Dilkon, AZ Map & Demographics
Dilkon Map
Dilkon Overview
$16,489
PER CAPITA INCOME
$46,250
AVG FAMILY INCOME
$40,288
AVG HOUSEHOLD INCOME
10.9%
WAGE / INCOME GAP [ % ]
89.1¢/ $1
WAGE / INCOME GAP [ $ ]
0.45
INEQUALITY / GINI INDEX
1,326
TOTAL POPULATION
700
MALE POPULATION
626
FEMALE POPULATION
111.82
MALES / 100 FEMALES
89.43
FEMALES / 100 MALES
28.8
MEDIAN AGE
3.6
AVG FAMILY SIZE
3.2
AVG HOUSEHOLD SIZE
439
LABOR FORCE [ PEOPLE ]
47.3%
PERCENT IN LABOR FORCE
7.1%
UNEMPLOYMENT RATE
Income in Dilkon
Income Overview in Dilkon
Per Capita Income in Dilkon is $16,489, while median incomes of families and households are $46,250 and $40,288 respectively.
| Characteristic | Number | Measure |
| Per Capita Income | 1,326 | $16,489 |
| Median Family Income | 331 | $46,250 |
| Mean Family Income | 331 | $57,699 |
| Median Household Income | 411 | $40,288 |
| Mean Household Income | 411 | $54,457 |
| Income Deficit | 331 | $0 |
| Wage / Income Gap (%) | 1,326 | 10.93% |
| Wage / Income Gap ($) | 1,326 | 89.07¢ per $1 |
| Gini / Inequality Index | 1,326 | 0.45 |
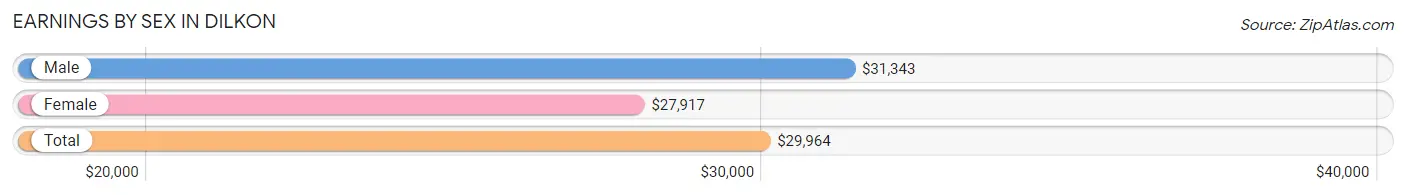
Earnings by Sex in Dilkon
Average Earnings in Dilkon are $29,964, $31,343 for men and $27,917 for women, a difference of 10.9%.
| Sex | Number | Average Earnings |
| Male | 269 (58.1%) | $31,343 |
| Female | 194 (41.9%) | $27,917 |
| Total | 463 (100.0%) | $29,964 |
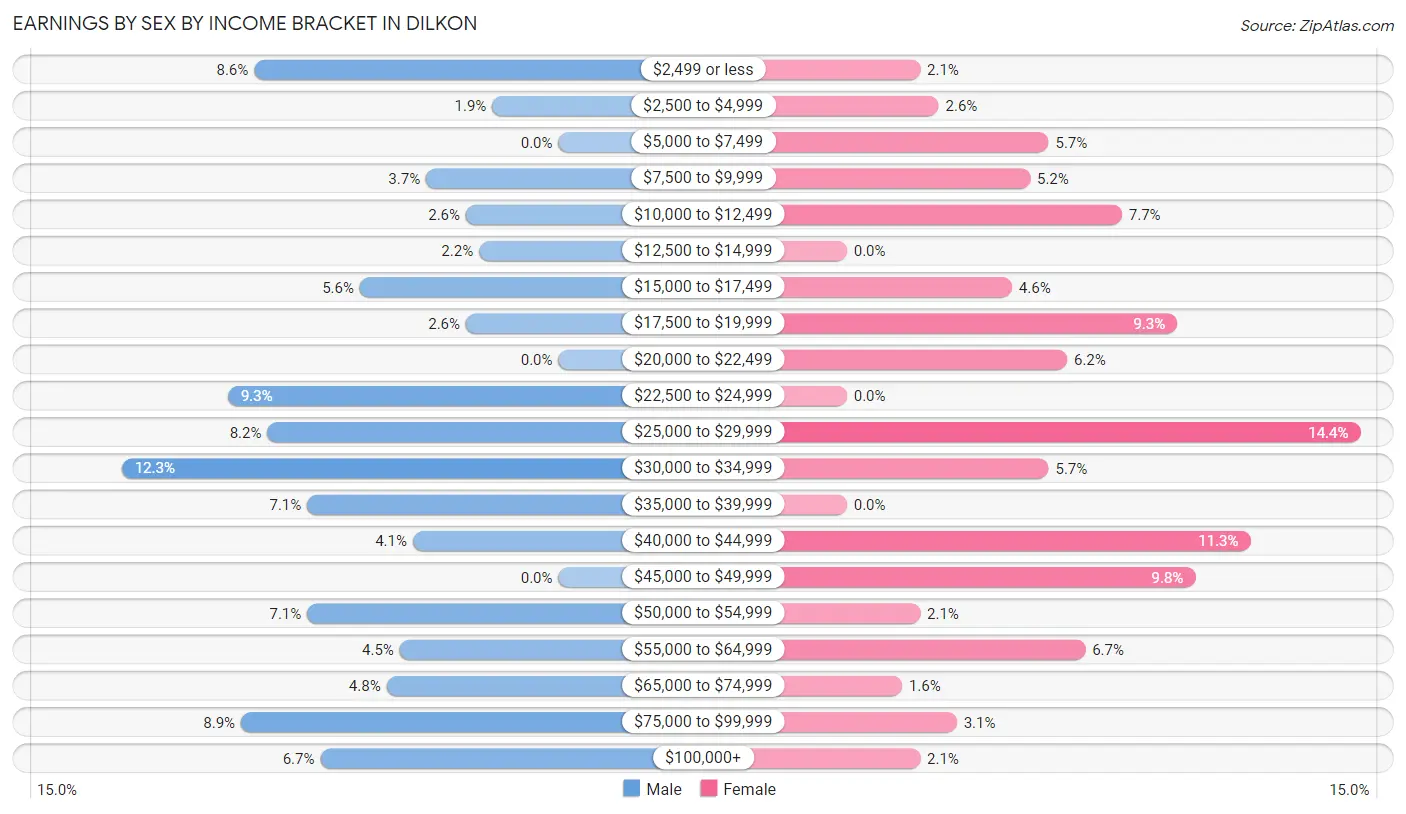
Earnings by Sex by Income Bracket in Dilkon
The most common earnings brackets in Dilkon are $30,000 to $34,999 for men (33 | 12.3%) and $25,000 to $29,999 for women (28 | 14.4%).
| Income | Male | Female |
| $2,499 or less | 23 (8.6%) | 4 (2.1%) |
| $2,500 to $4,999 | 5 (1.9%) | 5 (2.6%) |
| $5,000 to $7,499 | 0 (0.0%) | 11 (5.7%) |
| $7,500 to $9,999 | 10 (3.7%) | 10 (5.1%) |
| $10,000 to $12,499 | 7 (2.6%) | 15 (7.7%) |
| $12,500 to $14,999 | 6 (2.2%) | 0 (0.0%) |
| $15,000 to $17,499 | 15 (5.6%) | 9 (4.6%) |
| $17,500 to $19,999 | 7 (2.6%) | 18 (9.3%) |
| $20,000 to $22,499 | 0 (0.0%) | 12 (6.2%) |
| $22,500 to $24,999 | 25 (9.3%) | 0 (0.0%) |
| $25,000 to $29,999 | 22 (8.2%) | 28 (14.4%) |
| $30,000 to $34,999 | 33 (12.3%) | 11 (5.7%) |
| $35,000 to $39,999 | 19 (7.1%) | 0 (0.0%) |
| $40,000 to $44,999 | 11 (4.1%) | 22 (11.3%) |
| $45,000 to $49,999 | 0 (0.0%) | 19 (9.8%) |
| $50,000 to $54,999 | 19 (7.1%) | 4 (2.1%) |
| $55,000 to $64,999 | 12 (4.5%) | 13 (6.7%) |
| $65,000 to $74,999 | 13 (4.8%) | 3 (1.5%) |
| $75,000 to $99,999 | 24 (8.9%) | 6 (3.1%) |
| $100,000+ | 18 (6.7%) | 4 (2.1%) |
| Total | 269 (100.0%) | 194 (100.0%) |
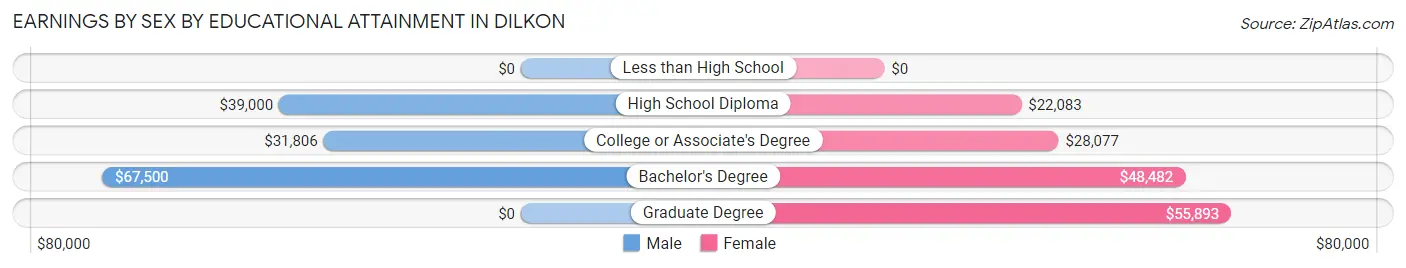
Earnings by Sex by Educational Attainment in Dilkon
Average earnings in Dilkon are $38,942 for men and $28,681 for women, a difference of 26.4%. Men with an educational attainment of bachelor's degree enjoy the highest average annual earnings of $67,500, while those with college or associate's degree education earn the least with $31,806. Women with an educational attainment of graduate degree earn the most with the average annual earnings of $55,893, while those with high school diploma education have the smallest earnings of $22,083.
| Educational Attainment | Male Income | Female Income |
| Less than High School | - | - |
| High School Diploma | $39,000 | $22,083 |
| College or Associate's Degree | $31,806 | $28,077 |
| Bachelor's Degree | $67,500 | $48,482 |
| Graduate Degree | - | - |
| Total | $38,942 | $28,681 |
Family Income in Dilkon
Family Income Brackets in Dilkon
According to the Dilkon family income data, there are 60 families falling into the $100,000 to $149,999 income range, which is the most common income bracket and makes up 18.1% of all families.
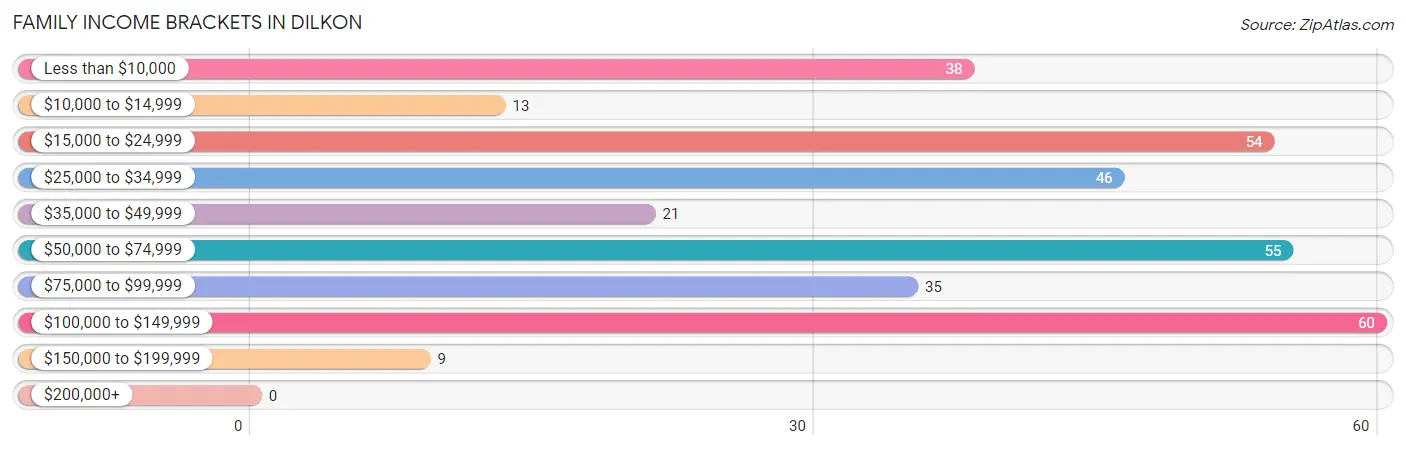
| Income Bracket | # Families | % Families |
| Less than $10,000 | 38 | 11.5% |
| $10,000 to $14,999 | 13 | 3.9% |
| $15,000 to $24,999 | 54 | 16.3% |
| $25,000 to $34,999 | 46 | 13.9% |
| $35,000 to $49,999 | 21 | 6.3% |
| $50,000 to $74,999 | 55 | 16.6% |
| $75,000 to $99,999 | 35 | 10.6% |
| $100,000 to $149,999 | 60 | 18.1% |
| $150,000 to $199,999 | 9 | 2.7% |
| $200,000+ | 0 | 0.0% |
Family Income by Famaliy Size in Dilkon
7+ person families (32 | 9.7%) account for the highest median family income in Dilkon with $118,804 per family, while 2-person families (61 | 18.4%) have the highest median income of $26,125 per family member.
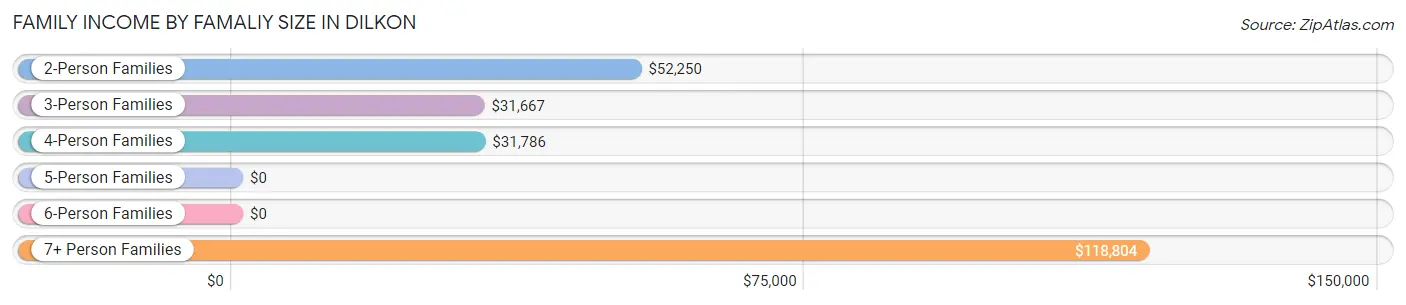
| Income Bracket | # Families | Median Income |
| 2-Person Families | 61 (18.4%) | $52,250 |
| 3-Person Families | 104 (31.4%) | $31,667 |
| 4-Person Families | 76 (23.0%) | $31,786 |
| 5-Person Families | 44 (13.3%) | $0 |
| 6-Person Families | 14 (4.2%) | $0 |
| 7+ Person Families | 32 (9.7%) | $118,804 |
| Total | 331 (100.0%) | $46,250 |
Family Income by Number of Earners in Dilkon
The median family income in Dilkon is $46,250, with families comprising 3+ earners (37) having the highest median family income of $118,967, while families with no earners (67) have the lowest median family income of $15,375, accounting for 11.2% and 20.2% of families, respectively.
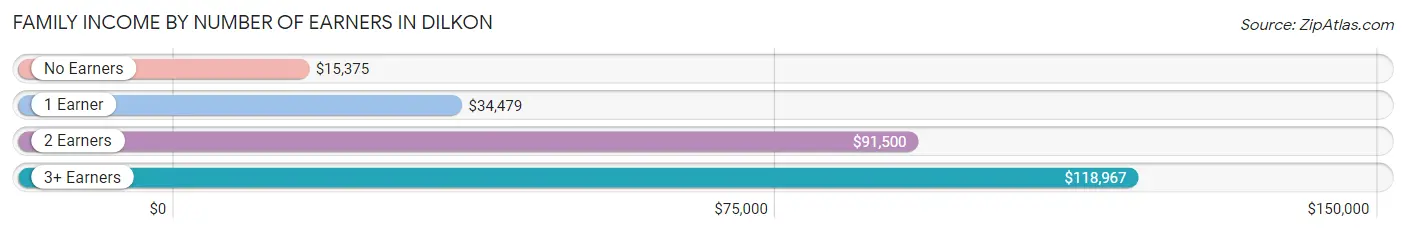
| Number of Earners | # Families | Median Income |
| No Earners | 67 (20.2%) | $15,375 |
| 1 Earner | 157 (47.4%) | $34,479 |
| 2 Earners | 70 (21.1%) | $91,500 |
| 3+ Earners | 37 (11.2%) | $118,967 |
| Total | 331 (100.0%) | $46,250 |
Household Income in Dilkon
Household Income Brackets in Dilkon
With 69 households falling in the category, the $100,000 to $149,999 income range is the most frequent in Dilkon, accounting for 16.8% of all households.
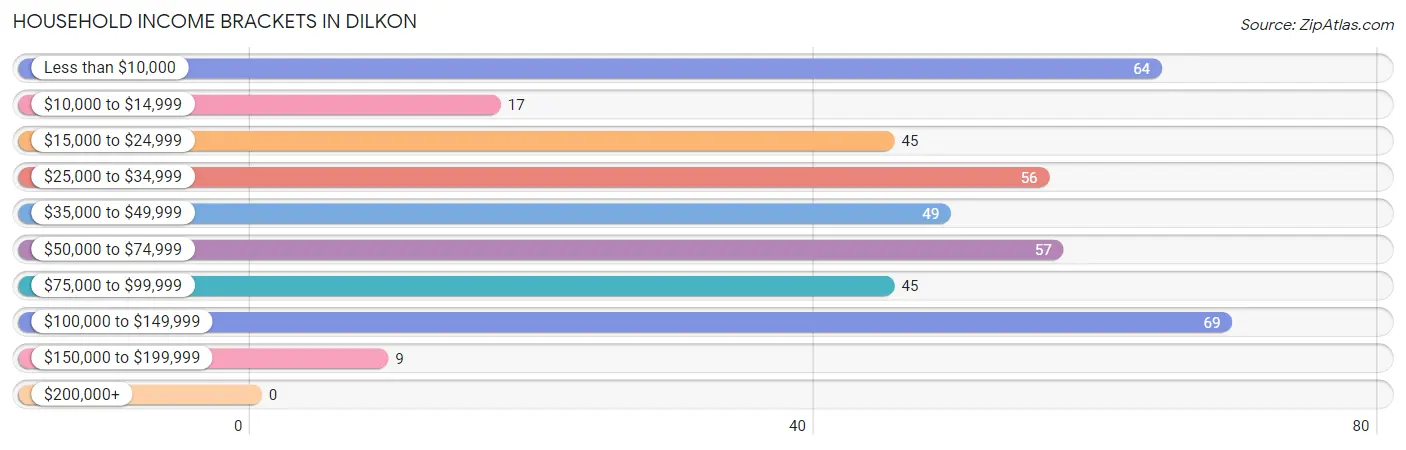
| Income Bracket | # Households | % Households |
| Less than $10,000 | 64 | 15.6% |
| $10,000 to $14,999 | 17 | 4.1% |
| $15,000 to $24,999 | 45 | 10.9% |
| $25,000 to $34,999 | 56 | 13.6% |
| $35,000 to $49,999 | 49 | 11.9% |
| $50,000 to $74,999 | 57 | 13.9% |
| $75,000 to $99,999 | 45 | 10.9% |
| $100,000 to $149,999 | 69 | 16.8% |
| $150,000 to $199,999 | 9 | 2.2% |
| $200,000+ | 0 | 0.0% |
Household Income by Householder Age in Dilkon
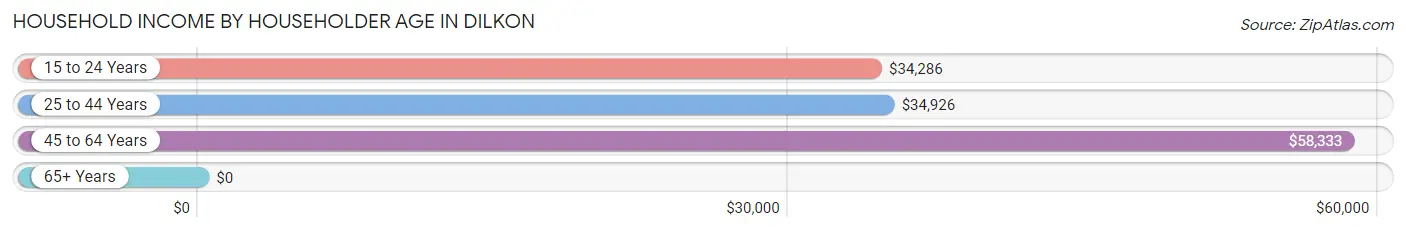
The median household income in Dilkon is $40,288, with the highest median household income of $58,333 found in the 45 to 64 years age bracket for the primary householder. A total of 130 households (31.6%) fall into this category. Meanwhile, the 65+ years age bracket for the primary householder has the lowest median household income of $0, with 94 households (22.9%) in this group.
| Income Bracket | # Households | Median Income |
| 15 to 24 Years | 30 (7.3%) | $34,286 |
| 25 to 44 Years | 157 (38.2%) | $34,926 |
| 45 to 64 Years | 130 (31.6%) | $58,333 |
| 65+ Years | 94 (22.9%) | $0 |
| Total | 411 (100.0%) | $40,288 |
Poverty in Dilkon
Income Below Poverty by Sex and Age in Dilkon
With 34.4% poverty level for males and 40.4% for females among the residents of Dilkon, 6 to 11 year old males and 5 year old females are the most vulnerable to poverty, with 53 males (67.1%) and 9 females (100.0%) in their respective age groups living below the poverty level.
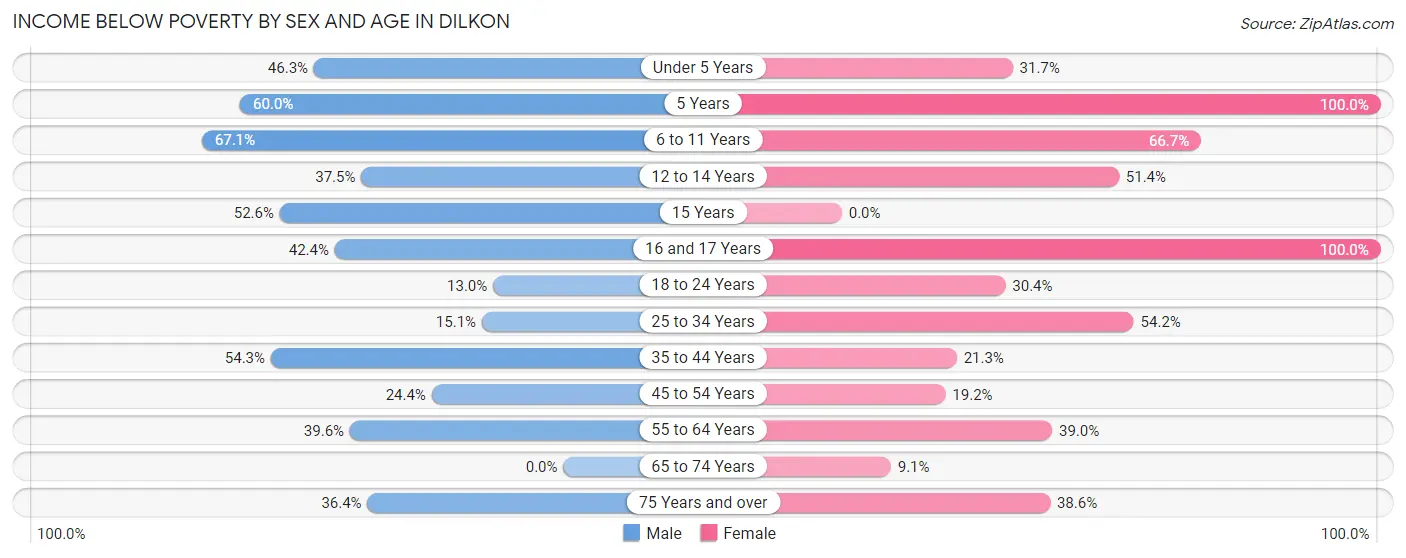
| Age Bracket | Male | Female |
| Under 5 Years | 25 (46.3%) | 13 (31.7%) |
| 5 Years | 9 (60.0%) | 9 (100.0%) |
| 6 to 11 Years | 53 (67.1%) | 62 (66.7%) |
| 12 to 14 Years | 18 (37.5%) | 18 (51.4%) |
| 15 Years | 10 (52.6%) | 0 (0.0%) |
| 16 and 17 Years | 14 (42.4%) | 5 (100.0%) |
| 18 to 24 Years | 12 (13.0%) | 17 (30.4%) |
| 25 to 34 Years | 13 (15.1%) | 65 (54.2%) |
| 35 to 44 Years | 38 (54.3%) | 16 (21.3%) |
| 45 to 54 Years | 22 (24.4%) | 10 (19.2%) |
| 55 to 64 Years | 21 (39.6%) | 16 (39.0%) |
| 65 to 74 Years | 0 (0.0%) | 5 (9.1%) |
| 75 Years and over | 4 (36.4%) | 17 (38.6%) |
| Total | 239 (34.4%) | 253 (40.4%) |
Income Above Poverty by Sex and Age in Dilkon
According to the poverty statistics in Dilkon, males aged 65 to 74 years and females aged 65 to 74 years are the age groups that are most secure financially, with 100.0% of males and 90.9% of females in these age groups living above the poverty line.
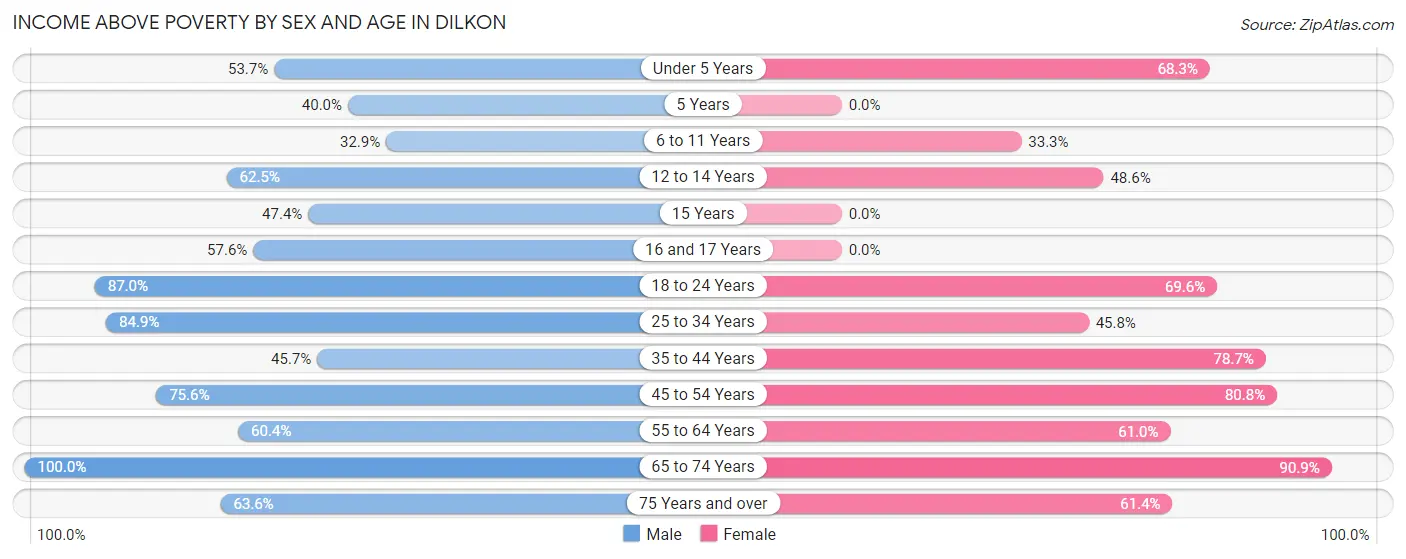
| Age Bracket | Male | Female |
| Under 5 Years | 29 (53.7%) | 28 (68.3%) |
| 5 Years | 6 (40.0%) | 0 (0.0%) |
| 6 to 11 Years | 26 (32.9%) | 31 (33.3%) |
| 12 to 14 Years | 30 (62.5%) | 17 (48.6%) |
| 15 Years | 9 (47.4%) | 0 (0.0%) |
| 16 and 17 Years | 19 (57.6%) | 0 (0.0%) |
| 18 to 24 Years | 80 (87.0%) | 39 (69.6%) |
| 25 to 34 Years | 73 (84.9%) | 55 (45.8%) |
| 35 to 44 Years | 32 (45.7%) | 59 (78.7%) |
| 45 to 54 Years | 68 (75.6%) | 42 (80.8%) |
| 55 to 64 Years | 32 (60.4%) | 25 (61.0%) |
| 65 to 74 Years | 45 (100.0%) | 50 (90.9%) |
| 75 Years and over | 7 (63.6%) | 27 (61.4%) |
| Total | 456 (65.6%) | 373 (59.6%) |
Income Below Poverty Among Married-Couple Families in Dilkon
The poverty statistics for married-couple families in Dilkon show that 22.7% or 34 of the total 150 families live below the poverty line. Families with 5 or more children have the highest poverty rate of 100.0%, comprising of 4 families. On the other hand, families with no children have the lowest poverty rate of 0.0%, which includes 0 families.
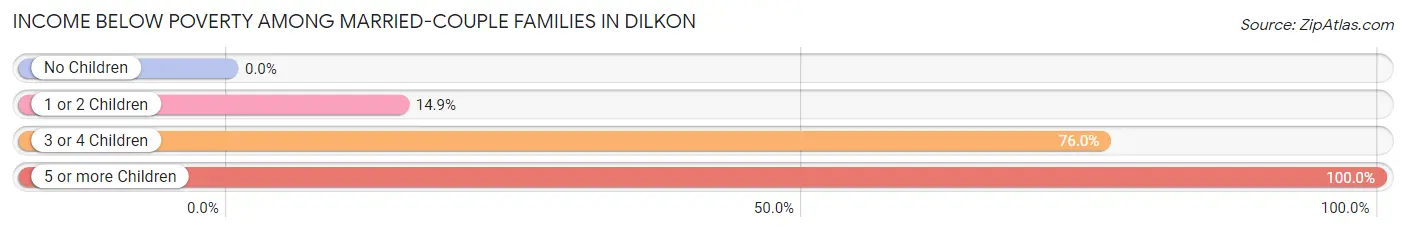
| Children | Above Poverty | Below Poverty |
| No Children | 47 (100.0%) | 0 (0.0%) |
| 1 or 2 Children | 63 (85.1%) | 11 (14.9%) |
| 3 or 4 Children | 6 (24.0%) | 19 (76.0%) |
| 5 or more Children | 0 (0.0%) | 4 (100.0%) |
| Total | 116 (77.3%) | 34 (22.7%) |
Income Below Poverty Among Single-Parent Households in Dilkon
According to the poverty data in Dilkon, 40.7% or 11 single-father households and 50.0% or 77 single-mother households are living below the poverty line. Among single-father households, those with 1 or 2 children have the highest poverty rate, with 11 households (61.1%) experiencing poverty. Likewise, among single-mother households, those with 3 or 4 children have the highest poverty rate, with 23 households (67.6%) falling below the poverty line.
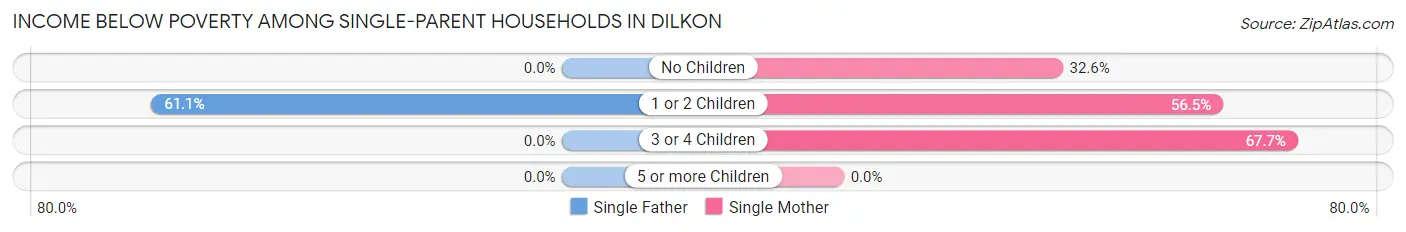
| Children | Single Father | Single Mother |
| No Children | 0 (0.0%) | 15 (32.6%) |
| 1 or 2 Children | 11 (61.1%) | 39 (56.5%) |
| 3 or 4 Children | 0 (0.0%) | 23 (67.6%) |
| 5 or more Children | 0 (0.0%) | 0 (0.0%) |
| Total | 11 (40.7%) | 77 (50.0%) |
Income Below Poverty Among Married-Couple vs Single-Parent Households in Dilkon
The poverty data for Dilkon shows that 34 of the married-couple family households (22.7%) and 88 of the single-parent households (48.6%) are living below the poverty level. Within the married-couple family households, those with 5 or more children have the highest poverty rate, with 4 households (100.0%) falling below the poverty line. Among the single-parent households, those with 3 or 4 children have the highest poverty rate, with 23 household (67.6%) living below poverty.
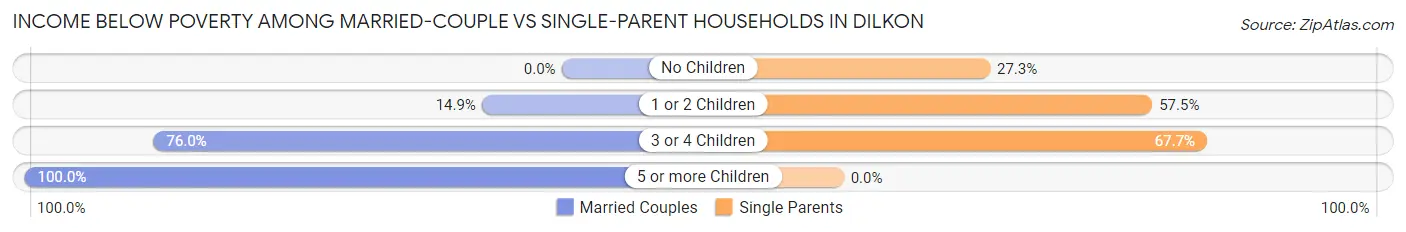
| Children | Married-Couple Families | Single-Parent Households |
| No Children | 0 (0.0%) | 15 (27.3%) |
| 1 or 2 Children | 11 (14.9%) | 50 (57.5%) |
| 3 or 4 Children | 19 (76.0%) | 23 (67.6%) |
| 5 or more Children | 4 (100.0%) | 0 (0.0%) |
| Total | 34 (22.7%) | 88 (48.6%) |
Race in Dilkon
The most populous races in Dilkon are Native / Alaskan (1,237 | 93.3%), Hispanic or Latino (73 | 5.5%), and Two or more Races (58 | 4.4%).
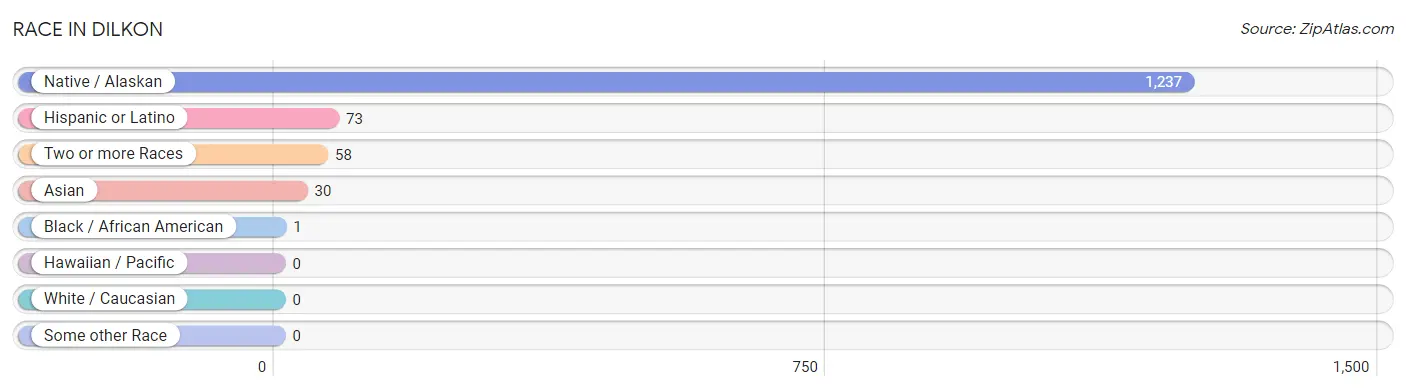
| Race | # Population | % Population |
| Asian | 30 | 2.3% |
| Black / African American | 1 | 0.1% |
| Hawaiian / Pacific | 0 | 0.0% |
| Hispanic or Latino | 73 | 5.5% |
| Native / Alaskan | 1,237 | 93.3% |
| White / Caucasian | 0 | 0.0% |
| Two or more Races | 58 | 4.4% |
| Some other Race | 0 | 0.0% |
| Total | 1,326 | 100.0% |
Ancestry in Dilkon
The most populous ancestries reported in Dilkon are Navajo (1,206 | 90.9%), Mexican (69 | 5.2%), Apache (43 | 3.2%), and Pima (10 | 0.7%), together accounting for 100.1% of all Dilkon residents.
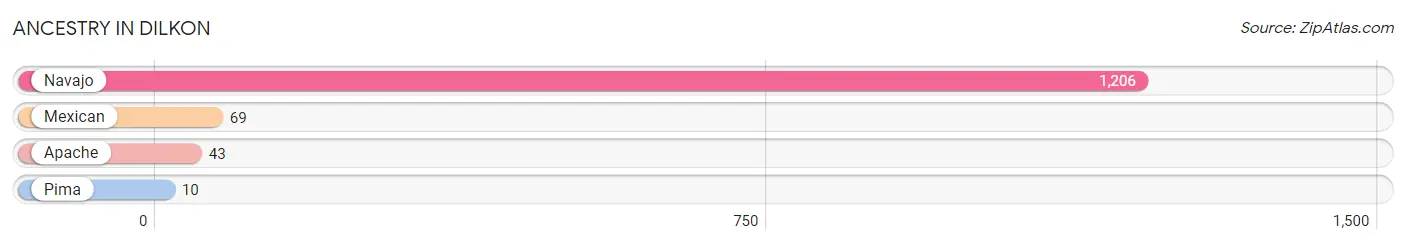
| Ancestry | # Population | % Population |
| Apache | 43 | 3.2% |
| Mexican | 69 | 5.2% |
| Navajo | 1,206 | 90.9% |
| Pima | 10 | 0.7% | View All 4 Rows |
Immigrants in Dilkon
The most numerous immigrant groups reported in Dilkon came from Central America (12 | 0.9%), Latin America (12 | 0.9%), Mexico (12 | 0.9%), Asia (7 | 0.5%), and Pakistan (7 | 0.5%), together accounting for 3.8% of all Dilkon residents.
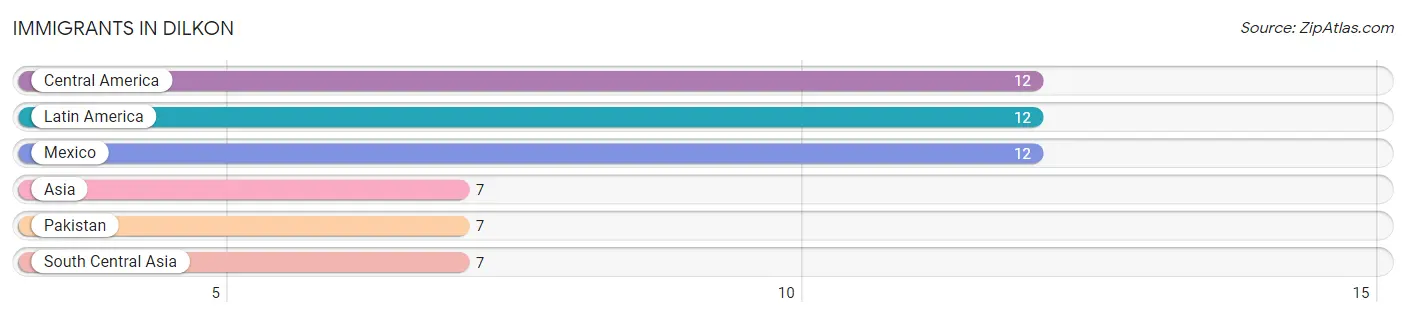
| Immigration Origin | # Population | % Population |
| Asia | 7 | 0.5% |
| Central America | 12 | 0.9% |
| Latin America | 12 | 0.9% |
| Mexico | 12 | 0.9% |
| Pakistan | 7 | 0.5% |
| South Central Asia | 7 | 0.5% | View All 6 Rows |
Sex and Age in Dilkon
Sex and Age in Dilkon
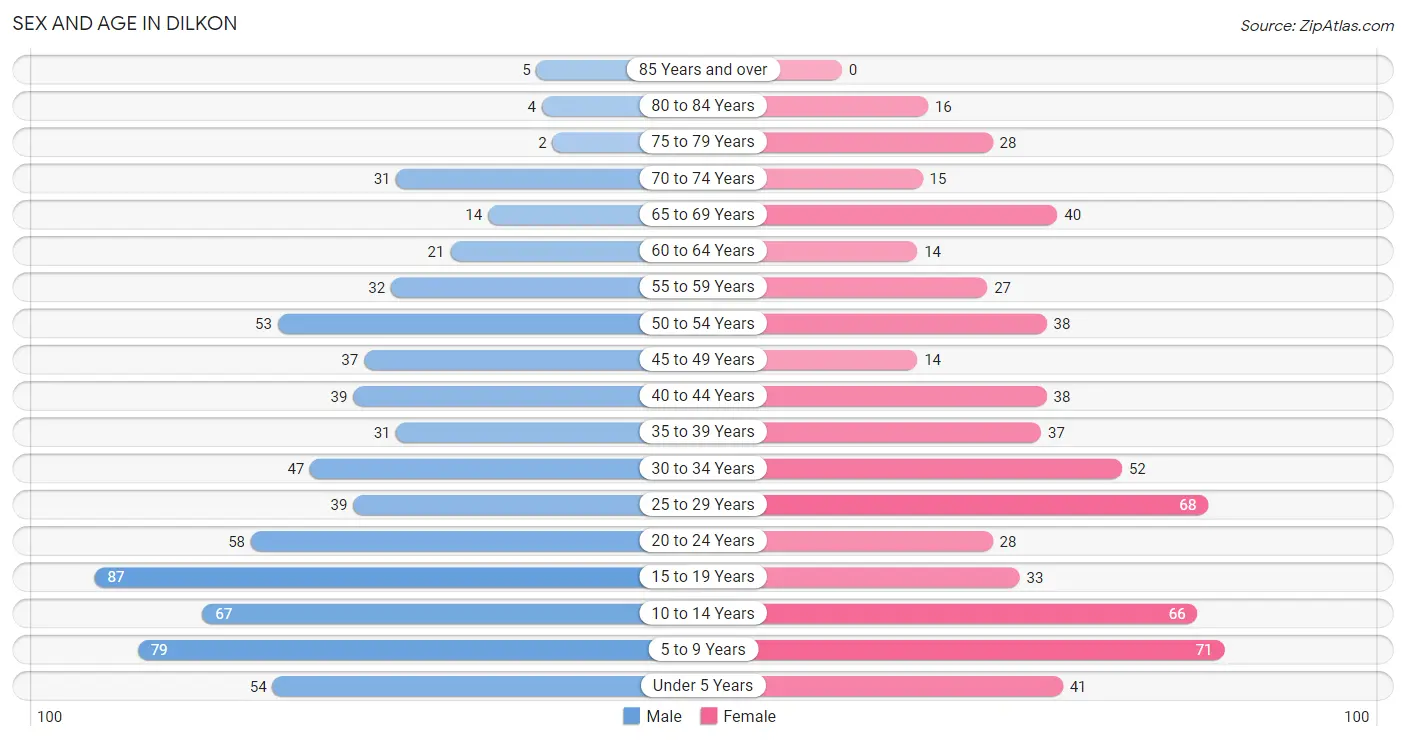
The most populous age groups in Dilkon are 15 to 19 Years (87 | 12.4%) for men and 5 to 9 Years (71 | 11.3%) for women.
| Age Bracket | Male | Female |
| Under 5 Years | 54 (7.7%) | 41 (6.6%) |
| 5 to 9 Years | 79 (11.3%) | 71 (11.3%) |
| 10 to 14 Years | 67 (9.6%) | 66 (10.5%) |
| 15 to 19 Years | 87 (12.4%) | 33 (5.3%) |
| 20 to 24 Years | 58 (8.3%) | 28 (4.5%) |
| 25 to 29 Years | 39 (5.6%) | 68 (10.9%) |
| 30 to 34 Years | 47 (6.7%) | 52 (8.3%) |
| 35 to 39 Years | 31 (4.4%) | 37 (5.9%) |
| 40 to 44 Years | 39 (5.6%) | 38 (6.1%) |
| 45 to 49 Years | 37 (5.3%) | 14 (2.2%) |
| 50 to 54 Years | 53 (7.6%) | 38 (6.1%) |
| 55 to 59 Years | 32 (4.6%) | 27 (4.3%) |
| 60 to 64 Years | 21 (3.0%) | 14 (2.2%) |
| 65 to 69 Years | 14 (2.0%) | 40 (6.4%) |
| 70 to 74 Years | 31 (4.4%) | 15 (2.4%) |
| 75 to 79 Years | 2 (0.3%) | 28 (4.5%) |
| 80 to 84 Years | 4 (0.6%) | 16 (2.6%) |
| 85 Years and over | 5 (0.7%) | 0 (0.0%) |
| Total | 700 (100.0%) | 626 (100.0%) |
Families and Households in Dilkon
Median Family Size in Dilkon
The median family size in Dilkon is 3.58 persons per family, with married-couple families (150 | 45.3%) accounting for the largest median family size of 3.98 persons per family. On the other hand, single male/father families (27 | 8.2%) represent the smallest median family size with 3.07 persons per family.
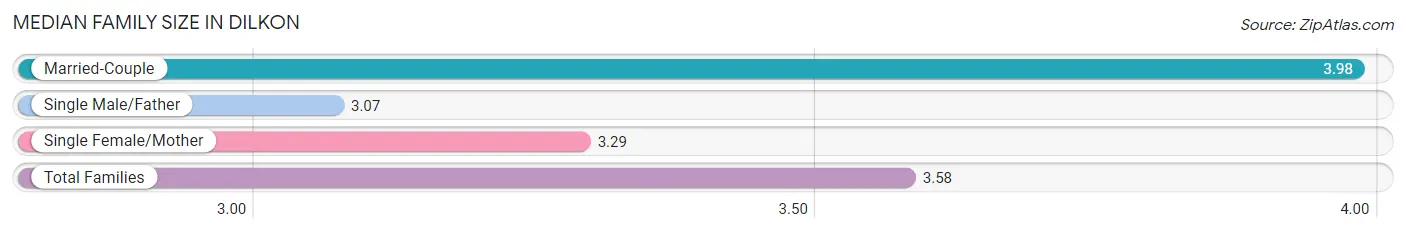
| Family Type | # Families | Family Size |
| Married-Couple | 150 (45.3%) | 3.98 |
| Single Male/Father | 27 (8.2%) | 3.07 |
| Single Female/Mother | 154 (46.5%) | 3.29 |
| Total Families | 331 (100.0%) | 3.58 |
Median Household Size in Dilkon
The median household size in Dilkon is 3.22 persons per household, with married-couple households (150 | 36.5%) accounting for the largest median household size of 4.01 persons per household. non-family households (80 | 19.5%) represent the smallest median household size with 1.05 persons per household.
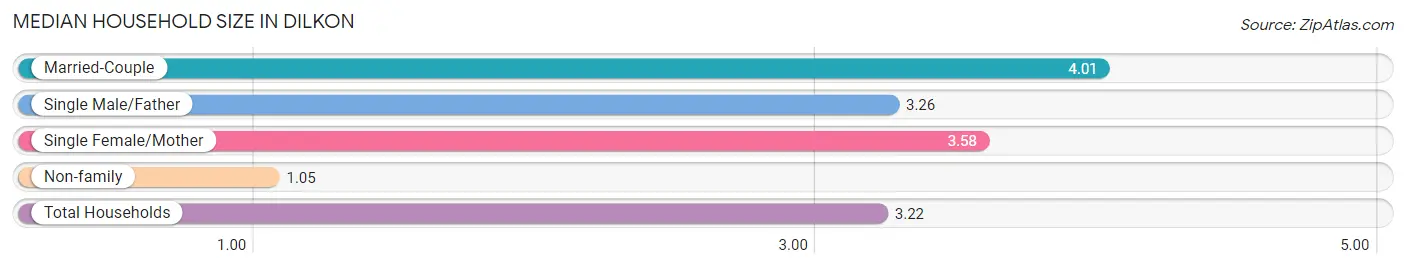
| Household Type | # Households | Household Size |
| Married-Couple | 150 (36.5%) | 4.01 |
| Single Male/Father | 27 (6.6%) | 3.26 |
| Single Female/Mother | 154 (37.5%) | 3.58 |
| Non-family | 80 (19.5%) | 1.05 |
| Total Households | 411 (100.0%) | 3.22 |
Household Size by Marriage Status in Dilkon
Out of a total of 411 households in Dilkon, 331 (80.5%) are family households, while 80 (19.5%) are nonfamily households. The most numerous type of family households are 3-person households, comprising 102, and the most common type of nonfamily households are 1-person households, comprising 76.
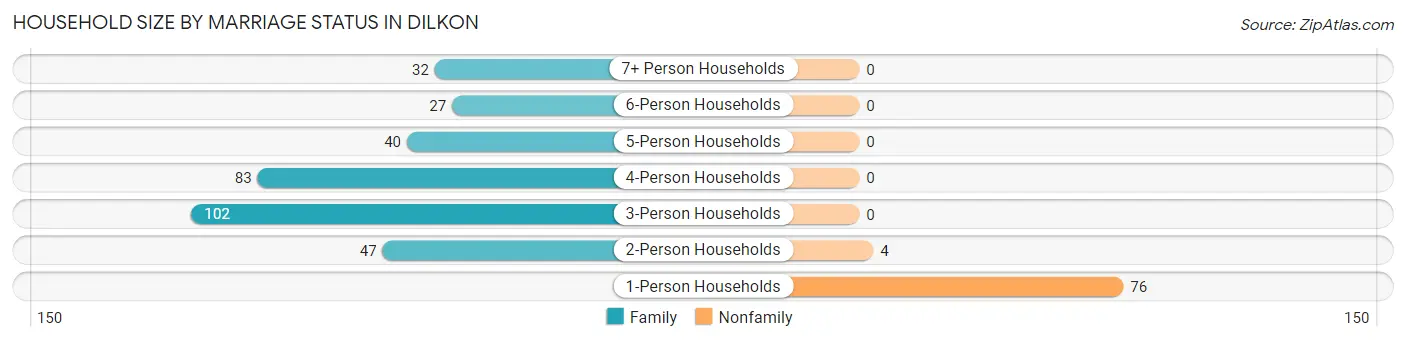
| Household Size | Family Households | Nonfamily Households |
| 1-Person Households | - | 76 (18.5%) |
| 2-Person Households | 47 (11.4%) | 4 (1.0%) |
| 3-Person Households | 102 (24.8%) | 0 (0.0%) |
| 4-Person Households | 83 (20.2%) | 0 (0.0%) |
| 5-Person Households | 40 (9.7%) | 0 (0.0%) |
| 6-Person Households | 27 (6.6%) | 0 (0.0%) |
| 7+ Person Households | 32 (7.8%) | 0 (0.0%) |
| Total | 331 (80.5%) | 80 (19.5%) |
Female Fertility in Dilkon
Fertility by Age in Dilkon
Average fertility rate in Dilkon is 100.0 births per 1,000 women. Women in the age bracket of 20 to 34 years have the highest fertility rate with 189.0 births per 1,000 women. Women in the age bracket of 20 to 34 years acount for 100.0% of all women with births.
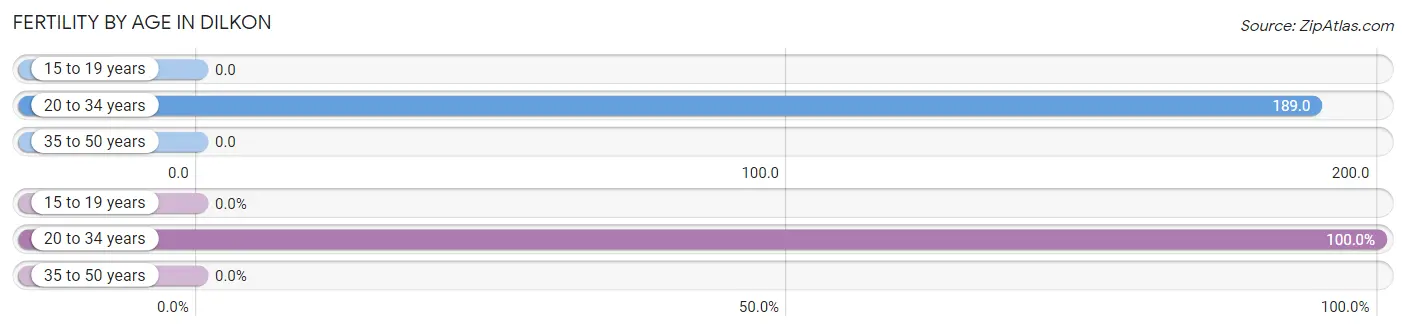
| Age Bracket | Women with Births | Births / 1,000 Women |
| 15 to 19 years | 0 (0.0%) | 0.0 |
| 20 to 34 years | 28 (100.0%) | 189.0 |
| 35 to 50 years | 0 (0.0%) | 0.0 |
| Total | 28 (100.0%) | 100.0 |
Fertility by Age by Marriage Status in Dilkon
53.6% of women with births (28) in Dilkon are married. The highest percentage of unmarried women with births falls into 20 to 34 years age bracket with 46.4% of them unmarried at the time of birth, while the lowest percentage of unmarried women with births belong to 20 to 34 years age bracket with 46.4% of them unmarried.
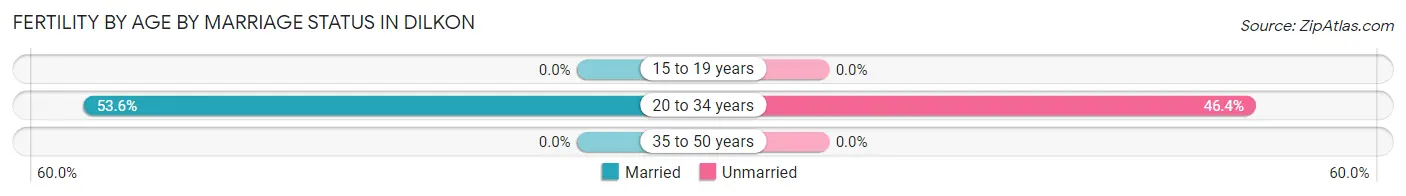
| Age Bracket | Married | Unmarried |
| 15 to 19 years | 0 (0.0%) | 0 (0.0%) |
| 20 to 34 years | 15 (53.6%) | 13 (46.4%) |
| 35 to 50 years | 0 (0.0%) | 0 (0.0%) |
| Total | 15 (53.6%) | 13 (46.4%) |
Fertility by Education in Dilkon

| Educational Attainment | Women with Births | Births / 1,000 Women |
| Less than High School | 0 (0.0%) | 0.0 |
| High School Diploma | 6 (21.4%) | 71.0 |
| College or Associate's Degree | 14 (50.0%) | 123.0 |
| Bachelor's Degree | 8 (28.6%) | 276.0 |
| Graduate Degree | 0 (0.0%) | 0.0 |
| Total | 28 (100.0%) | 100.0 |
Fertility by Education by Marriage Status in Dilkon
46.4% of women with births in Dilkon are unmarried. Women with the educational attainment of bachelor's degree are most likely to be married with 100.0% of them married at childbirth, while women with the educational attainment of high school diploma are least likely to be married with 100.0% of them unmarried at childbirth.
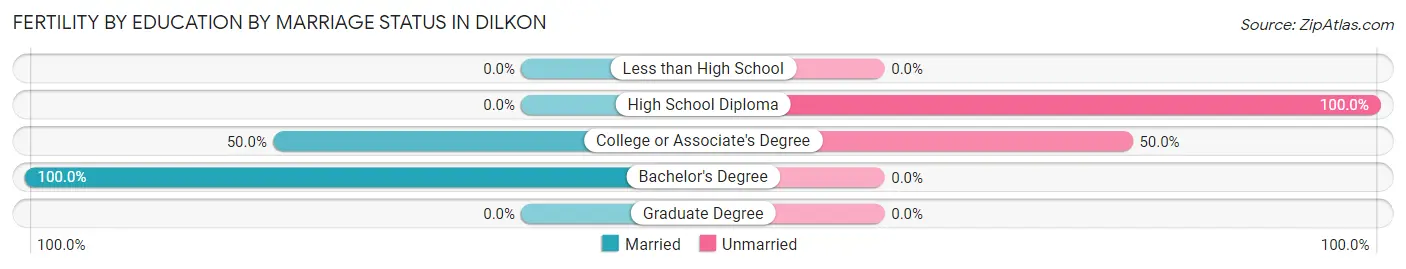
| Educational Attainment | Married | Unmarried |
| Less than High School | 0 (0.0%) | 0 (0.0%) |
| High School Diploma | 0 (0.0%) | 6 (100.0%) |
| College or Associate's Degree | 7 (50.0%) | 7 (50.0%) |
| Bachelor's Degree | 8 (100.0%) | 0 (0.0%) |
| Graduate Degree | 0 (0.0%) | 0 (0.0%) |
| Total | 15 (53.6%) | 13 (46.4%) |
Employment Characteristics in Dilkon
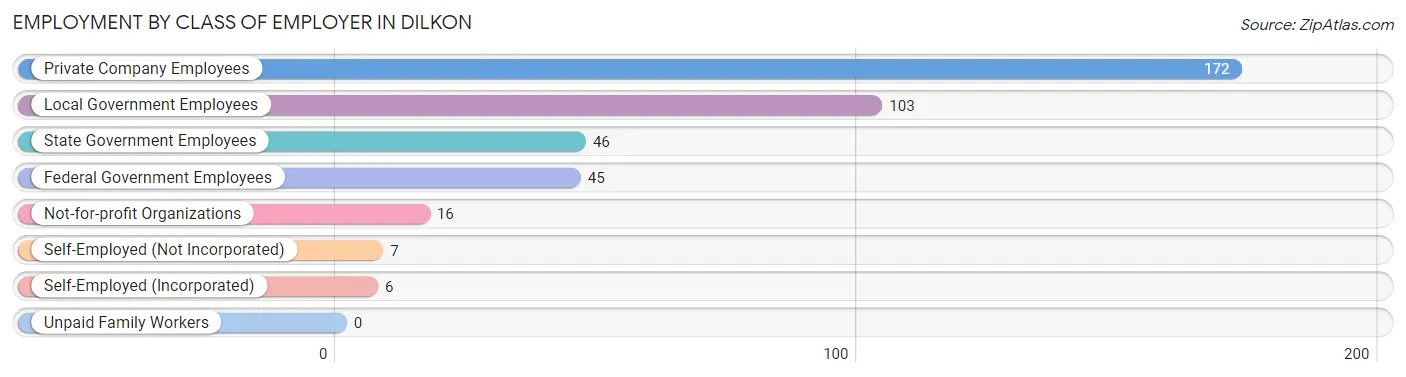
Employment by Class of Employer in Dilkon
Among the 395 employed individuals in Dilkon, private company employees (172 | 43.5%), local government employees (103 | 26.1%), and state government employees (46 | 11.7%) make up the most common classes of employment.
| Employer Class | # Employees | % Employees |
| Private Company Employees | 172 | 43.5% |
| Self-Employed (Incorporated) | 6 | 1.5% |
| Self-Employed (Not Incorporated) | 7 | 1.8% |
| Not-for-profit Organizations | 16 | 4.1% |
| Local Government Employees | 103 | 26.1% |
| State Government Employees | 46 | 11.7% |
| Federal Government Employees | 45 | 11.4% |
| Unpaid Family Workers | 0 | 0.0% |
| Total | 395 | 100.0% |
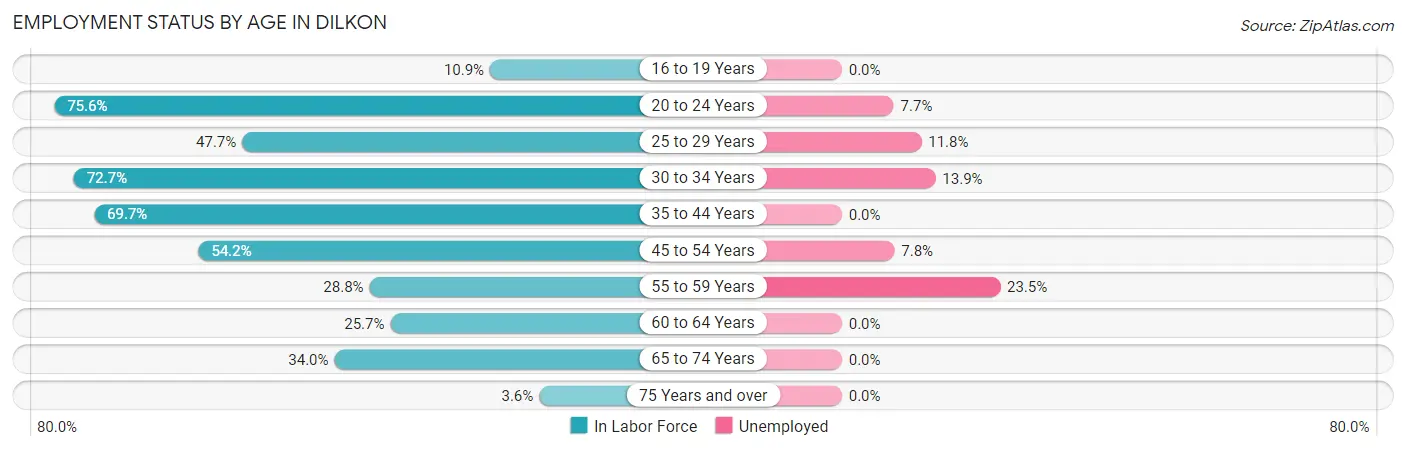
Employment Status by Age in Dilkon
According to the labor force statistics for Dilkon, out of the total population over 16 years of age (929), 47.3% or 439 individuals are in the labor force, with 7.1% or 31 of them unemployed. The age group with the highest labor force participation rate is 20 to 24 years, with 75.6% or 65 individuals in the labor force. Within the labor force, the 55 to 59 years age range has the highest percentage of unemployed individuals, with 23.5% or 4 of them being unemployed.
| Age Bracket | In Labor Force | Unemployed |
| 16 to 19 Years | 11 (10.9%) | 0 (0.0%) |
| 20 to 24 Years | 65 (75.6%) | 5 (7.7%) |
| 25 to 29 Years | 51 (47.7%) | 6 (11.8%) |
| 30 to 34 Years | 72 (72.7%) | 10 (13.9%) |
| 35 to 44 Years | 101 (69.7%) | 0 (0.0%) |
| 45 to 54 Years | 77 (54.2%) | 6 (7.8%) |
| 55 to 59 Years | 17 (28.8%) | 4 (23.5%) |
| 60 to 64 Years | 9 (25.7%) | 0 (0.0%) |
| 65 to 74 Years | 34 (34.0%) | 0 (0.0%) |
| 75 Years and over | 2 (3.6%) | 0 (0.0%) |
| Total | 439 (47.3%) | 31 (7.1%) |
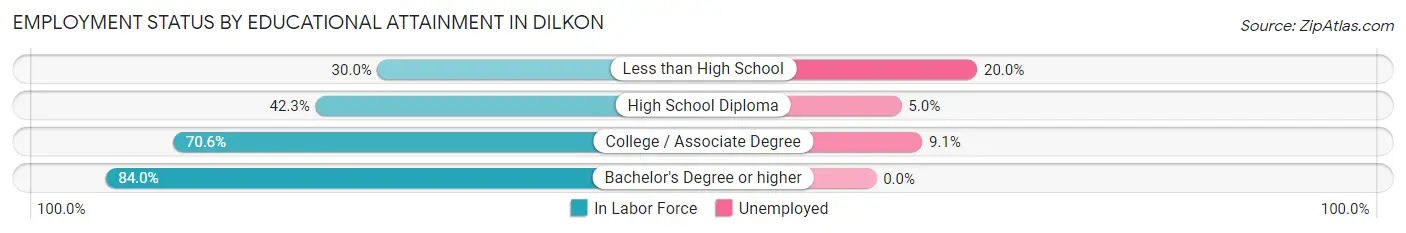
Employment Status by Educational Attainment in Dilkon
According to labor force statistics for Dilkon, 55.7% of individuals (327) out of the total population between 25 and 64 years of age (587) are in the labor force, with 8.0% or 26 of them being unemployed. The group with the highest labor force participation rate are those with the educational attainment of bachelor's degree or higher, with 84.0% or 42 individuals in the labor force. Within the labor force, individuals with less than high school education have the highest percentage of unemployment, with 20.0% or 6 of them being unemployed.
| Educational Attainment | In Labor Force | Unemployed |
| Less than High School | 30 (30.0%) | 20 (20.0%) |
| High School Diploma | 80 (42.3%) | 9 (5.0%) |
| College / Associate Degree | 175 (70.6%) | 23 (9.1%) |
| Bachelor's Degree or higher | 42 (84.0%) | 0 (0.0%) |
| Total | 327 (55.7%) | 47 (8.0%) |
Employment Occupations by Sex in Dilkon
Management, Business, Science and Arts Occupations
The most common Management, Business, Science and Arts occupations in Dilkon are Community & Social Service (36 | 8.8%), Computers, Engineering & Science (27 | 6.6%), Architecture & Engineering (17 | 4.2%), Education, Arts & Media (16 | 3.9%), and Health Diagnosing & Treating (15 | 3.7%).
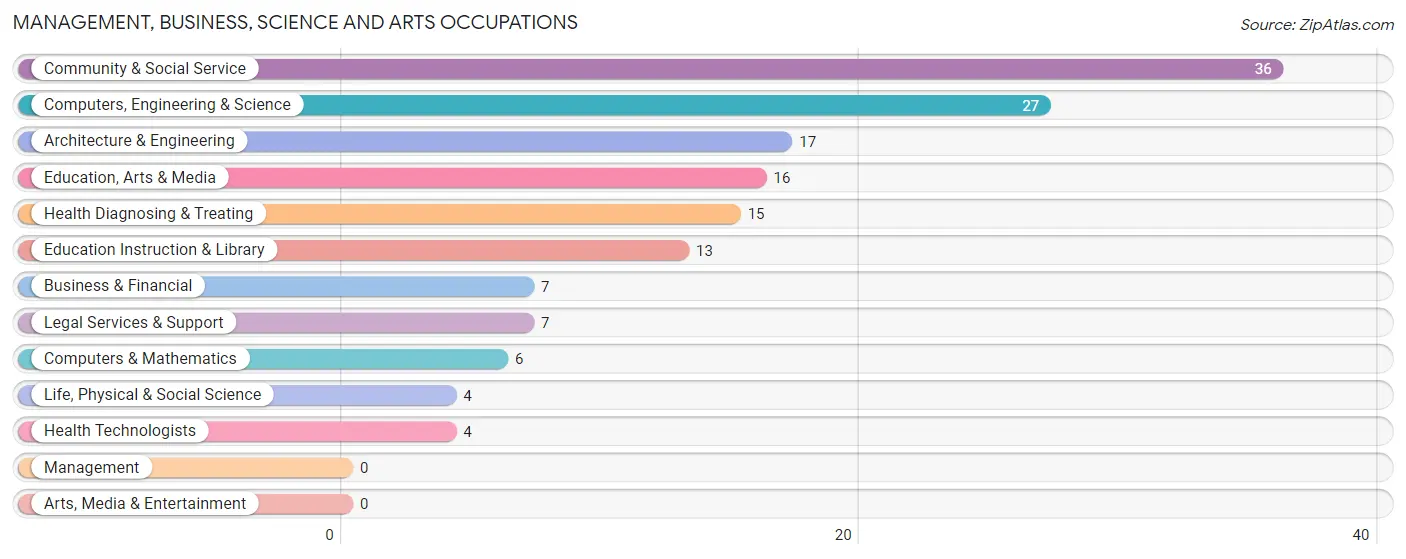
Management, Business, Science and Arts Occupations by Sex
Within the Management, Business, Science and Arts occupations in Dilkon, the most male-oriented occupations are Computers, Engineering & Science (100.0%), Computers & Mathematics (100.0%), and Architecture & Engineering (100.0%), while the most female-oriented occupations are Business & Financial (100.0%), Legal Services & Support (100.0%), and Health Diagnosing & Treating (100.0%).
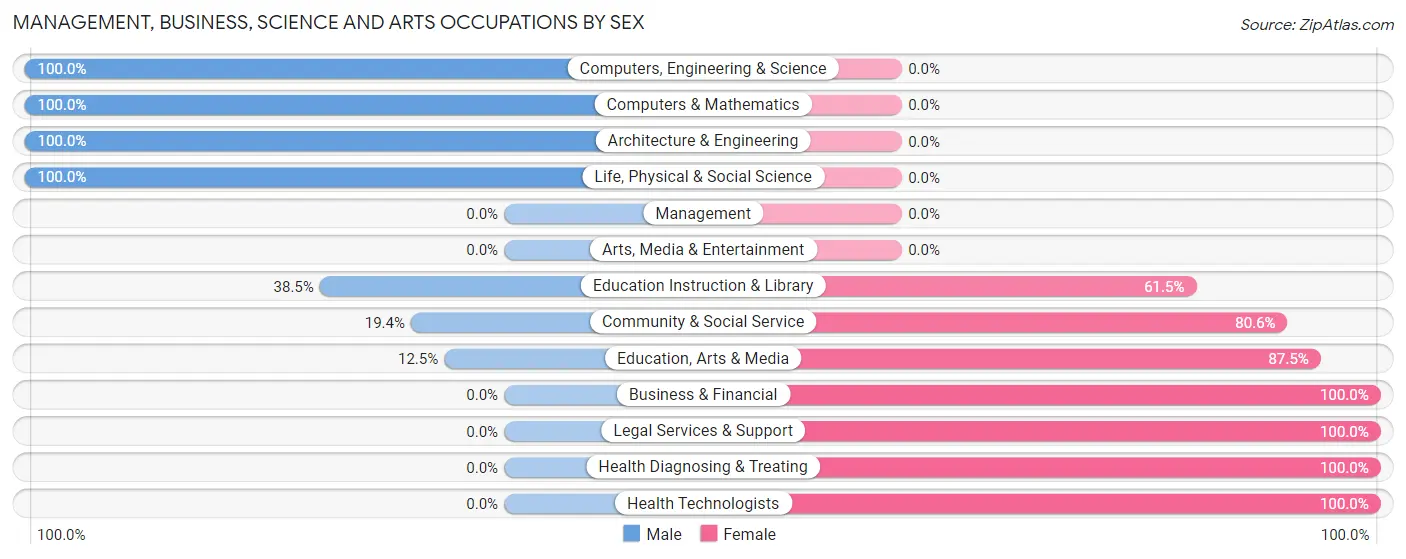
| Occupation | Male | Female |
| Management | 0 (0.0%) | 0 (0.0%) |
| Business & Financial | 0 (0.0%) | 7 (100.0%) |
| Computers, Engineering & Science | 27 (100.0%) | 0 (0.0%) |
| Computers & Mathematics | 6 (100.0%) | 0 (0.0%) |
| Architecture & Engineering | 17 (100.0%) | 0 (0.0%) |
| Life, Physical & Social Science | 4 (100.0%) | 0 (0.0%) |
| Community & Social Service | 7 (19.4%) | 29 (80.6%) |
| Education, Arts & Media | 2 (12.5%) | 14 (87.5%) |
| Legal Services & Support | 0 (0.0%) | 7 (100.0%) |
| Education Instruction & Library | 5 (38.5%) | 8 (61.5%) |
| Arts, Media & Entertainment | 0 (0.0%) | 0 (0.0%) |
| Health Diagnosing & Treating | 0 (0.0%) | 15 (100.0%) |
| Health Technologists | 0 (0.0%) | 4 (100.0%) |
| Total (Category) | 34 (40.0%) | 51 (60.0%) |
| Total (Overall) | 242 (59.3%) | 166 (40.7%) |
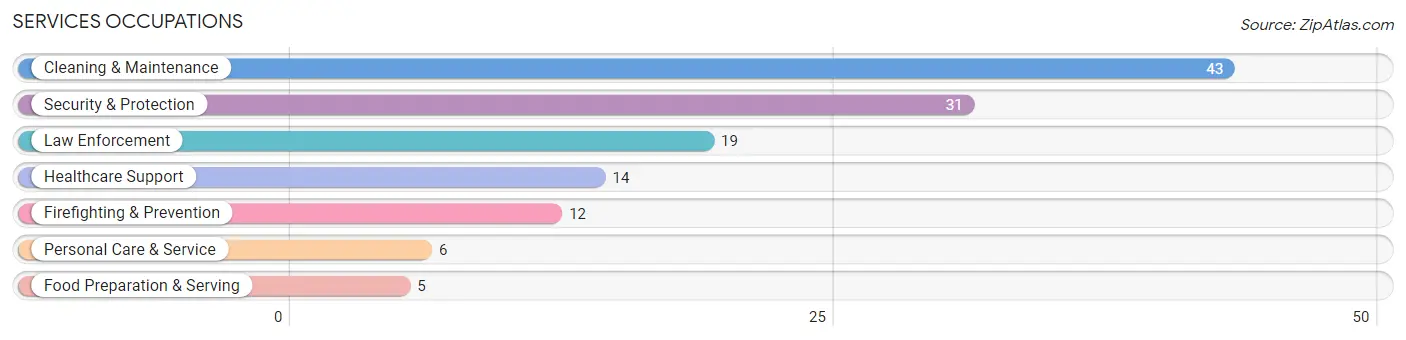
Services Occupations
The most common Services occupations in Dilkon are Cleaning & Maintenance (43 | 10.5%), Security & Protection (31 | 7.6%), Law Enforcement (19 | 4.7%), Healthcare Support (14 | 3.4%), and Firefighting & Prevention (12 | 2.9%).
Services Occupations by Sex
Within the Services occupations in Dilkon, the most male-oriented occupations are Food Preparation & Serving (100.0%), Personal Care & Service (100.0%), and Law Enforcement (78.9%), while the most female-oriented occupations are Healthcare Support (100.0%), Firefighting & Prevention (58.3%), and Security & Protection (35.5%).
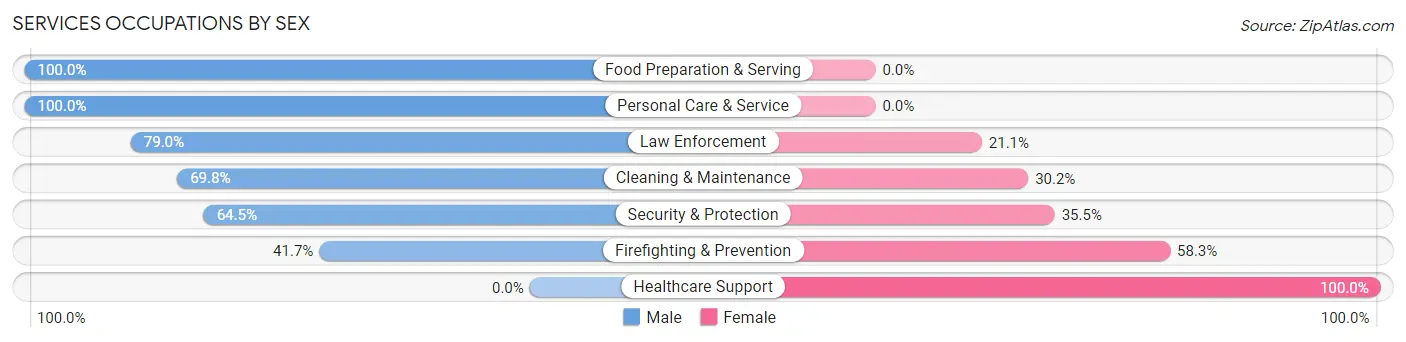
| Occupation | Male | Female |
| Healthcare Support | 0 (0.0%) | 14 (100.0%) |
| Security & Protection | 20 (64.5%) | 11 (35.5%) |
| Firefighting & Prevention | 5 (41.7%) | 7 (58.3%) |
| Law Enforcement | 15 (78.9%) | 4 (21.0%) |
| Food Preparation & Serving | 5 (100.0%) | 0 (0.0%) |
| Cleaning & Maintenance | 30 (69.8%) | 13 (30.2%) |
| Personal Care & Service | 6 (100.0%) | 0 (0.0%) |
| Total (Category) | 61 (61.6%) | 38 (38.4%) |
| Total (Overall) | 242 (59.3%) | 166 (40.7%) |
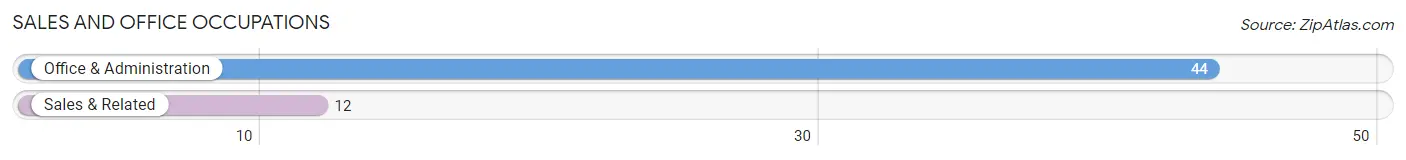
Sales and Office Occupations
The most common Sales and Office occupations in Dilkon are Office & Administration (44 | 10.8%), and Sales & Related (12 | 2.9%).
Sales and Office Occupations by Sex
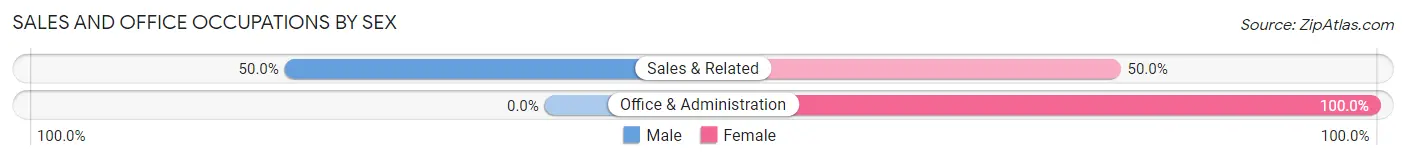
| Occupation | Male | Female |
| Sales & Related | 6 (50.0%) | 6 (50.0%) |
| Office & Administration | 0 (0.0%) | 44 (100.0%) |
| Total (Category) | 6 (10.7%) | 50 (89.3%) |
| Total (Overall) | 242 (59.3%) | 166 (40.7%) |
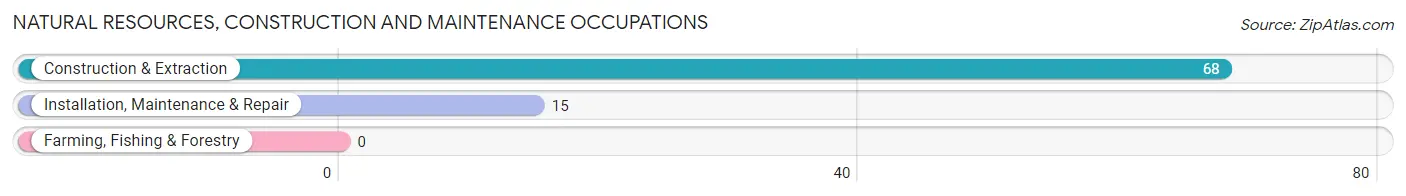
Natural Resources, Construction and Maintenance Occupations
The most common Natural Resources, Construction and Maintenance occupations in Dilkon are Construction & Extraction (68 | 16.7%), and Installation, Maintenance & Repair (15 | 3.7%).
Natural Resources, Construction and Maintenance Occupations by Sex
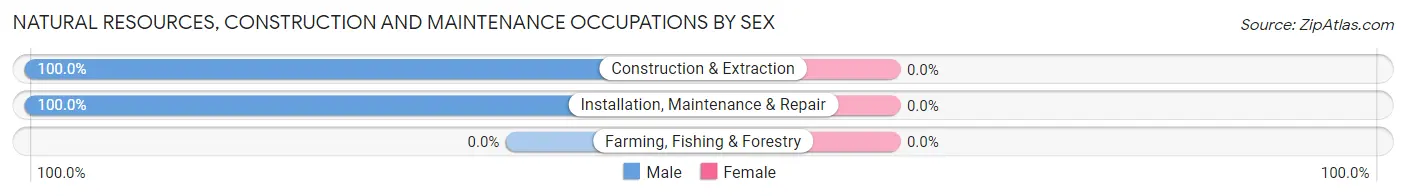
| Occupation | Male | Female |
| Farming, Fishing & Forestry | 0 (0.0%) | 0 (0.0%) |
| Construction & Extraction | 68 (100.0%) | 0 (0.0%) |
| Installation, Maintenance & Repair | 15 (100.0%) | 0 (0.0%) |
| Total (Category) | 83 (100.0%) | 0 (0.0%) |
| Total (Overall) | 242 (59.3%) | 166 (40.7%) |
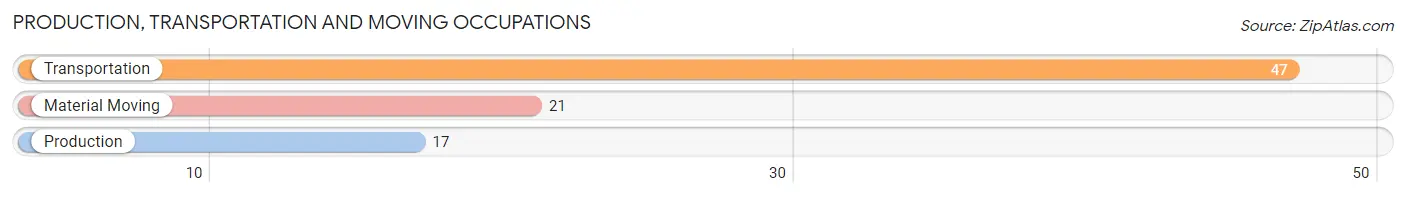
Production, Transportation and Moving Occupations
The most common Production, Transportation and Moving occupations in Dilkon are Transportation (47 | 11.5%), Material Moving (21 | 5.1%), and Production (17 | 4.2%).
Production, Transportation and Moving Occupations by Sex
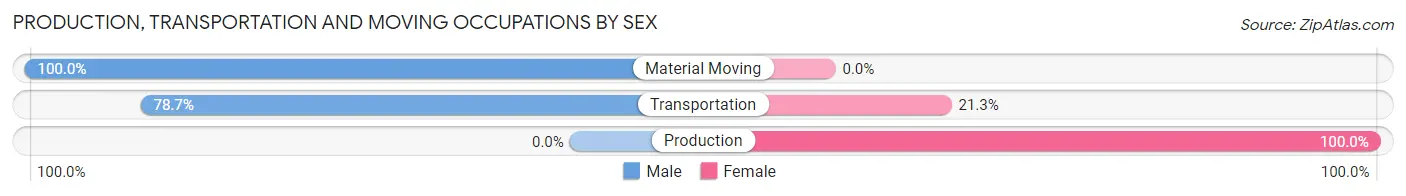
| Occupation | Male | Female |
| Production | 0 (0.0%) | 17 (100.0%) |
| Transportation | 37 (78.7%) | 10 (21.3%) |
| Material Moving | 21 (100.0%) | 0 (0.0%) |
| Total (Category) | 58 (68.2%) | 27 (31.8%) |
| Total (Overall) | 242 (59.3%) | 166 (40.7%) |
Employment Industries by Sex in Dilkon
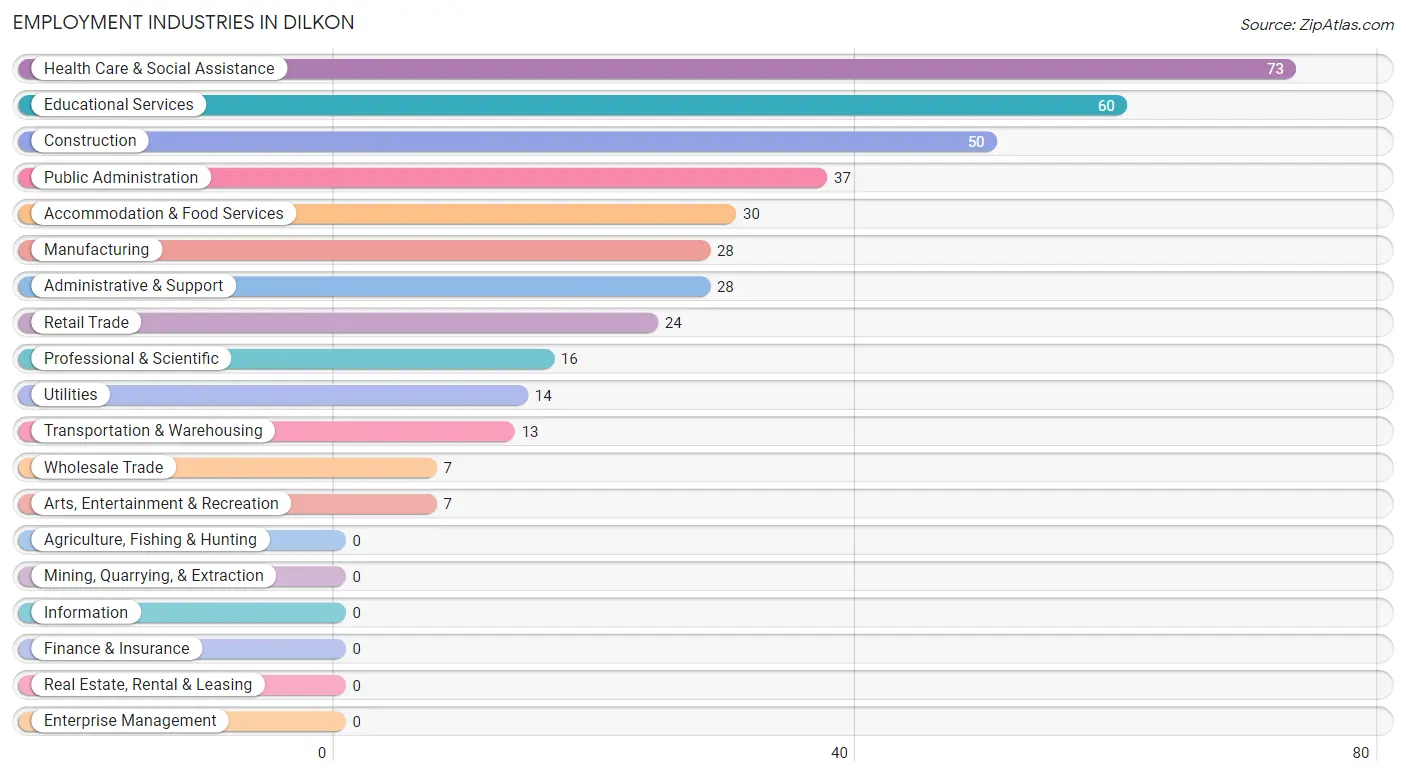
Employment Industries in Dilkon
The major employment industries in Dilkon include Health Care & Social Assistance (73 | 17.9%), Educational Services (60 | 14.7%), Construction (50 | 12.2%), Public Administration (37 | 9.1%), and Accommodation & Food Services (30 | 7.3%).
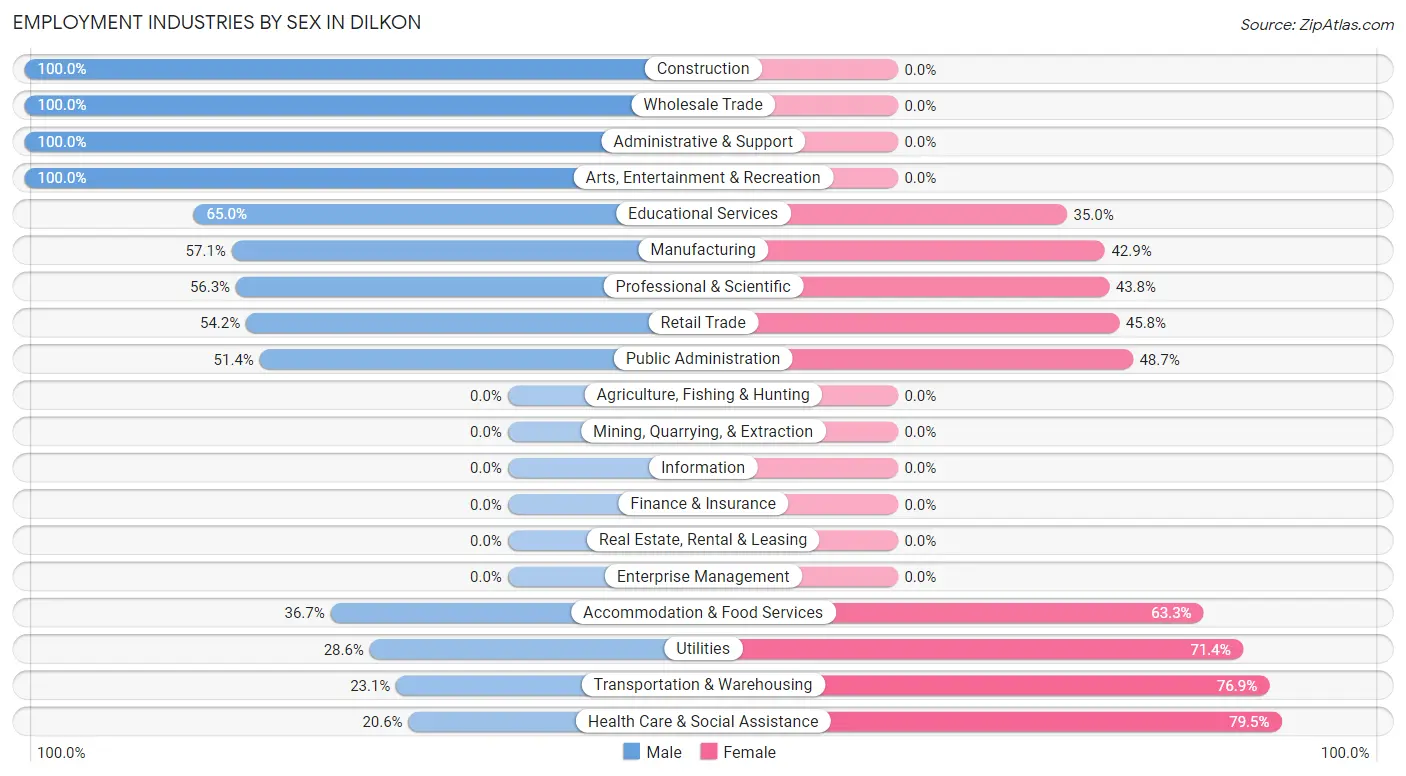
Employment Industries by Sex in Dilkon
The Dilkon industries that see more men than women are Construction (100.0%), Wholesale Trade (100.0%), and Administrative & Support (100.0%), whereas the industries that tend to have a higher number of women are Health Care & Social Assistance (79.4%), Transportation & Warehousing (76.9%), and Utilities (71.4%).
| Industry | Male | Female |
| Agriculture, Fishing & Hunting | 0 (0.0%) | 0 (0.0%) |
| Mining, Quarrying, & Extraction | 0 (0.0%) | 0 (0.0%) |
| Construction | 50 (100.0%) | 0 (0.0%) |
| Manufacturing | 16 (57.1%) | 12 (42.9%) |
| Wholesale Trade | 7 (100.0%) | 0 (0.0%) |
| Retail Trade | 13 (54.2%) | 11 (45.8%) |
| Transportation & Warehousing | 3 (23.1%) | 10 (76.9%) |
| Utilities | 4 (28.6%) | 10 (71.4%) |
| Information | 0 (0.0%) | 0 (0.0%) |
| Finance & Insurance | 0 (0.0%) | 0 (0.0%) |
| Real Estate, Rental & Leasing | 0 (0.0%) | 0 (0.0%) |
| Professional & Scientific | 9 (56.2%) | 7 (43.8%) |
| Enterprise Management | 0 (0.0%) | 0 (0.0%) |
| Administrative & Support | 28 (100.0%) | 0 (0.0%) |
| Educational Services | 39 (65.0%) | 21 (35.0%) |
| Health Care & Social Assistance | 15 (20.5%) | 58 (79.4%) |
| Arts, Entertainment & Recreation | 7 (100.0%) | 0 (0.0%) |
| Accommodation & Food Services | 11 (36.7%) | 19 (63.3%) |
| Public Administration | 19 (51.3%) | 18 (48.6%) |
| Total | 242 (59.3%) | 166 (40.7%) |
Education in Dilkon
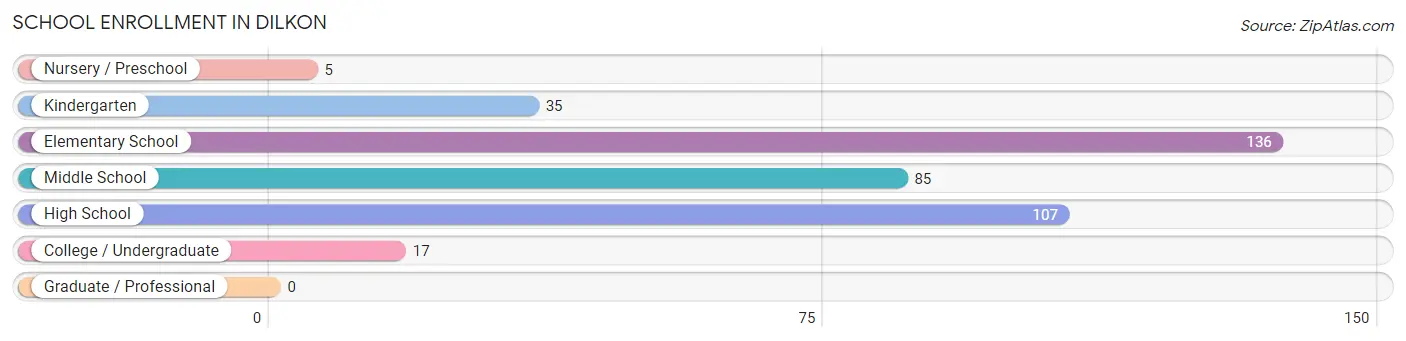
School Enrollment in Dilkon
The most common levels of schooling among the 385 students in Dilkon are elementary school (136 | 35.3%), high school (107 | 27.8%), and middle school (85 | 22.1%).
| School Level | # Students | % Students |
| Nursery / Preschool | 5 | 1.3% |
| Kindergarten | 35 | 9.1% |
| Elementary School | 136 | 35.3% |
| Middle School | 85 | 22.1% |
| High School | 107 | 27.8% |
| College / Undergraduate | 17 | 4.4% |
| Graduate / Professional | 0 | 0.0% |
| Total | 385 | 100.0% |
School Enrollment by Age by Funding Source in Dilkon
Out of a total of 385 students who are enrolled in schools in Dilkon, 4 (1.0%) attend a private institution, while the remaining 381 (99.0%) are enrolled in public schools. The age group of 10 to 14 year olds has the highest likelihood of being enrolled in private schools, with 4 (3.3% in the age bracket) enrolled. Conversely, the age group of 3 to 4 year olds has the lowest likelihood of being enrolled in a private school, with 5 (100.0% in the age bracket) attending a public institution.
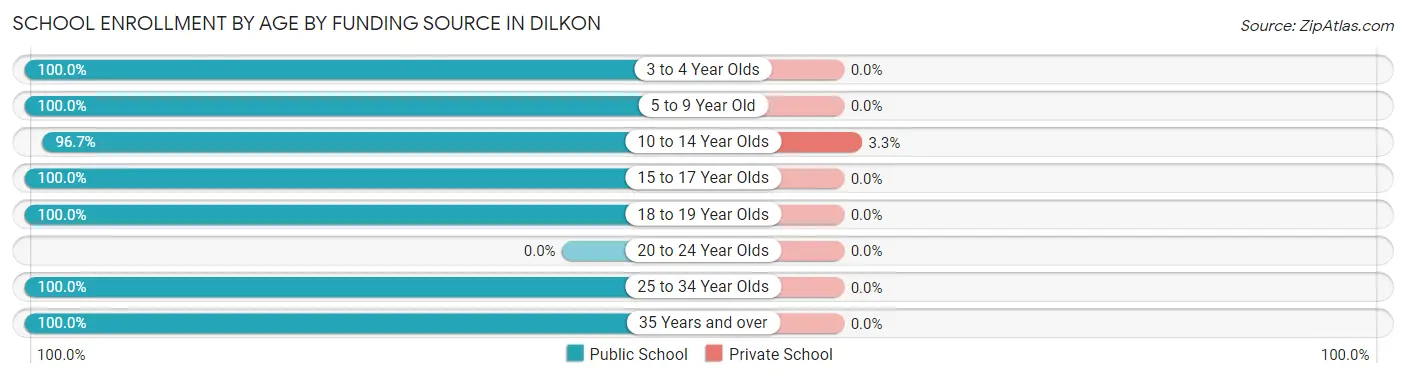
| Age Bracket | Public School | Private School |
| 3 to 4 Year Olds | 5 (100.0%) | 0 (0.0%) |
| 5 to 9 Year Old | 147 (100.0%) | 0 (0.0%) |
| 10 to 14 Year Olds | 116 (96.7%) | 4 (3.3%) |
| 15 to 17 Year Olds | 58 (100.0%) | 0 (0.0%) |
| 18 to 19 Year Olds | 43 (100.0%) | 0 (0.0%) |
| 20 to 24 Year Olds | 0 (0.0%) | 0 (0.0%) |
| 25 to 34 Year Olds | 8 (100.0%) | 0 (0.0%) |
| 35 Years and over | 4 (100.0%) | 0 (0.0%) |
| Total | 381 (99.0%) | 4 (1.0%) |
Educational Attainment by Field of Study in Dilkon
Education (19 | 29.2%), psychology (14 | 21.5%), engineering (8 | 12.3%), business (7 | 10.8%), and arts & humanities (7 | 10.8%) are the most common fields of study among 65 individuals in Dilkon who have obtained a bachelor's degree or higher.
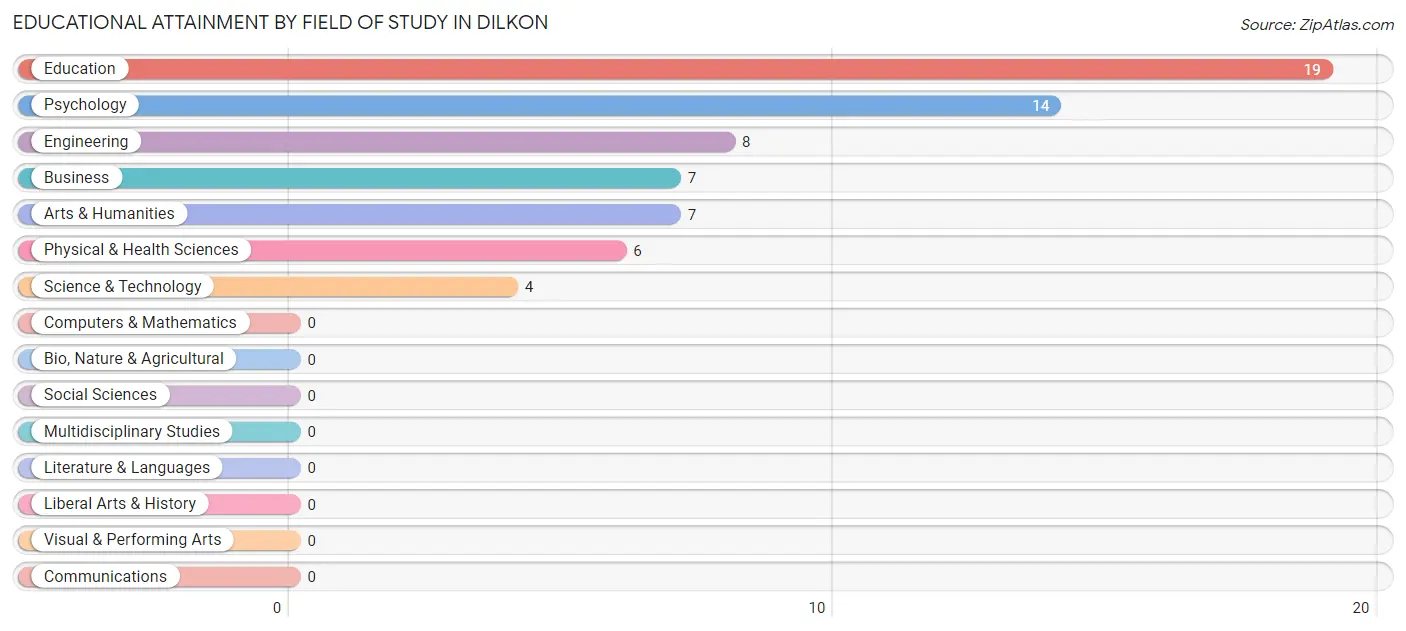
| Field of Study | # Graduates | % Graduates |
| Computers & Mathematics | 0 | 0.0% |
| Bio, Nature & Agricultural | 0 | 0.0% |
| Physical & Health Sciences | 6 | 9.2% |
| Psychology | 14 | 21.5% |
| Social Sciences | 0 | 0.0% |
| Engineering | 8 | 12.3% |
| Multidisciplinary Studies | 0 | 0.0% |
| Science & Technology | 4 | 6.1% |
| Business | 7 | 10.8% |
| Education | 19 | 29.2% |
| Literature & Languages | 0 | 0.0% |
| Liberal Arts & History | 0 | 0.0% |
| Visual & Performing Arts | 0 | 0.0% |
| Communications | 0 | 0.0% |
| Arts & Humanities | 7 | 10.8% |
| Total | 65 | 100.0% |
Transportation & Commute in Dilkon
Vehicle Availability by Sex in Dilkon
The most prevalent vehicle ownership categories in Dilkon are males with 2 vehicles (64, accounting for 28.0%) and females with 2 vehicles (20, making up 38.6%).
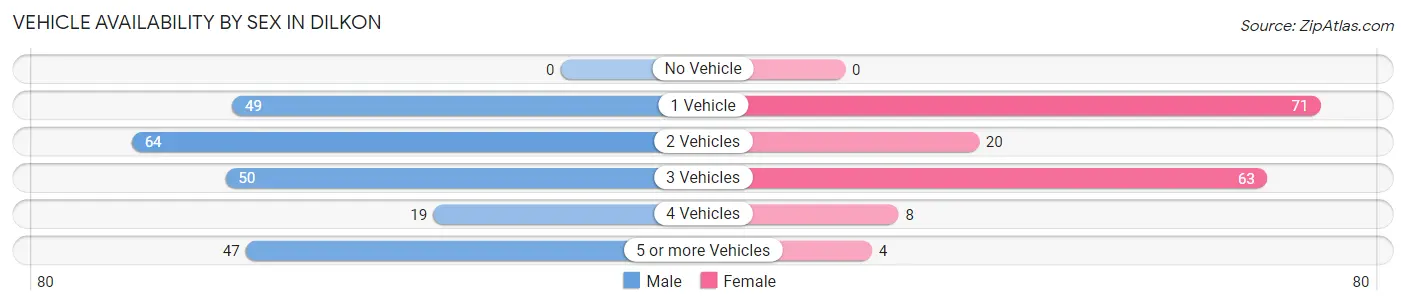
| Vehicles Available | Male | Female |
| No Vehicle | 0 (0.0%) | 0 (0.0%) |
| 1 Vehicle | 49 (21.4%) | 71 (42.8%) |
| 2 Vehicles | 64 (28.0%) | 20 (12.0%) |
| 3 Vehicles | 50 (21.8%) | 63 (38.0%) |
| 4 Vehicles | 19 (8.3%) | 8 (4.8%) |
| 5 or more Vehicles | 47 (20.5%) | 4 (2.4%) |
| Total | 229 (100.0%) | 166 (100.0%) |
Commute Time in Dilkon
The most frequently occuring commute durations in Dilkon are 90 or more minutes (86 commuters, 22.8%), less than 5 minutes (71 commuters, 18.8%), and 5 to 9 minutes (54 commuters, 14.3%).
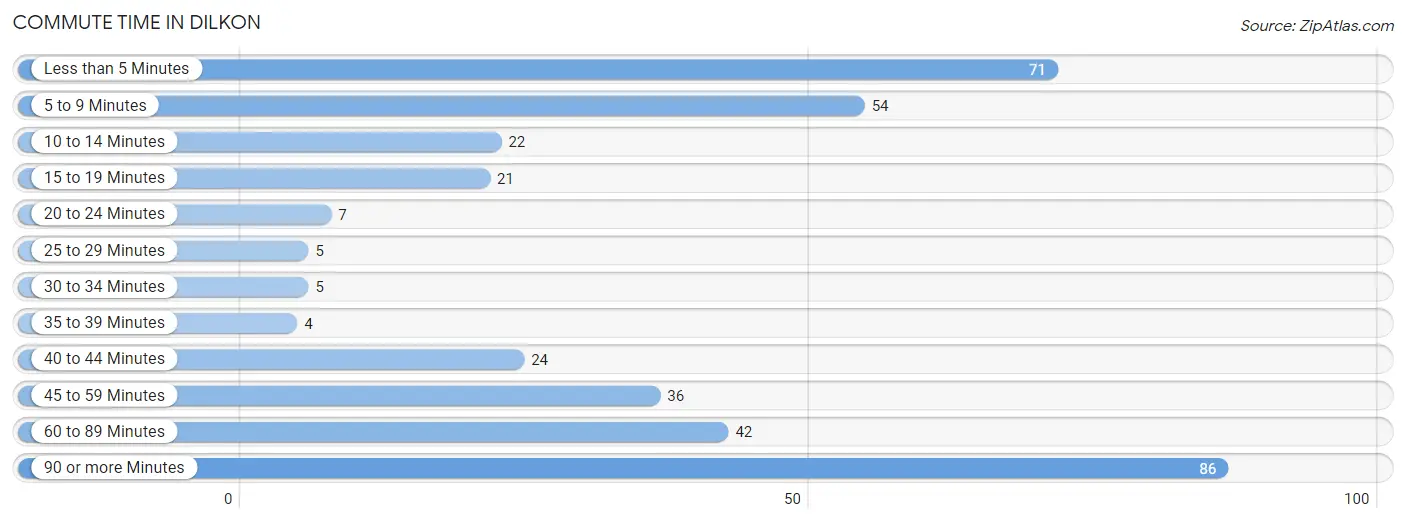
| Commute Time | # Commuters | % Commuters |
| Less than 5 Minutes | 71 | 18.8% |
| 5 to 9 Minutes | 54 | 14.3% |
| 10 to 14 Minutes | 22 | 5.8% |
| 15 to 19 Minutes | 21 | 5.6% |
| 20 to 24 Minutes | 7 | 1.9% |
| 25 to 29 Minutes | 5 | 1.3% |
| 30 to 34 Minutes | 5 | 1.3% |
| 35 to 39 Minutes | 4 | 1.1% |
| 40 to 44 Minutes | 24 | 6.4% |
| 45 to 59 Minutes | 36 | 9.6% |
| 60 to 89 Minutes | 42 | 11.1% |
| 90 or more Minutes | 86 | 22.8% |
Commute Time by Sex in Dilkon
The most common commute times in Dilkon are 90 or more minutes (59 commuters, 27.1%) for males and less than 5 minutes (27 commuters, 17.0%) for females.
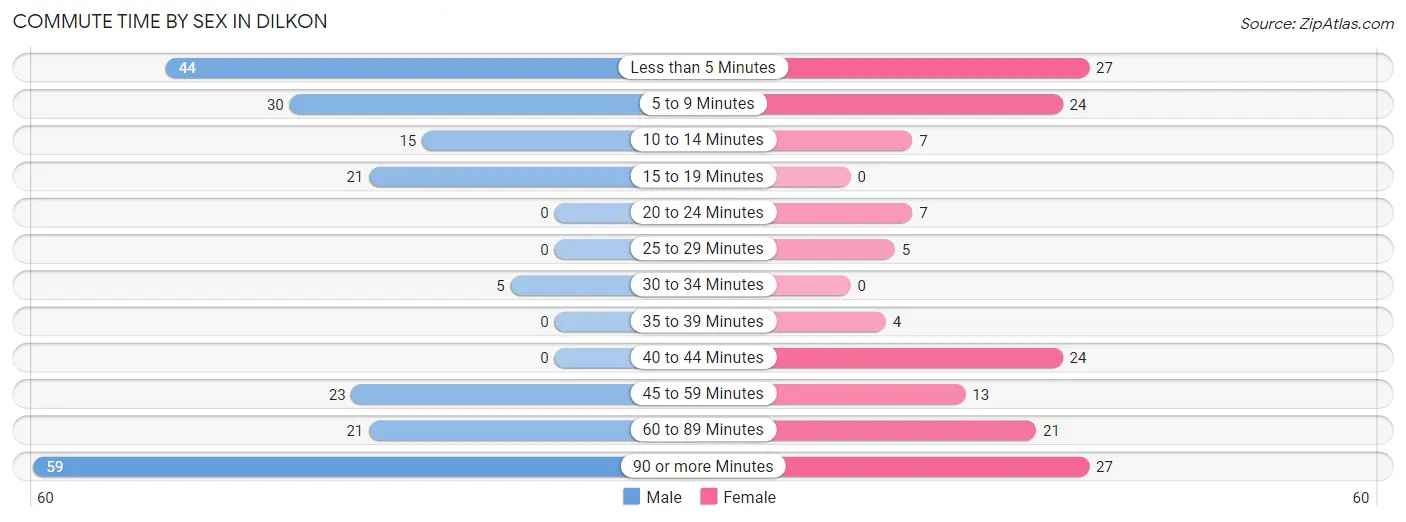
| Commute Time | Male | Female |
| Less than 5 Minutes | 44 (20.2%) | 27 (17.0%) |
| 5 to 9 Minutes | 30 (13.8%) | 24 (15.1%) |
| 10 to 14 Minutes | 15 (6.9%) | 7 (4.4%) |
| 15 to 19 Minutes | 21 (9.6%) | 0 (0.0%) |
| 20 to 24 Minutes | 0 (0.0%) | 7 (4.4%) |
| 25 to 29 Minutes | 0 (0.0%) | 5 (3.1%) |
| 30 to 34 Minutes | 5 (2.3%) | 0 (0.0%) |
| 35 to 39 Minutes | 0 (0.0%) | 4 (2.5%) |
| 40 to 44 Minutes | 0 (0.0%) | 24 (15.1%) |
| 45 to 59 Minutes | 23 (10.5%) | 13 (8.2%) |
| 60 to 89 Minutes | 21 (9.6%) | 21 (13.2%) |
| 90 or more Minutes | 59 (27.1%) | 27 (17.0%) |
Time of Departure to Work by Sex in Dilkon
The most frequent times of departure to work in Dilkon are 12:00 AM to 4:59 AM (51, 23.4%) for males and 7:00 AM to 7:29 AM (49, 30.8%) for females.
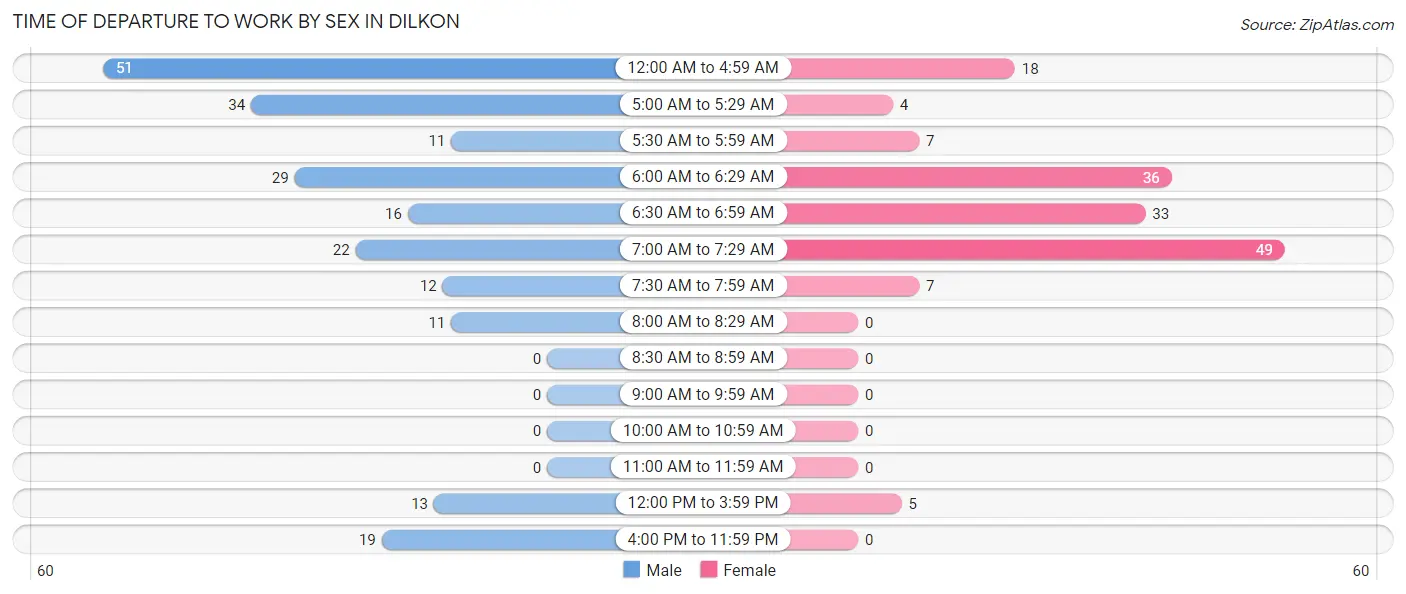
| Time of Departure | Male | Female |
| 12:00 AM to 4:59 AM | 51 (23.4%) | 18 (11.3%) |
| 5:00 AM to 5:29 AM | 34 (15.6%) | 4 (2.5%) |
| 5:30 AM to 5:59 AM | 11 (5.1%) | 7 (4.4%) |
| 6:00 AM to 6:29 AM | 29 (13.3%) | 36 (22.6%) |
| 6:30 AM to 6:59 AM | 16 (7.3%) | 33 (20.7%) |
| 7:00 AM to 7:29 AM | 22 (10.1%) | 49 (30.8%) |
| 7:30 AM to 7:59 AM | 12 (5.5%) | 7 (4.4%) |
| 8:00 AM to 8:29 AM | 11 (5.1%) | 0 (0.0%) |
| 8:30 AM to 8:59 AM | 0 (0.0%) | 0 (0.0%) |
| 9:00 AM to 9:59 AM | 0 (0.0%) | 0 (0.0%) |
| 10:00 AM to 10:59 AM | 0 (0.0%) | 0 (0.0%) |
| 11:00 AM to 11:59 AM | 0 (0.0%) | 0 (0.0%) |
| 12:00 PM to 3:59 PM | 13 (6.0%) | 5 (3.1%) |
| 4:00 PM to 11:59 PM | 19 (8.7%) | 0 (0.0%) |
| Total | 218 (100.0%) | 159 (100.0%) |
Housing Occupancy in Dilkon
Occupancy by Ownership in Dilkon
Of the total 411 dwellings in Dilkon, owner-occupied units account for 204 (49.6%), while renter-occupied units make up 207 (50.4%).
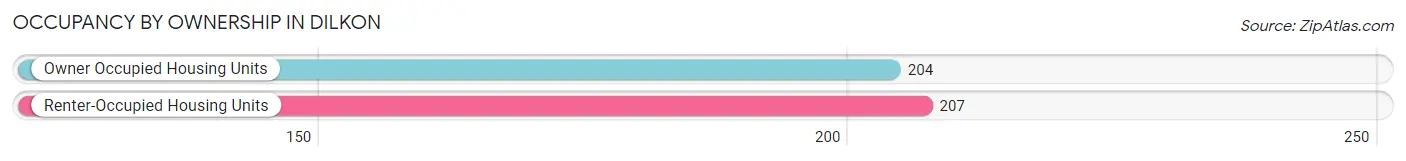
| Occupancy | # Housing Units | % Housing Units |
| Owner Occupied Housing Units | 204 | 49.6% |
| Renter-Occupied Housing Units | 207 | 50.4% |
| Total Occupied Housing Units | 411 | 100.0% |
Occupancy by Household Size in Dilkon
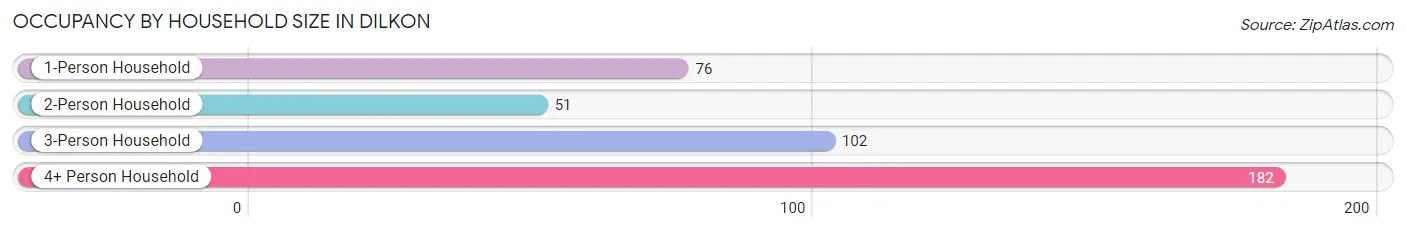
| Household Size | # Housing Units | % Housing Units |
| 1-Person Household | 76 | 18.5% |
| 2-Person Household | 51 | 12.4% |
| 3-Person Household | 102 | 24.8% |
| 4+ Person Household | 182 | 44.3% |
| Total Housing Units | 411 | 100.0% |
Occupancy by Ownership by Household Size in Dilkon
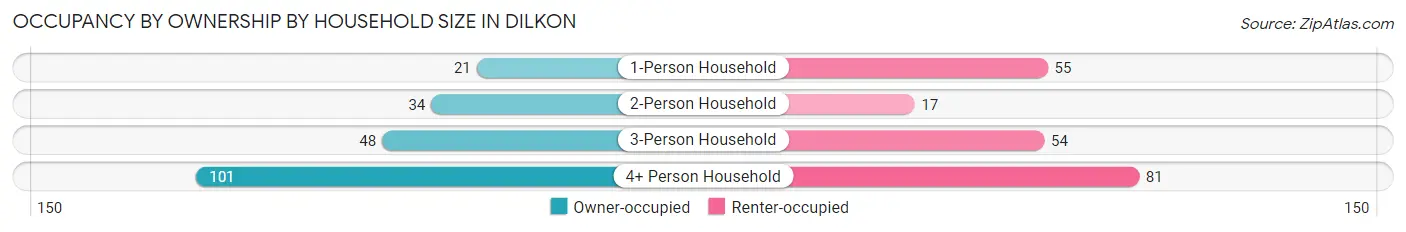
| Household Size | Owner-occupied | Renter-occupied |
| 1-Person Household | 21 (27.6%) | 55 (72.4%) |
| 2-Person Household | 34 (66.7%) | 17 (33.3%) |
| 3-Person Household | 48 (47.1%) | 54 (52.9%) |
| 4+ Person Household | 101 (55.5%) | 81 (44.5%) |
| Total Housing Units | 204 (49.6%) | 207 (50.4%) |
Occupancy by Educational Attainment in Dilkon
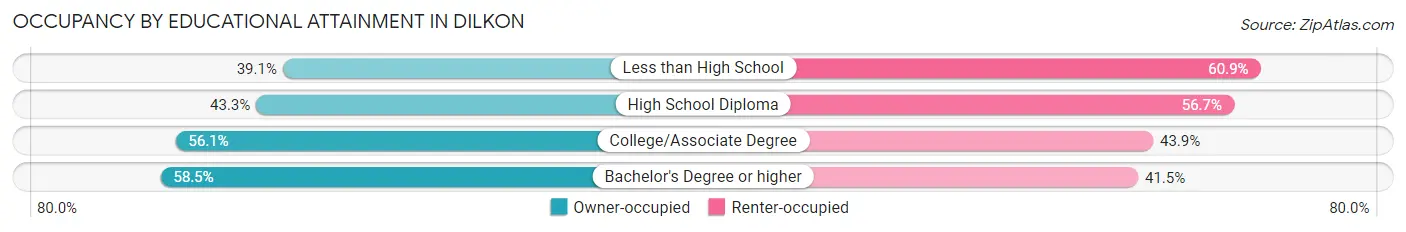
| Household Size | Owner-occupied | Renter-occupied |
| Less than High School | 25 (39.1%) | 39 (60.9%) |
| High School Diploma | 58 (43.3%) | 76 (56.7%) |
| College/Associate Degree | 83 (56.1%) | 65 (43.9%) |
| Bachelor's Degree or higher | 38 (58.5%) | 27 (41.5%) |
Occupancy by Age of Householder in Dilkon
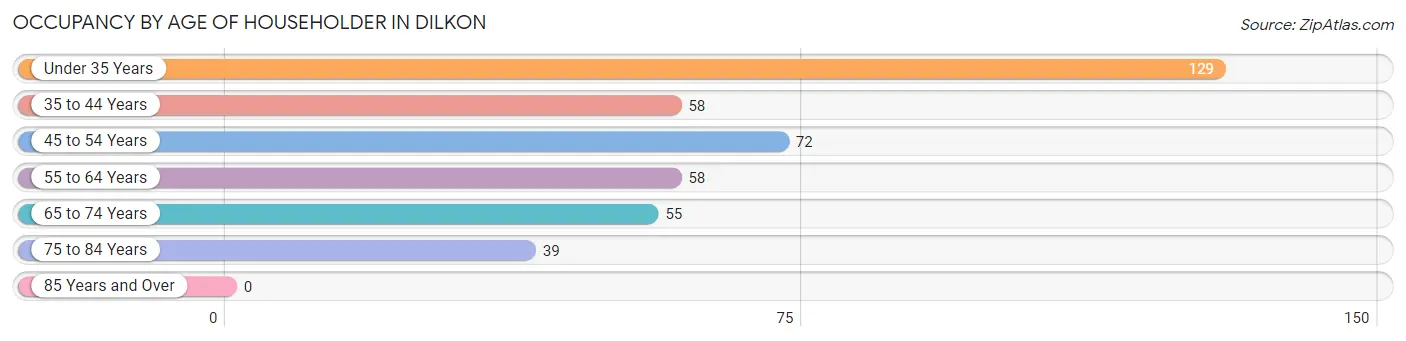
| Age Bracket | # Households | % Households |
| Under 35 Years | 129 | 31.4% |
| 35 to 44 Years | 58 | 14.1% |
| 45 to 54 Years | 72 | 17.5% |
| 55 to 64 Years | 58 | 14.1% |
| 65 to 74 Years | 55 | 13.4% |
| 75 to 84 Years | 39 | 9.5% |
| 85 Years and Over | 0 | 0.0% |
| Total | 411 | 100.0% |
Housing Finances in Dilkon
Median Income by Occupancy in Dilkon
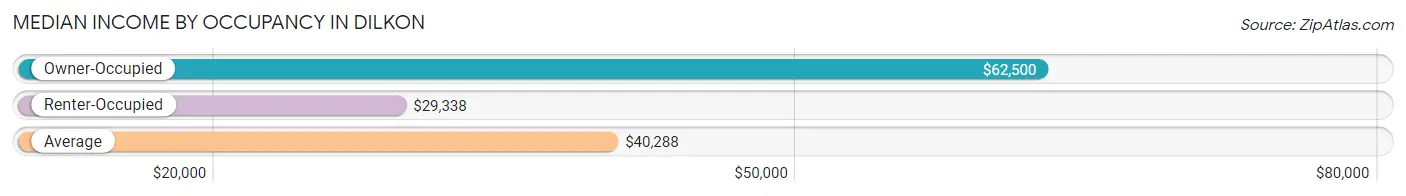
| Occupancy Type | # Households | Median Income |
| Owner-Occupied | 204 (49.6%) | $62,500 |
| Renter-Occupied | 207 (50.4%) | $29,338 |
| Average | 411 (100.0%) | $40,288 |
Occupancy by Householder Income Bracket in Dilkon
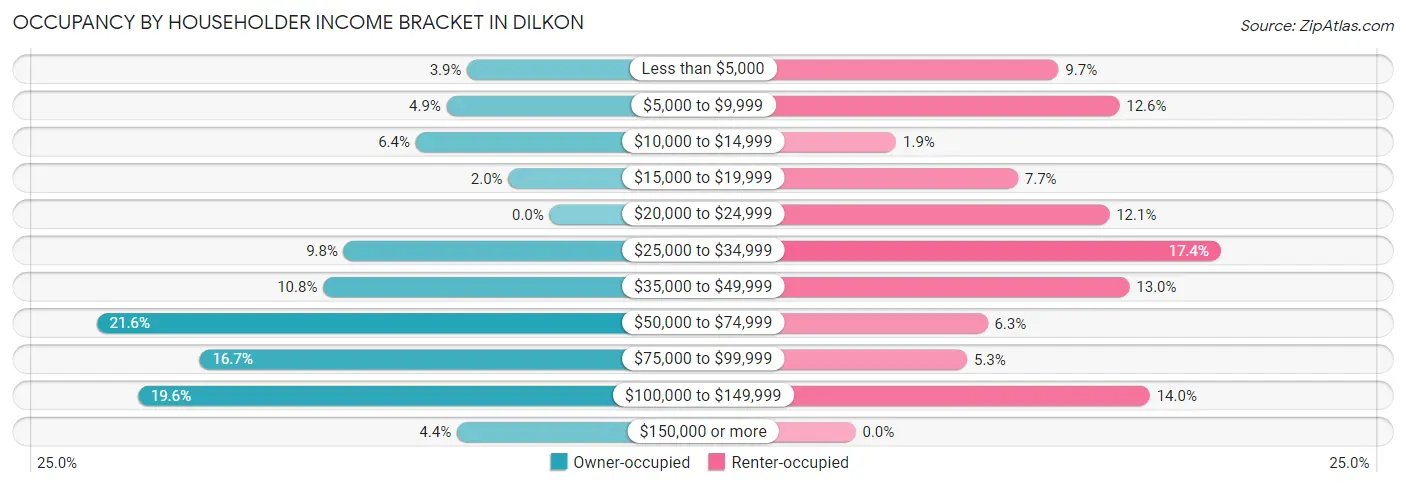
| Income Bracket | Owner-occupied | Renter-occupied |
| Less than $5,000 | 8 (3.9%) | 20 (9.7%) |
| $5,000 to $9,999 | 10 (4.9%) | 26 (12.6%) |
| $10,000 to $14,999 | 13 (6.4%) | 4 (1.9%) |
| $15,000 to $19,999 | 4 (2.0%) | 16 (7.7%) |
| $20,000 to $24,999 | 0 (0.0%) | 25 (12.1%) |
| $25,000 to $34,999 | 20 (9.8%) | 36 (17.4%) |
| $35,000 to $49,999 | 22 (10.8%) | 27 (13.0%) |
| $50,000 to $74,999 | 44 (21.6%) | 13 (6.3%) |
| $75,000 to $99,999 | 34 (16.7%) | 11 (5.3%) |
| $100,000 to $149,999 | 40 (19.6%) | 29 (14.0%) |
| $150,000 or more | 9 (4.4%) | 0 (0.0%) |
| Total | 204 (100.0%) | 207 (100.0%) |
Monthly Housing Cost Tiers in Dilkon
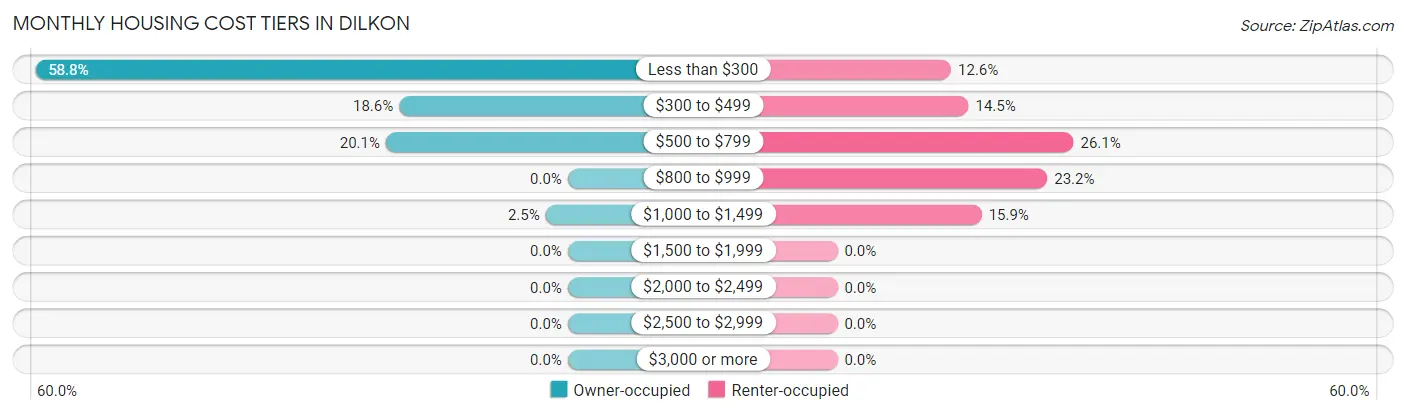
| Monthly Cost | Owner-occupied | Renter-occupied |
| Less than $300 | 120 (58.8%) | 26 (12.6%) |
| $300 to $499 | 38 (18.6%) | 30 (14.5%) |
| $500 to $799 | 41 (20.1%) | 54 (26.1%) |
| $800 to $999 | 0 (0.0%) | 48 (23.2%) |
| $1,000 to $1,499 | 5 (2.5%) | 33 (15.9%) |
| $1,500 to $1,999 | 0 (0.0%) | 0 (0.0%) |
| $2,000 to $2,499 | 0 (0.0%) | 0 (0.0%) |
| $2,500 to $2,999 | 0 (0.0%) | 0 (0.0%) |
| $3,000 or more | 0 (0.0%) | 0 (0.0%) |
| Total | 204 (100.0%) | 207 (100.0%) |
Physical Housing Characteristics in Dilkon
Housing Structures in Dilkon
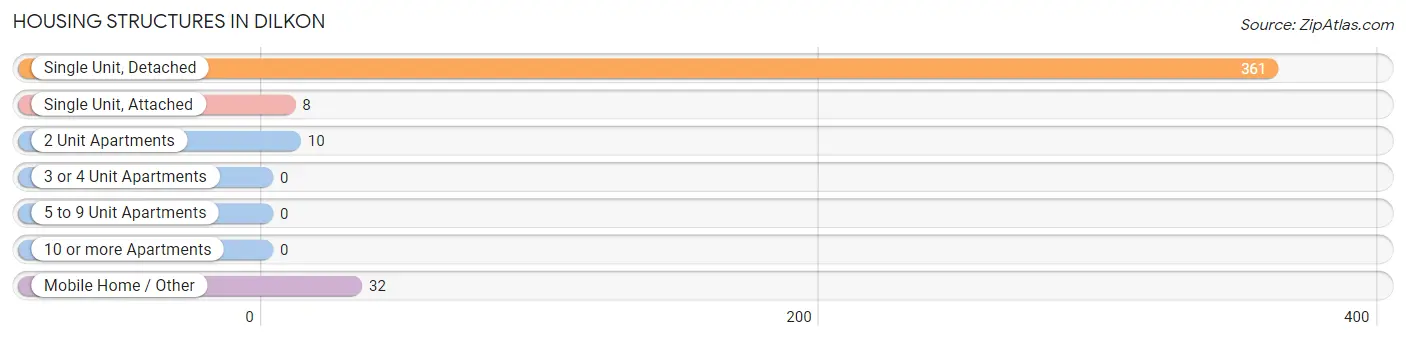
| Structure Type | # Housing Units | % Housing Units |
| Single Unit, Detached | 361 | 87.8% |
| Single Unit, Attached | 8 | 1.9% |
| 2 Unit Apartments | 10 | 2.4% |
| 3 or 4 Unit Apartments | 0 | 0.0% |
| 5 to 9 Unit Apartments | 0 | 0.0% |
| 10 or more Apartments | 0 | 0.0% |
| Mobile Home / Other | 32 | 7.8% |
| Total | 411 | 100.0% |
Housing Structures by Occupancy in Dilkon
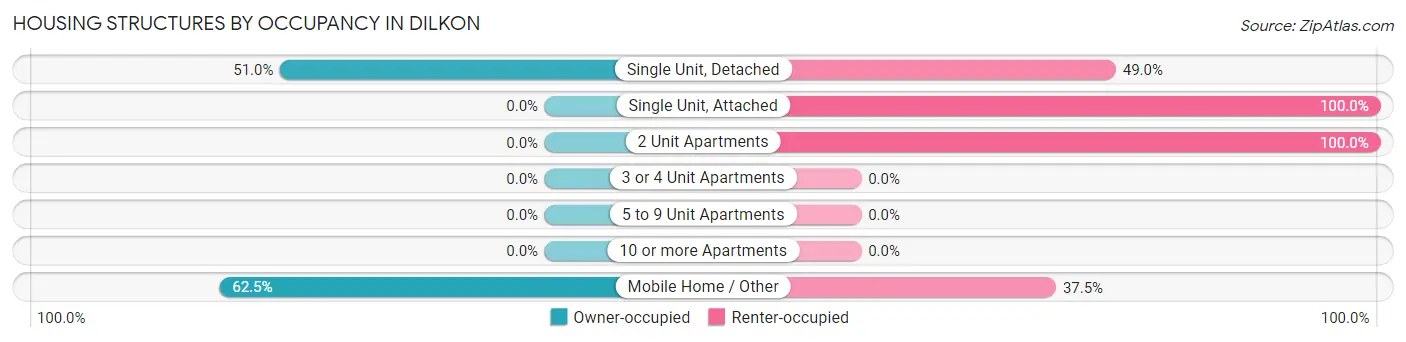
| Structure Type | Owner-occupied | Renter-occupied |
| Single Unit, Detached | 184 (51.0%) | 177 (49.0%) |
| Single Unit, Attached | 0 (0.0%) | 8 (100.0%) |
| 2 Unit Apartments | 0 (0.0%) | 10 (100.0%) |
| 3 or 4 Unit Apartments | 0 (0.0%) | 0 (0.0%) |
| 5 to 9 Unit Apartments | 0 (0.0%) | 0 (0.0%) |
| 10 or more Apartments | 0 (0.0%) | 0 (0.0%) |
| Mobile Home / Other | 20 (62.5%) | 12 (37.5%) |
| Total | 204 (49.6%) | 207 (50.4%) |
Housing Structures by Number of Rooms in Dilkon
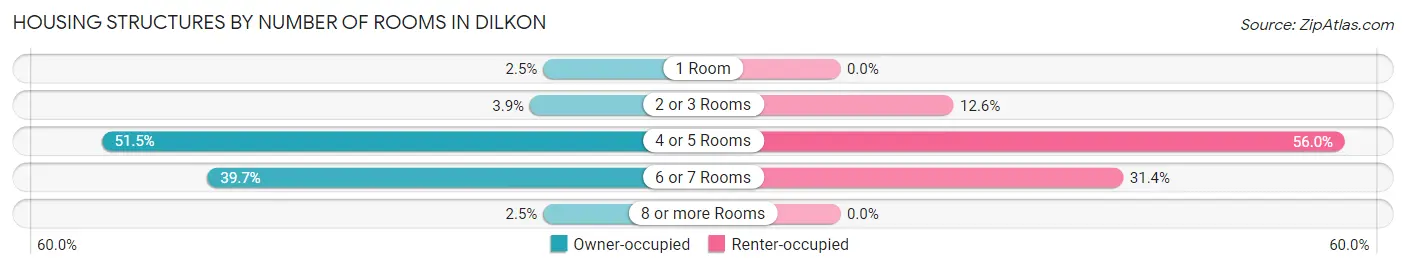
| Number of Rooms | Owner-occupied | Renter-occupied |
| 1 Room | 5 (2.5%) | 0 (0.0%) |
| 2 or 3 Rooms | 8 (3.9%) | 26 (12.6%) |
| 4 or 5 Rooms | 105 (51.5%) | 116 (56.0%) |
| 6 or 7 Rooms | 81 (39.7%) | 65 (31.4%) |
| 8 or more Rooms | 5 (2.5%) | 0 (0.0%) |
| Total | 204 (100.0%) | 207 (100.0%) |
Housing Structure by Heating Type in Dilkon
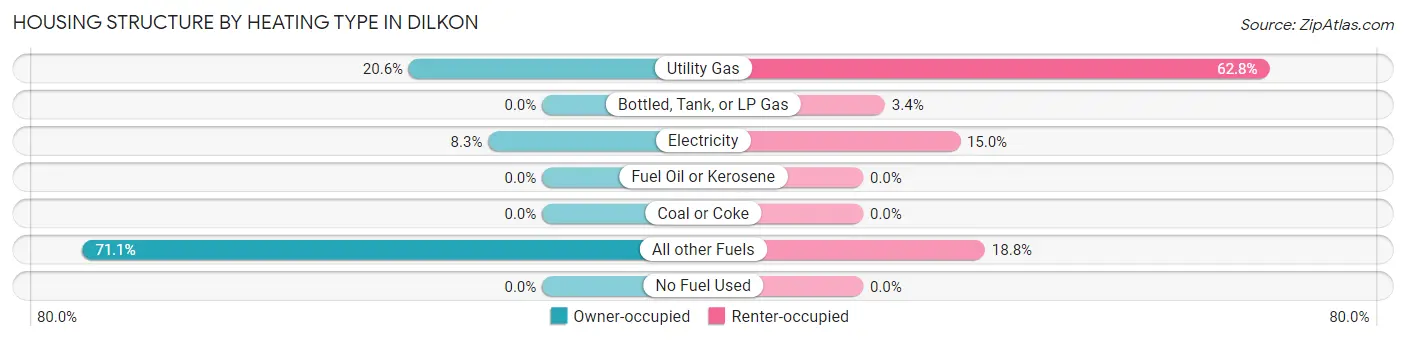
| Heating Type | Owner-occupied | Renter-occupied |
| Utility Gas | 42 (20.6%) | 130 (62.8%) |
| Bottled, Tank, or LP Gas | 0 (0.0%) | 7 (3.4%) |
| Electricity | 17 (8.3%) | 31 (15.0%) |
| Fuel Oil or Kerosene | 0 (0.0%) | 0 (0.0%) |
| Coal or Coke | 0 (0.0%) | 0 (0.0%) |
| All other Fuels | 145 (71.1%) | 39 (18.8%) |
| No Fuel Used | 0 (0.0%) | 0 (0.0%) |
| Total | 204 (100.0%) | 207 (100.0%) |
Household Vehicle Usage in Dilkon
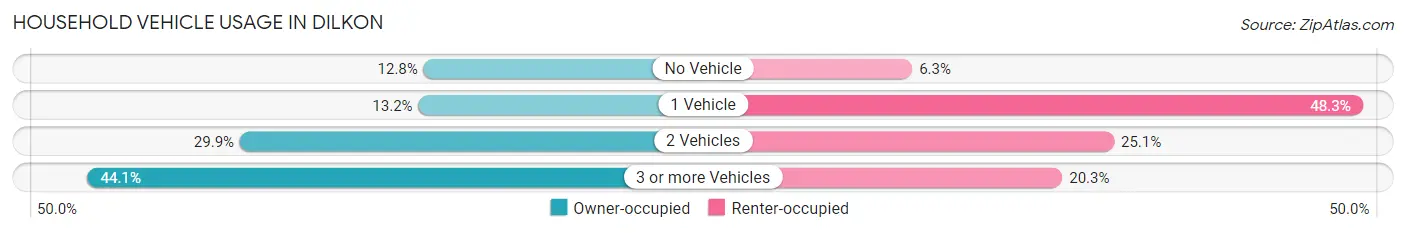
| Vehicles per Household | Owner-occupied | Renter-occupied |
| No Vehicle | 26 (12.8%) | 13 (6.3%) |
| 1 Vehicle | 27 (13.2%) | 100 (48.3%) |
| 2 Vehicles | 61 (29.9%) | 52 (25.1%) |
| 3 or more Vehicles | 90 (44.1%) | 42 (20.3%) |
| Total | 204 (100.0%) | 207 (100.0%) |
Real Estate & Mortgages in Dilkon
Real Estate and Mortgage Overview in Dilkon
| Characteristic | Without Mortgage | With Mortgage |
| Housing Units | 190 | 14 |
| Median Property Value | $95,000 | $0 |
| Median Household Income | $57,500 | $0 |
| Monthly Housing Costs | $273 | $0 |
| Real Estate Taxes | - | - |
Property Value by Mortgage Status in Dilkon
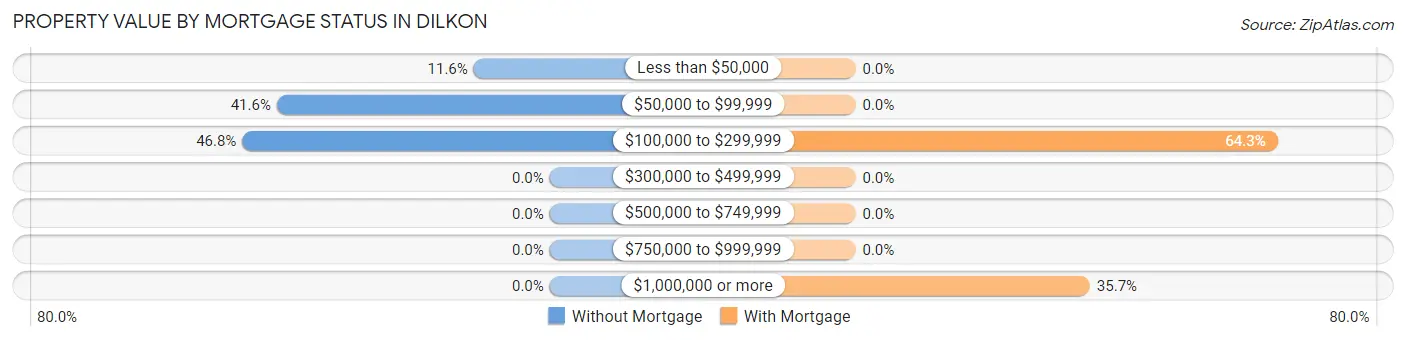
| Property Value | Without Mortgage | With Mortgage |
| Less than $50,000 | 22 (11.6%) | 0 (0.0%) |
| $50,000 to $99,999 | 79 (41.6%) | 0 (0.0%) |
| $100,000 to $299,999 | 89 (46.8%) | 9 (64.3%) |
| $300,000 to $499,999 | 0 (0.0%) | 0 (0.0%) |
| $500,000 to $749,999 | 0 (0.0%) | 0 (0.0%) |
| $750,000 to $999,999 | 0 (0.0%) | 0 (0.0%) |
| $1,000,000 or more | 0 (0.0%) | 5 (35.7%) |
| Total | 190 (100.0%) | 14 (100.0%) |
Household Income by Mortgage Status in Dilkon
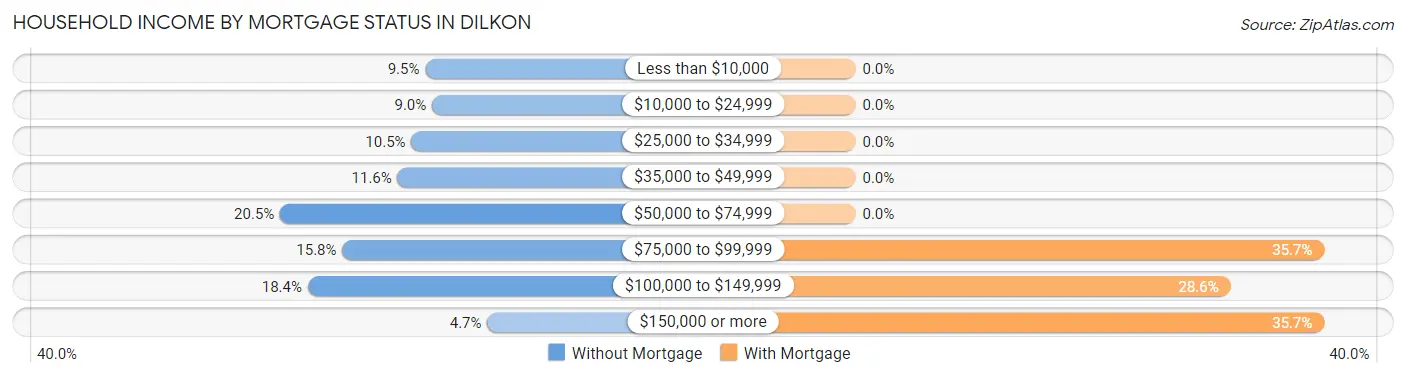
| Household Income | Without Mortgage | With Mortgage |
| Less than $10,000 | 18 (9.5%) | 0 (0.0%) |
| $10,000 to $24,999 | 17 (8.9%) | 0 (0.0%) |
| $25,000 to $34,999 | 20 (10.5%) | 0 (0.0%) |
| $35,000 to $49,999 | 22 (11.6%) | 0 (0.0%) |
| $50,000 to $74,999 | 39 (20.5%) | 0 (0.0%) |
| $75,000 to $99,999 | 30 (15.8%) | 5 (35.7%) |
| $100,000 to $149,999 | 35 (18.4%) | 4 (28.6%) |
| $150,000 or more | 9 (4.7%) | 5 (35.7%) |
| Total | 190 (100.0%) | 14 (100.0%) |
Property Value to Household Income Ratio in Dilkon
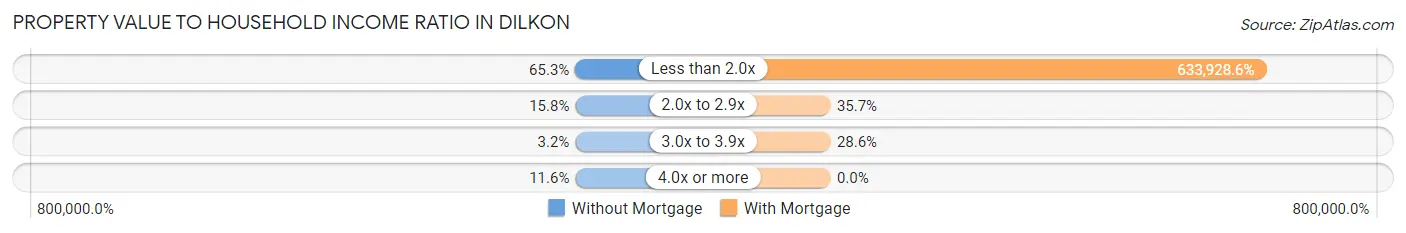
| Value-to-Income Ratio | Without Mortgage | With Mortgage |
| Less than 2.0x | 124 (65.3%) | 88,750 (633,928.6%) |
| 2.0x to 2.9x | 30 (15.8%) | 5 (35.7%) |
| 3.0x to 3.9x | 6 (3.2%) | 4 (28.6%) |
| 4.0x or more | 22 (11.6%) | 0 (0.0%) |
| Total | 190 (100.0%) | 14 (100.0%) |
Real Estate Taxes by Mortgage Status in Dilkon
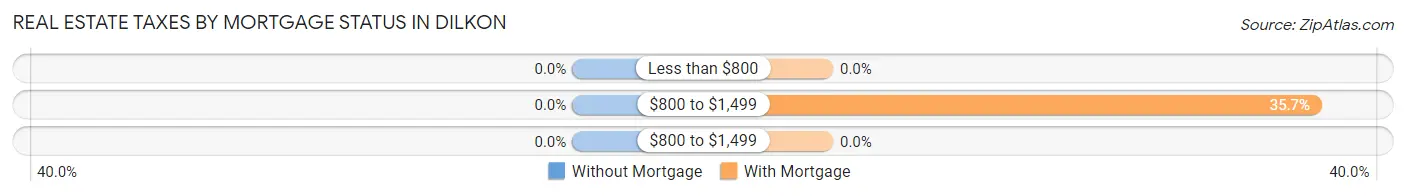
| Property Taxes | Without Mortgage | With Mortgage |
| Less than $800 | 0 (0.0%) | 0 (0.0%) |
| $800 to $1,499 | 0 (0.0%) | 5 (35.7%) |
| $800 to $1,499 | 0 (0.0%) | 0 (0.0%) |
| Total | 190 (100.0%) | 14 (100.0%) |
Health & Disability in Dilkon
Health Insurance Coverage by Age in Dilkon
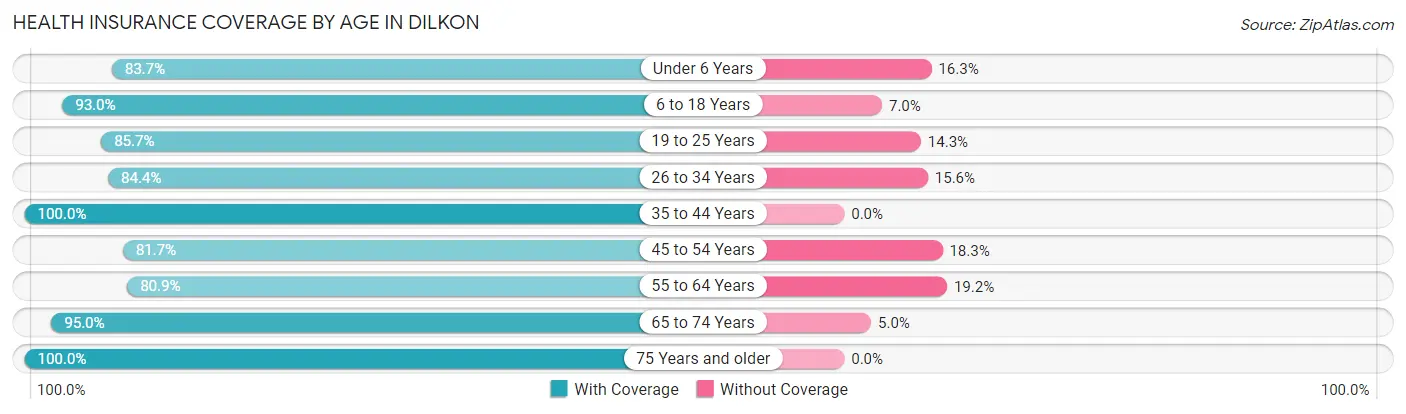
| Age Bracket | With Coverage | Without Coverage |
| Under 6 Years | 103 (83.7%) | 20 (16.3%) |
| 6 to 18 Years | 330 (93.0%) | 25 (7.0%) |
| 19 to 25 Years | 96 (85.7%) | 16 (14.3%) |
| 26 to 34 Years | 168 (84.4%) | 31 (15.6%) |
| 35 to 44 Years | 145 (100.0%) | 0 (0.0%) |
| 45 to 54 Years | 116 (81.7%) | 26 (18.3%) |
| 55 to 64 Years | 76 (80.8%) | 18 (19.2%) |
| 65 to 74 Years | 95 (95.0%) | 5 (5.0%) |
| 75 Years and older | 55 (100.0%) | 0 (0.0%) |
| Total | 1,184 (89.4%) | 141 (10.6%) |
Health Insurance Coverage by Citizenship Status in Dilkon
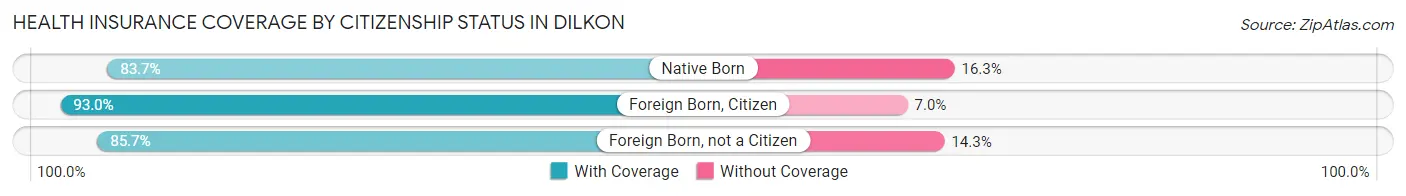
| Citizenship Status | With Coverage | Without Coverage |
| Native Born | 103 (83.7%) | 20 (16.3%) |
| Foreign Born, Citizen | 330 (93.0%) | 25 (7.0%) |
| Foreign Born, not a Citizen | 96 (85.7%) | 16 (14.3%) |
Health Insurance Coverage by Household Income in Dilkon
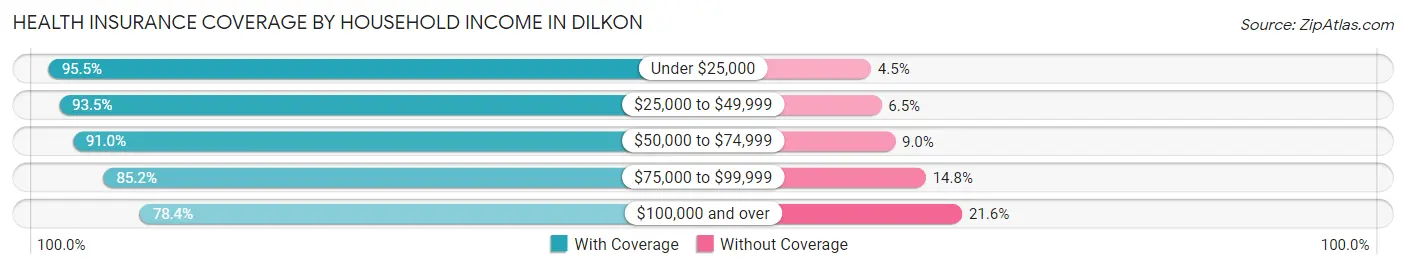
| Household Income | With Coverage | Without Coverage |
| Under $25,000 | 338 (95.5%) | 16 (4.5%) |
| $25,000 to $49,999 | 318 (93.5%) | 22 (6.5%) |
| $50,000 to $74,999 | 171 (91.0%) | 17 (9.0%) |
| $75,000 to $99,999 | 121 (85.2%) | 21 (14.8%) |
| $100,000 and over | 236 (78.4%) | 65 (21.6%) |
Public vs Private Health Insurance Coverage by Age in Dilkon
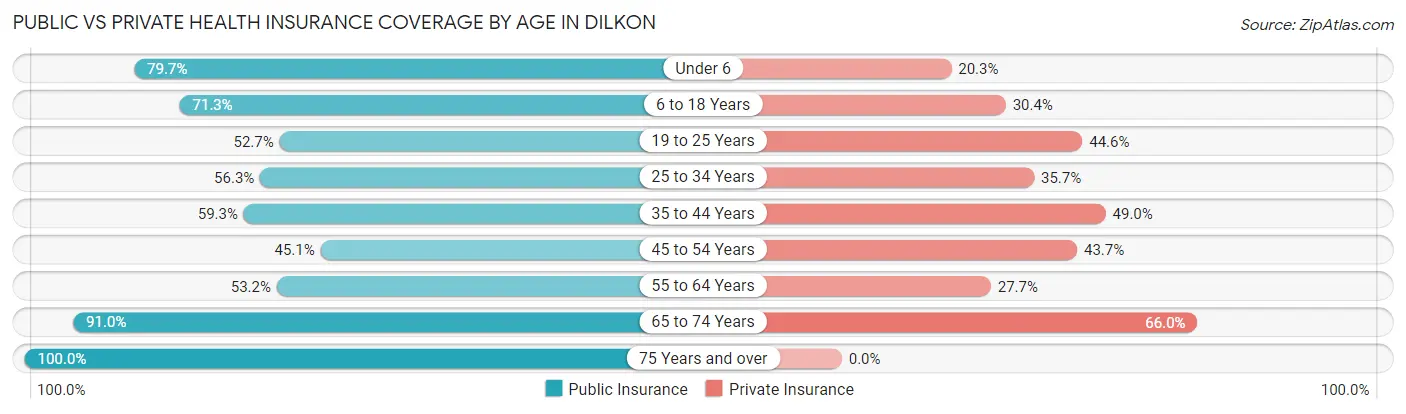
| Age Bracket | Public Insurance | Private Insurance |
| Under 6 | 98 (79.7%) | 25 (20.3%) |
| 6 to 18 Years | 253 (71.3%) | 108 (30.4%) |
| 19 to 25 Years | 59 (52.7%) | 50 (44.6%) |
| 25 to 34 Years | 112 (56.3%) | 71 (35.7%) |
| 35 to 44 Years | 86 (59.3%) | 71 (49.0%) |
| 45 to 54 Years | 64 (45.1%) | 62 (43.7%) |
| 55 to 64 Years | 50 (53.2%) | 26 (27.7%) |
| 65 to 74 Years | 91 (91.0%) | 66 (66.0%) |
| 75 Years and over | 55 (100.0%) | 0 (0.0%) |
| Total | 868 (65.5%) | 479 (36.1%) |
Disability Status by Sex by Age in Dilkon
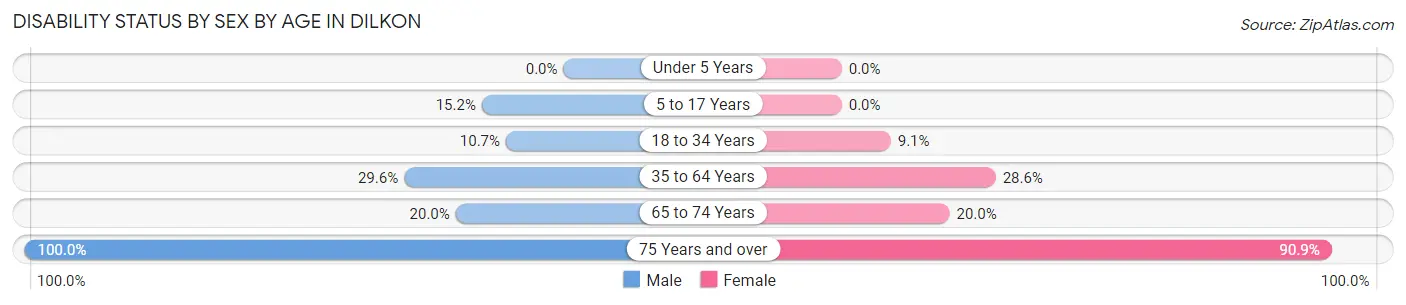
| Age Bracket | Male | Female |
| Under 5 Years | 0 (0.0%) | 0 (0.0%) |
| 5 to 17 Years | 30 (15.1%) | 0 (0.0%) |
| 18 to 34 Years | 19 (10.7%) | 16 (9.1%) |
| 35 to 64 Years | 63 (29.6%) | 48 (28.6%) |
| 65 to 74 Years | 9 (20.0%) | 11 (20.0%) |
| 75 Years and over | 11 (100.0%) | 40 (90.9%) |
Disability Class by Sex by Age in Dilkon
Disability Class: Hearing Difficulty
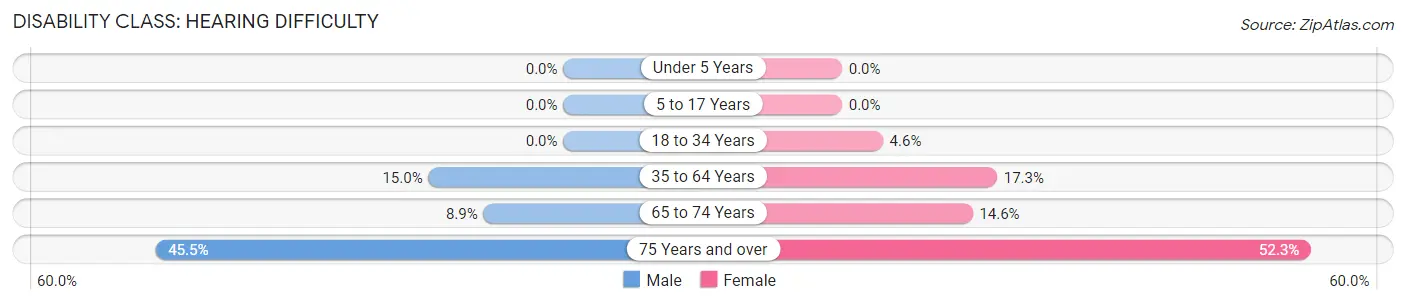
| Age Bracket | Male | Female |
| Under 5 Years | 0 (0.0%) | 0 (0.0%) |
| 5 to 17 Years | 0 (0.0%) | 0 (0.0%) |
| 18 to 34 Years | 0 (0.0%) | 8 (4.5%) |
| 35 to 64 Years | 32 (15.0%) | 29 (17.3%) |
| 65 to 74 Years | 4 (8.9%) | 8 (14.5%) |
| 75 Years and over | 5 (45.5%) | 23 (52.3%) |
Disability Class: Vision Difficulty
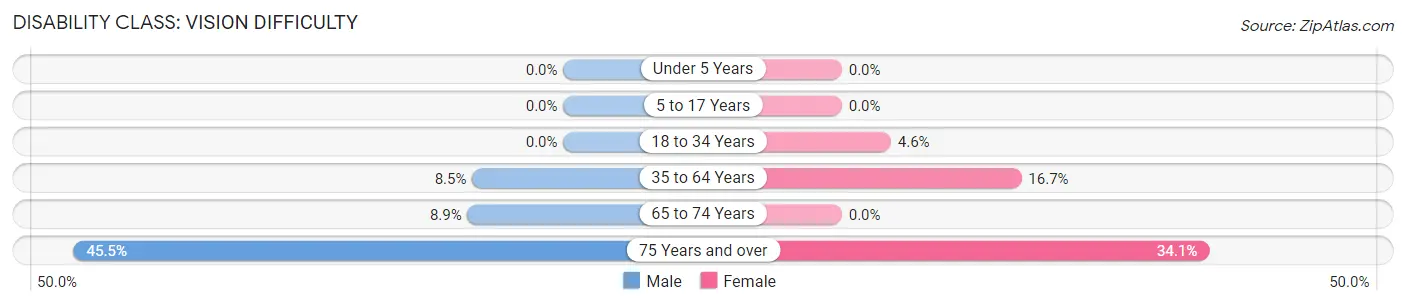
| Age Bracket | Male | Female |
| Under 5 Years | 0 (0.0%) | 0 (0.0%) |
| 5 to 17 Years | 0 (0.0%) | 0 (0.0%) |
| 18 to 34 Years | 0 (0.0%) | 8 (4.5%) |
| 35 to 64 Years | 18 (8.5%) | 28 (16.7%) |
| 65 to 74 Years | 4 (8.9%) | 0 (0.0%) |
| 75 Years and over | 5 (45.5%) | 15 (34.1%) |
Disability Class: Cognitive Difficulty
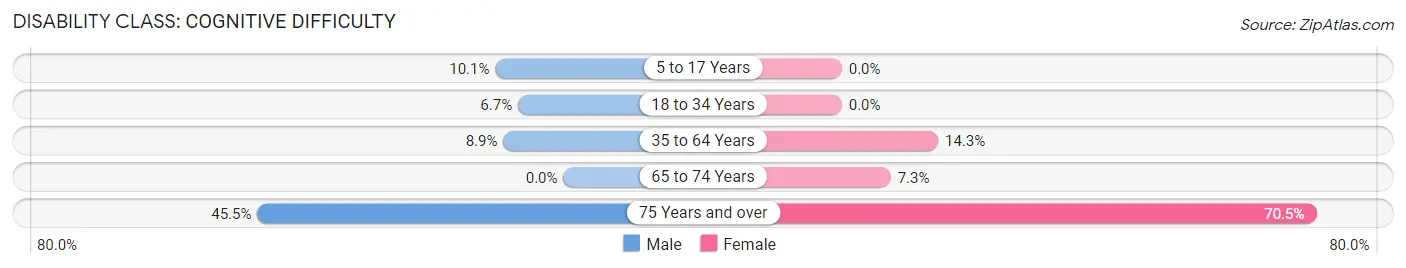
| Age Bracket | Male | Female |
| 5 to 17 Years | 20 (10.1%) | 0 (0.0%) |
| 18 to 34 Years | 12 (6.7%) | 0 (0.0%) |
| 35 to 64 Years | 19 (8.9%) | 24 (14.3%) |
| 65 to 74 Years | 0 (0.0%) | 4 (7.3%) |
| 75 Years and over | 5 (45.5%) | 31 (70.5%) |
Disability Class: Ambulatory Difficulty
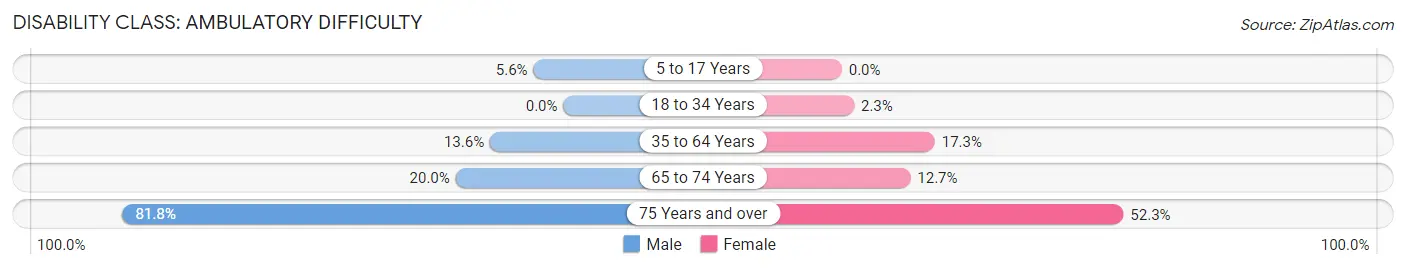
| Age Bracket | Male | Female |
| 5 to 17 Years | 11 (5.6%) | 0 (0.0%) |
| 18 to 34 Years | 0 (0.0%) | 4 (2.3%) |
| 35 to 64 Years | 29 (13.6%) | 29 (17.3%) |
| 65 to 74 Years | 9 (20.0%) | 7 (12.7%) |
| 75 Years and over | 9 (81.8%) | 23 (52.3%) |
Disability Class: Self-Care Difficulty
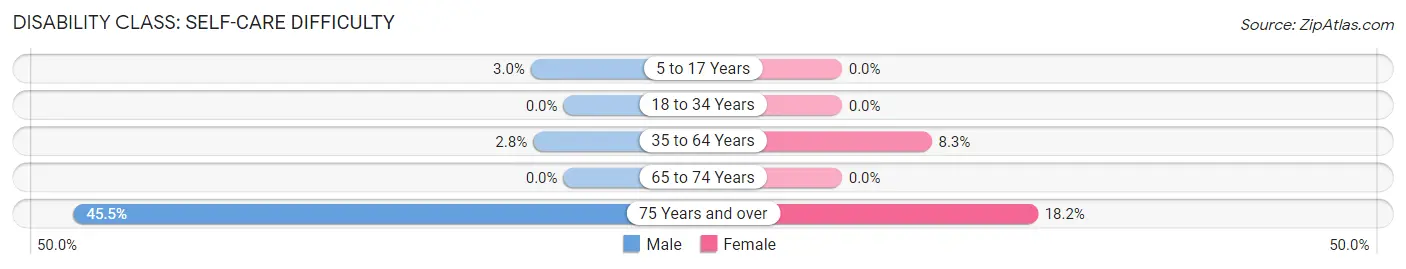
| Age Bracket | Male | Female |
| 5 to 17 Years | 6 (3.0%) | 0 (0.0%) |
| 18 to 34 Years | 0 (0.0%) | 0 (0.0%) |
| 35 to 64 Years | 6 (2.8%) | 14 (8.3%) |
| 65 to 74 Years | 0 (0.0%) | 0 (0.0%) |
| 75 Years and over | 5 (45.5%) | 8 (18.2%) |
Technology Access in Dilkon
Computing Device Access in Dilkon
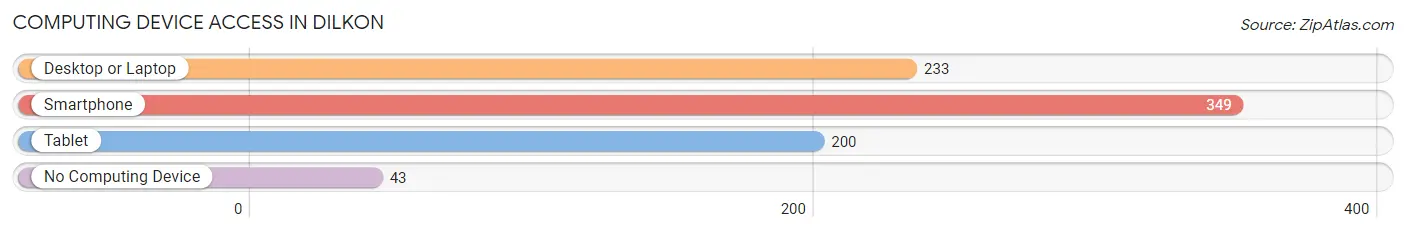
| Device Type | # Households | % Households |
| Desktop or Laptop | 233 | 56.7% |
| Smartphone | 349 | 84.9% |
| Tablet | 200 | 48.7% |
| No Computing Device | 43 | 10.5% |
| Total | 411 | 100.0% |
Internet Access in Dilkon
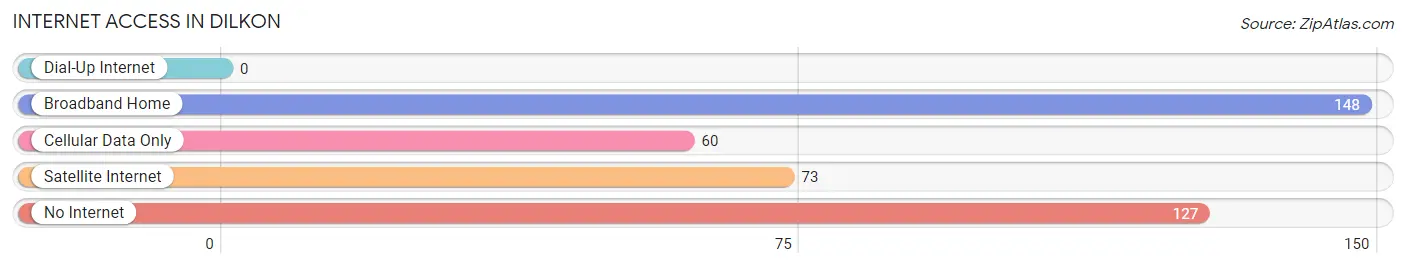
| Internet Type | # Households | % Households |
| Dial-Up Internet | 0 | 0.0% |
| Broadband Home | 148 | 36.0% |
| Cellular Data Only | 60 | 14.6% |
| Satellite Internet | 73 | 17.8% |
| No Internet | 127 | 30.9% |
| Total | 411 | 100.0% |
Dilkon Summary
Dilkon is a census-designated place (CDP) located in Navajo County, Arizona. It is located on the Navajo Nation, the largest Native American reservation in the United States. The population of Dilkon was 1,890 at the 2010 census.
History
The area that is now Dilkon was originally inhabited by the Navajo people. The first non-Native American settlers arrived in the area in the late 1800s. The area was known as "Dilkon Springs" and was a popular stop for travelers on the Navajo Trail. In the early 1900s, the area was settled by Mormon pioneers. The town was officially established in 1912 and was named after the nearby Dilkon Springs.
Geography
Dilkon is located at 35°41'17" North, 110°2'17" West (35.688, -110.038). It is situated in the Navajo Nation, the largest Native American reservation in the United States. The town is located in the northeastern part of the reservation, about 25 miles west of the city of Winslow.
The town has a total area of 4.2 square miles, all of which is land. The terrain is mostly flat, with some rolling hills. The climate is semi-arid, with hot summers and mild winters.
Economy
The economy of Dilkon is largely based on agriculture and tourism. The town is home to several farms and ranches, which produce a variety of crops, including corn, wheat, and hay. The town is also home to several tourist attractions, including the Dilkon Trading Post, which offers a variety of Native American crafts and souvenirs.
Demographics
As of the 2010 census, there were 1,890 people, 545 households, and 441 families residing in the town. The population density was 454.2 people per square mile. The racial makeup of the town was 92.2% Native American, 4.2% White, 0.3% African American, 0.2% Asian, 0.1% Pacific Islander, 0.5% from other races, and 2.6% from two or more races. Hispanic or Latino of any race were 2.2% of the population.
The median age in the town was 28.5 years. About 33.2% of residents were under the age of 18, 10.2% were between the ages of 18 and 24, 24.2% were from 25 to 44, 22.2% were from 45 to 64, and 10.2% were 65 years of age or older. The gender makeup of the town was 48.2% male and 51.8% female.
The median income for a household in the town was $20,938, and the median income for a family was $22,917. About 33.2% of the population was below the poverty line.
Common Questions
What is Per Capita Income in Dilkon?
Per Capita income in Dilkon is $16,489.
What is the Median Family Income in Dilkon?
Median Family Income in Dilkon is $46,250.
What is the Median Household income in Dilkon?
Median Household Income in Dilkon is $40,288.
What is Income or Wage Gap in Dilkon?
Income or Wage Gap in Dilkon is 10.9%.
Women in Dilkon earn 89.1 cents for every dollar earned by a man.
What is Inequality or Gini Index in Dilkon?
Inequality or Gini Index in Dilkon is 0.45.
What is the Total Population of Dilkon?
Total Population of Dilkon is 1,326.
What is the Total Male Population of Dilkon?
Total Male Population of Dilkon is 700.
What is the Total Female Population of Dilkon?
Total Female Population of Dilkon is 626.
What is the Ratio of Males per 100 Females in Dilkon?
There are 111.82 Males per 100 Females in Dilkon.
What is the Ratio of Females per 100 Males in Dilkon?
There are 89.43 Females per 100 Males in Dilkon.
What is the Median Population Age in Dilkon?
Median Population Age in Dilkon is 28.8 Years.
What is the Average Family Size in Dilkon
Average Family Size in Dilkon is 3.6 People.
What is the Average Household Size in Dilkon
Average Household Size in Dilkon is 3.2 People.
How Large is the Labor Force in Dilkon?
There are 439 People in the Labor Forcein in Dilkon.
What is the Percentage of People in the Labor Force in Dilkon?
47.3% of People are in the Labor Force in Dilkon.
What is the Unemployment Rate in Dilkon?
Unemployment Rate in Dilkon is 7.1%.