Zip Codes with the Highest Percentage of Population Employed in Computer, Engineering & Science in Tempe, AZ

RELATED REPORTS & OPTIONS

Computer, Engineering & Science
Population
Families and Households
Female Fertility
Female Fertility (Unmarried)
Race (Community Size)
Race (Percentage)
Ancestry (Community Size)
AfghanAfricanAlbanianAmericanApacheArabArgentineanArmenianAustralianAustrianBahamianBarbadianBasqueBelgianBelizeanBhutaneseBlackfeetBolivianBrazilianBritishBulgarianBurmeseCanadianCentral AmericanCentral American IndianCherokeeCheyenneChileanChoctawColombianCosta RicanCroatianCubanCzechCzechoslovakianDanishDominicanDutchEastern EuropeanEcuadorianEgyptianEnglishEthiopianEuropeanFilipinoFinnishFrenchFrench CanadianGermanGerman RussianGhanaianGreekGuamanian / ChamorroGuatemalanHonduranHopiHungarianIndian (Asian)InupiatIranianIrishIsraeliItalianJamaicanJapaneseJordanianKoreanLaotianLatvianLebaneseLithuanianMacedonianMalaysianMexicanMexican American IndianMoroccanNative HawaiianNavajoNicaraguanNigerianNorthern EuropeanNorwegianOkinawanPakistaniPalestinianPanamanianPeruvianPimaPolishPortuguesePotawatomiPuebloPuerto RicanRomanianRussianSalvadoranSamoanScandinavianScotch-IrishScottishSerbianSiouxSlavicSlovakSloveneSomaliSouth AfricanSouth AmericanSoviet UnionSpaniardSpanishSri LankanSubsaharan AfricanSudaneseSwedishSwissSyrianThaiTlingit-HaidaTohono O'OdhamTonganTurkishU.S. Virgin IslanderUkrainianVenezuelanVietnameseWelshWest IndianYaquiYugoslavianYuman
Ancestry (Percentage)
AfghanAfricanAlbanianAmericanApacheArabArgentineanArmenianAustralianAustrianBahamianBarbadianBasqueBelgianBelizeanBhutaneseBlackfeetBolivianBrazilianBritishBulgarianBurmeseCanadianCentral AmericanCentral American IndianCherokeeCheyenneChileanChoctawColombianCosta RicanCroatianCubanCzechCzechoslovakianDanishDominicanDutchEastern EuropeanEcuadorianEgyptianEnglishEthiopianEuropeanFilipinoFinnishFrenchFrench CanadianGermanGerman RussianGhanaianGreekGuamanian / ChamorroGuatemalanHonduranHopiHungarianIndian (Asian)InupiatIranianIrishIsraeliItalianJamaicanJapaneseJordanianKoreanLaotianLatvianLebaneseLithuanianMacedonianMalaysianMexicanMexican American IndianMoroccanNative HawaiianNavajoNicaraguanNigerianNorthern EuropeanNorwegianOkinawanPakistaniPalestinianPanamanianPeruvianPimaPolishPortuguesePotawatomiPuebloPuerto RicanRomanianRussianSalvadoranSamoanScandinavianScotch-IrishScottishSerbianSiouxSlavicSlovakSloveneSomaliSouth AfricanSouth AmericanSoviet UnionSpaniardSpanishSri LankanSubsaharan AfricanSudaneseSwedishSwissSyrianThaiTlingit-HaidaTohono O'OdhamTonganTurkishU.S. Virgin IslanderUkrainianVenezuelanVietnameseWelshWest IndianYaquiYugoslavianYuman
Immigrant Origin (Total)
Immigrant Origin (Percentage)
Income
Income (Families)
Income (Households)
Poverty
Poverty (Families)
Unemployment
Employment Occupations
Employment Industries
Employer Class
Commute Time
Commute Means
School Enrollment
Education by Degree Field
Occupancy
Finances
Physical Characteristics
Tempe
Compare Zip Codes
Comparison Subject

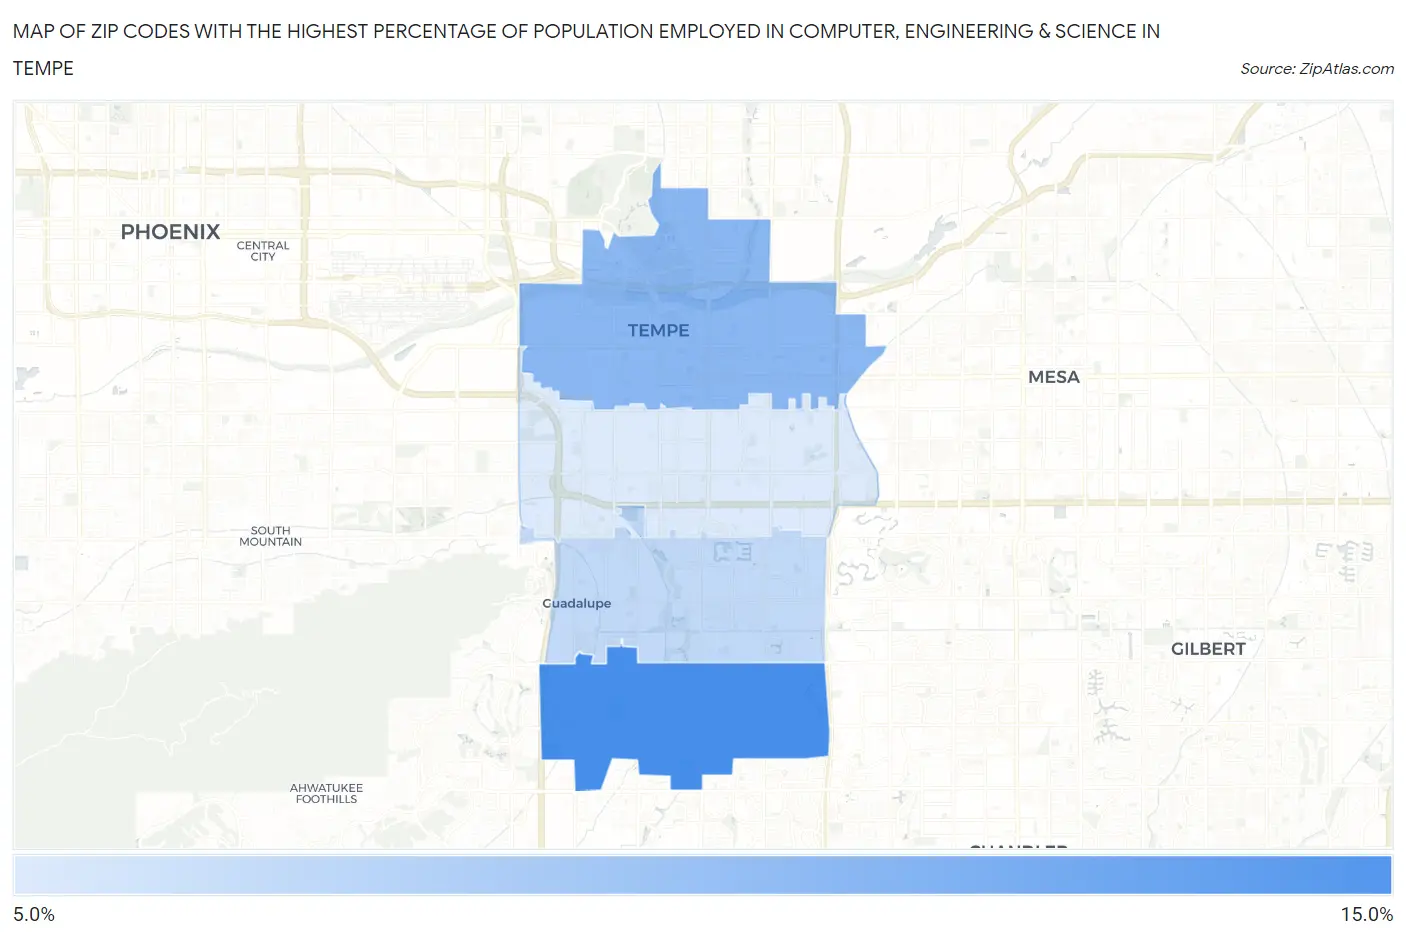
Map of Zip Codes with the Highest Percentage of Population Employed in Computer, Engineering & Science in Tempe

0.0%
15.0%
Zip Codes with the Highest Percentage of Population Employed in Computer, Engineering & Science in Tempe Map

Zip Codes with the Highest Percentage of Population Employed in Computer, Engineering & Science in Tempe, AZ

Zip Code % Employed vs State vs National
1.8528413.9%6.8%(+7.16)#126.8%(+7.18)#1,356
2.8528111.9%6.8%(+5.09)#276.8%(+5.10)#2,102
3.8528310.2%6.8%(+3.43)#486.8%(+3.44)#3,069
4.852829.4%6.8%(+2.58)#616.8%(+2.59)#3,725

Common Questions

What are the Top 3 Zip Codes with the Highest Percentage of Population Employed in Computer, Engineering & Science in Tempe, AZ?
Top 3 Zip Codes with the Highest Percentage of Population Employed in Computer, Engineering & Science in Tempe, AZ are:
#1
13.9%
#2
11.9%
#3
10.2%
What zip code has the Highest Percentage of Population Employed in Computer, Engineering & Science in Tempe, AZ?
85284 has the Highest Percentage of Population Employed in Computer, Engineering & Science in Tempe, AZ with 13.9%.
What is the Percentage of Population Employed in Computer, Engineering & Science in Tempe, AZ?
Percentage of Population Employed in Computer, Engineering & Science in Tempe is 11.2%.
What is the Percentage of Population Employed in Computer, Engineering & Science in Arizona?
Percentage of Population Employed in Computer, Engineering & Science in Arizona is 6.8%.
What is the Percentage of Population Employed in Computer, Engineering & Science in the United States?
Percentage of Population Employed in Computer, Engineering & Science in the United States is 6.8%.