Anthem, AZ Map & Demographics
Anthem Map
Anthem Overview
$53,839
PER CAPITA INCOME
$130,457
AVG FAMILY INCOME
$113,294
AVG HOUSEHOLD INCOME
37.0%
WAGE / INCOME GAP [ % ]
63.0¢/ $1
WAGE / INCOME GAP [ $ ]
0.43
INEQUALITY / GINI INDEX
22,708
TOTAL POPULATION
10,831
MALE POPULATION
11,877
FEMALE POPULATION
91.19
MALES / 100 FEMALES
109.66
FEMALES / 100 MALES
44.1
MEDIAN AGE
3.0
AVG FAMILY SIZE
2.6
AVG HOUSEHOLD SIZE
11,379
LABOR FORCE [ PEOPLE ]
62.3%
PERCENT IN LABOR FORCE
3.8%
UNEMPLOYMENT RATE
Income in Anthem
Income Overview in Anthem
Per Capita Income in Anthem is $53,839, while median incomes of families and households are $130,457 and $113,294 respectively.
| Characteristic | Number | Measure |
| Per Capita Income | 22,708 | $53,839 |
| Median Family Income | 6,639 | $130,457 |
| Mean Family Income | 6,639 | $162,058 |
| Median Household Income | 8,578 | $113,294 |
| Mean Household Income | 8,578 | $142,548 |
| Income Deficit | 6,639 | $0 |
| Wage / Income Gap (%) | 22,708 | 37.04% |
| Wage / Income Gap ($) | 22,708 | 62.96¢ per $1 |
| Gini / Inequality Index | 22,708 | 0.43 |
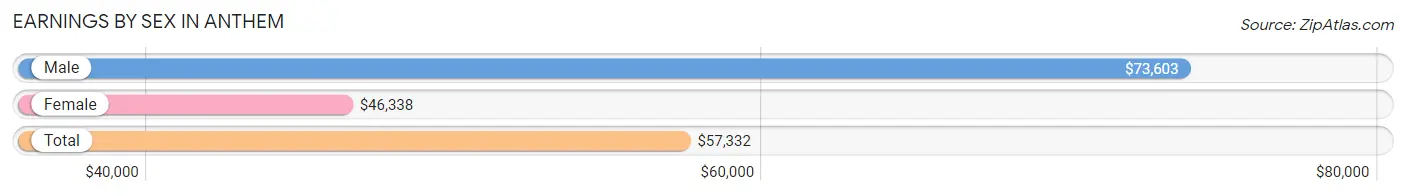
Earnings by Sex in Anthem
Average Earnings in Anthem are $57,332, $73,603 for men and $46,338 for women, a difference of 37.0%.
| Sex | Number | Average Earnings |
| Male | 5,902 (50.9%) | $73,603 |
| Female | 5,701 (49.1%) | $46,338 |
| Total | 11,603 (100.0%) | $57,332 |
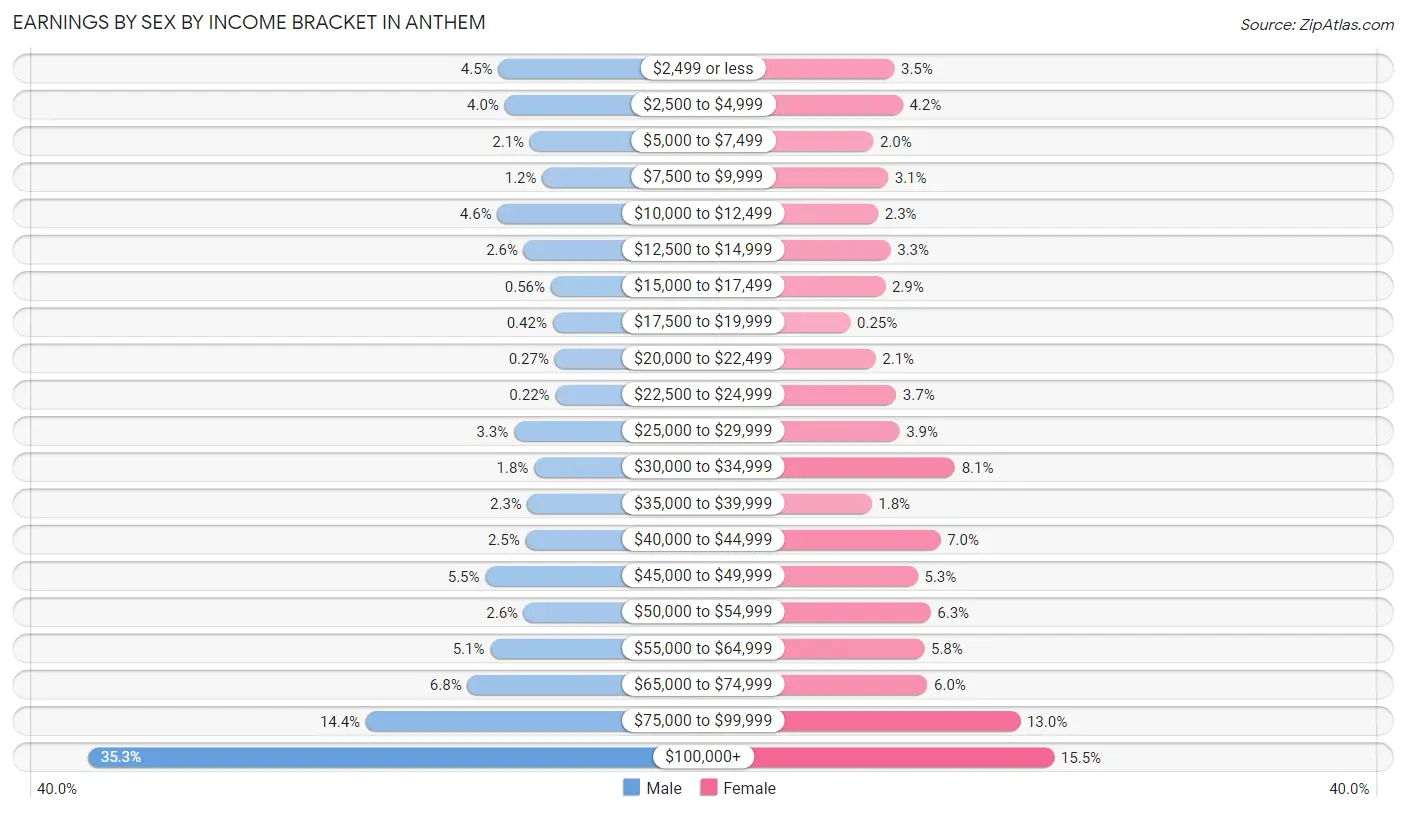
Earnings by Sex by Income Bracket in Anthem
The most common earnings brackets in Anthem are $100,000+ for men (2,081 | 35.3%) and $100,000+ for women (885 | 15.5%).
| Income | Male | Female |
| $2,499 or less | 265 (4.5%) | 202 (3.5%) |
| $2,500 to $4,999 | 237 (4.0%) | 238 (4.2%) |
| $5,000 to $7,499 | 126 (2.1%) | 112 (2.0%) |
| $7,500 to $9,999 | 71 (1.2%) | 175 (3.1%) |
| $10,000 to $12,499 | 269 (4.6%) | 133 (2.3%) |
| $12,500 to $14,999 | 153 (2.6%) | 186 (3.3%) |
| $15,000 to $17,499 | 33 (0.6%) | 163 (2.9%) |
| $17,500 to $19,999 | 25 (0.4%) | 14 (0.3%) |
| $20,000 to $22,499 | 16 (0.3%) | 122 (2.1%) |
| $22,500 to $24,999 | 13 (0.2%) | 210 (3.7%) |
| $25,000 to $29,999 | 196 (3.3%) | 224 (3.9%) |
| $30,000 to $34,999 | 107 (1.8%) | 461 (8.1%) |
| $35,000 to $39,999 | 136 (2.3%) | 105 (1.8%) |
| $40,000 to $44,999 | 145 (2.5%) | 399 (7.0%) |
| $45,000 to $49,999 | 323 (5.5%) | 302 (5.3%) |
| $50,000 to $54,999 | 152 (2.6%) | 357 (6.3%) |
| $55,000 to $64,999 | 301 (5.1%) | 330 (5.8%) |
| $65,000 to $74,999 | 402 (6.8%) | 343 (6.0%) |
| $75,000 to $99,999 | 851 (14.4%) | 740 (13.0%) |
| $100,000+ | 2,081 (35.3%) | 885 (15.5%) |
| Total | 5,902 (100.0%) | 5,701 (100.0%) |
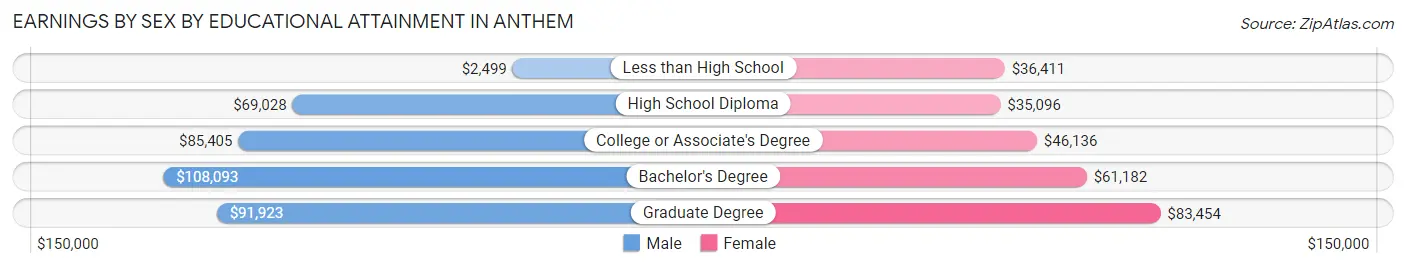
Earnings by Sex by Educational Attainment in Anthem
Average earnings in Anthem are $86,395 for men and $54,399 for women, a difference of 37.0%. Men with an educational attainment of bachelor's degree enjoy the highest average annual earnings of $108,093, while those with less than high school education earn the least with $2,499. Women with an educational attainment of graduate degree earn the most with the average annual earnings of $83,454, while those with high school diploma education have the smallest earnings of $35,096.
| Educational Attainment | Male Income | Female Income |
| Less than High School | $2,499 | $36,411 |
| High School Diploma | $69,028 | $35,096 |
| College or Associate's Degree | $85,405 | $46,136 |
| Bachelor's Degree | $108,093 | $61,182 |
| Graduate Degree | $91,923 | $83,454 |
| Total | $86,395 | $54,399 |
Family Income in Anthem
Family Income Brackets in Anthem
According to the Anthem family income data, there are 1,819 families falling into the $100,000 to $149,999 income range, which is the most common income bracket and makes up 27.4% of all families. Conversely, the less than $10,000 income bracket is the least frequent group with only 40 families (0.6%) belonging to this category.
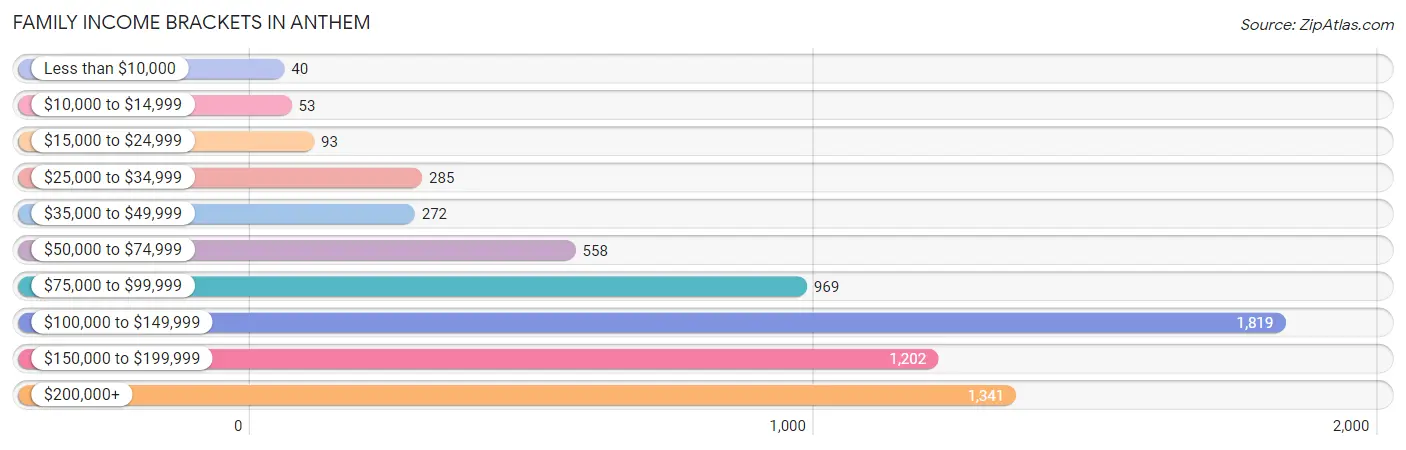
| Income Bracket | # Families | % Families |
| Less than $10,000 | 40 | 0.6% |
| $10,000 to $14,999 | 53 | 0.8% |
| $15,000 to $24,999 | 93 | 1.4% |
| $25,000 to $34,999 | 285 | 4.3% |
| $35,000 to $49,999 | 272 | 4.1% |
| $50,000 to $74,999 | 558 | 8.4% |
| $75,000 to $99,999 | 969 | 14.6% |
| $100,000 to $149,999 | 1,819 | 27.4% |
| $150,000 to $199,999 | 1,202 | 18.1% |
| $200,000+ | 1,341 | 20.2% |
Family Income by Famaliy Size in Anthem
7+ person families (86 | 1.3%) account for the highest median family income in Anthem with $250,001 per family, while 2-person families (3,362 | 50.6%) have the highest median income of $58,894 per family member.
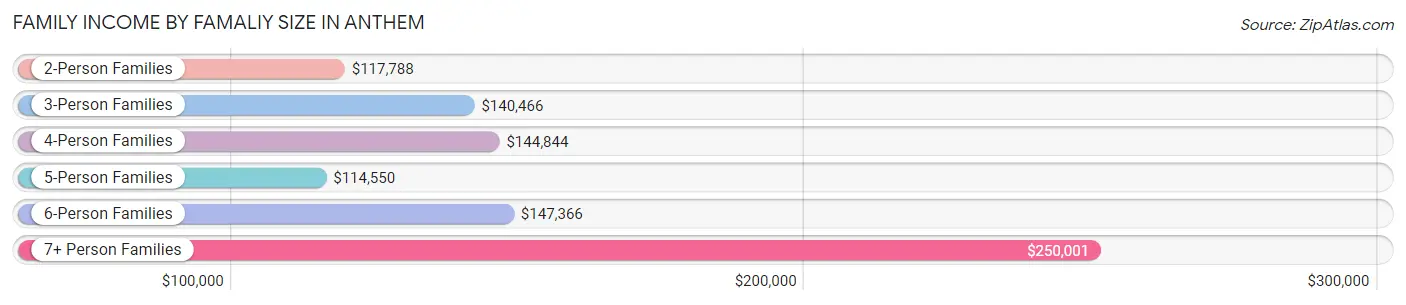
| Income Bracket | # Families | Median Income |
| 2-Person Families | 3,362 (50.6%) | $117,788 |
| 3-Person Families | 1,205 (18.1%) | $140,466 |
| 4-Person Families | 1,025 (15.4%) | $144,844 |
| 5-Person Families | 636 (9.6%) | $114,550 |
| 6-Person Families | 325 (4.9%) | $147,366 |
| 7+ Person Families | 86 (1.3%) | $250,001 |
| Total | 6,639 (100.0%) | $130,457 |
Family Income by Number of Earners in Anthem
The median family income in Anthem is $130,457, with families comprising 3+ earners (881) having the highest median family income of $178,086, while families with no earners (1,199) have the lowest median family income of $69,353, accounting for 13.3% and 18.1% of families, respectively.
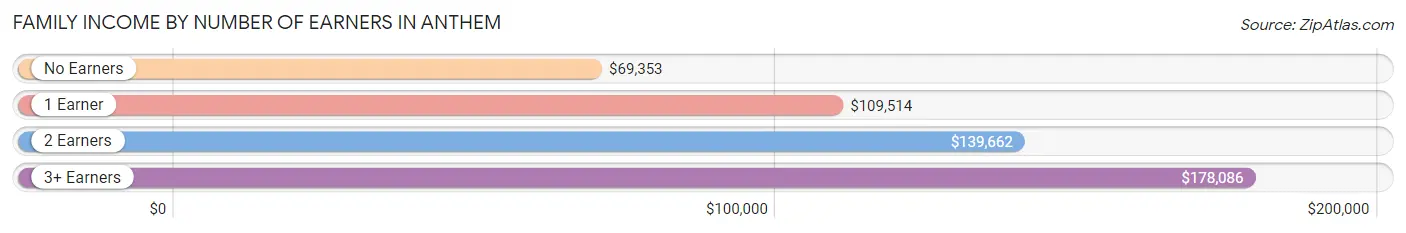
| Number of Earners | # Families | Median Income |
| No Earners | 1,199 (18.1%) | $69,353 |
| 1 Earner | 1,985 (29.9%) | $109,514 |
| 2 Earners | 2,574 (38.8%) | $139,662 |
| 3+ Earners | 881 (13.3%) | $178,086 |
| Total | 6,639 (100.0%) | $130,457 |
Household Income in Anthem
Household Income Brackets in Anthem
With 2,059 households falling in the category, the $100,000 to $149,999 income range is the most frequent in Anthem, accounting for 24.0% of all households. In contrast, only 146 households (1.7%) fall into the $10,000 to $14,999 income bracket, making it the least populous group.
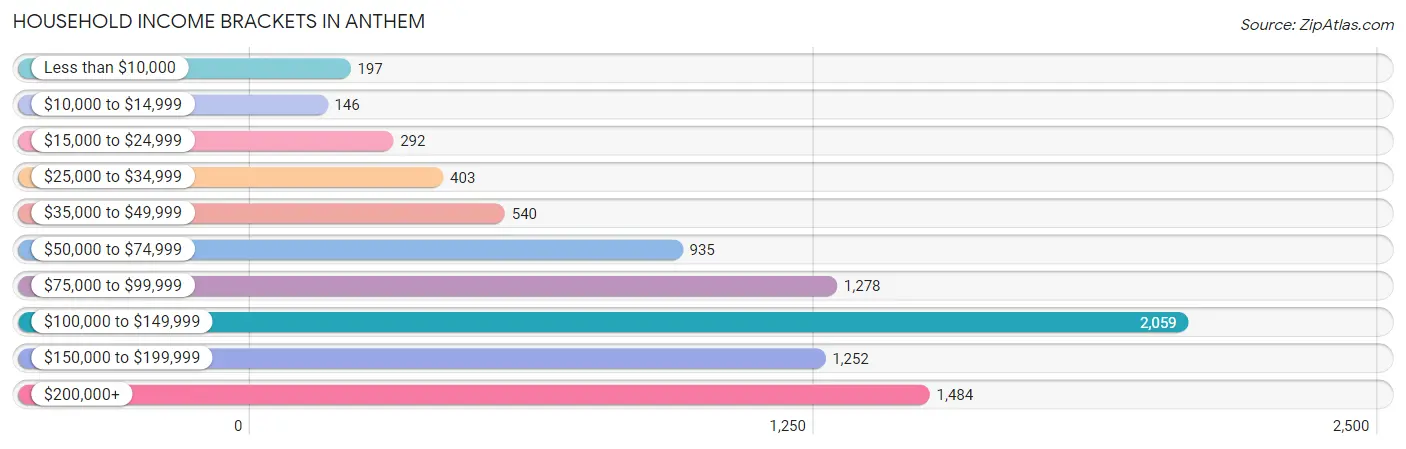
| Income Bracket | # Households | % Households |
| Less than $10,000 | 197 | 2.3% |
| $10,000 to $14,999 | 146 | 1.7% |
| $15,000 to $24,999 | 292 | 3.4% |
| $25,000 to $34,999 | 403 | 4.7% |
| $35,000 to $49,999 | 540 | 6.3% |
| $50,000 to $74,999 | 935 | 10.9% |
| $75,000 to $99,999 | 1,278 | 14.9% |
| $100,000 to $149,999 | 2,059 | 24.0% |
| $150,000 to $199,999 | 1,252 | 14.6% |
| $200,000+ | 1,484 | 17.3% |
Household Income by Householder Age in Anthem
The median household income in Anthem is $113,294, with the highest median household income of $131,814 found in the 45 to 64 years age bracket for the primary householder. A total of 3,718 households (43.3%) fall into this category. Meanwhile, the 65+ years age bracket for the primary householder has the lowest median household income of $69,603, with 2,694 households (31.4%) in this group.
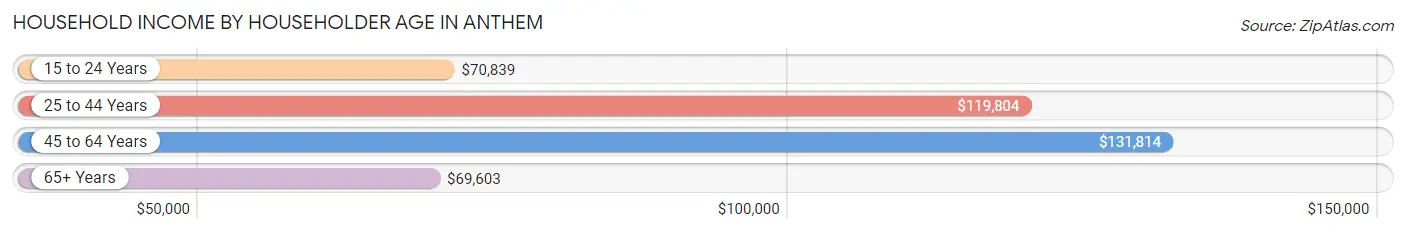
| Income Bracket | # Households | Median Income |
| 15 to 24 Years | 105 (1.2%) | $70,839 |
| 25 to 44 Years | 2,061 (24.0%) | $119,804 |
| 45 to 64 Years | 3,718 (43.3%) | $131,814 |
| 65+ Years | 2,694 (31.4%) | $69,603 |
| Total | 8,578 (100.0%) | $113,294 |
Poverty in Anthem
Income Below Poverty by Sex and Age in Anthem
With 3.3% poverty level for males and 3.6% for females among the residents of Anthem, 18 to 24 year old males and 25 to 34 year old females are the most vulnerable to poverty, with 95 males (9.8%) and 73 females (9.3%) in their respective age groups living below the poverty level.
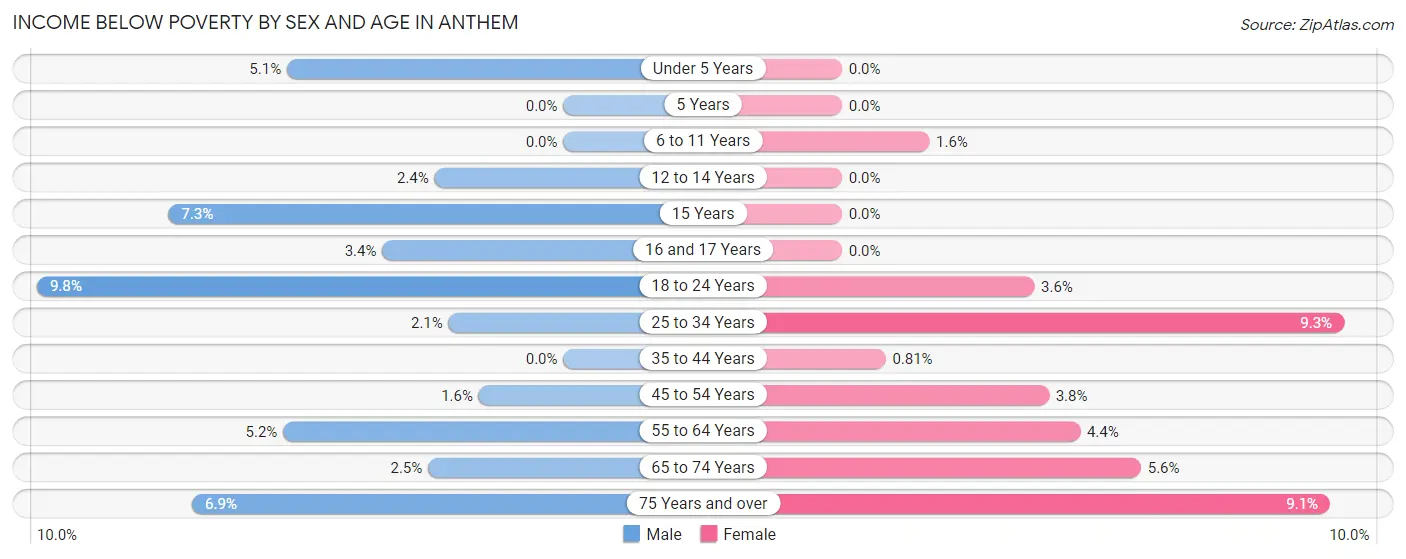
| Age Bracket | Male | Female |
| Under 5 Years | 22 (5.1%) | 0 (0.0%) |
| 5 Years | 0 (0.0%) | 0 (0.0%) |
| 6 to 11 Years | 0 (0.0%) | 12 (1.6%) |
| 12 to 14 Years | 13 (2.4%) | 0 (0.0%) |
| 15 Years | 14 (7.3%) | 0 (0.0%) |
| 16 and 17 Years | 18 (3.4%) | 0 (0.0%) |
| 18 to 24 Years | 95 (9.8%) | 36 (3.6%) |
| 25 to 34 Years | 14 (2.1%) | 73 (9.3%) |
| 35 to 44 Years | 0 (0.0%) | 12 (0.8%) |
| 45 to 54 Years | 29 (1.6%) | 73 (3.8%) |
| 55 to 64 Years | 55 (5.2%) | 70 (4.4%) |
| 65 to 74 Years | 34 (2.5%) | 86 (5.6%) |
| 75 Years and over | 58 (6.9%) | 70 (9.1%) |
| Total | 352 (3.3%) | 432 (3.6%) |
Income Above Poverty by Sex and Age in Anthem
According to the poverty statistics in Anthem, males aged 5 years and females aged under 5 years are the age groups that are most secure financially, with 100.0% of males and 100.0% of females in these age groups living above the poverty line.
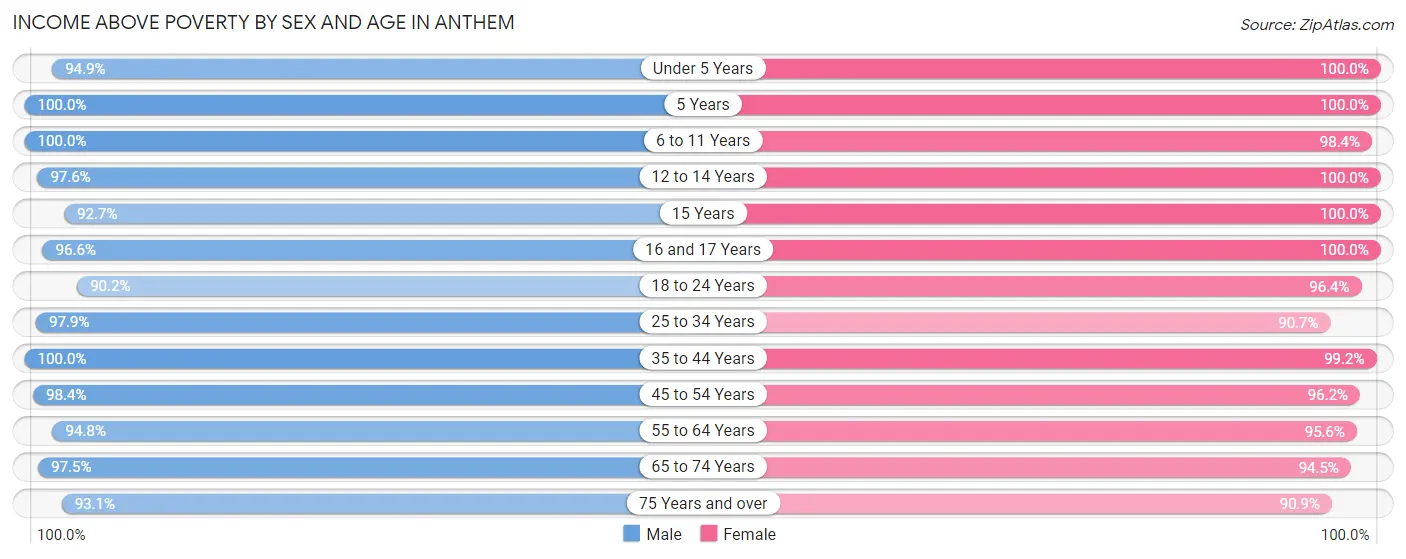
| Age Bracket | Male | Female |
| Under 5 Years | 407 (94.9%) | 604 (100.0%) |
| 5 Years | 146 (100.0%) | 102 (100.0%) |
| 6 to 11 Years | 907 (100.0%) | 727 (98.4%) |
| 12 to 14 Years | 531 (97.6%) | 569 (100.0%) |
| 15 Years | 177 (92.7%) | 212 (100.0%) |
| 16 and 17 Years | 517 (96.6%) | 561 (100.0%) |
| 18 to 24 Years | 877 (90.2%) | 972 (96.4%) |
| 25 to 34 Years | 642 (97.9%) | 710 (90.7%) |
| 35 to 44 Years | 1,343 (100.0%) | 1,462 (99.2%) |
| 45 to 54 Years | 1,813 (98.4%) | 1,826 (96.2%) |
| 55 to 64 Years | 1,003 (94.8%) | 1,514 (95.6%) |
| 65 to 74 Years | 1,319 (97.5%) | 1,464 (94.5%) |
| 75 Years and over | 784 (93.1%) | 703 (90.9%) |
| Total | 10,466 (96.8%) | 11,426 (96.4%) |
Income Below Poverty Among Married-Couple Families in Anthem
The poverty statistics for married-couple families in Anthem show that 1.6% or 85 of the total 5,438 families live below the poverty line. Families with no children have the highest poverty rate of 2.2%, comprising of 73 families. On the other hand, families with 3 or 4 children have the lowest poverty rate of 0.0%, which includes 0 families.
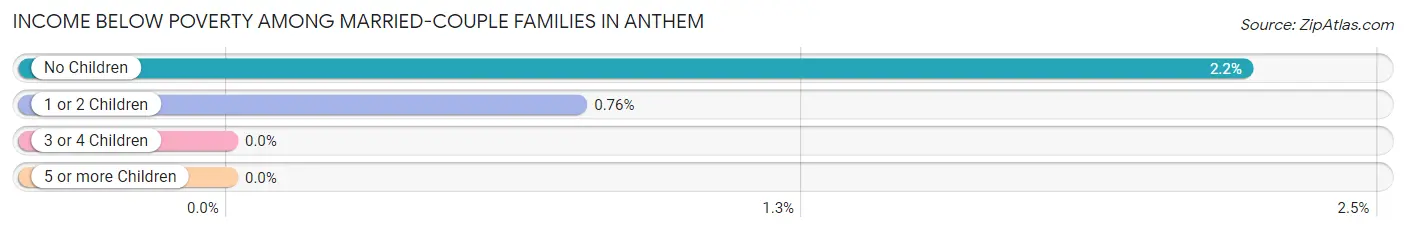
| Children | Above Poverty | Below Poverty |
| No Children | 3,237 (97.8%) | 73 (2.2%) |
| 1 or 2 Children | 1,564 (99.2%) | 12 (0.8%) |
| 3 or 4 Children | 552 (100.0%) | 0 (0.0%) |
| 5 or more Children | 0 (0.0%) | 0 (0.0%) |
| Total | 5,353 (98.4%) | 85 (1.6%) |
Income Below Poverty Among Single-Parent Households in Anthem
According to the poverty data in Anthem, 11.7% or 36 single-father households and 2.2% or 20 single-mother households are living below the poverty line. Among single-father households, those with 1 or 2 children have the highest poverty rate, with 36 households (19.7%) experiencing poverty. Likewise, among single-mother households, those with no children have the highest poverty rate, with 11 households (4.5%) falling below the poverty line.
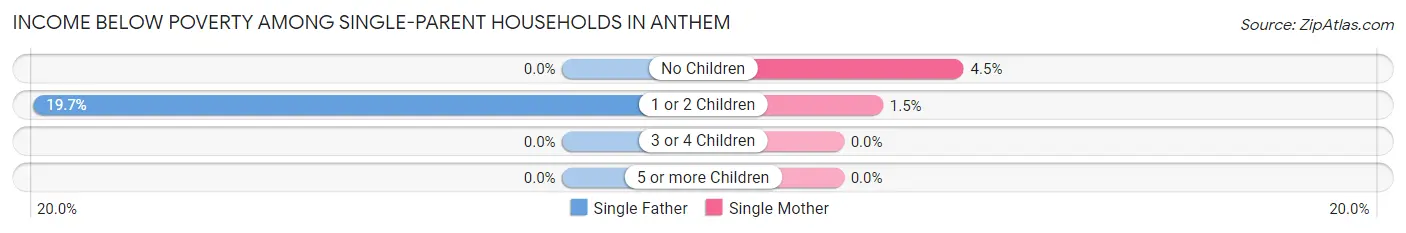
| Children | Single Father | Single Mother |
| No Children | 0 (0.0%) | 11 (4.5%) |
| 1 or 2 Children | 36 (19.7%) | 9 (1.5%) |
| 3 or 4 Children | 0 (0.0%) | 0 (0.0%) |
| 5 or more Children | 0 (0.0%) | 0 (0.0%) |
| Total | 36 (11.7%) | 20 (2.2%) |
Income Below Poverty Among Married-Couple vs Single-Parent Households in Anthem
The poverty data for Anthem shows that 85 of the married-couple family households (1.6%) and 56 of the single-parent households (4.7%) are living below the poverty level. Within the married-couple family households, those with no children have the highest poverty rate, with 73 households (2.2%) falling below the poverty line. Among the single-parent households, those with 1 or 2 children have the highest poverty rate, with 45 household (5.6%) living below poverty.
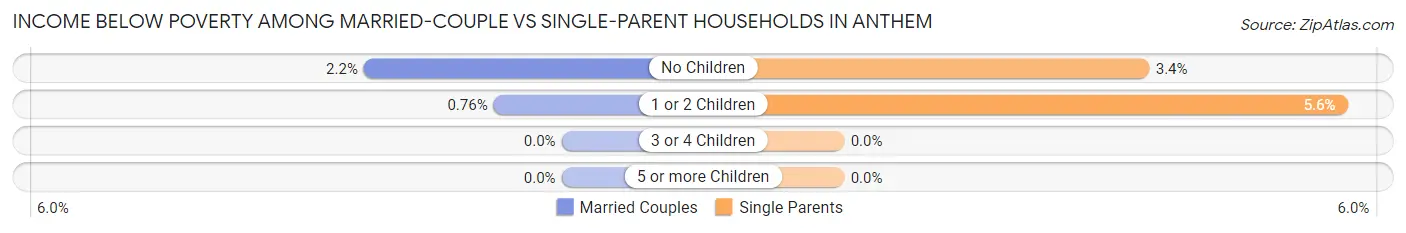
| Children | Married-Couple Families | Single-Parent Households |
| No Children | 73 (2.2%) | 11 (3.4%) |
| 1 or 2 Children | 12 (0.8%) | 45 (5.6%) |
| 3 or 4 Children | 0 (0.0%) | 0 (0.0%) |
| 5 or more Children | 0 (0.0%) | 0 (0.0%) |
| Total | 85 (1.6%) | 56 (4.7%) |
Race in Anthem
The most populous races in Anthem are White / Caucasian (20,137 | 88.7%), Hispanic or Latino (2,253 | 9.9%), and Two or more Races (1,210 | 5.3%).
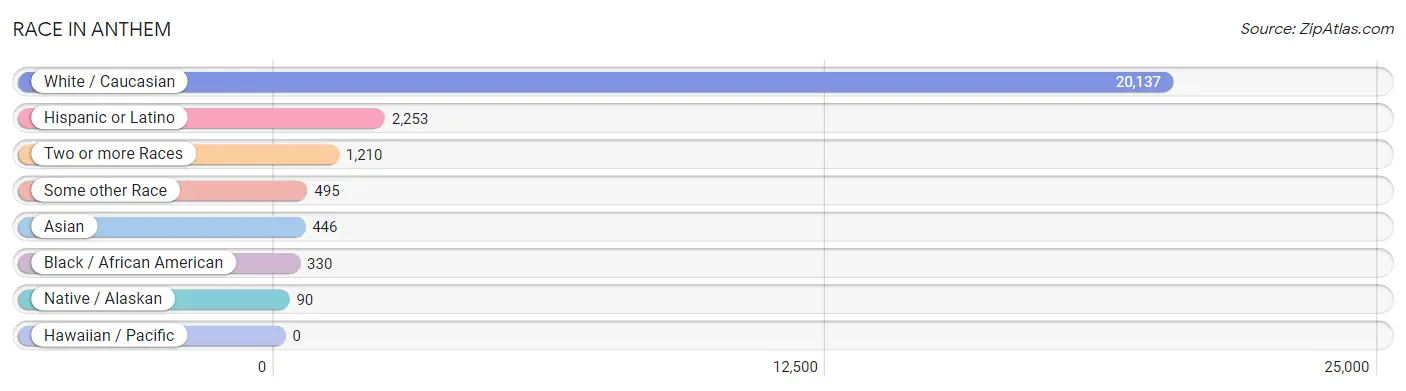
| Race | # Population | % Population |
| Asian | 446 | 2.0% |
| Black / African American | 330 | 1.5% |
| Hawaiian / Pacific | 0 | 0.0% |
| Hispanic or Latino | 2,253 | 9.9% |
| Native / Alaskan | 90 | 0.4% |
| White / Caucasian | 20,137 | 88.7% |
| Two or more Races | 1,210 | 5.3% |
| Some other Race | 495 | 2.2% |
| Total | 22,708 | 100.0% |
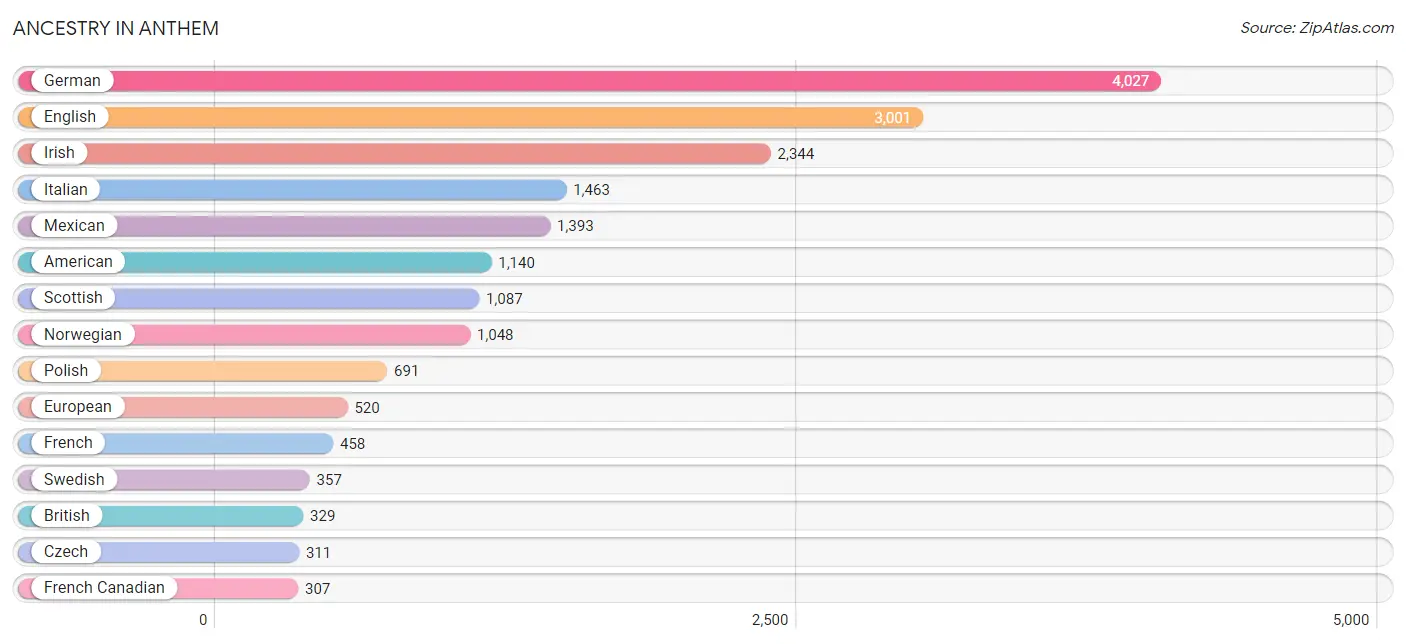
Ancestry in Anthem
The most populous ancestries reported in Anthem are German (4,027 | 17.7%), English (3,001 | 13.2%), Irish (2,344 | 10.3%), Italian (1,463 | 6.4%), and Mexican (1,393 | 6.1%), together accounting for 53.8% of all Anthem residents.
| Ancestry | # Population | % Population |
| African | 33 | 0.2% |
| American | 1,140 | 5.0% |
| Arab | 35 | 0.2% |
| Armenian | 13 | 0.1% |
| Assyrian / Chaldean / Syriac | 19 | 0.1% |
| Australian | 10 | 0.0% |
| Austrian | 13 | 0.1% |
| Barbadian | 17 | 0.1% |
| Belgian | 117 | 0.5% |
| Bhutanese | 233 | 1.0% |
| Blackfeet | 25 | 0.1% |
| Brazilian | 10 | 0.0% |
| British | 329 | 1.5% |
| Burmese | 47 | 0.2% |
| Canadian | 136 | 0.6% |
| Central American | 156 | 0.7% |
| Cherokee | 41 | 0.2% |
| Colombian | 8 | 0.0% |
| Colville | 45 | 0.2% |
| Costa Rican | 18 | 0.1% |
| Cuban | 31 | 0.1% |
| Czech | 311 | 1.4% |
| Czechoslovakian | 72 | 0.3% |
| Danish | 193 | 0.9% |
| Dutch | 270 | 1.2% |
| Eastern European | 124 | 0.5% |
| English | 3,001 | 13.2% |
| European | 520 | 2.3% |
| Finnish | 49 | 0.2% |
| French | 458 | 2.0% |
| French Canadian | 307 | 1.3% |
| German | 4,027 | 17.7% |
| Greek | 185 | 0.8% |
| Guatemalan | 19 | 0.1% |
| Haitian | 108 | 0.5% |
| Hungarian | 54 | 0.2% |
| Indian (Asian) | 144 | 0.6% |
| Irish | 2,344 | 10.3% |
| Italian | 1,463 | 6.4% |
| Korean | 34 | 0.2% |
| Latvian | 8 | 0.0% |
| Lithuanian | 182 | 0.8% |
| Macedonian | 143 | 0.6% |
| Malaysian | 36 | 0.2% |
| Maltese | 19 | 0.1% |
| Mexican | 1,393 | 6.1% |
| Moroccan | 24 | 0.1% |
| Native Hawaiian | 9 | 0.0% |
| Norwegian | 1,048 | 4.6% |
| Panamanian | 17 | 0.1% |
| Peruvian | 41 | 0.2% |
| Pima | 11 | 0.1% |
| Polish | 691 | 3.0% |
| Portuguese | 127 | 0.6% |
| Puerto Rican | 38 | 0.2% |
| Romanian | 18 | 0.1% |
| Russian | 187 | 0.8% |
| Salvadoran | 102 | 0.4% |
| Scandinavian | 52 | 0.2% |
| Scotch-Irish | 263 | 1.2% |
| Scottish | 1,087 | 4.8% |
| Sioux | 88 | 0.4% |
| Slavic | 120 | 0.5% |
| Slovak | 71 | 0.3% |
| South American | 49 | 0.2% |
| Spaniard | 39 | 0.2% |
| Spanish | 288 | 1.3% |
| Subsaharan African | 33 | 0.2% |
| Swedish | 357 | 1.6% |
| Swiss | 130 | 0.6% |
| Syrian | 11 | 0.1% |
| Thai | 73 | 0.3% |
| Turkish | 9 | 0.0% |
| Ukrainian | 56 | 0.3% |
| Welsh | 51 | 0.2% |
| Yugoslavian | 128 | 0.6% | View All 76 Rows |
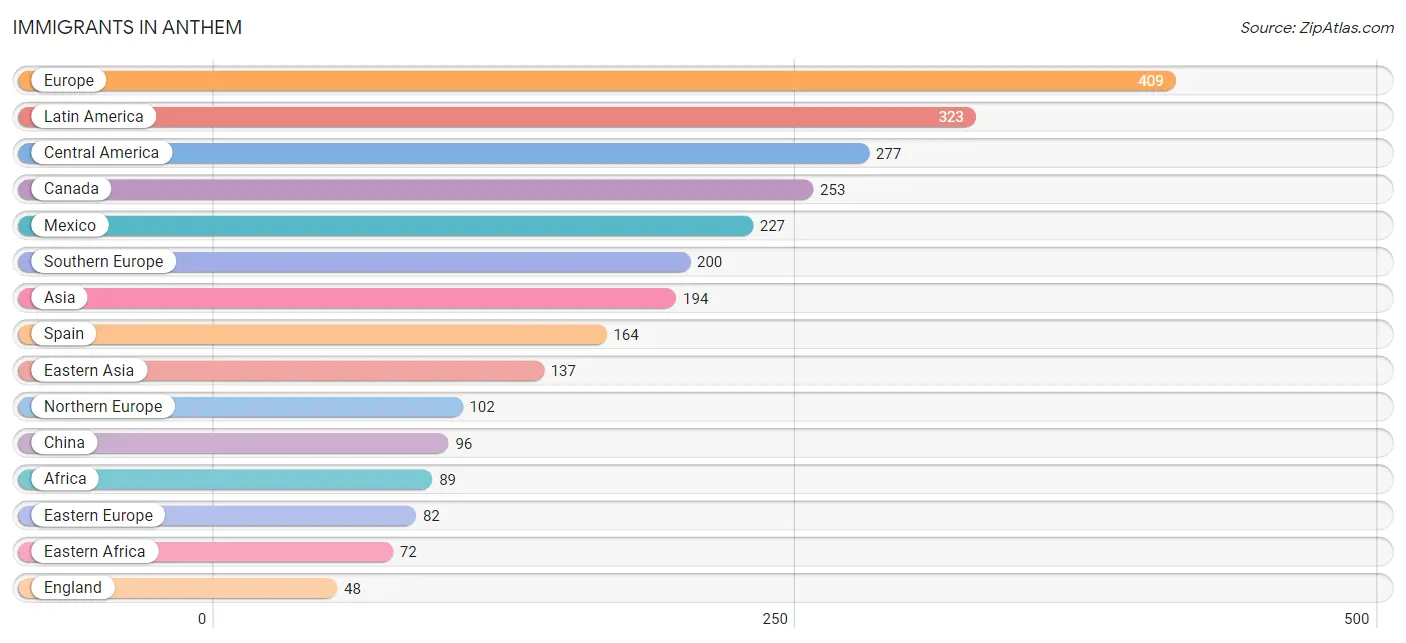
Immigrants in Anthem
The most numerous immigrant groups reported in Anthem came from Europe (409 | 1.8%), Latin America (323 | 1.4%), Central America (277 | 1.2%), Canada (253 | 1.1%), and Mexico (227 | 1.0%), together accounting for 6.6% of all Anthem residents.
| Immigration Origin | # Population | % Population |
| Africa | 89 | 0.4% |
| Asia | 194 | 0.9% |
| Australia | 10 | 0.0% |
| Bosnia and Herzegovina | 27 | 0.1% |
| Canada | 253 | 1.1% |
| Caribbean | 31 | 0.1% |
| Central America | 277 | 1.2% |
| China | 96 | 0.4% |
| Costa Rica | 18 | 0.1% |
| Cuba | 31 | 0.1% |
| Czechoslovakia | 19 | 0.1% |
| Eastern Africa | 72 | 0.3% |
| Eastern Asia | 137 | 0.6% |
| Eastern Europe | 82 | 0.4% |
| England | 48 | 0.2% |
| Ethiopia | 28 | 0.1% |
| Europe | 409 | 1.8% |
| Germany | 25 | 0.1% |
| Guatemala | 32 | 0.1% |
| India | 26 | 0.1% |
| Italy | 36 | 0.2% |
| Japan | 11 | 0.1% |
| Korea | 30 | 0.1% |
| Laos | 15 | 0.1% |
| Latin America | 323 | 1.4% |
| Mexico | 227 | 1.0% |
| Northern Europe | 102 | 0.4% |
| Oceania | 10 | 0.0% |
| Peru | 15 | 0.1% |
| Philippines | 16 | 0.1% |
| Romania | 18 | 0.1% |
| Russia | 18 | 0.1% |
| South Africa | 17 | 0.1% |
| South America | 15 | 0.1% |
| South Central Asia | 26 | 0.1% |
| South Eastern Asia | 31 | 0.1% |
| Southern Europe | 200 | 0.9% |
| Spain | 164 | 0.7% |
| Taiwan | 20 | 0.1% |
| Western Europe | 25 | 0.1% |
| Zimbabwe | 44 | 0.2% | View All 41 Rows |
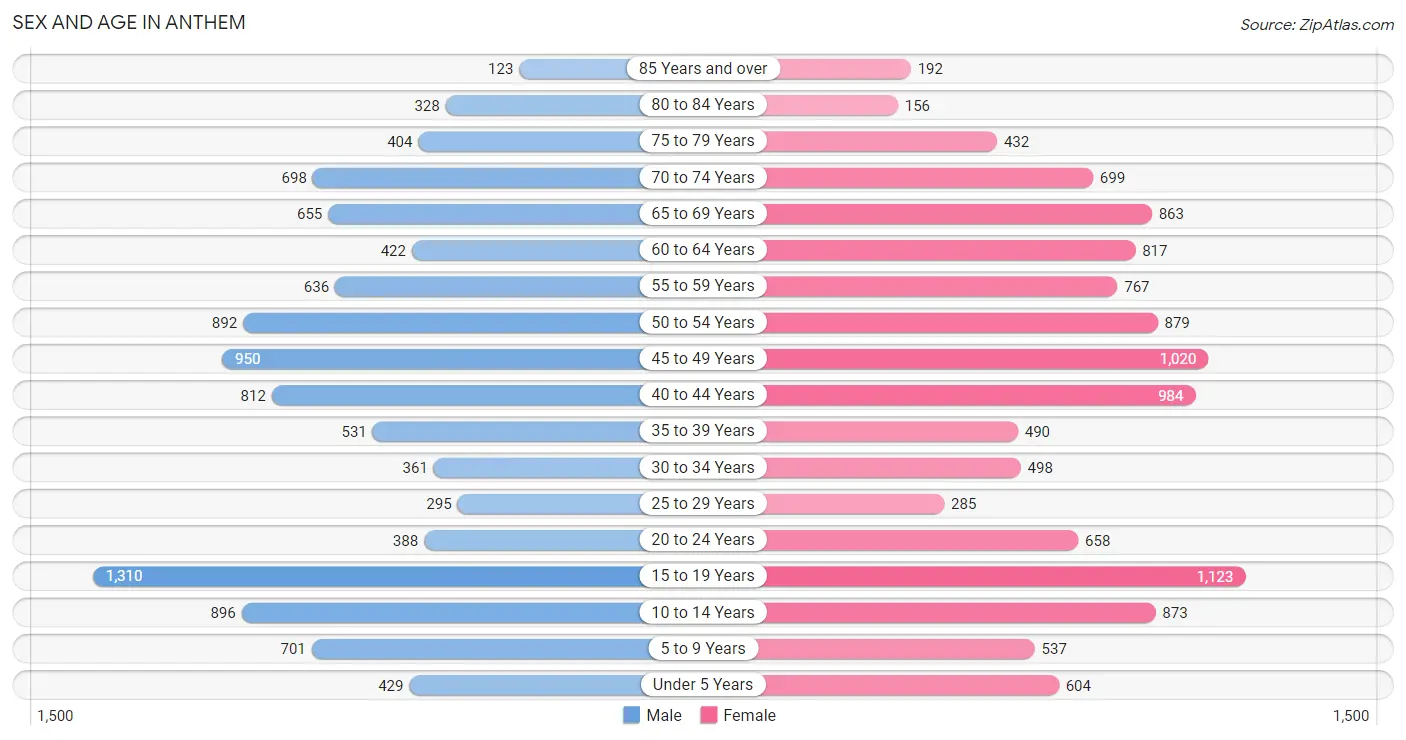
Sex and Age in Anthem
Sex and Age in Anthem
The most populous age groups in Anthem are 15 to 19 Years (1,310 | 12.1%) for men and 15 to 19 Years (1,123 | 9.5%) for women.
| Age Bracket | Male | Female |
| Under 5 Years | 429 (4.0%) | 604 (5.1%) |
| 5 to 9 Years | 701 (6.5%) | 537 (4.5%) |
| 10 to 14 Years | 896 (8.3%) | 873 (7.3%) |
| 15 to 19 Years | 1,310 (12.1%) | 1,123 (9.5%) |
| 20 to 24 Years | 388 (3.6%) | 658 (5.5%) |
| 25 to 29 Years | 295 (2.7%) | 285 (2.4%) |
| 30 to 34 Years | 361 (3.3%) | 498 (4.2%) |
| 35 to 39 Years | 531 (4.9%) | 490 (4.1%) |
| 40 to 44 Years | 812 (7.5%) | 984 (8.3%) |
| 45 to 49 Years | 950 (8.8%) | 1,020 (8.6%) |
| 50 to 54 Years | 892 (8.2%) | 879 (7.4%) |
| 55 to 59 Years | 636 (5.9%) | 767 (6.5%) |
| 60 to 64 Years | 422 (3.9%) | 817 (6.9%) |
| 65 to 69 Years | 655 (6.0%) | 863 (7.3%) |
| 70 to 74 Years | 698 (6.4%) | 699 (5.9%) |
| 75 to 79 Years | 404 (3.7%) | 432 (3.6%) |
| 80 to 84 Years | 328 (3.0%) | 156 (1.3%) |
| 85 Years and over | 123 (1.1%) | 192 (1.6%) |
| Total | 10,831 (100.0%) | 11,877 (100.0%) |
Families and Households in Anthem
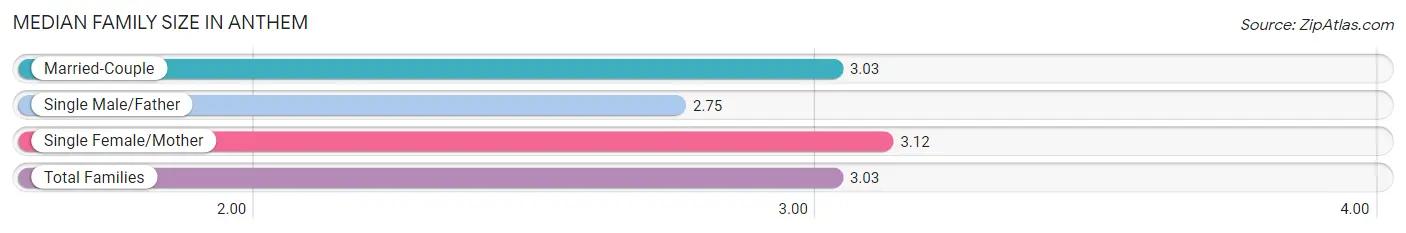
Median Family Size in Anthem
The median family size in Anthem is 3.03 persons per family, with single female/mother families (893 | 13.5%) accounting for the largest median family size of 3.12 persons per family. On the other hand, single male/father families (308 | 4.6%) represent the smallest median family size with 2.75 persons per family.
| Family Type | # Families | Family Size |
| Married-Couple | 5,438 (81.9%) | 3.03 |
| Single Male/Father | 308 (4.6%) | 2.75 |
| Single Female/Mother | 893 (13.5%) | 3.12 |
| Total Families | 6,639 (100.0%) | 3.03 |
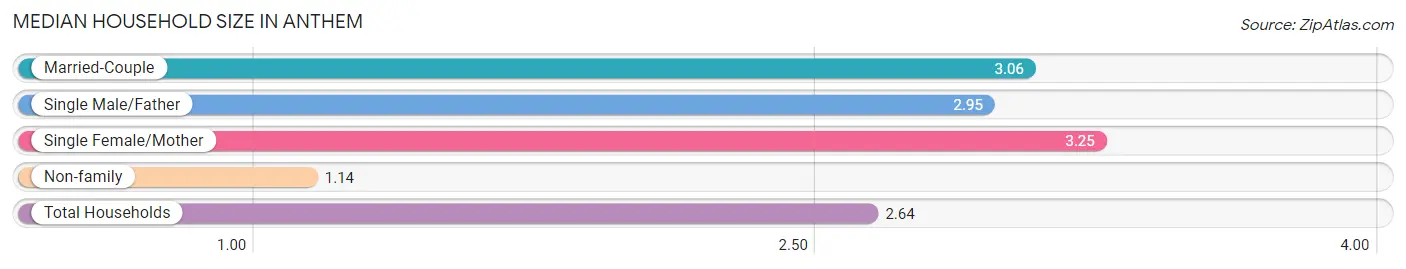
Median Household Size in Anthem
The median household size in Anthem is 2.64 persons per household, with single female/mother households (893 | 10.4%) accounting for the largest median household size of 3.25 persons per household. non-family households (1,939 | 22.6%) represent the smallest median household size with 1.14 persons per household.
| Household Type | # Households | Household Size |
| Married-Couple | 5,438 (63.4%) | 3.06 |
| Single Male/Father | 308 (3.6%) | 2.95 |
| Single Female/Mother | 893 (10.4%) | 3.25 |
| Non-family | 1,939 (22.6%) | 1.14 |
| Total Households | 8,578 (100.0%) | 2.64 |
Household Size by Marriage Status in Anthem
Out of a total of 8,578 households in Anthem, 6,639 (77.4%) are family households, while 1,939 (22.6%) are nonfamily households. The most numerous type of family households are 2-person households, comprising 3,263, and the most common type of nonfamily households are 1-person households, comprising 1,720.
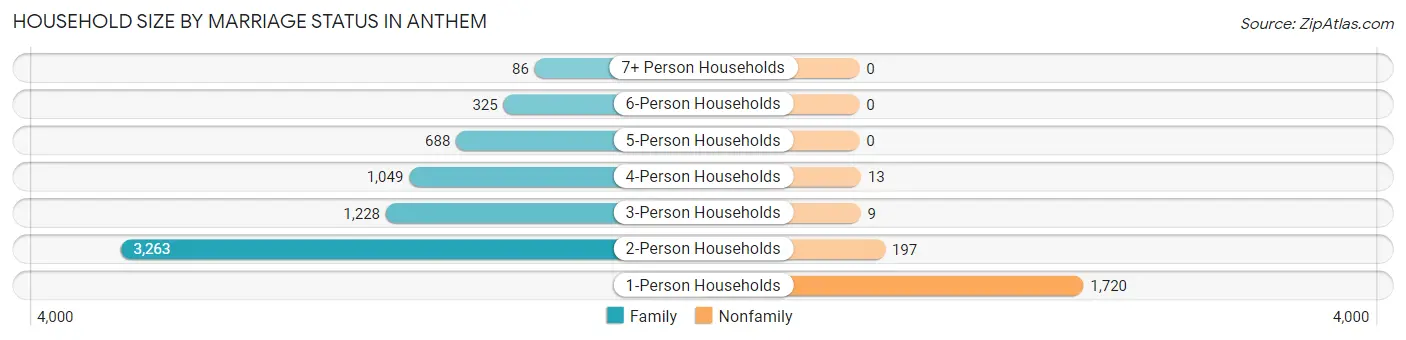
| Household Size | Family Households | Nonfamily Households |
| 1-Person Households | - | 1,720 (20.1%) |
| 2-Person Households | 3,263 (38.0%) | 197 (2.3%) |
| 3-Person Households | 1,228 (14.3%) | 9 (0.1%) |
| 4-Person Households | 1,049 (12.2%) | 13 (0.2%) |
| 5-Person Households | 688 (8.0%) | 0 (0.0%) |
| 6-Person Households | 325 (3.8%) | 0 (0.0%) |
| 7+ Person Households | 86 (1.0%) | 0 (0.0%) |
| Total | 6,639 (77.4%) | 1,939 (22.6%) |
Female Fertility in Anthem
Fertility by Age in Anthem
Average fertility rate in Anthem is 59.0 births per 1,000 women. Women in the age bracket of 15 to 19 years have the highest fertility rate with 151.0 births per 1,000 women. Women in the age bracket of 15 to 19 years acount for 54.7% of all women with births.
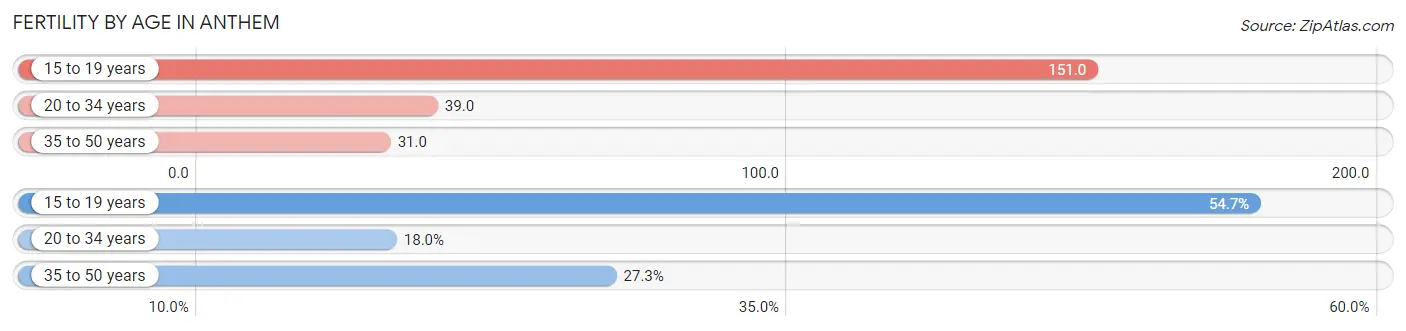
| Age Bracket | Women with Births | Births / 1,000 Women |
| 15 to 19 years | 170 (54.7%) | 151.0 |
| 20 to 34 years | 56 (18.0%) | 39.0 |
| 35 to 50 years | 85 (27.3%) | 31.0 |
| Total | 311 (100.0%) | 59.0 |
Fertility by Age by Marriage Status in Anthem
34.4% of women with births (311) in Anthem are married. The highest percentage of unmarried women with births falls into 15 to 19 years age bracket with 100.0% of them unmarried at the time of birth, while the lowest percentage of unmarried women with births belong to 20 to 34 years age bracket with 0.0% of them unmarried.
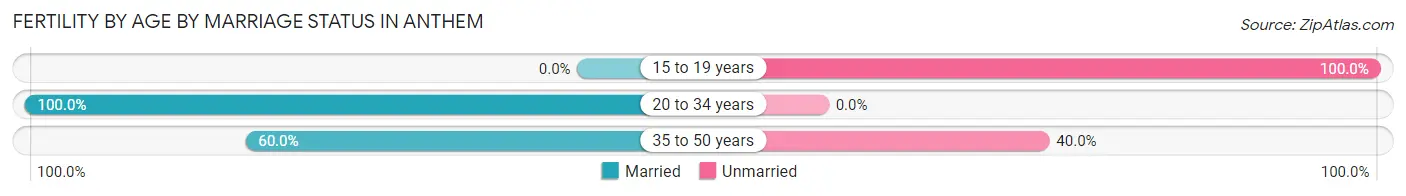
| Age Bracket | Married | Unmarried |
| 15 to 19 years | 0 (0.0%) | 170 (100.0%) |
| 20 to 34 years | 56 (100.0%) | 0 (0.0%) |
| 35 to 50 years | 51 (60.0%) | 34 (40.0%) |
| Total | 107 (34.4%) | 204 (65.6%) |
Fertility by Education in Anthem
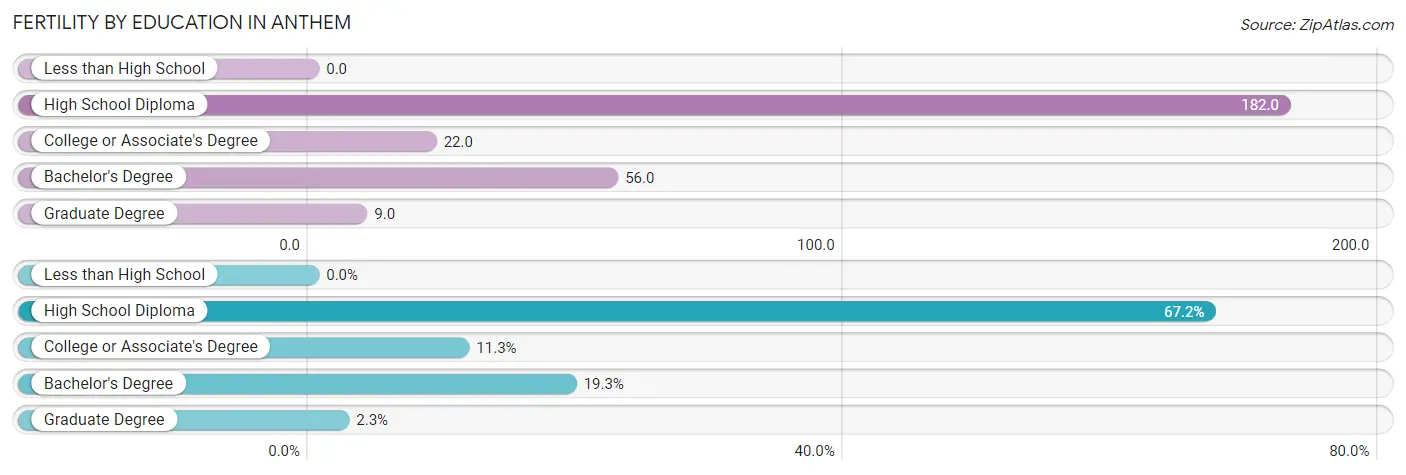
| Educational Attainment | Women with Births | Births / 1,000 Women |
| Less than High School | 0 (0.0%) | 0.0 |
| High School Diploma | 209 (67.2%) | 182.0 |
| College or Associate's Degree | 35 (11.3%) | 22.0 |
| Bachelor's Degree | 60 (19.3%) | 56.0 |
| Graduate Degree | 7 (2.2%) | 9.0 |
| Total | 311 (100.0%) | 59.0 |
Fertility by Education by Marriage Status in Anthem
65.6% of women with births in Anthem are unmarried. Women with the educational attainment of college or associate's degree are most likely to be married with 100.0% of them married at childbirth, while women with the educational attainment of high school diploma are least likely to be married with 81.3% of them unmarried at childbirth.
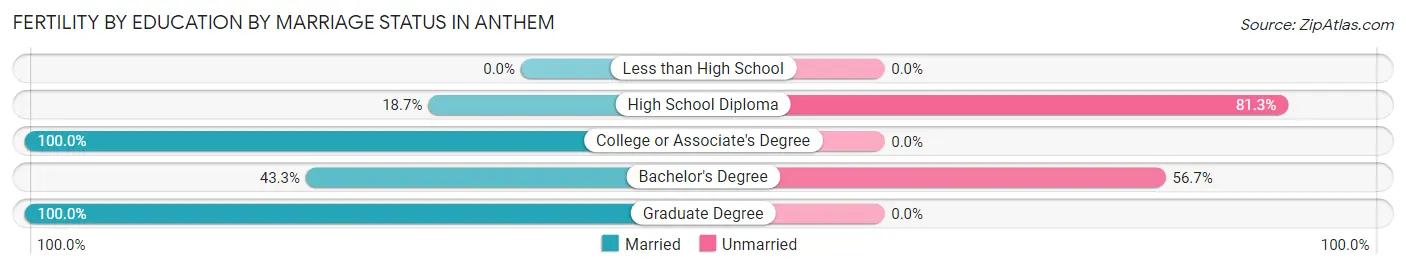
| Educational Attainment | Married | Unmarried |
| Less than High School | 0 (0.0%) | 0 (0.0%) |
| High School Diploma | 39 (18.7%) | 170 (81.3%) |
| College or Associate's Degree | 35 (100.0%) | 0 (0.0%) |
| Bachelor's Degree | 26 (43.3%) | 34 (56.7%) |
| Graduate Degree | 7 (100.0%) | 0 (0.0%) |
| Total | 107 (34.4%) | 204 (65.6%) |
Employment Characteristics in Anthem
Employment by Class of Employer in Anthem
Among the 10,730 employed individuals in Anthem, private company employees (7,469 | 69.6%), not-for-profit organizations (1,035 | 9.7%), and local government employees (664 | 6.2%) make up the most common classes of employment.
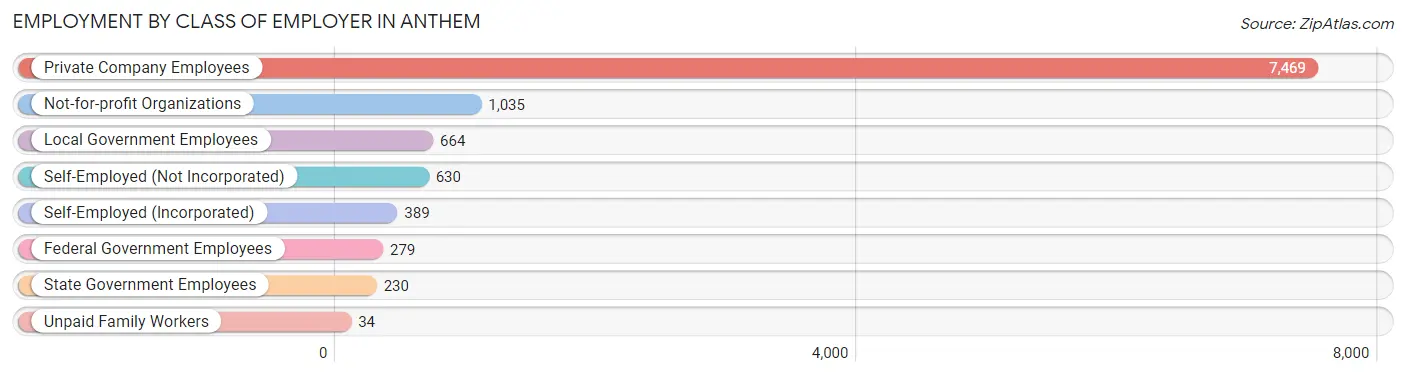
| Employer Class | # Employees | % Employees |
| Private Company Employees | 7,469 | 69.6% |
| Self-Employed (Incorporated) | 389 | 3.6% |
| Self-Employed (Not Incorporated) | 630 | 5.9% |
| Not-for-profit Organizations | 1,035 | 9.7% |
| Local Government Employees | 664 | 6.2% |
| State Government Employees | 230 | 2.1% |
| Federal Government Employees | 279 | 2.6% |
| Unpaid Family Workers | 34 | 0.3% |
| Total | 10,730 | 100.0% |
Employment Status by Age in Anthem
According to the labor force statistics for Anthem, out of the total population over 16 years of age (18,265), 62.3% or 11,379 individuals are in the labor force, with 3.8% or 432 of them unemployed. The age group with the highest labor force participation rate is 25 to 29 years, with 100.0% or 580 individuals in the labor force. Within the labor force, the 65 to 74 years age range has the highest percentage of unemployed individuals, with 15.9% or 120 of them being unemployed.
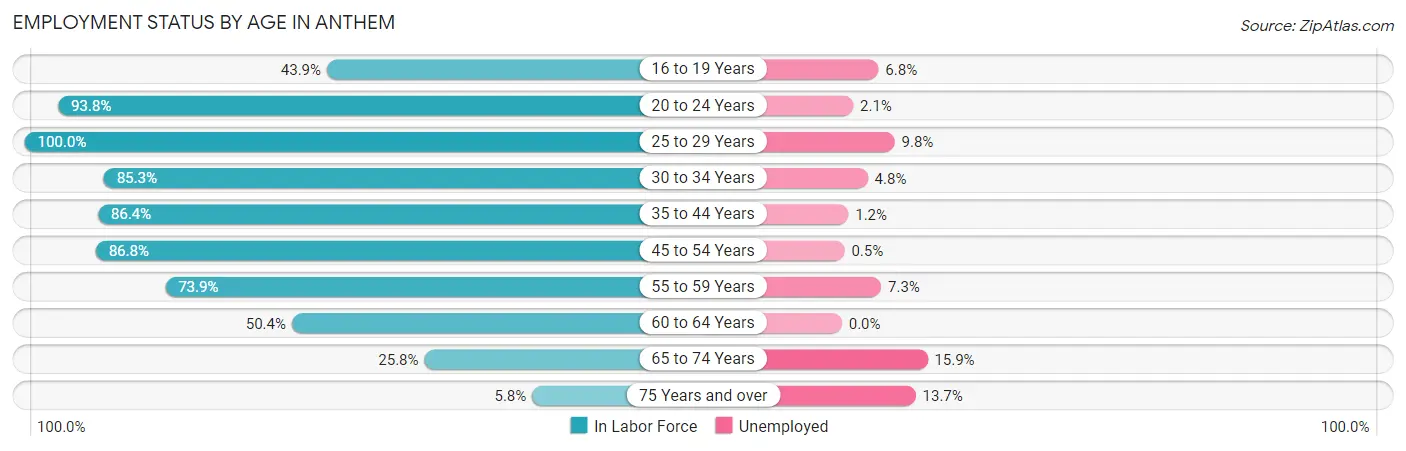
| Age Bracket | In Labor Force | Unemployed |
| 16 to 19 Years | 891 (43.9%) | 61 (6.8%) |
| 20 to 24 Years | 981 (93.8%) | 21 (2.1%) |
| 25 to 29 Years | 580 (100.0%) | 57 (9.8%) |
| 30 to 34 Years | 733 (85.3%) | 35 (4.8%) |
| 35 to 44 Years | 2,434 (86.4%) | 29 (1.2%) |
| 45 to 54 Years | 3,247 (86.8%) | 16 (0.5%) |
| 55 to 59 Years | 1,037 (73.9%) | 76 (7.3%) |
| 60 to 64 Years | 624 (50.4%) | 0 (0.0%) |
| 65 to 74 Years | 752 (25.8%) | 120 (15.9%) |
| 75 Years and over | 95 (5.8%) | 13 (13.7%) |
| Total | 11,379 (62.3%) | 432 (3.8%) |
Employment Status by Educational Attainment in Anthem
According to labor force statistics for Anthem, 81.3% of individuals (8,650) out of the total population between 25 and 64 years of age (10,639) are in the labor force, with 2.5% or 216 of them being unemployed. The group with the highest labor force participation rate are those with the educational attainment of college / associate degree, with 84.4% or 3,289 individuals in the labor force. Within the labor force, individuals with college / associate degree education have the highest percentage of unemployment, with 4.4% or 145 of them being unemployed.
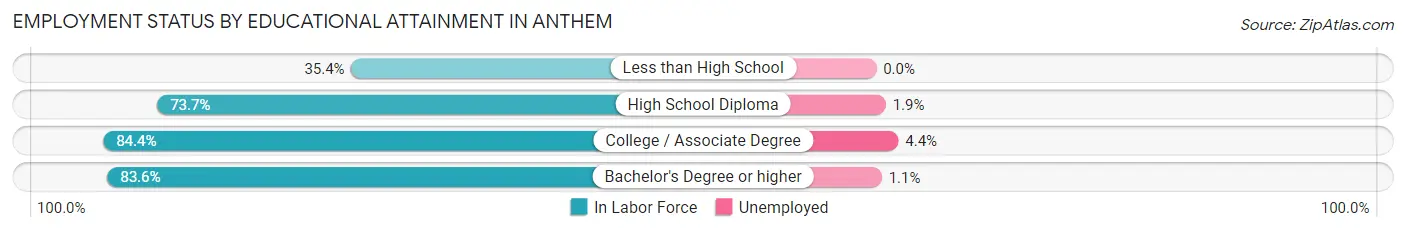
| Educational Attainment | In Labor Force | Unemployed |
| Less than High School | 86 (35.4%) | 0 (0.0%) |
| High School Diploma | 1,141 (73.7%) | 29 (1.9%) |
| College / Associate Degree | 3,289 (84.4%) | 171 (4.4%) |
| Bachelor's Degree or higher | 4,139 (83.6%) | 54 (1.1%) |
| Total | 8,650 (81.3%) | 266 (2.5%) |
Employment Occupations by Sex in Anthem
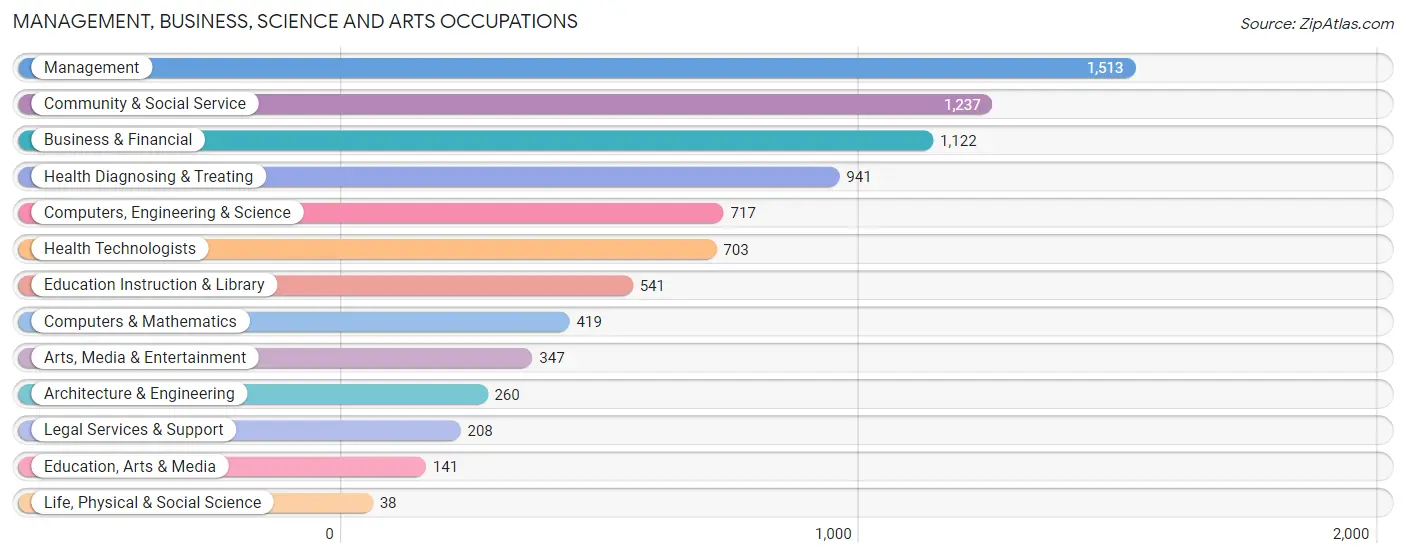
Management, Business, Science and Arts Occupations
The most common Management, Business, Science and Arts occupations in Anthem are Management (1,513 | 13.8%), Community & Social Service (1,237 | 11.3%), Business & Financial (1,122 | 10.3%), Health Diagnosing & Treating (941 | 8.6%), and Computers, Engineering & Science (717 | 6.6%).
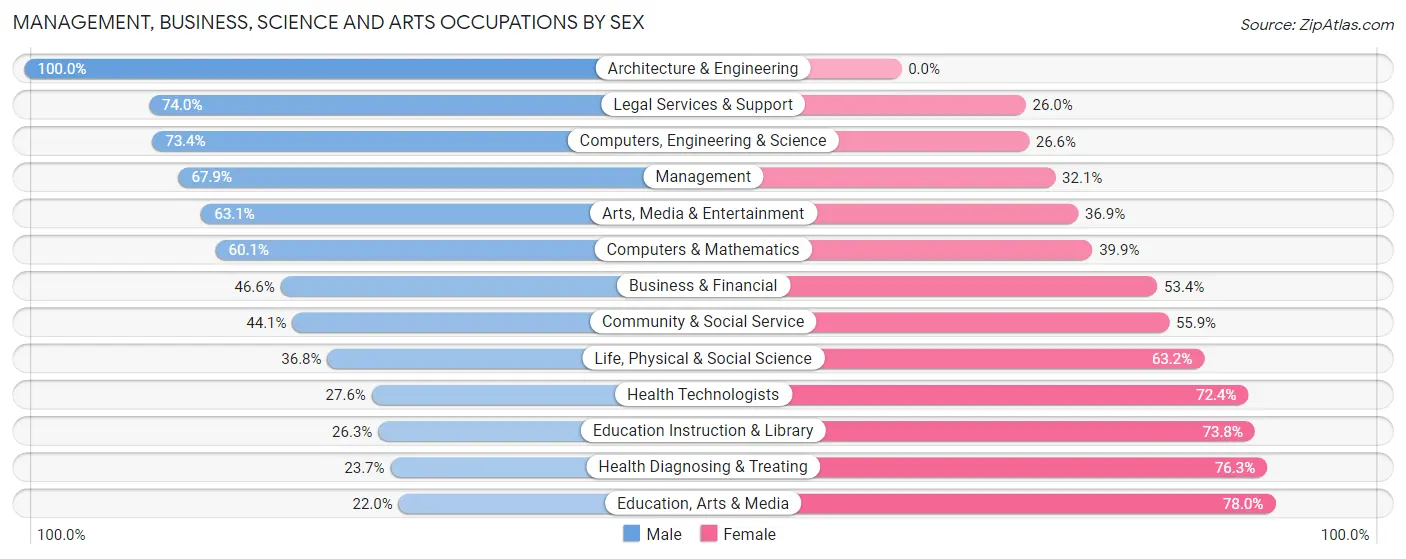
Management, Business, Science and Arts Occupations by Sex
Within the Management, Business, Science and Arts occupations in Anthem, the most male-oriented occupations are Architecture & Engineering (100.0%), Legal Services & Support (74.0%), and Computers, Engineering & Science (73.4%), while the most female-oriented occupations are Education, Arts & Media (78.0%), Health Diagnosing & Treating (76.3%), and Education Instruction & Library (73.8%).
| Occupation | Male | Female |
| Management | 1,027 (67.9%) | 486 (32.1%) |
| Business & Financial | 523 (46.6%) | 599 (53.4%) |
| Computers, Engineering & Science | 526 (73.4%) | 191 (26.6%) |
| Computers & Mathematics | 252 (60.1%) | 167 (39.9%) |
| Architecture & Engineering | 260 (100.0%) | 0 (0.0%) |
| Life, Physical & Social Science | 14 (36.8%) | 24 (63.2%) |
| Community & Social Service | 546 (44.1%) | 691 (55.9%) |
| Education, Arts & Media | 31 (22.0%) | 110 (78.0%) |
| Legal Services & Support | 154 (74.0%) | 54 (26.0%) |
| Education Instruction & Library | 142 (26.3%) | 399 (73.8%) |
| Arts, Media & Entertainment | 219 (63.1%) | 128 (36.9%) |
| Health Diagnosing & Treating | 223 (23.7%) | 718 (76.3%) |
| Health Technologists | 194 (27.6%) | 509 (72.4%) |
| Total (Category) | 2,845 (51.4%) | 2,685 (48.5%) |
| Total (Overall) | 5,540 (50.7%) | 5,396 (49.3%) |
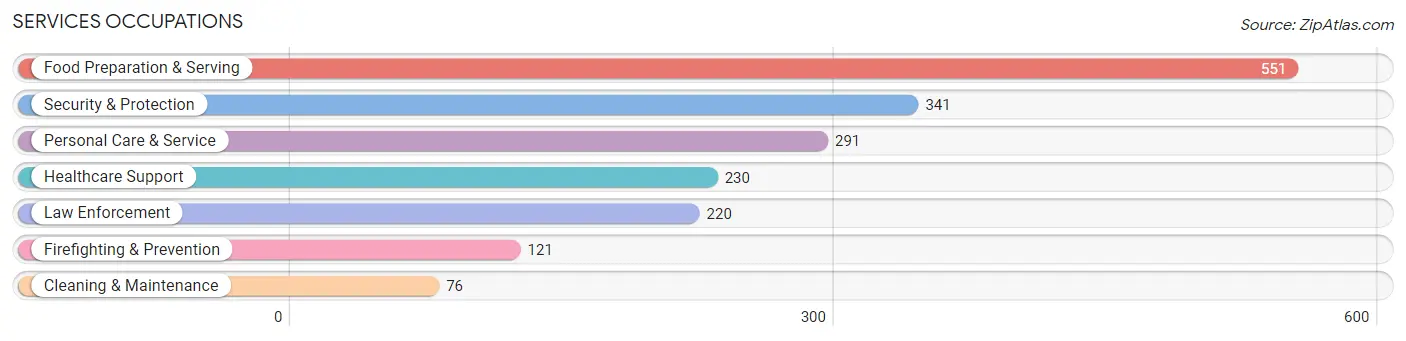
Services Occupations
The most common Services occupations in Anthem are Food Preparation & Serving (551 | 5.0%), Security & Protection (341 | 3.1%), Personal Care & Service (291 | 2.7%), Healthcare Support (230 | 2.1%), and Law Enforcement (220 | 2.0%).
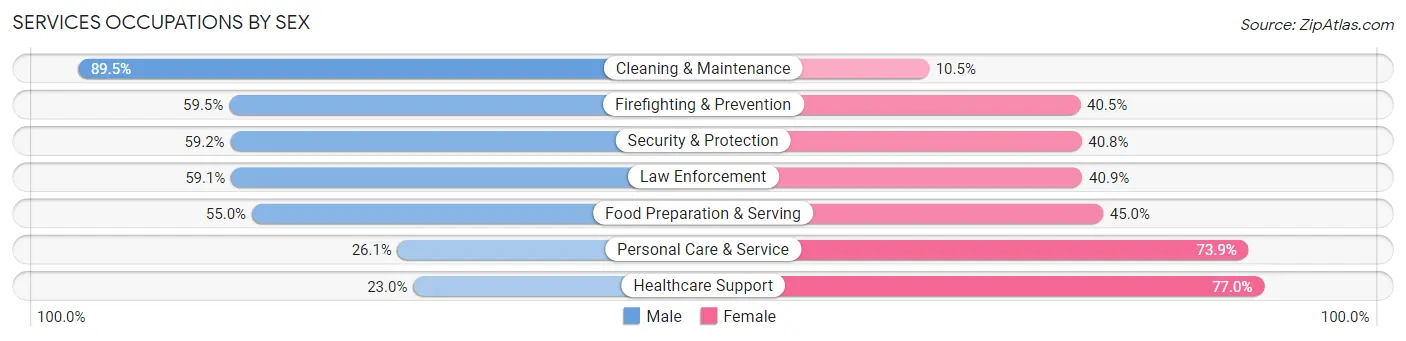
Services Occupations by Sex
Within the Services occupations in Anthem, the most male-oriented occupations are Cleaning & Maintenance (89.5%), Firefighting & Prevention (59.5%), and Security & Protection (59.2%), while the most female-oriented occupations are Healthcare Support (77.0%), Personal Care & Service (73.9%), and Food Preparation & Serving (45.0%).
| Occupation | Male | Female |
| Healthcare Support | 53 (23.0%) | 177 (77.0%) |
| Security & Protection | 202 (59.2%) | 139 (40.8%) |
| Firefighting & Prevention | 72 (59.5%) | 49 (40.5%) |
| Law Enforcement | 130 (59.1%) | 90 (40.9%) |
| Food Preparation & Serving | 303 (55.0%) | 248 (45.0%) |
| Cleaning & Maintenance | 68 (89.5%) | 8 (10.5%) |
| Personal Care & Service | 76 (26.1%) | 215 (73.9%) |
| Total (Category) | 702 (47.1%) | 787 (52.8%) |
| Total (Overall) | 5,540 (50.7%) | 5,396 (49.3%) |
Sales and Office Occupations
The most common Sales and Office occupations in Anthem are Office & Administration (1,499 | 13.7%), and Sales & Related (1,320 | 12.1%).
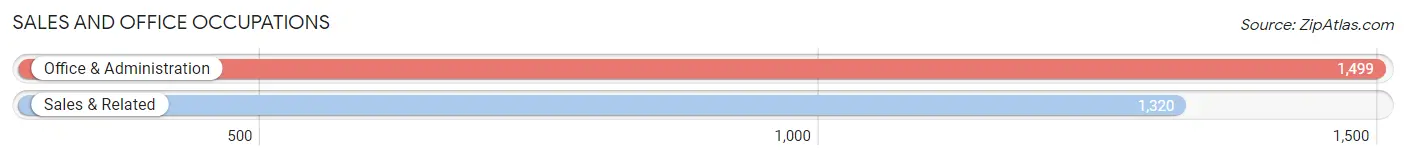
Sales and Office Occupations by Sex
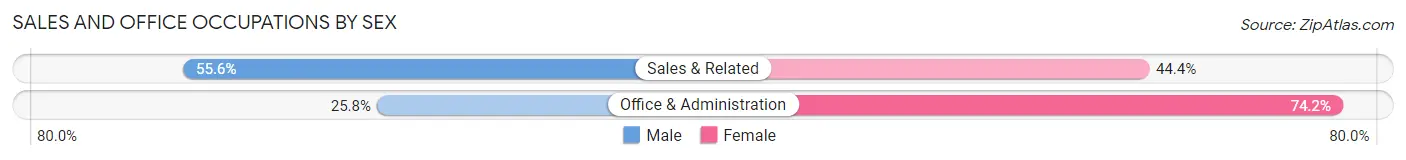
| Occupation | Male | Female |
| Sales & Related | 734 (55.6%) | 586 (44.4%) |
| Office & Administration | 387 (25.8%) | 1,112 (74.2%) |
| Total (Category) | 1,121 (39.8%) | 1,698 (60.2%) |
| Total (Overall) | 5,540 (50.7%) | 5,396 (49.3%) |
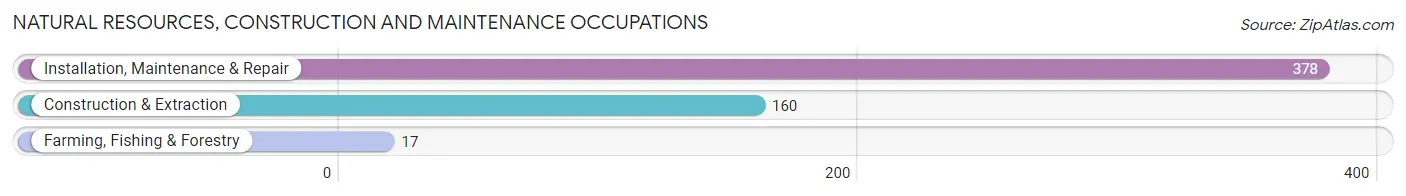
Natural Resources, Construction and Maintenance Occupations
The most common Natural Resources, Construction and Maintenance occupations in Anthem are Installation, Maintenance & Repair (378 | 3.5%), Construction & Extraction (160 | 1.5%), and Farming, Fishing & Forestry (17 | 0.2%).
Natural Resources, Construction and Maintenance Occupations by Sex
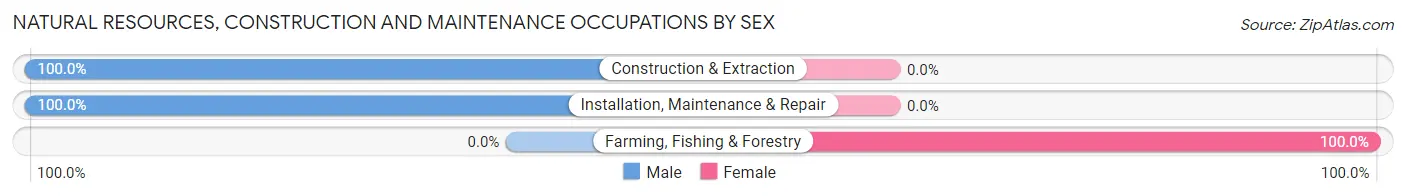
| Occupation | Male | Female |
| Farming, Fishing & Forestry | 0 (0.0%) | 17 (100.0%) |
| Construction & Extraction | 160 (100.0%) | 0 (0.0%) |
| Installation, Maintenance & Repair | 378 (100.0%) | 0 (0.0%) |
| Total (Category) | 538 (96.9%) | 17 (3.1%) |
| Total (Overall) | 5,540 (50.7%) | 5,396 (49.3%) |
Production, Transportation and Moving Occupations
The most common Production, Transportation and Moving occupations in Anthem are Production (197 | 1.8%), Transportation (180 | 1.7%), and Material Moving (166 | 1.5%).

Production, Transportation and Moving Occupations by Sex
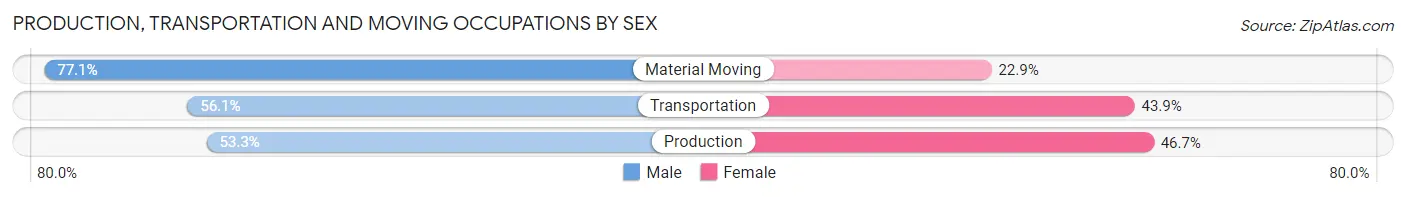
| Occupation | Male | Female |
| Production | 105 (53.3%) | 92 (46.7%) |
| Transportation | 101 (56.1%) | 79 (43.9%) |
| Material Moving | 128 (77.1%) | 38 (22.9%) |
| Total (Category) | 334 (61.5%) | 209 (38.5%) |
| Total (Overall) | 5,540 (50.7%) | 5,396 (49.3%) |
Employment Industries by Sex in Anthem
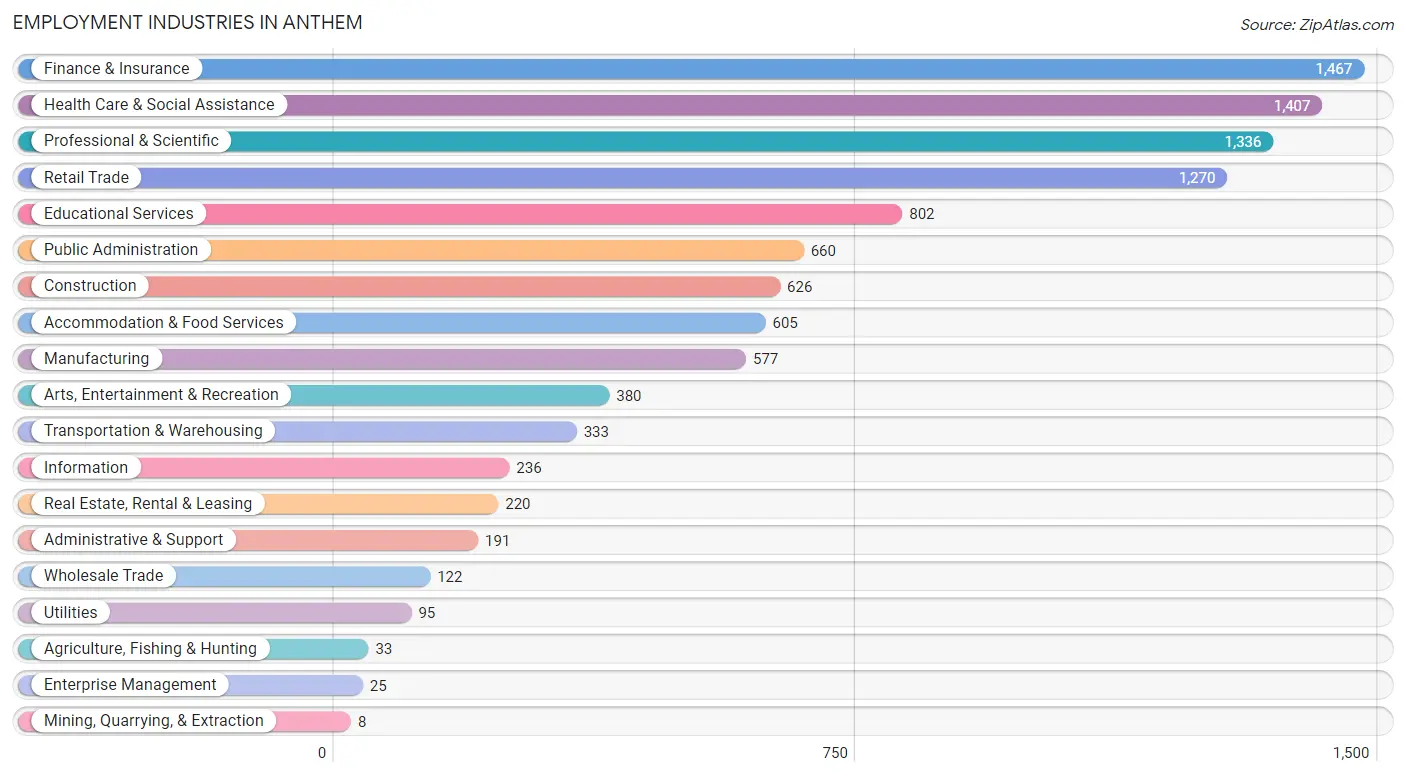
Employment Industries in Anthem
The major employment industries in Anthem include Finance & Insurance (1,467 | 13.4%), Health Care & Social Assistance (1,407 | 12.9%), Professional & Scientific (1,336 | 12.2%), Retail Trade (1,270 | 11.6%), and Educational Services (802 | 7.3%).
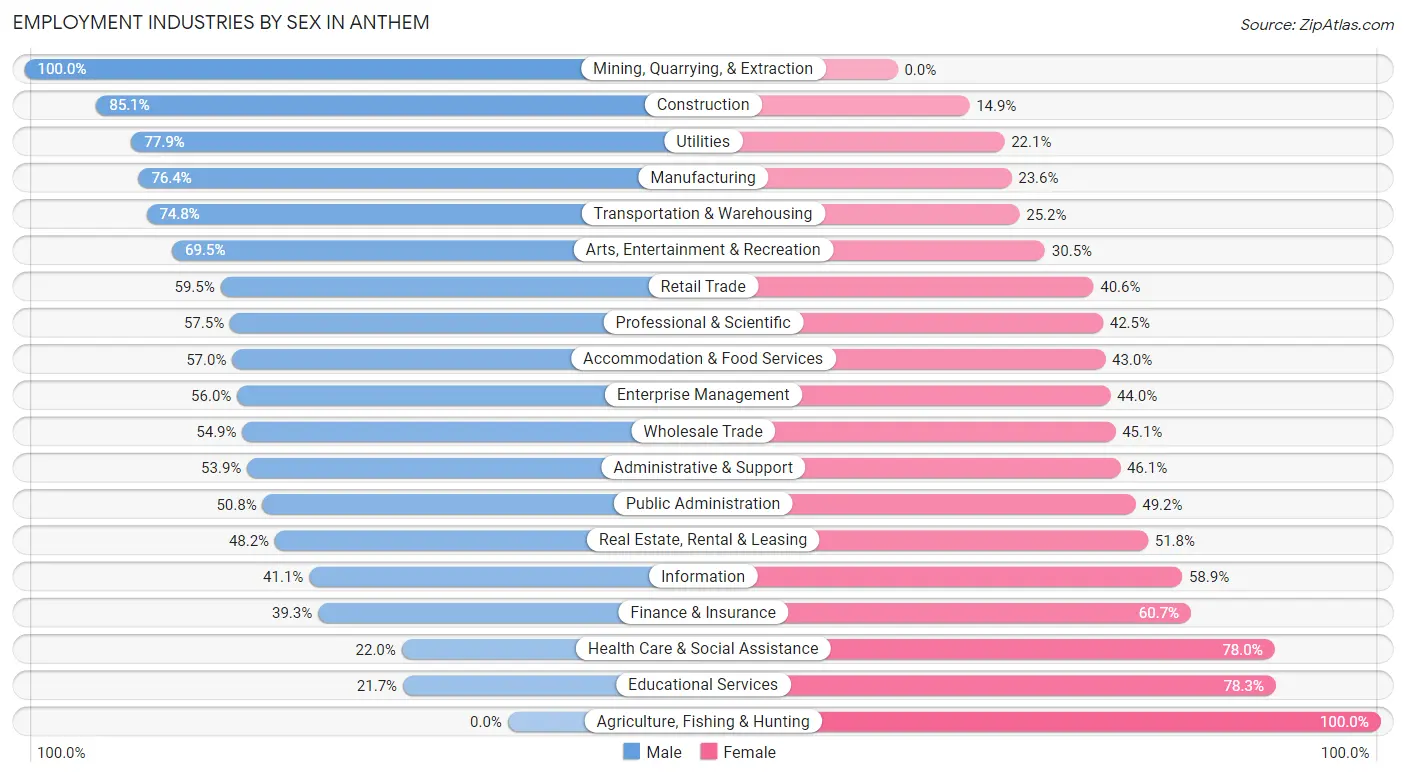
Employment Industries by Sex in Anthem
The Anthem industries that see more men than women are Mining, Quarrying, & Extraction (100.0%), Construction (85.1%), and Utilities (77.9%), whereas the industries that tend to have a higher number of women are Agriculture, Fishing & Hunting (100.0%), Educational Services (78.3%), and Health Care & Social Assistance (78.0%).
| Industry | Male | Female |
| Agriculture, Fishing & Hunting | 0 (0.0%) | 33 (100.0%) |
| Mining, Quarrying, & Extraction | 8 (100.0%) | 0 (0.0%) |
| Construction | 533 (85.1%) | 93 (14.9%) |
| Manufacturing | 441 (76.4%) | 136 (23.6%) |
| Wholesale Trade | 67 (54.9%) | 55 (45.1%) |
| Retail Trade | 755 (59.5%) | 515 (40.6%) |
| Transportation & Warehousing | 249 (74.8%) | 84 (25.2%) |
| Utilities | 74 (77.9%) | 21 (22.1%) |
| Information | 97 (41.1%) | 139 (58.9%) |
| Finance & Insurance | 576 (39.3%) | 891 (60.7%) |
| Real Estate, Rental & Leasing | 106 (48.2%) | 114 (51.8%) |
| Professional & Scientific | 768 (57.5%) | 568 (42.5%) |
| Enterprise Management | 14 (56.0%) | 11 (44.0%) |
| Administrative & Support | 103 (53.9%) | 88 (46.1%) |
| Educational Services | 174 (21.7%) | 628 (78.3%) |
| Health Care & Social Assistance | 309 (22.0%) | 1,098 (78.0%) |
| Arts, Entertainment & Recreation | 264 (69.5%) | 116 (30.5%) |
| Accommodation & Food Services | 345 (57.0%) | 260 (43.0%) |
| Public Administration | 335 (50.8%) | 325 (49.2%) |
| Total | 5,540 (50.7%) | 5,396 (49.3%) |
Education in Anthem
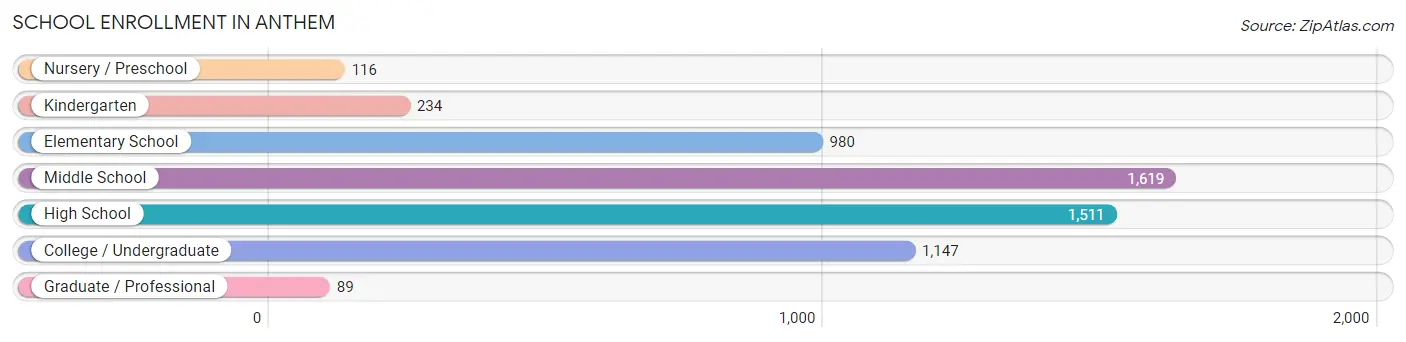
School Enrollment in Anthem
The most common levels of schooling among the 5,696 students in Anthem are middle school (1,619 | 28.4%), high school (1,511 | 26.5%), and college / undergraduate (1,147 | 20.1%).
| School Level | # Students | % Students |
| Nursery / Preschool | 116 | 2.0% |
| Kindergarten | 234 | 4.1% |
| Elementary School | 980 | 17.2% |
| Middle School | 1,619 | 28.4% |
| High School | 1,511 | 26.5% |
| College / Undergraduate | 1,147 | 20.1% |
| Graduate / Professional | 89 | 1.6% |
| Total | 5,696 | 100.0% |
School Enrollment by Age by Funding Source in Anthem
Out of a total of 5,696 students who are enrolled in schools in Anthem, 871 (15.3%) attend a private institution, while the remaining 4,825 (84.7%) are enrolled in public schools. The age group of 3 to 4 year olds has the highest likelihood of being enrolled in private schools, with 87 (71.3% in the age bracket) enrolled. Conversely, the age group of 18 to 19 year olds has the lowest likelihood of being enrolled in a private school, with 424 (90.6% in the age bracket) attending a public institution.
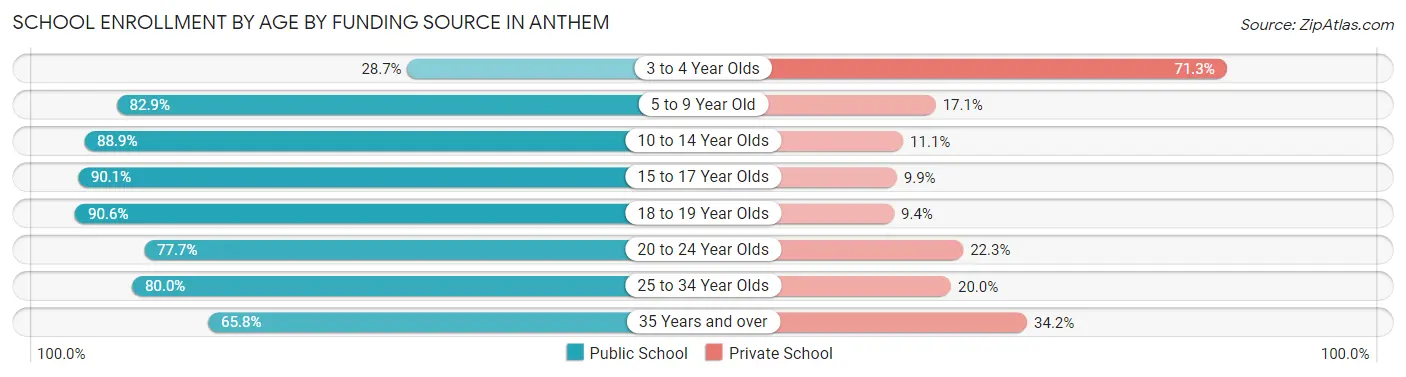
| Age Bracket | Public School | Private School |
| 3 to 4 Year Olds | 35 (28.7%) | 87 (71.3%) |
| 5 to 9 Year Old | 943 (82.9%) | 195 (17.1%) |
| 10 to 14 Year Olds | 1,565 (88.9%) | 195 (11.1%) |
| 15 to 17 Year Olds | 1,237 (90.1%) | 136 (9.9%) |
| 18 to 19 Year Olds | 424 (90.6%) | 44 (9.4%) |
| 20 to 24 Year Olds | 328 (77.7%) | 94 (22.3%) |
| 25 to 34 Year Olds | 108 (80.0%) | 27 (20.0%) |
| 35 Years and over | 183 (65.8%) | 95 (34.2%) |
| Total | 4,825 (84.7%) | 871 (15.3%) |
Educational Attainment by Field of Study in Anthem
Business (2,100 | 26.7%), education (1,065 | 13.6%), science & technology (1,064 | 13.5%), arts & humanities (478 | 6.1%), and social sciences (440 | 5.6%) are the most common fields of study among 7,858 individuals in Anthem who have obtained a bachelor's degree or higher.
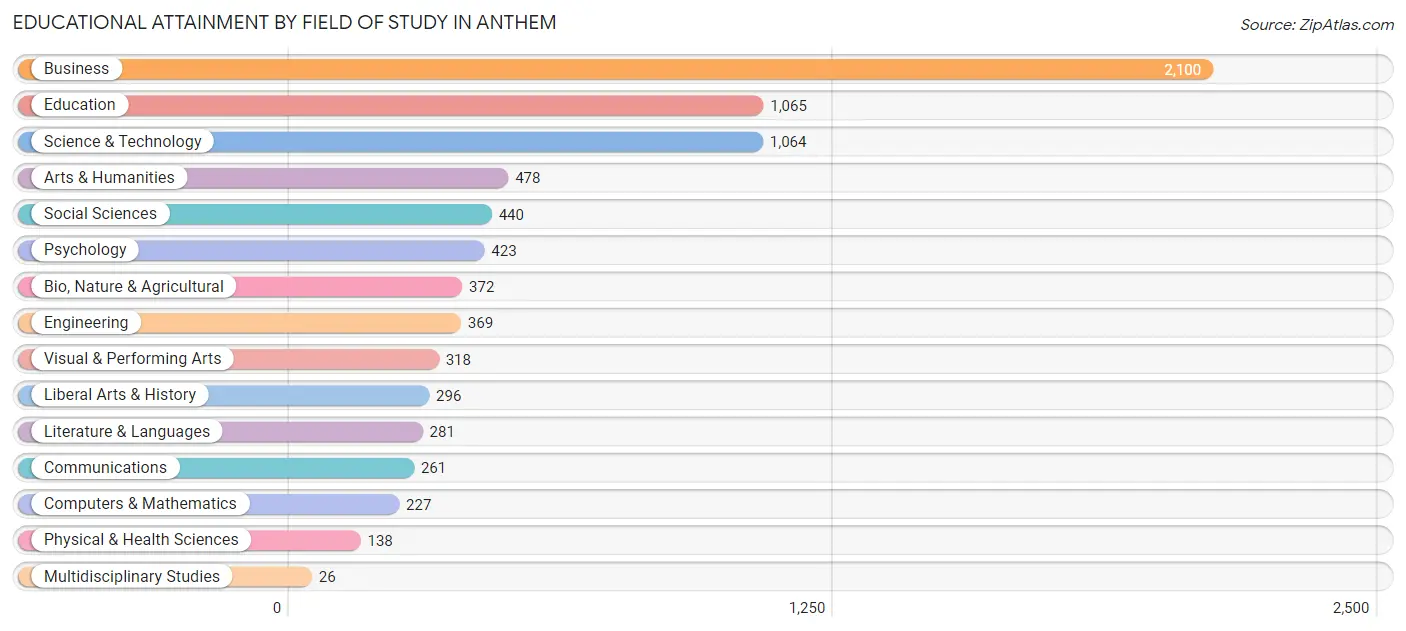
| Field of Study | # Graduates | % Graduates |
| Computers & Mathematics | 227 | 2.9% |
| Bio, Nature & Agricultural | 372 | 4.7% |
| Physical & Health Sciences | 138 | 1.8% |
| Psychology | 423 | 5.4% |
| Social Sciences | 440 | 5.6% |
| Engineering | 369 | 4.7% |
| Multidisciplinary Studies | 26 | 0.3% |
| Science & Technology | 1,064 | 13.5% |
| Business | 2,100 | 26.7% |
| Education | 1,065 | 13.6% |
| Literature & Languages | 281 | 3.6% |
| Liberal Arts & History | 296 | 3.8% |
| Visual & Performing Arts | 318 | 4.1% |
| Communications | 261 | 3.3% |
| Arts & Humanities | 478 | 6.1% |
| Total | 7,858 | 100.0% |
Transportation & Commute in Anthem
Vehicle Availability by Sex in Anthem
The most prevalent vehicle ownership categories in Anthem are males with 2 vehicles (2,422, accounting for 44.4%) and females with 2 vehicles (2,506, making up 46.1%).
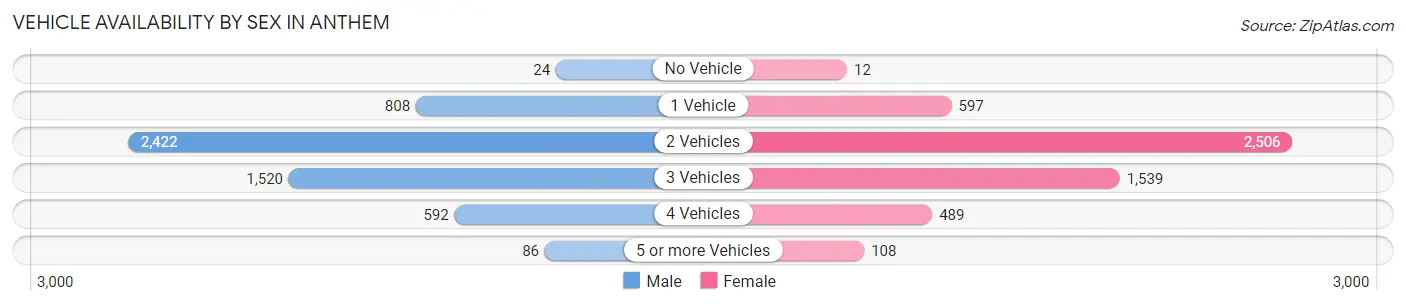
| Vehicles Available | Male | Female |
| No Vehicle | 24 (0.4%) | 12 (0.2%) |
| 1 Vehicle | 808 (14.8%) | 597 (11.4%) |
| 2 Vehicles | 2,422 (44.4%) | 2,506 (47.7%) |
| 3 Vehicles | 1,520 (27.9%) | 1,539 (29.3%) |
| 4 Vehicles | 592 (10.9%) | 489 (9.3%) |
| 5 or more Vehicles | 86 (1.6%) | 108 (2.1%) |
| Total | 5,452 (100.0%) | 5,251 (100.0%) |
Commute Time in Anthem
The most frequently occuring commute durations in Anthem are 30 to 34 minutes (1,180 commuters, 14.9%), 45 to 59 minutes (1,022 commuters, 13.0%), and 10 to 14 minutes (1,004 commuters, 12.7%).
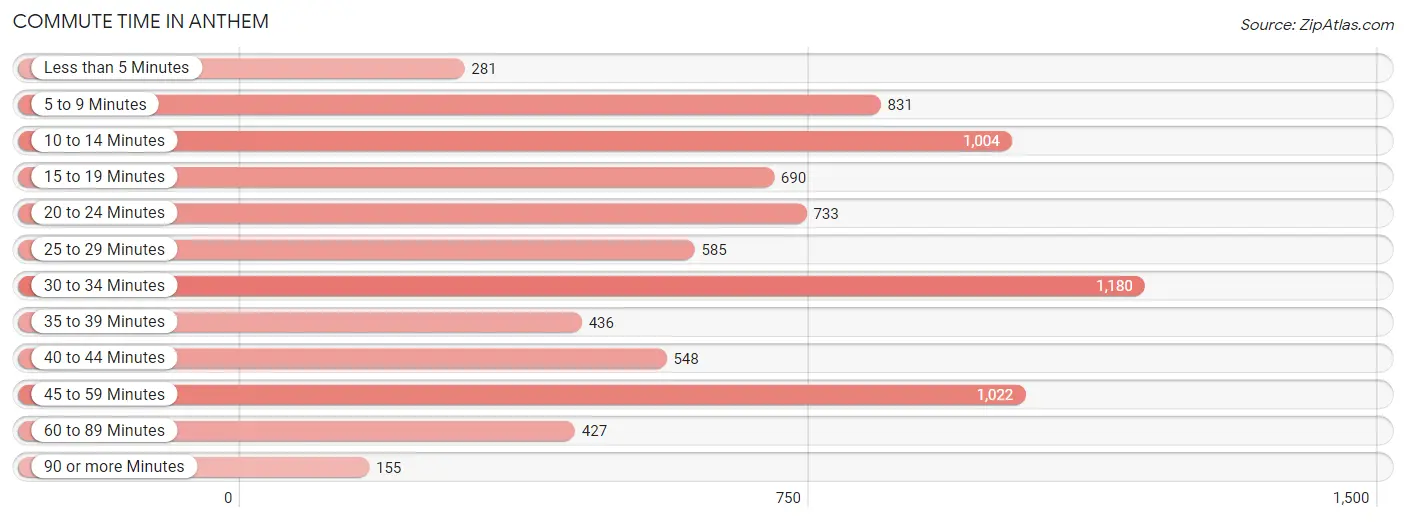
| Commute Time | # Commuters | % Commuters |
| Less than 5 Minutes | 281 | 3.6% |
| 5 to 9 Minutes | 831 | 10.5% |
| 10 to 14 Minutes | 1,004 | 12.7% |
| 15 to 19 Minutes | 690 | 8.7% |
| 20 to 24 Minutes | 733 | 9.3% |
| 25 to 29 Minutes | 585 | 7.4% |
| 30 to 34 Minutes | 1,180 | 14.9% |
| 35 to 39 Minutes | 436 | 5.5% |
| 40 to 44 Minutes | 548 | 6.9% |
| 45 to 59 Minutes | 1,022 | 13.0% |
| 60 to 89 Minutes | 427 | 5.4% |
| 90 or more Minutes | 155 | 2.0% |
Commute Time by Sex in Anthem
The most common commute times in Anthem are 30 to 34 minutes (581 commuters, 14.3%) for males and 30 to 34 minutes (599 commuters, 15.7%) for females.
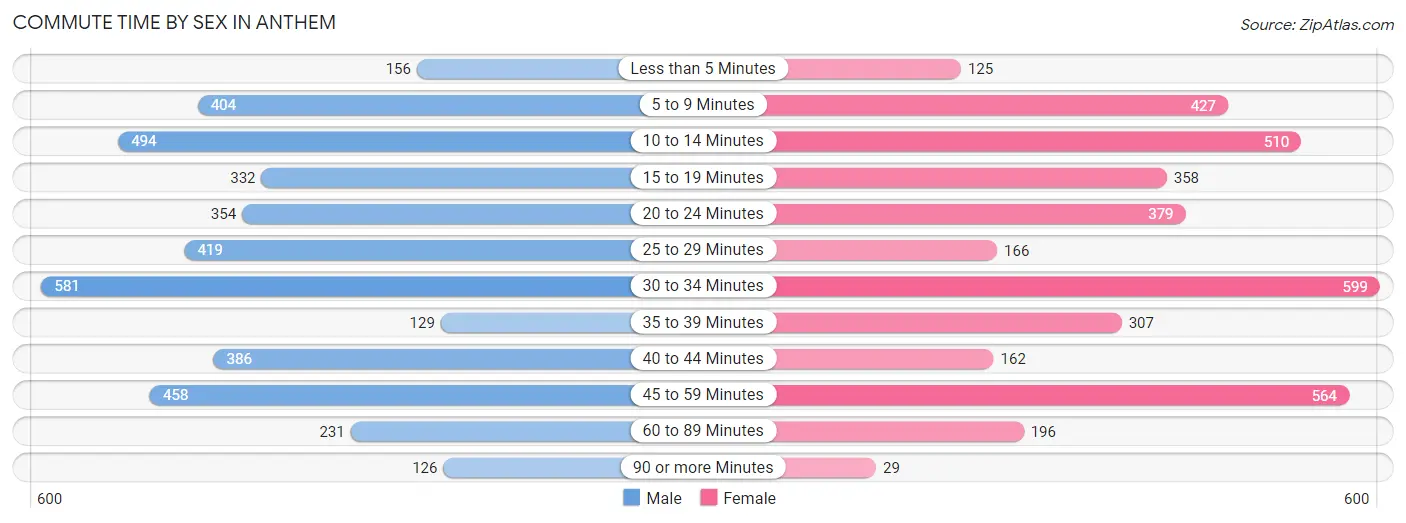
| Commute Time | Male | Female |
| Less than 5 Minutes | 156 (3.8%) | 125 (3.3%) |
| 5 to 9 Minutes | 404 (9.9%) | 427 (11.2%) |
| 10 to 14 Minutes | 494 (12.1%) | 510 (13.3%) |
| 15 to 19 Minutes | 332 (8.2%) | 358 (9.4%) |
| 20 to 24 Minutes | 354 (8.7%) | 379 (9.9%) |
| 25 to 29 Minutes | 419 (10.3%) | 166 (4.3%) |
| 30 to 34 Minutes | 581 (14.3%) | 599 (15.7%) |
| 35 to 39 Minutes | 129 (3.2%) | 307 (8.0%) |
| 40 to 44 Minutes | 386 (9.5%) | 162 (4.2%) |
| 45 to 59 Minutes | 458 (11.3%) | 564 (14.8%) |
| 60 to 89 Minutes | 231 (5.7%) | 196 (5.1%) |
| 90 or more Minutes | 126 (3.1%) | 29 (0.8%) |
Time of Departure to Work by Sex in Anthem
The most frequent times of departure to work in Anthem are 8:00 AM to 8:29 AM (480, 11.8%) for males and 8:00 AM to 8:29 AM (918, 24.0%) for females.
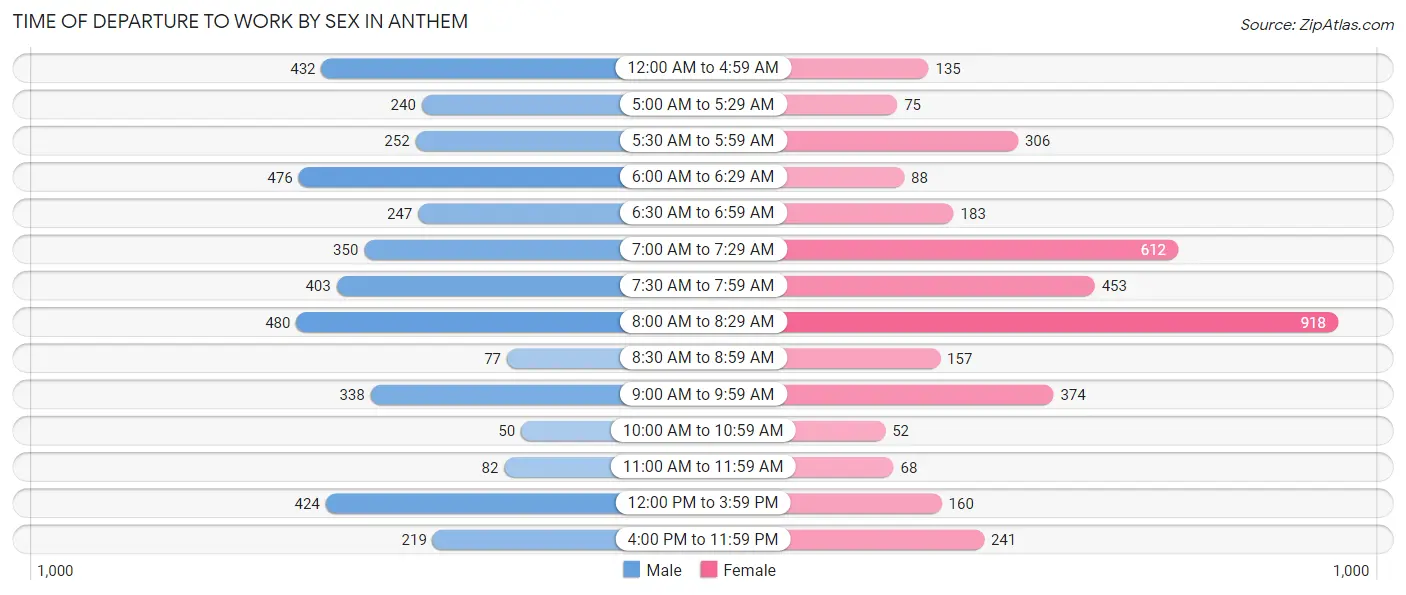
| Time of Departure | Male | Female |
| 12:00 AM to 4:59 AM | 432 (10.6%) | 135 (3.5%) |
| 5:00 AM to 5:29 AM | 240 (5.9%) | 75 (2.0%) |
| 5:30 AM to 5:59 AM | 252 (6.2%) | 306 (8.0%) |
| 6:00 AM to 6:29 AM | 476 (11.7%) | 88 (2.3%) |
| 6:30 AM to 6:59 AM | 247 (6.1%) | 183 (4.8%) |
| 7:00 AM to 7:29 AM | 350 (8.6%) | 612 (16.0%) |
| 7:30 AM to 7:59 AM | 403 (9.9%) | 453 (11.8%) |
| 8:00 AM to 8:29 AM | 480 (11.8%) | 918 (24.0%) |
| 8:30 AM to 8:59 AM | 77 (1.9%) | 157 (4.1%) |
| 9:00 AM to 9:59 AM | 338 (8.3%) | 374 (9.8%) |
| 10:00 AM to 10:59 AM | 50 (1.2%) | 52 (1.4%) |
| 11:00 AM to 11:59 AM | 82 (2.0%) | 68 (1.8%) |
| 12:00 PM to 3:59 PM | 424 (10.4%) | 160 (4.2%) |
| 4:00 PM to 11:59 PM | 219 (5.4%) | 241 (6.3%) |
| Total | 4,070 (100.0%) | 3,822 (100.0%) |
Housing Occupancy in Anthem
Occupancy by Ownership in Anthem
Of the total 8,578 dwellings in Anthem, owner-occupied units account for 7,042 (82.1%), while renter-occupied units make up 1,536 (17.9%).
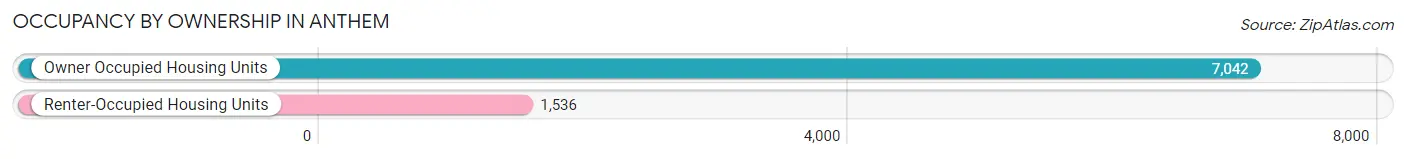
| Occupancy | # Housing Units | % Housing Units |
| Owner Occupied Housing Units | 7,042 | 82.1% |
| Renter-Occupied Housing Units | 1,536 | 17.9% |
| Total Occupied Housing Units | 8,578 | 100.0% |
Occupancy by Household Size in Anthem
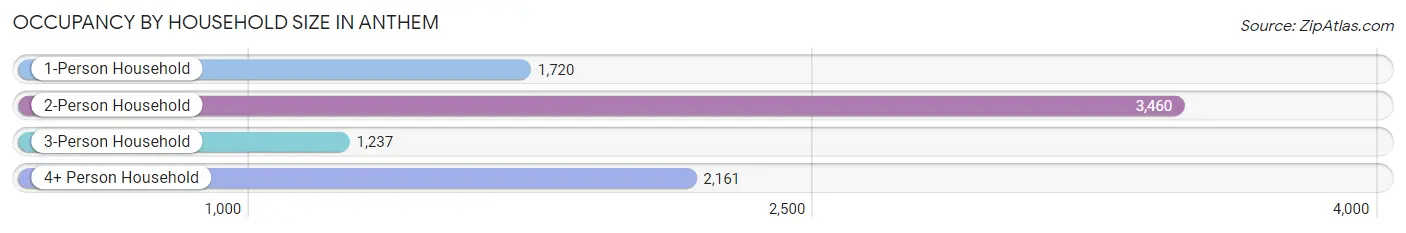
| Household Size | # Housing Units | % Housing Units |
| 1-Person Household | 1,720 | 20.1% |
| 2-Person Household | 3,460 | 40.3% |
| 3-Person Household | 1,237 | 14.4% |
| 4+ Person Household | 2,161 | 25.2% |
| Total Housing Units | 8,578 | 100.0% |
Occupancy by Ownership by Household Size in Anthem
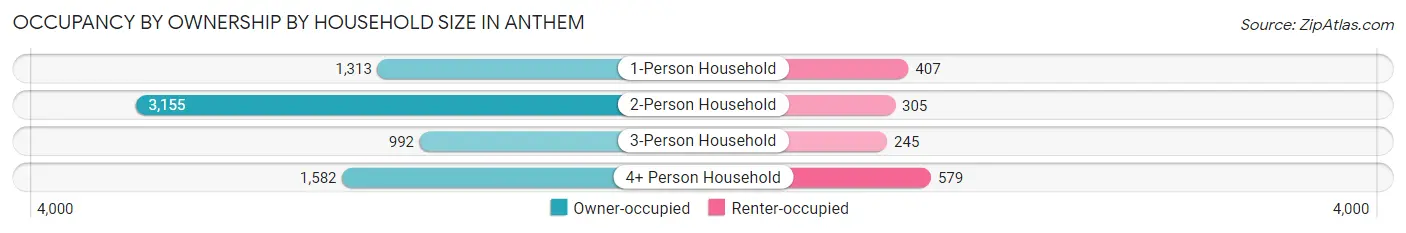
| Household Size | Owner-occupied | Renter-occupied |
| 1-Person Household | 1,313 (76.3%) | 407 (23.7%) |
| 2-Person Household | 3,155 (91.2%) | 305 (8.8%) |
| 3-Person Household | 992 (80.2%) | 245 (19.8%) |
| 4+ Person Household | 1,582 (73.2%) | 579 (26.8%) |
| Total Housing Units | 7,042 (82.1%) | 1,536 (17.9%) |
Occupancy by Educational Attainment in Anthem
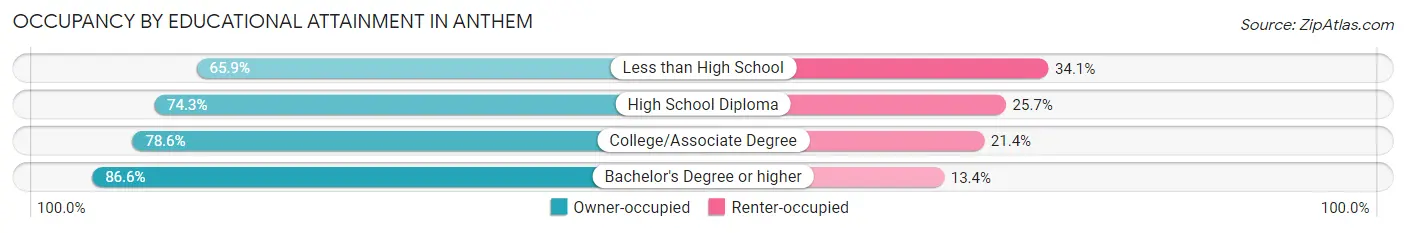
| Household Size | Owner-occupied | Renter-occupied |
| Less than High School | 87 (65.9%) | 45 (34.1%) |
| High School Diploma | 837 (74.3%) | 289 (25.7%) |
| College/Associate Degree | 2,179 (78.6%) | 592 (21.4%) |
| Bachelor's Degree or higher | 3,939 (86.6%) | 610 (13.4%) |
Occupancy by Age of Householder in Anthem
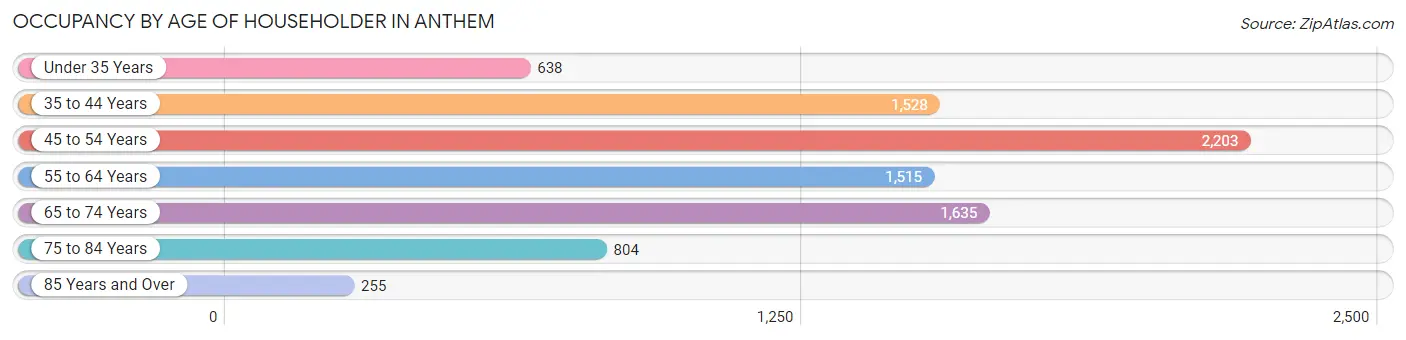
| Age Bracket | # Households | % Households |
| Under 35 Years | 638 | 7.4% |
| 35 to 44 Years | 1,528 | 17.8% |
| 45 to 54 Years | 2,203 | 25.7% |
| 55 to 64 Years | 1,515 | 17.7% |
| 65 to 74 Years | 1,635 | 19.1% |
| 75 to 84 Years | 804 | 9.4% |
| 85 Years and Over | 255 | 3.0% |
| Total | 8,578 | 100.0% |
Housing Finances in Anthem
Median Income by Occupancy in Anthem
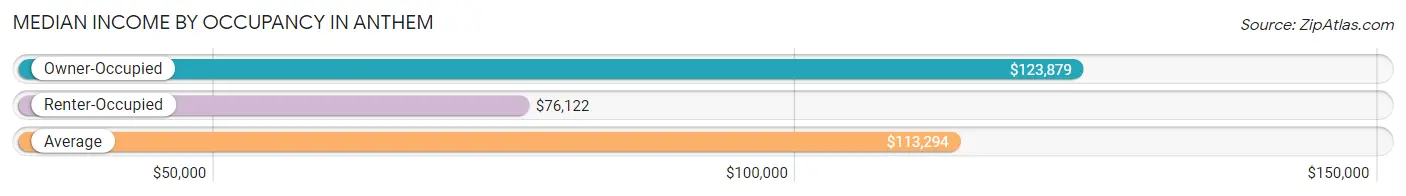
| Occupancy Type | # Households | Median Income |
| Owner-Occupied | 7,042 (82.1%) | $123,879 |
| Renter-Occupied | 1,536 (17.9%) | $76,122 |
| Average | 8,578 (100.0%) | $113,294 |
Occupancy by Householder Income Bracket in Anthem
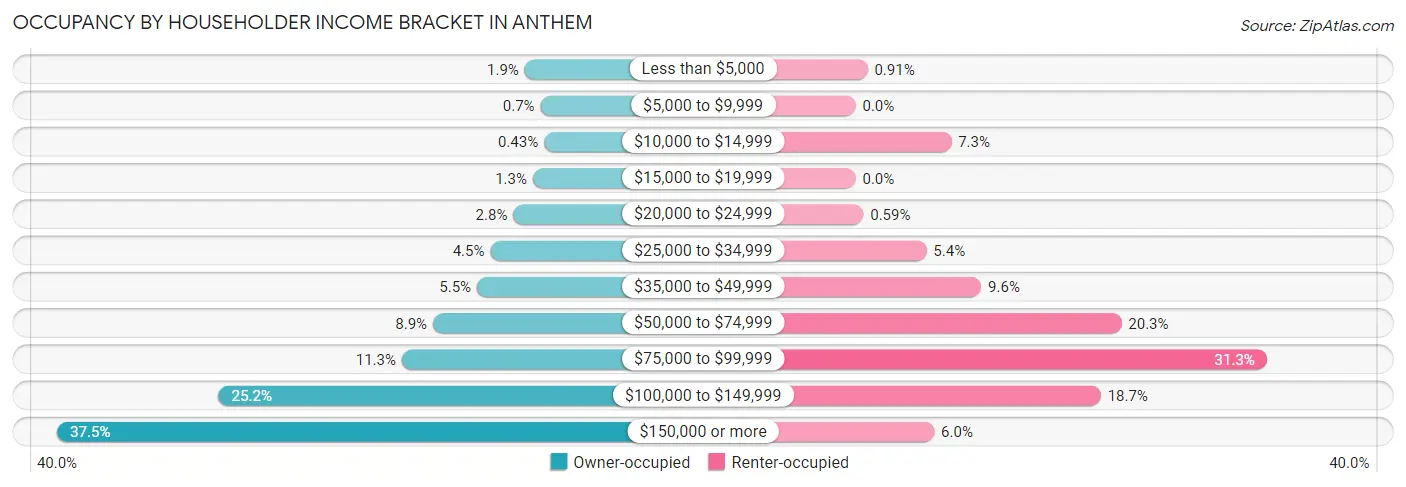
| Income Bracket | Owner-occupied | Renter-occupied |
| Less than $5,000 | 134 (1.9%) | 14 (0.9%) |
| $5,000 to $9,999 | 49 (0.7%) | 0 (0.0%) |
| $10,000 to $14,999 | 30 (0.4%) | 112 (7.3%) |
| $15,000 to $19,999 | 90 (1.3%) | 0 (0.0%) |
| $20,000 to $24,999 | 195 (2.8%) | 9 (0.6%) |
| $25,000 to $34,999 | 318 (4.5%) | 83 (5.4%) |
| $35,000 to $49,999 | 390 (5.5%) | 147 (9.6%) |
| $50,000 to $74,999 | 626 (8.9%) | 311 (20.3%) |
| $75,000 to $99,999 | 793 (11.3%) | 481 (31.3%) |
| $100,000 to $149,999 | 1,775 (25.2%) | 287 (18.7%) |
| $150,000 or more | 2,642 (37.5%) | 92 (6.0%) |
| Total | 7,042 (100.0%) | 1,536 (100.0%) |
Monthly Housing Cost Tiers in Anthem
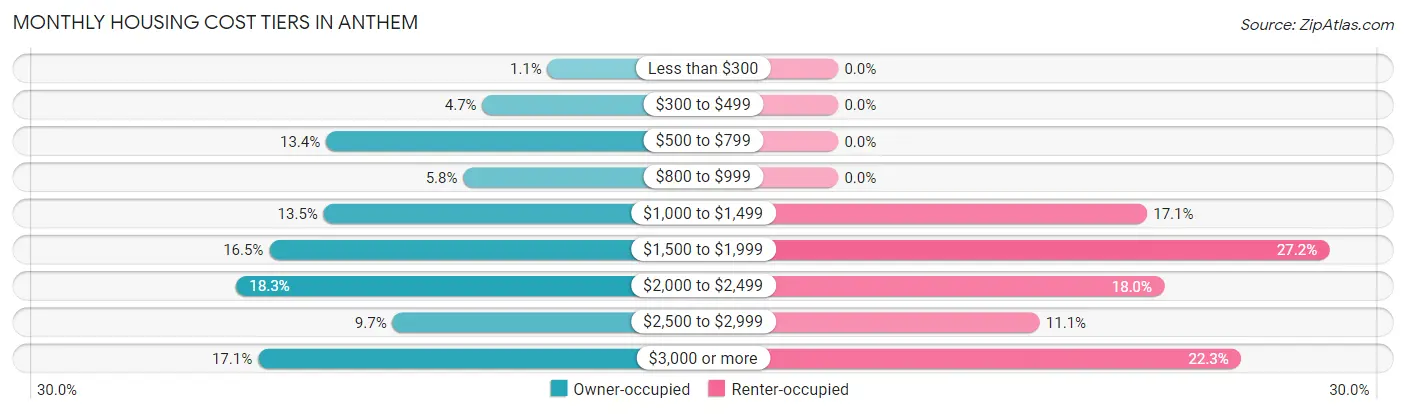
| Monthly Cost | Owner-occupied | Renter-occupied |
| Less than $300 | 78 (1.1%) | 0 (0.0%) |
| $300 to $499 | 332 (4.7%) | 0 (0.0%) |
| $500 to $799 | 940 (13.4%) | 0 (0.0%) |
| $800 to $999 | 406 (5.8%) | 0 (0.0%) |
| $1,000 to $1,499 | 949 (13.5%) | 262 (17.1%) |
| $1,500 to $1,999 | 1,161 (16.5%) | 417 (27.2%) |
| $2,000 to $2,499 | 1,289 (18.3%) | 277 (18.0%) |
| $2,500 to $2,999 | 682 (9.7%) | 171 (11.1%) |
| $3,000 or more | 1,205 (17.1%) | 342 (22.3%) |
| Total | 7,042 (100.0%) | 1,536 (100.0%) |
Physical Housing Characteristics in Anthem
Housing Structures in Anthem
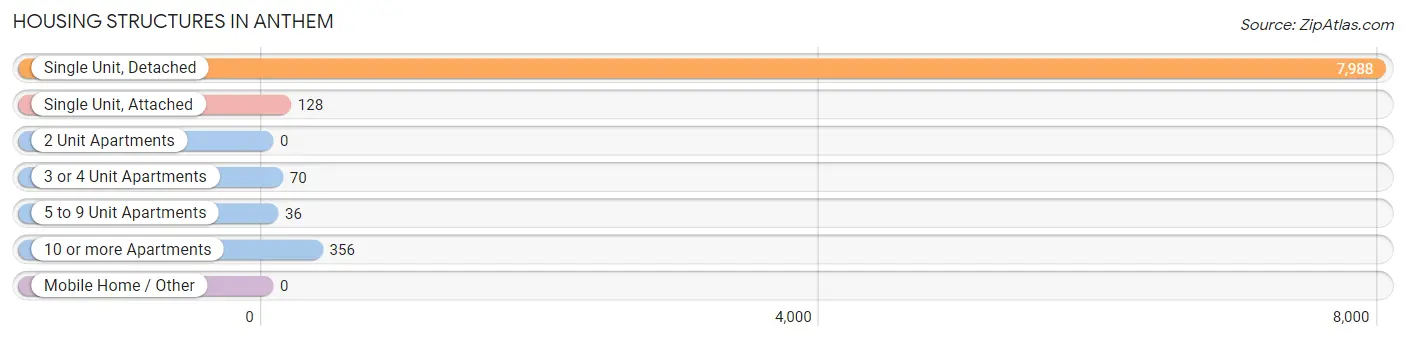
| Structure Type | # Housing Units | % Housing Units |
| Single Unit, Detached | 7,988 | 93.1% |
| Single Unit, Attached | 128 | 1.5% |
| 2 Unit Apartments | 0 | 0.0% |
| 3 or 4 Unit Apartments | 70 | 0.8% |
| 5 to 9 Unit Apartments | 36 | 0.4% |
| 10 or more Apartments | 356 | 4.2% |
| Mobile Home / Other | 0 | 0.0% |
| Total | 8,578 | 100.0% |
Housing Structures by Occupancy in Anthem
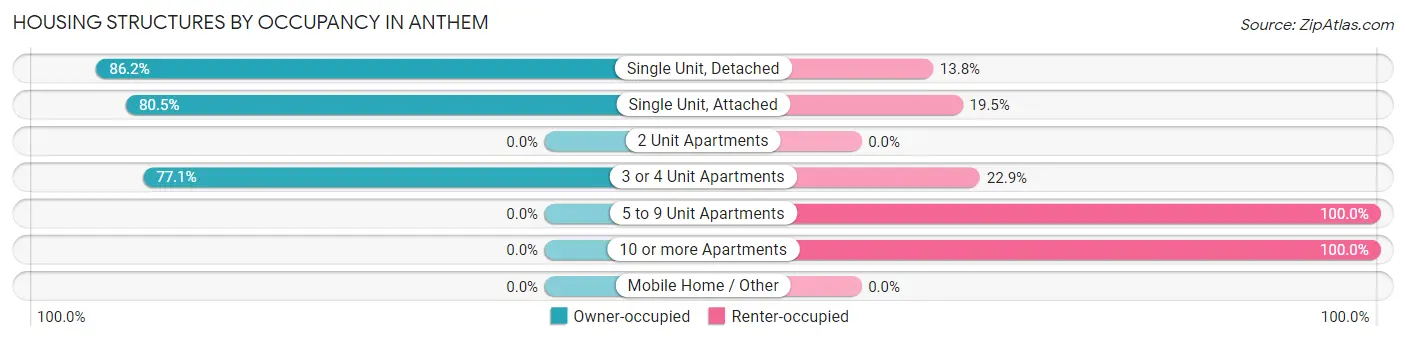
| Structure Type | Owner-occupied | Renter-occupied |
| Single Unit, Detached | 6,885 (86.2%) | 1,103 (13.8%) |
| Single Unit, Attached | 103 (80.5%) | 25 (19.5%) |
| 2 Unit Apartments | 0 (0.0%) | 0 (0.0%) |
| 3 or 4 Unit Apartments | 54 (77.1%) | 16 (22.9%) |
| 5 to 9 Unit Apartments | 0 (0.0%) | 36 (100.0%) |
| 10 or more Apartments | 0 (0.0%) | 356 (100.0%) |
| Mobile Home / Other | 0 (0.0%) | 0 (0.0%) |
| Total | 7,042 (82.1%) | 1,536 (17.9%) |
Housing Structures by Number of Rooms in Anthem
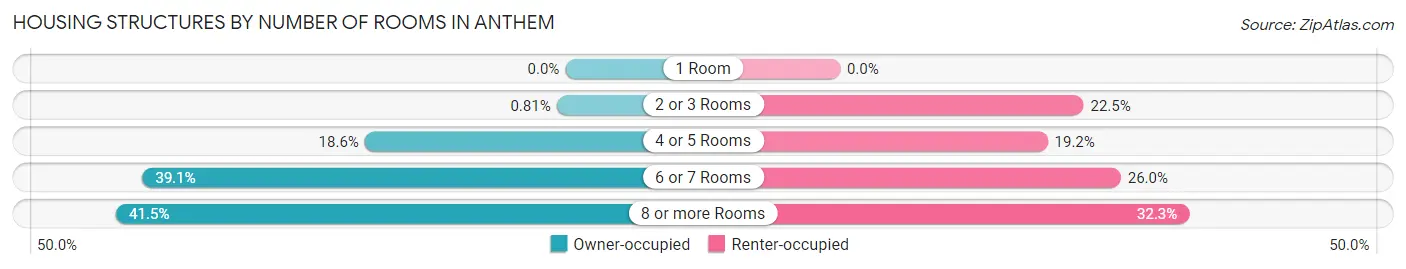
| Number of Rooms | Owner-occupied | Renter-occupied |
| 1 Room | 0 (0.0%) | 0 (0.0%) |
| 2 or 3 Rooms | 57 (0.8%) | 346 (22.5%) |
| 4 or 5 Rooms | 1,306 (18.5%) | 295 (19.2%) |
| 6 or 7 Rooms | 2,754 (39.1%) | 399 (26.0%) |
| 8 or more Rooms | 2,925 (41.5%) | 496 (32.3%) |
| Total | 7,042 (100.0%) | 1,536 (100.0%) |
Housing Structure by Heating Type in Anthem
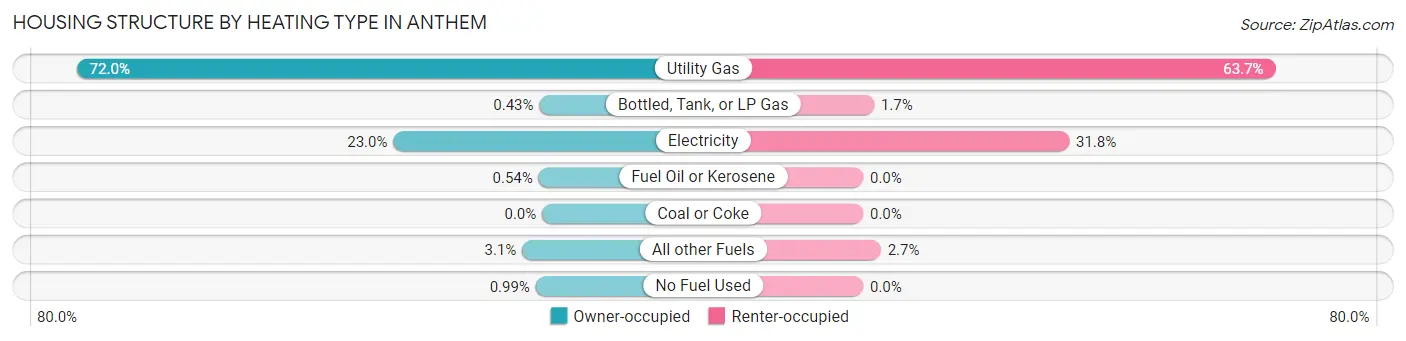
| Heating Type | Owner-occupied | Renter-occupied |
| Utility Gas | 5,067 (72.0%) | 979 (63.7%) |
| Bottled, Tank, or LP Gas | 30 (0.4%) | 26 (1.7%) |
| Electricity | 1,620 (23.0%) | 489 (31.8%) |
| Fuel Oil or Kerosene | 38 (0.5%) | 0 (0.0%) |
| Coal or Coke | 0 (0.0%) | 0 (0.0%) |
| All other Fuels | 217 (3.1%) | 42 (2.7%) |
| No Fuel Used | 70 (1.0%) | 0 (0.0%) |
| Total | 7,042 (100.0%) | 1,536 (100.0%) |
Household Vehicle Usage in Anthem
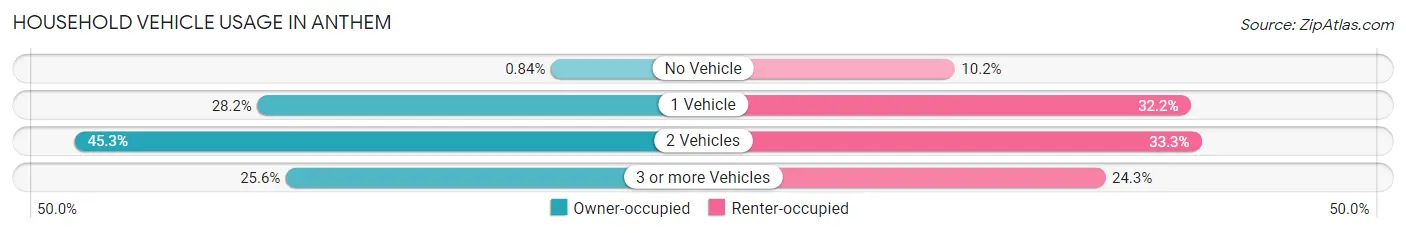
| Vehicles per Household | Owner-occupied | Renter-occupied |
| No Vehicle | 59 (0.8%) | 157 (10.2%) |
| 1 Vehicle | 1,989 (28.2%) | 495 (32.2%) |
| 2 Vehicles | 3,193 (45.3%) | 511 (33.3%) |
| 3 or more Vehicles | 1,801 (25.6%) | 373 (24.3%) |
| Total | 7,042 (100.0%) | 1,536 (100.0%) |
Real Estate & Mortgages in Anthem
Real Estate and Mortgage Overview in Anthem
| Characteristic | Without Mortgage | With Mortgage |
| Housing Units | 1,928 | 5,114 |
| Median Property Value | $487,400 | $451,500 |
| Median Household Income | $110,259 | $2,168 |
| Monthly Housing Costs | $642 | $1,205 |
| Real Estate Taxes | $3,290 | $63 |
Property Value by Mortgage Status in Anthem
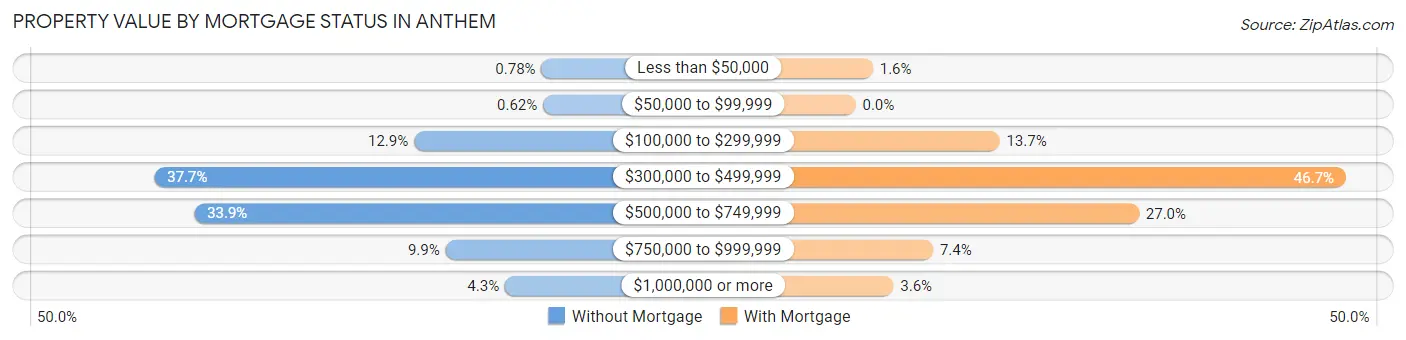
| Property Value | Without Mortgage | With Mortgage |
| Less than $50,000 | 15 (0.8%) | 84 (1.6%) |
| $50,000 to $99,999 | 12 (0.6%) | 0 (0.0%) |
| $100,000 to $299,999 | 249 (12.9%) | 701 (13.7%) |
| $300,000 to $499,999 | 726 (37.7%) | 2,388 (46.7%) |
| $500,000 to $749,999 | 653 (33.9%) | 1,380 (27.0%) |
| $750,000 to $999,999 | 191 (9.9%) | 377 (7.4%) |
| $1,000,000 or more | 82 (4.3%) | 184 (3.6%) |
| Total | 1,928 (100.0%) | 5,114 (100.0%) |
Household Income by Mortgage Status in Anthem
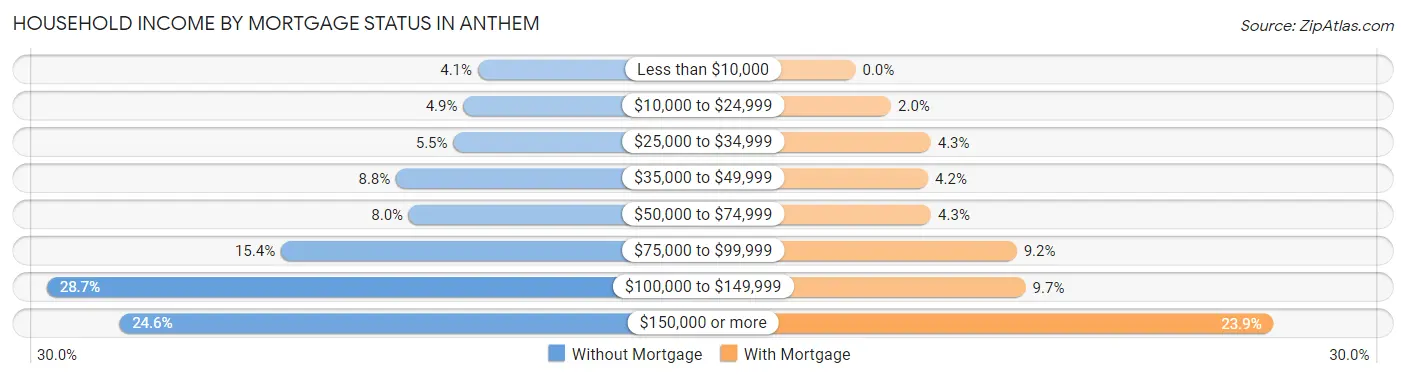
| Household Income | Without Mortgage | With Mortgage |
| Less than $10,000 | 79 (4.1%) | 0 (0.0%) |
| $10,000 to $24,999 | 95 (4.9%) | 104 (2.0%) |
| $25,000 to $34,999 | 106 (5.5%) | 220 (4.3%) |
| $35,000 to $49,999 | 169 (8.8%) | 212 (4.2%) |
| $50,000 to $74,999 | 155 (8.0%) | 221 (4.3%) |
| $75,000 to $99,999 | 296 (15.3%) | 471 (9.2%) |
| $100,000 to $149,999 | 554 (28.7%) | 497 (9.7%) |
| $150,000 or more | 474 (24.6%) | 1,221 (23.9%) |
| Total | 1,928 (100.0%) | 5,114 (100.0%) |
Property Value to Household Income Ratio in Anthem
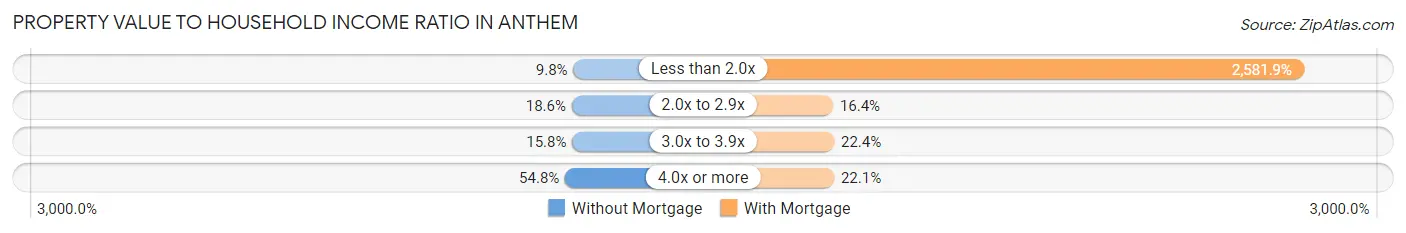
| Value-to-Income Ratio | Without Mortgage | With Mortgage |
| Less than 2.0x | 188 (9.8%) | 132,036 (2,581.9%) |
| 2.0x to 2.9x | 359 (18.6%) | 840 (16.4%) |
| 3.0x to 3.9x | 305 (15.8%) | 1,144 (22.4%) |
| 4.0x or more | 1,057 (54.8%) | 1,128 (22.1%) |
| Total | 1,928 (100.0%) | 5,114 (100.0%) |
Real Estate Taxes by Mortgage Status in Anthem
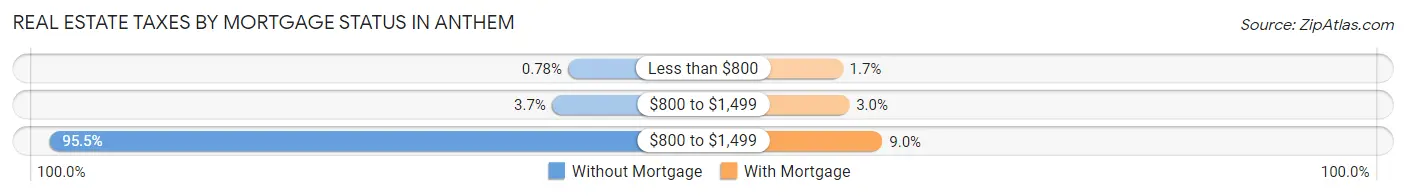
| Property Taxes | Without Mortgage | With Mortgage |
| Less than $800 | 15 (0.8%) | 89 (1.7%) |
| $800 to $1,499 | 72 (3.7%) | 151 (2.9%) |
| $800 to $1,499 | 1,841 (95.5%) | 461 (9.0%) |
| Total | 1,928 (100.0%) | 5,114 (100.0%) |
Health & Disability in Anthem
Health Insurance Coverage by Age in Anthem
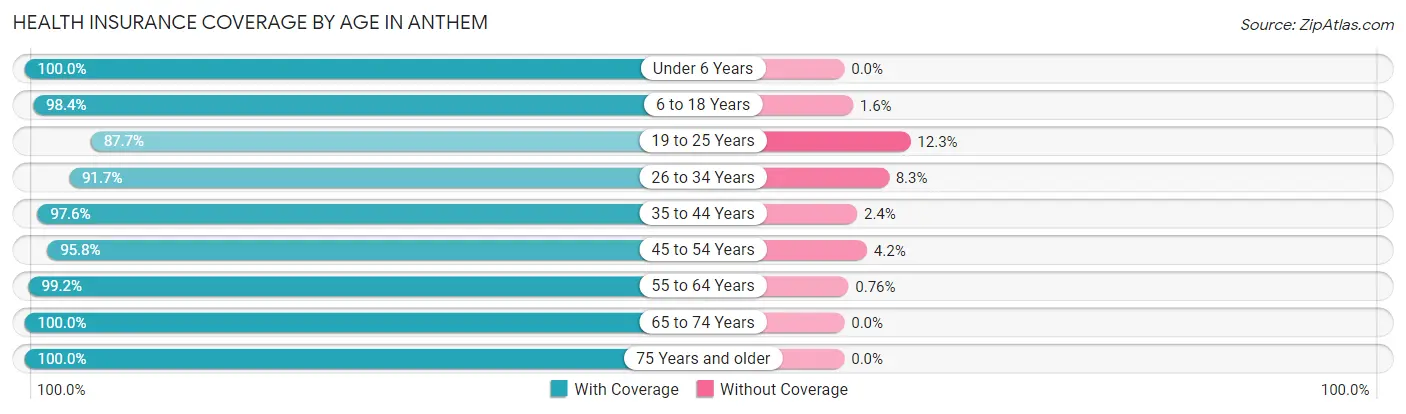
| Age Bracket | With Coverage | Without Coverage |
| Under 6 Years | 1,281 (100.0%) | 0 (0.0%) |
| 6 to 18 Years | 4,847 (98.4%) | 79 (1.6%) |
| 19 to 25 Years | 1,259 (87.7%) | 177 (12.3%) |
| 26 to 34 Years | 1,196 (91.7%) | 108 (8.3%) |
| 35 to 44 Years | 2,750 (97.6%) | 67 (2.4%) |
| 45 to 54 Years | 3,583 (95.8%) | 158 (4.2%) |
| 55 to 64 Years | 2,622 (99.2%) | 20 (0.8%) |
| 65 to 74 Years | 2,903 (100.0%) | 0 (0.0%) |
| 75 Years and older | 1,615 (100.0%) | 0 (0.0%) |
| Total | 22,056 (97.3%) | 609 (2.7%) |
Health Insurance Coverage by Citizenship Status in Anthem
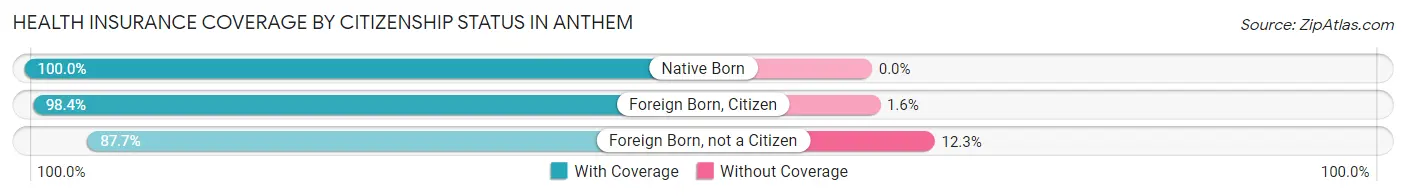
| Citizenship Status | With Coverage | Without Coverage |
| Native Born | 1,281 (100.0%) | 0 (0.0%) |
| Foreign Born, Citizen | 4,847 (98.4%) | 79 (1.6%) |
| Foreign Born, not a Citizen | 1,259 (87.7%) | 177 (12.3%) |
Health Insurance Coverage by Household Income in Anthem
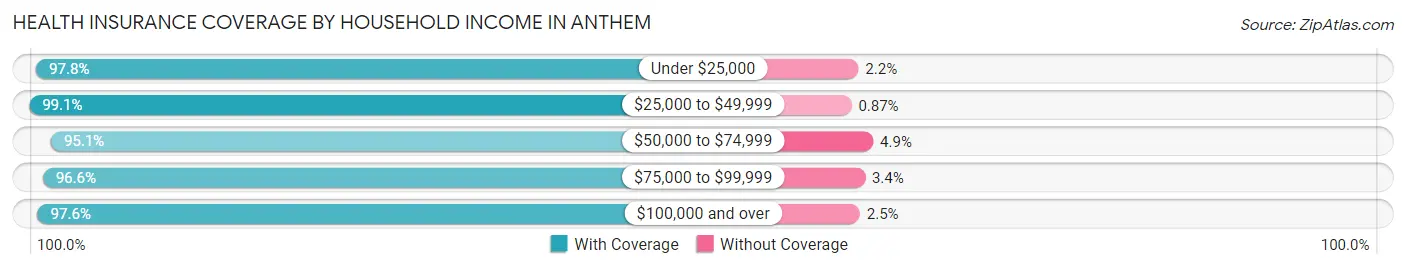
| Household Income | With Coverage | Without Coverage |
| Under $25,000 | 857 (97.8%) | 19 (2.2%) |
| $25,000 to $49,999 | 1,603 (99.1%) | 14 (0.9%) |
| $50,000 to $74,999 | 1,772 (95.1%) | 92 (4.9%) |
| $75,000 to $99,999 | 3,633 (96.6%) | 128 (3.4%) |
| $100,000 and over | 14,164 (97.6%) | 356 (2.5%) |
Public vs Private Health Insurance Coverage by Age in Anthem
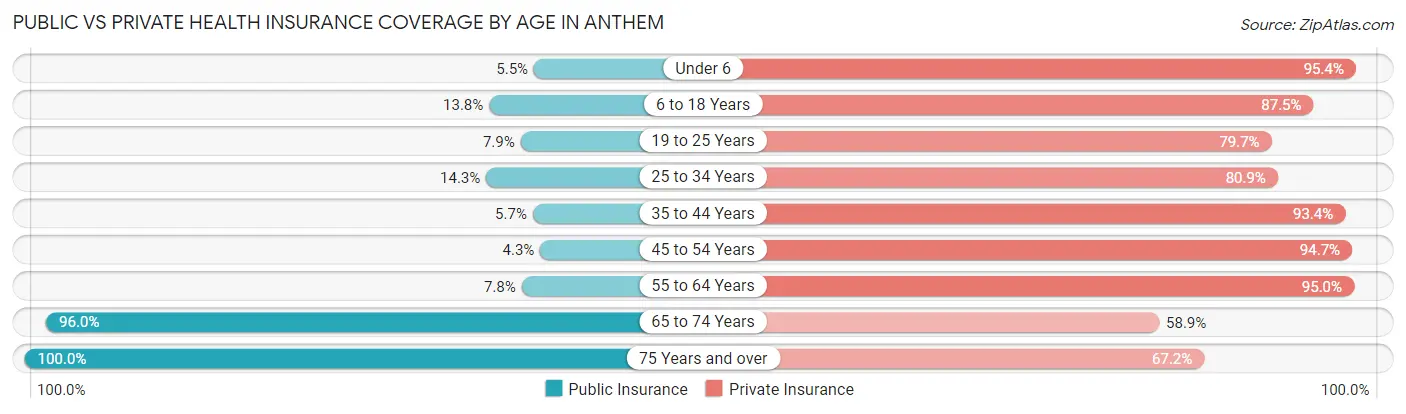
| Age Bracket | Public Insurance | Private Insurance |
| Under 6 | 70 (5.5%) | 1,222 (95.4%) |
| 6 to 18 Years | 679 (13.8%) | 4,311 (87.5%) |
| 19 to 25 Years | 114 (7.9%) | 1,145 (79.7%) |
| 25 to 34 Years | 187 (14.3%) | 1,055 (80.9%) |
| 35 to 44 Years | 160 (5.7%) | 2,631 (93.4%) |
| 45 to 54 Years | 161 (4.3%) | 3,542 (94.7%) |
| 55 to 64 Years | 205 (7.8%) | 2,511 (95.0%) |
| 65 to 74 Years | 2,787 (96.0%) | 1,710 (58.9%) |
| 75 Years and over | 1,615 (100.0%) | 1,086 (67.2%) |
| Total | 5,978 (26.4%) | 19,213 (84.8%) |
Disability Status by Sex by Age in Anthem
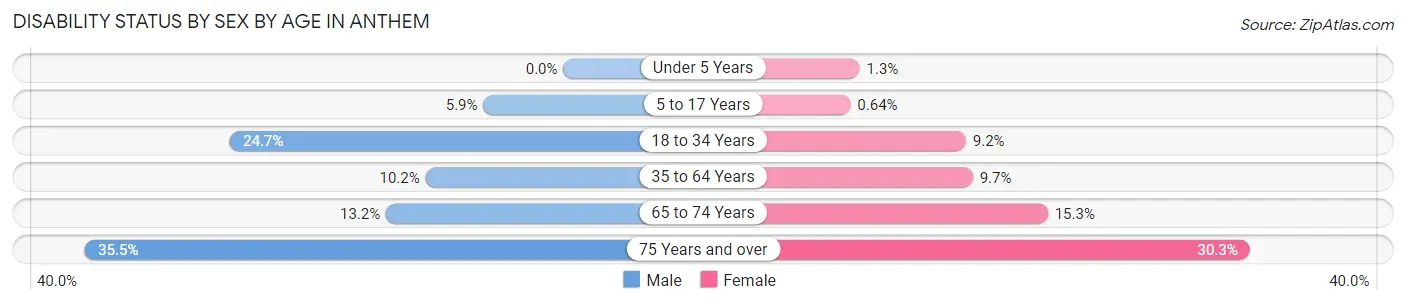
| Age Bracket | Male | Female |
| Under 5 Years | 0 (0.0%) | 8 (1.3%) |
| 5 to 17 Years | 138 (5.9%) | 14 (0.6%) |
| 18 to 34 Years | 400 (24.7%) | 165 (9.2%) |
| 35 to 64 Years | 434 (10.2%) | 482 (9.7%) |
| 65 to 74 Years | 178 (13.2%) | 237 (15.3%) |
| 75 Years and over | 299 (35.5%) | 234 (30.3%) |
Disability Class by Sex by Age in Anthem
Disability Class: Hearing Difficulty
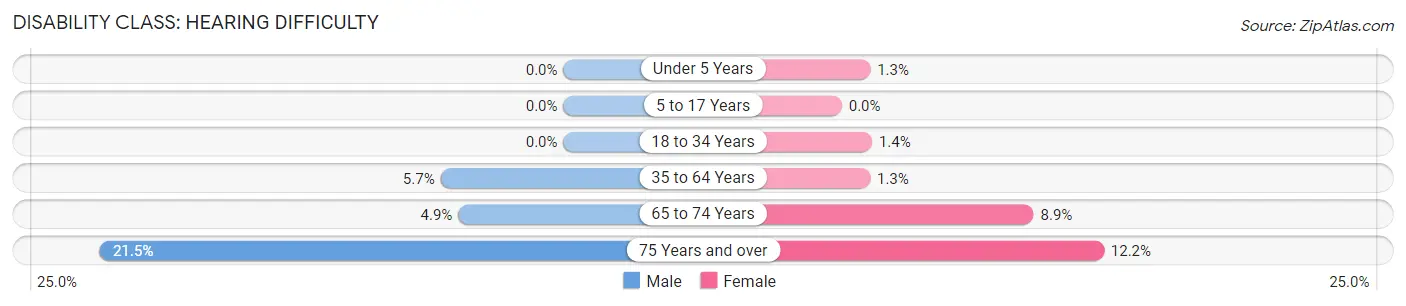
| Age Bracket | Male | Female |
| Under 5 Years | 0 (0.0%) | 8 (1.3%) |
| 5 to 17 Years | 0 (0.0%) | 0 (0.0%) |
| 18 to 34 Years | 0 (0.0%) | 25 (1.4%) |
| 35 to 64 Years | 242 (5.7%) | 65 (1.3%) |
| 65 to 74 Years | 66 (4.9%) | 138 (8.9%) |
| 75 Years and over | 181 (21.5%) | 94 (12.2%) |
Disability Class: Vision Difficulty
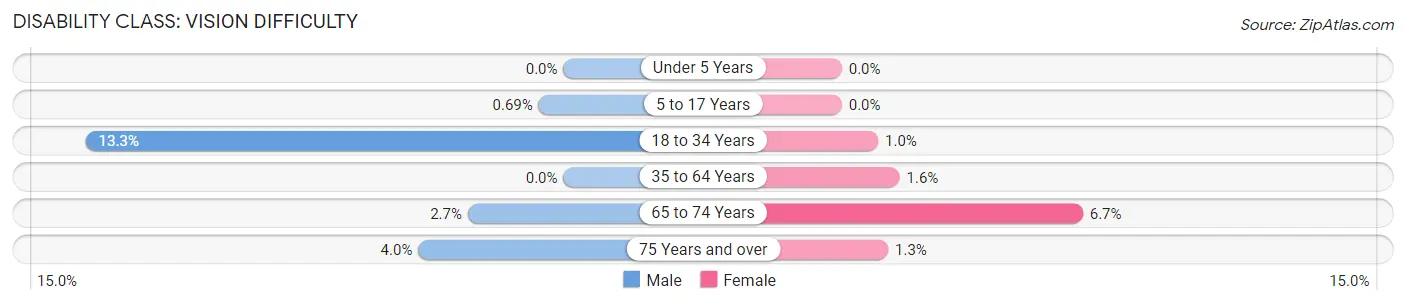
| Age Bracket | Male | Female |
| Under 5 Years | 0 (0.0%) | 0 (0.0%) |
| 5 to 17 Years | 16 (0.7%) | 0 (0.0%) |
| 18 to 34 Years | 215 (13.3%) | 18 (1.0%) |
| 35 to 64 Years | 0 (0.0%) | 80 (1.6%) |
| 65 to 74 Years | 36 (2.7%) | 104 (6.7%) |
| 75 Years and over | 34 (4.0%) | 10 (1.3%) |
Disability Class: Cognitive Difficulty
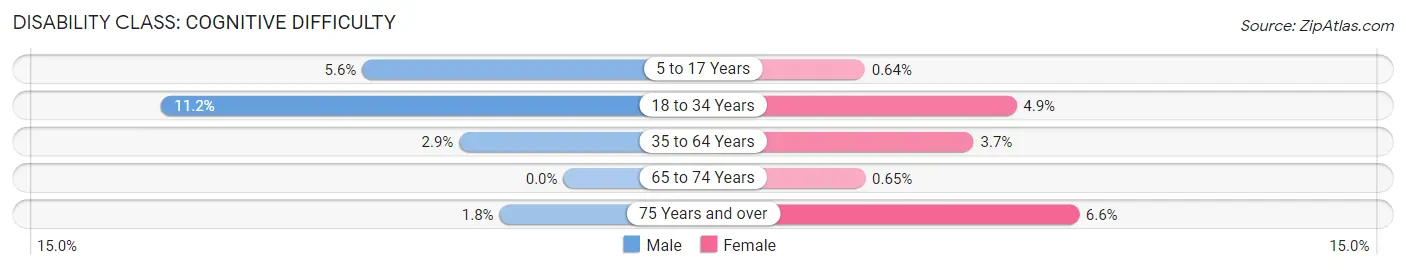
| Age Bracket | Male | Female |
| 5 to 17 Years | 130 (5.6%) | 14 (0.6%) |
| 18 to 34 Years | 181 (11.2%) | 87 (4.9%) |
| 35 to 64 Years | 123 (2.9%) | 182 (3.7%) |
| 65 to 74 Years | 0 (0.0%) | 10 (0.6%) |
| 75 Years and over | 15 (1.8%) | 51 (6.6%) |
Disability Class: Ambulatory Difficulty
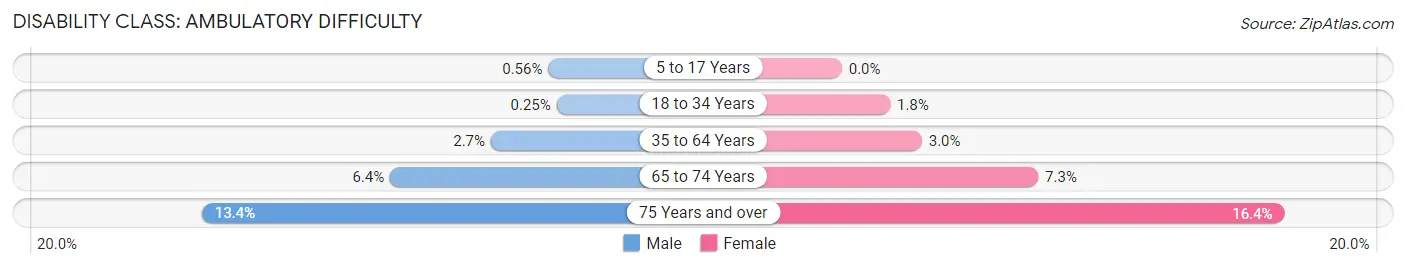
| Age Bracket | Male | Female |
| 5 to 17 Years | 13 (0.6%) | 0 (0.0%) |
| 18 to 34 Years | 4 (0.3%) | 32 (1.8%) |
| 35 to 64 Years | 114 (2.7%) | 147 (3.0%) |
| 65 to 74 Years | 87 (6.4%) | 113 (7.3%) |
| 75 Years and over | 113 (13.4%) | 127 (16.4%) |
Disability Class: Self-Care Difficulty
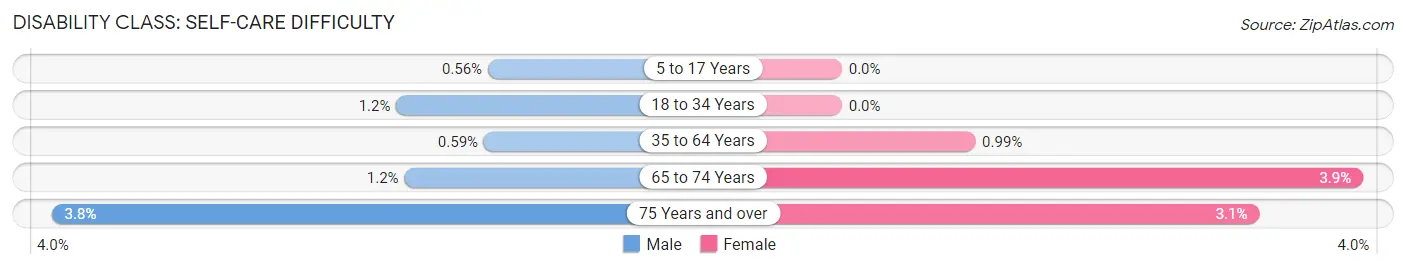
| Age Bracket | Male | Female |
| 5 to 17 Years | 13 (0.6%) | 0 (0.0%) |
| 18 to 34 Years | 20 (1.2%) | 0 (0.0%) |
| 35 to 64 Years | 25 (0.6%) | 49 (1.0%) |
| 65 to 74 Years | 16 (1.2%) | 60 (3.9%) |
| 75 Years and over | 32 (3.8%) | 24 (3.1%) |
Technology Access in Anthem
Computing Device Access in Anthem
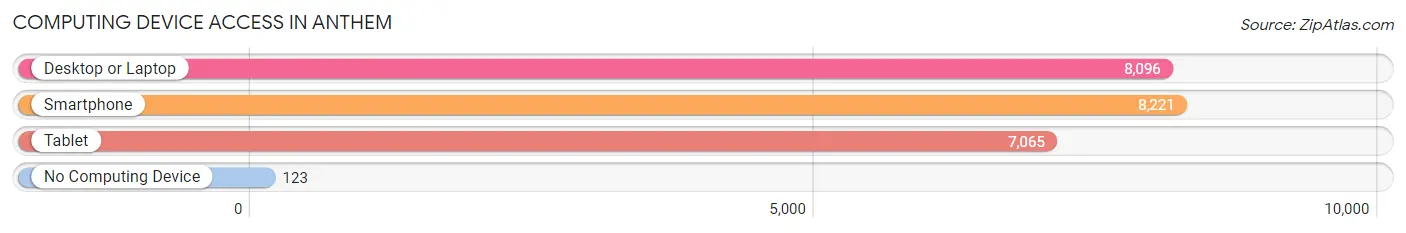
| Device Type | # Households | % Households |
| Desktop or Laptop | 8,096 | 94.4% |
| Smartphone | 8,221 | 95.8% |
| Tablet | 7,065 | 82.4% |
| No Computing Device | 123 | 1.4% |
| Total | 8,578 | 100.0% |
Internet Access in Anthem
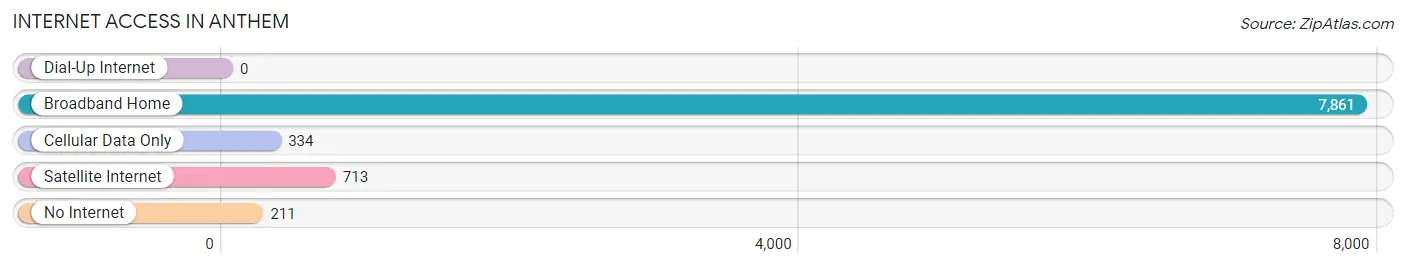
| Internet Type | # Households | % Households |
| Dial-Up Internet | 0 | 0.0% |
| Broadband Home | 7,861 | 91.6% |
| Cellular Data Only | 334 | 3.9% |
| Satellite Internet | 713 | 8.3% |
| No Internet | 211 | 2.5% |
| Total | 8,578 | 100.0% |
Anthem Summary
Anthem, Arizona is a census-designated place located in Maricopa County, Arizona. It is a master-planned community located about 30 miles north of downtown Phoenix. Anthem was developed by Del Webb in 1999 and is now home to over 30,000 people.
Geography
Anthem is located in the Sonoran Desert, at an elevation of 1,845 feet. It is bordered by the Gila River Indian Community to the east, New River to the north, and the Daisy Mountain Range to the west. The area is characterized by rolling hills, desert vegetation, and a variety of wildlife. The climate is hot and dry, with temperatures ranging from the mid-90s in the summer to the mid-50s in the winter.
Economy
Anthem is a major economic hub in the Phoenix metropolitan area. The city is home to several large employers, including Anthem Blue Cross and Blue Shield, Honeywell, and the Arizona State University West campus. The city also has a thriving retail sector, with several large shopping centers and a variety of restaurants and entertainment venues.
Demographics
As of the 2010 census, Anthem had a population of 21,700. The racial makeup of the city was 87.3% White, 4.2% African American, 0.7% Native American, 2.2% Asian, 0.1% Pacific Islander, 3.2% from other races, and 2.4% from two or more races. Hispanic or Latino of any race were 8.3% of the population.
The median income for a household in Anthem was $76,845, and the median income for a family was $86,945. The per capita income for the city was $35,945. About 4.3% of families and 5.7% of the population were below the poverty line, including 6.3% of those under age 18 and 4.2% of those age 65 or over.
Conclusion
Anthem, Arizona is a master-planned community located in Maricopa County, Arizona. It is home to over 30,000 people and is a major economic hub in the Phoenix metropolitan area. The city is characterized by rolling hills, desert vegetation, and a variety of wildlife. The population of Anthem is predominantly White, with a significant Hispanic or Latino population. The median income for a household in Anthem is significantly higher than the national average, and the city has a thriving retail sector.
Common Questions
What is Per Capita Income in Anthem?
Per Capita income in Anthem is $53,839.
What is the Median Family Income in Anthem?
Median Family Income in Anthem is $130,457.
What is the Median Household income in Anthem?
Median Household Income in Anthem is $113,294.
What is Income or Wage Gap in Anthem?
Income or Wage Gap in Anthem is 37.0%.
Women in Anthem earn 63.0 cents for every dollar earned by a man.
What is Inequality or Gini Index in Anthem?
Inequality or Gini Index in Anthem is 0.43.
What is the Total Population of Anthem?
Total Population of Anthem is 22,708.
What is the Total Male Population of Anthem?
Total Male Population of Anthem is 10,831.
What is the Total Female Population of Anthem?
Total Female Population of Anthem is 11,877.
What is the Ratio of Males per 100 Females in Anthem?
There are 91.19 Males per 100 Females in Anthem.
What is the Ratio of Females per 100 Males in Anthem?
There are 109.66 Females per 100 Males in Anthem.
What is the Median Population Age in Anthem?
Median Population Age in Anthem is 44.1 Years.
What is the Average Family Size in Anthem
Average Family Size in Anthem is 3.0 People.
What is the Average Household Size in Anthem
Average Household Size in Anthem is 2.6 People.
How Large is the Labor Force in Anthem?
There are 11,379 People in the Labor Forcein in Anthem.
What is the Percentage of People in the Labor Force in Anthem?
62.3% of People are in the Labor Force in Anthem.
What is the Unemployment Rate in Anthem?
Unemployment Rate in Anthem is 3.8%.