Rand, WV Map & Demographics
Rand Map
Rand Overview
$23,709
PER CAPITA INCOME
$44,702
AVG FAMILY INCOME
$37,230
AVG HOUSEHOLD INCOME
0.34
INEQUALITY / GINI INDEX
941
TOTAL POPULATION
466
MALE POPULATION
475
FEMALE POPULATION
98.11
MALES / 100 FEMALES
101.93
FEMALES / 100 MALES
50.0
MEDIAN AGE
2.9
AVG FAMILY SIZE
2.1
AVG HOUSEHOLD SIZE
365
LABOR FORCE [ PEOPLE ]
46.1%
PERCENT IN LABOR FORCE
4.9%
UNEMPLOYMENT RATE
Income in Rand
Income Overview in Rand
Per Capita Income in Rand is $23,709, while median incomes of families and households are $44,702 and $37,230 respectively.
| Characteristic | Number | Measure |
| Per Capita Income | 941 | $23,709 |
| Median Family Income | 257 | $44,702 |
| Mean Family Income | 257 | $56,981 |
| Median Household Income | 450 | $37,230 |
| Mean Household Income | 450 | $48,257 |
| Income Deficit | 257 | $0 |
| Wage / Income Gap (%) | 941 | 0.00% |
| Wage / Income Gap ($) | 941 | 100.00¢ per $1 |
| Gini / Inequality Index | 941 | 0.34 |
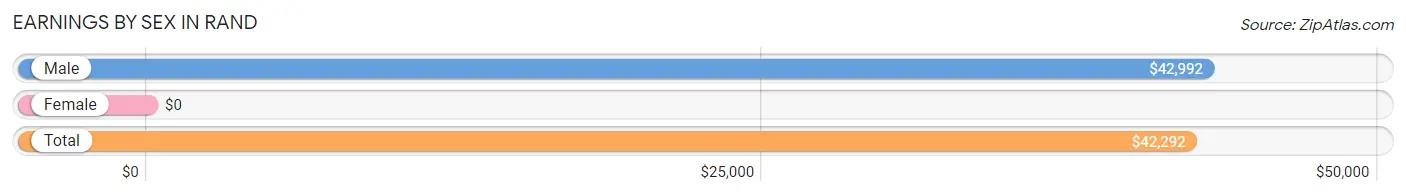
Earnings by Sex in Rand
| Sex | Number | Average Earnings |
| Male | 259 (66.9%) | $42,992 |
| Female | 128 (33.1%) | $0 |
| Total | 387 (100.0%) | $42,292 |
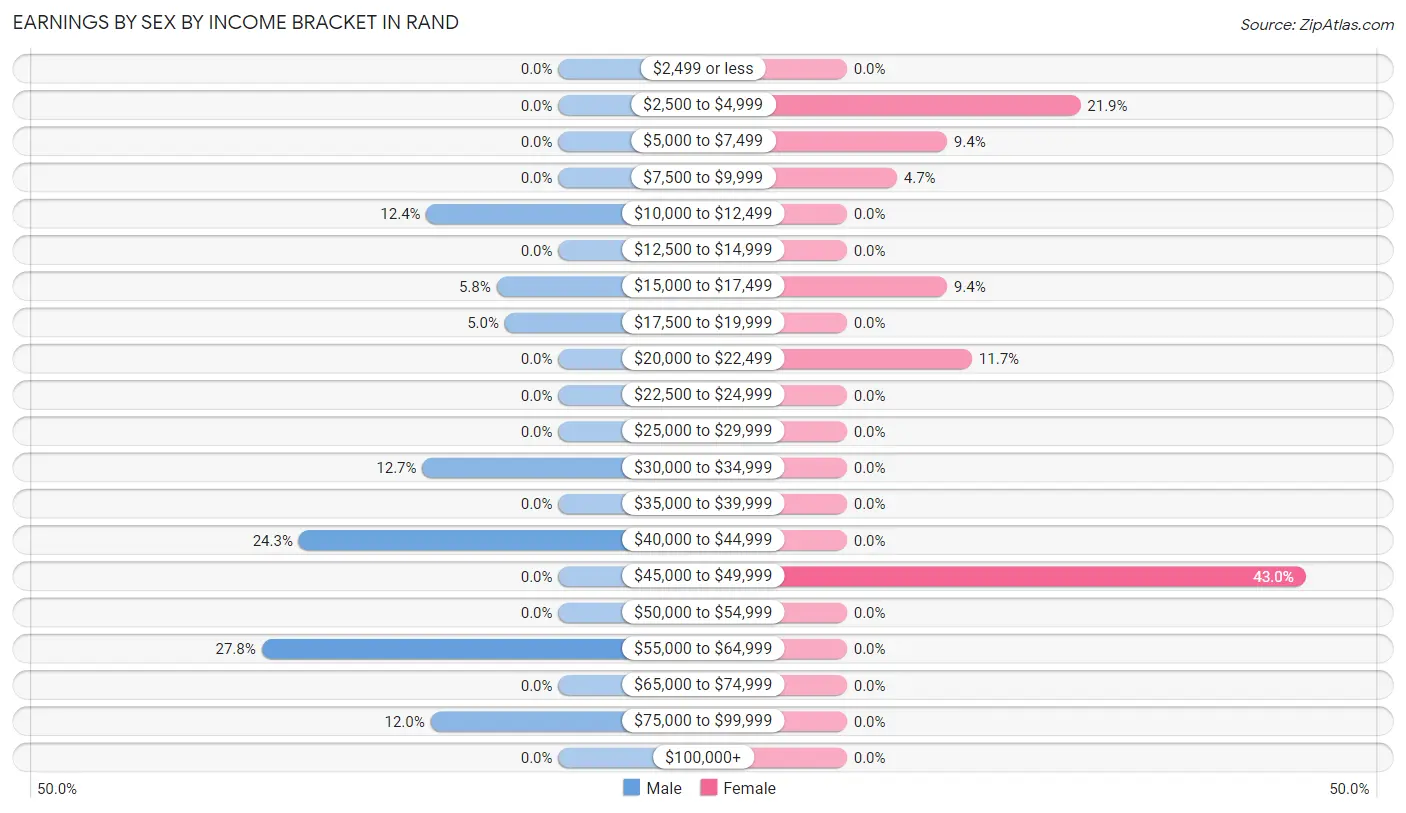
Earnings by Sex by Income Bracket in Rand
The most common earnings brackets in Rand are $55,000 to $64,999 for men (72 | 27.8%) and $45,000 to $49,999 for women (55 | 43.0%).
| Income | Male | Female |
| $2,499 or less | 0 (0.0%) | 0 (0.0%) |
| $2,500 to $4,999 | 0 (0.0%) | 28 (21.9%) |
| $5,000 to $7,499 | 0 (0.0%) | 12 (9.4%) |
| $7,500 to $9,999 | 0 (0.0%) | 6 (4.7%) |
| $10,000 to $12,499 | 32 (12.4%) | 0 (0.0%) |
| $12,500 to $14,999 | 0 (0.0%) | 0 (0.0%) |
| $15,000 to $17,499 | 15 (5.8%) | 12 (9.4%) |
| $17,500 to $19,999 | 13 (5.0%) | 0 (0.0%) |
| $20,000 to $22,499 | 0 (0.0%) | 15 (11.7%) |
| $22,500 to $24,999 | 0 (0.0%) | 0 (0.0%) |
| $25,000 to $29,999 | 0 (0.0%) | 0 (0.0%) |
| $30,000 to $34,999 | 33 (12.7%) | 0 (0.0%) |
| $35,000 to $39,999 | 0 (0.0%) | 0 (0.0%) |
| $40,000 to $44,999 | 63 (24.3%) | 0 (0.0%) |
| $45,000 to $49,999 | 0 (0.0%) | 55 (43.0%) |
| $50,000 to $54,999 | 0 (0.0%) | 0 (0.0%) |
| $55,000 to $64,999 | 72 (27.8%) | 0 (0.0%) |
| $65,000 to $74,999 | 0 (0.0%) | 0 (0.0%) |
| $75,000 to $99,999 | 31 (12.0%) | 0 (0.0%) |
| $100,000+ | 0 (0.0%) | 0 (0.0%) |
| Total | 259 (100.0%) | 128 (100.0%) |
Earnings by Sex by Educational Attainment in Rand
| Educational Attainment | Male Income | Female Income |
| Less than High School | - | - |
| High School Diploma | - | - |
| College or Associate's Degree | - | - |
| Bachelor's Degree | - | - |
| Graduate Degree | - | - |
| Total | $42,992 | $0 |
Family Income in Rand
Family Income Brackets in Rand
According to the Rand family income data, there are 67 families falling into the $35,000 to $49,999 income range, which is the most common income bracket and makes up 26.1% of all families.
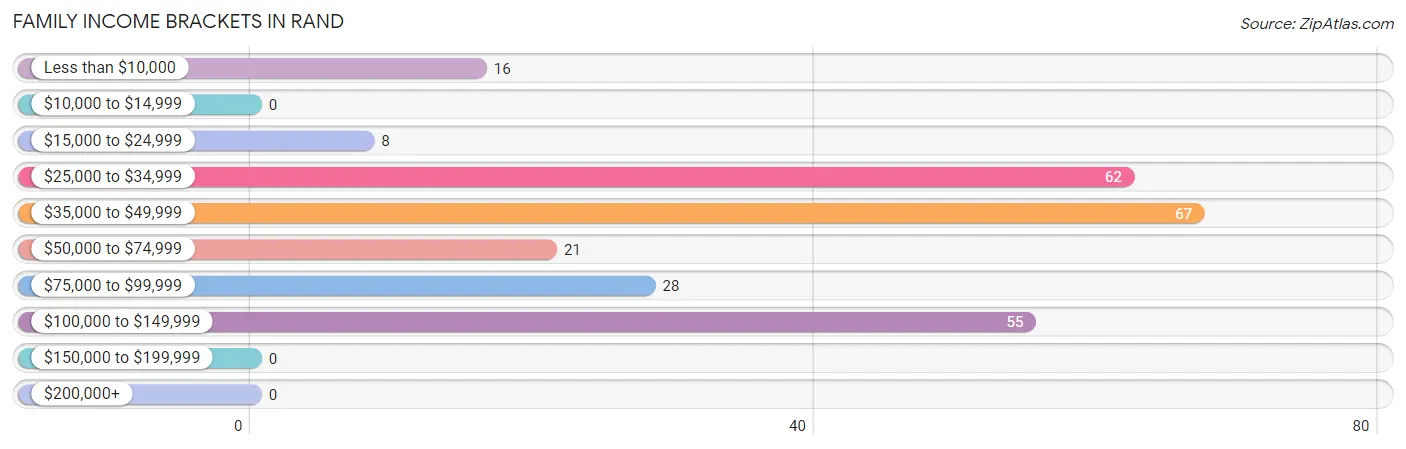
| Income Bracket | # Families | % Families |
| Less than $10,000 | 16 | 6.2% |
| $10,000 to $14,999 | 0 | 0.0% |
| $15,000 to $24,999 | 8 | 3.1% |
| $25,000 to $34,999 | 62 | 24.1% |
| $35,000 to $49,999 | 67 | 26.1% |
| $50,000 to $74,999 | 21 | 8.2% |
| $75,000 to $99,999 | 28 | 10.9% |
| $100,000 to $149,999 | 55 | 21.4% |
| $150,000 to $199,999 | 0 | 0.0% |
| $200,000+ | 0 | 0.0% |
Family Income by Famaliy Size in Rand
2-person families (168 | 65.4%) account for the highest median family income in Rand with $46,591 per family, while 2-person families (168 | 65.4%) have the highest median income of $23,296 per family member.
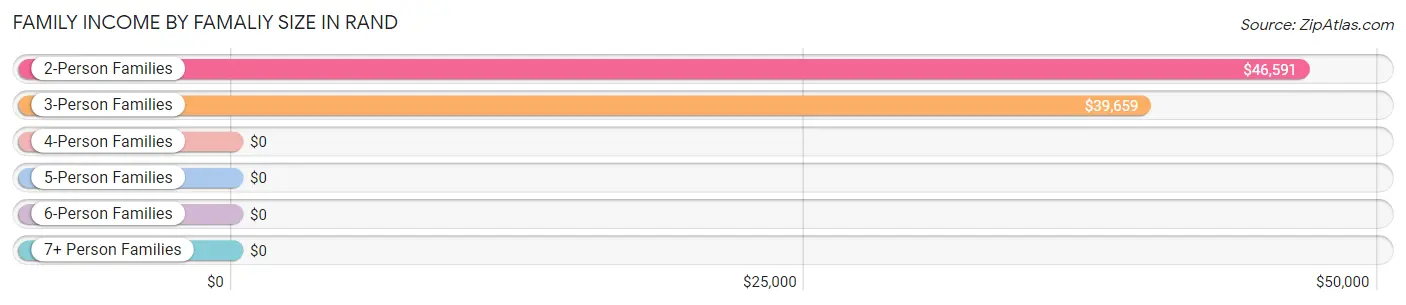
| Income Bracket | # Families | Median Income |
| 2-Person Families | 168 (65.4%) | $46,591 |
| 3-Person Families | 45 (17.5%) | $39,659 |
| 4-Person Families | 0 (0.0%) | $0 |
| 5-Person Families | 28 (10.9%) | $0 |
| 6-Person Families | 4 (1.6%) | $0 |
| 7+ Person Families | 12 (4.7%) | $0 |
| Total | 257 (100.0%) | $44,702 |
Family Income by Number of Earners in Rand
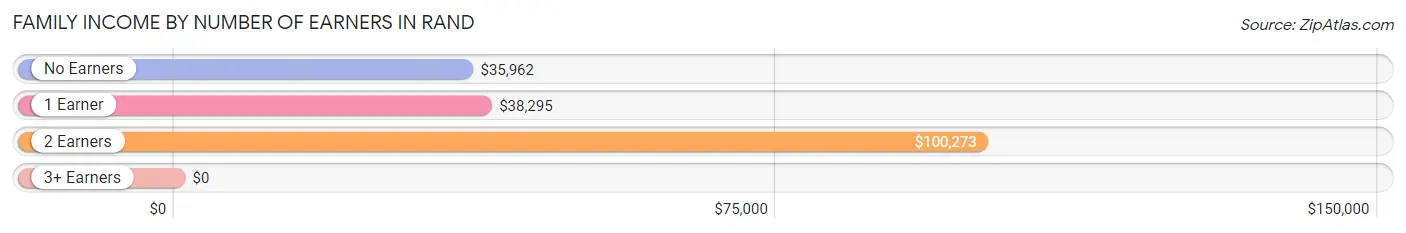
| Number of Earners | # Families | Median Income |
| No Earners | 62 (24.1%) | $35,962 |
| 1 Earner | 97 (37.7%) | $38,295 |
| 2 Earners | 98 (38.1%) | $100,273 |
| 3+ Earners | 0 (0.0%) | $0 |
| Total | 257 (100.0%) | $44,702 |
Household Income in Rand
Household Income Brackets in Rand
With 93 households falling in the category, the $25,000 to $34,999 income range is the most frequent in Rand, accounting for 20.7% of all households.
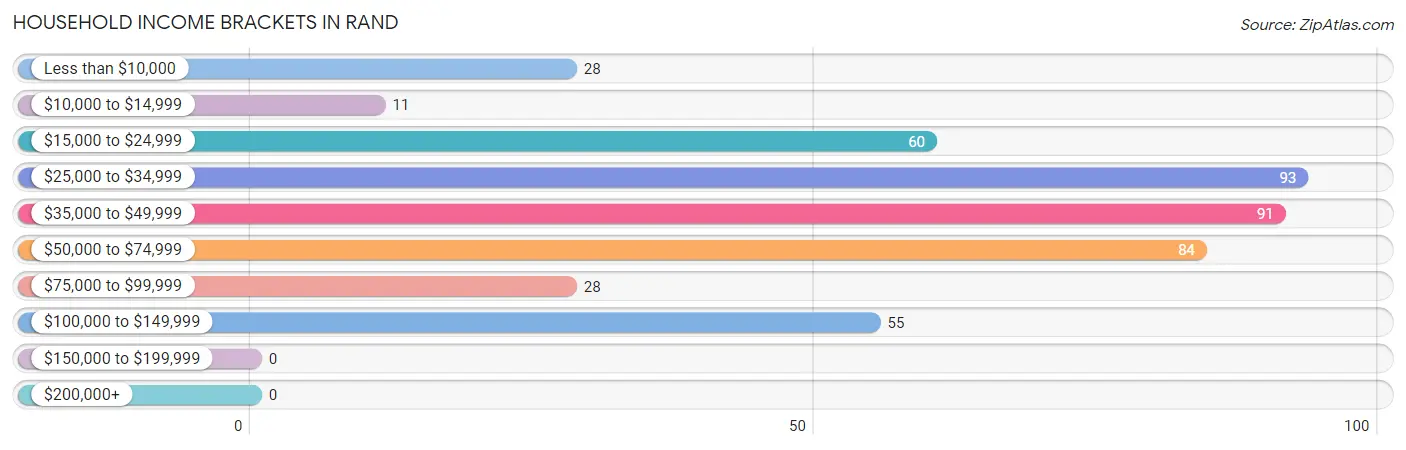
| Income Bracket | # Households | % Households |
| Less than $10,000 | 28 | 6.2% |
| $10,000 to $14,999 | 11 | 2.4% |
| $15,000 to $24,999 | 60 | 13.3% |
| $25,000 to $34,999 | 93 | 20.7% |
| $35,000 to $49,999 | 91 | 20.2% |
| $50,000 to $74,999 | 84 | 18.7% |
| $75,000 to $99,999 | 28 | 6.2% |
| $100,000 to $149,999 | 55 | 12.2% |
| $150,000 to $199,999 | 0 | 0.0% |
| $200,000+ | 0 | 0.0% |
Household Income by Householder Age in Rand
The median household income in Rand is $37,230, with the highest median household income of $45,000 found in the 45 to 64 years age bracket for the primary householder. A total of 238 households (52.9%) fall into this category.
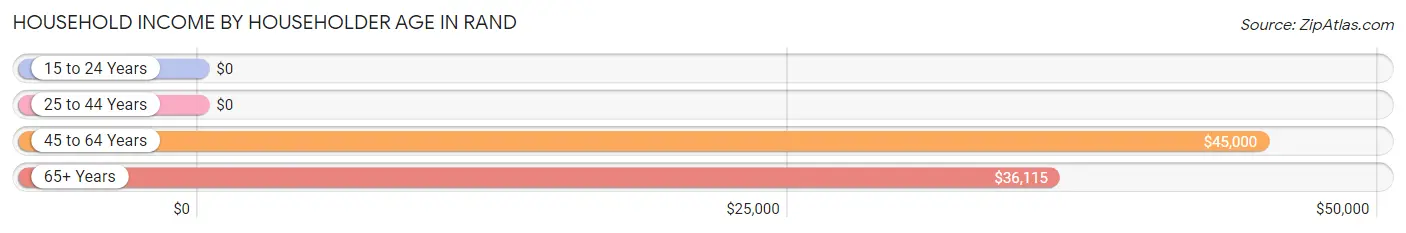
| Income Bracket | # Households | Median Income |
| 15 to 24 Years | 0 (0.0%) | $0 |
| 25 to 44 Years | 65 (14.4%) | $0 |
| 45 to 64 Years | 238 (52.9%) | $45,000 |
| 65+ Years | 147 (32.7%) | $36,115 |
| Total | 450 (100.0%) | $37,230 |
Poverty in Rand
Income Below Poverty by Sex and Age in Rand
With 6.0% poverty level for males and 27.6% for females among the residents of Rand, 16 and 17 year old males and under 5 year old females are the most vulnerable to poverty, with 6 males (100.0%) and 21 females (100.0%) in their respective age groups living below the poverty level.
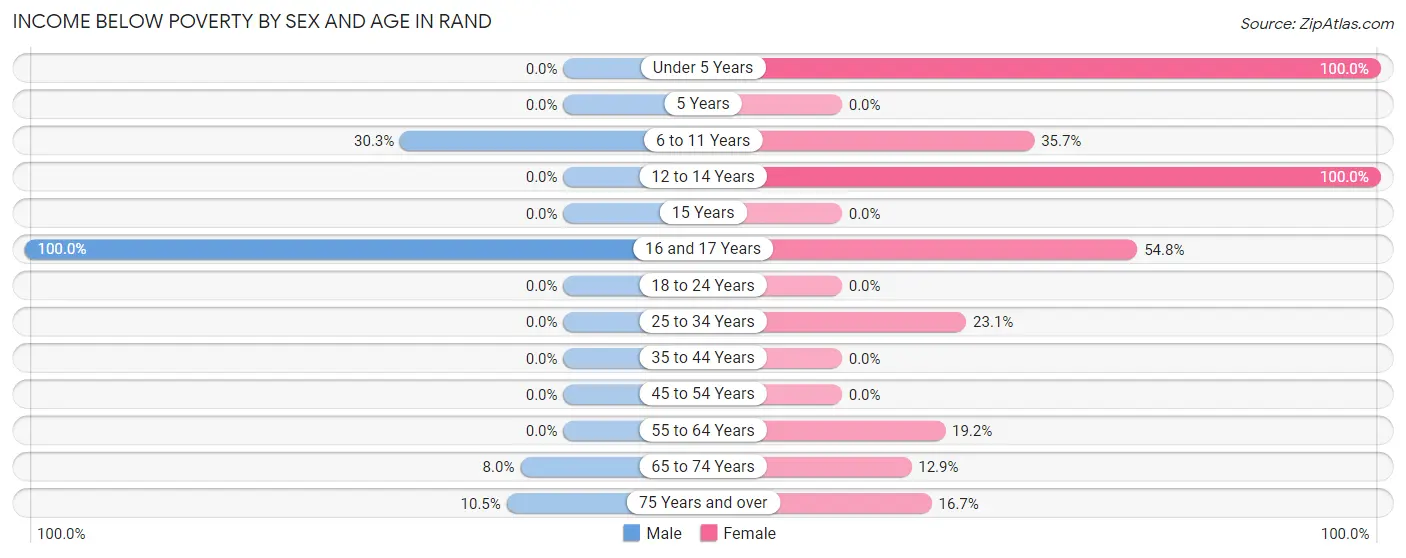
| Age Bracket | Male | Female |
| Under 5 Years | 0 (0.0%) | 21 (100.0%) |
| 5 Years | 0 (0.0%) | 0 (0.0%) |
| 6 to 11 Years | 10 (30.3%) | 15 (35.7%) |
| 12 to 14 Years | 0 (0.0%) | 31 (100.0%) |
| 15 Years | 0 (0.0%) | 0 (0.0%) |
| 16 and 17 Years | 6 (100.0%) | 17 (54.8%) |
| 18 to 24 Years | 0 (0.0%) | 0 (0.0%) |
| 25 to 34 Years | 0 (0.0%) | 12 (23.1%) |
| 35 to 44 Years | 0 (0.0%) | 0 (0.0%) |
| 45 to 54 Years | 0 (0.0%) | 0 (0.0%) |
| 55 to 64 Years | 0 (0.0%) | 23 (19.2%) |
| 65 to 74 Years | 4 (8.0%) | 4 (12.9%) |
| 75 Years and over | 8 (10.5%) | 8 (16.7%) |
| Total | 28 (6.0%) | 131 (27.6%) |
Income Above Poverty by Sex and Age in Rand
According to the poverty statistics in Rand, males aged 12 to 14 years and females aged 35 to 44 years are the age groups that are most secure financially, with 100.0% of males and 100.0% of females in these age groups living above the poverty line.
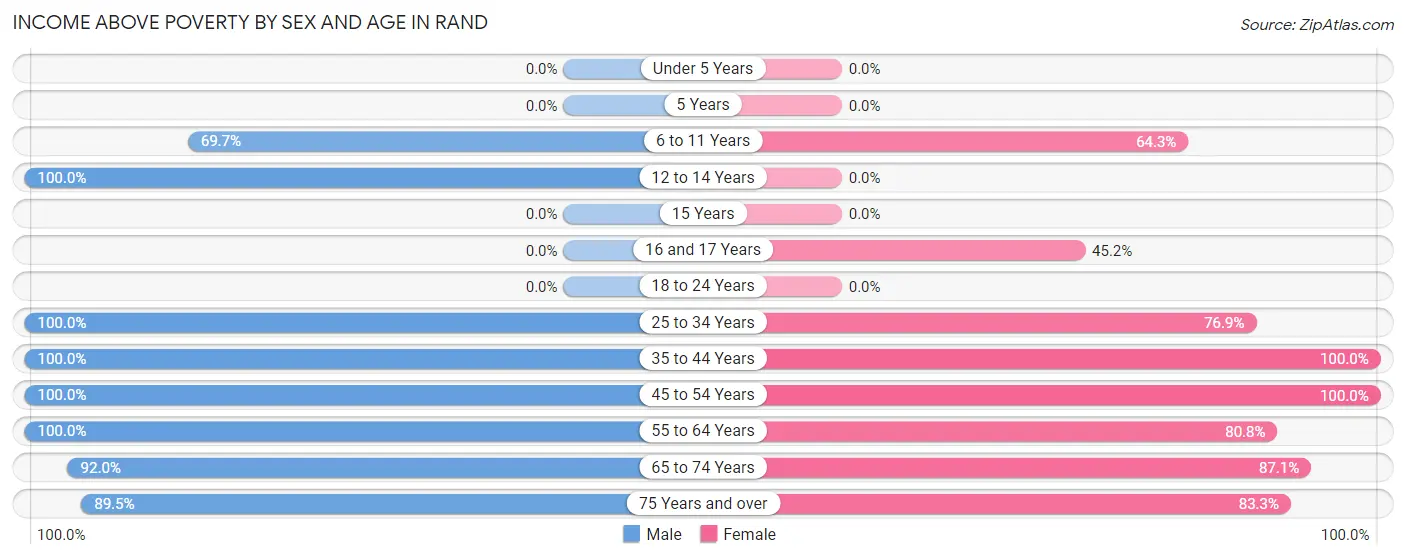
| Age Bracket | Male | Female |
| Under 5 Years | 0 (0.0%) | 0 (0.0%) |
| 5 Years | 0 (0.0%) | 0 (0.0%) |
| 6 to 11 Years | 23 (69.7%) | 27 (64.3%) |
| 12 to 14 Years | 23 (100.0%) | 0 (0.0%) |
| 15 Years | 0 (0.0%) | 0 (0.0%) |
| 16 and 17 Years | 0 (0.0%) | 14 (45.2%) |
| 18 to 24 Years | 0 (0.0%) | 0 (0.0%) |
| 25 to 34 Years | 55 (100.0%) | 40 (76.9%) |
| 35 to 44 Years | 31 (100.0%) | 15 (100.0%) |
| 45 to 54 Years | 109 (100.0%) | 84 (100.0%) |
| 55 to 64 Years | 83 (100.0%) | 97 (80.8%) |
| 65 to 74 Years | 46 (92.0%) | 27 (87.1%) |
| 75 Years and over | 68 (89.5%) | 40 (83.3%) |
| Total | 438 (94.0%) | 344 (72.4%) |
Income Below Poverty Among Married-Couple Families in Rand
The poverty statistics for married-couple families in Rand show that 5.8% or 12 of the total 207 families live below the poverty line. Families with 3 or 4 children have the highest poverty rate of 12.5%, comprising of 4 families. On the other hand, families with 1 or 2 children have the lowest poverty rate of 0.0%, which includes 0 families.
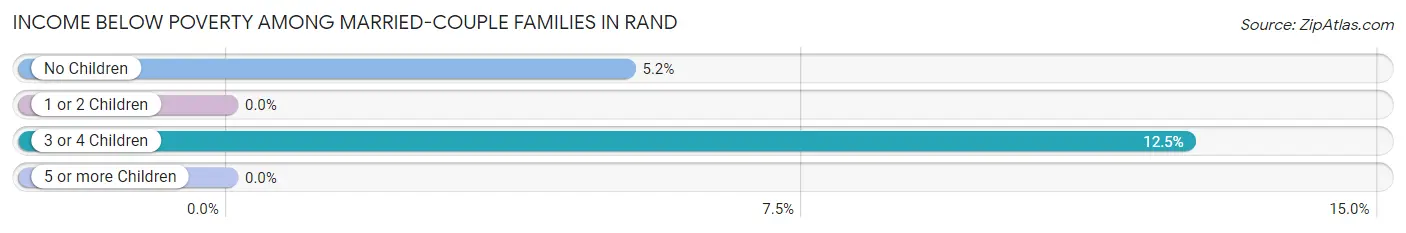
| Children | Above Poverty | Below Poverty |
| No Children | 146 (94.8%) | 8 (5.2%) |
| 1 or 2 Children | 21 (100.0%) | 0 (0.0%) |
| 3 or 4 Children | 28 (87.5%) | 4 (12.5%) |
| 5 or more Children | 0 (0.0%) | 0 (0.0%) |
| Total | 195 (94.2%) | 12 (5.8%) |
Income Below Poverty Among Single-Parent Households in Rand
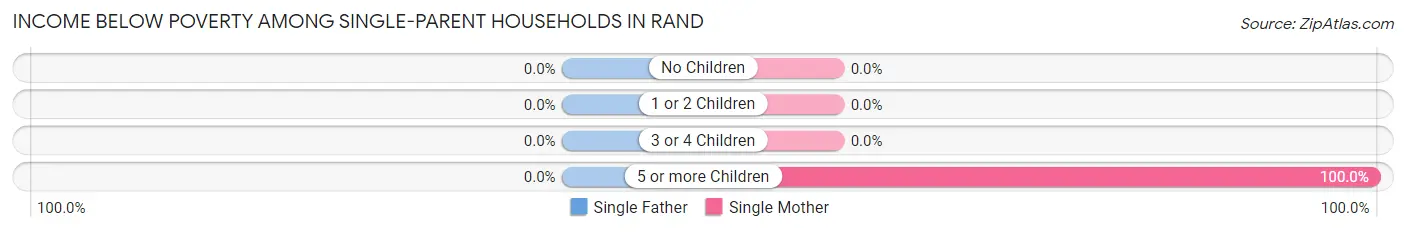
| Children | Single Father | Single Mother |
| No Children | 0 (0.0%) | 0 (0.0%) |
| 1 or 2 Children | 0 (0.0%) | 0 (0.0%) |
| 3 or 4 Children | 0 (0.0%) | 0 (0.0%) |
| 5 or more Children | 0 (0.0%) | 12 (100.0%) |
| Total | 0 (0.0%) | 12 (31.6%) |
Income Below Poverty Among Married-Couple vs Single-Parent Households in Rand
The poverty data for Rand shows that 12 of the married-couple family households (5.8%) and 12 of the single-parent households (24.0%) are living below the poverty level. Within the married-couple family households, those with 3 or 4 children have the highest poverty rate, with 4 households (12.5%) falling below the poverty line. Among the single-parent households, those with 5 or more children have the highest poverty rate, with 12 household (100.0%) living below poverty.
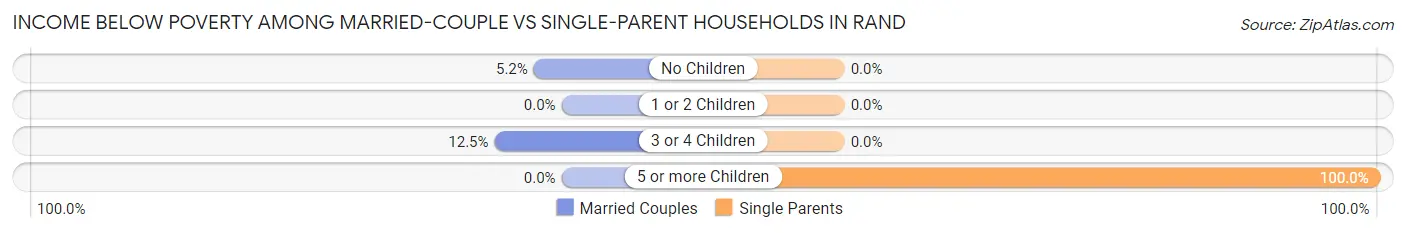
| Children | Married-Couple Families | Single-Parent Households |
| No Children | 8 (5.2%) | 0 (0.0%) |
| 1 or 2 Children | 0 (0.0%) | 0 (0.0%) |
| 3 or 4 Children | 4 (12.5%) | 0 (0.0%) |
| 5 or more Children | 0 (0.0%) | 12 (100.0%) |
| Total | 12 (5.8%) | 12 (24.0%) |
Race in Rand
The most populous races in Rand are White / Caucasian (513 | 54.5%), Black / African American (315 | 33.5%), and Two or more Races (113 | 12.0%).
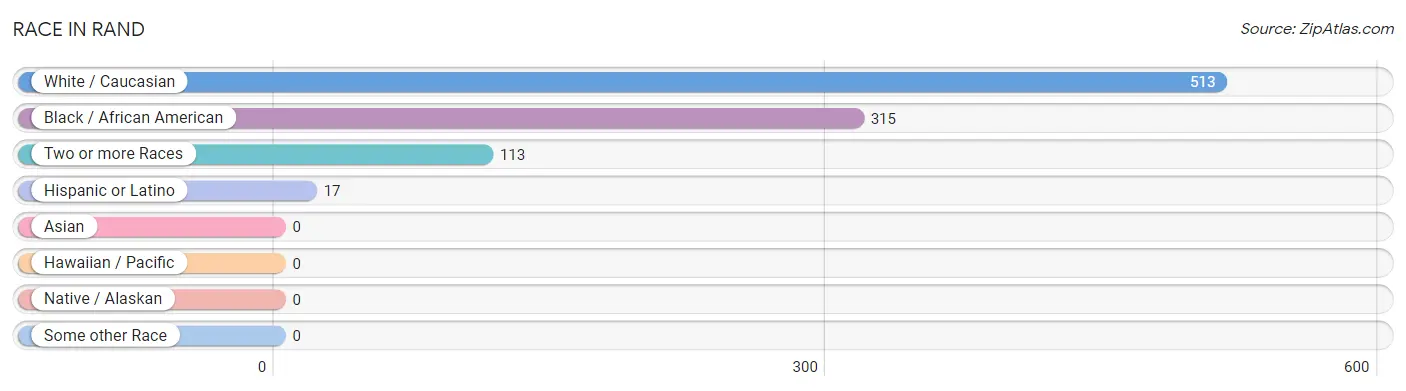
| Race | # Population | % Population |
| Asian | 0 | 0.0% |
| Black / African American | 315 | 33.5% |
| Hawaiian / Pacific | 0 | 0.0% |
| Hispanic or Latino | 17 | 1.8% |
| Native / Alaskan | 0 | 0.0% |
| White / Caucasian | 513 | 54.5% |
| Two or more Races | 113 | 12.0% |
| Some other Race | 0 | 0.0% |
| Total | 941 | 100.0% |
Ancestry in Rand
The most populous ancestries reported in Rand are Irish (148 | 15.7%), German (79 | 8.4%), Belgian (41 | 4.4%), English (41 | 4.4%), and Italian (41 | 4.4%), together accounting for 37.2% of all Rand residents.
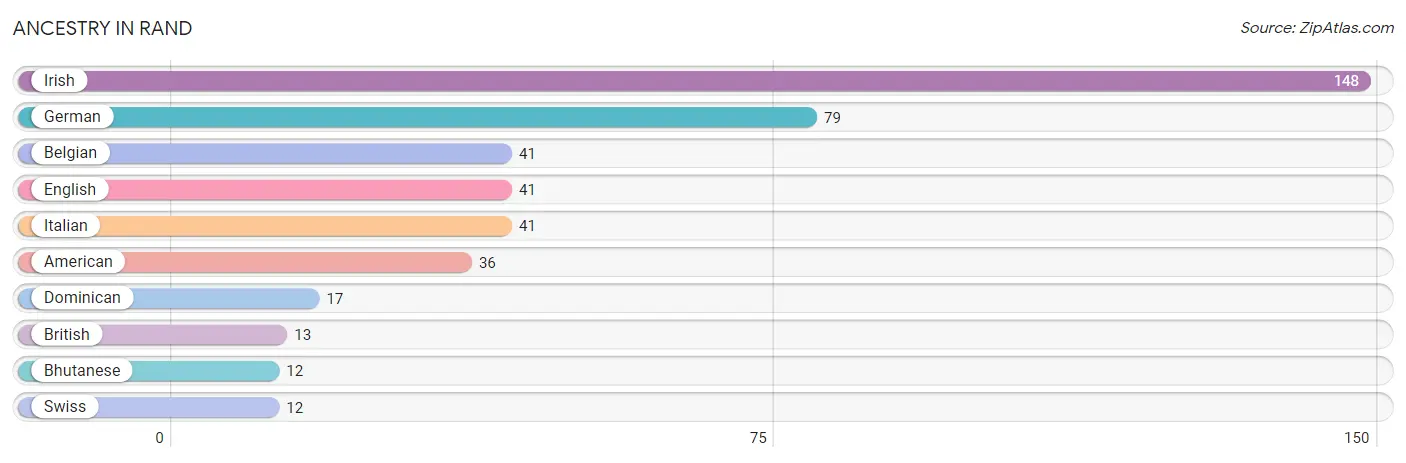
| Ancestry | # Population | % Population |
| American | 36 | 3.8% |
| Belgian | 41 | 4.4% |
| Bhutanese | 12 | 1.3% |
| British | 13 | 1.4% |
| Dominican | 17 | 1.8% |
| English | 41 | 4.4% |
| German | 79 | 8.4% |
| Irish | 148 | 15.7% |
| Italian | 41 | 4.4% |
| Swiss | 12 | 1.3% | View All 10 Rows |
Immigrants in Rand

| Immigration Origin | # Population | % Population | View All 0 Rows |
Sex and Age in Rand
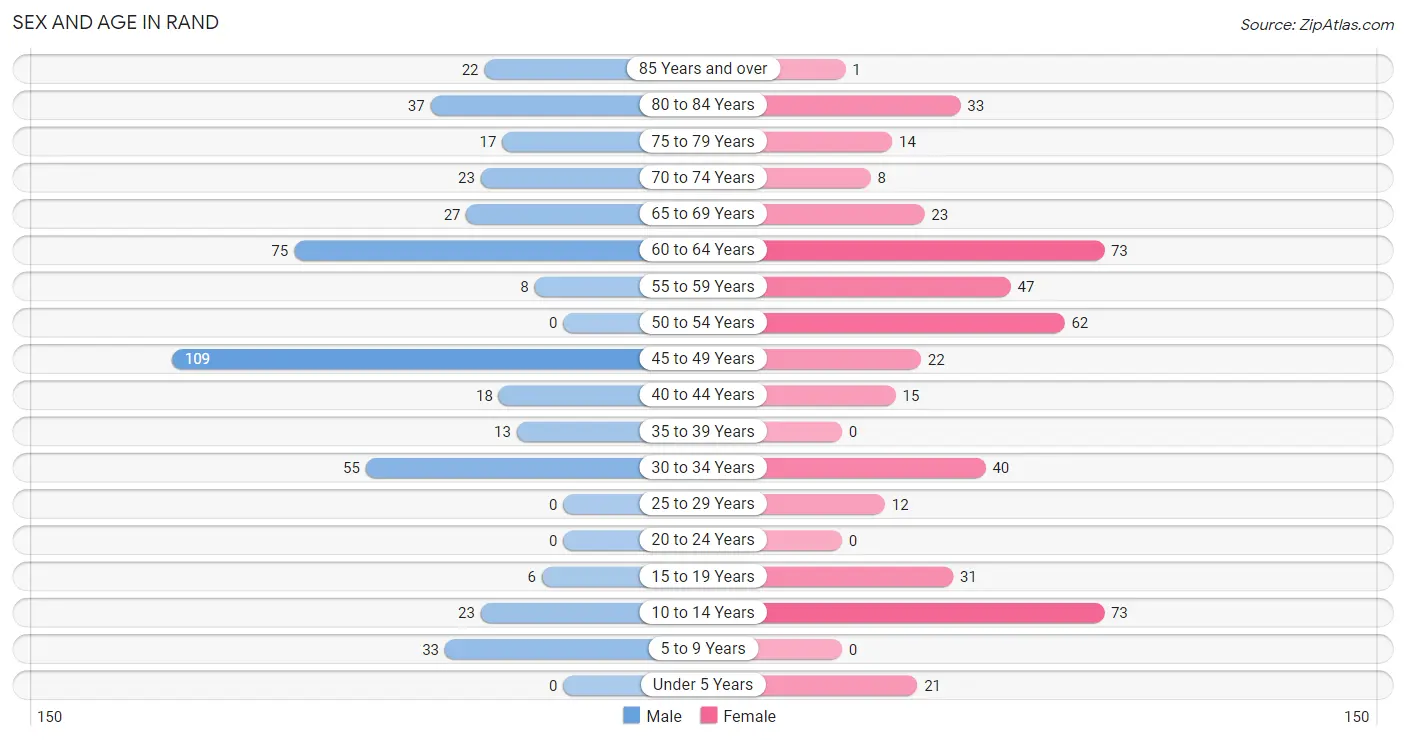
Sex and Age in Rand
The most populous age groups in Rand are 45 to 49 Years (109 | 23.4%) for men and 10 to 14 Years (73 | 15.4%) for women.
| Age Bracket | Male | Female |
| Under 5 Years | 0 (0.0%) | 21 (4.4%) |
| 5 to 9 Years | 33 (7.1%) | 0 (0.0%) |
| 10 to 14 Years | 23 (4.9%) | 73 (15.4%) |
| 15 to 19 Years | 6 (1.3%) | 31 (6.5%) |
| 20 to 24 Years | 0 (0.0%) | 0 (0.0%) |
| 25 to 29 Years | 0 (0.0%) | 12 (2.5%) |
| 30 to 34 Years | 55 (11.8%) | 40 (8.4%) |
| 35 to 39 Years | 13 (2.8%) | 0 (0.0%) |
| 40 to 44 Years | 18 (3.9%) | 15 (3.2%) |
| 45 to 49 Years | 109 (23.4%) | 22 (4.6%) |
| 50 to 54 Years | 0 (0.0%) | 62 (13.1%) |
| 55 to 59 Years | 8 (1.7%) | 47 (9.9%) |
| 60 to 64 Years | 75 (16.1%) | 73 (15.4%) |
| 65 to 69 Years | 27 (5.8%) | 23 (4.8%) |
| 70 to 74 Years | 23 (4.9%) | 8 (1.7%) |
| 75 to 79 Years | 17 (3.6%) | 14 (2.9%) |
| 80 to 84 Years | 37 (7.9%) | 33 (7.0%) |
| 85 Years and over | 22 (4.7%) | 1 (0.2%) |
| Total | 466 (100.0%) | 475 (100.0%) |
Families and Households in Rand
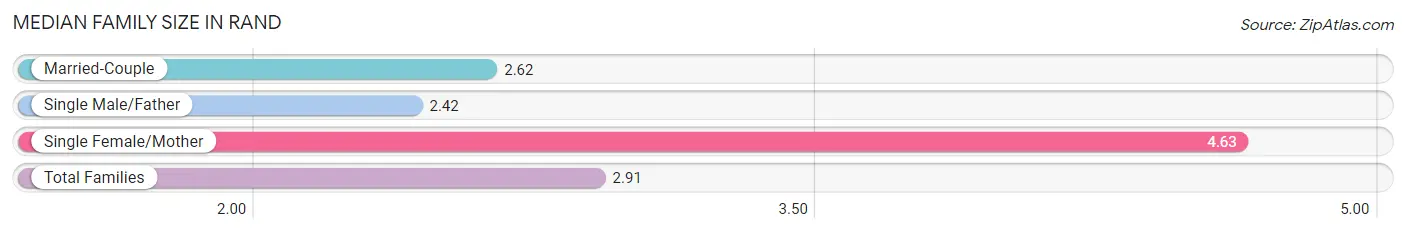
Median Family Size in Rand
The median family size in Rand is 2.91 persons per family, with single female/mother families (38 | 14.8%) accounting for the largest median family size of 4.63 persons per family. On the other hand, single male/father families (12 | 4.7%) represent the smallest median family size with 2.42 persons per family.
| Family Type | # Families | Family Size |
| Married-Couple | 207 (80.5%) | 2.62 |
| Single Male/Father | 12 (4.7%) | 2.42 |
| Single Female/Mother | 38 (14.8%) | 4.63 |
| Total Families | 257 (100.0%) | 2.91 |
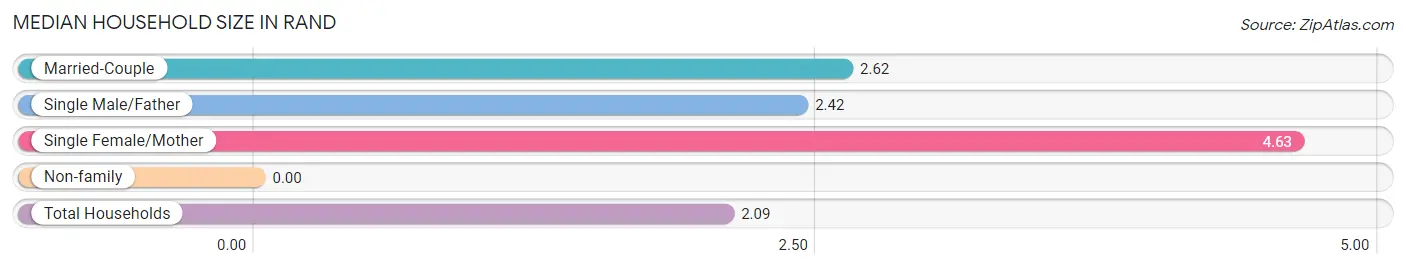
Median Household Size in Rand
| Household Type | # Households | Household Size |
| Married-Couple | 207 (46.0%) | 2.62 |
| Single Male/Father | 12 (2.7%) | 2.42 |
| Single Female/Mother | 38 (8.4%) | 4.63 |
| Non-family | 193 (42.9%) | - |
| Total Households | 450 (100.0%) | 2.09 |
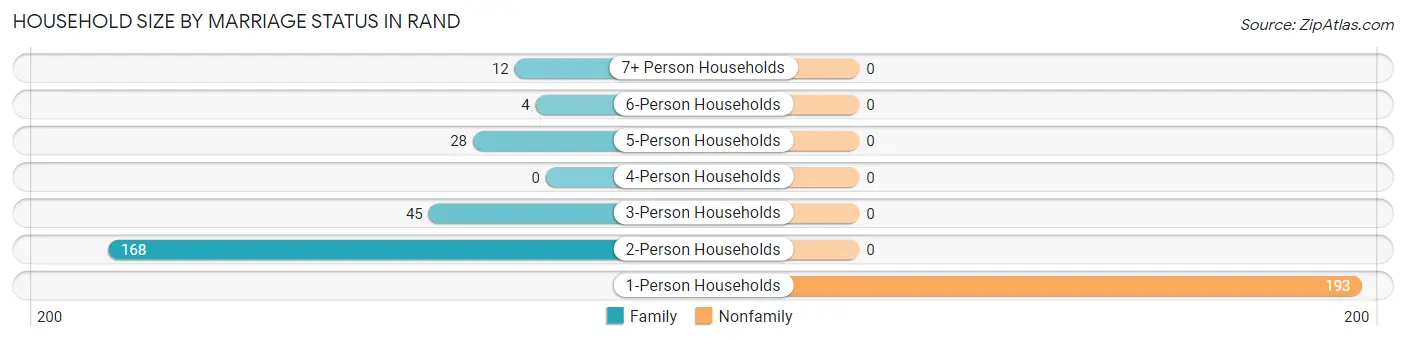
Household Size by Marriage Status in Rand
Out of a total of 450 households in Rand, 257 (57.1%) are family households, while 193 (42.9%) are nonfamily households. The most numerous type of family households are 2-person households, comprising 168, and the most common type of nonfamily households are 1-person households, comprising 193.
| Household Size | Family Households | Nonfamily Households |
| 1-Person Households | - | 193 (42.9%) |
| 2-Person Households | 168 (37.3%) | 0 (0.0%) |
| 3-Person Households | 45 (10.0%) | 0 (0.0%) |
| 4-Person Households | 0 (0.0%) | 0 (0.0%) |
| 5-Person Households | 28 (6.2%) | 0 (0.0%) |
| 6-Person Households | 4 (0.9%) | 0 (0.0%) |
| 7+ Person Households | 12 (2.7%) | 0 (0.0%) |
| Total | 257 (57.1%) | 193 (42.9%) |
Female Fertility in Rand
Fertility by Age in Rand
| Age Bracket | Women with Births | Births / 1,000 Women |
| 15 to 19 years | 0 (0.0%) | 0.0 |
| 20 to 34 years | 0 (0.0%) | 0.0 |
| 35 to 50 years | 0 (0.0%) | 0.0 |
| Total | 0 (0.0%) | 0.0 |
Fertility by Age by Marriage Status in Rand
| Age Bracket | Married | Unmarried |
| 15 to 19 years | 0 (0.0%) | 0 (0.0%) |
| 20 to 34 years | 0 (0.0%) | 0 (0.0%) |
| 35 to 50 years | 0 (0.0%) | 0 (0.0%) |
| Total | 0 (0.0%) | 0 (0.0%) |
Fertility by Education in Rand
| Educational Attainment | Women with Births | Births / 1,000 Women |
| Less than High School | 0 (0.0%) | 0.0 |
| High School Diploma | 0 (0.0%) | 0.0 |
| College or Associate's Degree | 0 (0.0%) | 0.0 |
| Bachelor's Degree | 0 (0.0%) | 0.0 |
| Graduate Degree | 0 (0.0%) | 0.0 |
| Total | 0 (0.0%) | 0.0 |
Fertility by Education by Marriage Status in Rand
| Educational Attainment | Married | Unmarried |
| Less than High School | 0 (0.0%) | 0 (0.0%) |
| High School Diploma | 0 (0.0%) | 0 (0.0%) |
| College or Associate's Degree | 0 (0.0%) | 0 (0.0%) |
| Bachelor's Degree | 0 (0.0%) | 0 (0.0%) |
| Graduate Degree | 0 (0.0%) | 0 (0.0%) |
| Total | 0 (0.0%) | 0 (0.0%) |
Employment Characteristics in Rand
Employment by Class of Employer in Rand
Among the 339 employed individuals in Rand, private company employees (240 | 70.8%), state government employees (93 | 27.4%), and self-employed (not incorporated) (6 | 1.8%) make up the most common classes of employment.
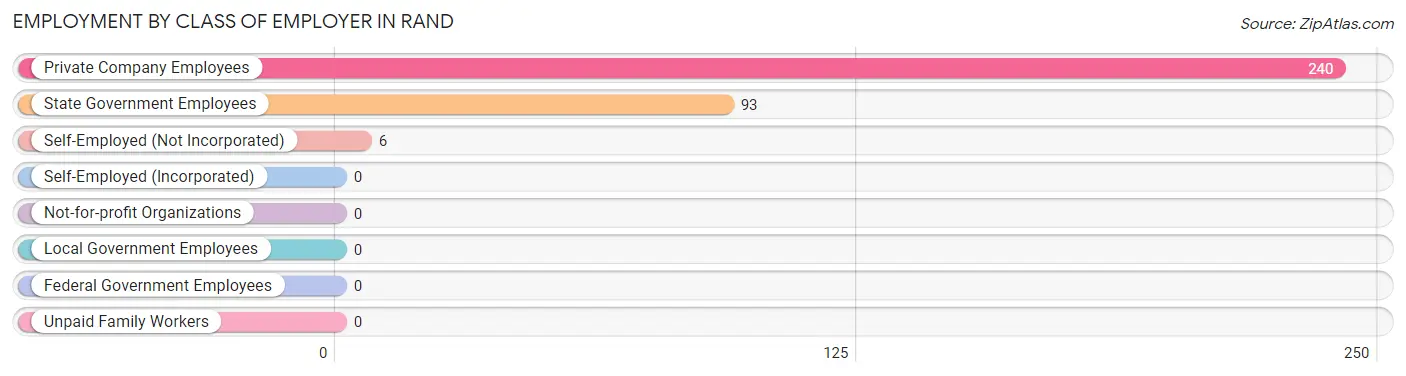
| Employer Class | # Employees | % Employees |
| Private Company Employees | 240 | 70.8% |
| Self-Employed (Incorporated) | 0 | 0.0% |
| Self-Employed (Not Incorporated) | 6 | 1.8% |
| Not-for-profit Organizations | 0 | 0.0% |
| Local Government Employees | 0 | 0.0% |
| State Government Employees | 93 | 27.4% |
| Federal Government Employees | 0 | 0.0% |
| Unpaid Family Workers | 0 | 0.0% |
| Total | 339 | 100.0% |
Employment Status by Age in Rand
According to the labor force statistics for Rand, out of the total population over 16 years of age (791), 46.1% or 365 individuals are in the labor force, with 4.9% or 18 of them unemployed. The age group with the highest labor force participation rate is 25 to 29 years, with 100.0% or 12 individuals in the labor force. Within the labor force, the 35 to 44 years age range has the highest percentage of unemployed individuals, with 58.1% or 18 of them being unemployed.
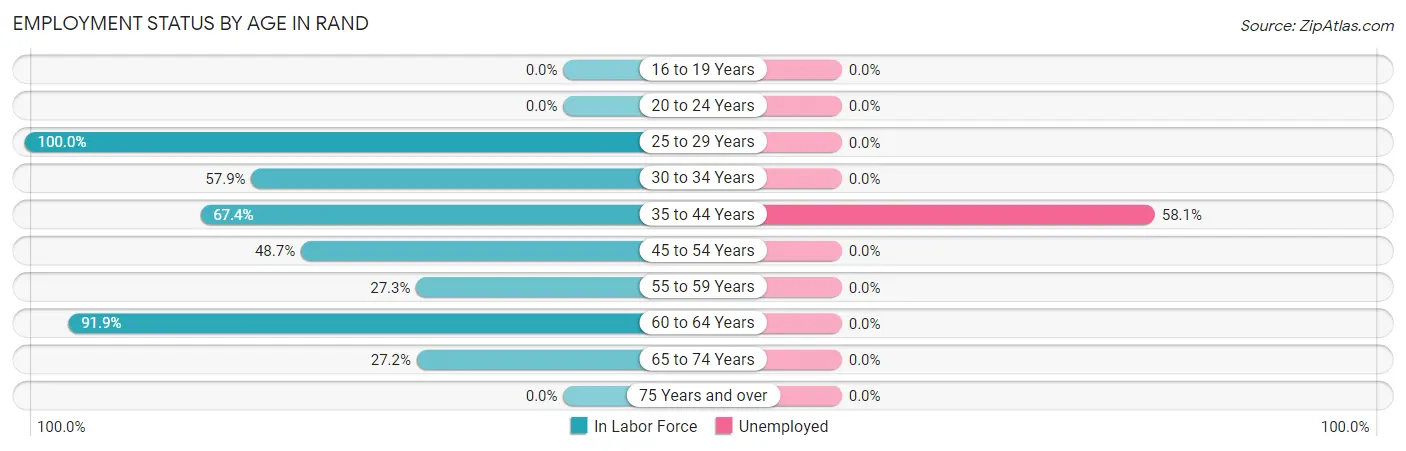
| Age Bracket | In Labor Force | Unemployed |
| 16 to 19 Years | 0 (0.0%) | 0 (0.0%) |
| 20 to 24 Years | 0 (0.0%) | 0 (0.0%) |
| 25 to 29 Years | 12 (100.0%) | 0 (0.0%) |
| 30 to 34 Years | 55 (57.9%) | 0 (0.0%) |
| 35 to 44 Years | 31 (67.4%) | 18 (58.1%) |
| 45 to 54 Years | 94 (48.7%) | 0 (0.0%) |
| 55 to 59 Years | 15 (27.3%) | 0 (0.0%) |
| 60 to 64 Years | 136 (91.9%) | 0 (0.0%) |
| 65 to 74 Years | 22 (27.2%) | 0 (0.0%) |
| 75 Years and over | 0 (0.0%) | 0 (0.0%) |
| Total | 365 (46.1%) | 18 (4.9%) |
Employment Status by Educational Attainment in Rand
According to labor force statistics for Rand, 62.5% of individuals (343) out of the total population between 25 and 64 years of age (549) are in the labor force, with 5.2% or 18 of them being unemployed. The group with the highest labor force participation rate are those with the educational attainment of bachelor's degree or higher, with 100.0% or 89 individuals in the labor force. Within the labor force, individuals with bachelor's degree or higher education have the highest percentage of unemployment, with 20.2% or 18 of them being unemployed.
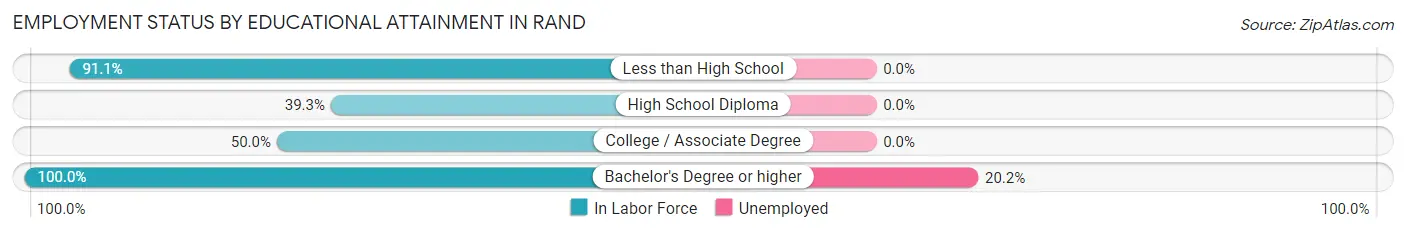
| Educational Attainment | In Labor Force | Unemployed |
| Less than High School | 113 (91.1%) | 0 (0.0%) |
| High School Diploma | 99 (39.3%) | 0 (0.0%) |
| College / Associate Degree | 42 (50.0%) | 0 (0.0%) |
| Bachelor's Degree or higher | 89 (100.0%) | 18 (20.2%) |
| Total | 343 (62.5%) | 29 (5.2%) |
Employment Occupations by Sex in Rand
Management, Business, Science and Arts Occupations
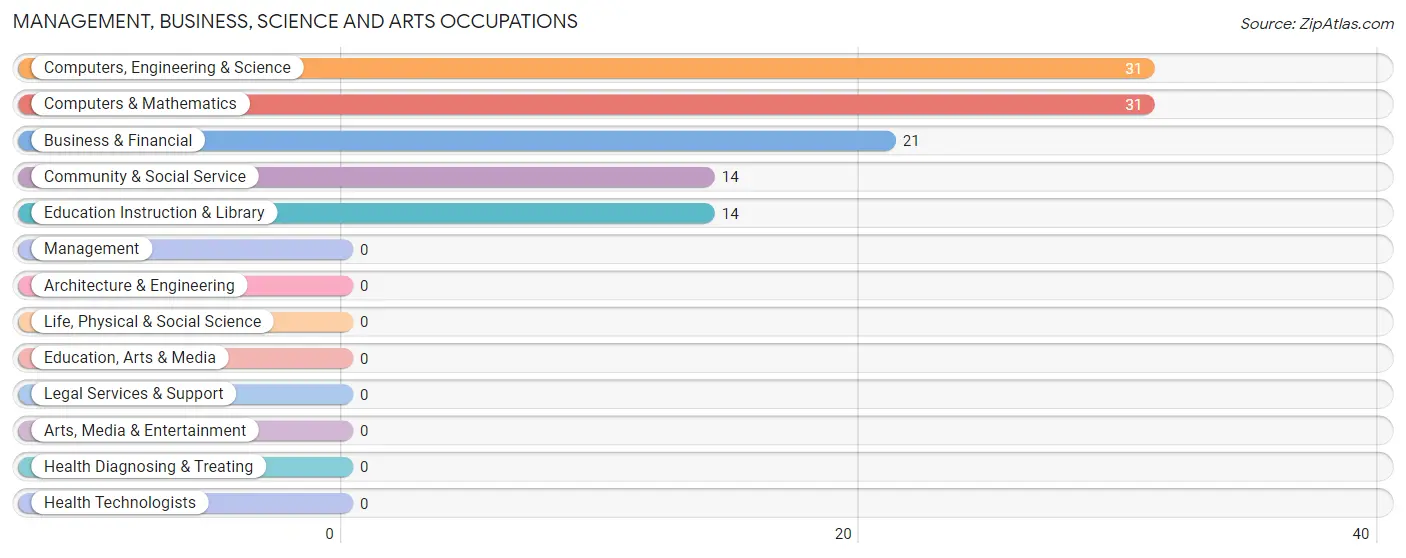
The most common Management, Business, Science and Arts occupations in Rand are Computers, Engineering & Science (31 | 8.9%), Computers & Mathematics (31 | 8.9%), Business & Financial (21 | 6.0%), Community & Social Service (14 | 4.0%), and Education Instruction & Library (14 | 4.0%).
Management, Business, Science and Arts Occupations by Sex
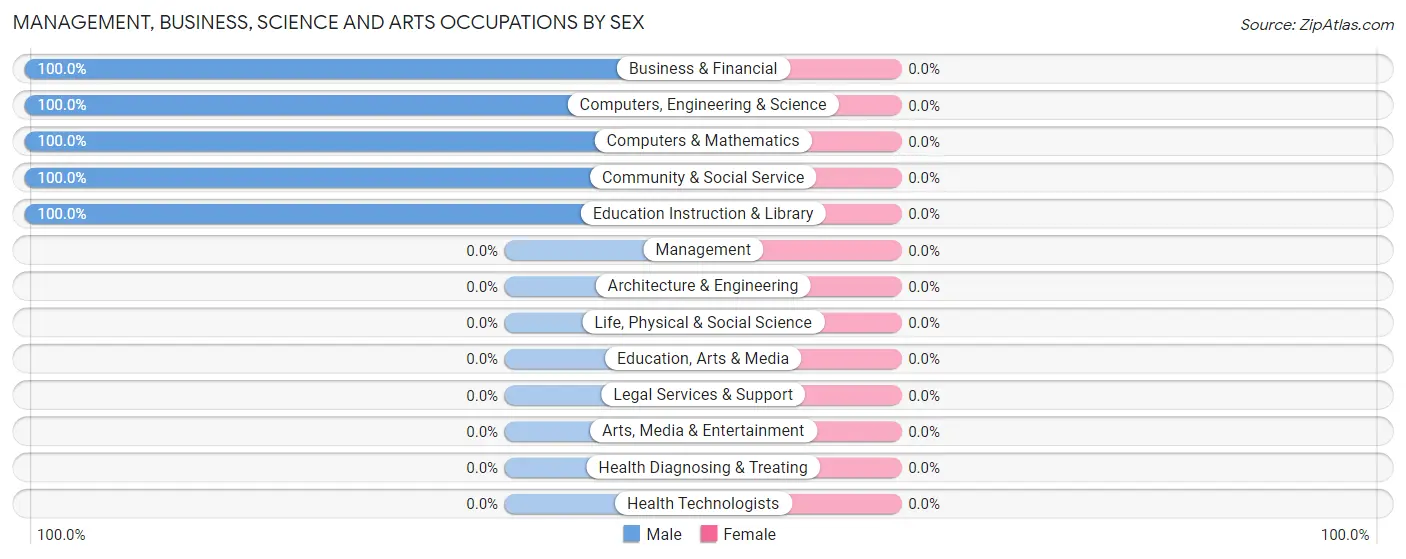
| Occupation | Male | Female |
| Management | 0 (0.0%) | 0 (0.0%) |
| Business & Financial | 21 (100.0%) | 0 (0.0%) |
| Computers, Engineering & Science | 31 (100.0%) | 0 (0.0%) |
| Computers & Mathematics | 31 (100.0%) | 0 (0.0%) |
| Architecture & Engineering | 0 (0.0%) | 0 (0.0%) |
| Life, Physical & Social Science | 0 (0.0%) | 0 (0.0%) |
| Community & Social Service | 14 (100.0%) | 0 (0.0%) |
| Education, Arts & Media | 0 (0.0%) | 0 (0.0%) |
| Legal Services & Support | 0 (0.0%) | 0 (0.0%) |
| Education Instruction & Library | 14 (100.0%) | 0 (0.0%) |
| Arts, Media & Entertainment | 0 (0.0%) | 0 (0.0%) |
| Health Diagnosing & Treating | 0 (0.0%) | 0 (0.0%) |
| Health Technologists | 0 (0.0%) | 0 (0.0%) |
| Total (Category) | 66 (100.0%) | 0 (0.0%) |
| Total (Overall) | 259 (74.6%) | 88 (25.4%) |
Services Occupations
The most common Services occupations in Rand are Healthcare Support (55 | 15.9%), Food Preparation & Serving (24 | 6.9%), Cleaning & Maintenance (15 | 4.3%), Security & Protection (13 | 3.7%), and Firefighting & Prevention (13 | 3.7%).
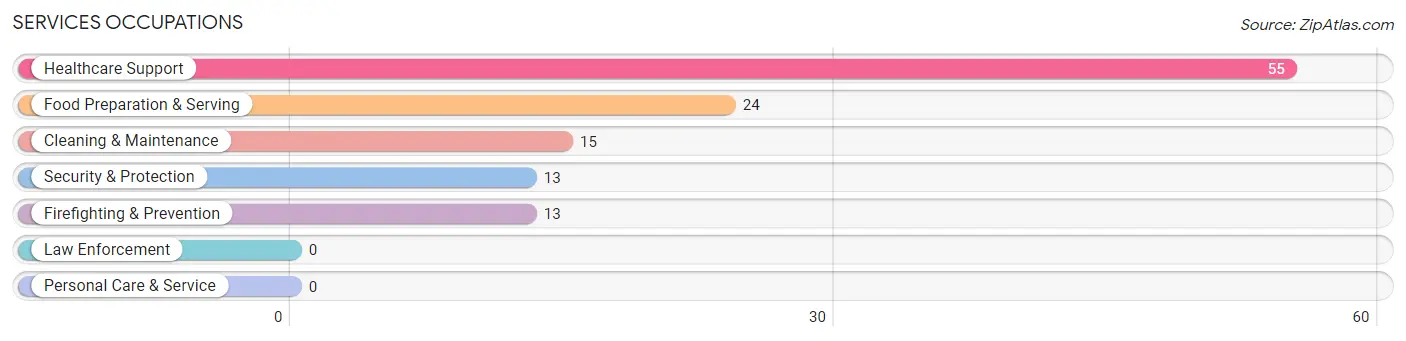
Services Occupations by Sex
Within the Services occupations in Rand, the most male-oriented occupations are Security & Protection (100.0%), Firefighting & Prevention (100.0%), and Food Preparation & Serving (100.0%), while the most female-oriented occupations are Healthcare Support (100.0%), and Cleaning & Maintenance (100.0%).
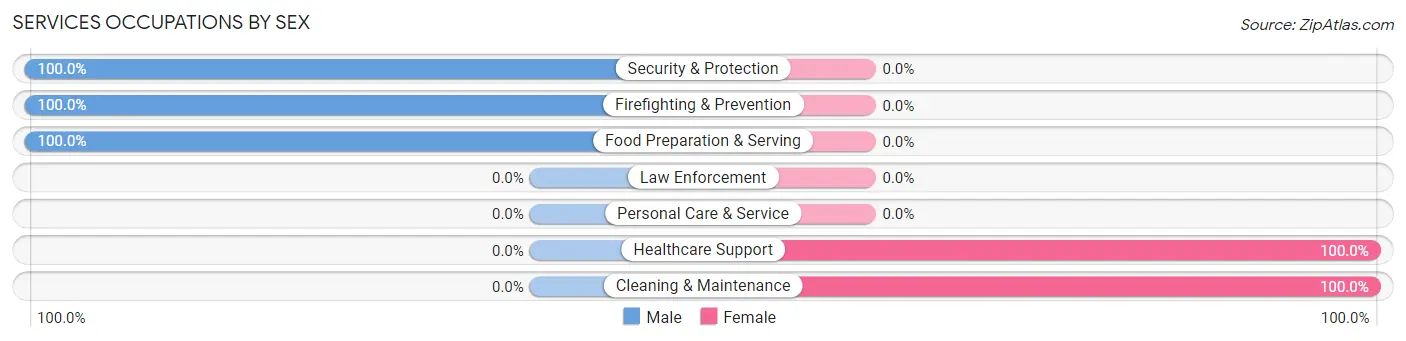
| Occupation | Male | Female |
| Healthcare Support | 0 (0.0%) | 55 (100.0%) |
| Security & Protection | 13 (100.0%) | 0 (0.0%) |
| Firefighting & Prevention | 13 (100.0%) | 0 (0.0%) |
| Law Enforcement | 0 (0.0%) | 0 (0.0%) |
| Food Preparation & Serving | 24 (100.0%) | 0 (0.0%) |
| Cleaning & Maintenance | 0 (0.0%) | 15 (100.0%) |
| Personal Care & Service | 0 (0.0%) | 0 (0.0%) |
| Total (Category) | 37 (34.6%) | 70 (65.4%) |
| Total (Overall) | 259 (74.6%) | 88 (25.4%) |
Sales and Office Occupations
The most common Sales and Office occupations in Rand are , and Office & Administration (42 | 12.1%).
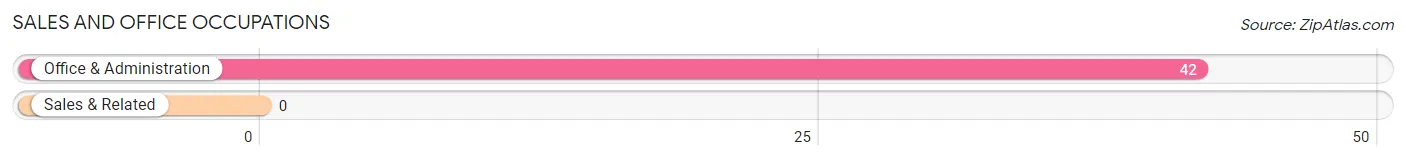
Sales and Office Occupations by Sex
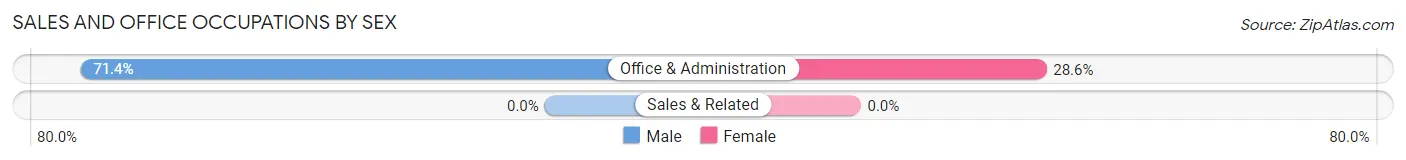
| Occupation | Male | Female |
| Sales & Related | 0 (0.0%) | 0 (0.0%) |
| Office & Administration | 30 (71.4%) | 12 (28.6%) |
| Total (Category) | 30 (71.4%) | 12 (28.6%) |
| Total (Overall) | 259 (74.6%) | 88 (25.4%) |
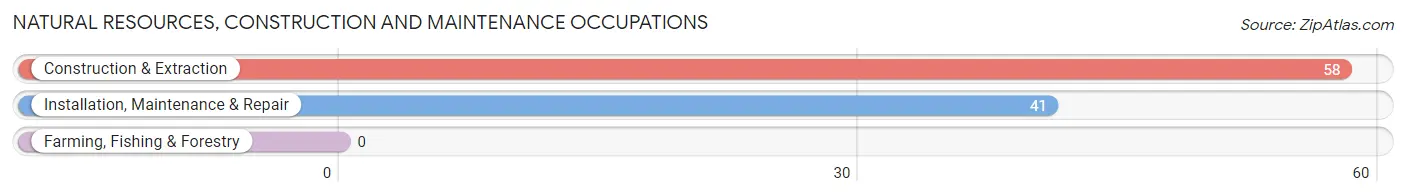
Natural Resources, Construction and Maintenance Occupations
The most common Natural Resources, Construction and Maintenance occupations in Rand are Construction & Extraction (58 | 16.7%), and Installation, Maintenance & Repair (41 | 11.8%).
Natural Resources, Construction and Maintenance Occupations by Sex
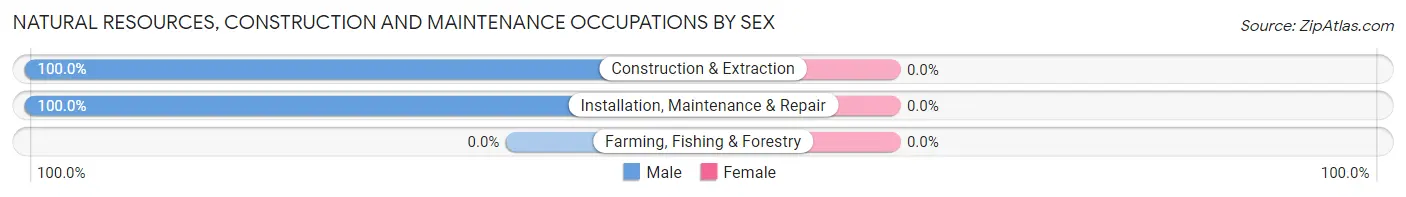
| Occupation | Male | Female |
| Farming, Fishing & Forestry | 0 (0.0%) | 0 (0.0%) |
| Construction & Extraction | 58 (100.0%) | 0 (0.0%) |
| Installation, Maintenance & Repair | 41 (100.0%) | 0 (0.0%) |
| Total (Category) | 99 (100.0%) | 0 (0.0%) |
| Total (Overall) | 259 (74.6%) | 88 (25.4%) |
Production, Transportation and Moving Occupations
The most common Production, Transportation and Moving occupations in Rand are Material Moving (27 | 7.8%), and Production (6 | 1.7%).
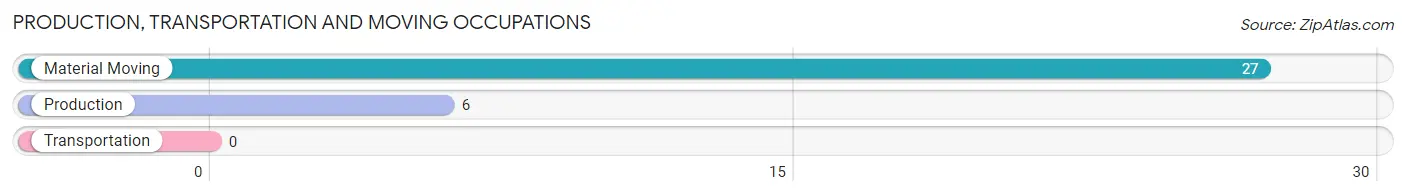
Production, Transportation and Moving Occupations by Sex
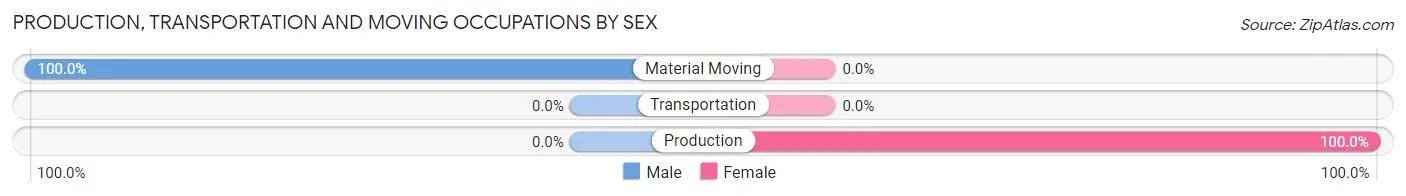
| Occupation | Male | Female |
| Production | 0 (0.0%) | 6 (100.0%) |
| Transportation | 0 (0.0%) | 0 (0.0%) |
| Material Moving | 27 (100.0%) | 0 (0.0%) |
| Total (Category) | 27 (81.8%) | 6 (18.2%) |
| Total (Overall) | 259 (74.6%) | 88 (25.4%) |
Employment Industries by Sex in Rand
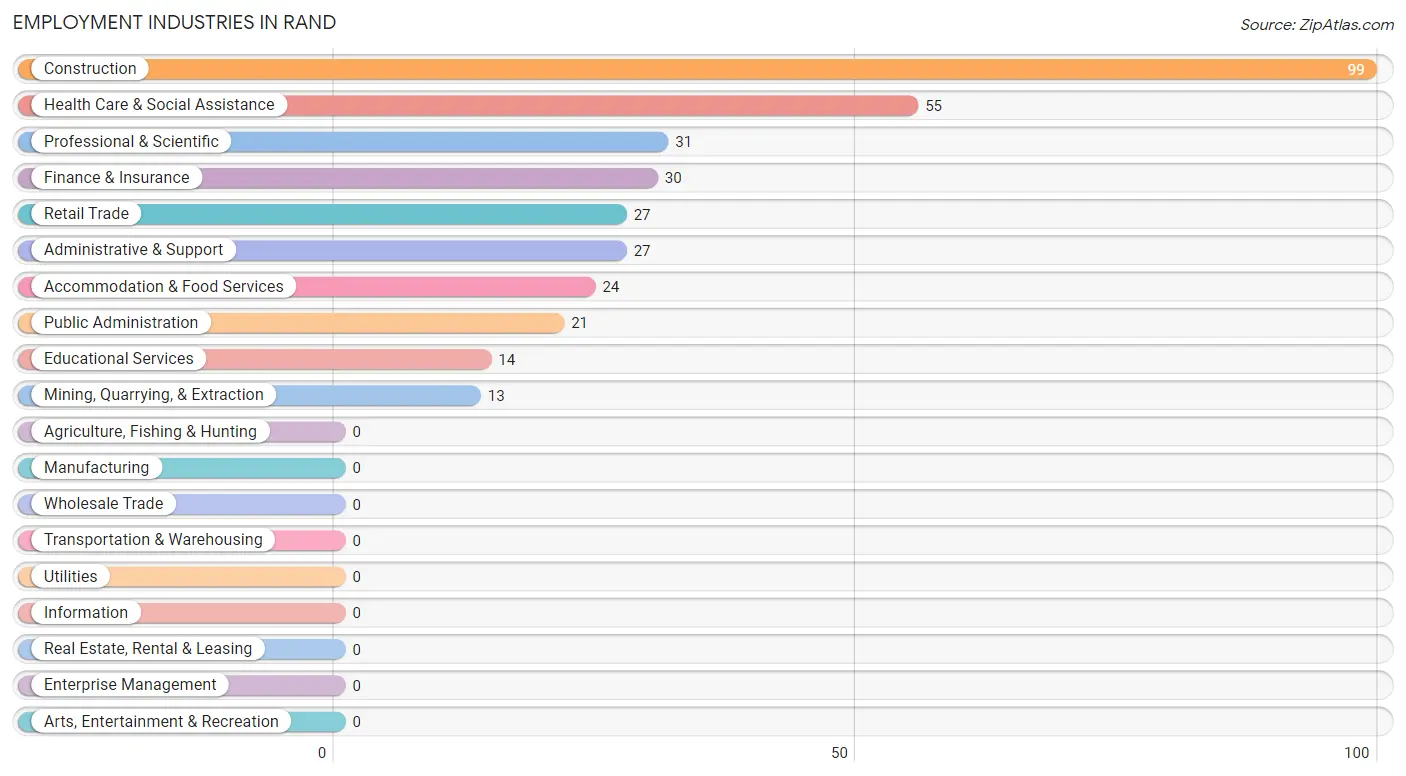
Employment Industries in Rand
The major employment industries in Rand include Construction (99 | 28.5%), Health Care & Social Assistance (55 | 15.9%), Professional & Scientific (31 | 8.9%), Finance & Insurance (30 | 8.6%), and Retail Trade (27 | 7.8%).
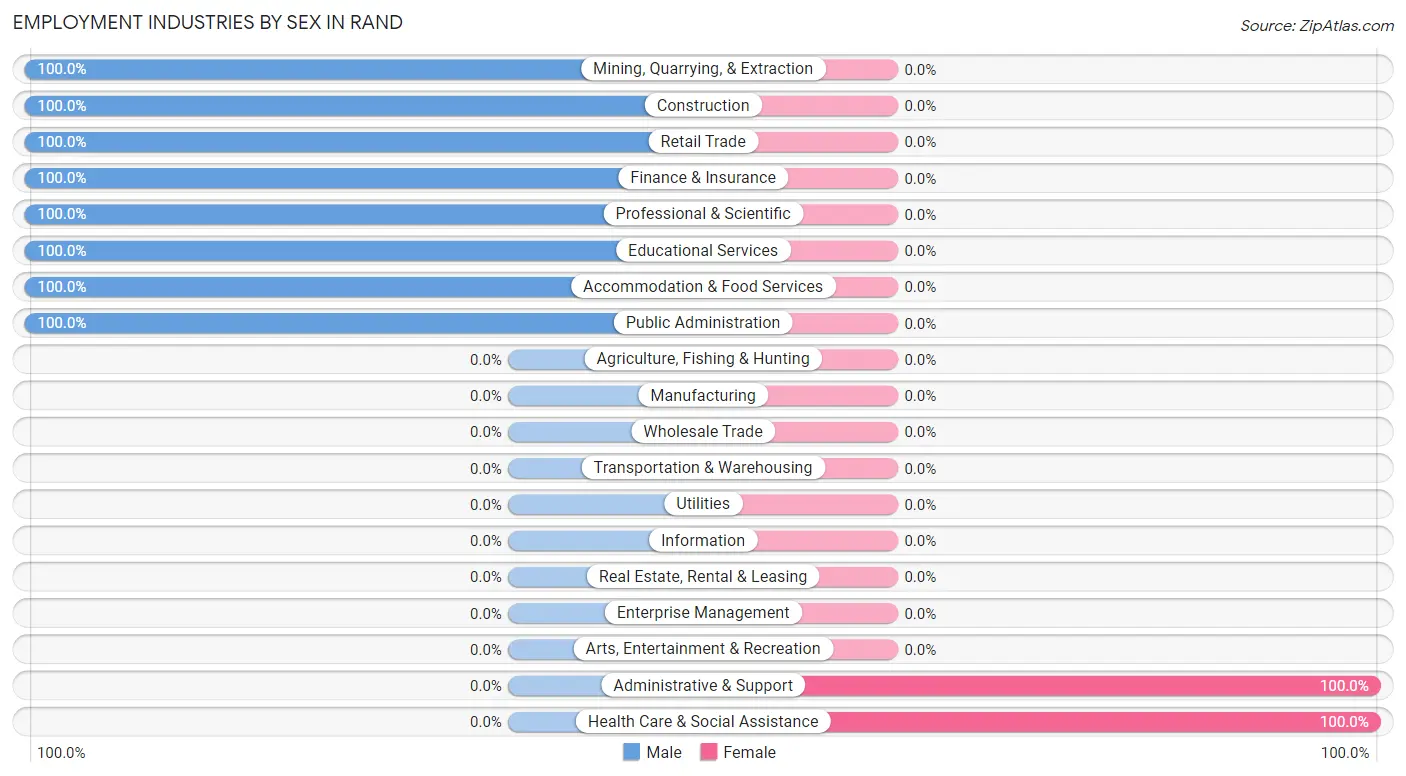
Employment Industries by Sex in Rand
The Rand industries that see more men than women are Mining, Quarrying, & Extraction (100.0%), Construction (100.0%), and Retail Trade (100.0%), whereas the industries that tend to have a higher number of women are Administrative & Support (100.0%), and Health Care & Social Assistance (100.0%).
| Industry | Male | Female |
| Agriculture, Fishing & Hunting | 0 (0.0%) | 0 (0.0%) |
| Mining, Quarrying, & Extraction | 13 (100.0%) | 0 (0.0%) |
| Construction | 99 (100.0%) | 0 (0.0%) |
| Manufacturing | 0 (0.0%) | 0 (0.0%) |
| Wholesale Trade | 0 (0.0%) | 0 (0.0%) |
| Retail Trade | 27 (100.0%) | 0 (0.0%) |
| Transportation & Warehousing | 0 (0.0%) | 0 (0.0%) |
| Utilities | 0 (0.0%) | 0 (0.0%) |
| Information | 0 (0.0%) | 0 (0.0%) |
| Finance & Insurance | 30 (100.0%) | 0 (0.0%) |
| Real Estate, Rental & Leasing | 0 (0.0%) | 0 (0.0%) |
| Professional & Scientific | 31 (100.0%) | 0 (0.0%) |
| Enterprise Management | 0 (0.0%) | 0 (0.0%) |
| Administrative & Support | 0 (0.0%) | 27 (100.0%) |
| Educational Services | 14 (100.0%) | 0 (0.0%) |
| Health Care & Social Assistance | 0 (0.0%) | 55 (100.0%) |
| Arts, Entertainment & Recreation | 0 (0.0%) | 0 (0.0%) |
| Accommodation & Food Services | 24 (100.0%) | 0 (0.0%) |
| Public Administration | 21 (100.0%) | 0 (0.0%) |
| Total | 259 (74.6%) | 88 (25.4%) |
Education in Rand
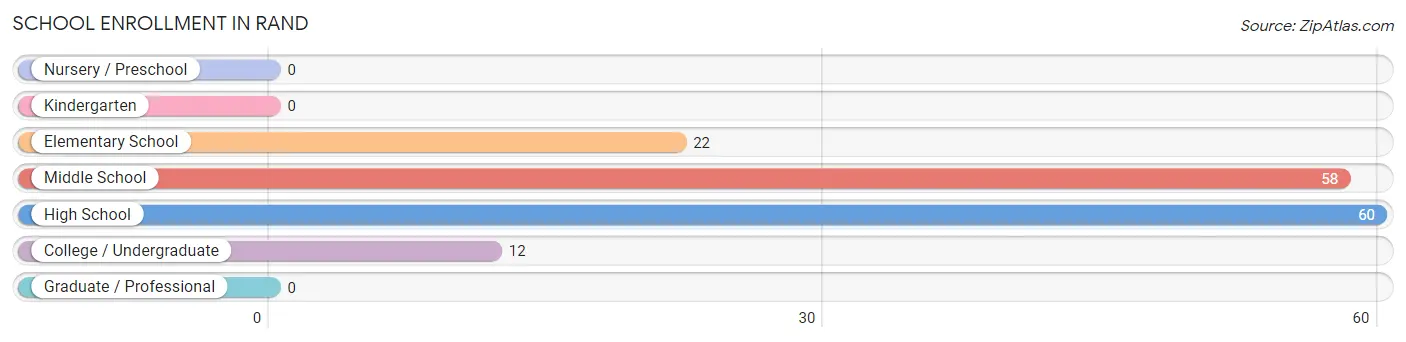
School Enrollment in Rand
The most common levels of schooling among the 152 students in Rand are high school (60 | 39.5%), middle school (58 | 38.2%), and elementary school (22 | 14.5%).
| School Level | # Students | % Students |
| Nursery / Preschool | 0 | 0.0% |
| Kindergarten | 0 | 0.0% |
| Elementary School | 22 | 14.5% |
| Middle School | 58 | 38.2% |
| High School | 60 | 39.5% |
| College / Undergraduate | 12 | 7.9% |
| Graduate / Professional | 0 | 0.0% |
| Total | 152 | 100.0% |
School Enrollment by Age by Funding Source in Rand
Out of a total of 152 students who are enrolled in schools in Rand, 29 (19.1%) attend a private institution, while the remaining 123 (80.9%) are enrolled in public schools. The age group of 25 to 34 year olds has the highest likelihood of being enrolled in private schools, with 12 (100.0% in the age bracket) enrolled. Conversely, the age group of 5 to 9 year old has the lowest likelihood of being enrolled in a private school, with 10 (100.0% in the age bracket) attending a public institution.
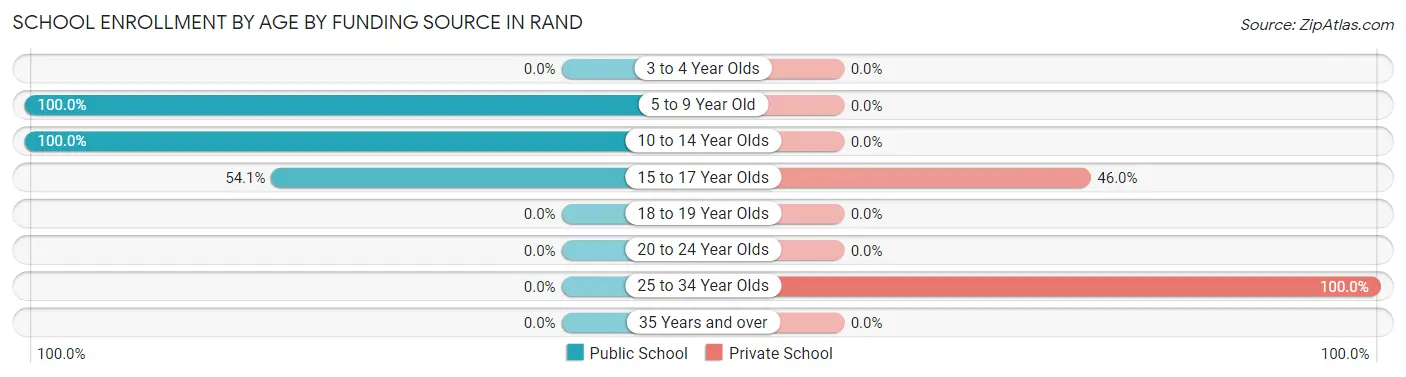
| Age Bracket | Public School | Private School |
| 3 to 4 Year Olds | 0 (0.0%) | 0 (0.0%) |
| 5 to 9 Year Old | 10 (100.0%) | 0 (0.0%) |
| 10 to 14 Year Olds | 93 (100.0%) | 0 (0.0%) |
| 15 to 17 Year Olds | 20 (54.0%) | 17 (46.0%) |
| 18 to 19 Year Olds | 0 (0.0%) | 0 (0.0%) |
| 20 to 24 Year Olds | 0 (0.0%) | 0 (0.0%) |
| 25 to 34 Year Olds | 0 (0.0%) | 12 (100.0%) |
| 35 Years and over | 0 (0.0%) | 0 (0.0%) |
| Total | 123 (80.9%) | 29 (19.1%) |
Educational Attainment by Field of Study in Rand
Science & technology (31 | 25.0%), business (21 | 16.9%), computers & mathematics (18 | 14.5%), liberal arts & history (14 | 11.3%), and education (13 | 10.5%) are the most common fields of study among 124 individuals in Rand who have obtained a bachelor's degree or higher.
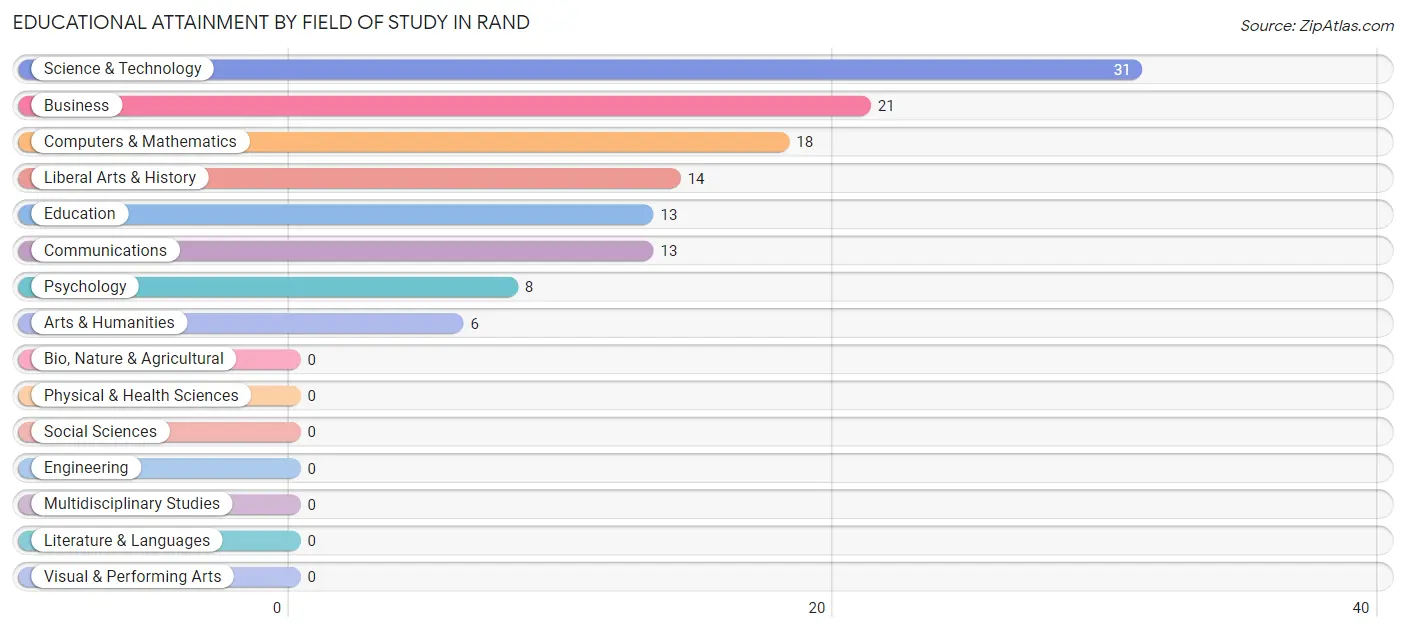
| Field of Study | # Graduates | % Graduates |
| Computers & Mathematics | 18 | 14.5% |
| Bio, Nature & Agricultural | 0 | 0.0% |
| Physical & Health Sciences | 0 | 0.0% |
| Psychology | 8 | 6.5% |
| Social Sciences | 0 | 0.0% |
| Engineering | 0 | 0.0% |
| Multidisciplinary Studies | 0 | 0.0% |
| Science & Technology | 31 | 25.0% |
| Business | 21 | 16.9% |
| Education | 13 | 10.5% |
| Literature & Languages | 0 | 0.0% |
| Liberal Arts & History | 14 | 11.3% |
| Visual & Performing Arts | 0 | 0.0% |
| Communications | 13 | 10.5% |
| Arts & Humanities | 6 | 4.8% |
| Total | 124 | 100.0% |
Transportation & Commute in Rand
Vehicle Availability by Sex in Rand
The most prevalent vehicle ownership categories in Rand are males with 1 vehicle (136, accounting for 54.2%) and females with 1 vehicle (18, making up 154.6%).
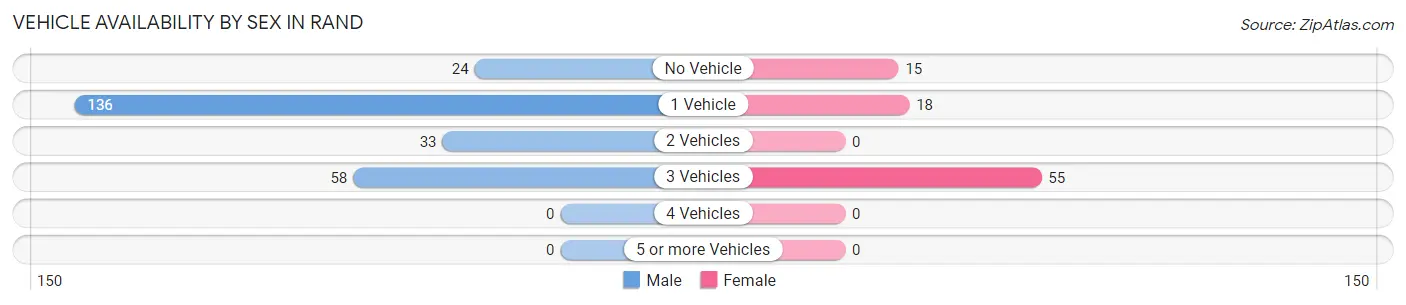
| Vehicles Available | Male | Female |
| No Vehicle | 24 (9.6%) | 15 (17.1%) |
| 1 Vehicle | 136 (54.2%) | 18 (20.4%) |
| 2 Vehicles | 33 (13.2%) | 0 (0.0%) |
| 3 Vehicles | 58 (23.1%) | 55 (62.5%) |
| 4 Vehicles | 0 (0.0%) | 0 (0.0%) |
| 5 or more Vehicles | 0 (0.0%) | 0 (0.0%) |
| Total | 251 (100.0%) | 88 (100.0%) |
Commute Time in Rand
The most frequently occuring commute durations in Rand are 20 to 24 minutes (128 commuters, 37.8%), 15 to 19 minutes (87 commuters, 25.7%), and 35 to 39 minutes (58 commuters, 17.1%).
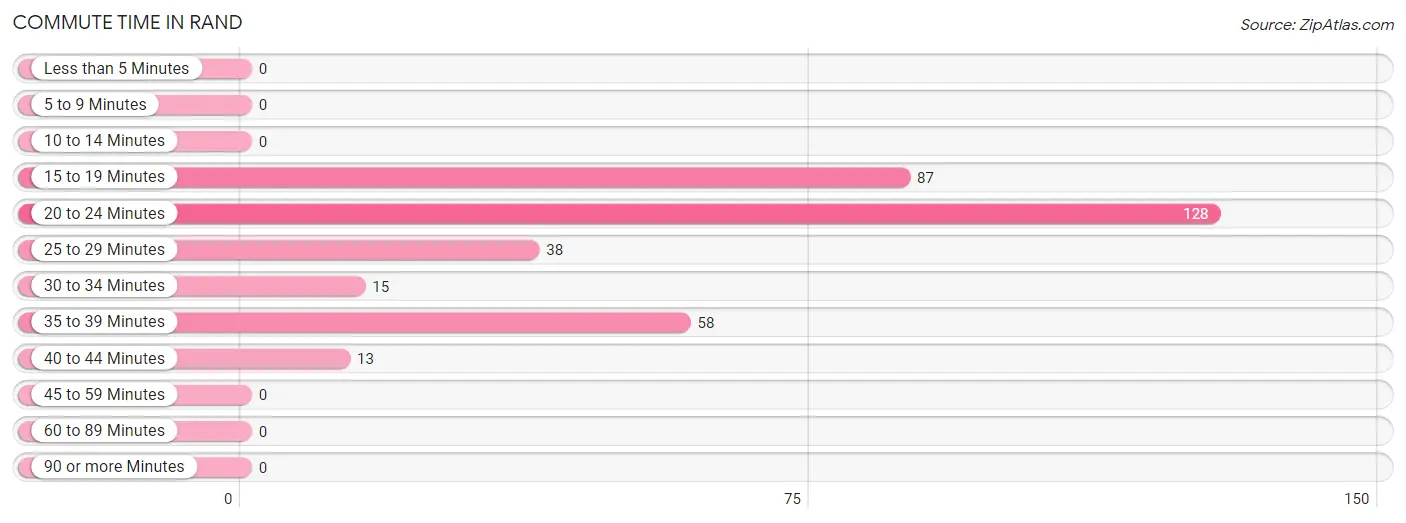
| Commute Time | # Commuters | % Commuters |
| Less than 5 Minutes | 0 | 0.0% |
| 5 to 9 Minutes | 0 | 0.0% |
| 10 to 14 Minutes | 0 | 0.0% |
| 15 to 19 Minutes | 87 | 25.7% |
| 20 to 24 Minutes | 128 | 37.8% |
| 25 to 29 Minutes | 38 | 11.2% |
| 30 to 34 Minutes | 15 | 4.4% |
| 35 to 39 Minutes | 58 | 17.1% |
| 40 to 44 Minutes | 13 | 3.8% |
| 45 to 59 Minutes | 0 | 0.0% |
| 60 to 89 Minutes | 0 | 0.0% |
| 90 or more Minutes | 0 | 0.0% |
Commute Time by Sex in Rand
The most common commute times in Rand are 15 to 19 minutes (81 commuters, 32.3%) for males and 20 to 24 minutes (67 commuters, 76.1%) for females.
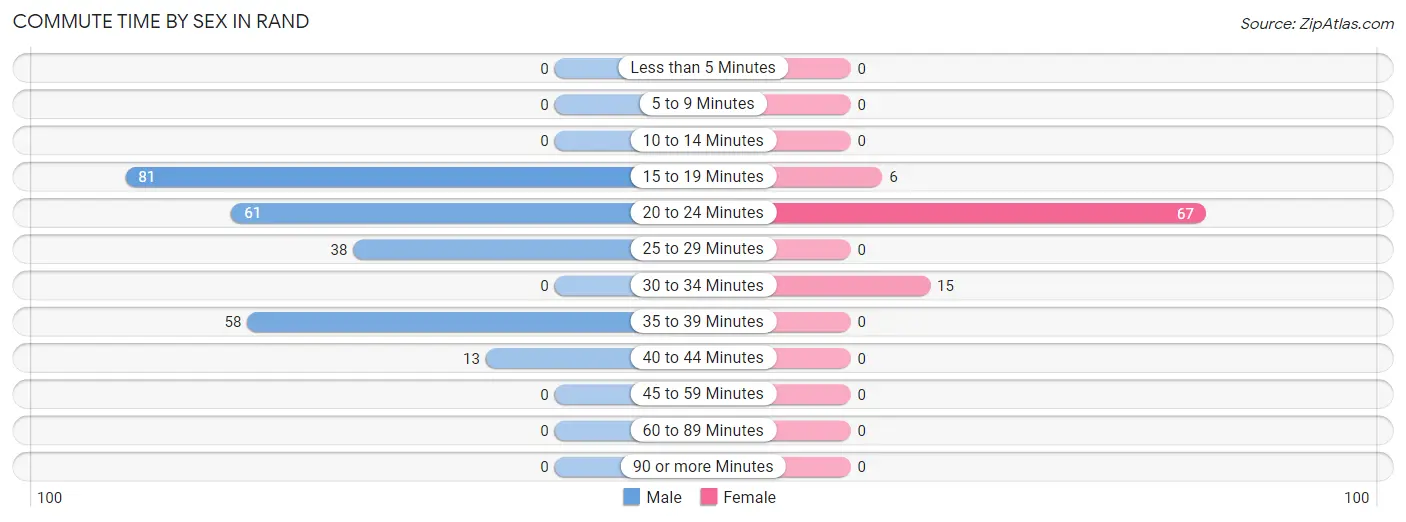
| Commute Time | Male | Female |
| Less than 5 Minutes | 0 (0.0%) | 0 (0.0%) |
| 5 to 9 Minutes | 0 (0.0%) | 0 (0.0%) |
| 10 to 14 Minutes | 0 (0.0%) | 0 (0.0%) |
| 15 to 19 Minutes | 81 (32.3%) | 6 (6.8%) |
| 20 to 24 Minutes | 61 (24.3%) | 67 (76.1%) |
| 25 to 29 Minutes | 38 (15.1%) | 0 (0.0%) |
| 30 to 34 Minutes | 0 (0.0%) | 15 (17.1%) |
| 35 to 39 Minutes | 58 (23.1%) | 0 (0.0%) |
| 40 to 44 Minutes | 13 (5.2%) | 0 (0.0%) |
| 45 to 59 Minutes | 0 (0.0%) | 0 (0.0%) |
| 60 to 89 Minutes | 0 (0.0%) | 0 (0.0%) |
| 90 or more Minutes | 0 (0.0%) | 0 (0.0%) |
Time of Departure to Work by Sex in Rand
The most frequent times of departure to work in Rand are 6:00 AM to 6:29 AM (89, 35.5%) for males and 7:00 AM to 7:29 AM (55, 62.5%) for females.
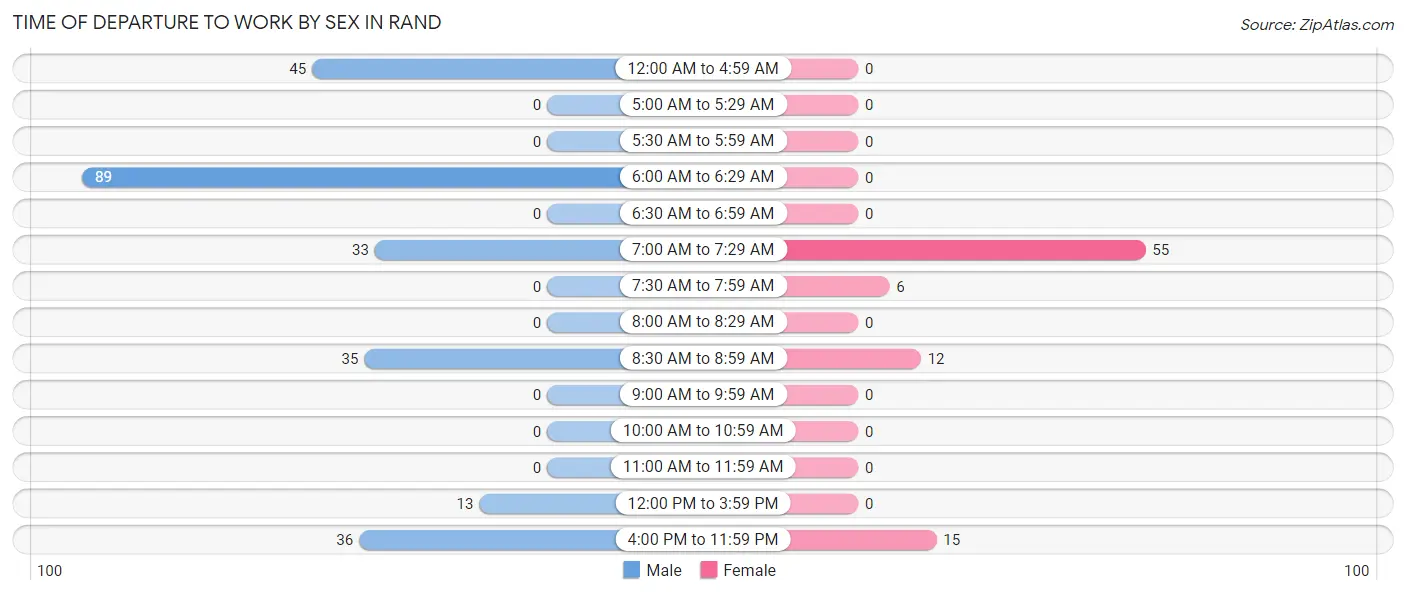
| Time of Departure | Male | Female |
| 12:00 AM to 4:59 AM | 45 (17.9%) | 0 (0.0%) |
| 5:00 AM to 5:29 AM | 0 (0.0%) | 0 (0.0%) |
| 5:30 AM to 5:59 AM | 0 (0.0%) | 0 (0.0%) |
| 6:00 AM to 6:29 AM | 89 (35.5%) | 0 (0.0%) |
| 6:30 AM to 6:59 AM | 0 (0.0%) | 0 (0.0%) |
| 7:00 AM to 7:29 AM | 33 (13.2%) | 55 (62.5%) |
| 7:30 AM to 7:59 AM | 0 (0.0%) | 6 (6.8%) |
| 8:00 AM to 8:29 AM | 0 (0.0%) | 0 (0.0%) |
| 8:30 AM to 8:59 AM | 35 (13.9%) | 12 (13.6%) |
| 9:00 AM to 9:59 AM | 0 (0.0%) | 0 (0.0%) |
| 10:00 AM to 10:59 AM | 0 (0.0%) | 0 (0.0%) |
| 11:00 AM to 11:59 AM | 0 (0.0%) | 0 (0.0%) |
| 12:00 PM to 3:59 PM | 13 (5.2%) | 0 (0.0%) |
| 4:00 PM to 11:59 PM | 36 (14.3%) | 15 (17.1%) |
| Total | 251 (100.0%) | 88 (100.0%) |
Housing Occupancy in Rand
Occupancy by Ownership in Rand
Of the total 450 dwellings in Rand, owner-occupied units account for 321 (71.3%), while renter-occupied units make up 129 (28.7%).
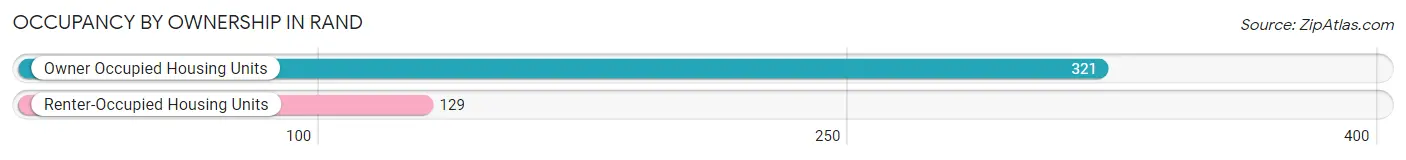
| Occupancy | # Housing Units | % Housing Units |
| Owner Occupied Housing Units | 321 | 71.3% |
| Renter-Occupied Housing Units | 129 | 28.7% |
| Total Occupied Housing Units | 450 | 100.0% |
Occupancy by Household Size in Rand
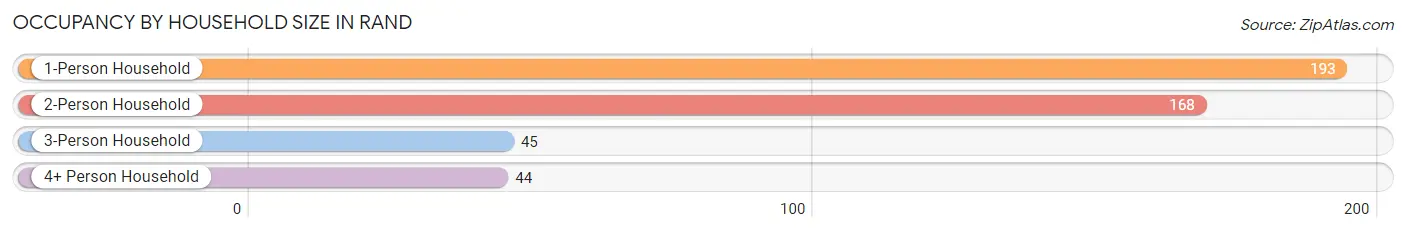
| Household Size | # Housing Units | % Housing Units |
| 1-Person Household | 193 | 42.9% |
| 2-Person Household | 168 | 37.3% |
| 3-Person Household | 45 | 10.0% |
| 4+ Person Household | 44 | 9.8% |
| Total Housing Units | 450 | 100.0% |
Occupancy by Ownership by Household Size in Rand
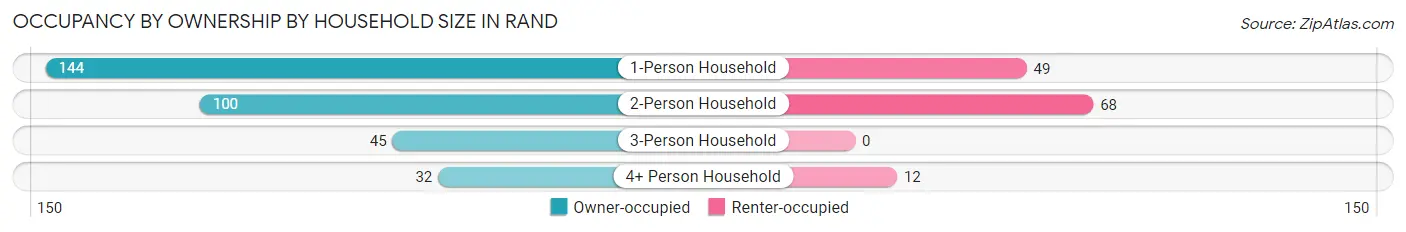
| Household Size | Owner-occupied | Renter-occupied |
| 1-Person Household | 144 (74.6%) | 49 (25.4%) |
| 2-Person Household | 100 (59.5%) | 68 (40.5%) |
| 3-Person Household | 45 (100.0%) | 0 (0.0%) |
| 4+ Person Household | 32 (72.7%) | 12 (27.3%) |
| Total Housing Units | 321 (71.3%) | 129 (28.7%) |
Occupancy by Educational Attainment in Rand
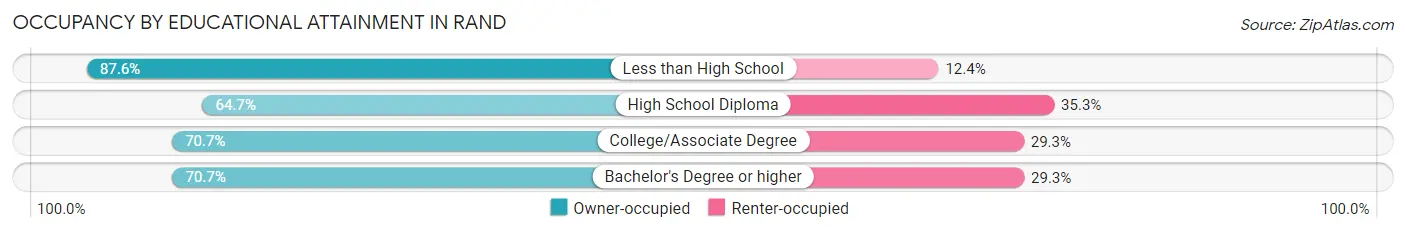
| Household Size | Owner-occupied | Renter-occupied |
| Less than High School | 78 (87.6%) | 11 (12.4%) |
| High School Diploma | 132 (64.7%) | 72 (35.3%) |
| College/Associate Degree | 58 (70.7%) | 24 (29.3%) |
| Bachelor's Degree or higher | 53 (70.7%) | 22 (29.3%) |
Occupancy by Age of Householder in Rand
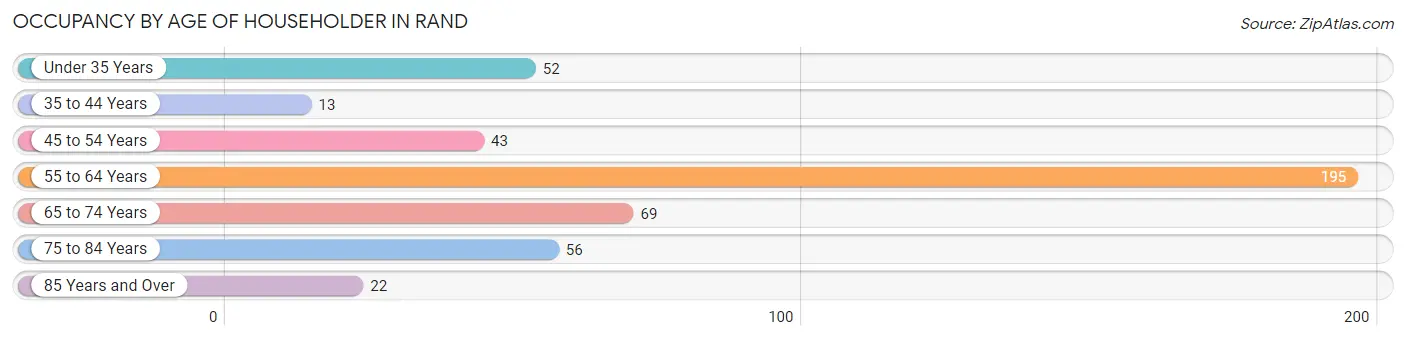
| Age Bracket | # Households | % Households |
| Under 35 Years | 52 | 11.6% |
| 35 to 44 Years | 13 | 2.9% |
| 45 to 54 Years | 43 | 9.6% |
| 55 to 64 Years | 195 | 43.3% |
| 65 to 74 Years | 69 | 15.3% |
| 75 to 84 Years | 56 | 12.4% |
| 85 Years and Over | 22 | 4.9% |
| Total | 450 | 100.0% |
Housing Finances in Rand
Median Income by Occupancy in Rand
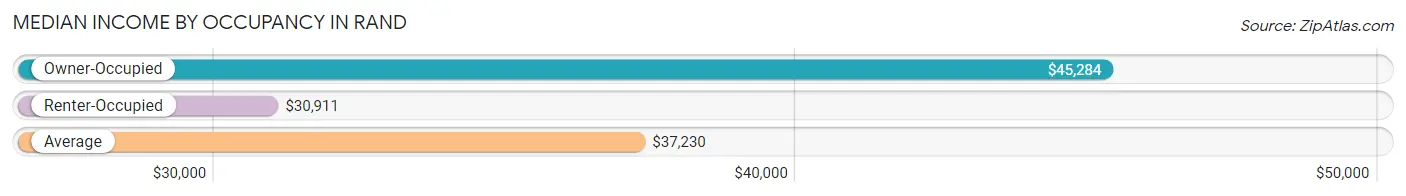
| Occupancy Type | # Households | Median Income |
| Owner-Occupied | 321 (71.3%) | $45,284 |
| Renter-Occupied | 129 (28.7%) | $30,911 |
| Average | 450 (100.0%) | $37,230 |
Occupancy by Householder Income Bracket in Rand
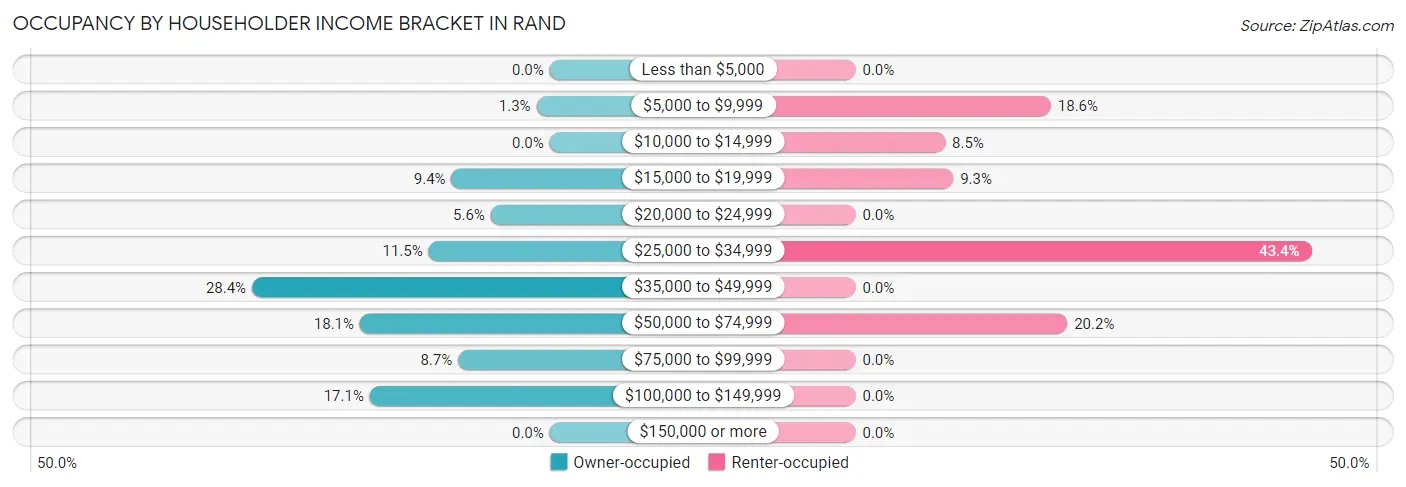
| Income Bracket | Owner-occupied | Renter-occupied |
| Less than $5,000 | 0 (0.0%) | 0 (0.0%) |
| $5,000 to $9,999 | 4 (1.3%) | 24 (18.6%) |
| $10,000 to $14,999 | 0 (0.0%) | 11 (8.5%) |
| $15,000 to $19,999 | 30 (9.3%) | 12 (9.3%) |
| $20,000 to $24,999 | 18 (5.6%) | 0 (0.0%) |
| $25,000 to $34,999 | 37 (11.5%) | 56 (43.4%) |
| $35,000 to $49,999 | 91 (28.3%) | 0 (0.0%) |
| $50,000 to $74,999 | 58 (18.1%) | 26 (20.2%) |
| $75,000 to $99,999 | 28 (8.7%) | 0 (0.0%) |
| $100,000 to $149,999 | 55 (17.1%) | 0 (0.0%) |
| $150,000 or more | 0 (0.0%) | 0 (0.0%) |
| Total | 321 (100.0%) | 129 (100.0%) |
Monthly Housing Cost Tiers in Rand
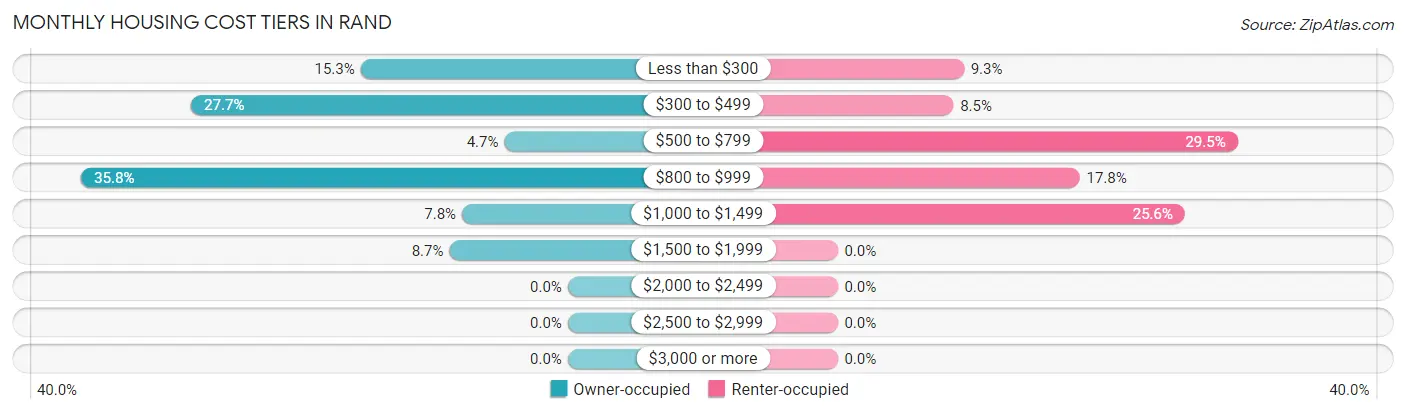
| Monthly Cost | Owner-occupied | Renter-occupied |
| Less than $300 | 49 (15.3%) | 12 (9.3%) |
| $300 to $499 | 89 (27.7%) | 11 (8.5%) |
| $500 to $799 | 15 (4.7%) | 38 (29.5%) |
| $800 to $999 | 115 (35.8%) | 23 (17.8%) |
| $1,000 to $1,499 | 25 (7.8%) | 33 (25.6%) |
| $1,500 to $1,999 | 28 (8.7%) | 0 (0.0%) |
| $2,000 to $2,499 | 0 (0.0%) | 0 (0.0%) |
| $2,500 to $2,999 | 0 (0.0%) | 0 (0.0%) |
| $3,000 or more | 0 (0.0%) | 0 (0.0%) |
| Total | 321 (100.0%) | 129 (100.0%) |
Physical Housing Characteristics in Rand
Housing Structures in Rand
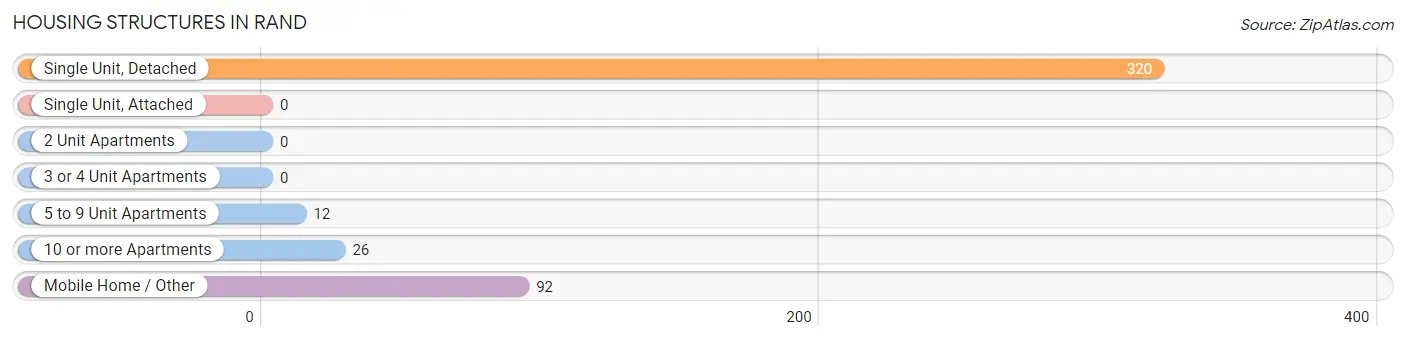
| Structure Type | # Housing Units | % Housing Units |
| Single Unit, Detached | 320 | 71.1% |
| Single Unit, Attached | 0 | 0.0% |
| 2 Unit Apartments | 0 | 0.0% |
| 3 or 4 Unit Apartments | 0 | 0.0% |
| 5 to 9 Unit Apartments | 12 | 2.7% |
| 10 or more Apartments | 26 | 5.8% |
| Mobile Home / Other | 92 | 20.4% |
| Total | 450 | 100.0% |
Housing Structures by Occupancy in Rand
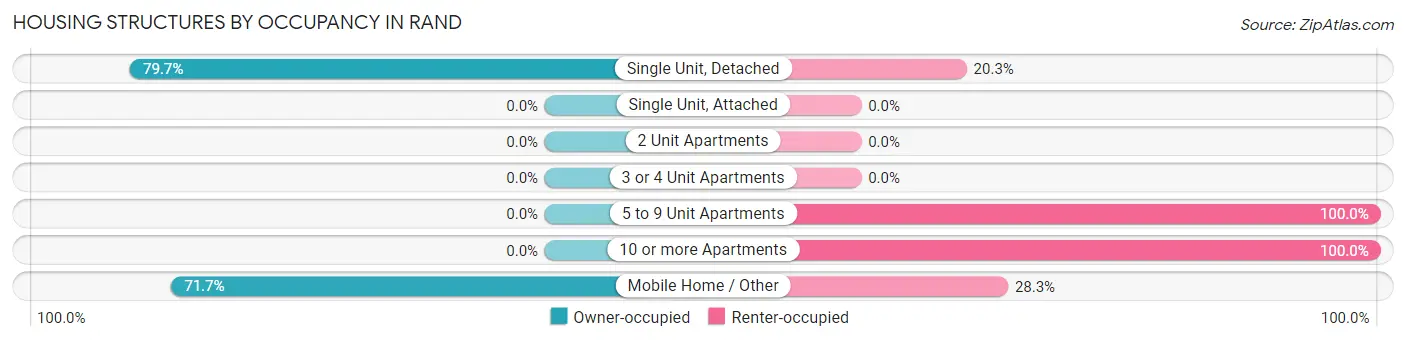
| Structure Type | Owner-occupied | Renter-occupied |
| Single Unit, Detached | 255 (79.7%) | 65 (20.3%) |
| Single Unit, Attached | 0 (0.0%) | 0 (0.0%) |
| 2 Unit Apartments | 0 (0.0%) | 0 (0.0%) |
| 3 or 4 Unit Apartments | 0 (0.0%) | 0 (0.0%) |
| 5 to 9 Unit Apartments | 0 (0.0%) | 12 (100.0%) |
| 10 or more Apartments | 0 (0.0%) | 26 (100.0%) |
| Mobile Home / Other | 66 (71.7%) | 26 (28.3%) |
| Total | 321 (71.3%) | 129 (28.7%) |
Housing Structures by Number of Rooms in Rand
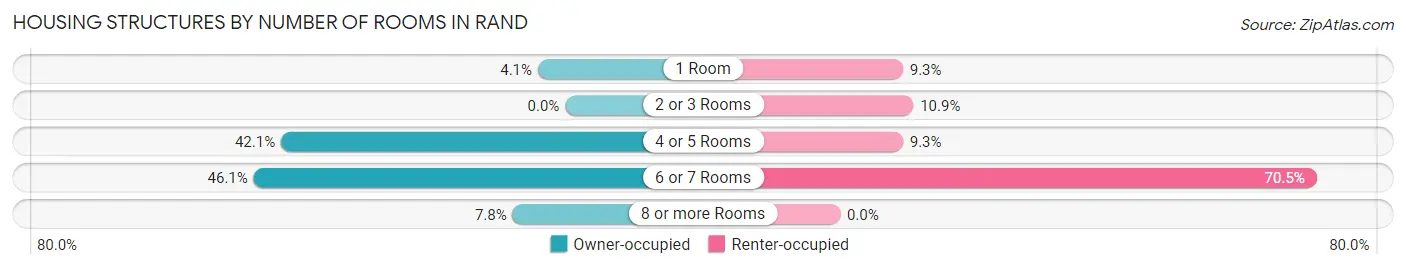
| Number of Rooms | Owner-occupied | Renter-occupied |
| 1 Room | 13 (4.1%) | 12 (9.3%) |
| 2 or 3 Rooms | 0 (0.0%) | 14 (10.8%) |
| 4 or 5 Rooms | 135 (42.1%) | 12 (9.3%) |
| 6 or 7 Rooms | 148 (46.1%) | 91 (70.5%) |
| 8 or more Rooms | 25 (7.8%) | 0 (0.0%) |
| Total | 321 (100.0%) | 129 (100.0%) |
Housing Structure by Heating Type in Rand
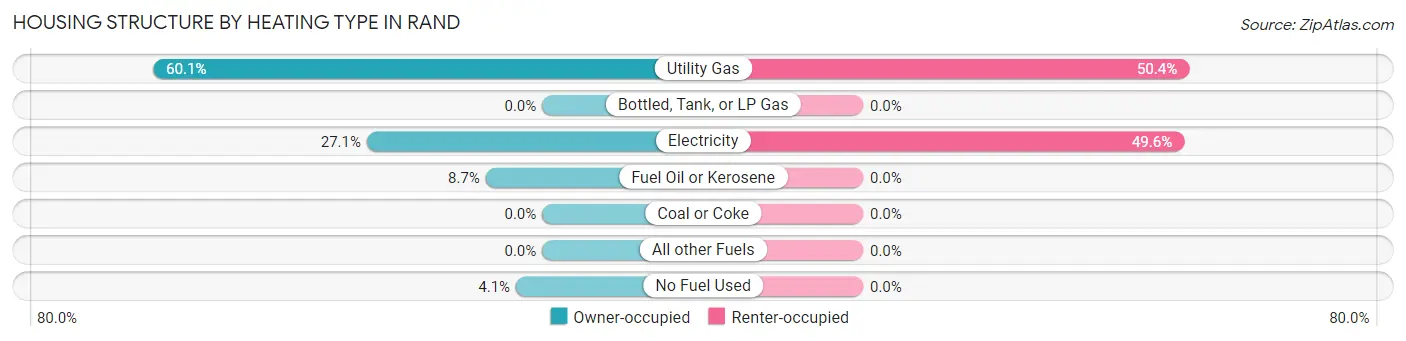
| Heating Type | Owner-occupied | Renter-occupied |
| Utility Gas | 193 (60.1%) | 65 (50.4%) |
| Bottled, Tank, or LP Gas | 0 (0.0%) | 0 (0.0%) |
| Electricity | 87 (27.1%) | 64 (49.6%) |
| Fuel Oil or Kerosene | 28 (8.7%) | 0 (0.0%) |
| Coal or Coke | 0 (0.0%) | 0 (0.0%) |
| All other Fuels | 0 (0.0%) | 0 (0.0%) |
| No Fuel Used | 13 (4.1%) | 0 (0.0%) |
| Total | 321 (100.0%) | 129 (100.0%) |
Household Vehicle Usage in Rand
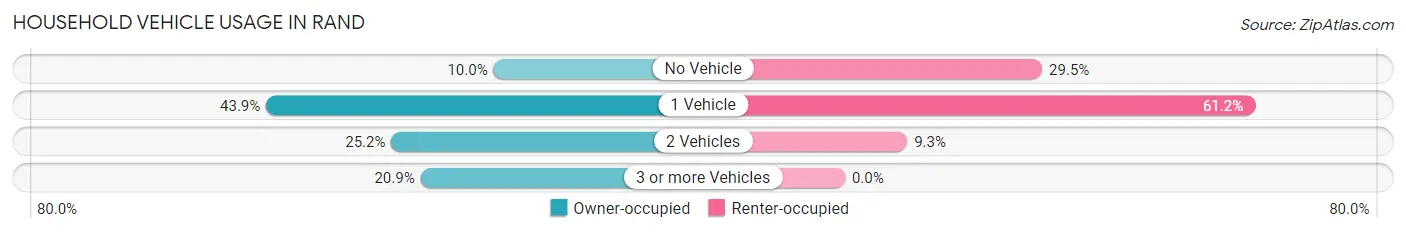
| Vehicles per Household | Owner-occupied | Renter-occupied |
| No Vehicle | 32 (10.0%) | 38 (29.5%) |
| 1 Vehicle | 141 (43.9%) | 79 (61.2%) |
| 2 Vehicles | 81 (25.2%) | 12 (9.3%) |
| 3 or more Vehicles | 67 (20.9%) | 0 (0.0%) |
| Total | 321 (100.0%) | 129 (100.0%) |
Real Estate & Mortgages in Rand
Real Estate and Mortgage Overview in Rand
| Characteristic | Without Mortgage | With Mortgage |
| Housing Units | 161 | 160 |
| Median Property Value | $76,600 | $90,500 |
| Median Household Income | $35,885 | $0 |
| Monthly Housing Costs | $414 | $0 |
| Real Estate Taxes | $481 | $0 |
Property Value by Mortgage Status in Rand
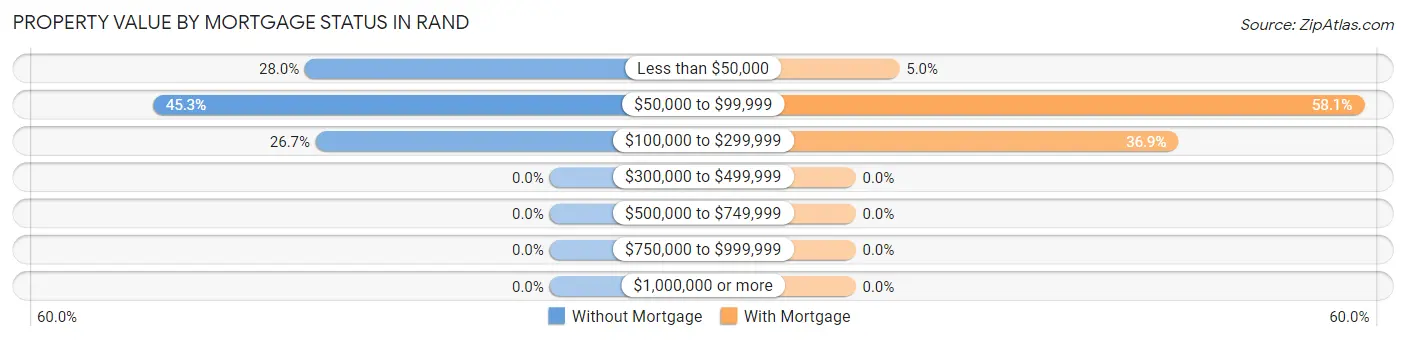
| Property Value | Without Mortgage | With Mortgage |
| Less than $50,000 | 45 (28.0%) | 8 (5.0%) |
| $50,000 to $99,999 | 73 (45.3%) | 93 (58.1%) |
| $100,000 to $299,999 | 43 (26.7%) | 59 (36.9%) |
| $300,000 to $499,999 | 0 (0.0%) | 0 (0.0%) |
| $500,000 to $749,999 | 0 (0.0%) | 0 (0.0%) |
| $750,000 to $999,999 | 0 (0.0%) | 0 (0.0%) |
| $1,000,000 or more | 0 (0.0%) | 0 (0.0%) |
| Total | 161 (100.0%) | 160 (100.0%) |
Household Income by Mortgage Status in Rand
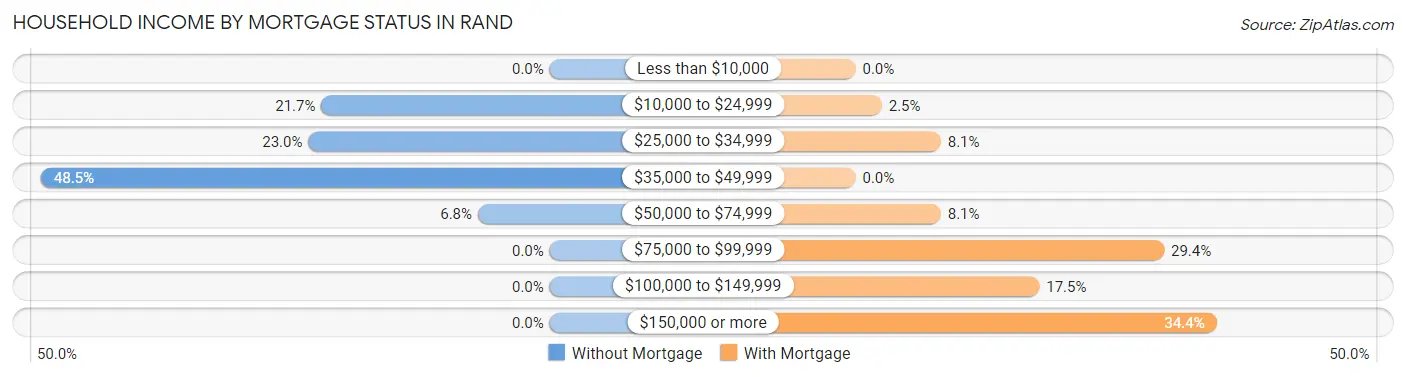
| Household Income | Without Mortgage | With Mortgage |
| Less than $10,000 | 0 (0.0%) | 0 (0.0%) |
| $10,000 to $24,999 | 35 (21.7%) | 4 (2.5%) |
| $25,000 to $34,999 | 37 (23.0%) | 13 (8.1%) |
| $35,000 to $49,999 | 78 (48.4%) | 0 (0.0%) |
| $50,000 to $74,999 | 11 (6.8%) | 13 (8.1%) |
| $75,000 to $99,999 | 0 (0.0%) | 47 (29.4%) |
| $100,000 to $149,999 | 0 (0.0%) | 28 (17.5%) |
| $150,000 or more | 0 (0.0%) | 55 (34.4%) |
| Total | 161 (100.0%) | 160 (100.0%) |
Property Value to Household Income Ratio in Rand
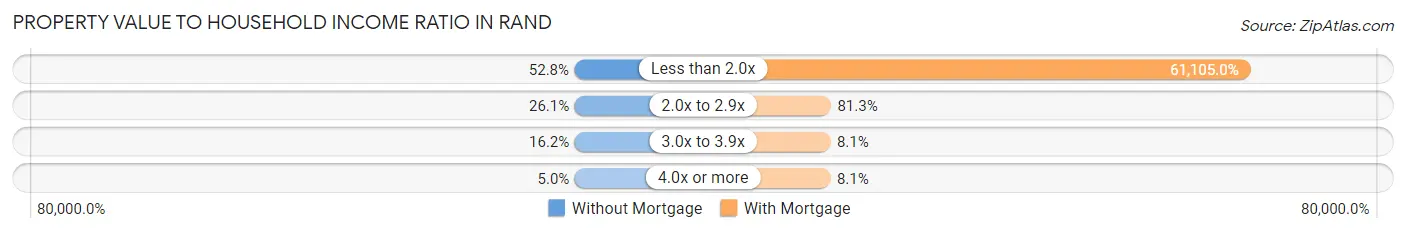
| Value-to-Income Ratio | Without Mortgage | With Mortgage |
| Less than 2.0x | 85 (52.8%) | 97,768 (61,105.0%) |
| 2.0x to 2.9x | 42 (26.1%) | 130 (81.2%) |
| 3.0x to 3.9x | 26 (16.2%) | 13 (8.1%) |
| 4.0x or more | 8 (5.0%) | 13 (8.1%) |
| Total | 161 (100.0%) | 160 (100.0%) |
Real Estate Taxes by Mortgage Status in Rand
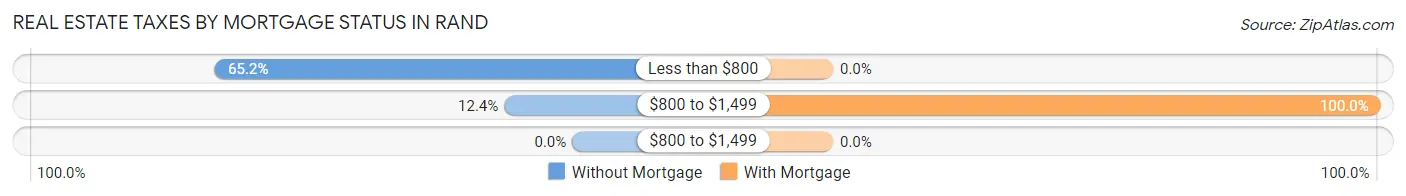
| Property Taxes | Without Mortgage | With Mortgage |
| Less than $800 | 105 (65.2%) | 0 (0.0%) |
| $800 to $1,499 | 20 (12.4%) | 160 (100.0%) |
| $800 to $1,499 | 0 (0.0%) | 0 (0.0%) |
| Total | 161 (100.0%) | 160 (100.0%) |
Health & Disability in Rand
Health Insurance Coverage by Age in Rand
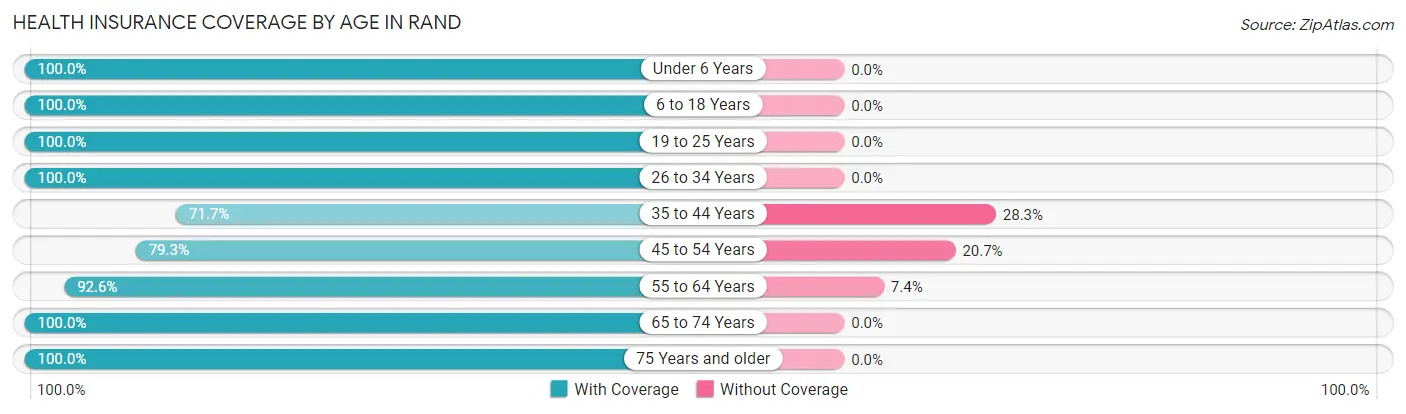
| Age Bracket | With Coverage | Without Coverage |
| Under 6 Years | 21 (100.0%) | 0 (0.0%) |
| 6 to 18 Years | 166 (100.0%) | 0 (0.0%) |
| 19 to 25 Years | 12 (100.0%) | 0 (0.0%) |
| 26 to 34 Years | 95 (100.0%) | 0 (0.0%) |
| 35 to 44 Years | 33 (71.7%) | 13 (28.3%) |
| 45 to 54 Years | 153 (79.3%) | 40 (20.7%) |
| 55 to 64 Years | 188 (92.6%) | 15 (7.4%) |
| 65 to 74 Years | 81 (100.0%) | 0 (0.0%) |
| 75 Years and older | 124 (100.0%) | 0 (0.0%) |
| Total | 873 (92.8%) | 68 (7.2%) |
Health Insurance Coverage by Citizenship Status in Rand
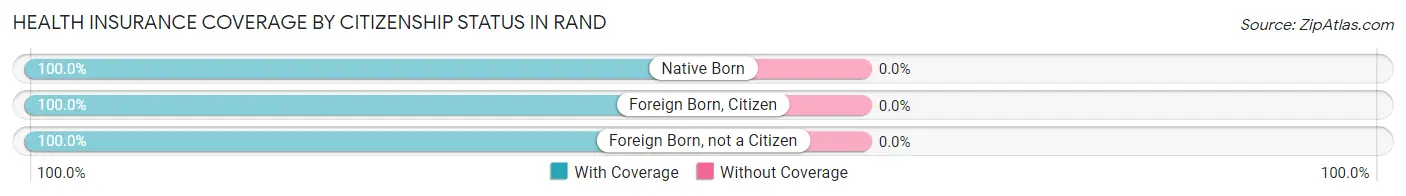
| Citizenship Status | With Coverage | Without Coverage |
| Native Born | 21 (100.0%) | 0 (0.0%) |
| Foreign Born, Citizen | 166 (100.0%) | 0 (0.0%) |
| Foreign Born, not a Citizen | 12 (100.0%) | 0 (0.0%) |
Health Insurance Coverage by Household Income in Rand
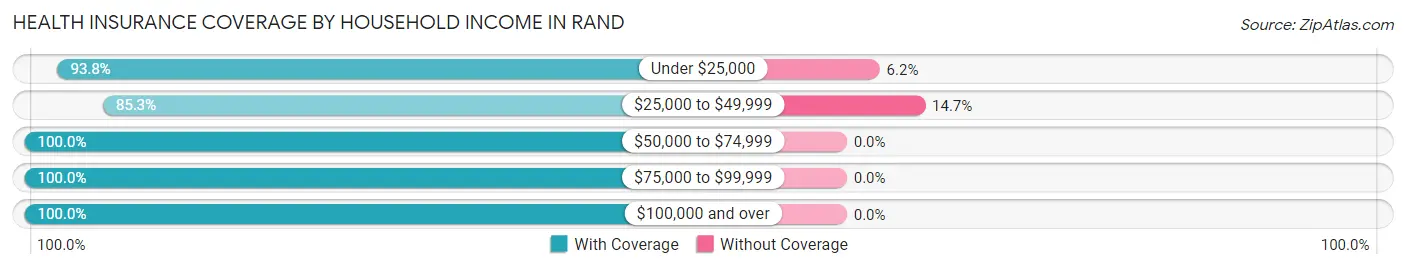
| Household Income | With Coverage | Without Coverage |
| Under $25,000 | 198 (93.8%) | 13 (6.2%) |
| $25,000 to $49,999 | 320 (85.3%) | 55 (14.7%) |
| $50,000 to $74,999 | 110 (100.0%) | 0 (0.0%) |
| $75,000 to $99,999 | 132 (100.0%) | 0 (0.0%) |
| $100,000 and over | 113 (100.0%) | 0 (0.0%) |
Public vs Private Health Insurance Coverage by Age in Rand
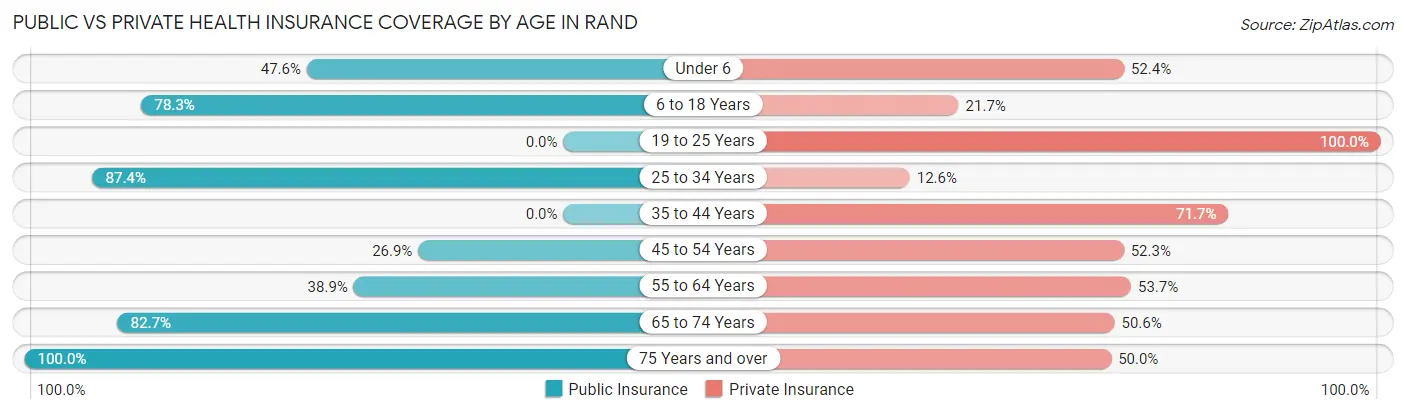
| Age Bracket | Public Insurance | Private Insurance |
| Under 6 | 10 (47.6%) | 11 (52.4%) |
| 6 to 18 Years | 130 (78.3%) | 36 (21.7%) |
| 19 to 25 Years | 0 (0.0%) | 12 (100.0%) |
| 25 to 34 Years | 83 (87.4%) | 12 (12.6%) |
| 35 to 44 Years | 0 (0.0%) | 33 (71.7%) |
| 45 to 54 Years | 52 (26.9%) | 101 (52.3%) |
| 55 to 64 Years | 79 (38.9%) | 109 (53.7%) |
| 65 to 74 Years | 67 (82.7%) | 41 (50.6%) |
| 75 Years and over | 124 (100.0%) | 62 (50.0%) |
| Total | 545 (57.9%) | 417 (44.3%) |
Disability Status by Sex by Age in Rand
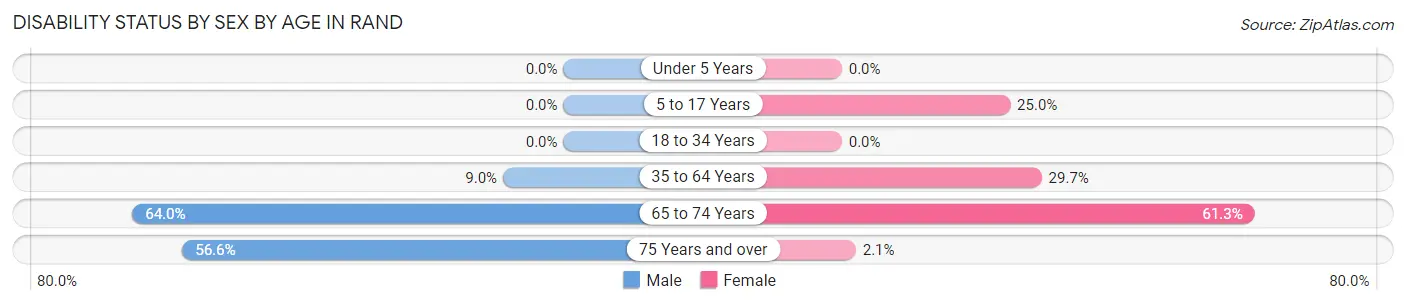
| Age Bracket | Male | Female |
| Under 5 Years | 0 (0.0%) | 0 (0.0%) |
| 5 to 17 Years | 0 (0.0%) | 26 (25.0%) |
| 18 to 34 Years | 0 (0.0%) | 0 (0.0%) |
| 35 to 64 Years | 20 (9.0%) | 65 (29.7%) |
| 65 to 74 Years | 32 (64.0%) | 19 (61.3%) |
| 75 Years and over | 43 (56.6%) | 1 (2.1%) |
Disability Class by Sex by Age in Rand
Disability Class: Hearing Difficulty
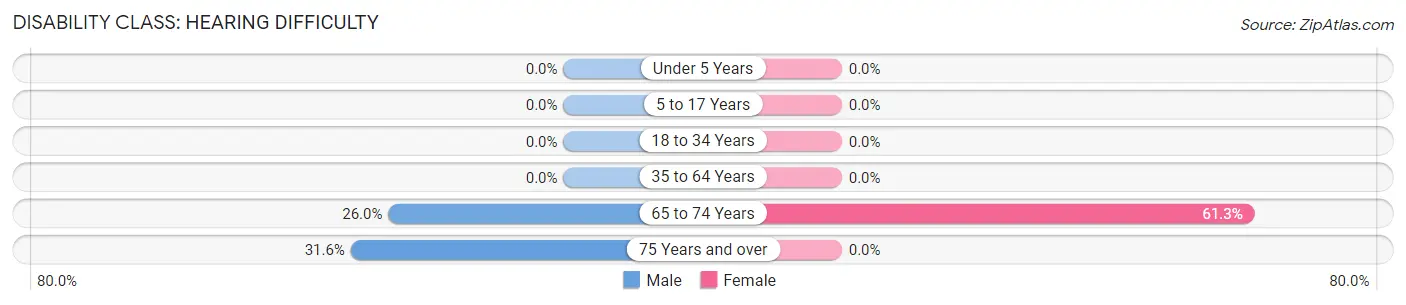
| Age Bracket | Male | Female |
| Under 5 Years | 0 (0.0%) | 0 (0.0%) |
| 5 to 17 Years | 0 (0.0%) | 0 (0.0%) |
| 18 to 34 Years | 0 (0.0%) | 0 (0.0%) |
| 35 to 64 Years | 0 (0.0%) | 0 (0.0%) |
| 65 to 74 Years | 13 (26.0%) | 19 (61.3%) |
| 75 Years and over | 24 (31.6%) | 0 (0.0%) |
Disability Class: Vision Difficulty
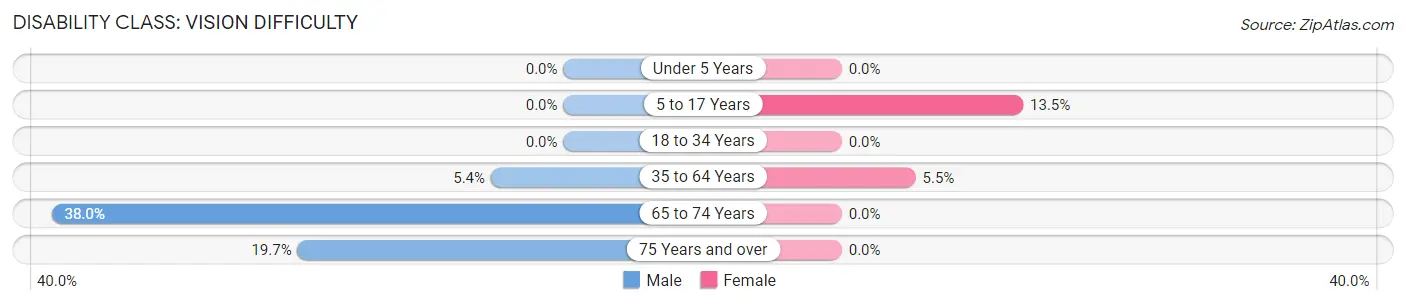
| Age Bracket | Male | Female |
| Under 5 Years | 0 (0.0%) | 0 (0.0%) |
| 5 to 17 Years | 0 (0.0%) | 14 (13.5%) |
| 18 to 34 Years | 0 (0.0%) | 0 (0.0%) |
| 35 to 64 Years | 12 (5.4%) | 12 (5.5%) |
| 65 to 74 Years | 19 (38.0%) | 0 (0.0%) |
| 75 Years and over | 15 (19.7%) | 0 (0.0%) |
Disability Class: Cognitive Difficulty
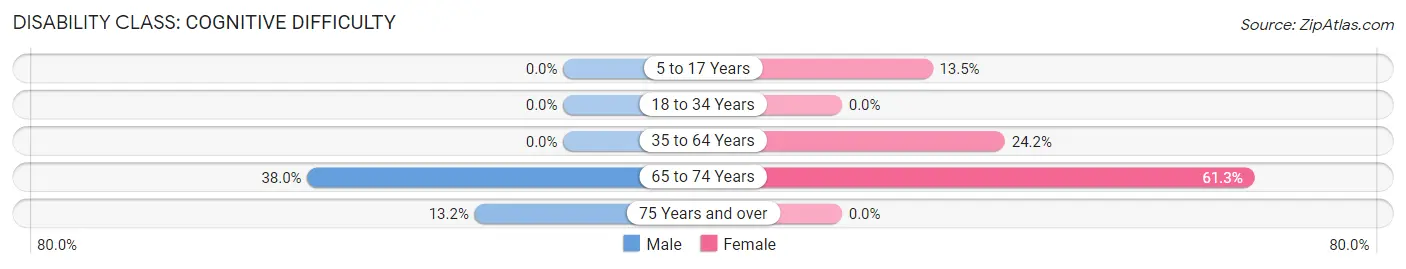
| Age Bracket | Male | Female |
| 5 to 17 Years | 0 (0.0%) | 14 (13.5%) |
| 18 to 34 Years | 0 (0.0%) | 0 (0.0%) |
| 35 to 64 Years | 0 (0.0%) | 53 (24.2%) |
| 65 to 74 Years | 19 (38.0%) | 19 (61.3%) |
| 75 Years and over | 10 (13.2%) | 0 (0.0%) |
Disability Class: Ambulatory Difficulty
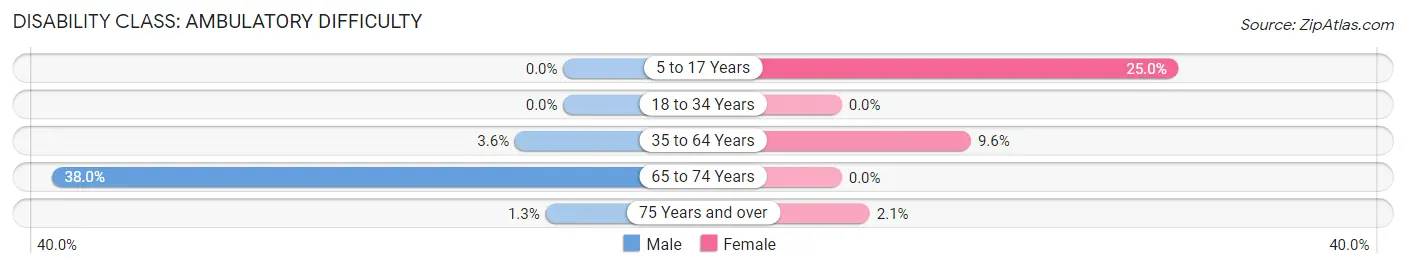
| Age Bracket | Male | Female |
| 5 to 17 Years | 0 (0.0%) | 26 (25.0%) |
| 18 to 34 Years | 0 (0.0%) | 0 (0.0%) |
| 35 to 64 Years | 8 (3.6%) | 21 (9.6%) |
| 65 to 74 Years | 19 (38.0%) | 0 (0.0%) |
| 75 Years and over | 1 (1.3%) | 1 (2.1%) |
Disability Class: Self-Care Difficulty
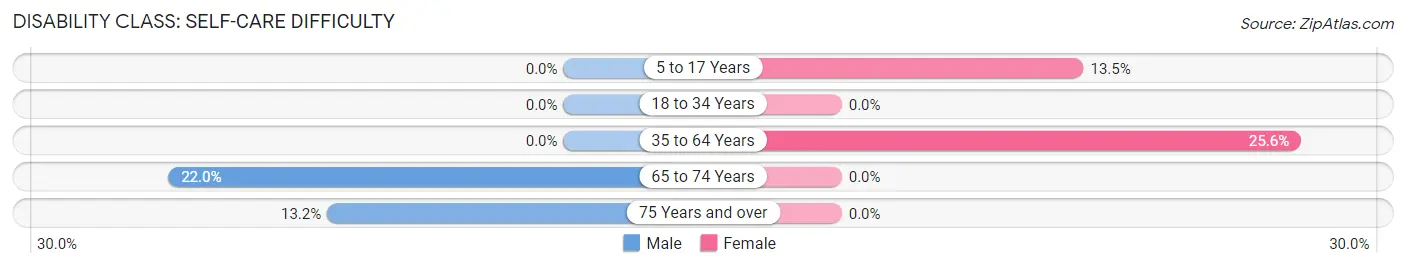
| Age Bracket | Male | Female |
| 5 to 17 Years | 0 (0.0%) | 14 (13.5%) |
| 18 to 34 Years | 0 (0.0%) | 0 (0.0%) |
| 35 to 64 Years | 0 (0.0%) | 56 (25.6%) |
| 65 to 74 Years | 11 (22.0%) | 0 (0.0%) |
| 75 Years and over | 10 (13.2%) | 0 (0.0%) |
Technology Access in Rand
Computing Device Access in Rand
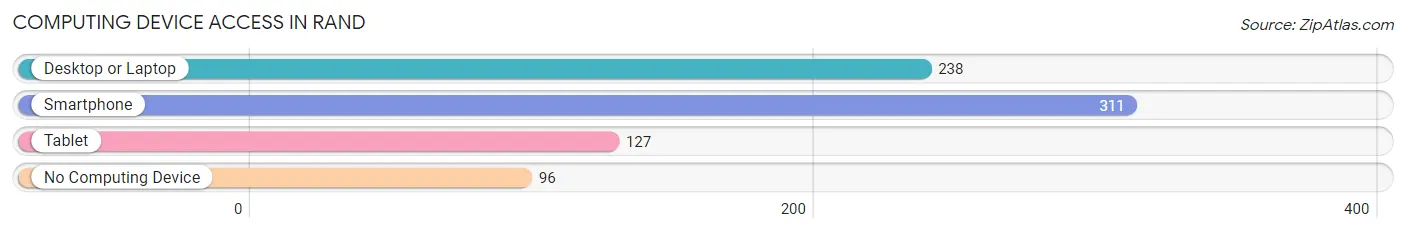
| Device Type | # Households | % Households |
| Desktop or Laptop | 238 | 52.9% |
| Smartphone | 311 | 69.1% |
| Tablet | 127 | 28.2% |
| No Computing Device | 96 | 21.3% |
| Total | 450 | 100.0% |
Internet Access in Rand
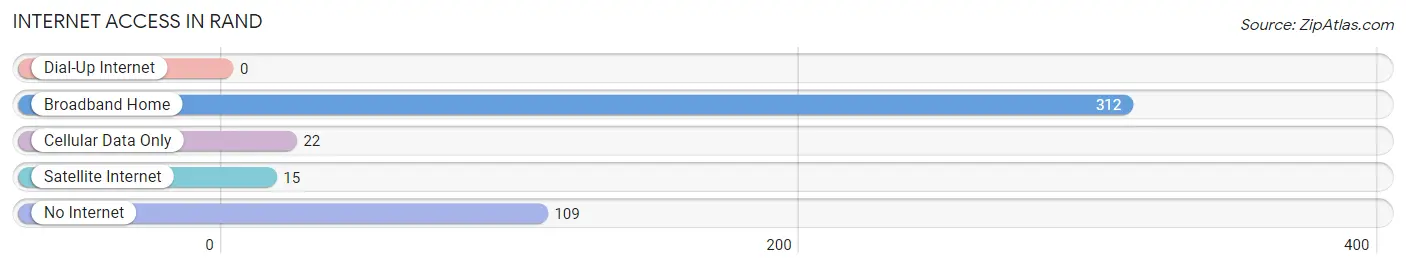
| Internet Type | # Households | % Households |
| Dial-Up Internet | 0 | 0.0% |
| Broadband Home | 312 | 69.3% |
| Cellular Data Only | 22 | 4.9% |
| Satellite Internet | 15 | 3.3% |
| No Internet | 109 | 24.2% |
| Total | 450 | 100.0% |
Rand Summary
Rand, West Virginia is a small unincorporated community located in the northern part of the state, in the county of McDowell. It is situated in the Appalachian Mountains, and is surrounded by the towns of Keystone, Welch, and Gary. The population of Rand was estimated to be around 200 people in 2000.
History
Rand was founded in the late 1800s by a group of coal miners who were looking for a place to call home. The town was named after the nearby Rand Coal Company, which was established in 1891. The company was owned by the Rand family, who were prominent in the area. The town grew quickly, and by the early 1900s, it had become a bustling mining town.
The town was home to several churches, a school, and a post office. The town also had a number of stores, including a general store, a drug store, and a barber shop. The town was also home to a number of saloons, which were popular among the miners.
The town was also home to a number of coal mines, which provided employment for many of the town's residents. The mines were owned by the Rand Coal Company, and the miners worked long hours in dangerous conditions. The mines were eventually closed in the 1950s, and the town's population began to decline.
Geography
Rand is located in the northern part of West Virginia, in the county of McDowell. It is situated in the Appalachian Mountains, and is surrounded by the towns of Keystone, Welch, and Gary. The town is located at an elevation of 2,400 feet, and is situated on the banks of the Tug Fork River.
The town is located in a mountainous region, and is surrounded by forests and rolling hills. The climate in the area is temperate, with cold winters and warm summers. The average annual temperature is around 50 degrees Fahrenheit.
Economy
The economy of Rand is largely based on tourism and agriculture. The town is home to a number of small businesses, including restaurants, stores, and a post office. The town is also home to a number of farms, which produce a variety of crops, including corn, soybeans, and hay.
The town is also home to a number of coal mines, which provide employment for many of the town's residents. The mines are owned by the Rand Coal Company, and the miners work long hours in dangerous conditions.
Demographics
The population of Rand was estimated to be around 200 people in 2000. The town is predominantly white, with a small African American population. The median household income in the town is around $25,000, and the median age is around 40 years old. The town has a high rate of poverty, with around 40% of the population living below the poverty line.
Conclusion
Rand, West Virginia is a small unincorporated community located in the northern part of the state, in the county of McDowell. It is situated in the Appalachian Mountains, and is surrounded by the towns of Keystone, Welch, and Gary. The town has a long history, and was once a bustling mining town. The economy of the town is largely based on tourism and agriculture, and the town is home to a number of small businesses. The population of Rand was estimated to be around 200 people in 2000, and the town is predominantly white. The town has a high rate of poverty, with around 40% of the population living below the poverty line.
Common Questions
What is Per Capita Income in Rand?
Per Capita income in Rand is $23,709.
What is the Median Family Income in Rand?
Median Family Income in Rand is $44,702.
What is the Median Household income in Rand?
Median Household Income in Rand is $37,230.
What is Inequality or Gini Index in Rand?
Inequality or Gini Index in Rand is 0.34.
What is the Total Population of Rand?
Total Population of Rand is 941.
What is the Total Male Population of Rand?
Total Male Population of Rand is 466.
What is the Total Female Population of Rand?
Total Female Population of Rand is 475.
What is the Ratio of Males per 100 Females in Rand?
There are 98.11 Males per 100 Females in Rand.
What is the Ratio of Females per 100 Males in Rand?
There are 101.93 Females per 100 Males in Rand.
What is the Median Population Age in Rand?
Median Population Age in Rand is 50.0 Years.
What is the Average Family Size in Rand
Average Family Size in Rand is 2.9 People.
What is the Average Household Size in Rand
Average Household Size in Rand is 2.1 People.
How Large is the Labor Force in Rand?
There are 365 People in the Labor Forcein in Rand.
What is the Percentage of People in the Labor Force in Rand?
46.1% of People are in the Labor Force in Rand.
What is the Unemployment Rate in Rand?
Unemployment Rate in Rand is 4.9%.