Stonewood, WV Map & Demographics
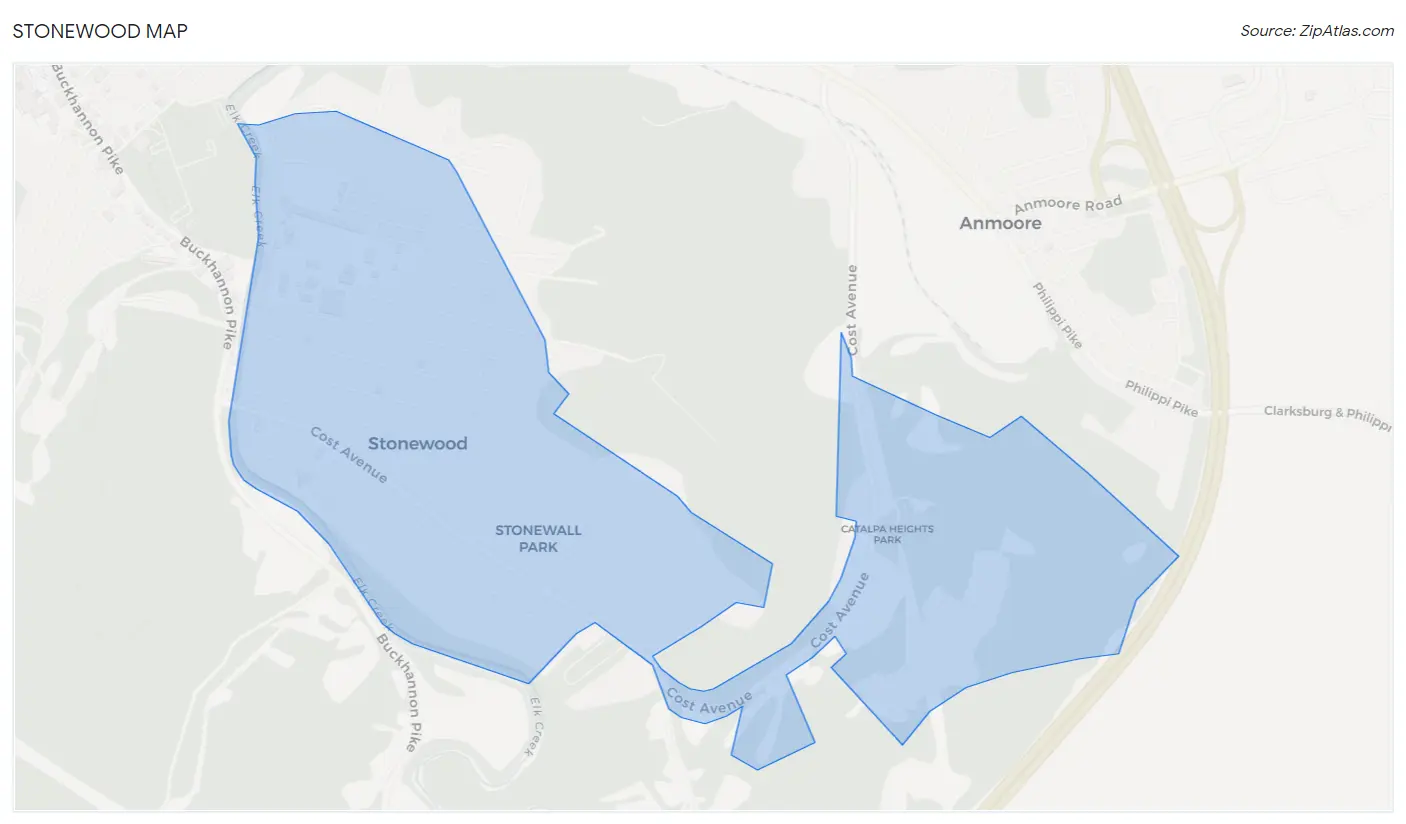
Stonewood Map
Stonewood Overview
$26,796
PER CAPITA INCOME
$58,500
AVG FAMILY INCOME
$49,402
AVG HOUSEHOLD INCOME
17.2%
WAGE / INCOME GAP [ % ]
82.8¢/ $1
WAGE / INCOME GAP [ $ ]
0.37
INEQUALITY / GINI INDEX
2,428
TOTAL POPULATION
1,224
MALE POPULATION
1,204
FEMALE POPULATION
101.66
MALES / 100 FEMALES
98.37
FEMALES / 100 MALES
41.5
MEDIAN AGE
3.3
AVG FAMILY SIZE
2.6
AVG HOUSEHOLD SIZE
1,100
LABOR FORCE [ PEOPLE ]
59.4%
PERCENT IN LABOR FORCE
11.4%
UNEMPLOYMENT RATE
Income in Stonewood
Income Overview in Stonewood
Per Capita Income in Stonewood is $26,796, while median incomes of families and households are $58,500 and $49,402 respectively.
| Characteristic | Number | Measure |
| Per Capita Income | 2,428 | $26,796 |
| Median Family Income | 602 | $58,500 |
| Mean Family Income | 602 | $75,727 |
| Median Household Income | 911 | $49,402 |
| Mean Household Income | 911 | $66,186 |
| Income Deficit | 602 | $0 |
| Wage / Income Gap (%) | 2,428 | 17.22% |
| Wage / Income Gap ($) | 2,428 | 82.78¢ per $1 |
| Gini / Inequality Index | 2,428 | 0.37 |
Earnings by Sex in Stonewood
Average Earnings in Stonewood are $36,182, $40,205 for men and $33,281 for women, a difference of 17.2%.
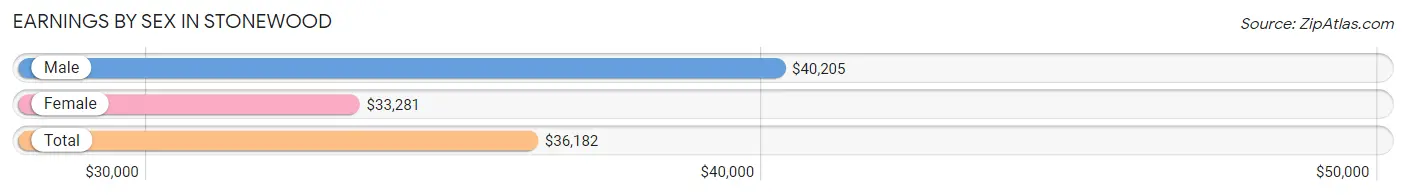
| Sex | Number | Average Earnings |
| Male | 625 (58.6%) | $40,205 |
| Female | 442 (41.4%) | $33,281 |
| Total | 1,067 (100.0%) | $36,182 |
Earnings by Sex by Income Bracket in Stonewood
The most common earnings brackets in Stonewood are $40,000 to $44,999 for men (67 | 10.7%) and $30,000 to $34,999 for women (72 | 16.3%).
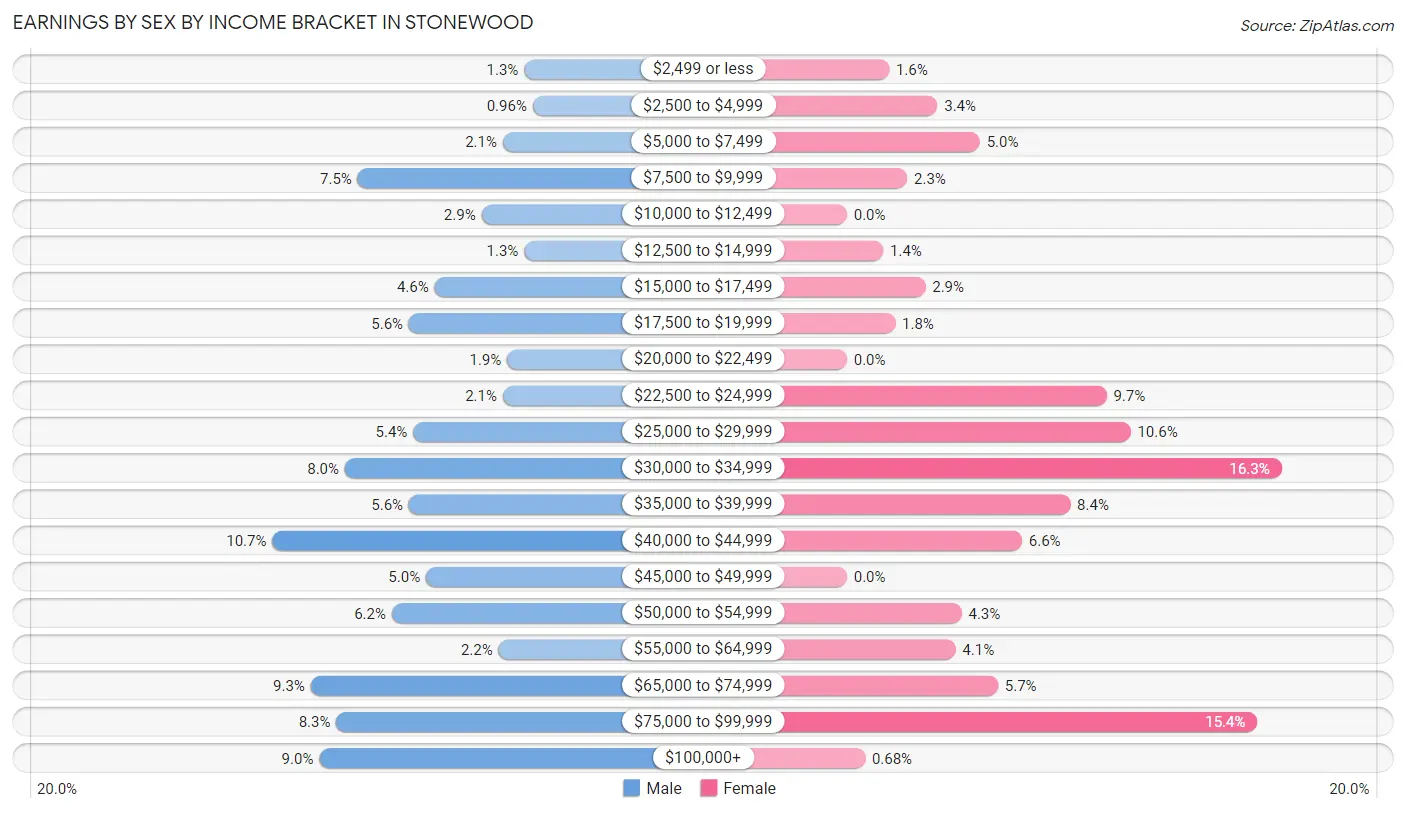
| Income | Male | Female |
| $2,499 or less | 8 (1.3%) | 7 (1.6%) |
| $2,500 to $4,999 | 6 (1.0%) | 15 (3.4%) |
| $5,000 to $7,499 | 13 (2.1%) | 22 (5.0%) |
| $7,500 to $9,999 | 47 (7.5%) | 10 (2.3%) |
| $10,000 to $12,499 | 18 (2.9%) | 0 (0.0%) |
| $12,500 to $14,999 | 8 (1.3%) | 6 (1.4%) |
| $15,000 to $17,499 | 29 (4.6%) | 13 (2.9%) |
| $17,500 to $19,999 | 35 (5.6%) | 8 (1.8%) |
| $20,000 to $22,499 | 12 (1.9%) | 0 (0.0%) |
| $22,500 to $24,999 | 13 (2.1%) | 43 (9.7%) |
| $25,000 to $29,999 | 34 (5.4%) | 47 (10.6%) |
| $30,000 to $34,999 | 50 (8.0%) | 72 (16.3%) |
| $35,000 to $39,999 | 35 (5.6%) | 37 (8.4%) |
| $40,000 to $44,999 | 67 (10.7%) | 29 (6.6%) |
| $45,000 to $49,999 | 31 (5.0%) | 0 (0.0%) |
| $50,000 to $54,999 | 39 (6.2%) | 19 (4.3%) |
| $55,000 to $64,999 | 14 (2.2%) | 18 (4.1%) |
| $65,000 to $74,999 | 58 (9.3%) | 25 (5.7%) |
| $75,000 to $99,999 | 52 (8.3%) | 68 (15.4%) |
| $100,000+ | 56 (9.0%) | 3 (0.7%) |
| Total | 625 (100.0%) | 442 (100.0%) |
Earnings by Sex by Educational Attainment in Stonewood
Average earnings in Stonewood are $42,028 for men and $33,398 for women, a difference of 20.5%. Men with an educational attainment of college or associate's degree enjoy the highest average annual earnings of $58,125, while those with less than high school education earn the least with $30,750. Women with an educational attainment of graduate degree earn the most with the average annual earnings of $87,708, while those with high school diploma education have the smallest earnings of $27,235.
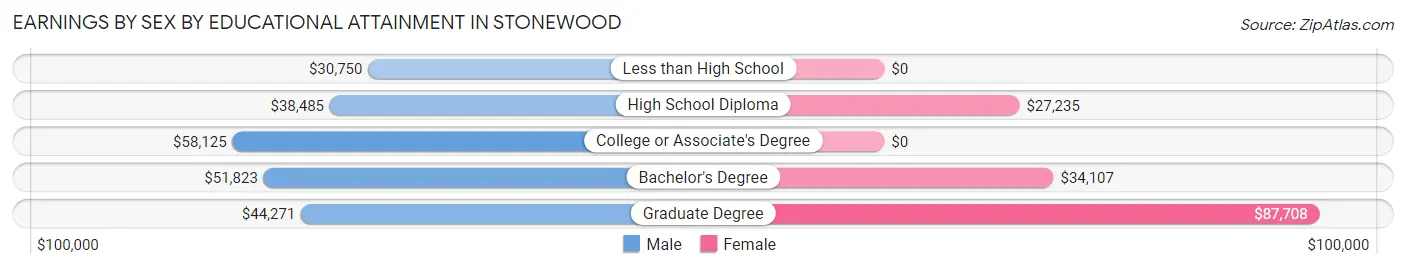
| Educational Attainment | Male Income | Female Income |
| Less than High School | $30,750 | $0 |
| High School Diploma | $38,485 | $27,235 |
| College or Associate's Degree | $58,125 | $0 |
| Bachelor's Degree | $51,823 | $34,107 |
| Graduate Degree | $44,271 | $87,708 |
| Total | $42,028 | $33,398 |
Family Income in Stonewood
Family Income Brackets in Stonewood
According to the Stonewood family income data, there are 155 families falling into the $50,000 to $74,999 income range, which is the most common income bracket and makes up 25.8% of all families. Conversely, the $15,000 to $24,999 income bracket is the least frequent group with only 4 families (0.7%) belonging to this category.
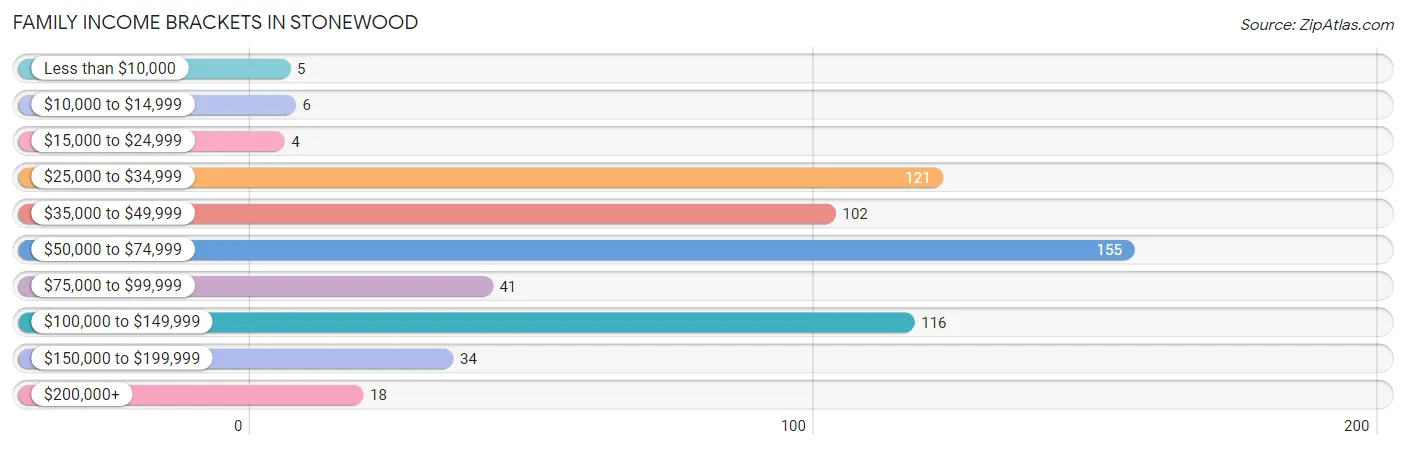
| Income Bracket | # Families | % Families |
| Less than $10,000 | 5 | 0.8% |
| $10,000 to $14,999 | 6 | 1.0% |
| $15,000 to $24,999 | 4 | 0.7% |
| $25,000 to $34,999 | 121 | 20.1% |
| $35,000 to $49,999 | 102 | 16.9% |
| $50,000 to $74,999 | 155 | 25.7% |
| $75,000 to $99,999 | 41 | 6.8% |
| $100,000 to $149,999 | 116 | 19.3% |
| $150,000 to $199,999 | 34 | 5.6% |
| $200,000+ | 18 | 3.0% |
Family Income by Famaliy Size in Stonewood
4-person families (118 | 19.6%) account for the highest median family income in Stonewood with $97,813 per family, while 4-person families (118 | 19.6%) have the highest median income of $24,453 per family member.
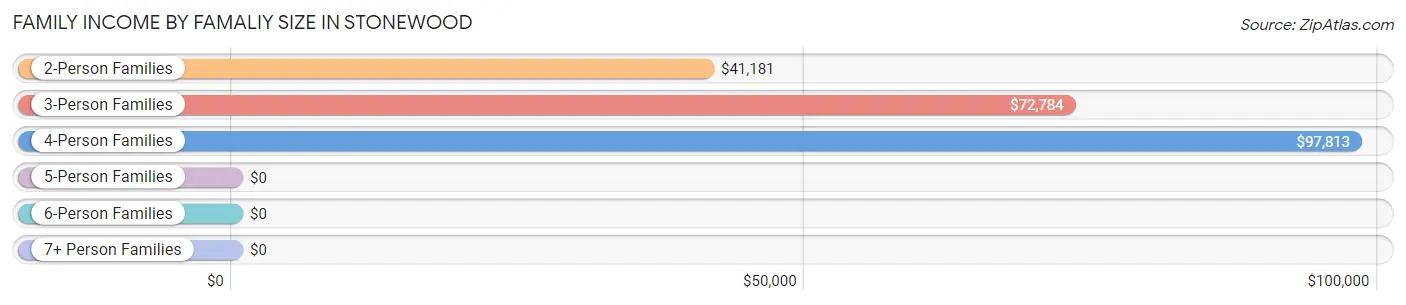
| Income Bracket | # Families | Median Income |
| 2-Person Families | 305 (50.7%) | $41,181 |
| 3-Person Families | 141 (23.4%) | $72,784 |
| 4-Person Families | 118 (19.6%) | $97,813 |
| 5-Person Families | 21 (3.5%) | $0 |
| 6-Person Families | 9 (1.5%) | $0 |
| 7+ Person Families | 8 (1.3%) | $0 |
| Total | 602 (100.0%) | $58,500 |
Family Income by Number of Earners in Stonewood
The median family income in Stonewood is $58,500, with families comprising 3+ earners (24) having the highest median family income of $197,500, while families with 1 earner (250) have the lowest median family income of $38,523, accounting for 4.0% and 41.5% of families, respectively.
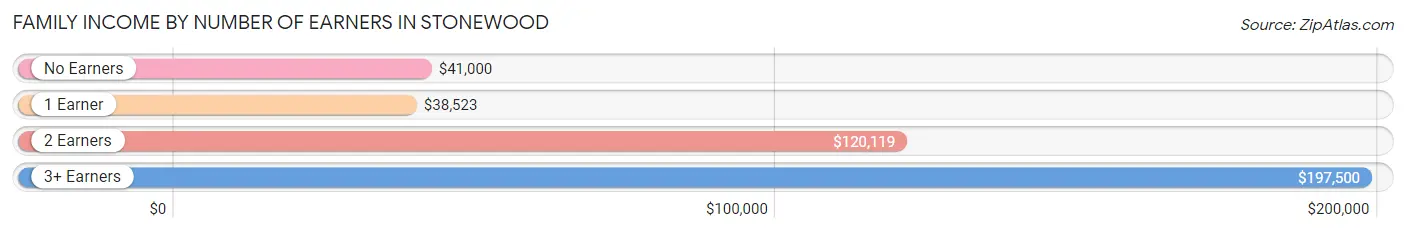
| Number of Earners | # Families | Median Income |
| No Earners | 102 (16.9%) | $41,000 |
| 1 Earner | 250 (41.5%) | $38,523 |
| 2 Earners | 226 (37.5%) | $120,119 |
| 3+ Earners | 24 (4.0%) | $197,500 |
| Total | 602 (100.0%) | $58,500 |
Household Income in Stonewood
Household Income Brackets in Stonewood
With 210 households falling in the category, the $35,000 to $49,999 income range is the most frequent in Stonewood, accounting for 23.1% of all households. In contrast, only 14 households (1.5%) fall into the less than $10,000 income bracket, making it the least populous group.
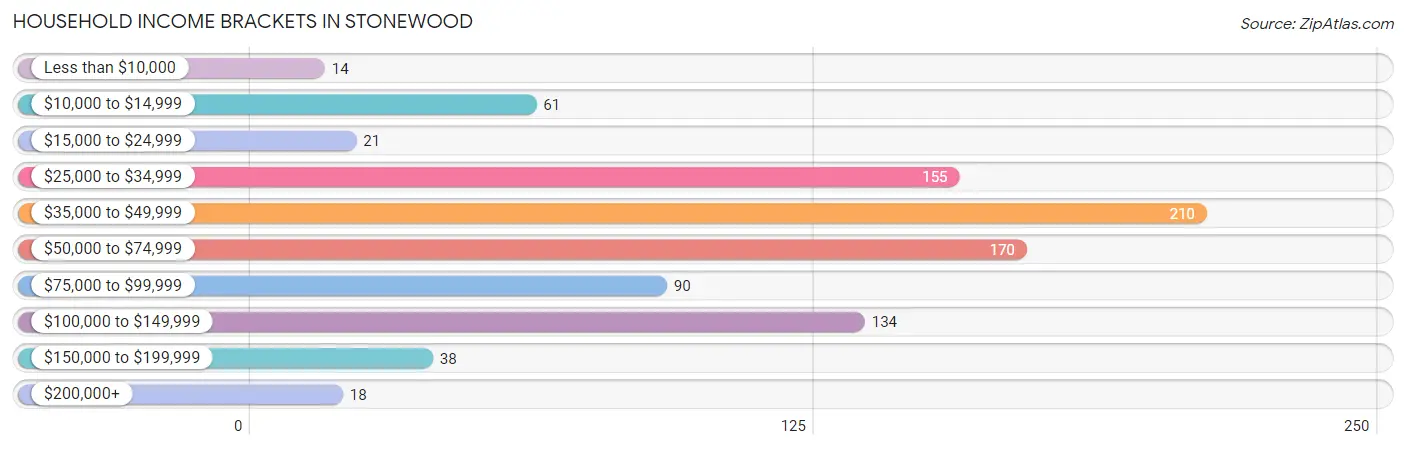
| Income Bracket | # Households | % Households |
| Less than $10,000 | 14 | 1.5% |
| $10,000 to $14,999 | 61 | 6.7% |
| $15,000 to $24,999 | 21 | 2.3% |
| $25,000 to $34,999 | 155 | 17.0% |
| $35,000 to $49,999 | 210 | 23.1% |
| $50,000 to $74,999 | 170 | 18.7% |
| $75,000 to $99,999 | 90 | 9.9% |
| $100,000 to $149,999 | 134 | 14.7% |
| $150,000 to $199,999 | 38 | 4.2% |
| $200,000+ | 18 | 2.0% |
Household Income by Householder Age in Stonewood
The median household income in Stonewood is $49,402, with the highest median household income of $73,889 found in the 25 to 44 years age bracket for the primary householder. A total of 238 households (26.1%) fall into this category. Meanwhile, the 15 to 24 years age bracket for the primary householder has the lowest median household income of $0, with 7 households (0.8%) in this group.
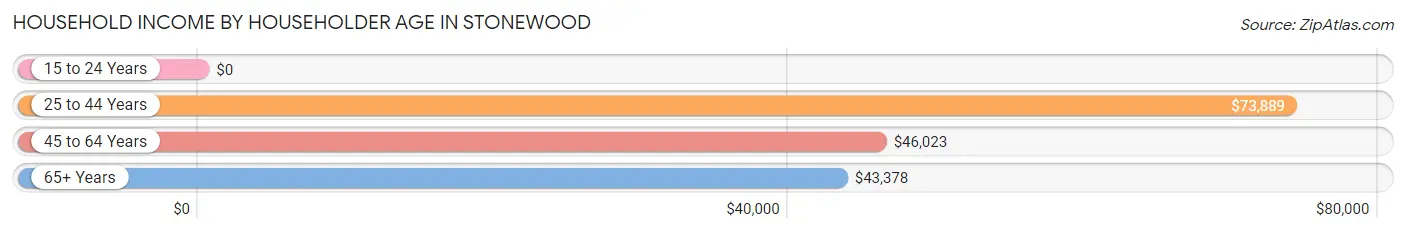
| Income Bracket | # Households | Median Income |
| 15 to 24 Years | 7 (0.8%) | $0 |
| 25 to 44 Years | 238 (26.1%) | $73,889 |
| 45 to 64 Years | 369 (40.5%) | $46,023 |
| 65+ Years | 297 (32.6%) | $43,378 |
| Total | 911 (100.0%) | $49,402 |
Poverty in Stonewood
Income Below Poverty by Sex and Age in Stonewood
With 7.3% poverty level for males and 11.8% for females among the residents of Stonewood, 16 and 17 year old males and 16 and 17 year old females are the most vulnerable to poverty, with 13 males (25.0%) and 7 females (100.0%) in their respective age groups living below the poverty level.
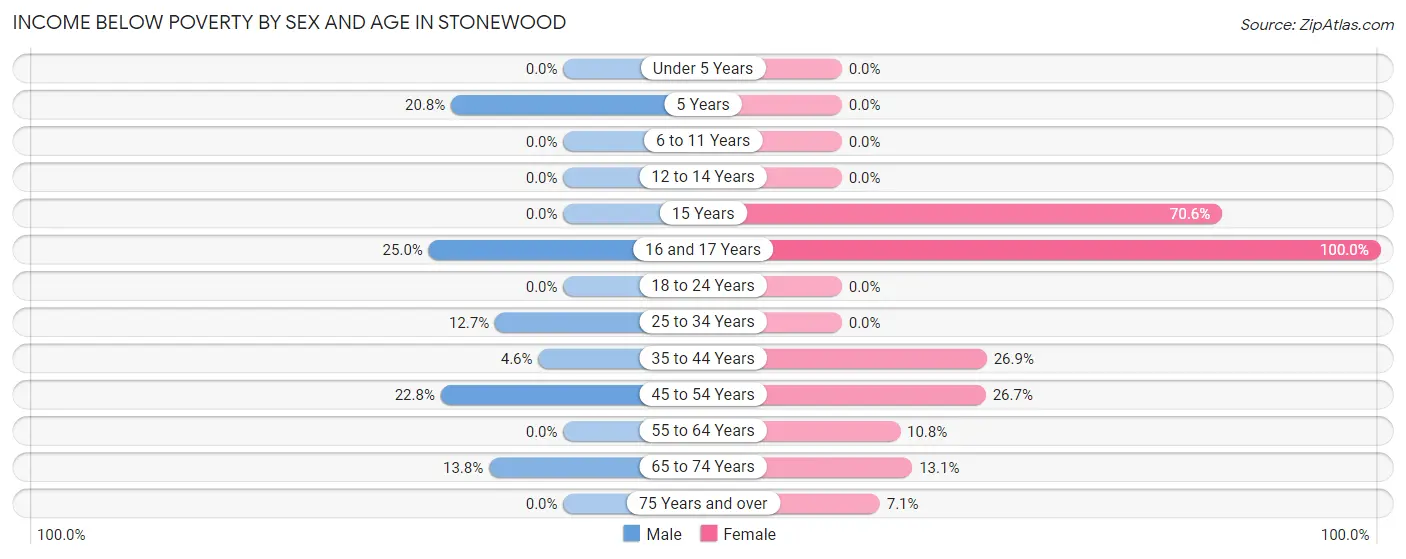
| Age Bracket | Male | Female |
| Under 5 Years | 0 (0.0%) | 0 (0.0%) |
| 5 Years | 5 (20.8%) | 0 (0.0%) |
| 6 to 11 Years | 0 (0.0%) | 0 (0.0%) |
| 12 to 14 Years | 0 (0.0%) | 0 (0.0%) |
| 15 Years | 0 (0.0%) | 12 (70.6%) |
| 16 and 17 Years | 13 (25.0%) | 7 (100.0%) |
| 18 to 24 Years | 0 (0.0%) | 0 (0.0%) |
| 25 to 34 Years | 17 (12.7%) | 0 (0.0%) |
| 35 to 44 Years | 9 (4.6%) | 46 (26.9%) |
| 45 to 54 Years | 33 (22.8%) | 31 (26.7%) |
| 55 to 64 Years | 0 (0.0%) | 20 (10.8%) |
| 65 to 74 Years | 12 (13.8%) | 14 (13.1%) |
| 75 Years and over | 0 (0.0%) | 11 (7.0%) |
| Total | 89 (7.3%) | 141 (11.8%) |
Income Above Poverty by Sex and Age in Stonewood
According to the poverty statistics in Stonewood, males aged under 5 years and females aged under 5 years are the age groups that are most secure financially, with 100.0% of males and 100.0% of females in these age groups living above the poverty line.
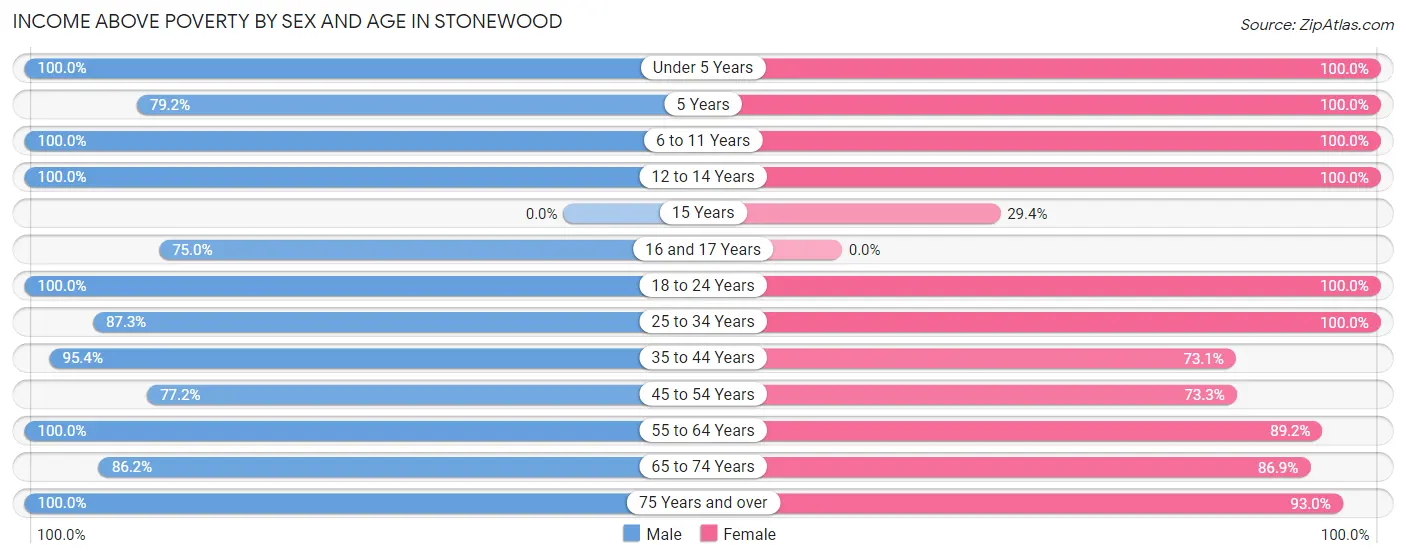
| Age Bracket | Male | Female |
| Under 5 Years | 34 (100.0%) | 81 (100.0%) |
| 5 Years | 19 (79.2%) | 16 (100.0%) |
| 6 to 11 Years | 193 (100.0%) | 87 (100.0%) |
| 12 to 14 Years | 48 (100.0%) | 68 (100.0%) |
| 15 Years | 0 (0.0%) | 5 (29.4%) |
| 16 and 17 Years | 39 (75.0%) | 0 (0.0%) |
| 18 to 24 Years | 79 (100.0%) | 51 (100.0%) |
| 25 to 34 Years | 117 (87.3%) | 134 (100.0%) |
| 35 to 44 Years | 185 (95.4%) | 125 (73.1%) |
| 45 to 54 Years | 112 (77.2%) | 85 (73.3%) |
| 55 to 64 Years | 166 (100.0%) | 165 (89.2%) |
| 65 to 74 Years | 75 (86.2%) | 93 (86.9%) |
| 75 Years and over | 68 (100.0%) | 145 (92.9%) |
| Total | 1,135 (92.7%) | 1,055 (88.2%) |
Income Below Poverty Among Married-Couple Families in Stonewood
The poverty statistics for married-couple families in Stonewood show that 3.2% or 14 of the total 438 families live below the poverty line. Families with 1 or 2 children have the highest poverty rate of 9.7%, comprising of 14 families. On the other hand, families with no children have the lowest poverty rate of 0.0%, which includes 0 families.
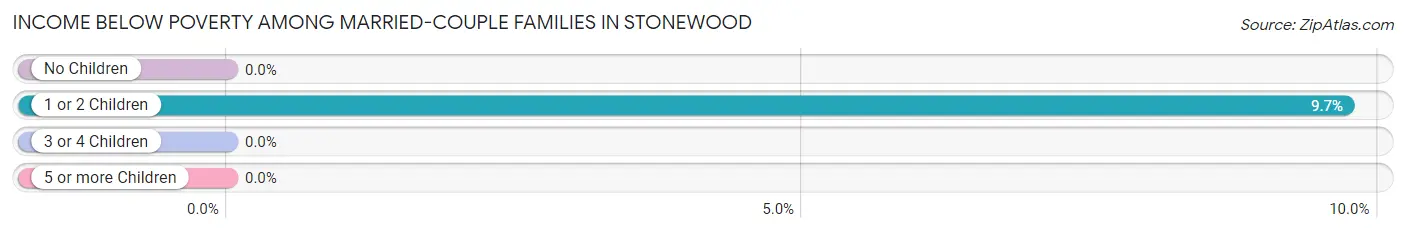
| Children | Above Poverty | Below Poverty |
| No Children | 271 (100.0%) | 0 (0.0%) |
| 1 or 2 Children | 130 (90.3%) | 14 (9.7%) |
| 3 or 4 Children | 23 (100.0%) | 0 (0.0%) |
| 5 or more Children | 0 (0.0%) | 0 (0.0%) |
| Total | 424 (96.8%) | 14 (3.2%) |
Income Below Poverty Among Single-Parent Households in Stonewood
According to the poverty data in Stonewood, 18.5% or 5 single-father households and 4.4% or 6 single-mother households are living below the poverty line. Among single-father households, those with 1 or 2 children have the highest poverty rate, with 5 households (18.5%) experiencing poverty. Likewise, among single-mother households, those with 1 or 2 children have the highest poverty rate, with 6 households (9.2%) falling below the poverty line.
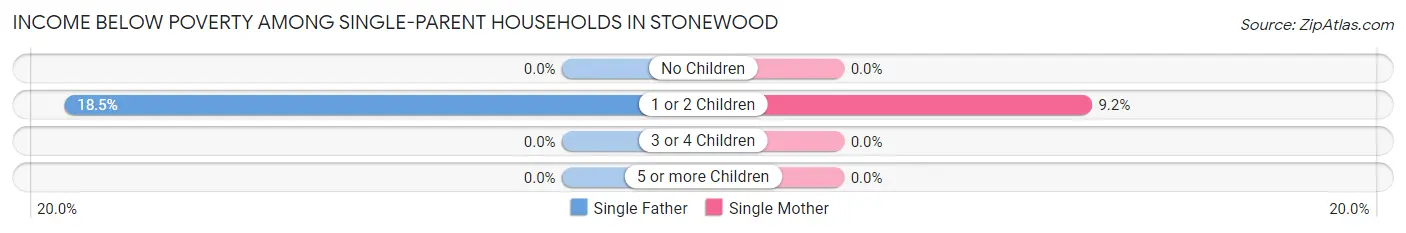
| Children | Single Father | Single Mother |
| No Children | 0 (0.0%) | 0 (0.0%) |
| 1 or 2 Children | 5 (18.5%) | 6 (9.2%) |
| 3 or 4 Children | 0 (0.0%) | 0 (0.0%) |
| 5 or more Children | 0 (0.0%) | 0 (0.0%) |
| Total | 5 (18.5%) | 6 (4.4%) |
Income Below Poverty Among Married-Couple vs Single-Parent Households in Stonewood
The poverty data for Stonewood shows that 14 of the married-couple family households (3.2%) and 11 of the single-parent households (6.7%) are living below the poverty level. Within the married-couple family households, those with 1 or 2 children have the highest poverty rate, with 14 households (9.7%) falling below the poverty line. Among the single-parent households, those with 1 or 2 children have the highest poverty rate, with 11 household (12.0%) living below poverty.
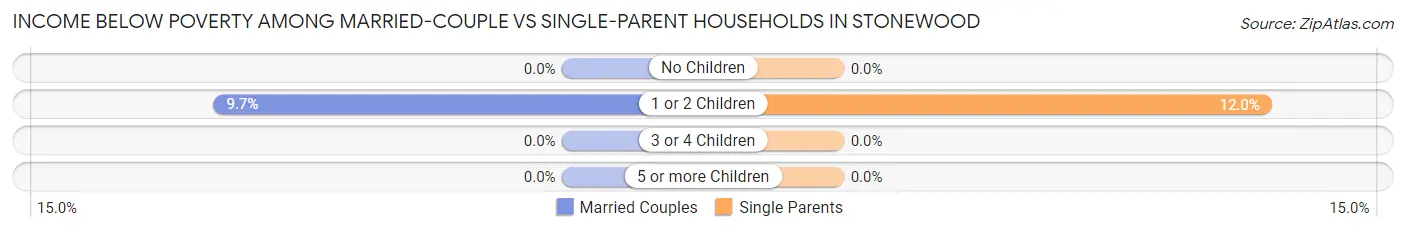
| Children | Married-Couple Families | Single-Parent Households |
| No Children | 0 (0.0%) | 0 (0.0%) |
| 1 or 2 Children | 14 (9.7%) | 11 (12.0%) |
| 3 or 4 Children | 0 (0.0%) | 0 (0.0%) |
| 5 or more Children | 0 (0.0%) | 0 (0.0%) |
| Total | 14 (3.2%) | 11 (6.7%) |
Race in Stonewood
The most populous races in Stonewood are White / Caucasian (2,158 | 88.9%), Black / African American (139 | 5.7%), and Two or more Races (130 | 5.3%).
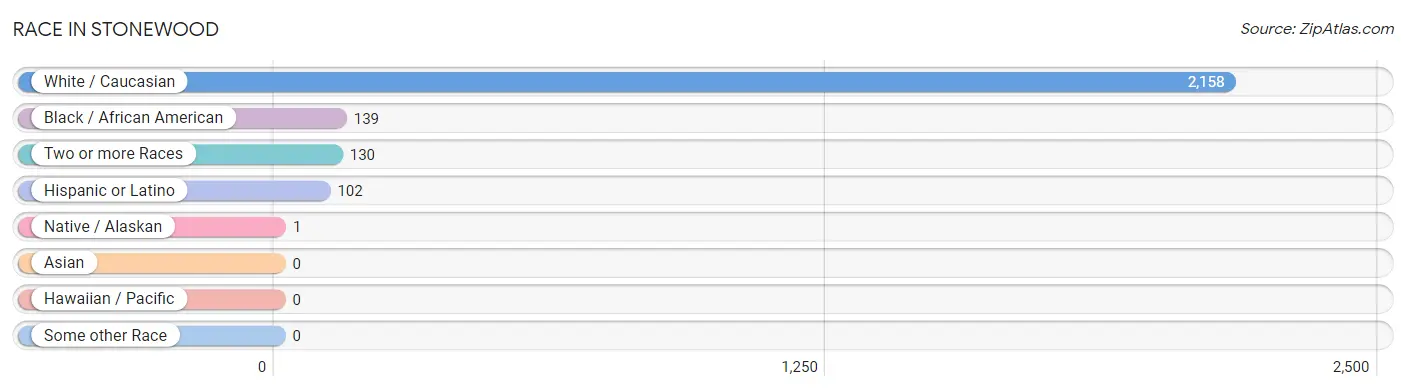
| Race | # Population | % Population |
| Asian | 0 | 0.0% |
| Black / African American | 139 | 5.7% |
| Hawaiian / Pacific | 0 | 0.0% |
| Hispanic or Latino | 102 | 4.2% |
| Native / Alaskan | 1 | 0.0% |
| White / Caucasian | 2,158 | 88.9% |
| Two or more Races | 130 | 5.3% |
| Some other Race | 0 | 0.0% |
| Total | 2,428 | 100.0% |
Ancestry in Stonewood
The most populous ancestries reported in Stonewood are Irish (436 | 18.0%), Italian (354 | 14.6%), English (340 | 14.0%), German (294 | 12.1%), and American (197 | 8.1%), together accounting for 66.8% of all Stonewood residents.
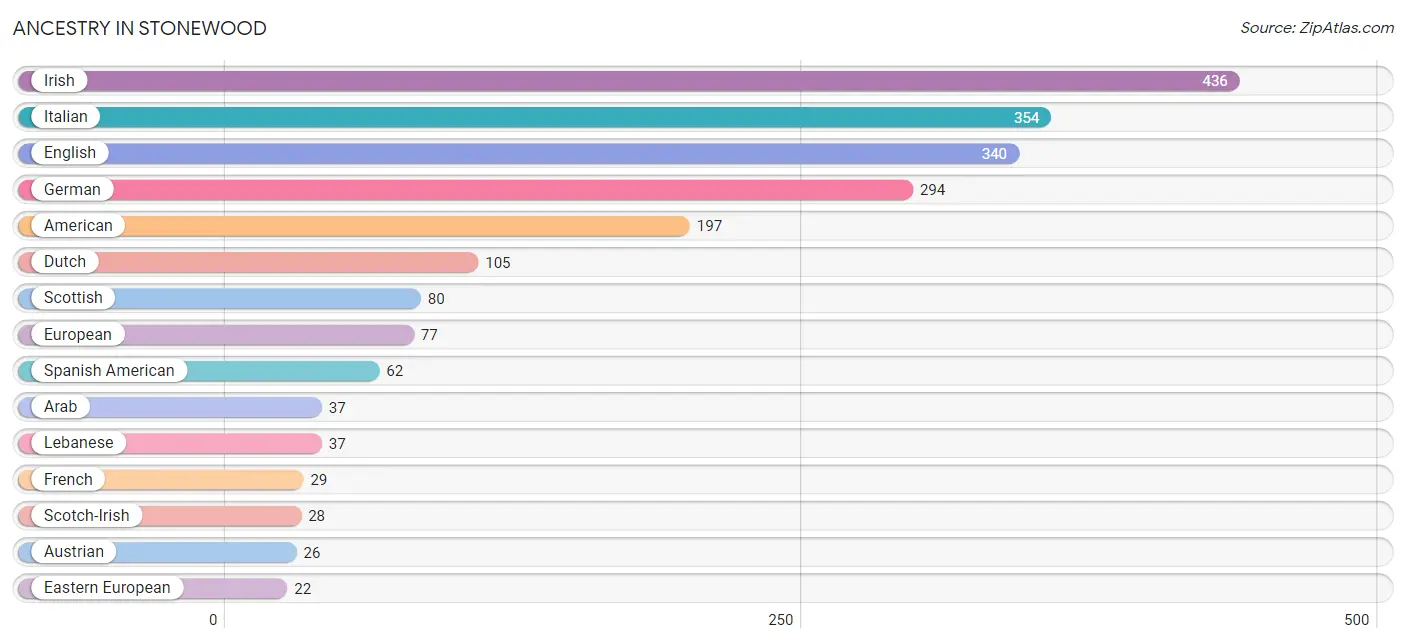
| Ancestry | # Population | % Population |
| American | 197 | 8.1% |
| Arab | 37 | 1.5% |
| Austrian | 26 | 1.1% |
| Belgian | 15 | 0.6% |
| British | 6 | 0.3% |
| Central American | 16 | 0.7% |
| Cherokee | 1 | 0.0% |
| Czechoslovakian | 6 | 0.3% |
| Dutch | 105 | 4.3% |
| Eastern European | 22 | 0.9% |
| English | 340 | 14.0% |
| European | 77 | 3.2% |
| French | 29 | 1.2% |
| French Canadian | 8 | 0.3% |
| German | 294 | 12.1% |
| Hungarian | 3 | 0.1% |
| Irish | 436 | 18.0% |
| Italian | 354 | 14.6% |
| Lebanese | 37 | 1.5% |
| Northern European | 3 | 0.1% |
| Panamanian | 16 | 0.7% |
| Polish | 15 | 0.6% |
| Puerto Rican | 11 | 0.4% |
| Scotch-Irish | 28 | 1.1% |
| Scottish | 80 | 3.3% |
| Slavic | 1 | 0.0% |
| Slovak | 12 | 0.5% |
| Spaniard | 13 | 0.5% |
| Spanish American | 62 | 2.5% | View All 29 Rows |
Immigrants in Stonewood
The most numerous immigrant groups reported in Stonewood came from Africa (14 | 0.6%), South Africa (9 | 0.4%), Central America (7 | 0.3%), Latin America (7 | 0.3%), and Panama (7 | 0.3%), together accounting for 1.8% of all Stonewood residents.
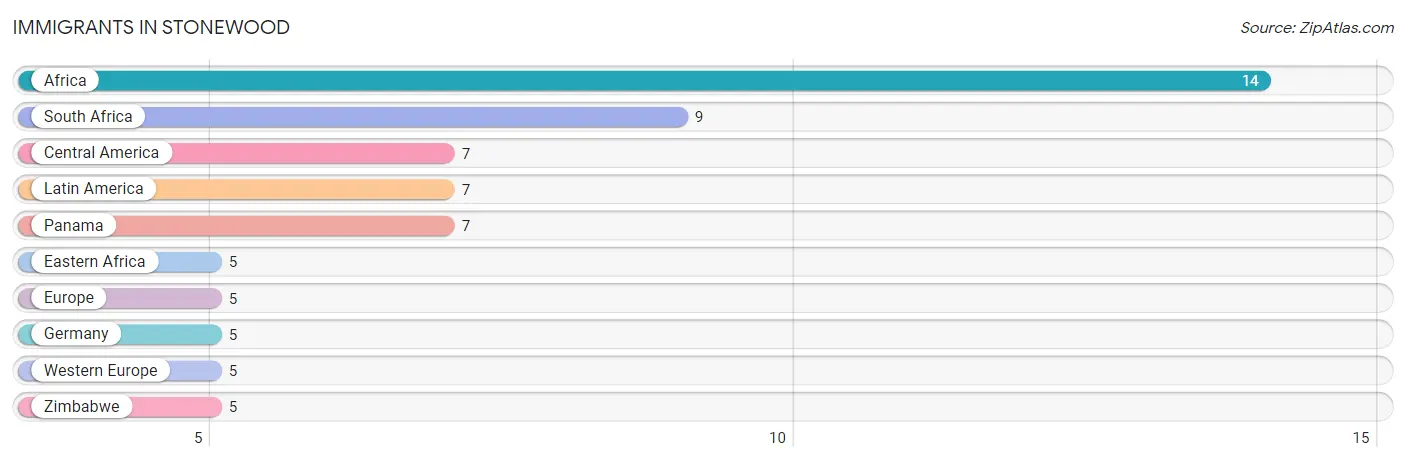
| Immigration Origin | # Population | % Population |
| Africa | 14 | 0.6% |
| Central America | 7 | 0.3% |
| Eastern Africa | 5 | 0.2% |
| Europe | 5 | 0.2% |
| Germany | 5 | 0.2% |
| Latin America | 7 | 0.3% |
| Panama | 7 | 0.3% |
| South Africa | 9 | 0.4% |
| Western Europe | 5 | 0.2% |
| Zimbabwe | 5 | 0.2% | View All 10 Rows |
Sex and Age in Stonewood
Sex and Age in Stonewood
The most populous age groups in Stonewood are 5 to 9 Years (180 | 14.7%) for men and 40 to 44 Years (134 | 11.1%) for women.
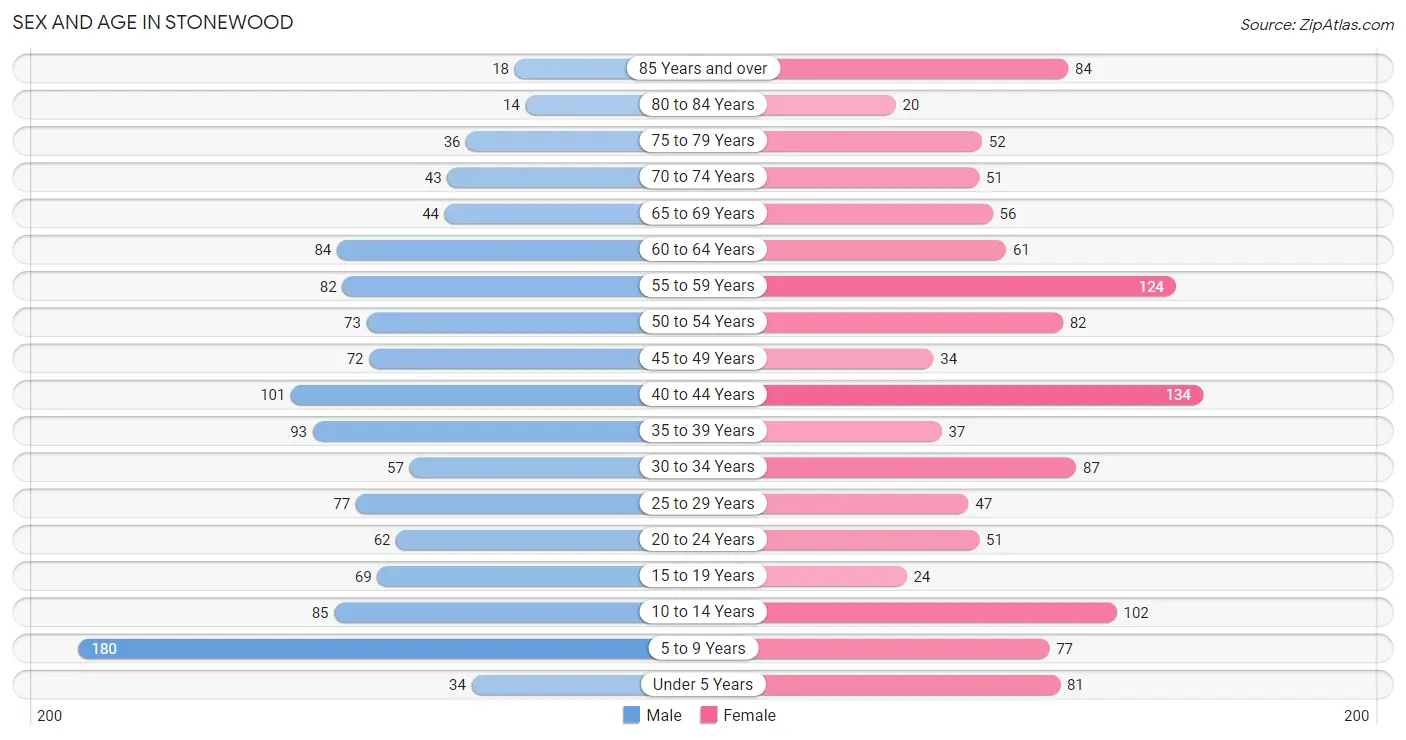
| Age Bracket | Male | Female |
| Under 5 Years | 34 (2.8%) | 81 (6.7%) |
| 5 to 9 Years | 180 (14.7%) | 77 (6.4%) |
| 10 to 14 Years | 85 (6.9%) | 102 (8.5%) |
| 15 to 19 Years | 69 (5.6%) | 24 (2.0%) |
| 20 to 24 Years | 62 (5.1%) | 51 (4.2%) |
| 25 to 29 Years | 77 (6.3%) | 47 (3.9%) |
| 30 to 34 Years | 57 (4.7%) | 87 (7.2%) |
| 35 to 39 Years | 93 (7.6%) | 37 (3.1%) |
| 40 to 44 Years | 101 (8.3%) | 134 (11.1%) |
| 45 to 49 Years | 72 (5.9%) | 34 (2.8%) |
| 50 to 54 Years | 73 (6.0%) | 82 (6.8%) |
| 55 to 59 Years | 82 (6.7%) | 124 (10.3%) |
| 60 to 64 Years | 84 (6.9%) | 61 (5.1%) |
| 65 to 69 Years | 44 (3.6%) | 56 (4.6%) |
| 70 to 74 Years | 43 (3.5%) | 51 (4.2%) |
| 75 to 79 Years | 36 (2.9%) | 52 (4.3%) |
| 80 to 84 Years | 14 (1.1%) | 20 (1.7%) |
| 85 Years and over | 18 (1.5%) | 84 (7.0%) |
| Total | 1,224 (100.0%) | 1,204 (100.0%) |
Families and Households in Stonewood
Median Family Size in Stonewood
The median family size in Stonewood is 3.26 persons per family, with single male/father families (27 | 4.5%) accounting for the largest median family size of 3.74 persons per family. On the other hand, single female/mother families (137 | 22.8%) represent the smallest median family size with 3.12 persons per family.
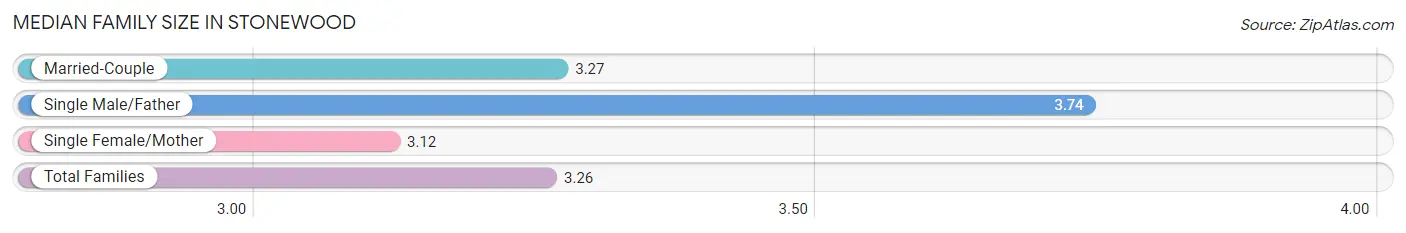
| Family Type | # Families | Family Size |
| Married-Couple | 438 (72.8%) | 3.27 |
| Single Male/Father | 27 (4.5%) | 3.74 |
| Single Female/Mother | 137 (22.8%) | 3.12 |
| Total Families | 602 (100.0%) | 3.26 |
Median Household Size in Stonewood
The median household size in Stonewood is 2.65 persons per household, with single male/father households (27 | 3.0%) accounting for the largest median household size of 5.44 persons per household. non-family households (309 | 33.9%) represent the smallest median household size with 1.13 persons per household.
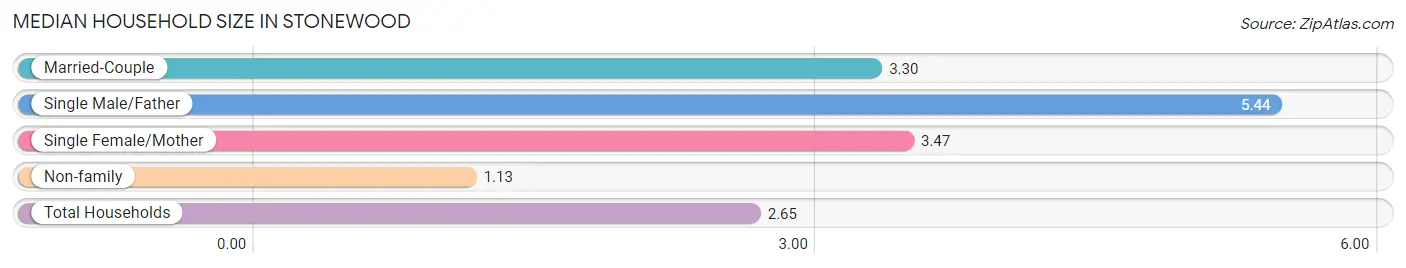
| Household Type | # Households | Household Size |
| Married-Couple | 438 (48.1%) | 3.30 |
| Single Male/Father | 27 (3.0%) | 5.44 |
| Single Female/Mother | 137 (15.0%) | 3.47 |
| Non-family | 309 (33.9%) | 1.13 |
| Total Households | 911 (100.0%) | 2.65 |
Household Size by Marriage Status in Stonewood
Out of a total of 911 households in Stonewood, 602 (66.1%) are family households, while 309 (33.9%) are nonfamily households. The most numerous type of family households are 2-person households, comprising 273, and the most common type of nonfamily households are 1-person households, comprising 281.
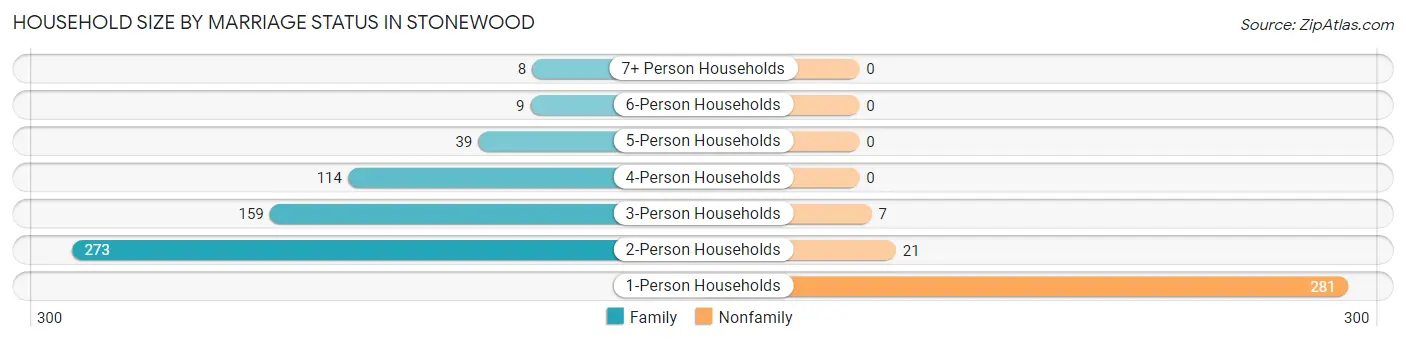
| Household Size | Family Households | Nonfamily Households |
| 1-Person Households | - | 281 (30.8%) |
| 2-Person Households | 273 (30.0%) | 21 (2.3%) |
| 3-Person Households | 159 (17.4%) | 7 (0.8%) |
| 4-Person Households | 114 (12.5%) | 0 (0.0%) |
| 5-Person Households | 39 (4.3%) | 0 (0.0%) |
| 6-Person Households | 9 (1.0%) | 0 (0.0%) |
| 7+ Person Households | 8 (0.9%) | 0 (0.0%) |
| Total | 602 (66.1%) | 309 (33.9%) |
Female Fertility in Stonewood
Fertility by Age in Stonewood
Average fertility rate in Stonewood is 48.0 births per 1,000 women. Women in the age bracket of 20 to 34 years have the highest fertility rate with 119.0 births per 1,000 women. Women in the age bracket of 20 to 34 years acount for 100.0% of all women with births.
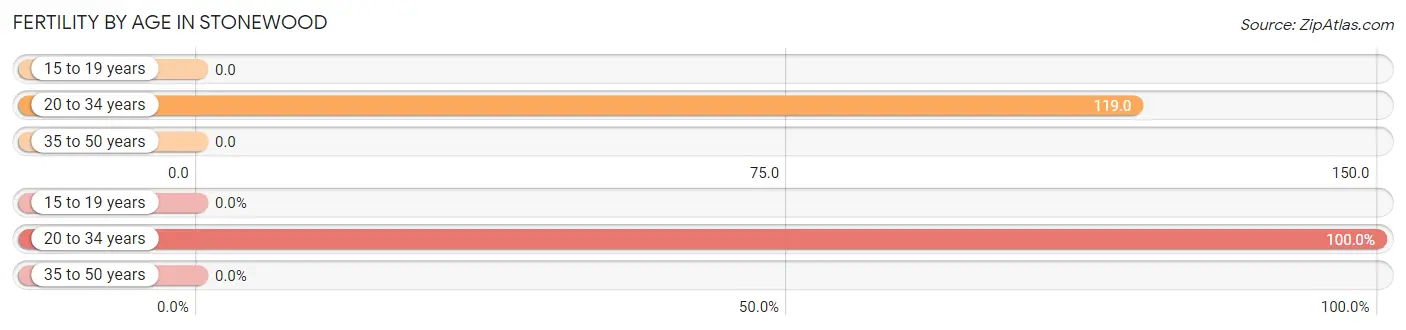
| Age Bracket | Women with Births | Births / 1,000 Women |
| 15 to 19 years | 0 (0.0%) | 0.0 |
| 20 to 34 years | 22 (100.0%) | 119.0 |
| 35 to 50 years | 0 (0.0%) | 0.0 |
| Total | 22 (100.0%) | 48.0 |
Fertility by Age by Marriage Status in Stonewood
| Age Bracket | Married | Unmarried |
| 15 to 19 years | 0 (0.0%) | 0 (0.0%) |
| 20 to 34 years | 22 (100.0%) | 0 (0.0%) |
| 35 to 50 years | 0 (0.0%) | 0 (0.0%) |
| Total | 22 (100.0%) | 0 (0.0%) |
Fertility by Education in Stonewood
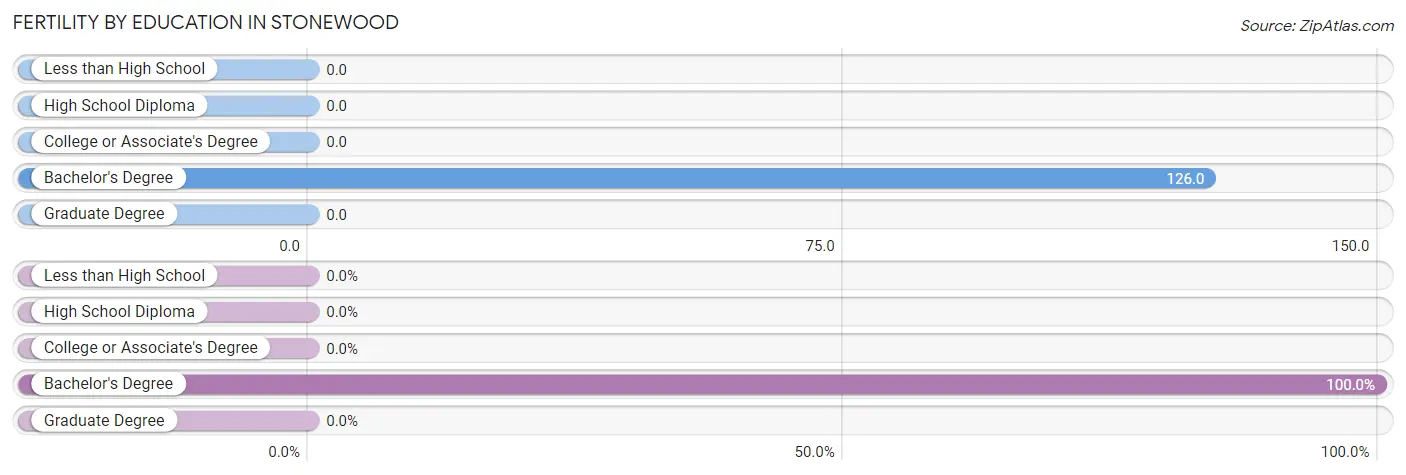
| Educational Attainment | Women with Births | Births / 1,000 Women |
| Less than High School | 0 (0.0%) | 0.0 |
| High School Diploma | 0 (0.0%) | 0.0 |
| College or Associate's Degree | 0 (0.0%) | 0.0 |
| Bachelor's Degree | 22 (100.0%) | 126.0 |
| Graduate Degree | 0 (0.0%) | 0.0 |
| Total | 22 (100.0%) | 48.0 |
Fertility by Education by Marriage Status in Stonewood
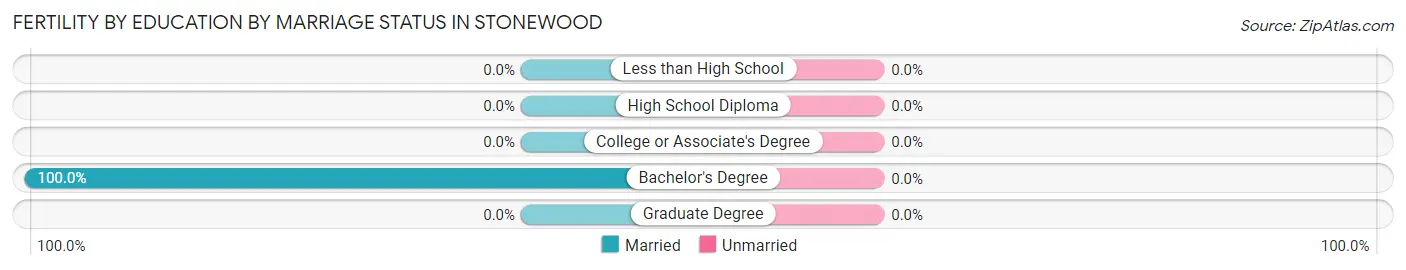
| Educational Attainment | Married | Unmarried |
| Less than High School | 0 (0.0%) | 0 (0.0%) |
| High School Diploma | 0 (0.0%) | 0 (0.0%) |
| College or Associate's Degree | 0 (0.0%) | 0 (0.0%) |
| Bachelor's Degree | 22 (100.0%) | 0 (0.0%) |
| Graduate Degree | 0 (0.0%) | 0 (0.0%) |
| Total | 22 (100.0%) | 0 (0.0%) |
Employment Characteristics in Stonewood
Employment by Class of Employer in Stonewood
Among the 971 employed individuals in Stonewood, private company employees (626 | 64.5%), not-for-profit organizations (101 | 10.4%), and local government employees (95 | 9.8%) make up the most common classes of employment.
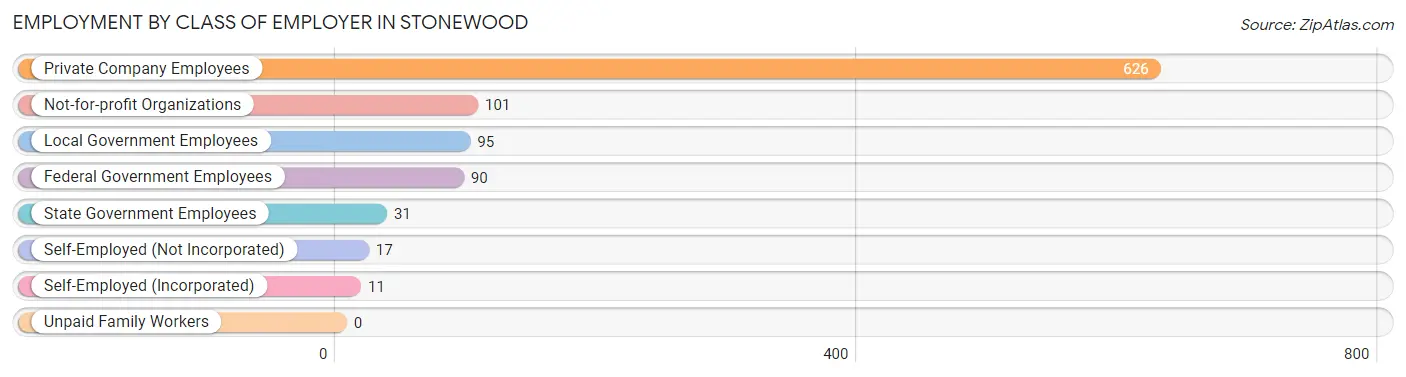
| Employer Class | # Employees | % Employees |
| Private Company Employees | 626 | 64.5% |
| Self-Employed (Incorporated) | 11 | 1.1% |
| Self-Employed (Not Incorporated) | 17 | 1.8% |
| Not-for-profit Organizations | 101 | 10.4% |
| Local Government Employees | 95 | 9.8% |
| State Government Employees | 31 | 3.2% |
| Federal Government Employees | 90 | 9.3% |
| Unpaid Family Workers | 0 | 0.0% |
| Total | 971 | 100.0% |
Employment Status by Age in Stonewood
According to the labor force statistics for Stonewood, out of the total population over 16 years of age (1,852), 59.4% or 1,100 individuals are in the labor force, with 11.4% or 125 of them unemployed. The age group with the highest labor force participation rate is 25 to 29 years, with 95.2% or 118 individuals in the labor force. Within the labor force, the 65 to 74 years age range has the highest percentage of unemployed individuals, with 45.5% or 25 of them being unemployed.
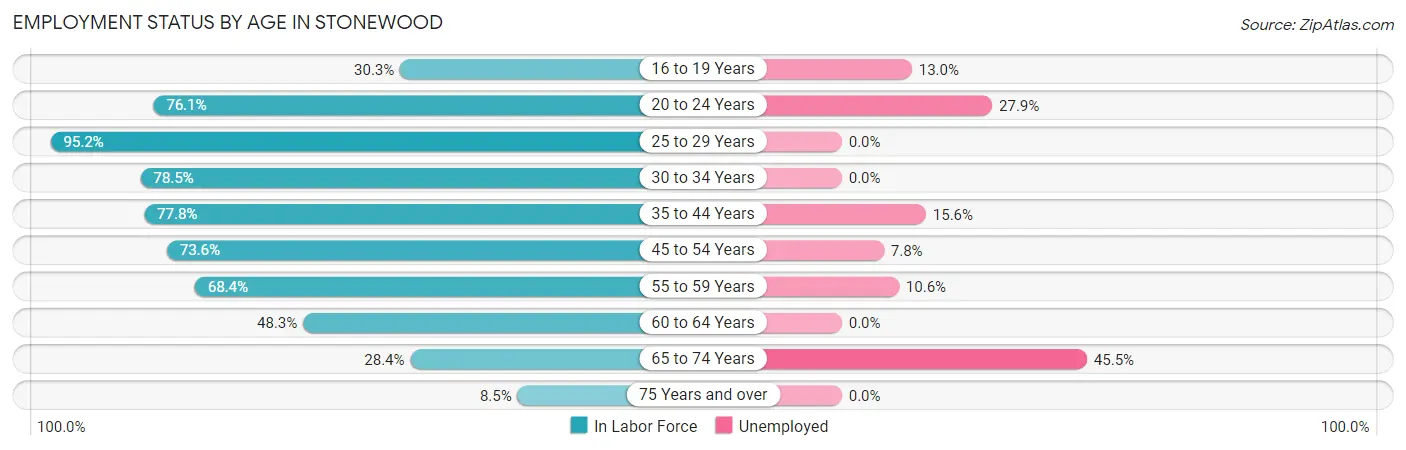
| Age Bracket | In Labor Force | Unemployed |
| 16 to 19 Years | 23 (30.3%) | 3 (13.0%) |
| 20 to 24 Years | 86 (76.1%) | 24 (27.9%) |
| 25 to 29 Years | 118 (95.2%) | 0 (0.0%) |
| 30 to 34 Years | 113 (78.5%) | 0 (0.0%) |
| 35 to 44 Years | 284 (77.8%) | 44 (15.6%) |
| 45 to 54 Years | 192 (73.6%) | 15 (7.8%) |
| 55 to 59 Years | 141 (68.4%) | 15 (10.6%) |
| 60 to 64 Years | 70 (48.3%) | 0 (0.0%) |
| 65 to 74 Years | 55 (28.4%) | 25 (45.5%) |
| 75 Years and over | 19 (8.5%) | 0 (0.0%) |
| Total | 1,100 (59.4%) | 125 (11.4%) |
Employment Status by Educational Attainment in Stonewood
According to labor force statistics for Stonewood, 73.7% of individuals (918) out of the total population between 25 and 64 years of age (1,245) are in the labor force, with 8.0% or 73 of them being unemployed. The group with the highest labor force participation rate are those with the educational attainment of bachelor's degree or higher, with 90.8% or 306 individuals in the labor force. Within the labor force, individuals with bachelor's degree or higher education have the highest percentage of unemployment, with 14.1% or 43 of them being unemployed.
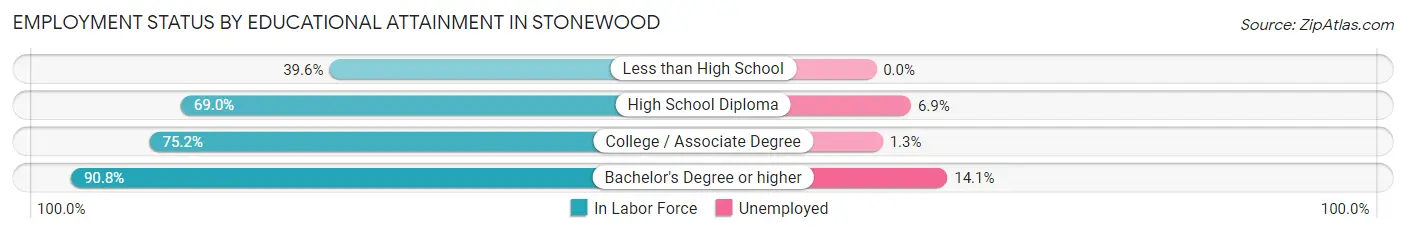
| Educational Attainment | In Labor Force | Unemployed |
| Less than High School | 38 (39.6%) | 0 (0.0%) |
| High School Diploma | 407 (69.0%) | 41 (6.9%) |
| College / Associate Degree | 167 (75.2%) | 3 (1.3%) |
| Bachelor's Degree or higher | 306 (90.8%) | 48 (14.1%) |
| Total | 918 (73.7%) | 100 (8.0%) |
Employment Occupations by Sex in Stonewood
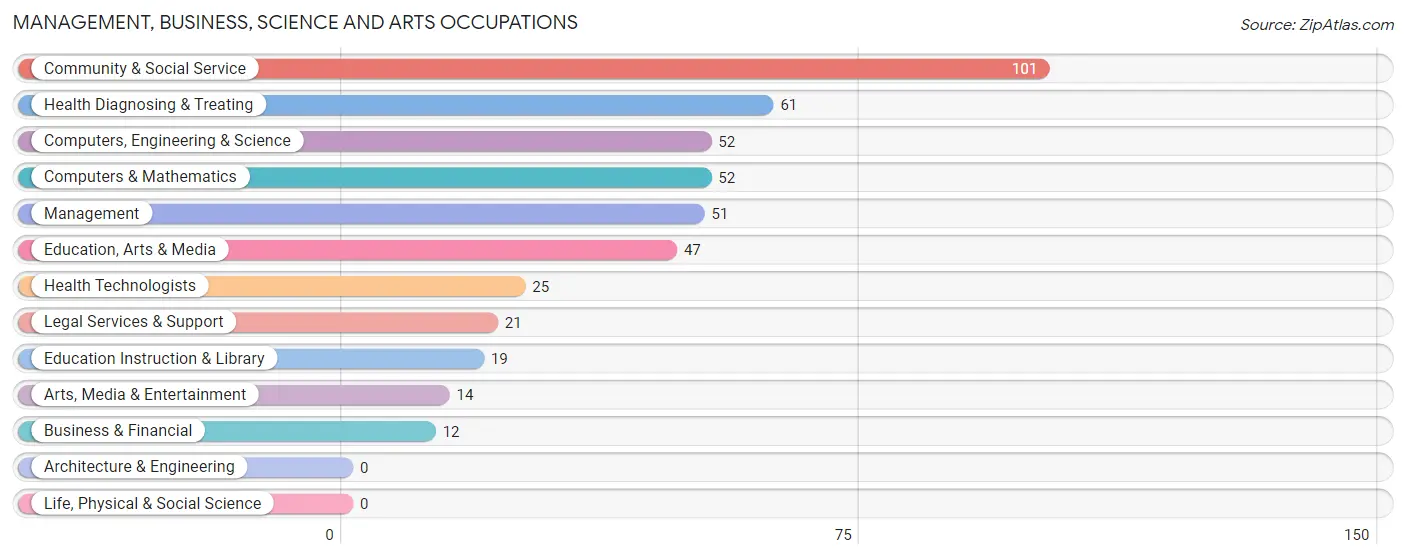
Management, Business, Science and Arts Occupations
The most common Management, Business, Science and Arts occupations in Stonewood are Community & Social Service (101 | 10.4%), Health Diagnosing & Treating (61 | 6.3%), Computers, Engineering & Science (52 | 5.4%), Computers & Mathematics (52 | 5.4%), and Management (51 | 5.3%).
Management, Business, Science and Arts Occupations by Sex
Within the Management, Business, Science and Arts occupations in Stonewood, the most male-oriented occupations are Arts, Media & Entertainment (100.0%), Education Instruction & Library (84.2%), and Management (70.6%), while the most female-oriented occupations are Business & Financial (100.0%), Health Diagnosing & Treating (100.0%), and Health Technologists (100.0%).
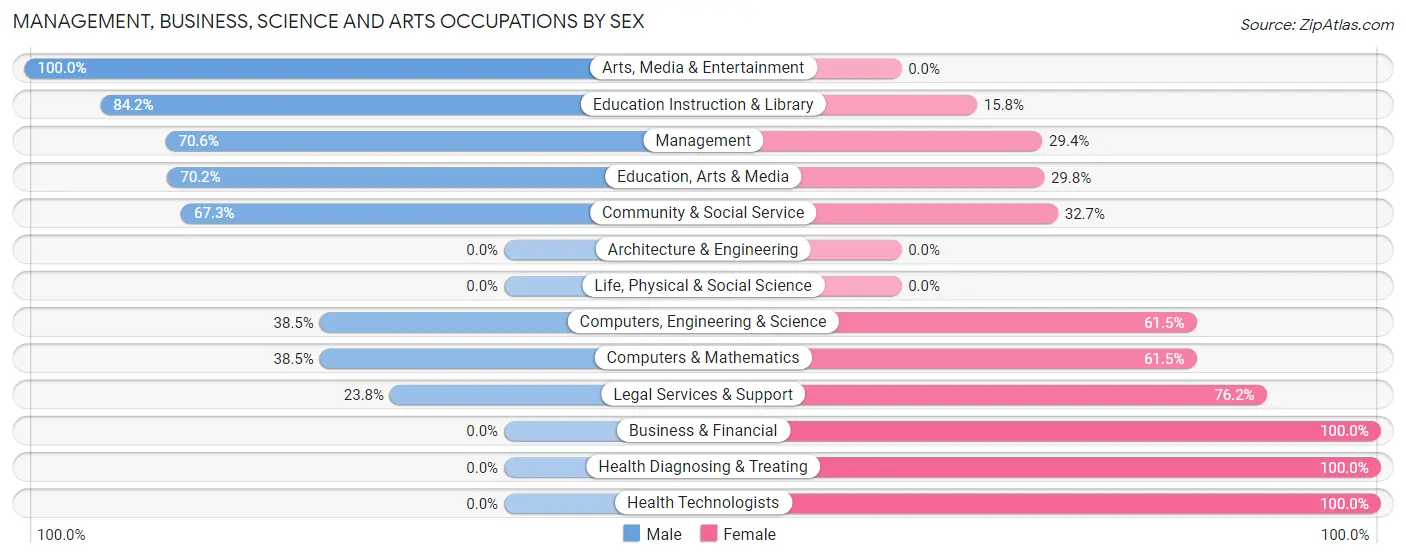
| Occupation | Male | Female |
| Management | 36 (70.6%) | 15 (29.4%) |
| Business & Financial | 0 (0.0%) | 12 (100.0%) |
| Computers, Engineering & Science | 20 (38.5%) | 32 (61.5%) |
| Computers & Mathematics | 20 (38.5%) | 32 (61.5%) |
| Architecture & Engineering | 0 (0.0%) | 0 (0.0%) |
| Life, Physical & Social Science | 0 (0.0%) | 0 (0.0%) |
| Community & Social Service | 68 (67.3%) | 33 (32.7%) |
| Education, Arts & Media | 33 (70.2%) | 14 (29.8%) |
| Legal Services & Support | 5 (23.8%) | 16 (76.2%) |
| Education Instruction & Library | 16 (84.2%) | 3 (15.8%) |
| Arts, Media & Entertainment | 14 (100.0%) | 0 (0.0%) |
| Health Diagnosing & Treating | 0 (0.0%) | 61 (100.0%) |
| Health Technologists | 0 (0.0%) | 25 (100.0%) |
| Total (Category) | 124 (44.8%) | 153 (55.2%) |
| Total (Overall) | 578 (59.7%) | 390 (40.3%) |
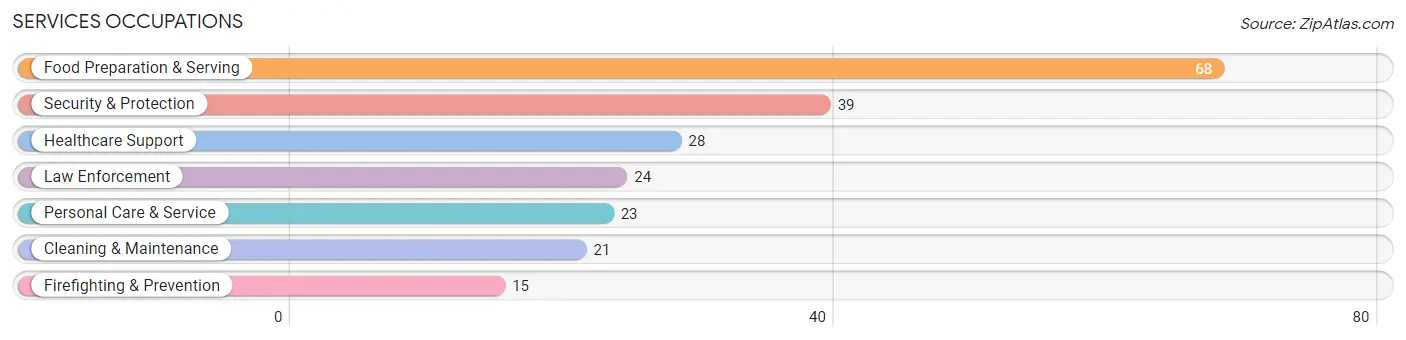
Services Occupations
The most common Services occupations in Stonewood are Food Preparation & Serving (68 | 7.0%), Security & Protection (39 | 4.0%), Healthcare Support (28 | 2.9%), Law Enforcement (24 | 2.5%), and Personal Care & Service (23 | 2.4%).
Services Occupations by Sex
Within the Services occupations in Stonewood, the most male-oriented occupations are Firefighting & Prevention (100.0%), Cleaning & Maintenance (61.9%), and Security & Protection (56.4%), while the most female-oriented occupations are Personal Care & Service (100.0%), Healthcare Support (82.1%), and Law Enforcement (70.8%).
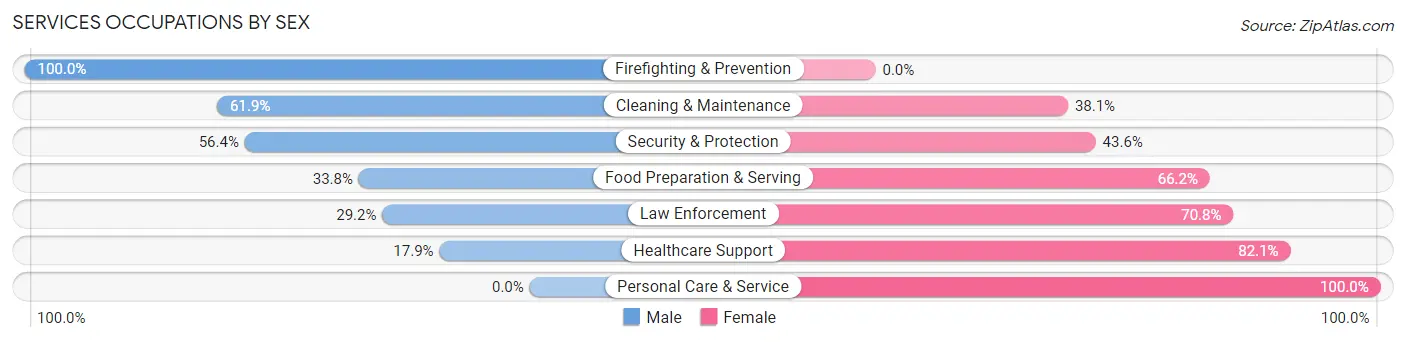
| Occupation | Male | Female |
| Healthcare Support | 5 (17.9%) | 23 (82.1%) |
| Security & Protection | 22 (56.4%) | 17 (43.6%) |
| Firefighting & Prevention | 15 (100.0%) | 0 (0.0%) |
| Law Enforcement | 7 (29.2%) | 17 (70.8%) |
| Food Preparation & Serving | 23 (33.8%) | 45 (66.2%) |
| Cleaning & Maintenance | 13 (61.9%) | 8 (38.1%) |
| Personal Care & Service | 0 (0.0%) | 23 (100.0%) |
| Total (Category) | 63 (35.2%) | 116 (64.8%) |
| Total (Overall) | 578 (59.7%) | 390 (40.3%) |
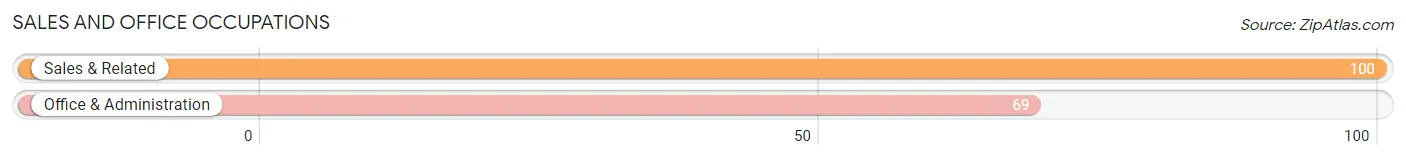
Sales and Office Occupations
The most common Sales and Office occupations in Stonewood are Sales & Related (100 | 10.3%), and Office & Administration (69 | 7.1%).
Sales and Office Occupations by Sex
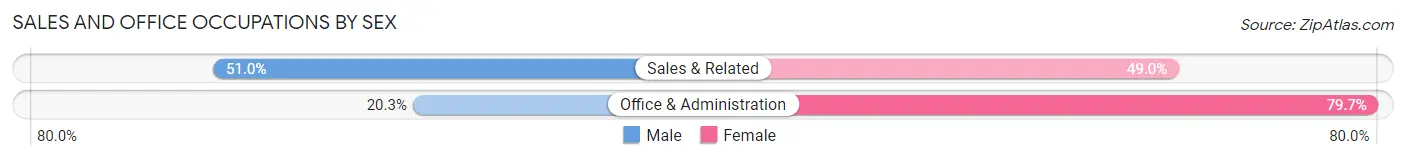
| Occupation | Male | Female |
| Sales & Related | 51 (51.0%) | 49 (49.0%) |
| Office & Administration | 14 (20.3%) | 55 (79.7%) |
| Total (Category) | 65 (38.5%) | 104 (61.5%) |
| Total (Overall) | 578 (59.7%) | 390 (40.3%) |
Natural Resources, Construction and Maintenance Occupations
The most common Natural Resources, Construction and Maintenance occupations in Stonewood are Installation, Maintenance & Repair (84 | 8.7%), and Construction & Extraction (69 | 7.1%).
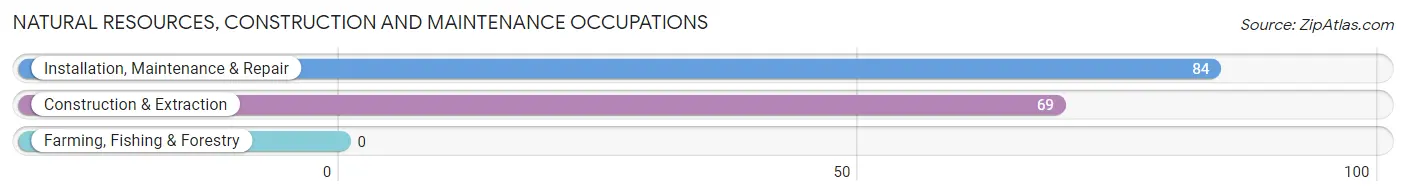
Natural Resources, Construction and Maintenance Occupations by Sex
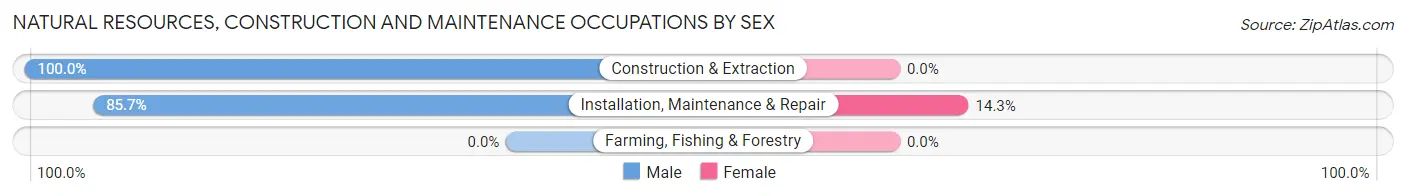
| Occupation | Male | Female |
| Farming, Fishing & Forestry | 0 (0.0%) | 0 (0.0%) |
| Construction & Extraction | 69 (100.0%) | 0 (0.0%) |
| Installation, Maintenance & Repair | 72 (85.7%) | 12 (14.3%) |
| Total (Category) | 141 (92.2%) | 12 (7.8%) |
| Total (Overall) | 578 (59.7%) | 390 (40.3%) |
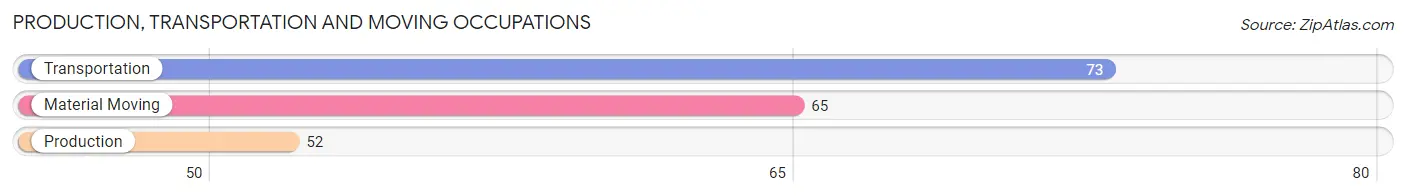
Production, Transportation and Moving Occupations
The most common Production, Transportation and Moving occupations in Stonewood are Transportation (73 | 7.5%), Material Moving (65 | 6.7%), and Production (52 | 5.4%).
Production, Transportation and Moving Occupations by Sex
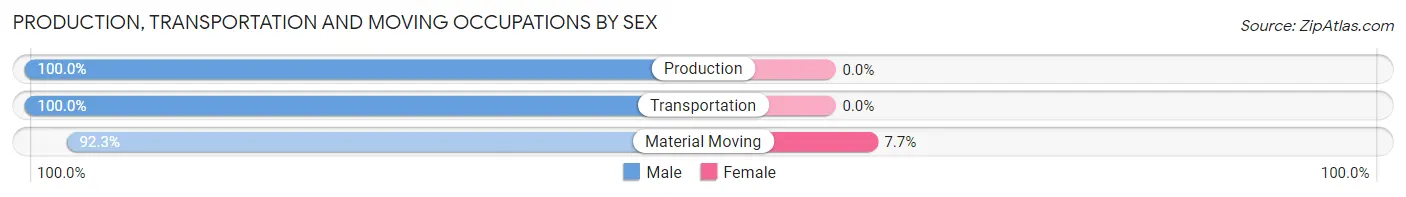
| Occupation | Male | Female |
| Production | 52 (100.0%) | 0 (0.0%) |
| Transportation | 73 (100.0%) | 0 (0.0%) |
| Material Moving | 60 (92.3%) | 5 (7.7%) |
| Total (Category) | 185 (97.4%) | 5 (2.6%) |
| Total (Overall) | 578 (59.7%) | 390 (40.3%) |
Employment Industries by Sex in Stonewood
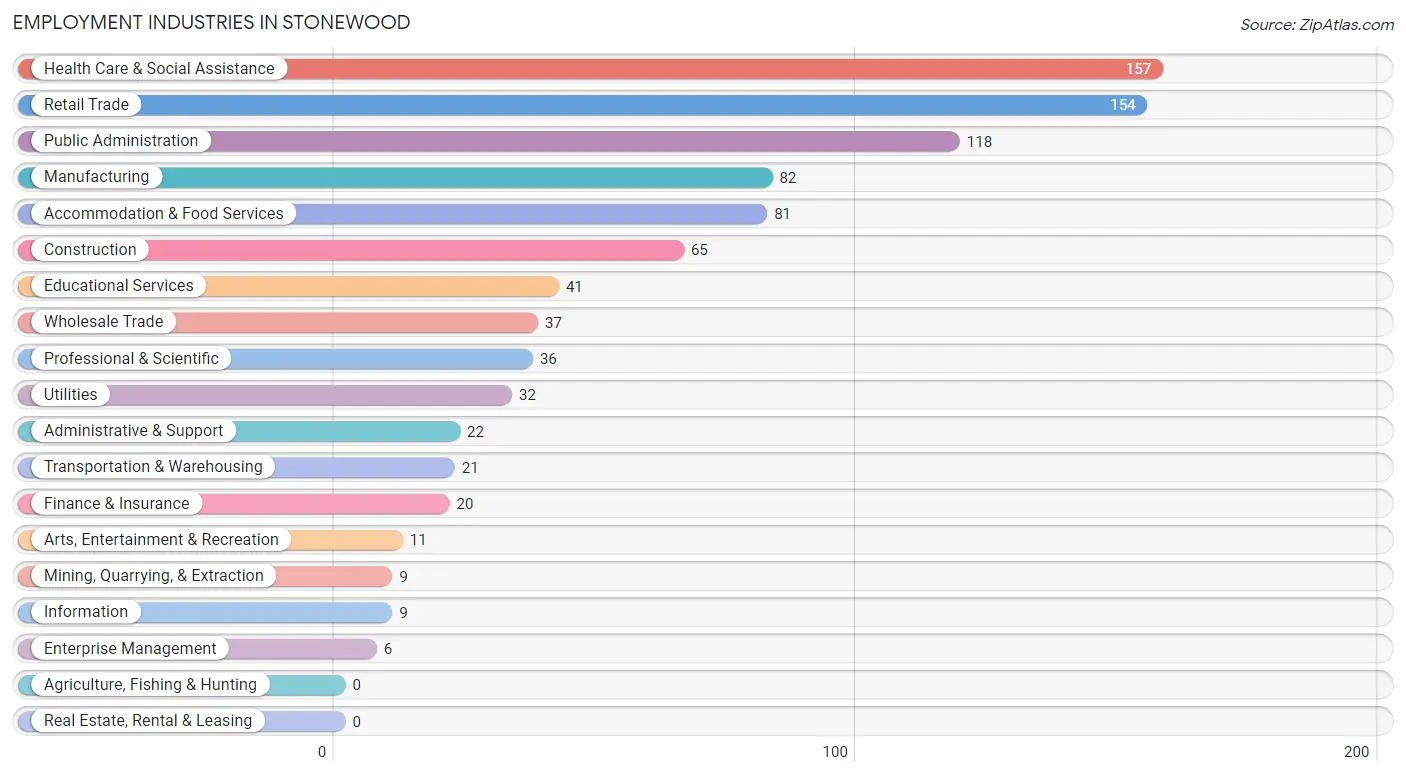
Employment Industries in Stonewood
The major employment industries in Stonewood include Health Care & Social Assistance (157 | 16.2%), Retail Trade (154 | 15.9%), Public Administration (118 | 12.2%), Manufacturing (82 | 8.5%), and Accommodation & Food Services (81 | 8.4%).
Employment Industries by Sex in Stonewood
The Stonewood industries that see more men than women are Mining, Quarrying, & Extraction (100.0%), Construction (100.0%), and Wholesale Trade (100.0%), whereas the industries that tend to have a higher number of women are Information (100.0%), Finance & Insurance (100.0%), and Administrative & Support (90.9%).
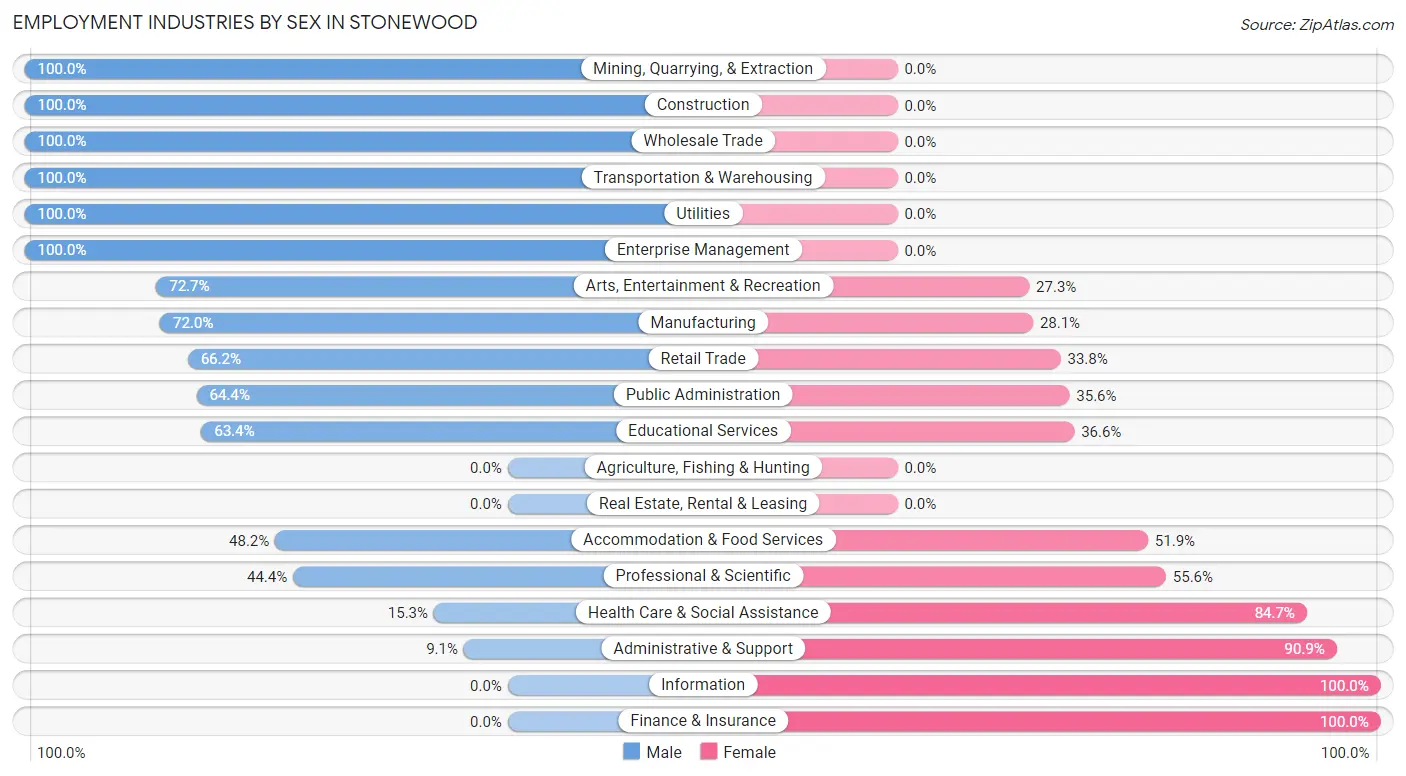
| Industry | Male | Female |
| Agriculture, Fishing & Hunting | 0 (0.0%) | 0 (0.0%) |
| Mining, Quarrying, & Extraction | 9 (100.0%) | 0 (0.0%) |
| Construction | 65 (100.0%) | 0 (0.0%) |
| Manufacturing | 59 (72.0%) | 23 (28.1%) |
| Wholesale Trade | 37 (100.0%) | 0 (0.0%) |
| Retail Trade | 102 (66.2%) | 52 (33.8%) |
| Transportation & Warehousing | 21 (100.0%) | 0 (0.0%) |
| Utilities | 32 (100.0%) | 0 (0.0%) |
| Information | 0 (0.0%) | 9 (100.0%) |
| Finance & Insurance | 0 (0.0%) | 20 (100.0%) |
| Real Estate, Rental & Leasing | 0 (0.0%) | 0 (0.0%) |
| Professional & Scientific | 16 (44.4%) | 20 (55.6%) |
| Enterprise Management | 6 (100.0%) | 0 (0.0%) |
| Administrative & Support | 2 (9.1%) | 20 (90.9%) |
| Educational Services | 26 (63.4%) | 15 (36.6%) |
| Health Care & Social Assistance | 24 (15.3%) | 133 (84.7%) |
| Arts, Entertainment & Recreation | 8 (72.7%) | 3 (27.3%) |
| Accommodation & Food Services | 39 (48.1%) | 42 (51.8%) |
| Public Administration | 76 (64.4%) | 42 (35.6%) |
| Total | 578 (59.7%) | 390 (40.3%) |
Education in Stonewood
School Enrollment in Stonewood
The most common levels of schooling among the 591 students in Stonewood are elementary school (194 | 32.8%), middle school (136 | 23.0%), and high school (96 | 16.2%).
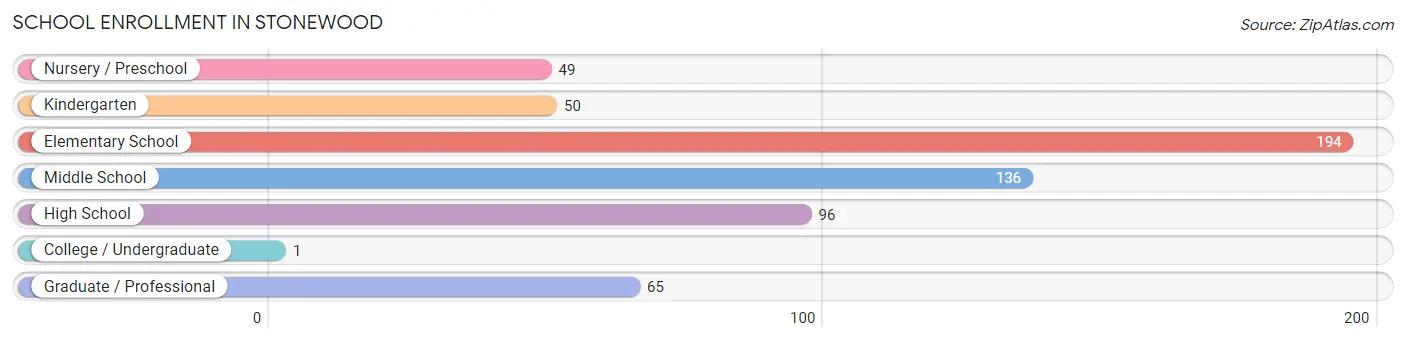
| School Level | # Students | % Students |
| Nursery / Preschool | 49 | 8.3% |
| Kindergarten | 50 | 8.5% |
| Elementary School | 194 | 32.8% |
| Middle School | 136 | 23.0% |
| High School | 96 | 16.2% |
| College / Undergraduate | 1 | 0.2% |
| Graduate / Professional | 65 | 11.0% |
| Total | 591 | 100.0% |
School Enrollment by Age by Funding Source in Stonewood
Out of a total of 591 students who are enrolled in schools in Stonewood, 59 (10.0%) attend a private institution, while the remaining 532 (90.0%) are enrolled in public schools. The age group of 3 to 4 year olds has the highest likelihood of being enrolled in private schools, with 16 (53.3% in the age bracket) enrolled. Conversely, the age group of 15 to 17 year olds has the lowest likelihood of being enrolled in a private school, with 71 (100.0% in the age bracket) attending a public institution.
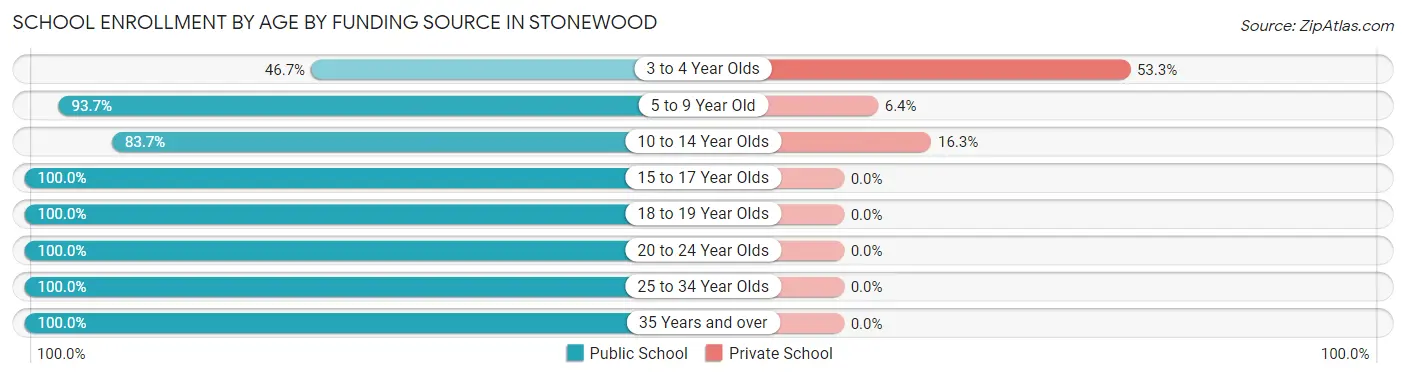
| Age Bracket | Public School | Private School |
| 3 to 4 Year Olds | 14 (46.7%) | 16 (53.3%) |
| 5 to 9 Year Old | 236 (93.6%) | 16 (6.4%) |
| 10 to 14 Year Olds | 139 (83.7%) | 27 (16.3%) |
| 15 to 17 Year Olds | 71 (100.0%) | 0 (0.0%) |
| 18 to 19 Year Olds | 6 (100.0%) | 0 (0.0%) |
| 20 to 24 Year Olds | 12 (100.0%) | 0 (0.0%) |
| 25 to 34 Year Olds | 29 (100.0%) | 0 (0.0%) |
| 35 Years and over | 25 (100.0%) | 0 (0.0%) |
| Total | 532 (90.0%) | 59 (10.0%) |
Educational Attainment by Field of Study in Stonewood
Business (92 | 22.7%), arts & humanities (69 | 17.0%), science & technology (53 | 13.1%), education (38 | 9.4%), and bio, nature & agricultural (32 | 7.9%) are the most common fields of study among 405 individuals in Stonewood who have obtained a bachelor's degree or higher.
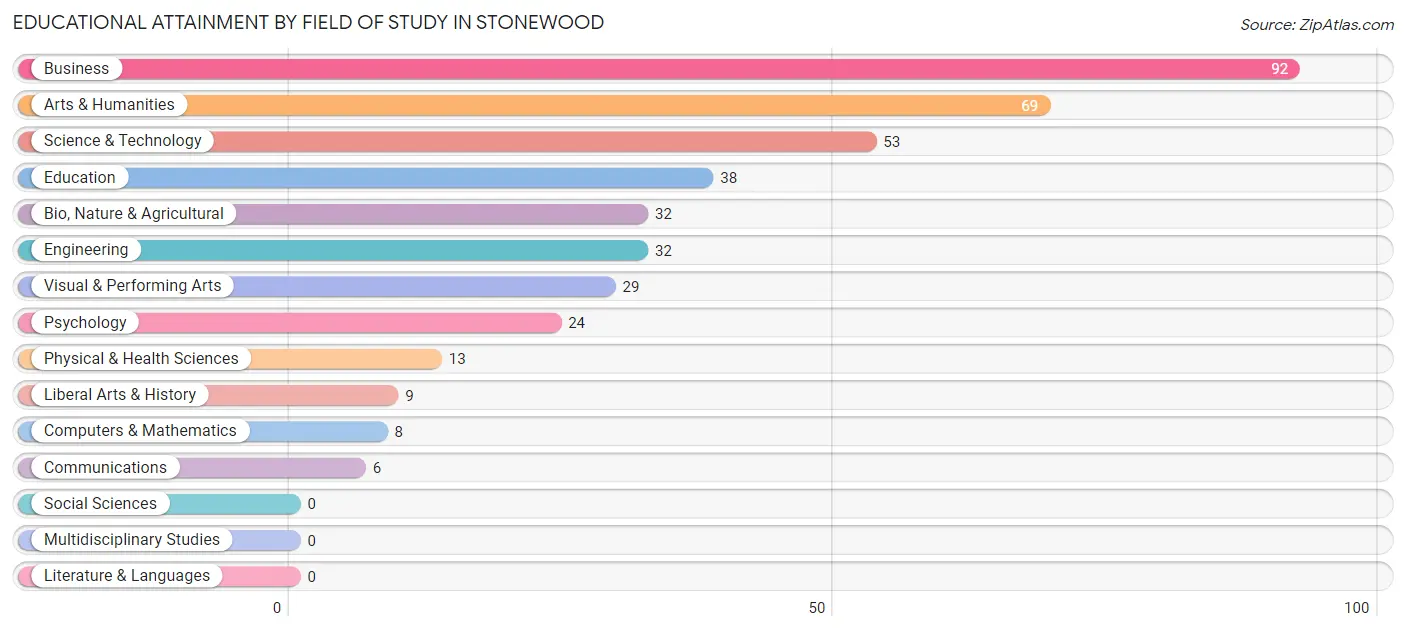
| Field of Study | # Graduates | % Graduates |
| Computers & Mathematics | 8 | 2.0% |
| Bio, Nature & Agricultural | 32 | 7.9% |
| Physical & Health Sciences | 13 | 3.2% |
| Psychology | 24 | 5.9% |
| Social Sciences | 0 | 0.0% |
| Engineering | 32 | 7.9% |
| Multidisciplinary Studies | 0 | 0.0% |
| Science & Technology | 53 | 13.1% |
| Business | 92 | 22.7% |
| Education | 38 | 9.4% |
| Literature & Languages | 0 | 0.0% |
| Liberal Arts & History | 9 | 2.2% |
| Visual & Performing Arts | 29 | 7.2% |
| Communications | 6 | 1.5% |
| Arts & Humanities | 69 | 17.0% |
| Total | 405 | 100.0% |
Transportation & Commute in Stonewood
Vehicle Availability by Sex in Stonewood
The most prevalent vehicle ownership categories in Stonewood are males with 2 vehicles (282, accounting for 48.6%) and females with 2 vehicles (156, making up 72.3%).
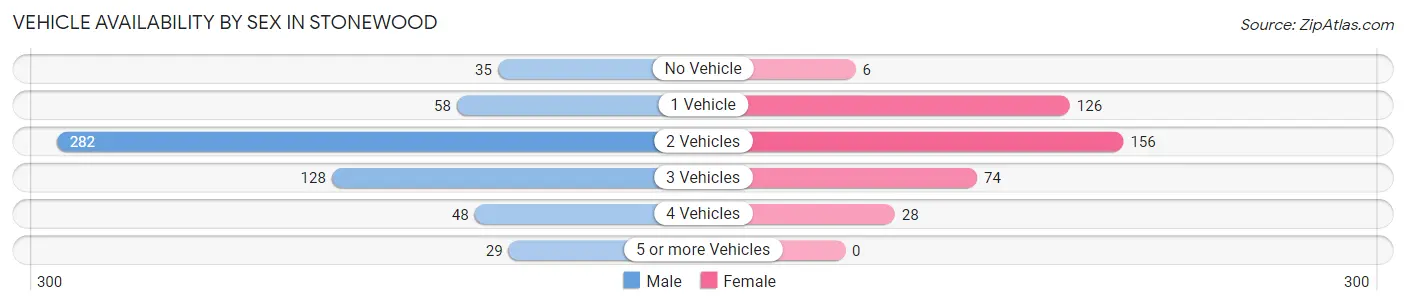
| Vehicles Available | Male | Female |
| No Vehicle | 35 (6.0%) | 6 (1.5%) |
| 1 Vehicle | 58 (10.0%) | 126 (32.3%) |
| 2 Vehicles | 282 (48.6%) | 156 (40.0%) |
| 3 Vehicles | 128 (22.1%) | 74 (19.0%) |
| 4 Vehicles | 48 (8.3%) | 28 (7.2%) |
| 5 or more Vehicles | 29 (5.0%) | 0 (0.0%) |
| Total | 580 (100.0%) | 390 (100.0%) |
Commute Time in Stonewood
The most frequently occuring commute durations in Stonewood are 15 to 19 minutes (339 commuters, 36.4%), 10 to 14 minutes (210 commuters, 22.5%), and 20 to 24 minutes (120 commuters, 12.9%).
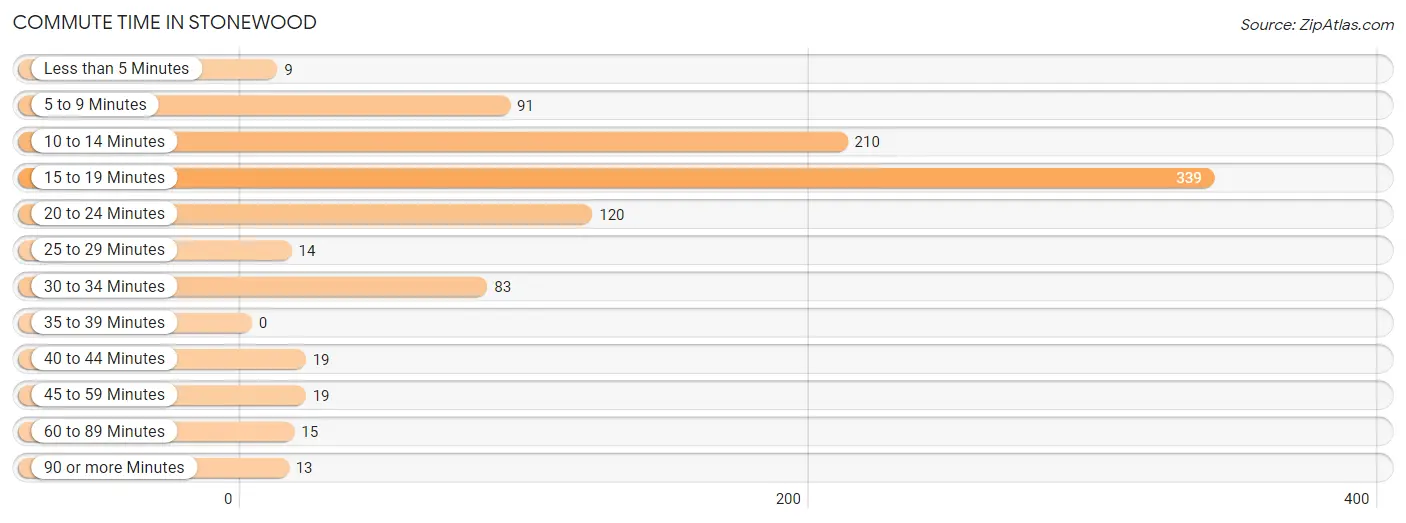
| Commute Time | # Commuters | % Commuters |
| Less than 5 Minutes | 9 | 1.0% |
| 5 to 9 Minutes | 91 | 9.8% |
| 10 to 14 Minutes | 210 | 22.5% |
| 15 to 19 Minutes | 339 | 36.4% |
| 20 to 24 Minutes | 120 | 12.9% |
| 25 to 29 Minutes | 14 | 1.5% |
| 30 to 34 Minutes | 83 | 8.9% |
| 35 to 39 Minutes | 0 | 0.0% |
| 40 to 44 Minutes | 19 | 2.0% |
| 45 to 59 Minutes | 19 | 2.0% |
| 60 to 89 Minutes | 15 | 1.6% |
| 90 or more Minutes | 13 | 1.4% |
Commute Time by Sex in Stonewood
The most common commute times in Stonewood are 15 to 19 minutes (181 commuters, 32.1%) for males and 15 to 19 minutes (158 commuters, 42.9%) for females.
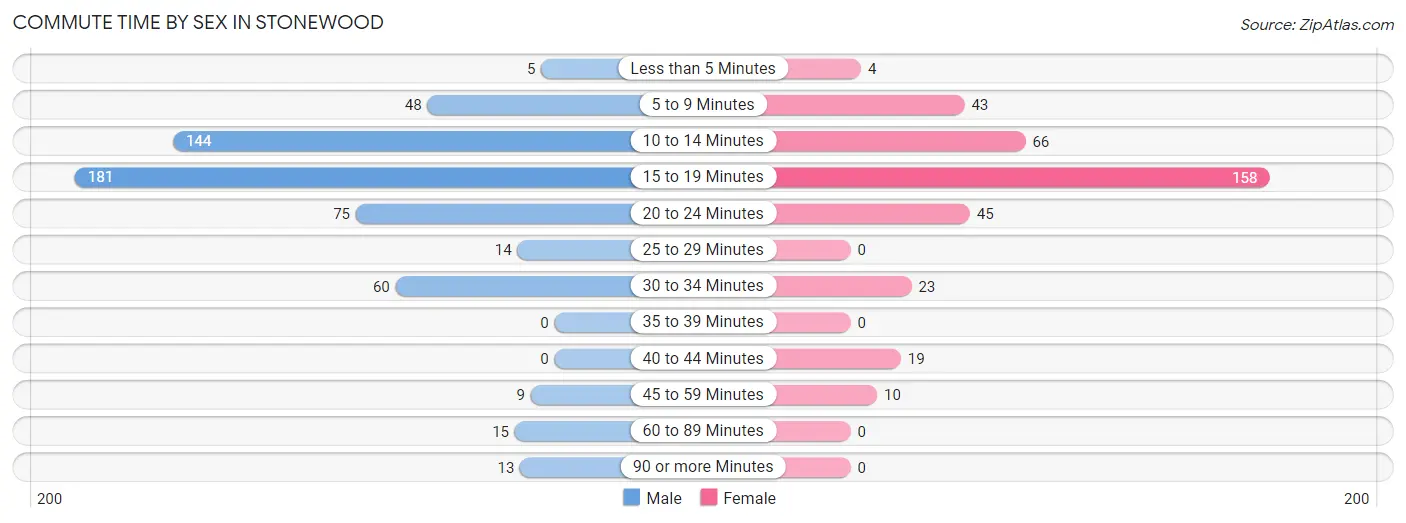
| Commute Time | Male | Female |
| Less than 5 Minutes | 5 (0.9%) | 4 (1.1%) |
| 5 to 9 Minutes | 48 (8.5%) | 43 (11.7%) |
| 10 to 14 Minutes | 144 (25.5%) | 66 (17.9%) |
| 15 to 19 Minutes | 181 (32.1%) | 158 (42.9%) |
| 20 to 24 Minutes | 75 (13.3%) | 45 (12.2%) |
| 25 to 29 Minutes | 14 (2.5%) | 0 (0.0%) |
| 30 to 34 Minutes | 60 (10.6%) | 23 (6.2%) |
| 35 to 39 Minutes | 0 (0.0%) | 0 (0.0%) |
| 40 to 44 Minutes | 0 (0.0%) | 19 (5.2%) |
| 45 to 59 Minutes | 9 (1.6%) | 10 (2.7%) |
| 60 to 89 Minutes | 15 (2.7%) | 0 (0.0%) |
| 90 or more Minutes | 13 (2.3%) | 0 (0.0%) |
Time of Departure to Work by Sex in Stonewood
The most frequent times of departure to work in Stonewood are 7:00 AM to 7:29 AM (156, 27.7%) for males and 6:30 AM to 6:59 AM (79, 21.5%) for females.
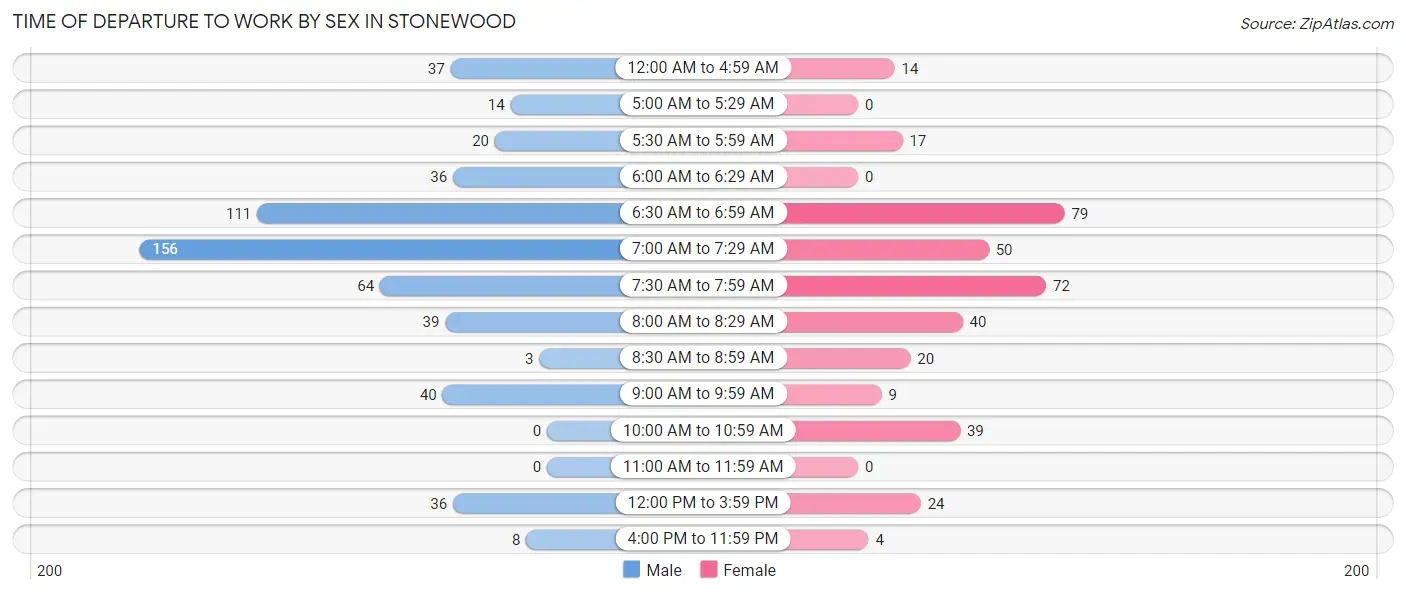
| Time of Departure | Male | Female |
| 12:00 AM to 4:59 AM | 37 (6.6%) | 14 (3.8%) |
| 5:00 AM to 5:29 AM | 14 (2.5%) | 0 (0.0%) |
| 5:30 AM to 5:59 AM | 20 (3.5%) | 17 (4.6%) |
| 6:00 AM to 6:29 AM | 36 (6.4%) | 0 (0.0%) |
| 6:30 AM to 6:59 AM | 111 (19.7%) | 79 (21.5%) |
| 7:00 AM to 7:29 AM | 156 (27.7%) | 50 (13.6%) |
| 7:30 AM to 7:59 AM | 64 (11.4%) | 72 (19.6%) |
| 8:00 AM to 8:29 AM | 39 (6.9%) | 40 (10.9%) |
| 8:30 AM to 8:59 AM | 3 (0.5%) | 20 (5.4%) |
| 9:00 AM to 9:59 AM | 40 (7.1%) | 9 (2.5%) |
| 10:00 AM to 10:59 AM | 0 (0.0%) | 39 (10.6%) |
| 11:00 AM to 11:59 AM | 0 (0.0%) | 0 (0.0%) |
| 12:00 PM to 3:59 PM | 36 (6.4%) | 24 (6.5%) |
| 4:00 PM to 11:59 PM | 8 (1.4%) | 4 (1.1%) |
| Total | 564 (100.0%) | 368 (100.0%) |
Housing Occupancy in Stonewood
Occupancy by Ownership in Stonewood
Of the total 911 dwellings in Stonewood, owner-occupied units account for 631 (69.3%), while renter-occupied units make up 280 (30.7%).
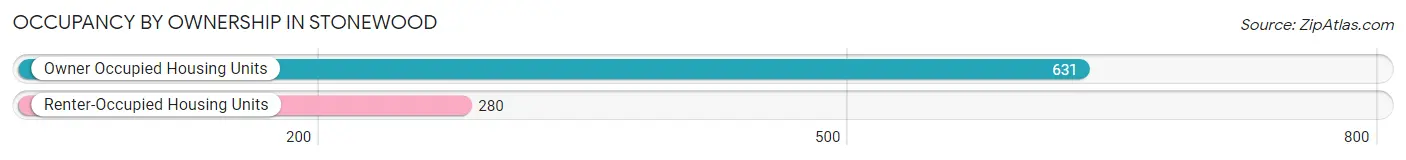
| Occupancy | # Housing Units | % Housing Units |
| Owner Occupied Housing Units | 631 | 69.3% |
| Renter-Occupied Housing Units | 280 | 30.7% |
| Total Occupied Housing Units | 911 | 100.0% |
Occupancy by Household Size in Stonewood
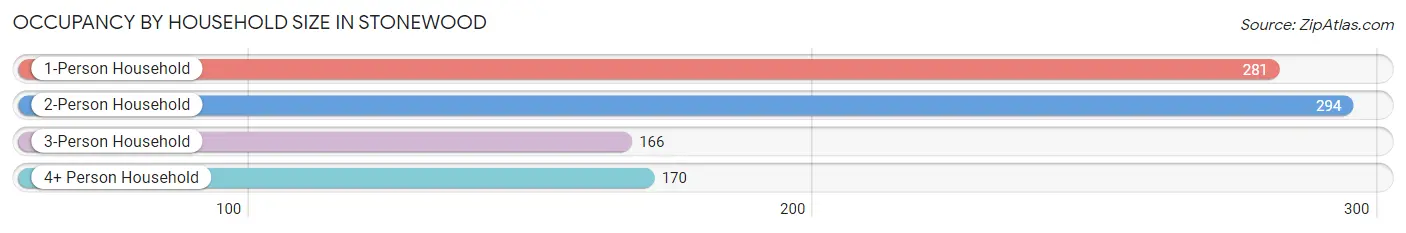
| Household Size | # Housing Units | % Housing Units |
| 1-Person Household | 281 | 30.8% |
| 2-Person Household | 294 | 32.3% |
| 3-Person Household | 166 | 18.2% |
| 4+ Person Household | 170 | 18.7% |
| Total Housing Units | 911 | 100.0% |
Occupancy by Ownership by Household Size in Stonewood
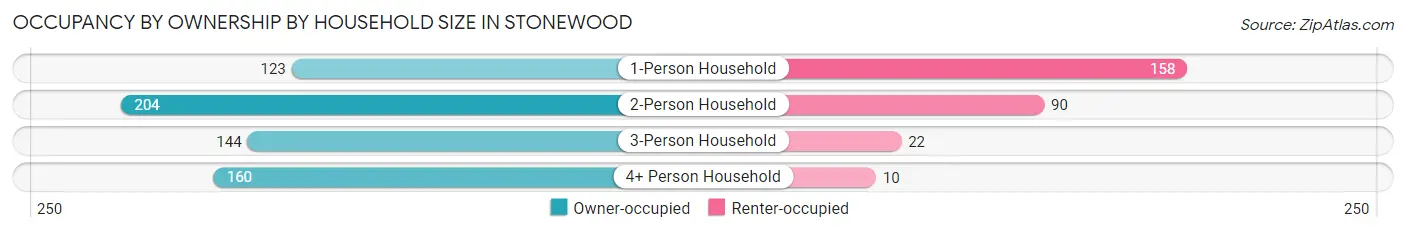
| Household Size | Owner-occupied | Renter-occupied |
| 1-Person Household | 123 (43.8%) | 158 (56.2%) |
| 2-Person Household | 204 (69.4%) | 90 (30.6%) |
| 3-Person Household | 144 (86.8%) | 22 (13.3%) |
| 4+ Person Household | 160 (94.1%) | 10 (5.9%) |
| Total Housing Units | 631 (69.3%) | 280 (30.7%) |
Occupancy by Educational Attainment in Stonewood
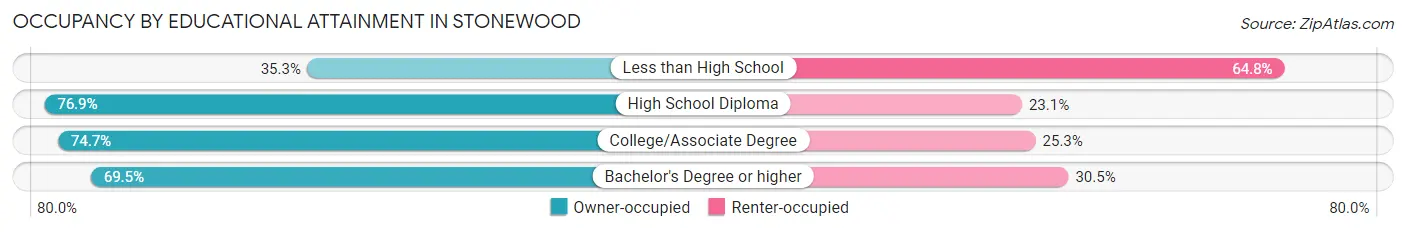
| Household Size | Owner-occupied | Renter-occupied |
| Less than High School | 43 (35.2%) | 79 (64.7%) |
| High School Diploma | 319 (76.9%) | 96 (23.1%) |
| College/Associate Degree | 130 (74.7%) | 44 (25.3%) |
| Bachelor's Degree or higher | 139 (69.5%) | 61 (30.5%) |
Occupancy by Age of Householder in Stonewood

| Age Bracket | # Households | % Households |
| Under 35 Years | 112 | 12.3% |
| 35 to 44 Years | 133 | 14.6% |
| 45 to 54 Years | 173 | 19.0% |
| 55 to 64 Years | 196 | 21.5% |
| 65 to 74 Years | 142 | 15.6% |
| 75 to 84 Years | 69 | 7.6% |
| 85 Years and Over | 86 | 9.4% |
| Total | 911 | 100.0% |
Housing Finances in Stonewood
Median Income by Occupancy in Stonewood
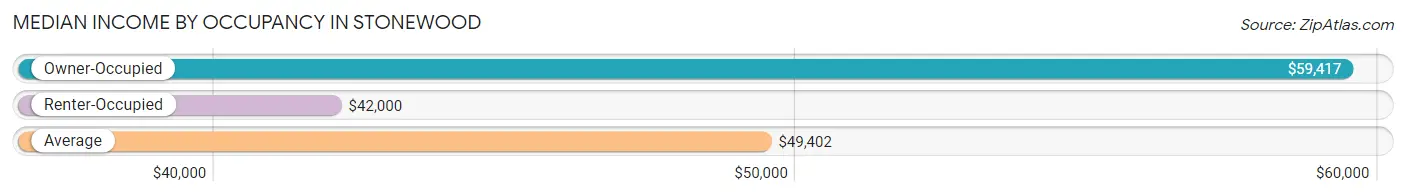
| Occupancy Type | # Households | Median Income |
| Owner-Occupied | 631 (69.3%) | $59,417 |
| Renter-Occupied | 280 (30.7%) | $42,000 |
| Average | 911 (100.0%) | $49,402 |
Occupancy by Householder Income Bracket in Stonewood
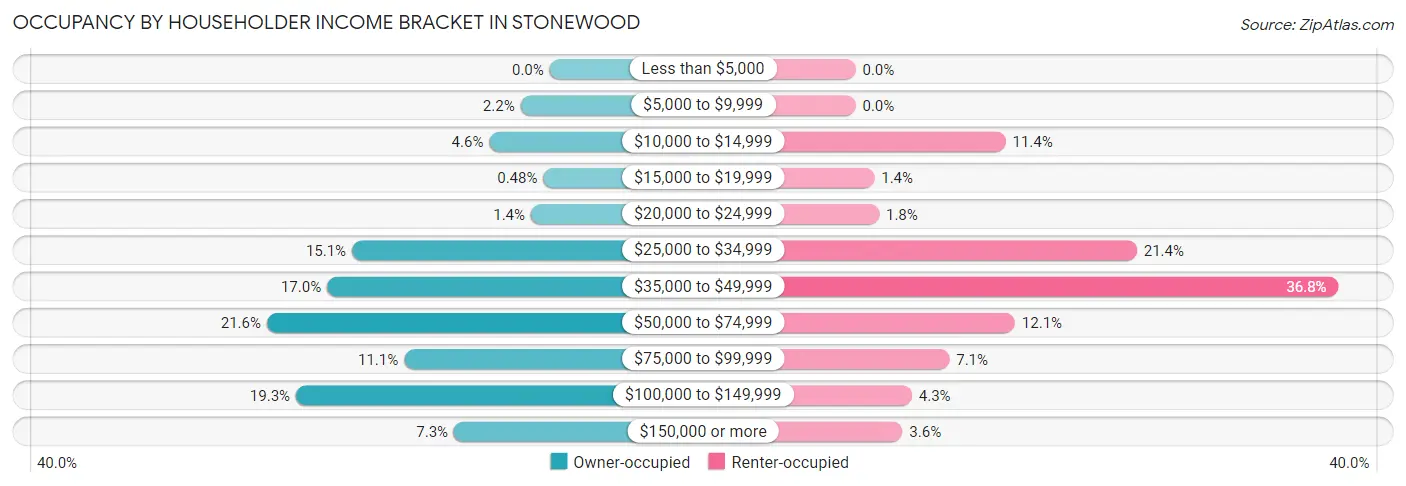
| Income Bracket | Owner-occupied | Renter-occupied |
| Less than $5,000 | 0 (0.0%) | 0 (0.0%) |
| $5,000 to $9,999 | 14 (2.2%) | 0 (0.0%) |
| $10,000 to $14,999 | 29 (4.6%) | 32 (11.4%) |
| $15,000 to $19,999 | 3 (0.5%) | 4 (1.4%) |
| $20,000 to $24,999 | 9 (1.4%) | 5 (1.8%) |
| $25,000 to $34,999 | 95 (15.1%) | 60 (21.4%) |
| $35,000 to $49,999 | 107 (17.0%) | 103 (36.8%) |
| $50,000 to $74,999 | 136 (21.5%) | 34 (12.1%) |
| $75,000 to $99,999 | 70 (11.1%) | 20 (7.1%) |
| $100,000 to $149,999 | 122 (19.3%) | 12 (4.3%) |
| $150,000 or more | 46 (7.3%) | 10 (3.6%) |
| Total | 631 (100.0%) | 280 (100.0%) |
Monthly Housing Cost Tiers in Stonewood
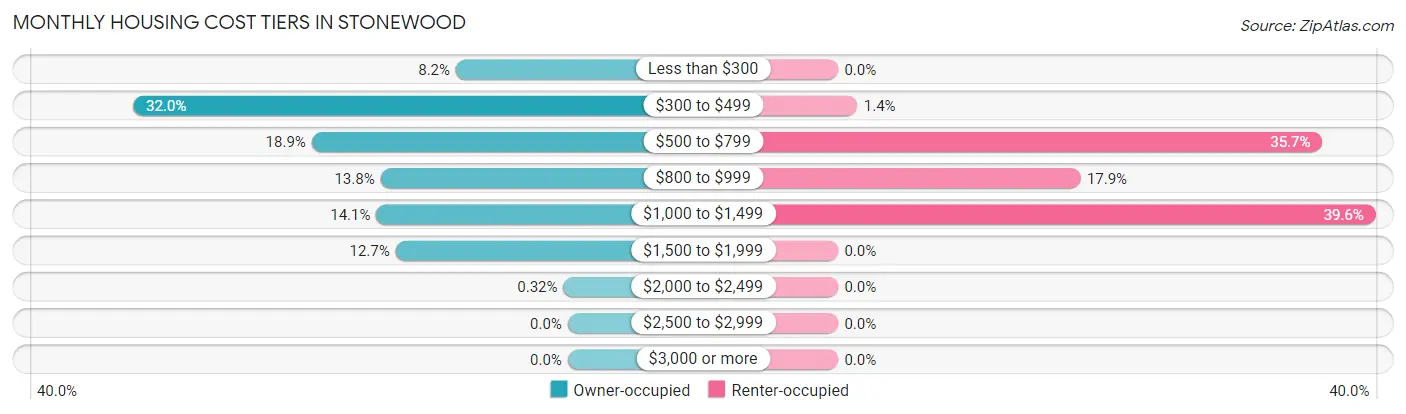
| Monthly Cost | Owner-occupied | Renter-occupied |
| Less than $300 | 52 (8.2%) | 0 (0.0%) |
| $300 to $499 | 202 (32.0%) | 4 (1.4%) |
| $500 to $799 | 119 (18.9%) | 100 (35.7%) |
| $800 to $999 | 87 (13.8%) | 50 (17.9%) |
| $1,000 to $1,499 | 89 (14.1%) | 111 (39.6%) |
| $1,500 to $1,999 | 80 (12.7%) | 0 (0.0%) |
| $2,000 to $2,499 | 2 (0.3%) | 0 (0.0%) |
| $2,500 to $2,999 | 0 (0.0%) | 0 (0.0%) |
| $3,000 or more | 0 (0.0%) | 0 (0.0%) |
| Total | 631 (100.0%) | 280 (100.0%) |
Physical Housing Characteristics in Stonewood
Housing Structures in Stonewood
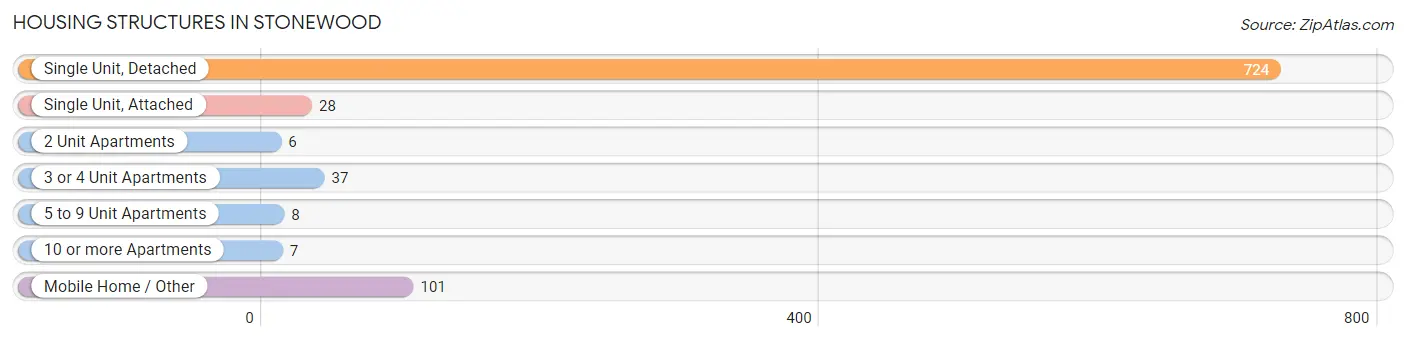
| Structure Type | # Housing Units | % Housing Units |
| Single Unit, Detached | 724 | 79.5% |
| Single Unit, Attached | 28 | 3.1% |
| 2 Unit Apartments | 6 | 0.7% |
| 3 or 4 Unit Apartments | 37 | 4.1% |
| 5 to 9 Unit Apartments | 8 | 0.9% |
| 10 or more Apartments | 7 | 0.8% |
| Mobile Home / Other | 101 | 11.1% |
| Total | 911 | 100.0% |
Housing Structures by Occupancy in Stonewood
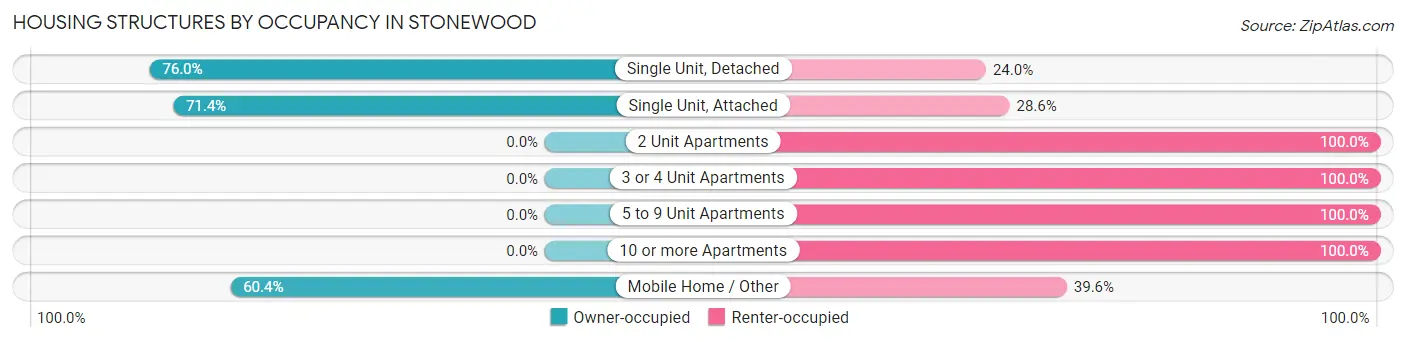
| Structure Type | Owner-occupied | Renter-occupied |
| Single Unit, Detached | 550 (76.0%) | 174 (24.0%) |
| Single Unit, Attached | 20 (71.4%) | 8 (28.6%) |
| 2 Unit Apartments | 0 (0.0%) | 6 (100.0%) |
| 3 or 4 Unit Apartments | 0 (0.0%) | 37 (100.0%) |
| 5 to 9 Unit Apartments | 0 (0.0%) | 8 (100.0%) |
| 10 or more Apartments | 0 (0.0%) | 7 (100.0%) |
| Mobile Home / Other | 61 (60.4%) | 40 (39.6%) |
| Total | 631 (69.3%) | 280 (30.7%) |
Housing Structures by Number of Rooms in Stonewood
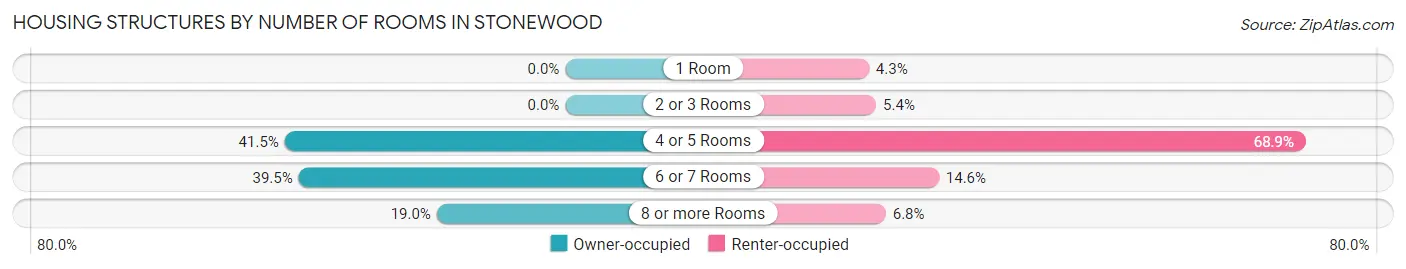
| Number of Rooms | Owner-occupied | Renter-occupied |
| 1 Room | 0 (0.0%) | 12 (4.3%) |
| 2 or 3 Rooms | 0 (0.0%) | 15 (5.4%) |
| 4 or 5 Rooms | 262 (41.5%) | 193 (68.9%) |
| 6 or 7 Rooms | 249 (39.5%) | 41 (14.6%) |
| 8 or more Rooms | 120 (19.0%) | 19 (6.8%) |
| Total | 631 (100.0%) | 280 (100.0%) |
Housing Structure by Heating Type in Stonewood
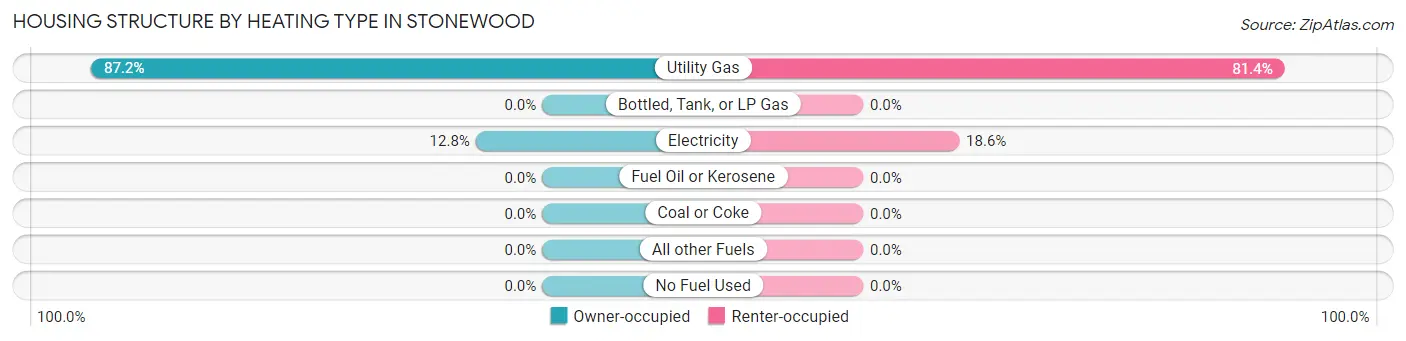
| Heating Type | Owner-occupied | Renter-occupied |
| Utility Gas | 550 (87.2%) | 228 (81.4%) |
| Bottled, Tank, or LP Gas | 0 (0.0%) | 0 (0.0%) |
| Electricity | 81 (12.8%) | 52 (18.6%) |
| Fuel Oil or Kerosene | 0 (0.0%) | 0 (0.0%) |
| Coal or Coke | 0 (0.0%) | 0 (0.0%) |
| All other Fuels | 0 (0.0%) | 0 (0.0%) |
| No Fuel Used | 0 (0.0%) | 0 (0.0%) |
| Total | 631 (100.0%) | 280 (100.0%) |
Household Vehicle Usage in Stonewood
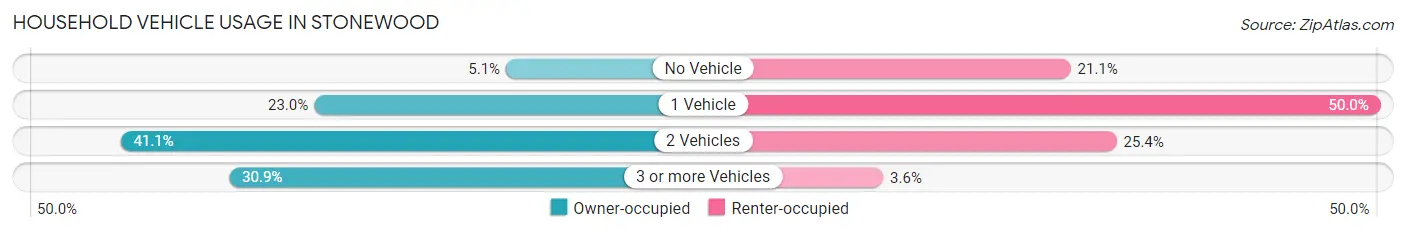
| Vehicles per Household | Owner-occupied | Renter-occupied |
| No Vehicle | 32 (5.1%) | 59 (21.1%) |
| 1 Vehicle | 145 (23.0%) | 140 (50.0%) |
| 2 Vehicles | 259 (41.0%) | 71 (25.4%) |
| 3 or more Vehicles | 195 (30.9%) | 10 (3.6%) |
| Total | 631 (100.0%) | 280 (100.0%) |
Real Estate & Mortgages in Stonewood
Real Estate and Mortgage Overview in Stonewood
| Characteristic | Without Mortgage | With Mortgage |
| Housing Units | 344 | 287 |
| Median Property Value | $102,700 | $166,700 |
| Median Household Income | $48,333 | $24 |
| Monthly Housing Costs | $417 | $0 |
| Real Estate Taxes | $615 | $6 |
Property Value by Mortgage Status in Stonewood
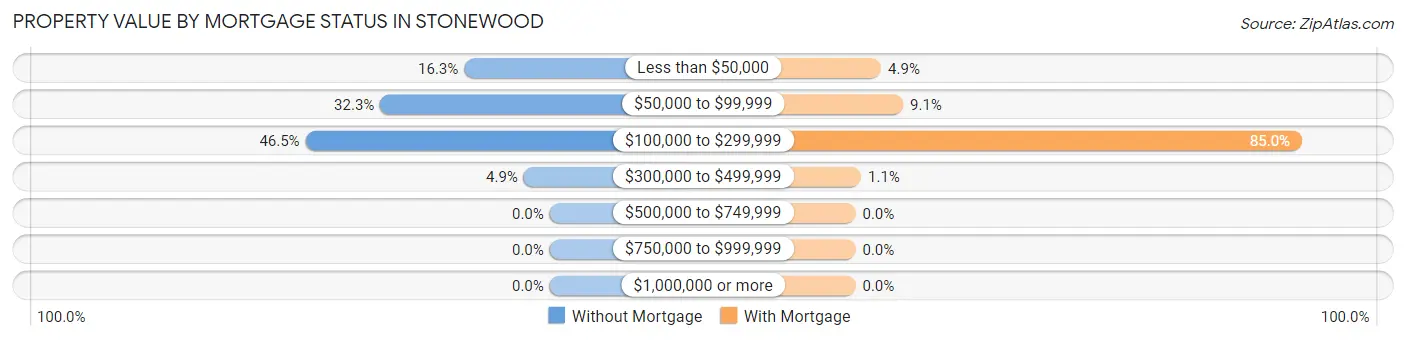
| Property Value | Without Mortgage | With Mortgage |
| Less than $50,000 | 56 (16.3%) | 14 (4.9%) |
| $50,000 to $99,999 | 111 (32.3%) | 26 (9.1%) |
| $100,000 to $299,999 | 160 (46.5%) | 244 (85.0%) |
| $300,000 to $499,999 | 17 (4.9%) | 3 (1.1%) |
| $500,000 to $749,999 | 0 (0.0%) | 0 (0.0%) |
| $750,000 to $999,999 | 0 (0.0%) | 0 (0.0%) |
| $1,000,000 or more | 0 (0.0%) | 0 (0.0%) |
| Total | 344 (100.0%) | 287 (100.0%) |
Household Income by Mortgage Status in Stonewood
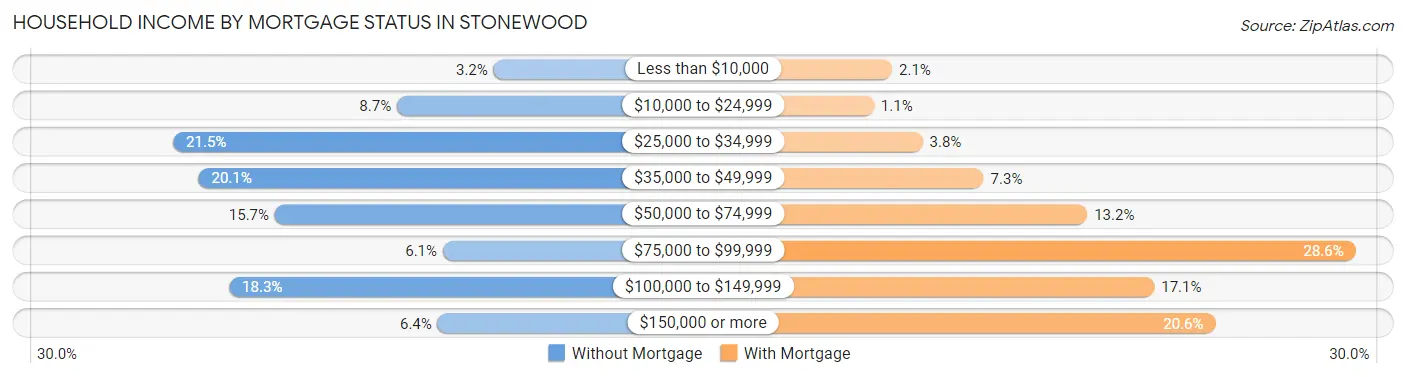
| Household Income | Without Mortgage | With Mortgage |
| Less than $10,000 | 11 (3.2%) | 6 (2.1%) |
| $10,000 to $24,999 | 30 (8.7%) | 3 (1.1%) |
| $25,000 to $34,999 | 74 (21.5%) | 11 (3.8%) |
| $35,000 to $49,999 | 69 (20.1%) | 21 (7.3%) |
| $50,000 to $74,999 | 54 (15.7%) | 38 (13.2%) |
| $75,000 to $99,999 | 21 (6.1%) | 82 (28.6%) |
| $100,000 to $149,999 | 63 (18.3%) | 49 (17.1%) |
| $150,000 or more | 22 (6.4%) | 59 (20.6%) |
| Total | 344 (100.0%) | 287 (100.0%) |
Property Value to Household Income Ratio in Stonewood
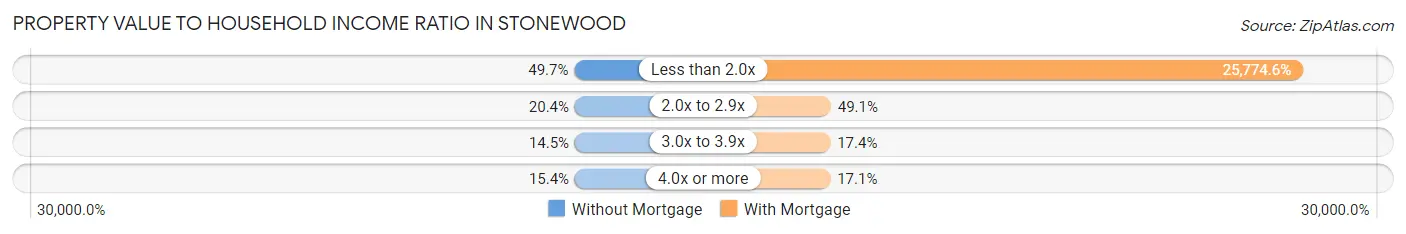
| Value-to-Income Ratio | Without Mortgage | With Mortgage |
| Less than 2.0x | 171 (49.7%) | 73,973 (25,774.6%) |
| 2.0x to 2.9x | 70 (20.3%) | 141 (49.1%) |
| 3.0x to 3.9x | 50 (14.5%) | 50 (17.4%) |
| 4.0x or more | 53 (15.4%) | 49 (17.1%) |
| Total | 344 (100.0%) | 287 (100.0%) |
Real Estate Taxes by Mortgage Status in Stonewood
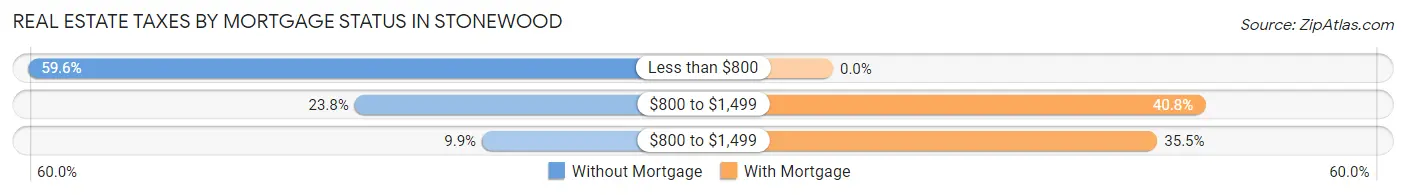
| Property Taxes | Without Mortgage | With Mortgage |
| Less than $800 | 205 (59.6%) | 0 (0.0%) |
| $800 to $1,499 | 82 (23.8%) | 117 (40.8%) |
| $800 to $1,499 | 34 (9.9%) | 102 (35.5%) |
| Total | 344 (100.0%) | 287 (100.0%) |
Health & Disability in Stonewood
Health Insurance Coverage by Age in Stonewood
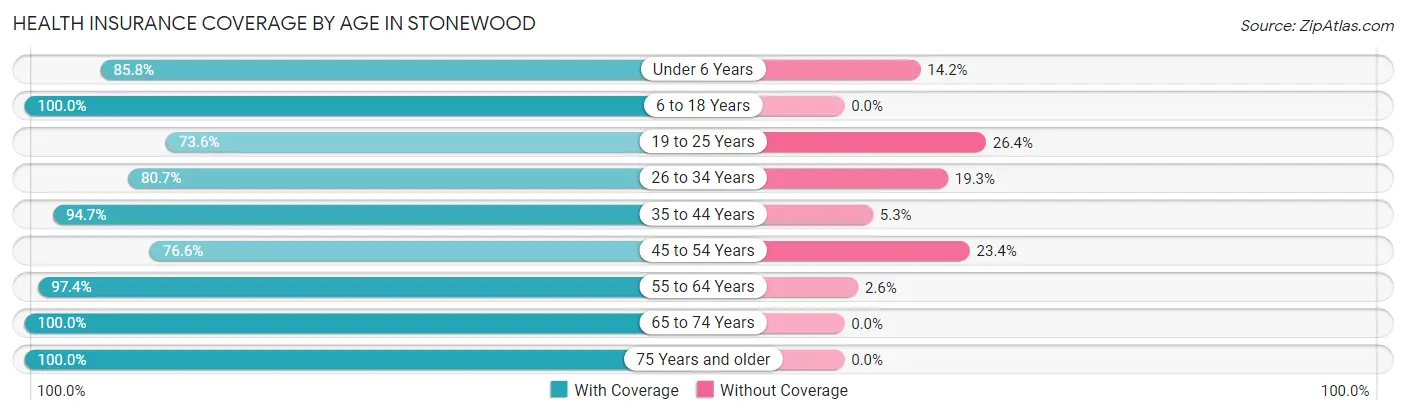
| Age Bracket | With Coverage | Without Coverage |
| Under 6 Years | 133 (85.8%) | 22 (14.2%) |
| 6 to 18 Years | 494 (100.0%) | 0 (0.0%) |
| 19 to 25 Years | 92 (73.6%) | 33 (26.4%) |
| 26 to 34 Years | 209 (80.7%) | 50 (19.3%) |
| 35 to 44 Years | 338 (94.7%) | 19 (5.3%) |
| 45 to 54 Years | 200 (76.6%) | 61 (23.4%) |
| 55 to 64 Years | 342 (97.4%) | 9 (2.6%) |
| 65 to 74 Years | 194 (100.0%) | 0 (0.0%) |
| 75 Years and older | 224 (100.0%) | 0 (0.0%) |
| Total | 2,226 (92.0%) | 194 (8.0%) |
Health Insurance Coverage by Citizenship Status in Stonewood
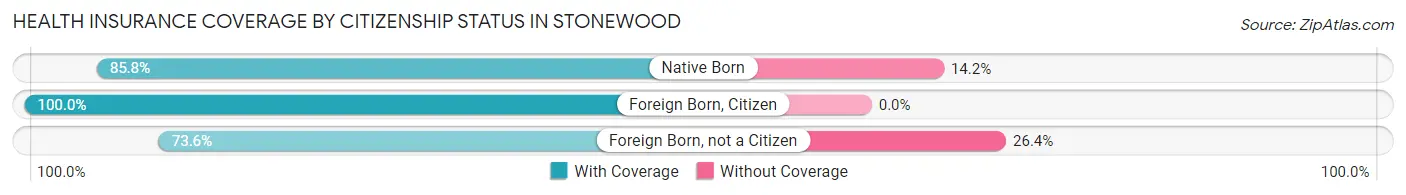
| Citizenship Status | With Coverage | Without Coverage |
| Native Born | 133 (85.8%) | 22 (14.2%) |
| Foreign Born, Citizen | 494 (100.0%) | 0 (0.0%) |
| Foreign Born, not a Citizen | 92 (73.6%) | 33 (26.4%) |
Health Insurance Coverage by Household Income in Stonewood
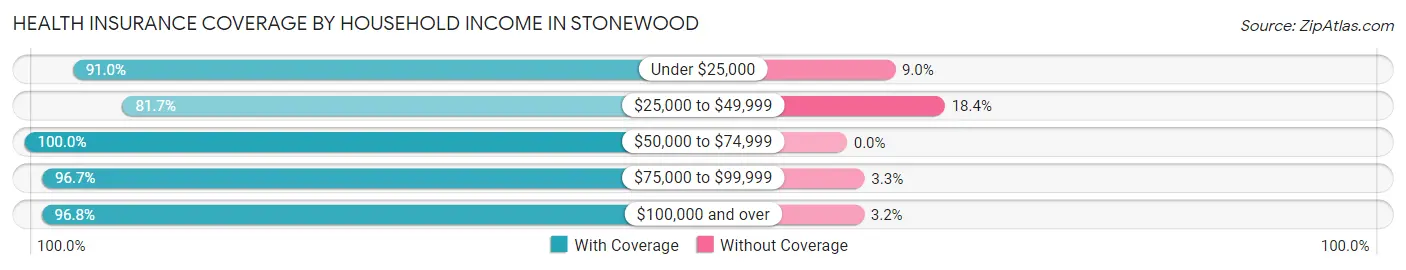
| Household Income | With Coverage | Without Coverage |
| Under $25,000 | 111 (91.0%) | 11 (9.0%) |
| $25,000 to $49,999 | 672 (81.7%) | 151 (18.3%) |
| $50,000 to $74,999 | 475 (100.0%) | 0 (0.0%) |
| $75,000 to $99,999 | 293 (96.7%) | 10 (3.3%) |
| $100,000 and over | 665 (96.8%) | 22 (3.2%) |
Public vs Private Health Insurance Coverage by Age in Stonewood
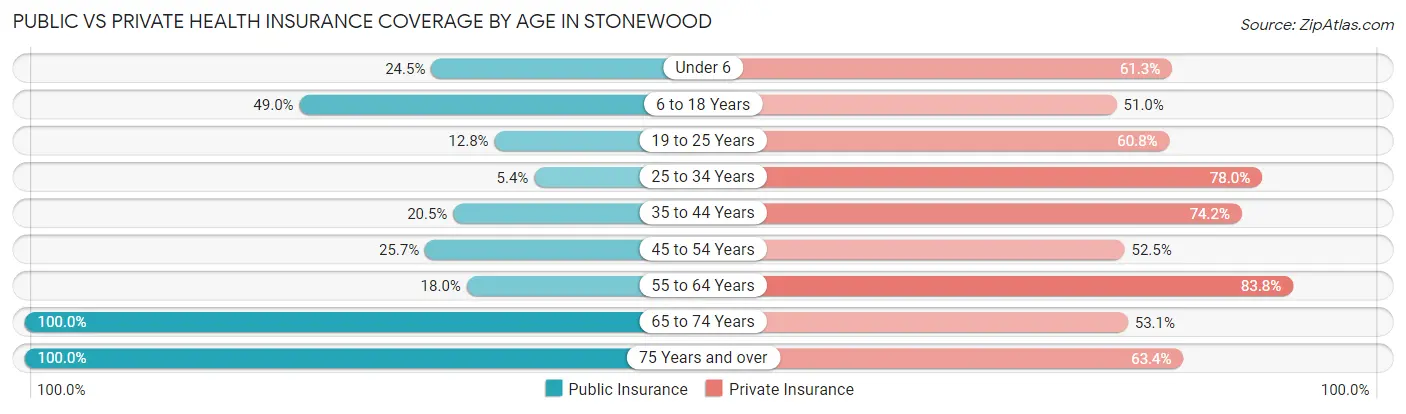
| Age Bracket | Public Insurance | Private Insurance |
| Under 6 | 38 (24.5%) | 95 (61.3%) |
| 6 to 18 Years | 242 (49.0%) | 252 (51.0%) |
| 19 to 25 Years | 16 (12.8%) | 76 (60.8%) |
| 25 to 34 Years | 14 (5.4%) | 202 (78.0%) |
| 35 to 44 Years | 73 (20.4%) | 265 (74.2%) |
| 45 to 54 Years | 67 (25.7%) | 137 (52.5%) |
| 55 to 64 Years | 63 (17.9%) | 294 (83.8%) |
| 65 to 74 Years | 194 (100.0%) | 103 (53.1%) |
| 75 Years and over | 224 (100.0%) | 142 (63.4%) |
| Total | 931 (38.5%) | 1,566 (64.7%) |
Disability Status by Sex by Age in Stonewood
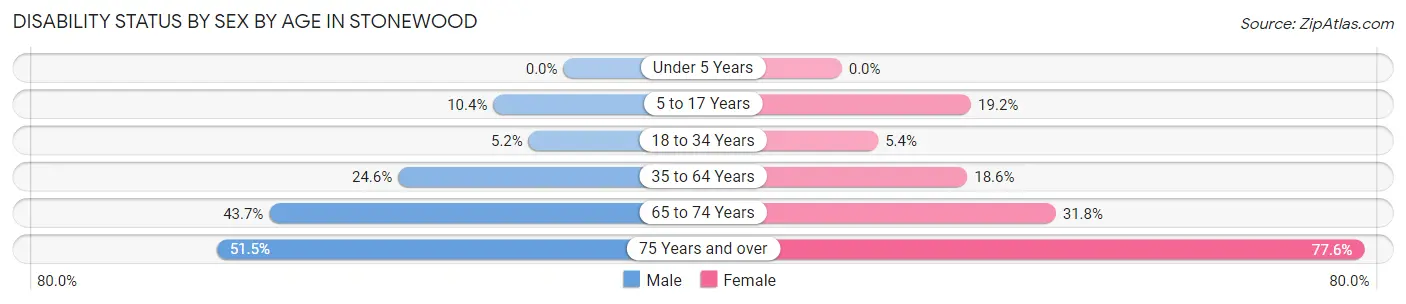
| Age Bracket | Male | Female |
| Under 5 Years | 0 (0.0%) | 0 (0.0%) |
| 5 to 17 Years | 33 (10.4%) | 39 (19.2%) |
| 18 to 34 Years | 11 (5.2%) | 10 (5.4%) |
| 35 to 64 Years | 122 (24.5%) | 88 (18.6%) |
| 65 to 74 Years | 38 (43.7%) | 34 (31.8%) |
| 75 Years and over | 35 (51.5%) | 121 (77.6%) |
Disability Class by Sex by Age in Stonewood
Disability Class: Hearing Difficulty
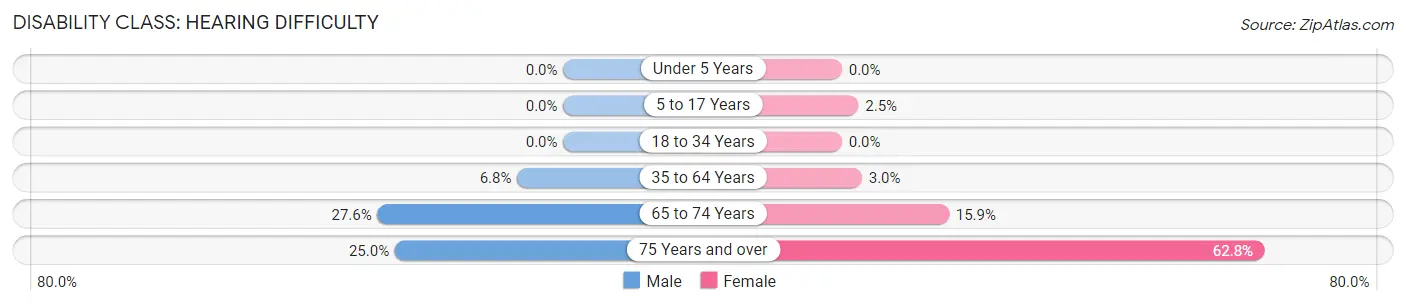
| Age Bracket | Male | Female |
| Under 5 Years | 0 (0.0%) | 0 (0.0%) |
| 5 to 17 Years | 0 (0.0%) | 5 (2.5%) |
| 18 to 34 Years | 0 (0.0%) | 0 (0.0%) |
| 35 to 64 Years | 34 (6.8%) | 14 (3.0%) |
| 65 to 74 Years | 24 (27.6%) | 17 (15.9%) |
| 75 Years and over | 17 (25.0%) | 98 (62.8%) |
Disability Class: Vision Difficulty
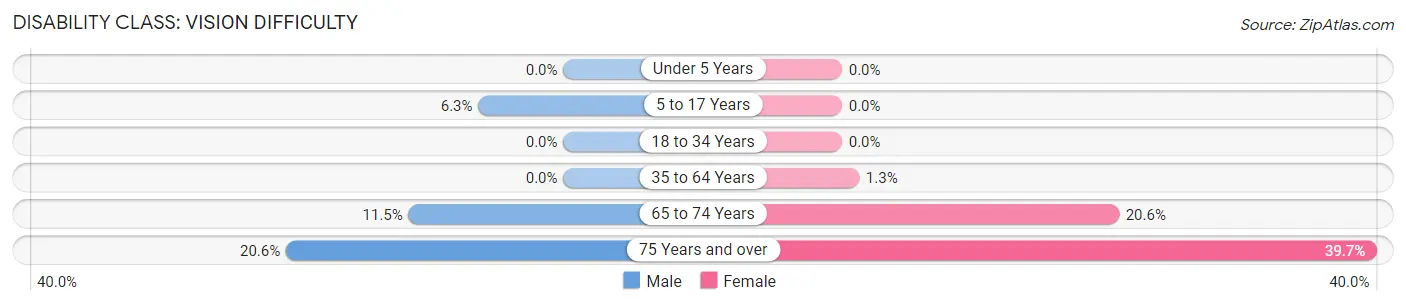
| Age Bracket | Male | Female |
| Under 5 Years | 0 (0.0%) | 0 (0.0%) |
| 5 to 17 Years | 20 (6.3%) | 0 (0.0%) |
| 18 to 34 Years | 0 (0.0%) | 0 (0.0%) |
| 35 to 64 Years | 0 (0.0%) | 6 (1.3%) |
| 65 to 74 Years | 10 (11.5%) | 22 (20.6%) |
| 75 Years and over | 14 (20.6%) | 62 (39.7%) |
Disability Class: Cognitive Difficulty
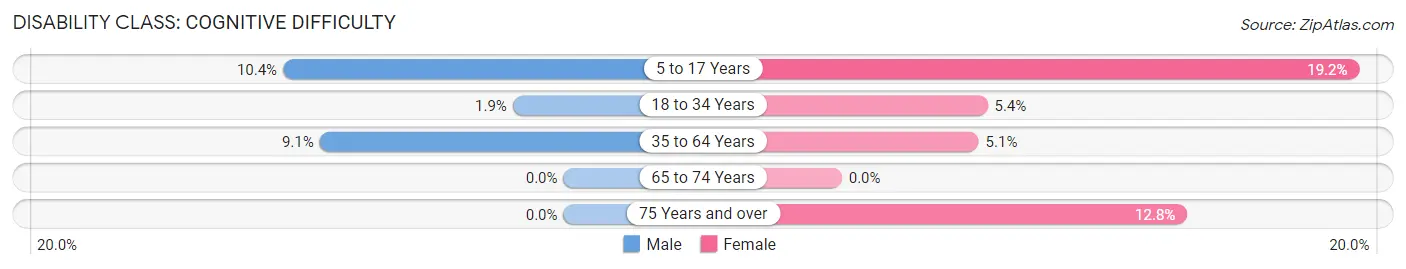
| Age Bracket | Male | Female |
| 5 to 17 Years | 33 (10.4%) | 39 (19.2%) |
| 18 to 34 Years | 4 (1.9%) | 10 (5.4%) |
| 35 to 64 Years | 45 (9.0%) | 24 (5.1%) |
| 65 to 74 Years | 0 (0.0%) | 0 (0.0%) |
| 75 Years and over | 0 (0.0%) | 20 (12.8%) |
Disability Class: Ambulatory Difficulty
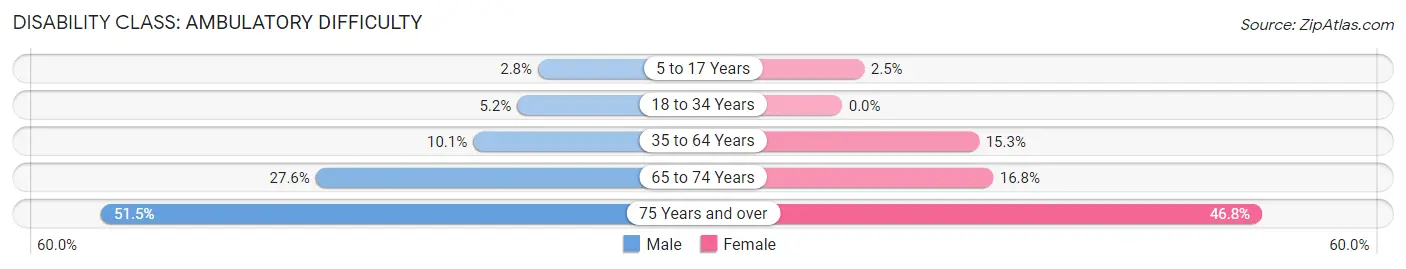
| Age Bracket | Male | Female |
| 5 to 17 Years | 9 (2.8%) | 5 (2.5%) |
| 18 to 34 Years | 11 (5.2%) | 0 (0.0%) |
| 35 to 64 Years | 50 (10.1%) | 72 (15.2%) |
| 65 to 74 Years | 24 (27.6%) | 18 (16.8%) |
| 75 Years and over | 35 (51.5%) | 73 (46.8%) |
Disability Class: Self-Care Difficulty
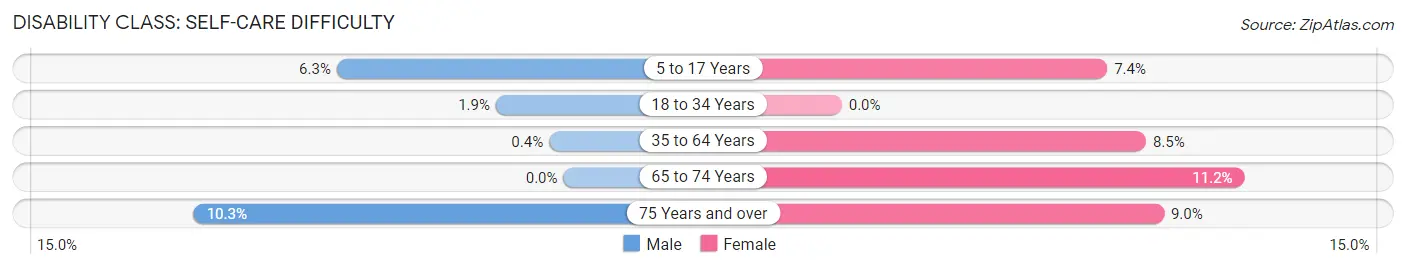
| Age Bracket | Male | Female |
| 5 to 17 Years | 20 (6.3%) | 15 (7.4%) |
| 18 to 34 Years | 4 (1.9%) | 0 (0.0%) |
| 35 to 64 Years | 2 (0.4%) | 40 (8.5%) |
| 65 to 74 Years | 0 (0.0%) | 12 (11.2%) |
| 75 Years and over | 7 (10.3%) | 14 (9.0%) |
Technology Access in Stonewood
Computing Device Access in Stonewood
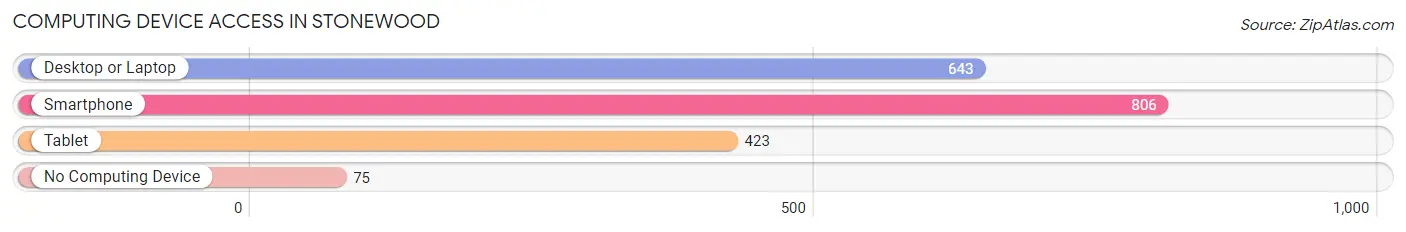
| Device Type | # Households | % Households |
| Desktop or Laptop | 643 | 70.6% |
| Smartphone | 806 | 88.5% |
| Tablet | 423 | 46.4% |
| No Computing Device | 75 | 8.2% |
| Total | 911 | 100.0% |
Internet Access in Stonewood
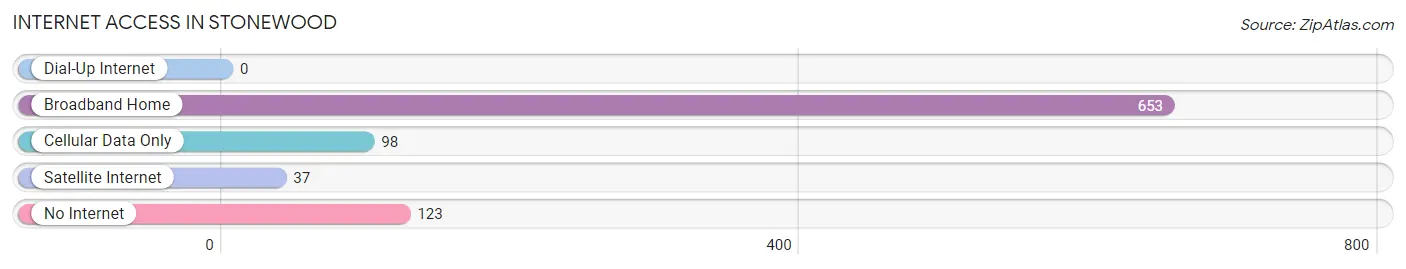
| Internet Type | # Households | % Households |
| Dial-Up Internet | 0 | 0.0% |
| Broadband Home | 653 | 71.7% |
| Cellular Data Only | 98 | 10.8% |
| Satellite Internet | 37 | 4.1% |
| No Internet | 123 | 13.5% |
| Total | 911 | 100.0% |
Stonewood Summary
Stonewood is a small town located in Harrison County, West Virginia. It is situated on the banks of the West Fork River, and is part of the Clarksburg, WV Metropolitan Statistical Area. The town has a population of approximately 1,000 people, and is known for its small-town charm and friendly atmosphere.
Geography
Stonewood is located in the northern part of Harrison County, West Virginia. It is situated on the banks of the West Fork River, and is part of the Clarksburg, WV Metropolitan Statistical Area. The town is located at an elevation of 890 feet above sea level. The town is surrounded by rolling hills and lush forests, and is home to a variety of wildlife.
The climate in Stonewood is classified as humid continental, with hot summers and cold winters. The average annual temperature is around 50 degrees Fahrenheit, with an average high of around 75 degrees in the summer and an average low of around 25 degrees in the winter. The town receives an average of 40 inches of precipitation per year, with most of it falling in the form of snow during the winter months.
Economy
The economy of Stonewood is largely based on the coal mining industry. The town is home to several coal mines, and many of the town’s residents are employed in the industry. In addition to coal mining, the town is also home to several small businesses, including restaurants, retail stores, and other services.
Demographics
As of the 2010 census, the population of Stonewood was 1,000 people. The racial makeup of the town was 97.2% White, 0.7% African American, 0.2% Native American, 0.2% Asian, 0.2% from other races, and 1.7% from two or more races. Hispanic or Latino of any race were 0.7% of the population.
The median household income in Stonewood was $30,000, and the median family income was $35,000. The per capita income for the town was $14,000. About 17.2% of the population was below the poverty line.
Conclusion
Stonewood is a small town located in Harrison County, West Virginia. It is situated on the banks of the West Fork River, and is part of the Clarksburg, WV Metropolitan Statistical Area. The town has a population of approximately 1,000 people, and is known for its small-town charm and friendly atmosphere. The economy of Stonewood is largely based on the coal mining industry, and the town is home to several small businesses. The racial makeup of the town is predominantly White, with a small percentage of African American, Native American, and Asian residents. The median household income in Stonewood is $30,000, and the per capita income is $14,000.
Common Questions
What is Per Capita Income in Stonewood?
Per Capita income in Stonewood is $26,796.
What is the Median Family Income in Stonewood?
Median Family Income in Stonewood is $58,500.
What is the Median Household income in Stonewood?
Median Household Income in Stonewood is $49,402.
What is Income or Wage Gap in Stonewood?
Income or Wage Gap in Stonewood is 17.2%.
Women in Stonewood earn 82.8 cents for every dollar earned by a man.
What is Inequality or Gini Index in Stonewood?
Inequality or Gini Index in Stonewood is 0.37.
What is the Total Population of Stonewood?
Total Population of Stonewood is 2,428.
What is the Total Male Population of Stonewood?
Total Male Population of Stonewood is 1,224.
What is the Total Female Population of Stonewood?
Total Female Population of Stonewood is 1,204.
What is the Ratio of Males per 100 Females in Stonewood?
There are 101.66 Males per 100 Females in Stonewood.
What is the Ratio of Females per 100 Males in Stonewood?
There are 98.37 Females per 100 Males in Stonewood.
What is the Median Population Age in Stonewood?
Median Population Age in Stonewood is 41.5 Years.
What is the Average Family Size in Stonewood
Average Family Size in Stonewood is 3.3 People.
What is the Average Household Size in Stonewood
Average Household Size in Stonewood is 2.6 People.
How Large is the Labor Force in Stonewood?
There are 1,100 People in the Labor Forcein in Stonewood.
What is the Percentage of People in the Labor Force in Stonewood?
59.4% of People are in the Labor Force in Stonewood.
What is the Unemployment Rate in Stonewood?
Unemployment Rate in Stonewood is 11.4%.