Lavalette, WV Map & Demographics
Lavalette Map
Lavalette Overview
$19,029
PER CAPITA INCOME
$82,316
AVG FAMILY INCOME
$80,404
AVG HOUSEHOLD INCOME
0.24
INEQUALITY / GINI INDEX
991
TOTAL POPULATION
491
MALE POPULATION
500
FEMALE POPULATION
98.20
MALES / 100 FEMALES
101.83
FEMALES / 100 MALES
25.1
MEDIAN AGE
5.6
AVG FAMILY SIZE
4.5
AVG HOUSEHOLD SIZE
375
LABOR FORCE [ PEOPLE ]
59.3%
PERCENT IN LABOR FORCE
Lavalette Zip Codes
Lavalette Area Codes
Income in Lavalette
Income Overview in Lavalette
Per Capita Income in Lavalette is $19,029, while median incomes of families and households are $82,316 and $80,404 respectively.
| Characteristic | Number | Measure |
| Per Capita Income | 991 | $19,029 |
| Median Family Income | 167 | $82,316 |
| Mean Family Income | 167 | $96,435 |
| Median Household Income | 219 | $80,404 |
| Mean Household Income | 219 | $82,621 |
| Income Deficit | 167 | $0 |
| Wage / Income Gap (%) | 991 | 0.00% |
| Wage / Income Gap ($) | 991 | 100.00¢ per $1 |
| Gini / Inequality Index | 991 | 0.24 |
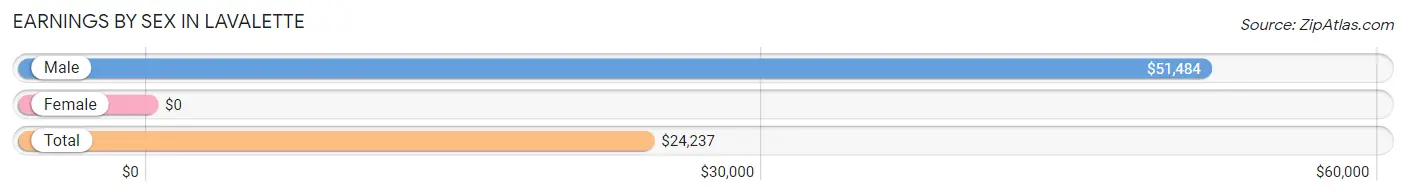
Earnings by Sex in Lavalette
| Sex | Number | Average Earnings |
| Male | 189 (50.4%) | $51,484 |
| Female | 186 (49.6%) | $0 |
| Total | 375 (100.0%) | $24,237 |
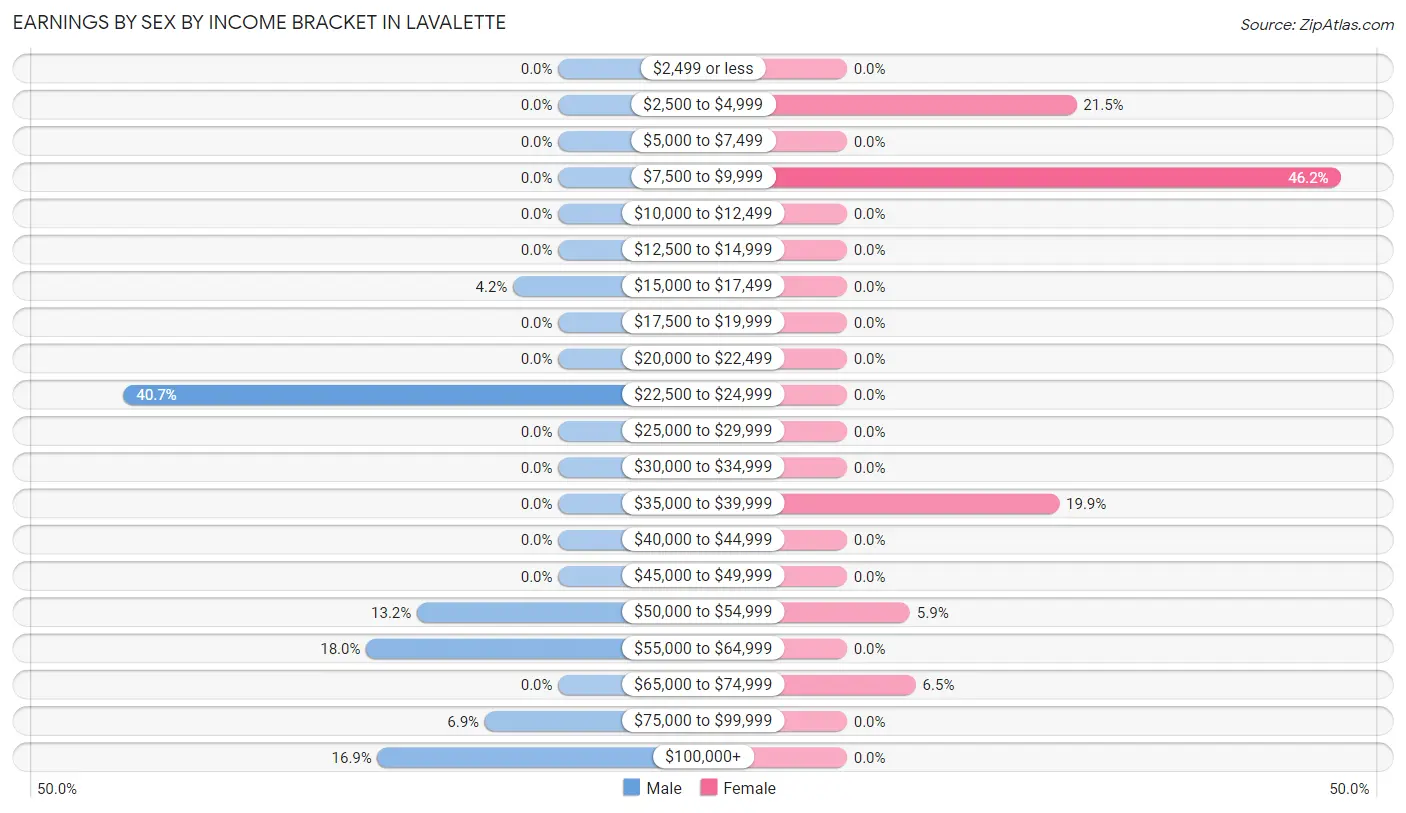
Earnings by Sex by Income Bracket in Lavalette
The most common earnings brackets in Lavalette are $22,500 to $24,999 for men (77 | 40.7%) and $7,500 to $9,999 for women (86 | 46.2%).
| Income | Male | Female |
| $2,499 or less | 0 (0.0%) | 0 (0.0%) |
| $2,500 to $4,999 | 0 (0.0%) | 40 (21.5%) |
| $5,000 to $7,499 | 0 (0.0%) | 0 (0.0%) |
| $7,500 to $9,999 | 0 (0.0%) | 86 (46.2%) |
| $10,000 to $12,499 | 0 (0.0%) | 0 (0.0%) |
| $12,500 to $14,999 | 0 (0.0%) | 0 (0.0%) |
| $15,000 to $17,499 | 8 (4.2%) | 0 (0.0%) |
| $17,500 to $19,999 | 0 (0.0%) | 0 (0.0%) |
| $20,000 to $22,499 | 0 (0.0%) | 0 (0.0%) |
| $22,500 to $24,999 | 77 (40.7%) | 0 (0.0%) |
| $25,000 to $29,999 | 0 (0.0%) | 0 (0.0%) |
| $30,000 to $34,999 | 0 (0.0%) | 0 (0.0%) |
| $35,000 to $39,999 | 0 (0.0%) | 37 (19.9%) |
| $40,000 to $44,999 | 0 (0.0%) | 0 (0.0%) |
| $45,000 to $49,999 | 0 (0.0%) | 0 (0.0%) |
| $50,000 to $54,999 | 25 (13.2%) | 11 (5.9%) |
| $55,000 to $64,999 | 34 (18.0%) | 0 (0.0%) |
| $65,000 to $74,999 | 0 (0.0%) | 12 (6.5%) |
| $75,000 to $99,999 | 13 (6.9%) | 0 (0.0%) |
| $100,000+ | 32 (16.9%) | 0 (0.0%) |
| Total | 189 (100.0%) | 186 (100.0%) |
Earnings by Sex by Educational Attainment in Lavalette
| Educational Attainment | Male Income | Female Income |
| Less than High School | - | - |
| High School Diploma | - | - |
| College or Associate's Degree | - | - |
| Bachelor's Degree | - | - |
| Graduate Degree | - | - |
| Total | $51,484 | $0 |
Family Income in Lavalette
Family Income Brackets in Lavalette
According to the Lavalette family income data, there are 81 families falling into the $100,000 to $149,999 income range, which is the most common income bracket and makes up 48.5% of all families.
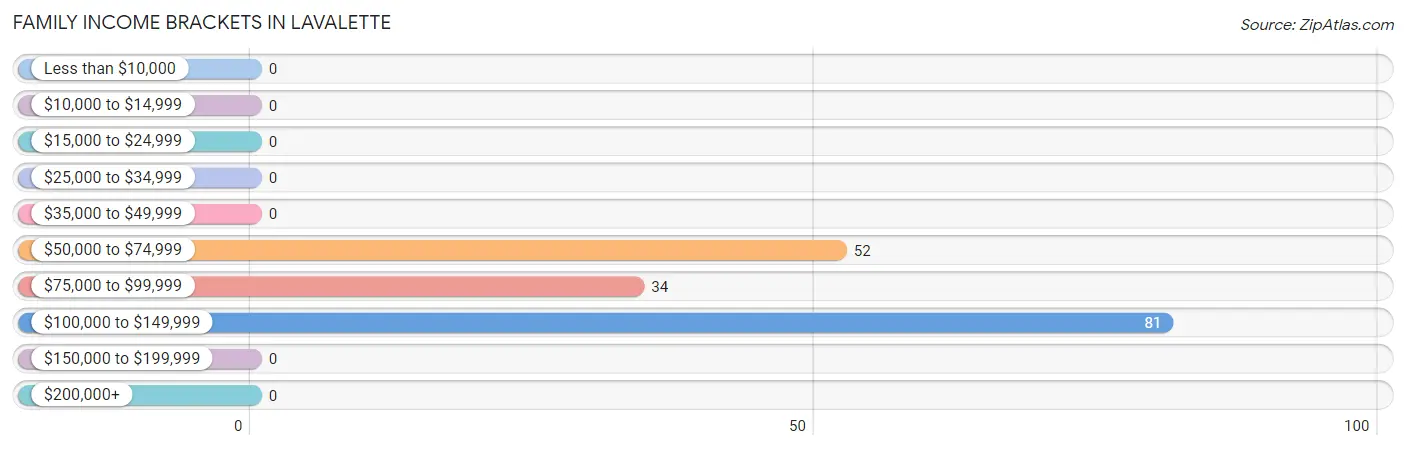
| Income Bracket | # Families | % Families |
| Less than $10,000 | 0 | 0.0% |
| $10,000 to $14,999 | 0 | 0.0% |
| $15,000 to $24,999 | 0 | 0.0% |
| $25,000 to $34,999 | 0 | 0.0% |
| $35,000 to $49,999 | 0 | 0.0% |
| $50,000 to $74,999 | 52 | 31.1% |
| $75,000 to $99,999 | 34 | 20.4% |
| $100,000 to $149,999 | 81 | 48.5% |
| $150,000 to $199,999 | 0 | 0.0% |
| $200,000+ | 0 | 0.0% |
Family Income by Famaliy Size in Lavalette
4-person families (41 | 24.5%) account for the highest median family income in Lavalette with $107,361 per family, while 4-person families (41 | 24.5%) have the highest median income of $26,840 per family member.
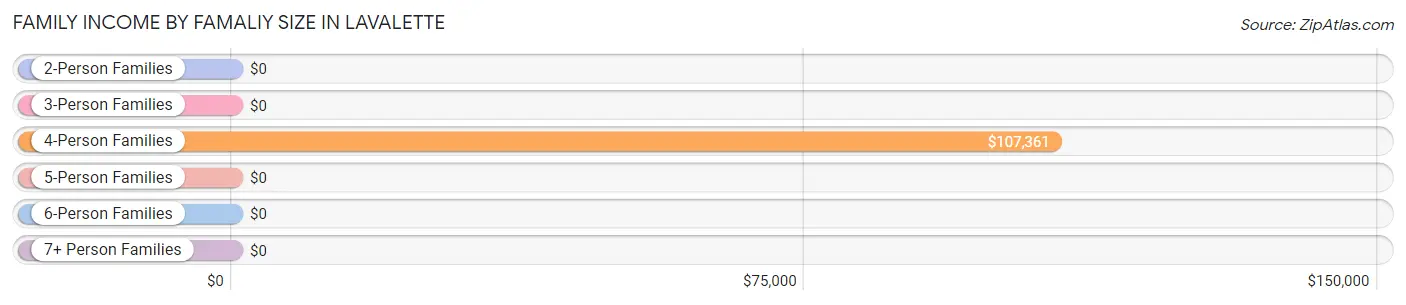
| Income Bracket | # Families | Median Income |
| 2-Person Families | 19 (11.4%) | $0 |
| 3-Person Families | 0 (0.0%) | $0 |
| 4-Person Families | 41 (24.5%) | $107,361 |
| 5-Person Families | 33 (19.8%) | $0 |
| 6-Person Families | 74 (44.3%) | $0 |
| 7+ Person Families | 0 (0.0%) | $0 |
| Total | 167 (100.0%) | $82,316 |
Family Income by Number of Earners in Lavalette
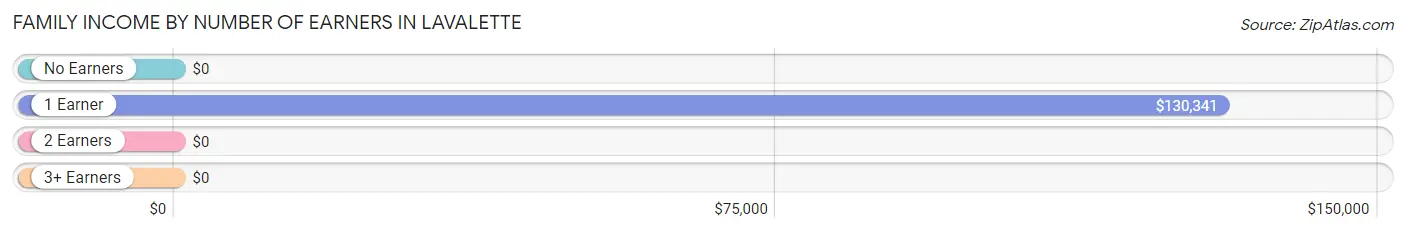
| Number of Earners | # Families | Median Income |
| No Earners | 0 (0.0%) | $0 |
| 1 Earner | 71 (42.5%) | $130,341 |
| 2 Earners | 62 (37.1%) | $0 |
| 3+ Earners | 34 (20.4%) | $0 |
| Total | 167 (100.0%) | $82,316 |
Household Income in Lavalette
Household Income Brackets in Lavalette
With 81 households falling in the category, the $100,000 to $149,999 income range is the most frequent in Lavalette, accounting for 37.0% of all households.
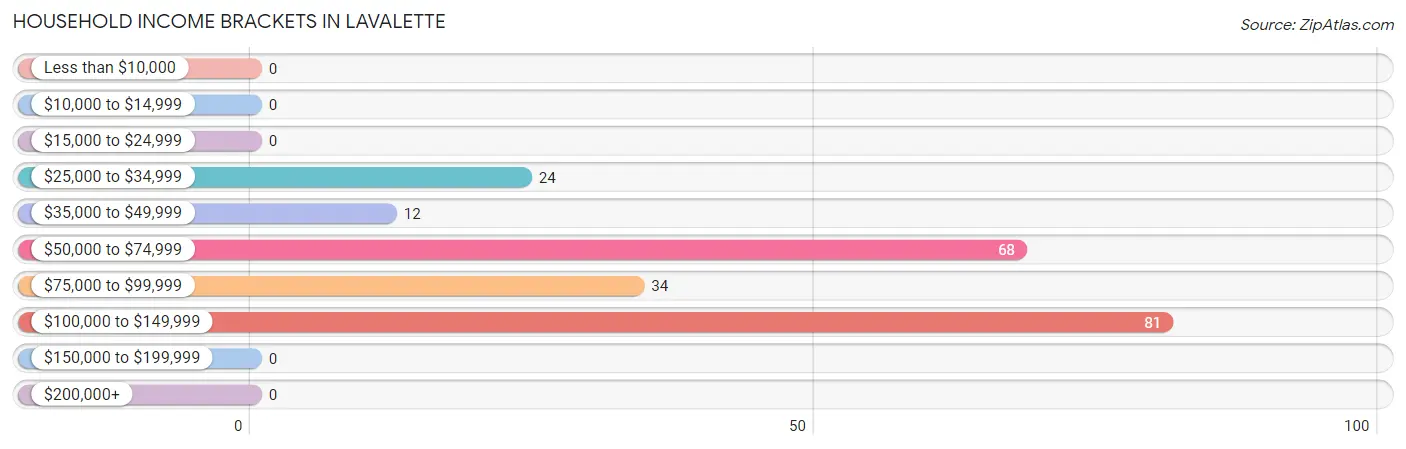
| Income Bracket | # Households | % Households |
| Less than $10,000 | 0 | 0.0% |
| $10,000 to $14,999 | 0 | 0.0% |
| $15,000 to $24,999 | 0 | 0.0% |
| $25,000 to $34,999 | 24 | 11.0% |
| $35,000 to $49,999 | 12 | 5.5% |
| $50,000 to $74,999 | 68 | 31.1% |
| $75,000 to $99,999 | 34 | 15.5% |
| $100,000 to $149,999 | 81 | 37.0% |
| $150,000 to $199,999 | 0 | 0.0% |
| $200,000+ | 0 | 0.0% |
Household Income by Householder Age in Lavalette
The median household income in Lavalette is $80,404, with the highest median household income of $81,176 found in the 25 to 44 years age bracket for the primary householder. A total of 160 households (73.1%) fall into this category.
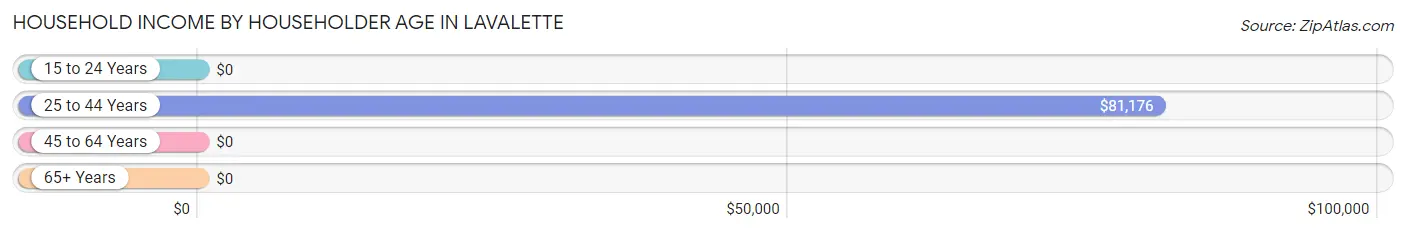
| Income Bracket | # Households | Median Income |
| 15 to 24 Years | 0 (0.0%) | $0 |
| 25 to 44 Years | 160 (73.1%) | $81,176 |
| 45 to 64 Years | 35 (16.0%) | $0 |
| 65+ Years | 24 (11.0%) | $0 |
| Total | 219 (100.0%) | $80,404 |
Poverty in Lavalette
Income Below Poverty by Sex and Age in Lavalette
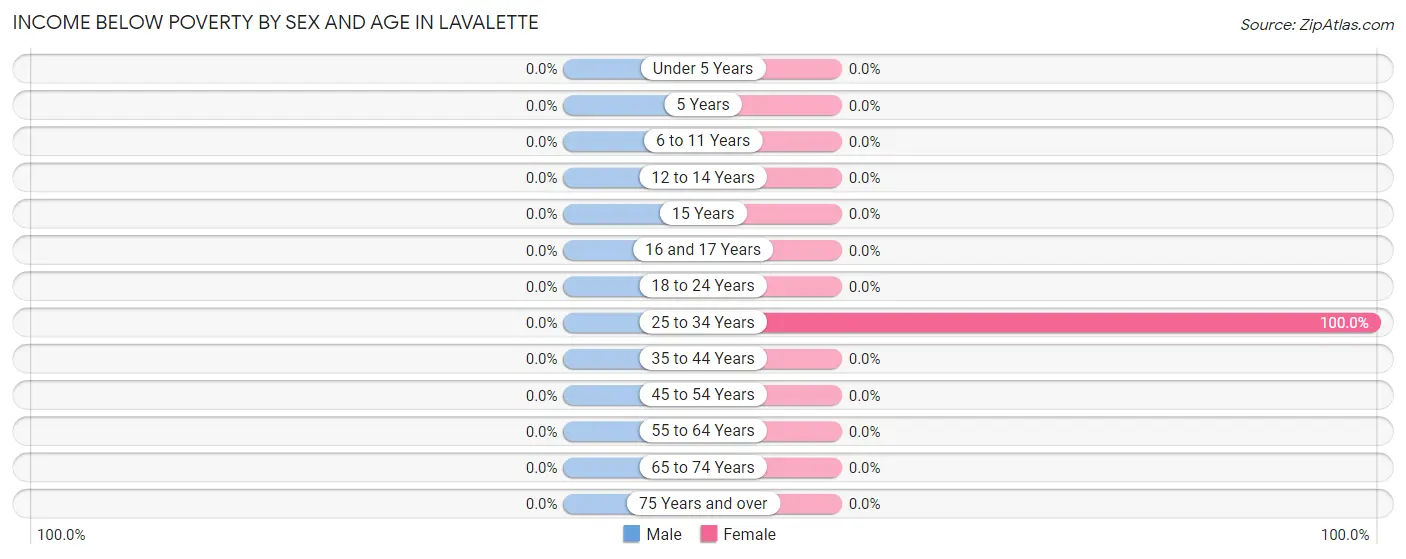
| Age Bracket | Male | Female |
| Under 5 Years | 0 (0.0%) | 0 (0.0%) |
| 5 Years | 0 (0.0%) | 0 (0.0%) |
| 6 to 11 Years | 0 (0.0%) | 0 (0.0%) |
| 12 to 14 Years | 0 (0.0%) | 0 (0.0%) |
| 15 Years | 0 (0.0%) | 0 (0.0%) |
| 16 and 17 Years | 0 (0.0%) | 0 (0.0%) |
| 18 to 24 Years | 0 (0.0%) | 0 (0.0%) |
| 25 to 34 Years | 0 (0.0%) | 12 (100.0%) |
| 35 to 44 Years | 0 (0.0%) | 0 (0.0%) |
| 45 to 54 Years | 0 (0.0%) | 0 (0.0%) |
| 55 to 64 Years | 0 (0.0%) | 0 (0.0%) |
| 65 to 74 Years | 0 (0.0%) | 0 (0.0%) |
| 75 Years and over | 0 (0.0%) | 0 (0.0%) |
| Total | 0 (0.0%) | 12 (2.4%) |
Income Above Poverty by Sex and Age in Lavalette
According to the poverty statistics in Lavalette, males aged under 5 years and females aged under 5 years are the age groups that are most secure financially, with 100.0% of males and 100.0% of females in these age groups living above the poverty line.
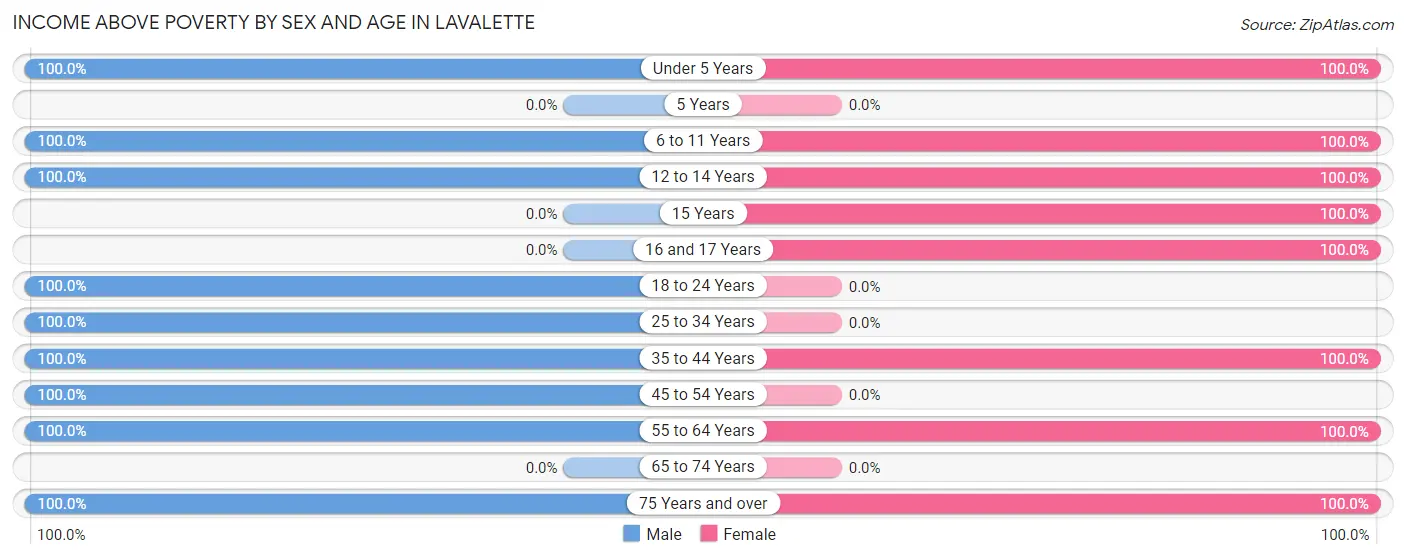
| Age Bracket | Male | Female |
| Under 5 Years | 15 (100.0%) | 54 (100.0%) |
| 5 Years | 0 (0.0%) | 0 (0.0%) |
| 6 to 11 Years | 97 (100.0%) | 68 (100.0%) |
| 12 to 14 Years | 90 (100.0%) | 20 (100.0%) |
| 15 Years | 0 (0.0%) | 15 (100.0%) |
| 16 and 17 Years | 0 (0.0%) | 73 (100.0%) |
| 18 to 24 Years | 59 (100.0%) | 0 (0.0%) |
| 25 to 34 Years | 77 (100.0%) | 0 (0.0%) |
| 35 to 44 Years | 103 (100.0%) | 171 (100.0%) |
| 45 to 54 Years | 16 (100.0%) | 0 (0.0%) |
| 55 to 64 Years | 19 (100.0%) | 19 (100.0%) |
| 65 to 74 Years | 0 (0.0%) | 0 (0.0%) |
| 75 Years and over | 15 (100.0%) | 68 (100.0%) |
| Total | 491 (100.0%) | 488 (97.6%) |
Income Below Poverty Among Married-Couple Families in Lavalette
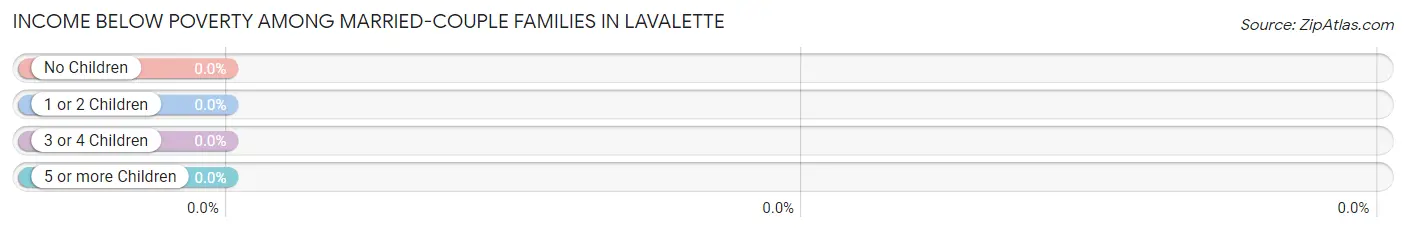
| Children | Above Poverty | Below Poverty |
| No Children | 19 (100.0%) | 0 (0.0%) |
| 1 or 2 Children | 41 (100.0%) | 0 (0.0%) |
| 3 or 4 Children | 67 (100.0%) | 0 (0.0%) |
| 5 or more Children | 0 (0.0%) | 0 (0.0%) |
| Total | 127 (100.0%) | 0 (0.0%) |
Income Below Poverty Among Single-Parent Households in Lavalette
| Children | Single Father | Single Mother |
| No Children | 0 (0.0%) | 0 (0.0%) |
| 1 or 2 Children | 0 (0.0%) | 0 (0.0%) |
| 3 or 4 Children | 0 (0.0%) | 0 (0.0%) |
| 5 or more Children | 0 (0.0%) | 0 (0.0%) |
| Total | 0 (0.0%) | 0 (0.0%) |
Income Below Poverty Among Married-Couple vs Single-Parent Households in Lavalette
| Children | Married-Couple Families | Single-Parent Households |
| No Children | 0 (0.0%) | 0 (0.0%) |
| 1 or 2 Children | 0 (0.0%) | 0 (0.0%) |
| 3 or 4 Children | 0 (0.0%) | 0 (0.0%) |
| 5 or more Children | 0 (0.0%) | 0 (0.0%) |
| Total | 0 (0.0%) | 0 (0.0%) |
Race in Lavalette
The most populous races in Lavalette are White / Caucasian (972 | 98.1%), Two or more Races (12 | 1.2%), and Black / African American (7 | 0.7%).
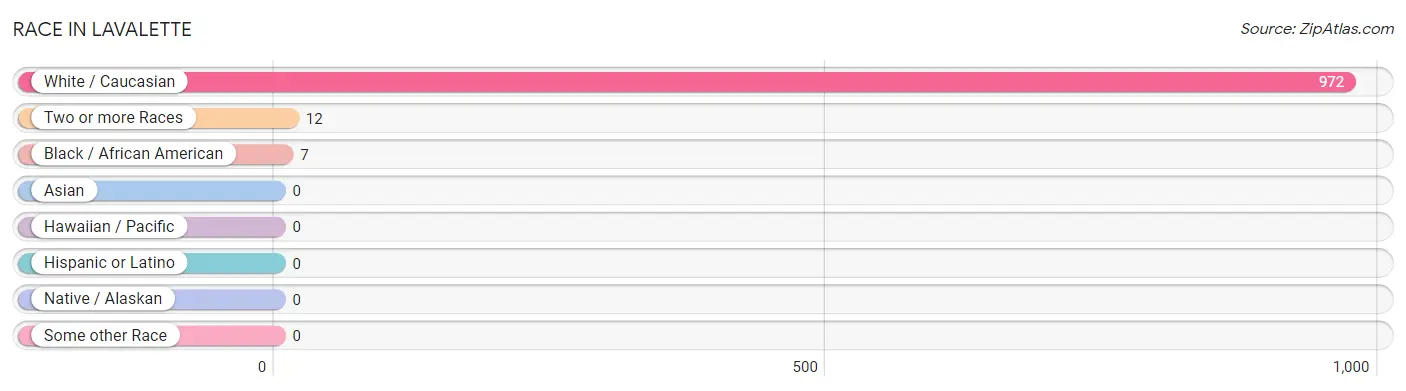
| Race | # Population | % Population |
| Asian | 0 | 0.0% |
| Black / African American | 7 | 0.7% |
| Hawaiian / Pacific | 0 | 0.0% |
| Hispanic or Latino | 0 | 0.0% |
| Native / Alaskan | 0 | 0.0% |
| White / Caucasian | 972 | 98.1% |
| Two or more Races | 12 | 1.2% |
| Some other Race | 0 | 0.0% |
| Total | 991 | 100.0% |
Ancestry in Lavalette
The most populous ancestries reported in Lavalette are American (341 | 34.4%), German (136 | 13.7%), Irish (89 | 9.0%), English (75 | 7.6%), and Russian (35 | 3.5%), together accounting for 68.2% of all Lavalette residents.
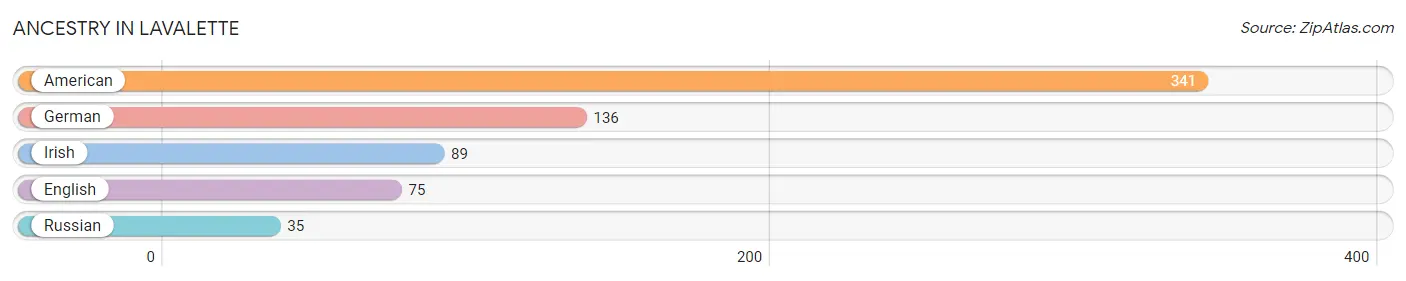
| Ancestry | # Population | % Population |
| American | 341 | 34.4% |
| English | 75 | 7.6% |
| German | 136 | 13.7% |
| Irish | 89 | 9.0% |
| Russian | 35 | 3.5% | View All 5 Rows |
Immigrants in Lavalette

| Immigration Origin | # Population | % Population | View All 0 Rows |
Sex and Age in Lavalette
Sex and Age in Lavalette
The most populous age groups in Lavalette are 10 to 14 Years (134 | 27.3%) for men and 35 to 39 Years (102 | 20.4%) for women.
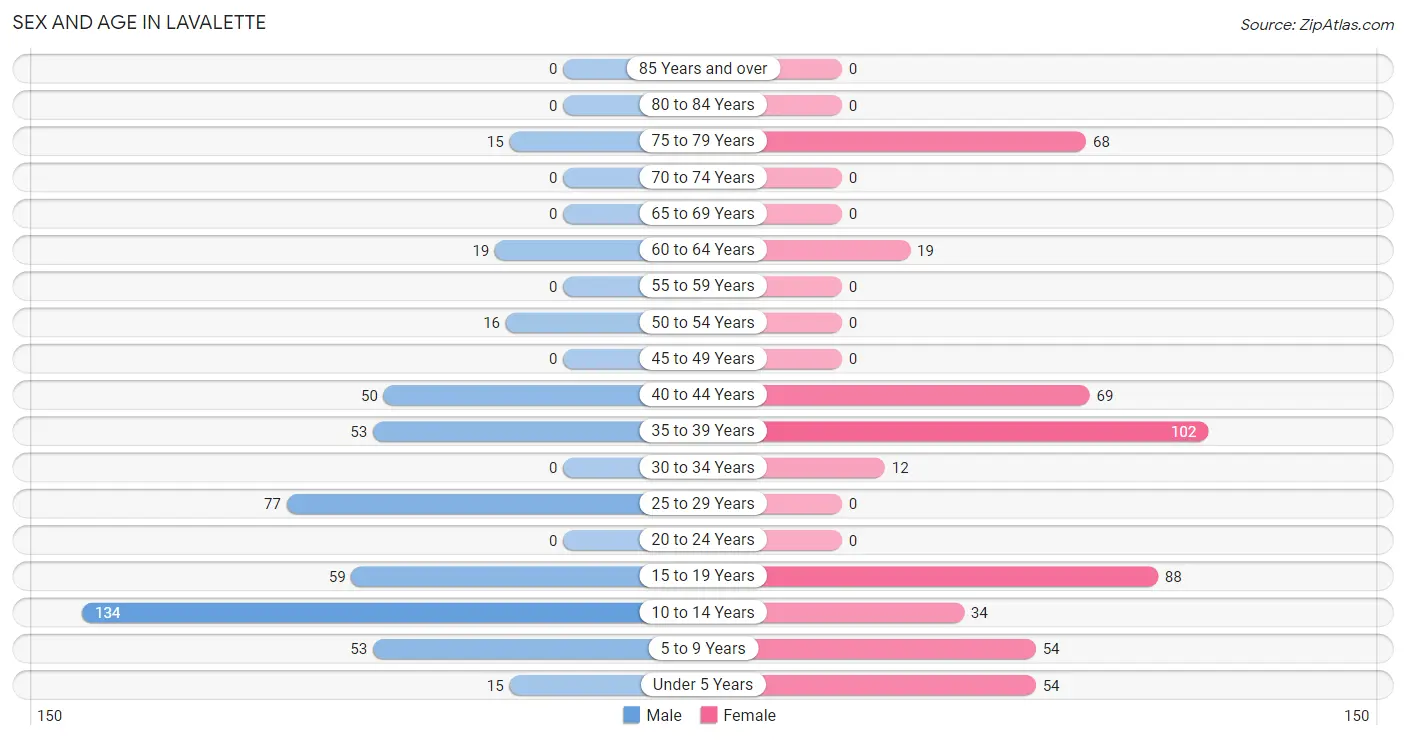
| Age Bracket | Male | Female |
| Under 5 Years | 15 (3.0%) | 54 (10.8%) |
| 5 to 9 Years | 53 (10.8%) | 54 (10.8%) |
| 10 to 14 Years | 134 (27.3%) | 34 (6.8%) |
| 15 to 19 Years | 59 (12.0%) | 88 (17.6%) |
| 20 to 24 Years | 0 (0.0%) | 0 (0.0%) |
| 25 to 29 Years | 77 (15.7%) | 0 (0.0%) |
| 30 to 34 Years | 0 (0.0%) | 12 (2.4%) |
| 35 to 39 Years | 53 (10.8%) | 102 (20.4%) |
| 40 to 44 Years | 50 (10.2%) | 69 (13.8%) |
| 45 to 49 Years | 0 (0.0%) | 0 (0.0%) |
| 50 to 54 Years | 16 (3.3%) | 0 (0.0%) |
| 55 to 59 Years | 0 (0.0%) | 0 (0.0%) |
| 60 to 64 Years | 19 (3.9%) | 19 (3.8%) |
| 65 to 69 Years | 0 (0.0%) | 0 (0.0%) |
| 70 to 74 Years | 0 (0.0%) | 0 (0.0%) |
| 75 to 79 Years | 15 (3.0%) | 68 (13.6%) |
| 80 to 84 Years | 0 (0.0%) | 0 (0.0%) |
| 85 Years and over | 0 (0.0%) | 0 (0.0%) |
| Total | 491 (100.0%) | 500 (100.0%) |
Families and Households in Lavalette
Median Family Size in Lavalette
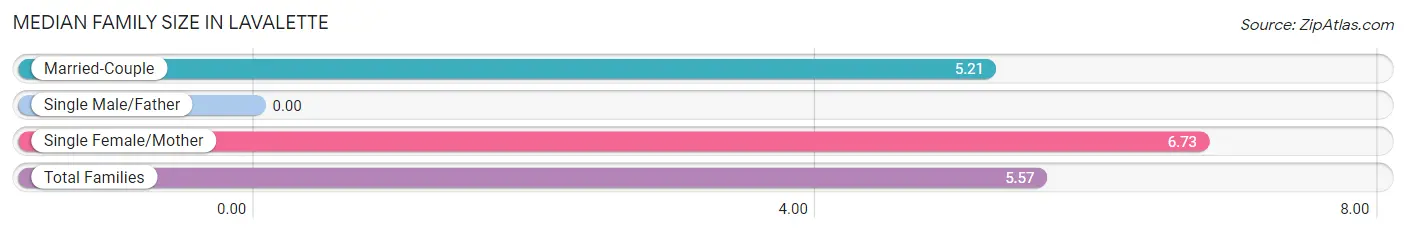
| Family Type | # Families | Family Size |
| Married-Couple | 127 (76.0%) | 5.21 |
| Single Male/Father | 0 (0.0%) | - |
| Single Female/Mother | 40 (23.9%) | 6.73 |
| Total Families | 167 (100.0%) | 5.57 |
Median Household Size in Lavalette
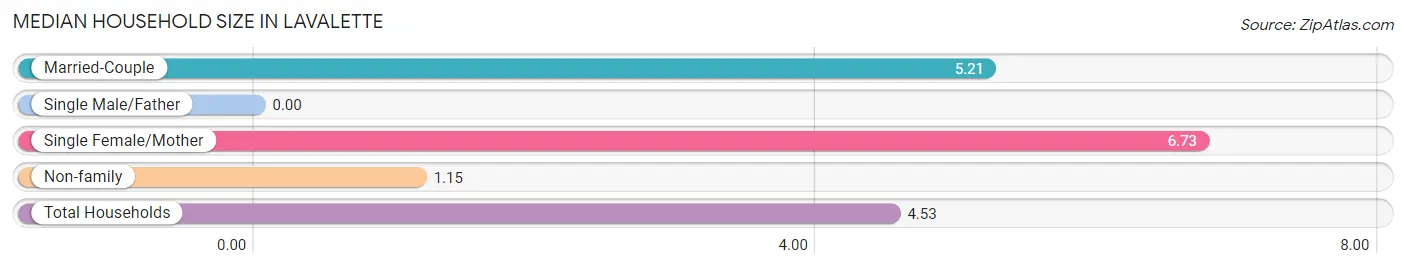
| Household Type | # Households | Household Size |
| Married-Couple | 127 (58.0%) | 5.21 |
| Single Male/Father | 0 (0.0%) | - |
| Single Female/Mother | 40 (18.3%) | 6.73 |
| Non-family | 52 (23.7%) | 1.15 |
| Total Households | 219 (100.0%) | 4.53 |
Household Size by Marriage Status in Lavalette
Out of a total of 219 households in Lavalette, 167 (76.3%) are family households, while 52 (23.7%) are nonfamily households. The most numerous type of family households are 6-person households, comprising 74, and the most common type of nonfamily households are 1-person households, comprising 40.
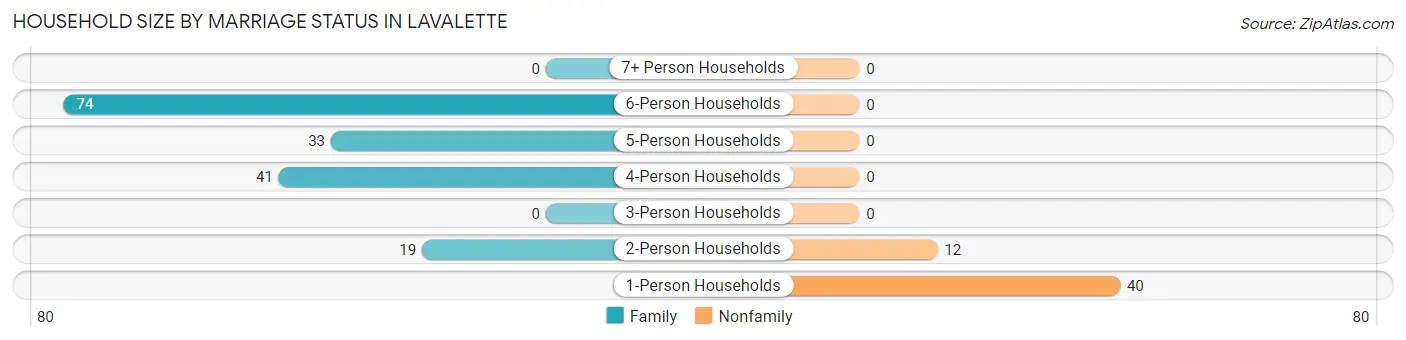
| Household Size | Family Households | Nonfamily Households |
| 1-Person Households | - | 40 (18.3%) |
| 2-Person Households | 19 (8.7%) | 12 (5.5%) |
| 3-Person Households | 0 (0.0%) | 0 (0.0%) |
| 4-Person Households | 41 (18.7%) | 0 (0.0%) |
| 5-Person Households | 33 (15.1%) | 0 (0.0%) |
| 6-Person Households | 74 (33.8%) | 0 (0.0%) |
| 7+ Person Households | 0 (0.0%) | 0 (0.0%) |
| Total | 167 (76.3%) | 52 (23.7%) |
Female Fertility in Lavalette
Fertility by Age in Lavalette
| Age Bracket | Women with Births | Births / 1,000 Women |
| 15 to 19 years | 0 (0.0%) | 0.0 |
| 20 to 34 years | 0 (0.0%) | 0.0 |
| 35 to 50 years | 0 (0.0%) | 0.0 |
| Total | 0 (0.0%) | 0.0 |
Fertility by Age by Marriage Status in Lavalette
| Age Bracket | Married | Unmarried |
| 15 to 19 years | 0 (0.0%) | 0 (0.0%) |
| 20 to 34 years | 0 (0.0%) | 0 (0.0%) |
| 35 to 50 years | 0 (0.0%) | 0 (0.0%) |
| Total | 0 (0.0%) | 0 (0.0%) |
Fertility by Education in Lavalette
| Educational Attainment | Women with Births | Births / 1,000 Women |
| Less than High School | 0 (0.0%) | 0.0 |
| High School Diploma | 0 (0.0%) | 0.0 |
| College or Associate's Degree | 0 (0.0%) | 0.0 |
| Bachelor's Degree | 0 (0.0%) | 0.0 |
| Graduate Degree | 0 (0.0%) | 0.0 |
| Total | 0 (0.0%) | 0.0 |
Fertility by Education by Marriage Status in Lavalette
| Educational Attainment | Married | Unmarried |
| Less than High School | 0 (0.0%) | 0 (0.0%) |
| High School Diploma | 0 (0.0%) | 0 (0.0%) |
| College or Associate's Degree | 0 (0.0%) | 0 (0.0%) |
| Bachelor's Degree | 0 (0.0%) | 0 (0.0%) |
| Graduate Degree | 0 (0.0%) | 0 (0.0%) |
| Total | 0 (0.0%) | 0 (0.0%) |
Employment Characteristics in Lavalette
Employment by Class of Employer in Lavalette
Among the 350 employed individuals in Lavalette, private company employees (278 | 79.4%), federal government employees (52 | 14.9%), and local government employees (20 | 5.7%) make up the most common classes of employment.
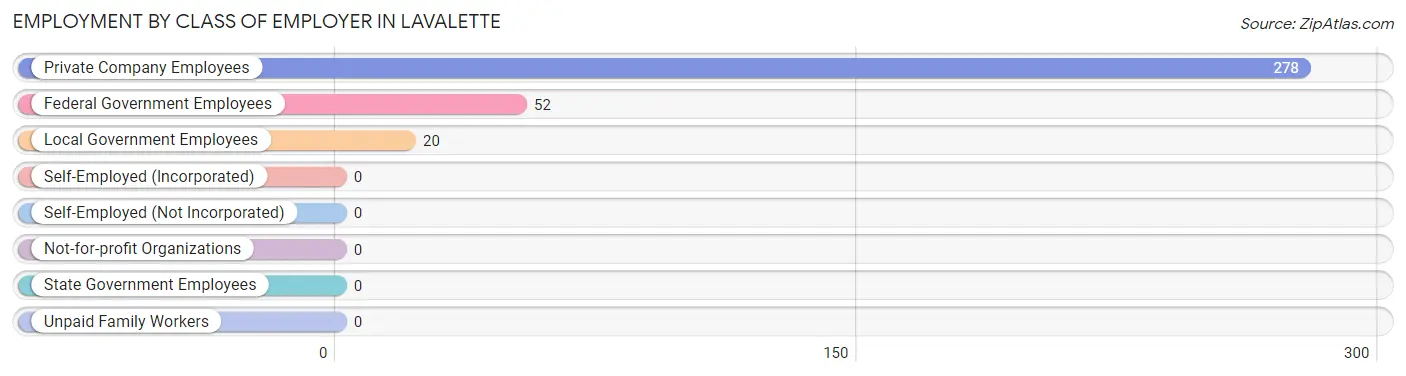
| Employer Class | # Employees | % Employees |
| Private Company Employees | 278 | 79.4% |
| Self-Employed (Incorporated) | 0 | 0.0% |
| Self-Employed (Not Incorporated) | 0 | 0.0% |
| Not-for-profit Organizations | 0 | 0.0% |
| Local Government Employees | 20 | 5.7% |
| State Government Employees | 0 | 0.0% |
| Federal Government Employees | 52 | 14.9% |
| Unpaid Family Workers | 0 | 0.0% |
| Total | 350 | 100.0% |
Employment Status by Age in Lavalette
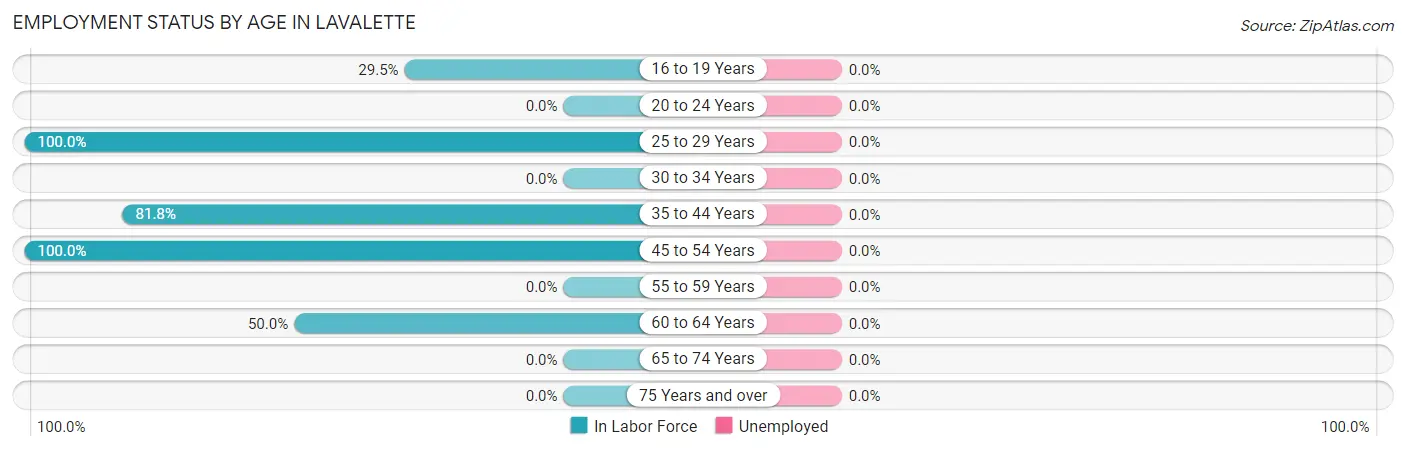
| Age Bracket | In Labor Force | Unemployed |
| 16 to 19 Years | 39 (29.5%) | 0 (0.0%) |
| 20 to 24 Years | 0 (0.0%) | 0 (0.0%) |
| 25 to 29 Years | 77 (100.0%) | 0 (0.0%) |
| 30 to 34 Years | 0 (0.0%) | 0 (0.0%) |
| 35 to 44 Years | 224 (81.8%) | 0 (0.0%) |
| 45 to 54 Years | 16 (100.0%) | 0 (0.0%) |
| 55 to 59 Years | 0 (0.0%) | 0 (0.0%) |
| 60 to 64 Years | 19 (50.0%) | 0 (0.0%) |
| 65 to 74 Years | 0 (0.0%) | 0 (0.0%) |
| 75 Years and over | 0 (0.0%) | 0 (0.0%) |
| Total | 375 (59.3%) | 0 (0.0%) |
Employment Status by Educational Attainment in Lavalette
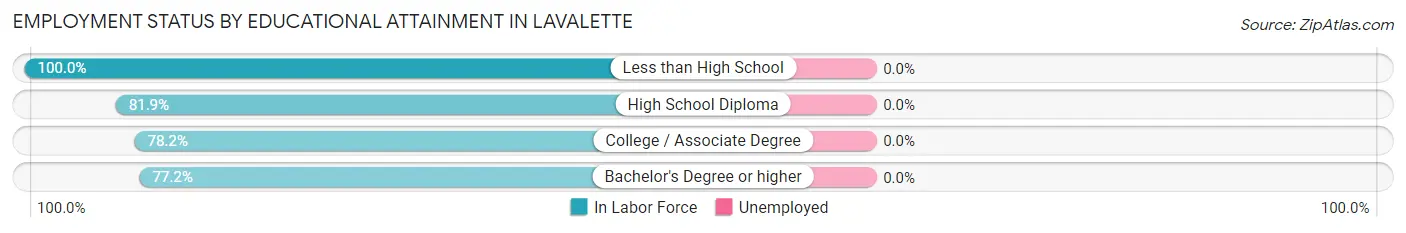
| Educational Attainment | In Labor Force | Unemployed |
| Less than High School | 40 (100.0%) | 0 (0.0%) |
| High School Diploma | 77 (81.9%) | 0 (0.0%) |
| College / Associate Degree | 43 (78.2%) | 0 (0.0%) |
| Bachelor's Degree or higher | 176 (77.2%) | 0 (0.0%) |
| Total | 336 (80.6%) | 0 (0.0%) |
Employment Occupations by Sex in Lavalette
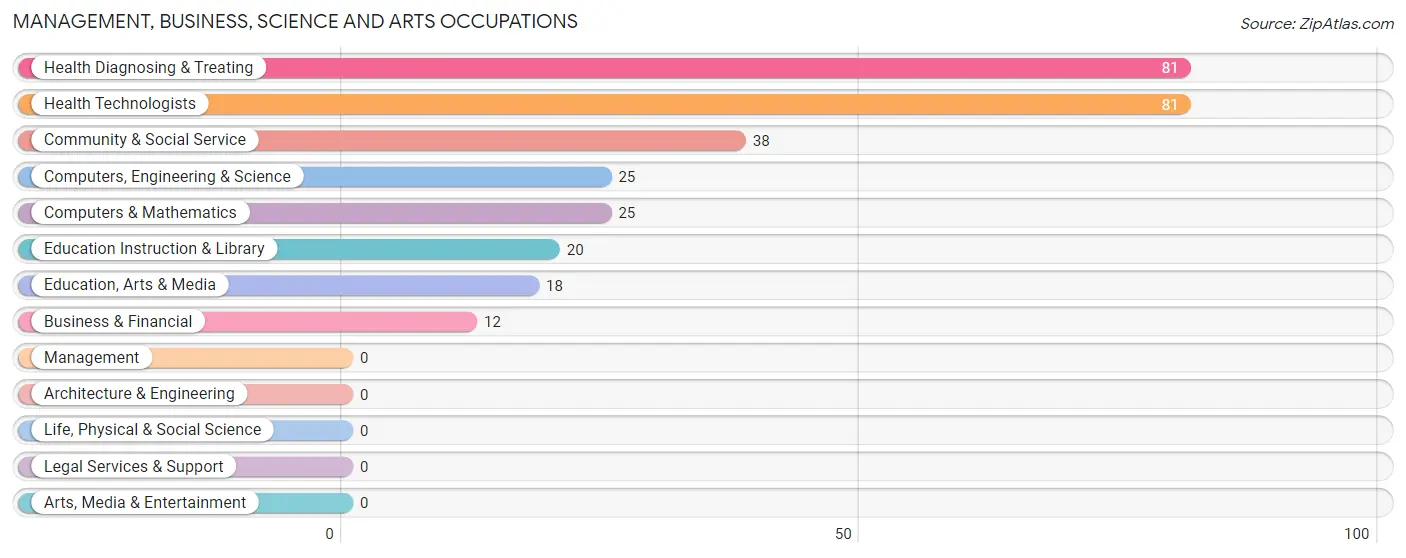
Management, Business, Science and Arts Occupations
The most common Management, Business, Science and Arts occupations in Lavalette are Health Diagnosing & Treating (81 | 21.6%), Health Technologists (81 | 21.6%), Community & Social Service (38 | 10.1%), Computers, Engineering & Science (25 | 6.7%), and Computers & Mathematics (25 | 6.7%).
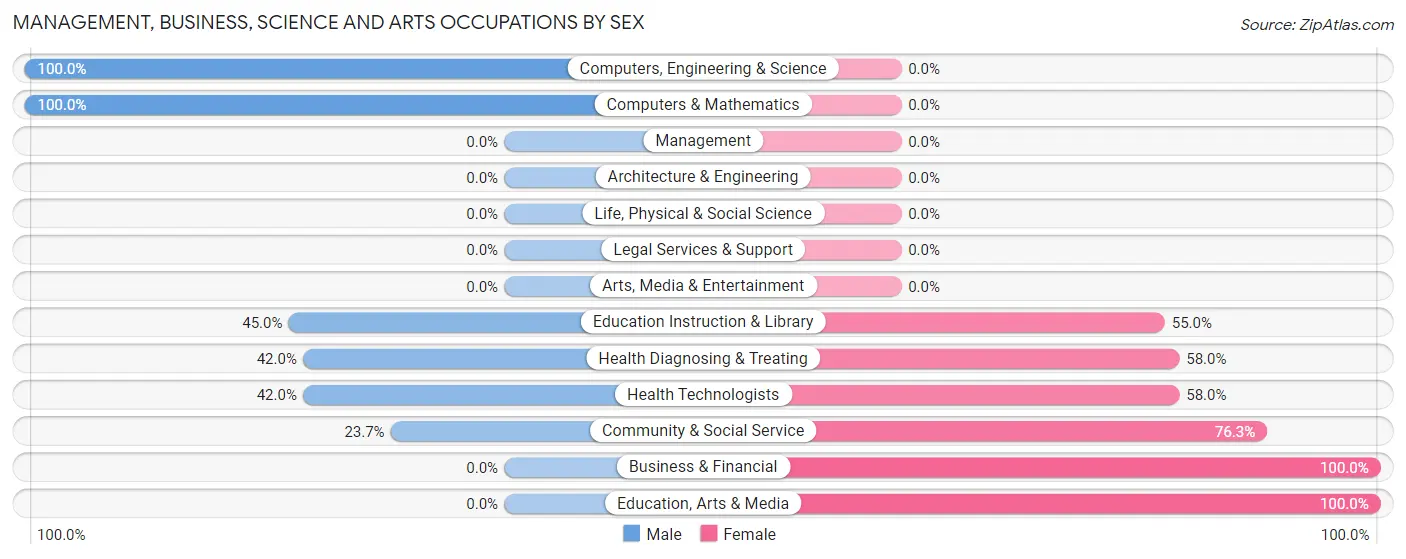
Management, Business, Science and Arts Occupations by Sex
Within the Management, Business, Science and Arts occupations in Lavalette, the most male-oriented occupations are Computers, Engineering & Science (100.0%), Computers & Mathematics (100.0%), and Education Instruction & Library (45.0%), while the most female-oriented occupations are Business & Financial (100.0%), Education, Arts & Media (100.0%), and Community & Social Service (76.3%).
| Occupation | Male | Female |
| Management | 0 (0.0%) | 0 (0.0%) |
| Business & Financial | 0 (0.0%) | 12 (100.0%) |
| Computers, Engineering & Science | 25 (100.0%) | 0 (0.0%) |
| Computers & Mathematics | 25 (100.0%) | 0 (0.0%) |
| Architecture & Engineering | 0 (0.0%) | 0 (0.0%) |
| Life, Physical & Social Science | 0 (0.0%) | 0 (0.0%) |
| Community & Social Service | 9 (23.7%) | 29 (76.3%) |
| Education, Arts & Media | 0 (0.0%) | 18 (100.0%) |
| Legal Services & Support | 0 (0.0%) | 0 (0.0%) |
| Education Instruction & Library | 9 (45.0%) | 11 (55.0%) |
| Arts, Media & Entertainment | 0 (0.0%) | 0 (0.0%) |
| Health Diagnosing & Treating | 34 (42.0%) | 47 (58.0%) |
| Health Technologists | 34 (42.0%) | 47 (58.0%) |
| Total (Category) | 68 (43.6%) | 88 (56.4%) |
| Total (Overall) | 189 (50.4%) | 186 (49.6%) |
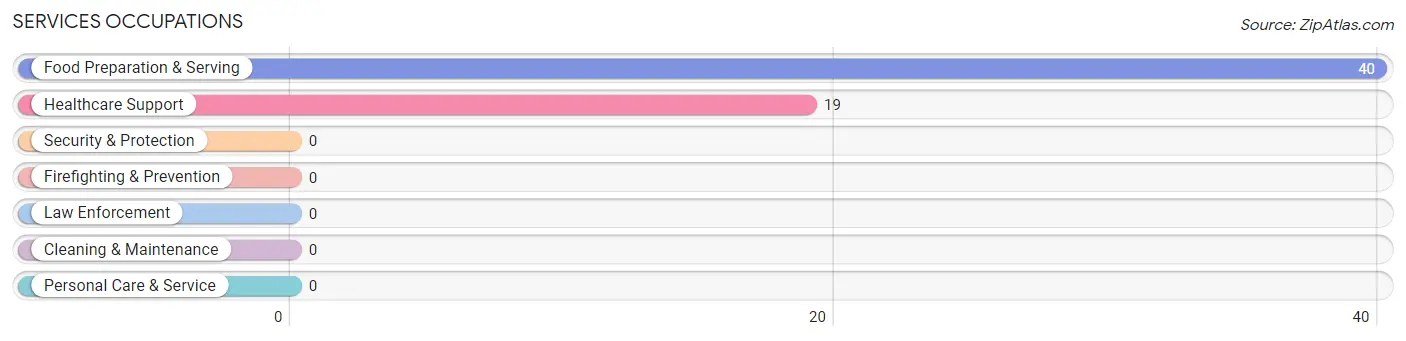
Services Occupations
The most common Services occupations in Lavalette are Food Preparation & Serving (40 | 10.7%), and Healthcare Support (19 | 5.1%).
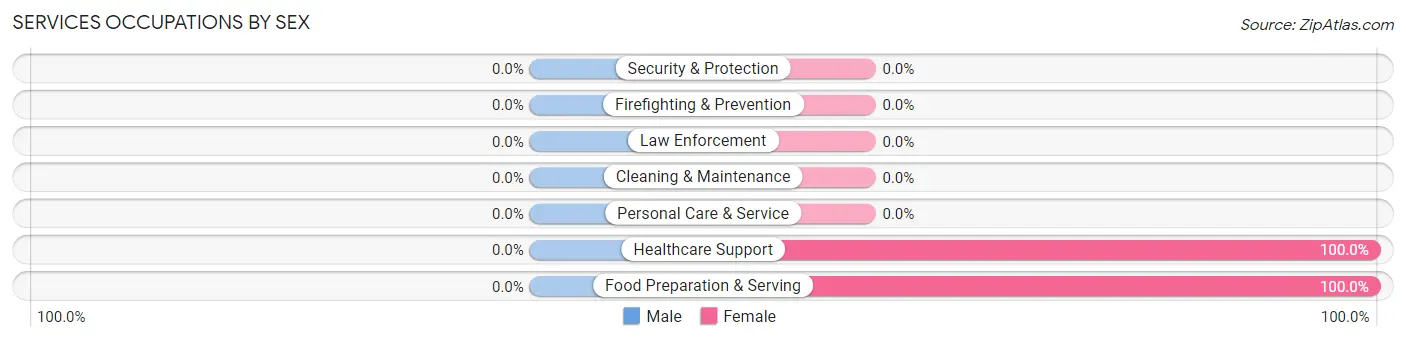
Services Occupations by Sex
| Occupation | Male | Female |
| Healthcare Support | 0 (0.0%) | 19 (100.0%) |
| Security & Protection | 0 (0.0%) | 0 (0.0%) |
| Firefighting & Prevention | 0 (0.0%) | 0 (0.0%) |
| Law Enforcement | 0 (0.0%) | 0 (0.0%) |
| Food Preparation & Serving | 0 (0.0%) | 40 (100.0%) |
| Cleaning & Maintenance | 0 (0.0%) | 0 (0.0%) |
| Personal Care & Service | 0 (0.0%) | 0 (0.0%) |
| Total (Category) | 0 (0.0%) | 59 (100.0%) |
| Total (Overall) | 189 (50.4%) | 186 (49.6%) |
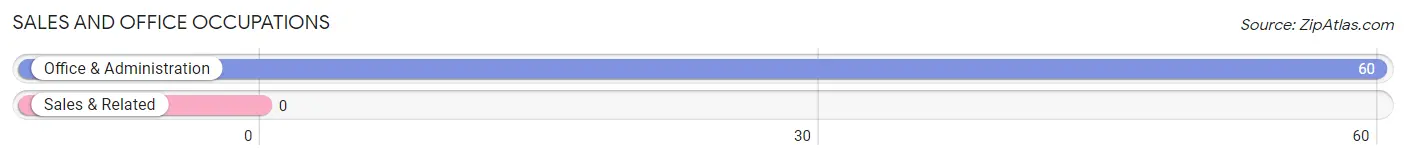
Sales and Office Occupations
The most common Sales and Office occupations in Lavalette are , and Office & Administration (60 | 16.0%).
Sales and Office Occupations by Sex
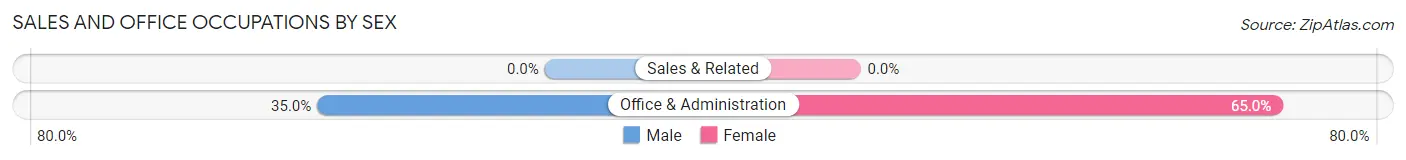
| Occupation | Male | Female |
| Sales & Related | 0 (0.0%) | 0 (0.0%) |
| Office & Administration | 21 (35.0%) | 39 (65.0%) |
| Total (Category) | 21 (35.0%) | 39 (65.0%) |
| Total (Overall) | 189 (50.4%) | 186 (49.6%) |
Natural Resources, Construction and Maintenance Occupations
The most common Natural Resources, Construction and Maintenance occupations in Lavalette are , and Installation, Maintenance & Repair (77 | 20.5%).
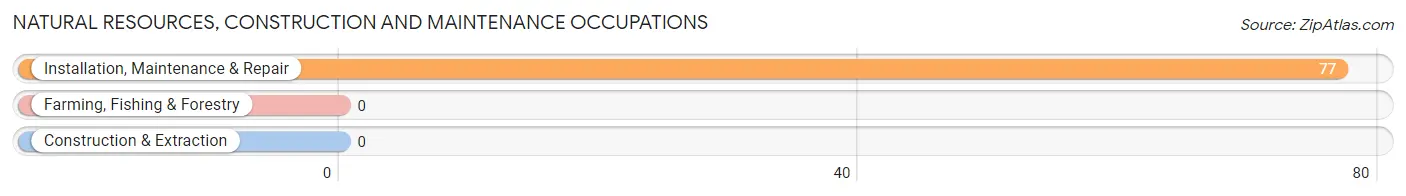
Natural Resources, Construction and Maintenance Occupations by Sex
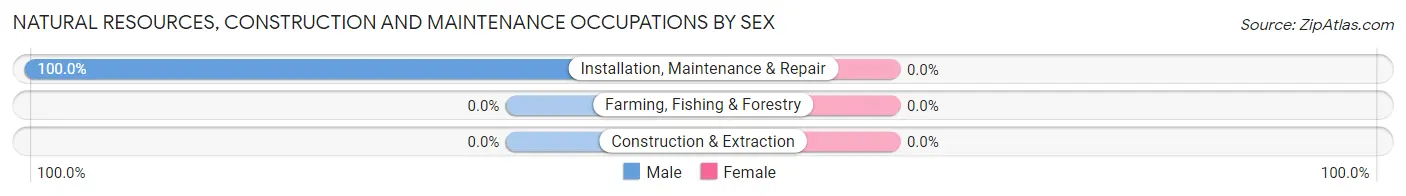
| Occupation | Male | Female |
| Farming, Fishing & Forestry | 0 (0.0%) | 0 (0.0%) |
| Construction & Extraction | 0 (0.0%) | 0 (0.0%) |
| Installation, Maintenance & Repair | 77 (100.0%) | 0 (0.0%) |
| Total (Category) | 77 (100.0%) | 0 (0.0%) |
| Total (Overall) | 189 (50.4%) | 186 (49.6%) |
Production, Transportation and Moving Occupations
The most common Production, Transportation and Moving occupations in Lavalette are , and Production (23 | 6.1%).
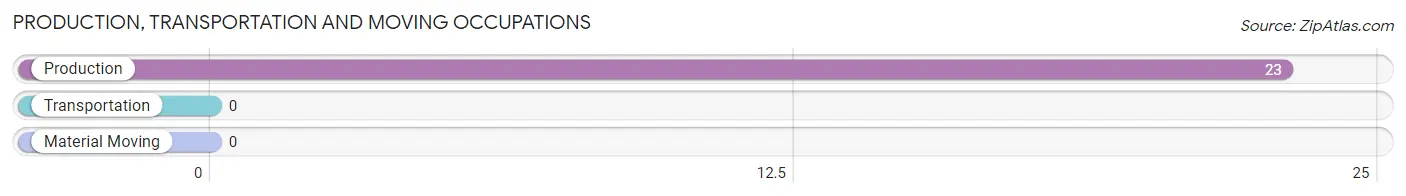
Production, Transportation and Moving Occupations by Sex
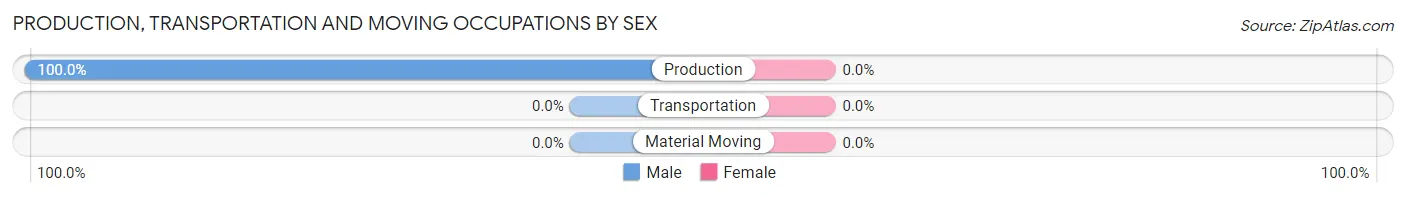
| Occupation | Male | Female |
| Production | 23 (100.0%) | 0 (0.0%) |
| Transportation | 0 (0.0%) | 0 (0.0%) |
| Material Moving | 0 (0.0%) | 0 (0.0%) |
| Total (Category) | 23 (100.0%) | 0 (0.0%) |
| Total (Overall) | 189 (50.4%) | 186 (49.6%) |
Employment Industries by Sex in Lavalette
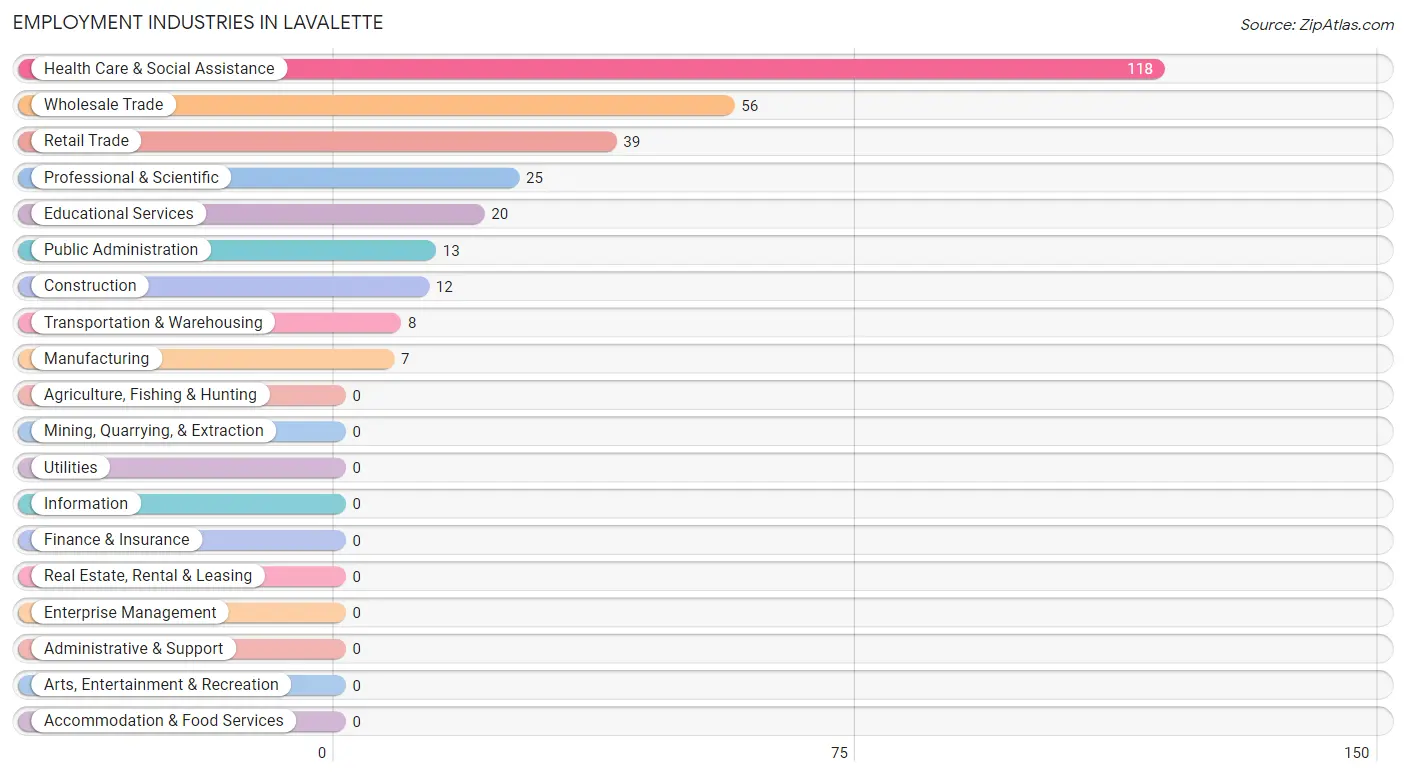
Employment Industries in Lavalette
The major employment industries in Lavalette include Health Care & Social Assistance (118 | 31.5%), Wholesale Trade (56 | 14.9%), Retail Trade (39 | 10.4%), Professional & Scientific (25 | 6.7%), and Educational Services (20 | 5.3%).
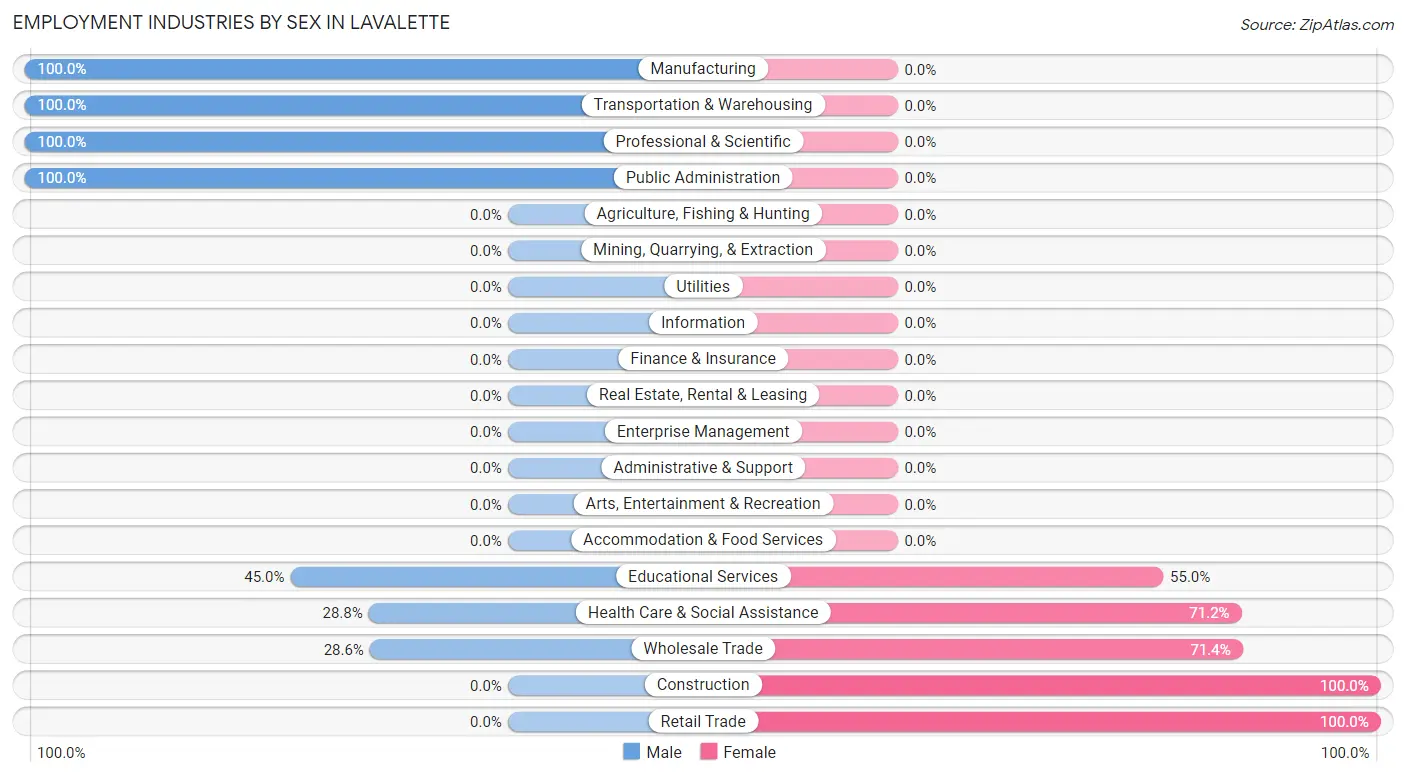
Employment Industries by Sex in Lavalette
The Lavalette industries that see more men than women are Manufacturing (100.0%), Transportation & Warehousing (100.0%), and Professional & Scientific (100.0%), whereas the industries that tend to have a higher number of women are Construction (100.0%), Retail Trade (100.0%), and Wholesale Trade (71.4%).
| Industry | Male | Female |
| Agriculture, Fishing & Hunting | 0 (0.0%) | 0 (0.0%) |
| Mining, Quarrying, & Extraction | 0 (0.0%) | 0 (0.0%) |
| Construction | 0 (0.0%) | 12 (100.0%) |
| Manufacturing | 7 (100.0%) | 0 (0.0%) |
| Wholesale Trade | 16 (28.6%) | 40 (71.4%) |
| Retail Trade | 0 (0.0%) | 39 (100.0%) |
| Transportation & Warehousing | 8 (100.0%) | 0 (0.0%) |
| Utilities | 0 (0.0%) | 0 (0.0%) |
| Information | 0 (0.0%) | 0 (0.0%) |
| Finance & Insurance | 0 (0.0%) | 0 (0.0%) |
| Real Estate, Rental & Leasing | 0 (0.0%) | 0 (0.0%) |
| Professional & Scientific | 25 (100.0%) | 0 (0.0%) |
| Enterprise Management | 0 (0.0%) | 0 (0.0%) |
| Administrative & Support | 0 (0.0%) | 0 (0.0%) |
| Educational Services | 9 (45.0%) | 11 (55.0%) |
| Health Care & Social Assistance | 34 (28.8%) | 84 (71.2%) |
| Arts, Entertainment & Recreation | 0 (0.0%) | 0 (0.0%) |
| Accommodation & Food Services | 0 (0.0%) | 0 (0.0%) |
| Public Administration | 13 (100.0%) | 0 (0.0%) |
| Total | 189 (50.4%) | 186 (49.6%) |
Education in Lavalette
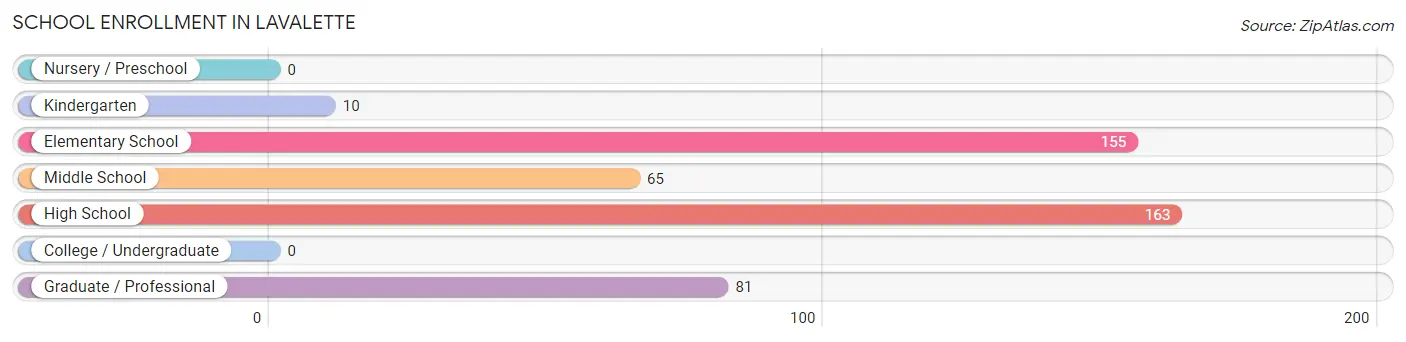
School Enrollment in Lavalette
The most common levels of schooling among the 474 students in Lavalette are high school (163 | 34.4%), elementary school (155 | 32.7%), and graduate / professional (81 | 17.1%).
| School Level | # Students | % Students |
| Nursery / Preschool | 0 | 0.0% |
| Kindergarten | 10 | 2.1% |
| Elementary School | 155 | 32.7% |
| Middle School | 65 | 13.7% |
| High School | 163 | 34.4% |
| College / Undergraduate | 0 | 0.0% |
| Graduate / Professional | 81 | 17.1% |
| Total | 474 | 100.0% |
School Enrollment by Age by Funding Source in Lavalette
Out of a total of 474 students who are enrolled in schools in Lavalette, 37 (7.8%) attend a private institution, while the remaining 437 (92.2%) are enrolled in public schools. The age group of 10 to 14 year olds has the highest likelihood of being enrolled in private schools, with 26 (15.5% in the age bracket) enrolled. Conversely, the age group of 15 to 17 year olds has the lowest likelihood of being enrolled in a private school, with 88 (100.0% in the age bracket) attending a public institution.
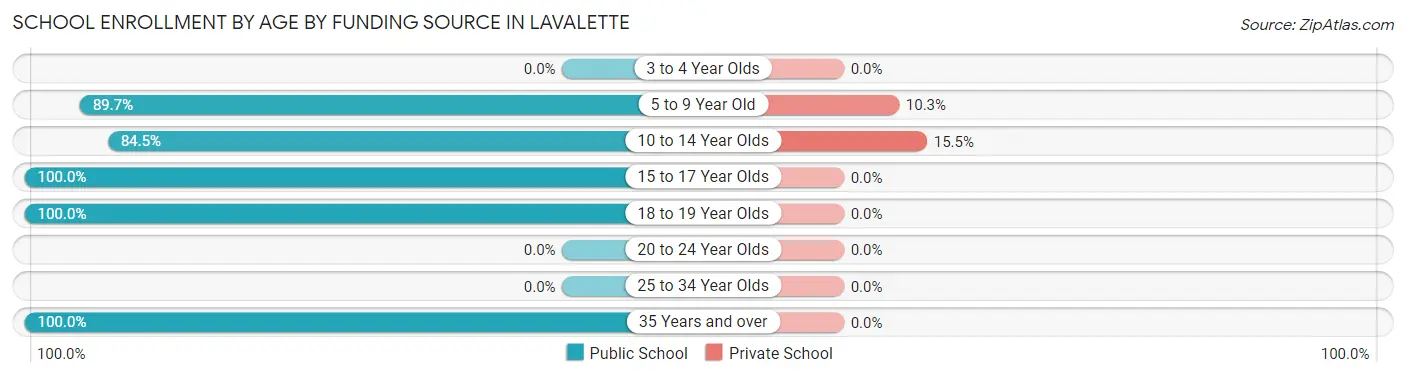
| Age Bracket | Public School | Private School |
| 3 to 4 Year Olds | 0 (0.0%) | 0 (0.0%) |
| 5 to 9 Year Old | 96 (89.7%) | 11 (10.3%) |
| 10 to 14 Year Olds | 142 (84.5%) | 26 (15.5%) |
| 15 to 17 Year Olds | 88 (100.0%) | 0 (0.0%) |
| 18 to 19 Year Olds | 30 (100.0%) | 0 (0.0%) |
| 20 to 24 Year Olds | 0 (0.0%) | 0 (0.0%) |
| 25 to 34 Year Olds | 0 (0.0%) | 0 (0.0%) |
| 35 Years and over | 81 (100.0%) | 0 (0.0%) |
| Total | 437 (92.2%) | 37 (7.8%) |
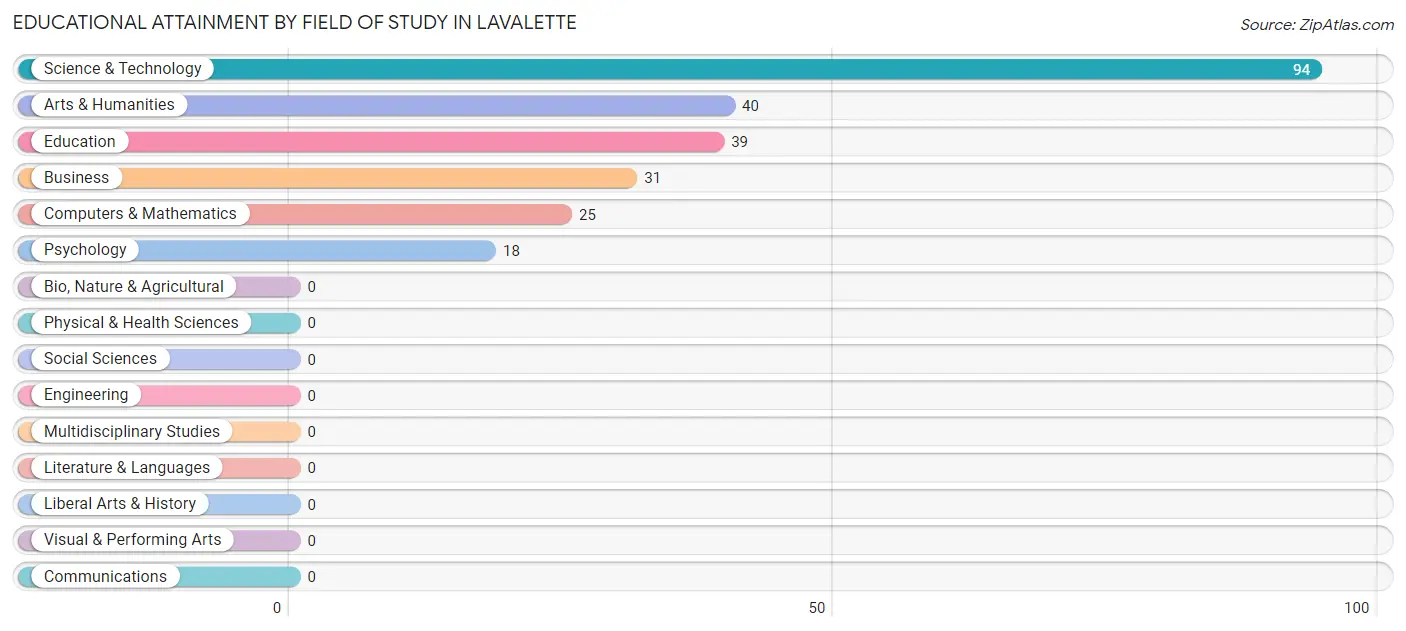
Educational Attainment by Field of Study in Lavalette
Science & technology (94 | 38.1%), arts & humanities (40 | 16.2%), education (39 | 15.8%), business (31 | 12.6%), and computers & mathematics (25 | 10.1%) are the most common fields of study among 247 individuals in Lavalette who have obtained a bachelor's degree or higher.
| Field of Study | # Graduates | % Graduates |
| Computers & Mathematics | 25 | 10.1% |
| Bio, Nature & Agricultural | 0 | 0.0% |
| Physical & Health Sciences | 0 | 0.0% |
| Psychology | 18 | 7.3% |
| Social Sciences | 0 | 0.0% |
| Engineering | 0 | 0.0% |
| Multidisciplinary Studies | 0 | 0.0% |
| Science & Technology | 94 | 38.1% |
| Business | 31 | 12.6% |
| Education | 39 | 15.8% |
| Literature & Languages | 0 | 0.0% |
| Liberal Arts & History | 0 | 0.0% |
| Visual & Performing Arts | 0 | 0.0% |
| Communications | 0 | 0.0% |
| Arts & Humanities | 40 | 16.2% |
| Total | 247 | 100.0% |
Transportation & Commute in Lavalette
Vehicle Availability by Sex in Lavalette
The most prevalent vehicle ownership categories in Lavalette are males with 1 vehicle (77, accounting for 46.9%) and females with 1 vehicle (40, making up 41.4%).
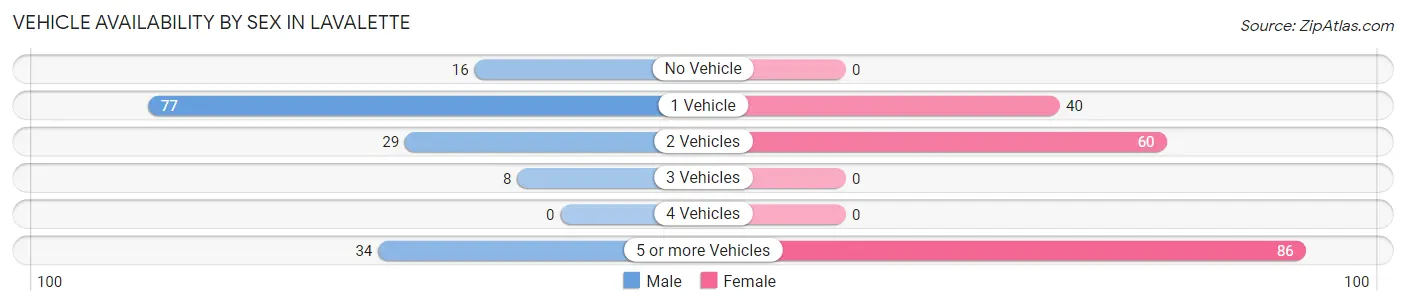
| Vehicles Available | Male | Female |
| No Vehicle | 16 (9.8%) | 0 (0.0%) |
| 1 Vehicle | 77 (46.9%) | 40 (21.5%) |
| 2 Vehicles | 29 (17.7%) | 60 (32.3%) |
| 3 Vehicles | 8 (4.9%) | 0 (0.0%) |
| 4 Vehicles | 0 (0.0%) | 0 (0.0%) |
| 5 or more Vehicles | 34 (20.7%) | 86 (46.2%) |
| Total | 164 (100.0%) | 186 (100.0%) |
Commute Time in Lavalette
The most frequently occuring commute durations in Lavalette are 30 to 34 minutes (140 commuters, 41.9%), 15 to 19 minutes (93 commuters, 27.8%), and 60 to 89 minutes (77 commuters, 23.1%).
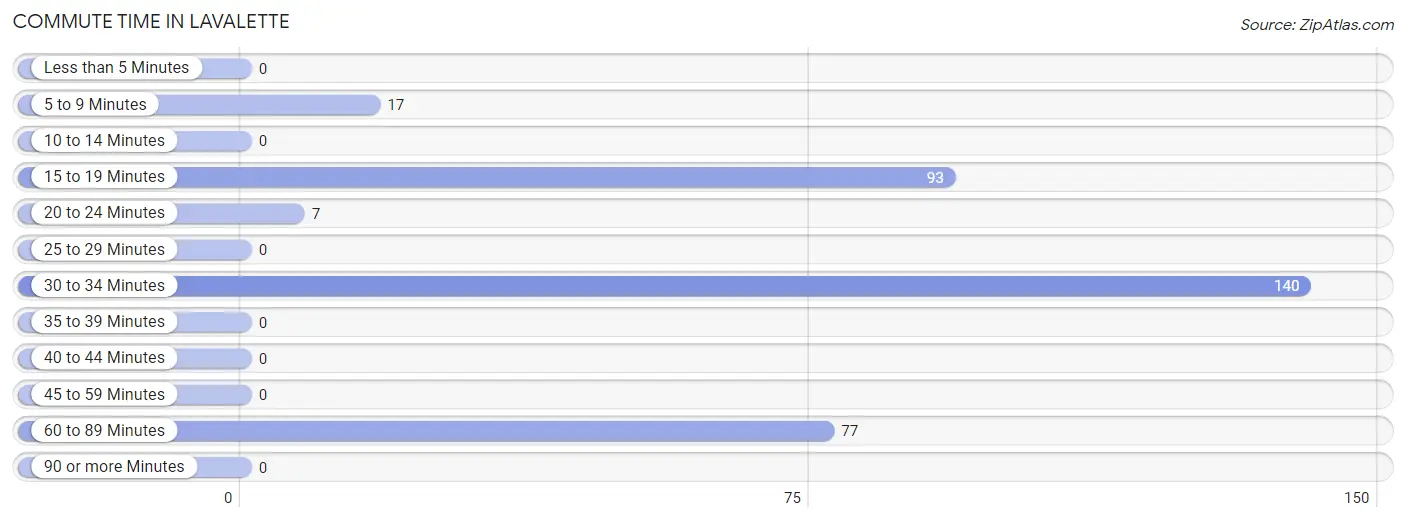
| Commute Time | # Commuters | % Commuters |
| Less than 5 Minutes | 0 | 0.0% |
| 5 to 9 Minutes | 17 | 5.1% |
| 10 to 14 Minutes | 0 | 0.0% |
| 15 to 19 Minutes | 93 | 27.8% |
| 20 to 24 Minutes | 7 | 2.1% |
| 25 to 29 Minutes | 0 | 0.0% |
| 30 to 34 Minutes | 140 | 41.9% |
| 35 to 39 Minutes | 0 | 0.0% |
| 40 to 44 Minutes | 0 | 0.0% |
| 45 to 59 Minutes | 0 | 0.0% |
| 60 to 89 Minutes | 77 | 23.1% |
| 90 or more Minutes | 0 | 0.0% |
Commute Time by Sex in Lavalette
The most common commute times in Lavalette are 60 to 89 minutes (77 commuters, 52.0%) for males and 30 to 34 minutes (106 commuters, 57.0%) for females.
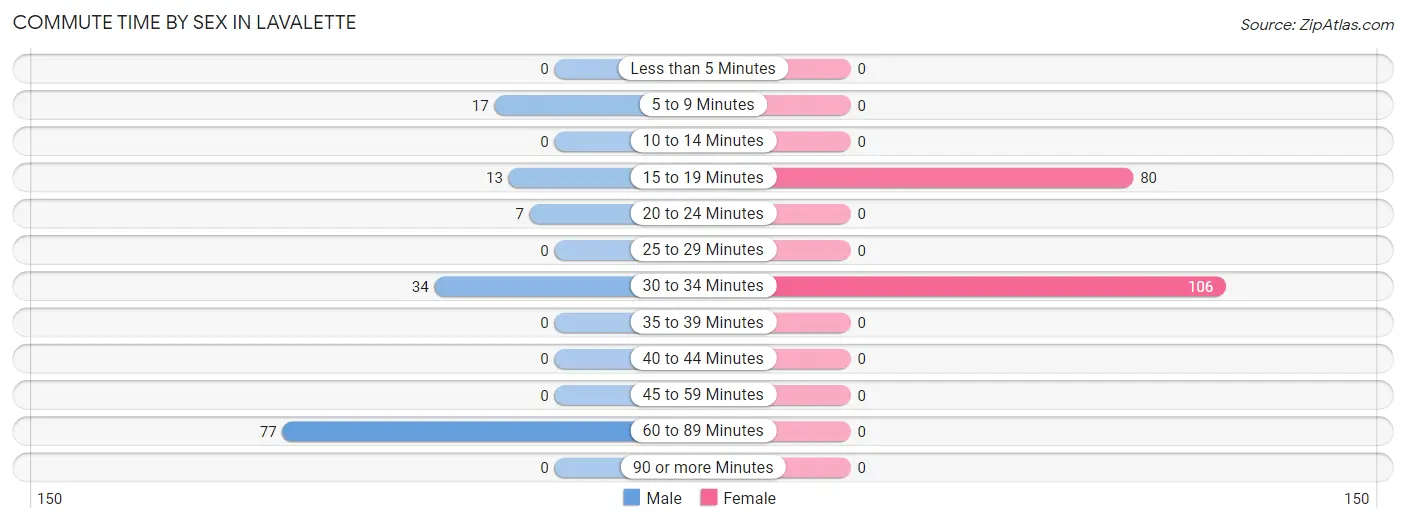
| Commute Time | Male | Female |
| Less than 5 Minutes | 0 (0.0%) | 0 (0.0%) |
| 5 to 9 Minutes | 17 (11.5%) | 0 (0.0%) |
| 10 to 14 Minutes | 0 (0.0%) | 0 (0.0%) |
| 15 to 19 Minutes | 13 (8.8%) | 80 (43.0%) |
| 20 to 24 Minutes | 7 (4.7%) | 0 (0.0%) |
| 25 to 29 Minutes | 0 (0.0%) | 0 (0.0%) |
| 30 to 34 Minutes | 34 (23.0%) | 106 (57.0%) |
| 35 to 39 Minutes | 0 (0.0%) | 0 (0.0%) |
| 40 to 44 Minutes | 0 (0.0%) | 0 (0.0%) |
| 45 to 59 Minutes | 0 (0.0%) | 0 (0.0%) |
| 60 to 89 Minutes | 77 (52.0%) | 0 (0.0%) |
| 90 or more Minutes | 0 (0.0%) | 0 (0.0%) |
Time of Departure to Work by Sex in Lavalette
The most frequent times of departure to work in Lavalette are 6:30 AM to 6:59 AM (84, 56.8%) for males and 7:30 AM to 7:59 AM (59, 31.7%) for females.
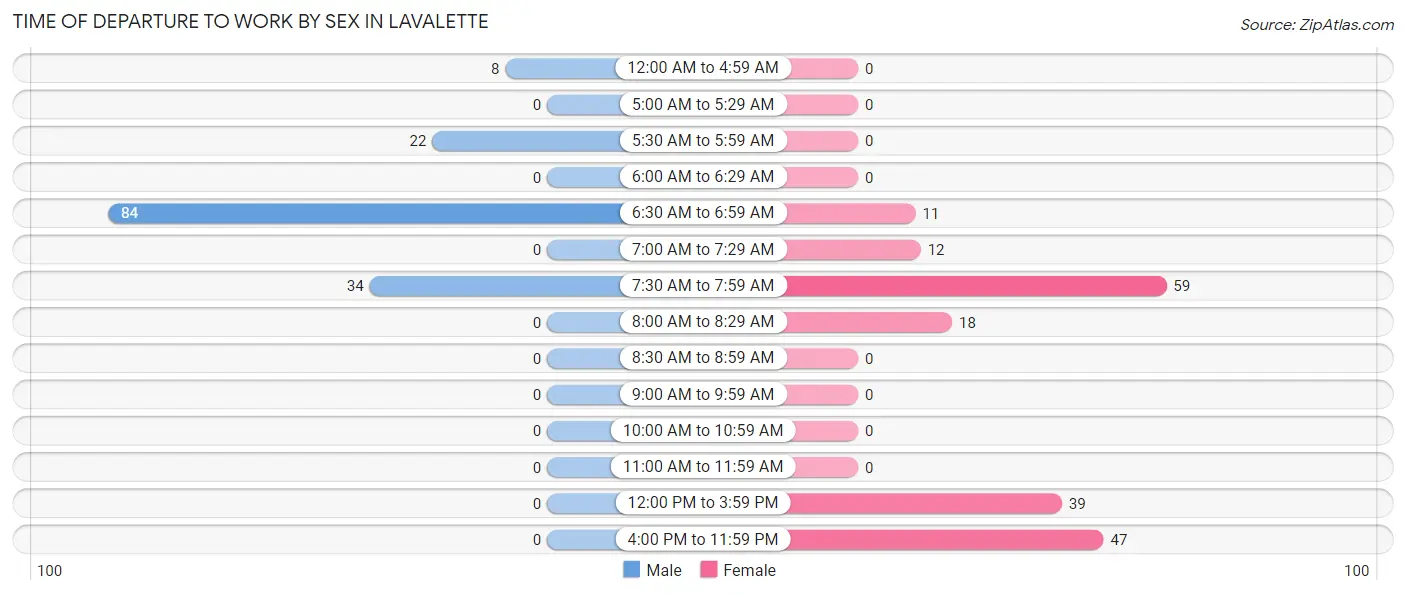
| Time of Departure | Male | Female |
| 12:00 AM to 4:59 AM | 8 (5.4%) | 0 (0.0%) |
| 5:00 AM to 5:29 AM | 0 (0.0%) | 0 (0.0%) |
| 5:30 AM to 5:59 AM | 22 (14.9%) | 0 (0.0%) |
| 6:00 AM to 6:29 AM | 0 (0.0%) | 0 (0.0%) |
| 6:30 AM to 6:59 AM | 84 (56.8%) | 11 (5.9%) |
| 7:00 AM to 7:29 AM | 0 (0.0%) | 12 (6.5%) |
| 7:30 AM to 7:59 AM | 34 (23.0%) | 59 (31.7%) |
| 8:00 AM to 8:29 AM | 0 (0.0%) | 18 (9.7%) |
| 8:30 AM to 8:59 AM | 0 (0.0%) | 0 (0.0%) |
| 9:00 AM to 9:59 AM | 0 (0.0%) | 0 (0.0%) |
| 10:00 AM to 10:59 AM | 0 (0.0%) | 0 (0.0%) |
| 11:00 AM to 11:59 AM | 0 (0.0%) | 0 (0.0%) |
| 12:00 PM to 3:59 PM | 0 (0.0%) | 39 (21.0%) |
| 4:00 PM to 11:59 PM | 0 (0.0%) | 47 (25.3%) |
| Total | 148 (100.0%) | 186 (100.0%) |
Housing Occupancy in Lavalette
Occupancy by Ownership in Lavalette
Of the total 219 dwellings in Lavalette, owner-occupied units account for 203 (92.7%), while renter-occupied units make up 16 (7.3%).
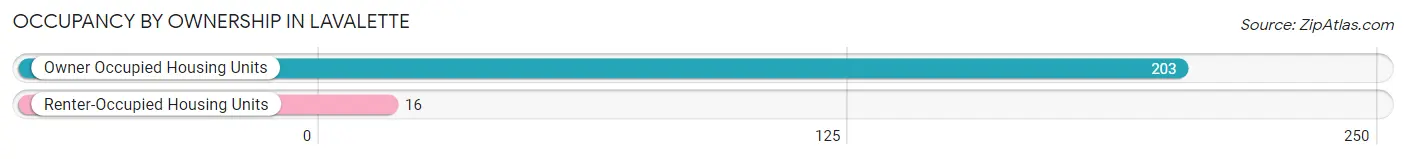
| Occupancy | # Housing Units | % Housing Units |
| Owner Occupied Housing Units | 203 | 92.7% |
| Renter-Occupied Housing Units | 16 | 7.3% |
| Total Occupied Housing Units | 219 | 100.0% |
Occupancy by Household Size in Lavalette
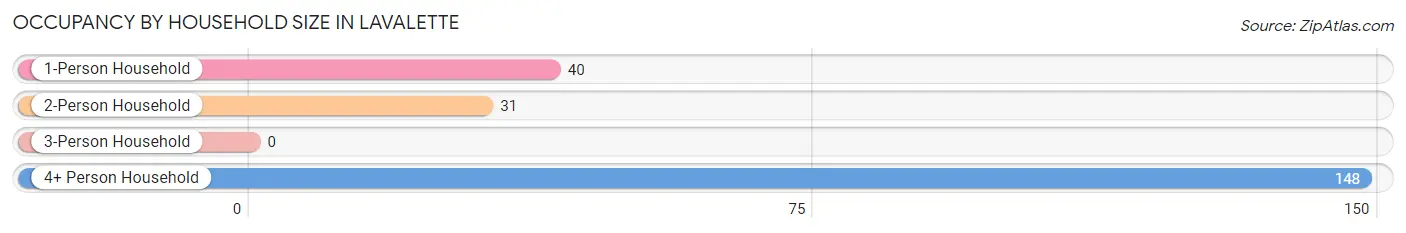
| Household Size | # Housing Units | % Housing Units |
| 1-Person Household | 40 | 18.3% |
| 2-Person Household | 31 | 14.2% |
| 3-Person Household | 0 | 0.0% |
| 4+ Person Household | 148 | 67.6% |
| Total Housing Units | 219 | 100.0% |
Occupancy by Ownership by Household Size in Lavalette
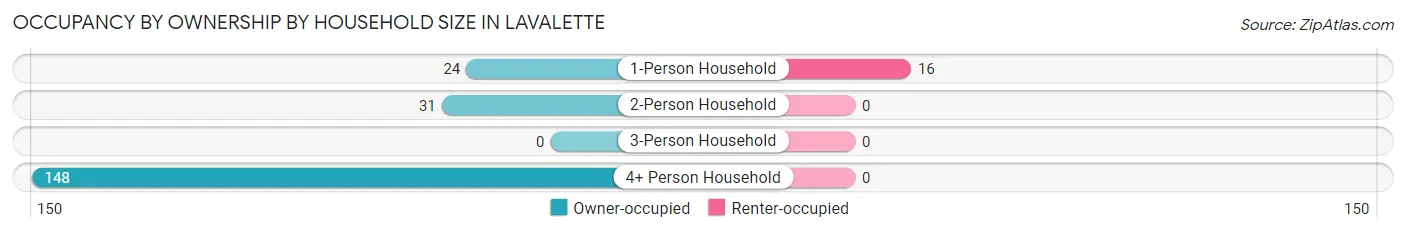
| Household Size | Owner-occupied | Renter-occupied |
| 1-Person Household | 24 (60.0%) | 16 (40.0%) |
| 2-Person Household | 31 (100.0%) | 0 (0.0%) |
| 3-Person Household | 0 (0.0%) | 0 (0.0%) |
| 4+ Person Household | 148 (100.0%) | 0 (0.0%) |
| Total Housing Units | 203 (92.7%) | 16 (7.3%) |
Occupancy by Educational Attainment in Lavalette
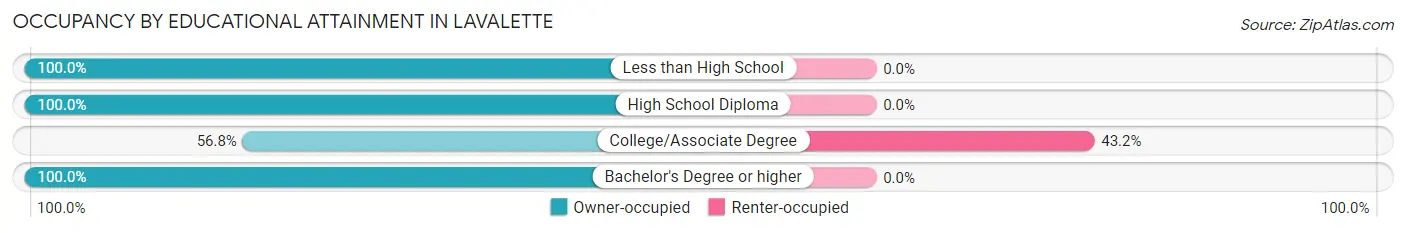
| Household Size | Owner-occupied | Renter-occupied |
| Less than High School | 40 (100.0%) | 0 (0.0%) |
| High School Diploma | 15 (100.0%) | 0 (0.0%) |
| College/Associate Degree | 21 (56.8%) | 16 (43.2%) |
| Bachelor's Degree or higher | 127 (100.0%) | 0 (0.0%) |
Occupancy by Age of Householder in Lavalette
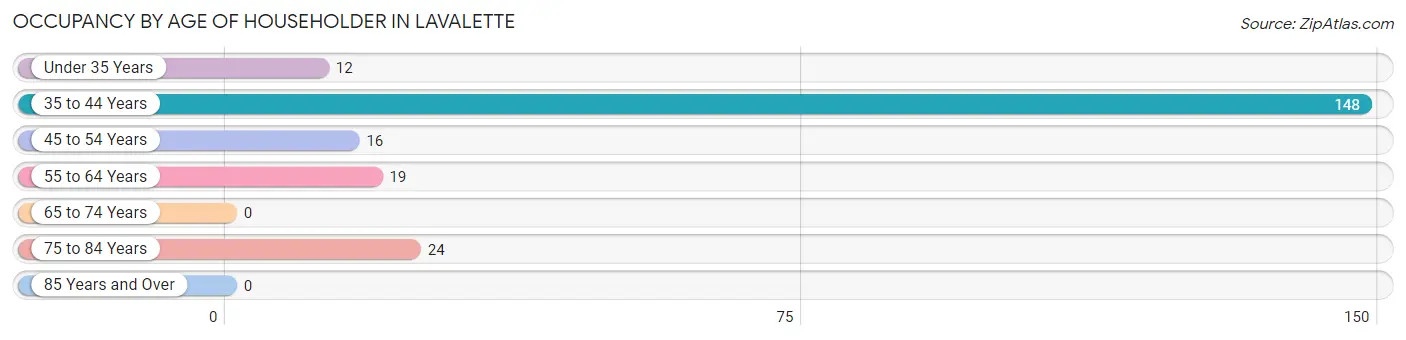
| Age Bracket | # Households | % Households |
| Under 35 Years | 12 | 5.5% |
| 35 to 44 Years | 148 | 67.6% |
| 45 to 54 Years | 16 | 7.3% |
| 55 to 64 Years | 19 | 8.7% |
| 65 to 74 Years | 0 | 0.0% |
| 75 to 84 Years | 24 | 11.0% |
| 85 Years and Over | 0 | 0.0% |
| Total | 219 | 100.0% |
Housing Finances in Lavalette
Median Income by Occupancy in Lavalette
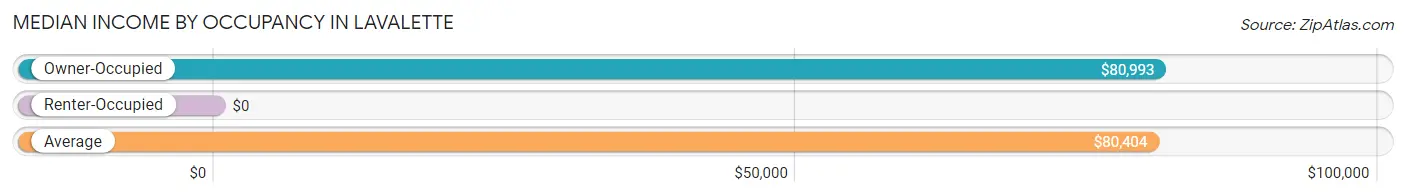
| Occupancy Type | # Households | Median Income |
| Owner-Occupied | 203 (92.7%) | $80,993 |
| Renter-Occupied | 16 (7.3%) | $0 |
| Average | 219 (100.0%) | $80,404 |
Occupancy by Householder Income Bracket in Lavalette
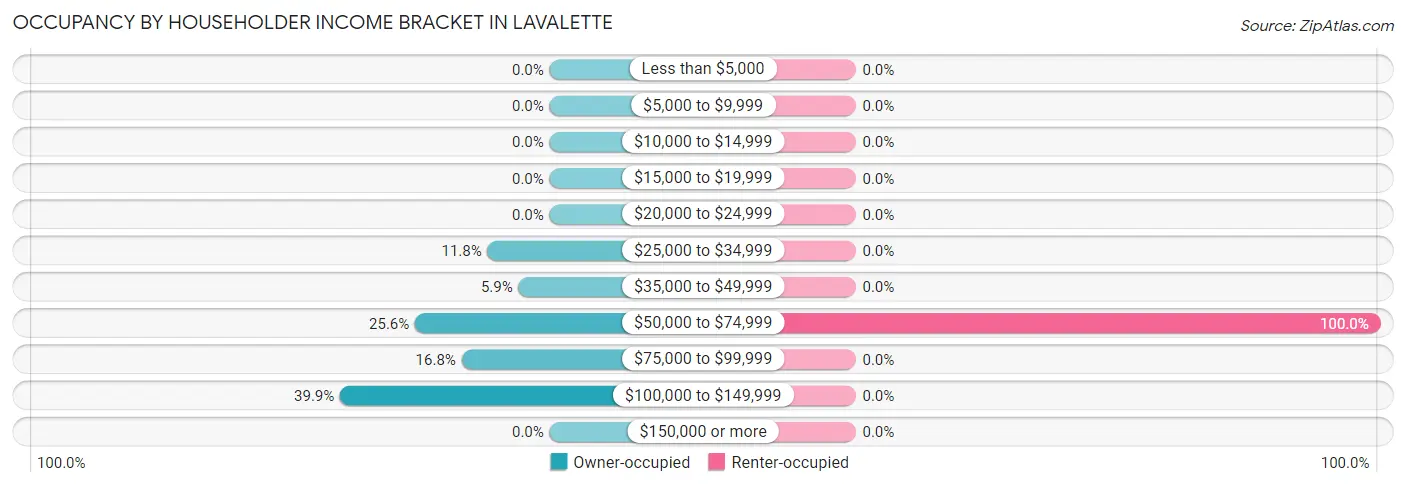
| Income Bracket | Owner-occupied | Renter-occupied |
| Less than $5,000 | 0 (0.0%) | 0 (0.0%) |
| $5,000 to $9,999 | 0 (0.0%) | 0 (0.0%) |
| $10,000 to $14,999 | 0 (0.0%) | 0 (0.0%) |
| $15,000 to $19,999 | 0 (0.0%) | 0 (0.0%) |
| $20,000 to $24,999 | 0 (0.0%) | 0 (0.0%) |
| $25,000 to $34,999 | 24 (11.8%) | 0 (0.0%) |
| $35,000 to $49,999 | 12 (5.9%) | 0 (0.0%) |
| $50,000 to $74,999 | 52 (25.6%) | 16 (100.0%) |
| $75,000 to $99,999 | 34 (16.8%) | 0 (0.0%) |
| $100,000 to $149,999 | 81 (39.9%) | 0 (0.0%) |
| $150,000 or more | 0 (0.0%) | 0 (0.0%) |
| Total | 203 (100.0%) | 16 (100.0%) |
Monthly Housing Cost Tiers in Lavalette
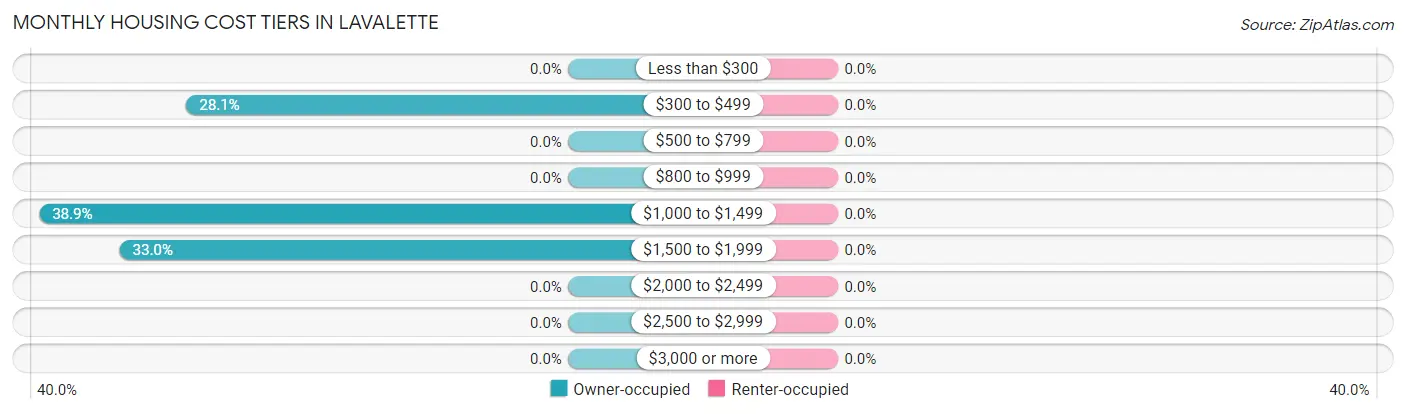
| Monthly Cost | Owner-occupied | Renter-occupied |
| Less than $300 | 0 (0.0%) | 0 (0.0%) |
| $300 to $499 | 57 (28.1%) | 0 (0.0%) |
| $500 to $799 | 0 (0.0%) | 0 (0.0%) |
| $800 to $999 | 0 (0.0%) | 0 (0.0%) |
| $1,000 to $1,499 | 79 (38.9%) | 0 (0.0%) |
| $1,500 to $1,999 | 67 (33.0%) | 0 (0.0%) |
| $2,000 to $2,499 | 0 (0.0%) | 0 (0.0%) |
| $2,500 to $2,999 | 0 (0.0%) | 0 (0.0%) |
| $3,000 or more | 0 (0.0%) | 0 (0.0%) |
| Total | 203 (100.0%) | 16 (100.0%) |
Physical Housing Characteristics in Lavalette
Housing Structures in Lavalette
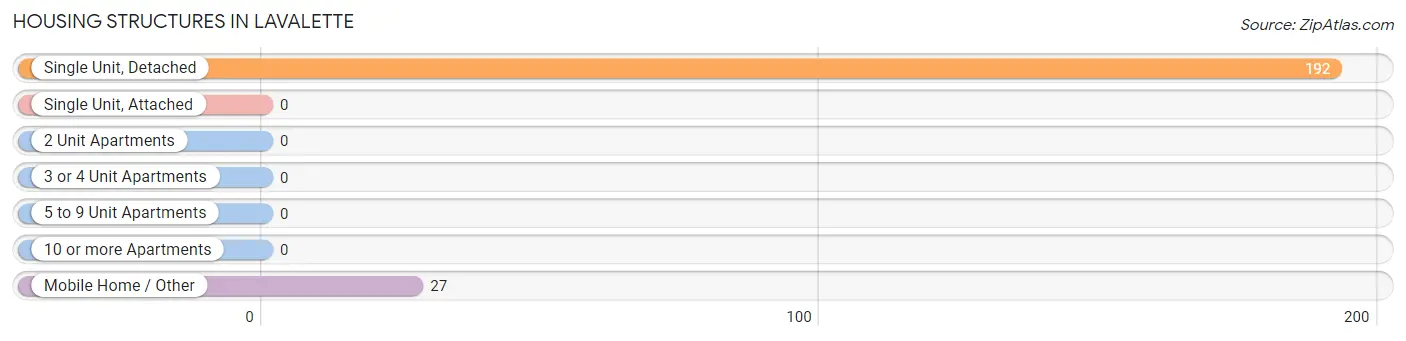
| Structure Type | # Housing Units | % Housing Units |
| Single Unit, Detached | 192 | 87.7% |
| Single Unit, Attached | 0 | 0.0% |
| 2 Unit Apartments | 0 | 0.0% |
| 3 or 4 Unit Apartments | 0 | 0.0% |
| 5 to 9 Unit Apartments | 0 | 0.0% |
| 10 or more Apartments | 0 | 0.0% |
| Mobile Home / Other | 27 | 12.3% |
| Total | 219 | 100.0% |
Housing Structures by Occupancy in Lavalette
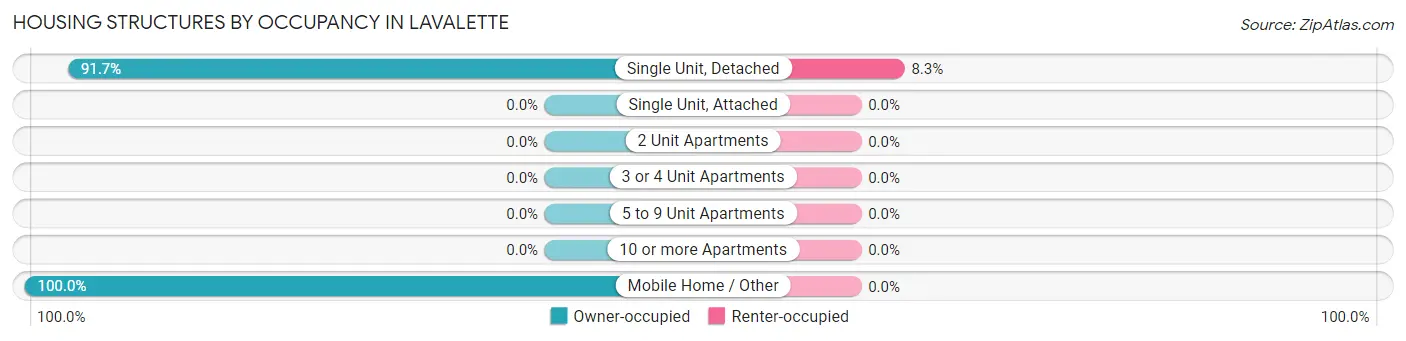
| Structure Type | Owner-occupied | Renter-occupied |
| Single Unit, Detached | 176 (91.7%) | 16 (8.3%) |
| Single Unit, Attached | 0 (0.0%) | 0 (0.0%) |
| 2 Unit Apartments | 0 (0.0%) | 0 (0.0%) |
| 3 or 4 Unit Apartments | 0 (0.0%) | 0 (0.0%) |
| 5 to 9 Unit Apartments | 0 (0.0%) | 0 (0.0%) |
| 10 or more Apartments | 0 (0.0%) | 0 (0.0%) |
| Mobile Home / Other | 27 (100.0%) | 0 (0.0%) |
| Total | 203 (92.7%) | 16 (7.3%) |
Housing Structures by Number of Rooms in Lavalette
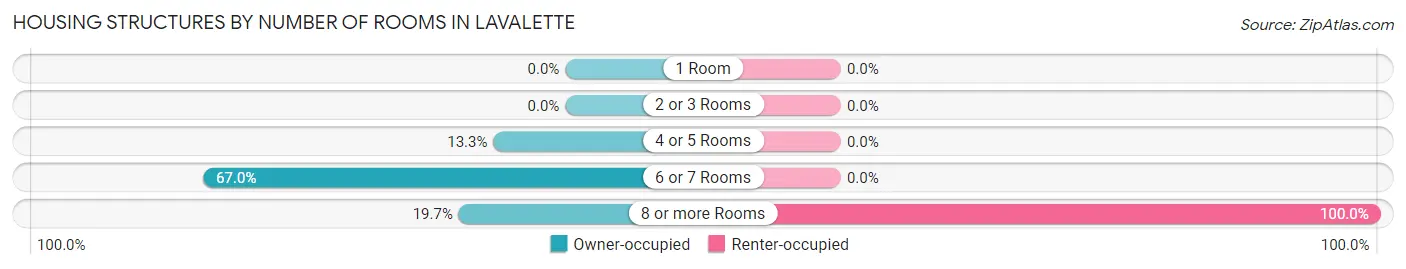
| Number of Rooms | Owner-occupied | Renter-occupied |
| 1 Room | 0 (0.0%) | 0 (0.0%) |
| 2 or 3 Rooms | 0 (0.0%) | 0 (0.0%) |
| 4 or 5 Rooms | 27 (13.3%) | 0 (0.0%) |
| 6 or 7 Rooms | 136 (67.0%) | 0 (0.0%) |
| 8 or more Rooms | 40 (19.7%) | 16 (100.0%) |
| Total | 203 (100.0%) | 16 (100.0%) |
Housing Structure by Heating Type in Lavalette
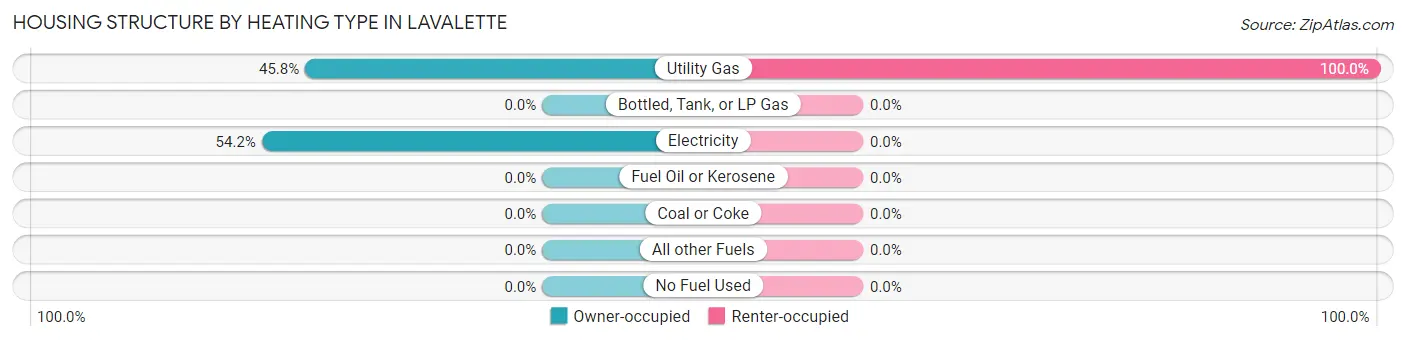
| Heating Type | Owner-occupied | Renter-occupied |
| Utility Gas | 93 (45.8%) | 16 (100.0%) |
| Bottled, Tank, or LP Gas | 0 (0.0%) | 0 (0.0%) |
| Electricity | 110 (54.2%) | 0 (0.0%) |
| Fuel Oil or Kerosene | 0 (0.0%) | 0 (0.0%) |
| Coal or Coke | 0 (0.0%) | 0 (0.0%) |
| All other Fuels | 0 (0.0%) | 0 (0.0%) |
| No Fuel Used | 0 (0.0%) | 0 (0.0%) |
| Total | 203 (100.0%) | 16 (100.0%) |
Household Vehicle Usage in Lavalette
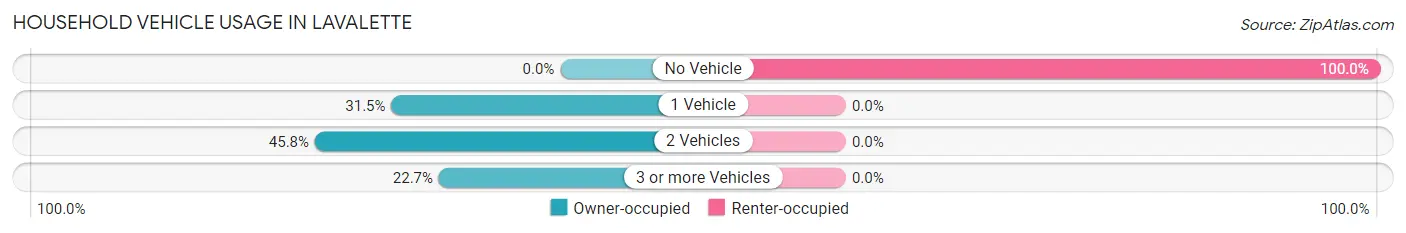
| Vehicles per Household | Owner-occupied | Renter-occupied |
| No Vehicle | 0 (0.0%) | 16 (100.0%) |
| 1 Vehicle | 64 (31.5%) | 0 (0.0%) |
| 2 Vehicles | 93 (45.8%) | 0 (0.0%) |
| 3 or more Vehicles | 46 (22.7%) | 0 (0.0%) |
| Total | 203 (100.0%) | 16 (100.0%) |
Real Estate & Mortgages in Lavalette
Real Estate and Mortgage Overview in Lavalette
| Characteristic | Without Mortgage | With Mortgage |
| Housing Units | 57 | 146 |
| Median Property Value | - | - |
| Median Household Income | $40,938 | $0 |
| Monthly Housing Costs | $437 | $0 |
| Real Estate Taxes | - | - |
Property Value by Mortgage Status in Lavalette
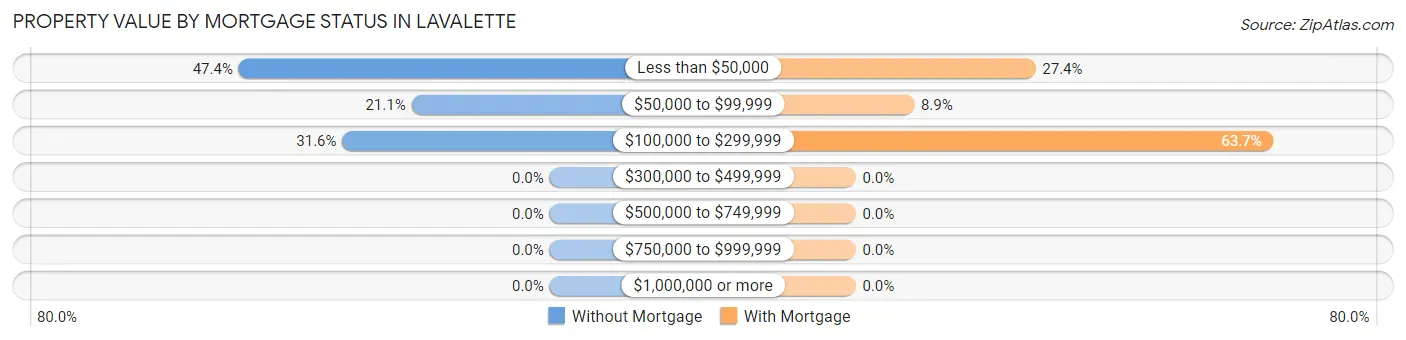
| Property Value | Without Mortgage | With Mortgage |
| Less than $50,000 | 27 (47.4%) | 40 (27.4%) |
| $50,000 to $99,999 | 12 (21.0%) | 13 (8.9%) |
| $100,000 to $299,999 | 18 (31.6%) | 93 (63.7%) |
| $300,000 to $499,999 | 0 (0.0%) | 0 (0.0%) |
| $500,000 to $749,999 | 0 (0.0%) | 0 (0.0%) |
| $750,000 to $999,999 | 0 (0.0%) | 0 (0.0%) |
| $1,000,000 or more | 0 (0.0%) | 0 (0.0%) |
| Total | 57 (100.0%) | 146 (100.0%) |
Household Income by Mortgage Status in Lavalette
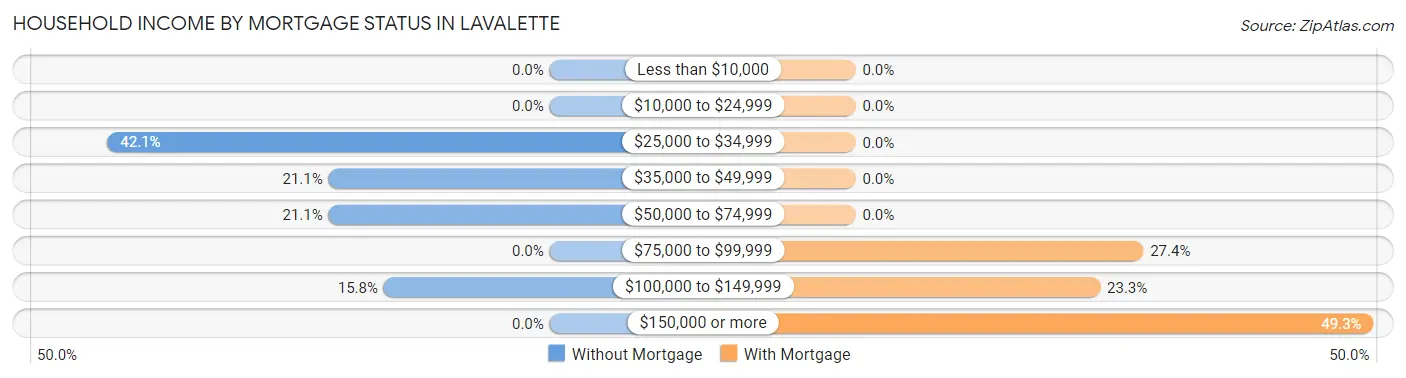
| Household Income | Without Mortgage | With Mortgage |
| Less than $10,000 | 0 (0.0%) | 0 (0.0%) |
| $10,000 to $24,999 | 0 (0.0%) | 0 (0.0%) |
| $25,000 to $34,999 | 24 (42.1%) | 0 (0.0%) |
| $35,000 to $49,999 | 12 (21.0%) | 0 (0.0%) |
| $50,000 to $74,999 | 12 (21.0%) | 0 (0.0%) |
| $75,000 to $99,999 | 0 (0.0%) | 40 (27.4%) |
| $100,000 to $149,999 | 9 (15.8%) | 34 (23.3%) |
| $150,000 or more | 0 (0.0%) | 72 (49.3%) |
| Total | 57 (100.0%) | 146 (100.0%) |
Property Value to Household Income Ratio in Lavalette
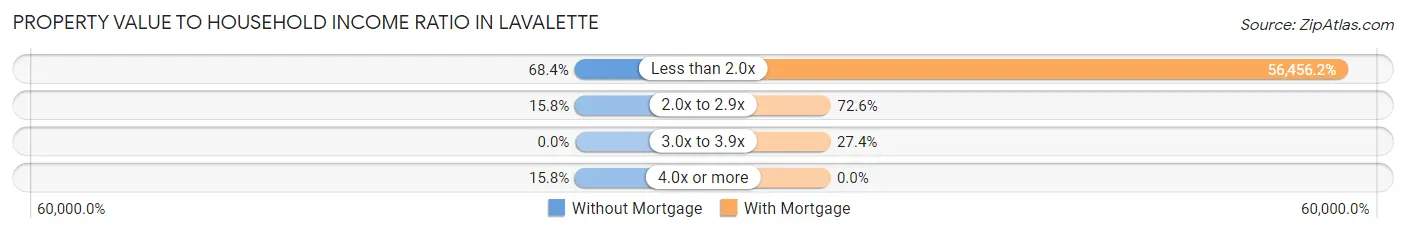
| Value-to-Income Ratio | Without Mortgage | With Mortgage |
| Less than 2.0x | 39 (68.4%) | 82,426 (56,456.2%) |
| 2.0x to 2.9x | 9 (15.8%) | 106 (72.6%) |
| 3.0x to 3.9x | 0 (0.0%) | 40 (27.4%) |
| 4.0x or more | 9 (15.8%) | 0 (0.0%) |
| Total | 57 (100.0%) | 146 (100.0%) |
Real Estate Taxes by Mortgage Status in Lavalette
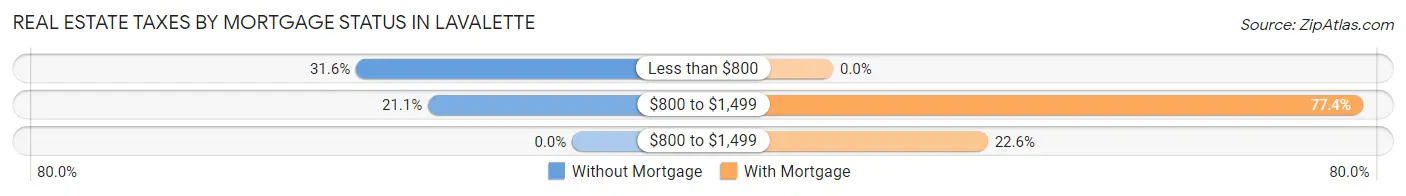
| Property Taxes | Without Mortgage | With Mortgage |
| Less than $800 | 18 (31.6%) | 0 (0.0%) |
| $800 to $1,499 | 12 (21.0%) | 113 (77.4%) |
| $800 to $1,499 | 0 (0.0%) | 33 (22.6%) |
| Total | 57 (100.0%) | 146 (100.0%) |
Health & Disability in Lavalette
Health Insurance Coverage by Age in Lavalette
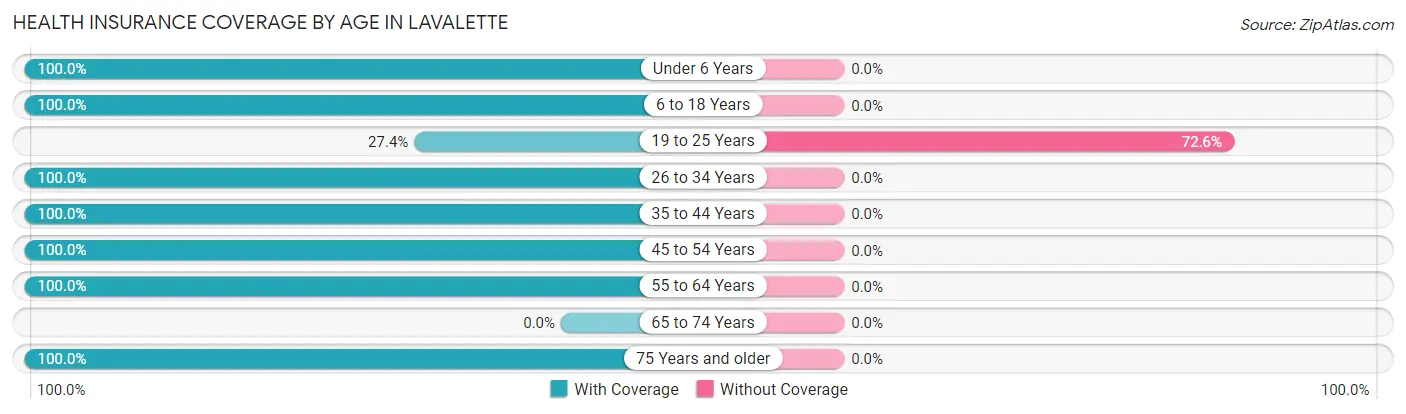
| Age Bracket | With Coverage | Without Coverage |
| Under 6 Years | 69 (100.0%) | 0 (0.0%) |
| 6 to 18 Years | 393 (100.0%) | 0 (0.0%) |
| 19 to 25 Years | 29 (27.4%) | 77 (72.6%) |
| 26 to 34 Years | 12 (100.0%) | 0 (0.0%) |
| 35 to 44 Years | 274 (100.0%) | 0 (0.0%) |
| 45 to 54 Years | 16 (100.0%) | 0 (0.0%) |
| 55 to 64 Years | 38 (100.0%) | 0 (0.0%) |
| 65 to 74 Years | 0 (0.0%) | 0 (0.0%) |
| 75 Years and older | 83 (100.0%) | 0 (0.0%) |
| Total | 914 (92.2%) | 77 (7.8%) |
Health Insurance Coverage by Citizenship Status in Lavalette
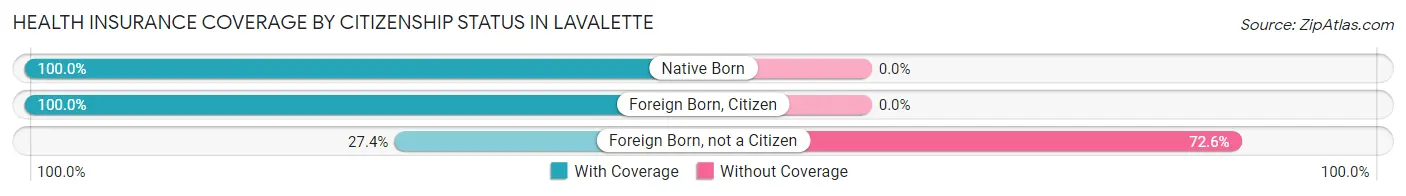
| Citizenship Status | With Coverage | Without Coverage |
| Native Born | 69 (100.0%) | 0 (0.0%) |
| Foreign Born, Citizen | 393 (100.0%) | 0 (0.0%) |
| Foreign Born, not a Citizen | 29 (27.4%) | 77 (72.6%) |
Health Insurance Coverage by Household Income in Lavalette
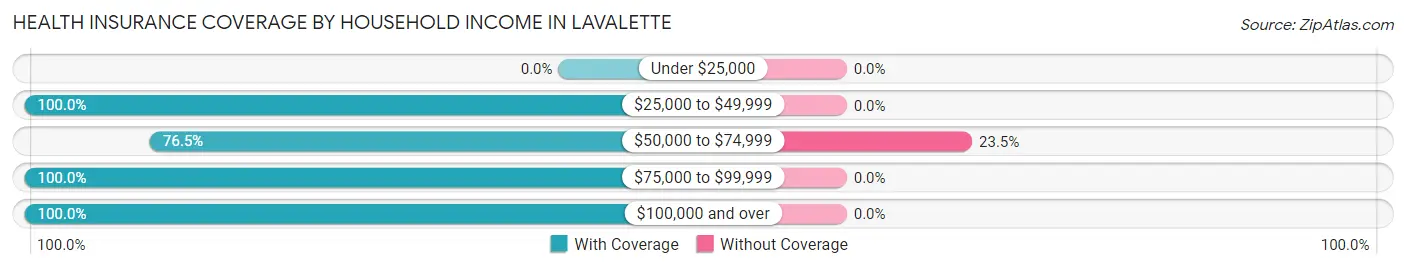
| Household Income | With Coverage | Without Coverage |
| Under $25,000 | 0 (0.0%) | 0 (0.0%) |
| $25,000 to $49,999 | 44 (100.0%) | 0 (0.0%) |
| $50,000 to $74,999 | 251 (76.5%) | 77 (23.5%) |
| $75,000 to $99,999 | 264 (100.0%) | 0 (0.0%) |
| $100,000 and over | 355 (100.0%) | 0 (0.0%) |
Public vs Private Health Insurance Coverage by Age in Lavalette
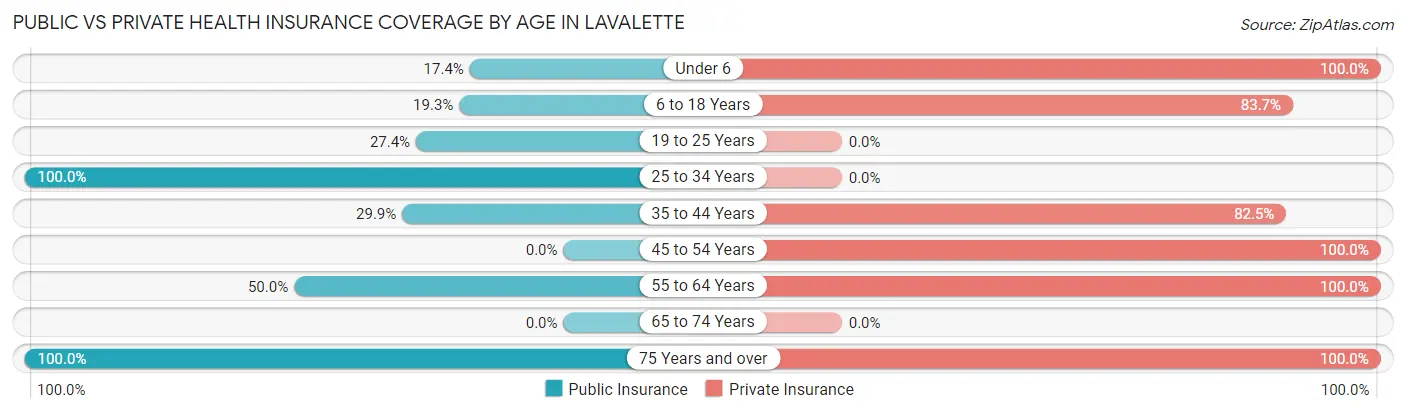
| Age Bracket | Public Insurance | Private Insurance |
| Under 6 | 12 (17.4%) | 69 (100.0%) |
| 6 to 18 Years | 76 (19.3%) | 329 (83.7%) |
| 19 to 25 Years | 29 (27.4%) | 0 (0.0%) |
| 25 to 34 Years | 12 (100.0%) | 0 (0.0%) |
| 35 to 44 Years | 82 (29.9%) | 226 (82.5%) |
| 45 to 54 Years | 0 (0.0%) | 16 (100.0%) |
| 55 to 64 Years | 19 (50.0%) | 38 (100.0%) |
| 65 to 74 Years | 0 (0.0%) | 0 (0.0%) |
| 75 Years and over | 83 (100.0%) | 83 (100.0%) |
| Total | 313 (31.6%) | 761 (76.8%) |
Disability Status by Sex by Age in Lavalette
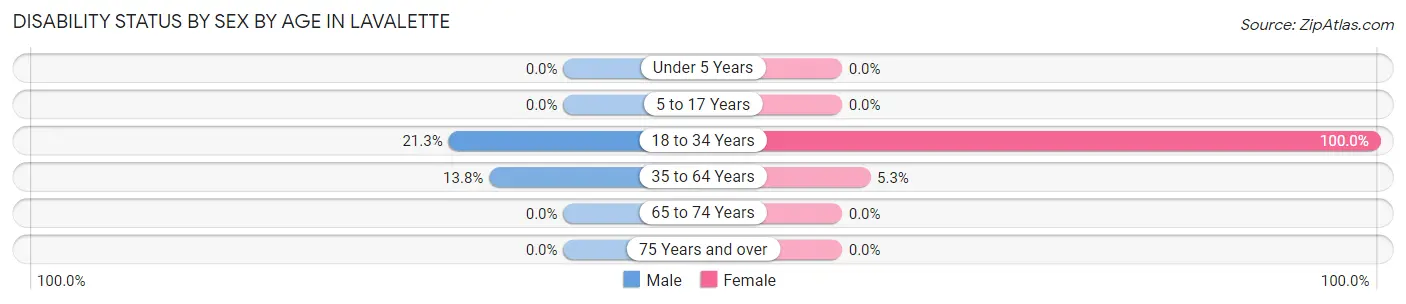
| Age Bracket | Male | Female |
| Under 5 Years | 0 (0.0%) | 0 (0.0%) |
| 5 to 17 Years | 0 (0.0%) | 0 (0.0%) |
| 18 to 34 Years | 29 (21.3%) | 12 (100.0%) |
| 35 to 64 Years | 19 (13.8%) | 10 (5.3%) |
| 65 to 74 Years | 0 (0.0%) | 0 (0.0%) |
| 75 Years and over | 0 (0.0%) | 0 (0.0%) |
Disability Class by Sex by Age in Lavalette
Disability Class: Hearing Difficulty
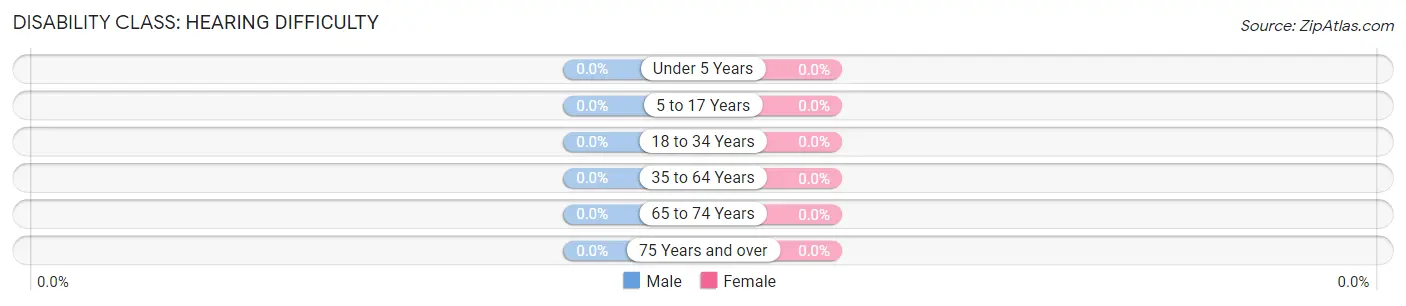
| Age Bracket | Male | Female |
| Under 5 Years | 0 (0.0%) | 0 (0.0%) |
| 5 to 17 Years | 0 (0.0%) | 0 (0.0%) |
| 18 to 34 Years | 0 (0.0%) | 0 (0.0%) |
| 35 to 64 Years | 0 (0.0%) | 0 (0.0%) |
| 65 to 74 Years | 0 (0.0%) | 0 (0.0%) |
| 75 Years and over | 0 (0.0%) | 0 (0.0%) |
Disability Class: Vision Difficulty
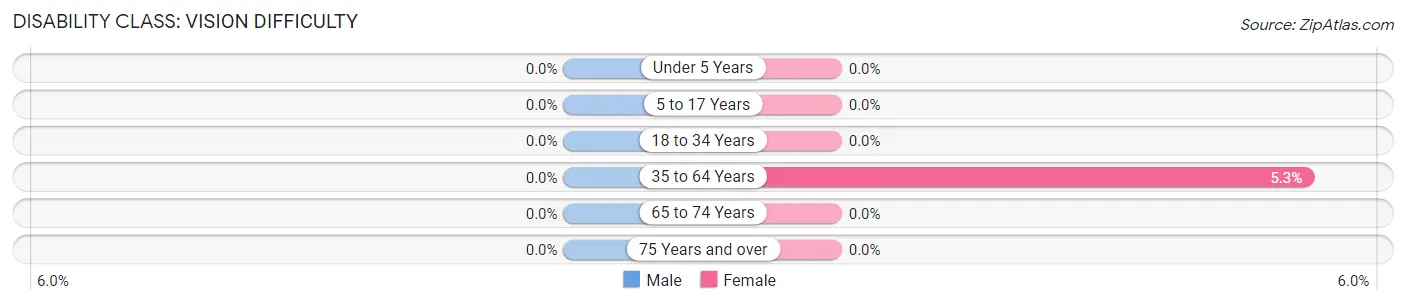
| Age Bracket | Male | Female |
| Under 5 Years | 0 (0.0%) | 0 (0.0%) |
| 5 to 17 Years | 0 (0.0%) | 0 (0.0%) |
| 18 to 34 Years | 0 (0.0%) | 0 (0.0%) |
| 35 to 64 Years | 0 (0.0%) | 10 (5.3%) |
| 65 to 74 Years | 0 (0.0%) | 0 (0.0%) |
| 75 Years and over | 0 (0.0%) | 0 (0.0%) |
Disability Class: Cognitive Difficulty
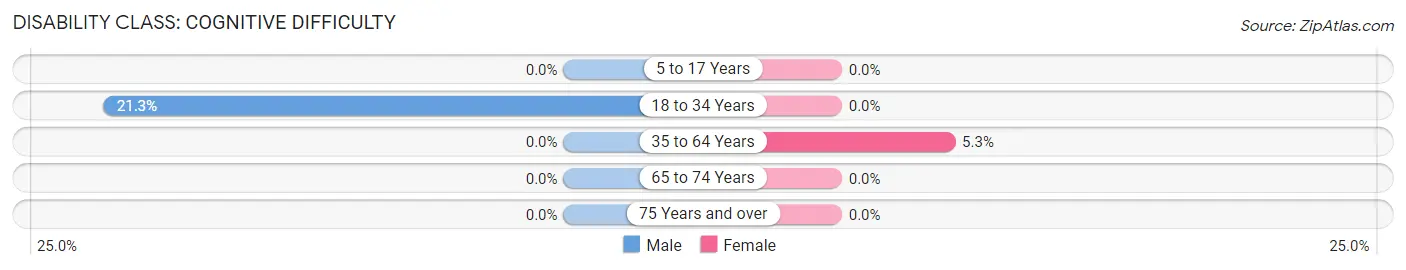
| Age Bracket | Male | Female |
| 5 to 17 Years | 0 (0.0%) | 0 (0.0%) |
| 18 to 34 Years | 29 (21.3%) | 0 (0.0%) |
| 35 to 64 Years | 0 (0.0%) | 10 (5.3%) |
| 65 to 74 Years | 0 (0.0%) | 0 (0.0%) |
| 75 Years and over | 0 (0.0%) | 0 (0.0%) |
Disability Class: Ambulatory Difficulty
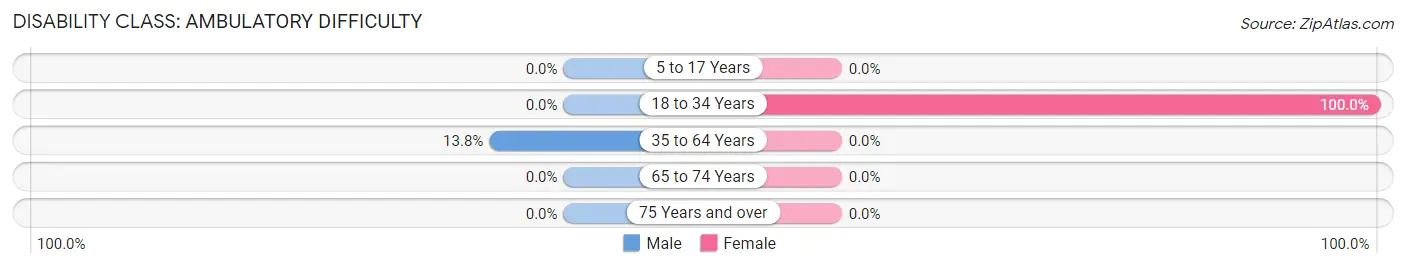
| Age Bracket | Male | Female |
| 5 to 17 Years | 0 (0.0%) | 0 (0.0%) |
| 18 to 34 Years | 0 (0.0%) | 12 (100.0%) |
| 35 to 64 Years | 19 (13.8%) | 0 (0.0%) |
| 65 to 74 Years | 0 (0.0%) | 0 (0.0%) |
| 75 Years and over | 0 (0.0%) | 0 (0.0%) |
Disability Class: Self-Care Difficulty
| Age Bracket | Male | Female |
| 5 to 17 Years | 0 (0.0%) | 0 (0.0%) |
| 18 to 34 Years | 0 (0.0%) | 0 (0.0%) |
| 35 to 64 Years | 0 (0.0%) | 0 (0.0%) |
| 65 to 74 Years | 0 (0.0%) | 0 (0.0%) |
| 75 Years and over | 0 (0.0%) | 0 (0.0%) |
Technology Access in Lavalette
Computing Device Access in Lavalette
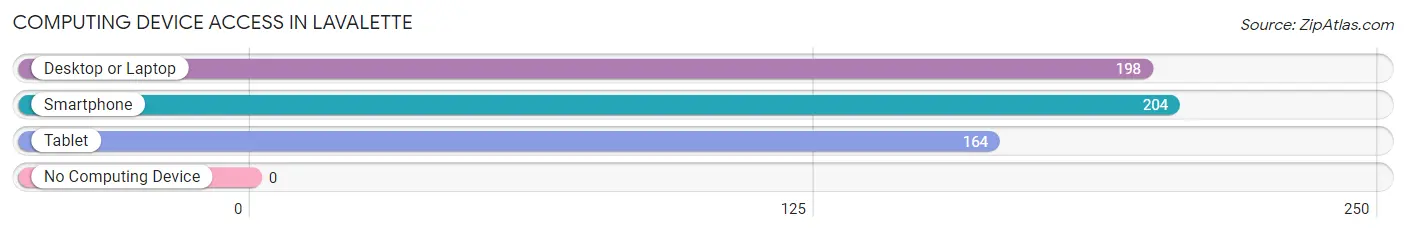
| Device Type | # Households | % Households |
| Desktop or Laptop | 198 | 90.4% |
| Smartphone | 204 | 93.1% |
| Tablet | 164 | 74.9% |
| No Computing Device | 0 | 0.0% |
| Total | 219 | 100.0% |
Internet Access in Lavalette
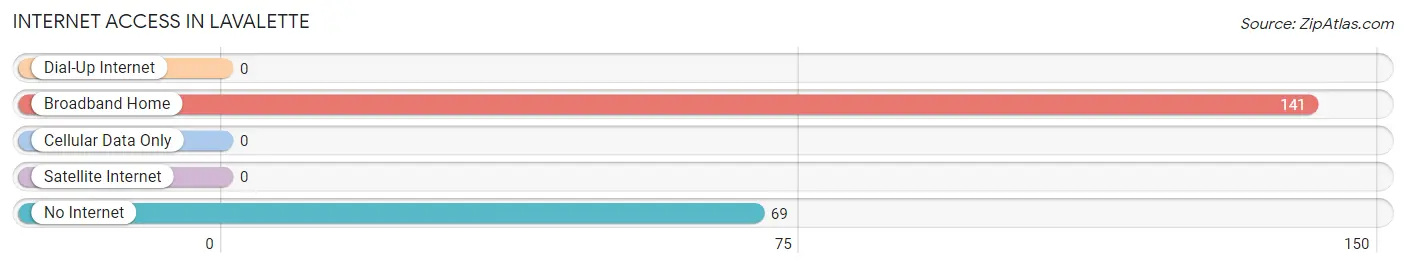
| Internet Type | # Households | % Households |
| Dial-Up Internet | 0 | 0.0% |
| Broadband Home | 141 | 64.4% |
| Cellular Data Only | 0 | 0.0% |
| Satellite Internet | 0 | 0.0% |
| No Internet | 69 | 31.5% |
| Total | 219 | 100.0% |
Lavalette Summary
Lavalette is a small town located in Wayne County, West Virginia. It is situated on the banks of the Big Sandy River, and is part of the Huntington-Ashland Metropolitan Statistical Area. The town has a population of approximately 1,000 people, and is known for its small-town charm and friendly atmosphere.
History
Lavalette was founded in 1817 by William Lavalette, a French immigrant who had come to the area in search of a better life. He purchased a large tract of land along the Big Sandy River and began to develop the area. The town was originally known as Lavalette’s Landing, and was a popular stop for steamboats traveling up and down the river.
In 1845, the town was officially incorporated as Lavalette. The town quickly grew and prospered, and by the turn of the century, it had become a bustling commercial center. The town was home to several stores, a hotel, a bank, and a post office.
In the early 1900s, the town began to decline as the railroad bypassed it in favor of larger cities. The population began to dwindle, and by the 1950s, the town was nearly abandoned. In the late 1970s, the town began to experience a resurgence as people began to move back to the area. Today, Lavalette is a small but vibrant community.
Geography
Lavalette is located in the Appalachian Mountains of West Virginia. The town is situated on the banks of the Big Sandy River, and is surrounded by rolling hills and lush forests. The town is located approximately 25 miles east of Huntington, West Virginia, and is part of the Huntington-Ashland Metropolitan Statistical Area.
The climate in Lavalette is humid and subtropical, with hot summers and mild winters. The average annual temperature is around 60 degrees Fahrenheit, and the average annual precipitation is around 40 inches.
Economy
The economy of Lavalette is largely based on tourism and agriculture. The town is home to several small businesses, including restaurants, shops, and a bed and breakfast. The town is also home to several farms, which produce a variety of crops, including corn, soybeans, and hay.
The town is also home to several manufacturing companies, including a furniture factory and a plastics plant. The town is also home to a coal mine, which provides jobs for many of the town’s residents.
Demographics
As of the 2010 census, the population of Lavalette was 1,000 people. The racial makeup of the town was 97.2% White, 0.7% African American, 0.3% Native American, 0.2% Asian, and 1.6% from other races. The median household income was $30,000, and the median home value was $90,000.
The town is home to several churches, including the Lavalette United Methodist Church, the Lavalette Baptist Church, and the Lavalette Presbyterian Church. The town is also home to a public library, a post office, and a fire department.
Conclusion
Lavalette is a small town located in Wayne County, West Virginia. It is situated on the banks of the Big Sandy River, and is part of the Huntington-Ashland Metropolitan Statistical Area. The town has a population of approximately 1,000 people, and is known for its small-town charm and friendly atmosphere. The economy of Lavalette is largely based on tourism and agriculture, and the town is home to several small businesses, farms, and manufacturing companies. The racial makeup of the town is 97.2% White, 0.7% African American, 0.3% Native American, 0.2% Asian, and 1.6% from other races. The median household income was $30,000, and the median home value was $90,000. Lavalette is a vibrant and welcoming community, and is a great place to live and work.
Common Questions
What is Per Capita Income in Lavalette?
Per Capita income in Lavalette is $19,029.
What is the Median Family Income in Lavalette?
Median Family Income in Lavalette is $82,316.
What is the Median Household income in Lavalette?
Median Household Income in Lavalette is $80,404.
What is Inequality or Gini Index in Lavalette?
Inequality or Gini Index in Lavalette is 0.24.
What is the Total Population of Lavalette?
Total Population of Lavalette is 991.
What is the Total Male Population of Lavalette?
Total Male Population of Lavalette is 491.
What is the Total Female Population of Lavalette?
Total Female Population of Lavalette is 500.
What is the Ratio of Males per 100 Females in Lavalette?
There are 98.20 Males per 100 Females in Lavalette.
What is the Ratio of Females per 100 Males in Lavalette?
There are 101.83 Females per 100 Males in Lavalette.
What is the Median Population Age in Lavalette?
Median Population Age in Lavalette is 25.1 Years.
What is the Average Family Size in Lavalette
Average Family Size in Lavalette is 5.6 People.
What is the Average Household Size in Lavalette
Average Household Size in Lavalette is 4.5 People.
How Large is the Labor Force in Lavalette?
There are 375 People in the Labor Forcein in Lavalette.
What is the Percentage of People in the Labor Force in Lavalette?
59.3% of People are in the Labor Force in Lavalette.