Martinsburg, WV Map & Demographics
Martinsburg Map
Martinsburg Overview
$28,739
PER CAPITA INCOME
$61,053
AVG FAMILY INCOME
$55,240
AVG HOUSEHOLD INCOME
39.0%
WAGE / INCOME GAP [ % ]
61.0¢/ $1
WAGE / INCOME GAP [ $ ]
0.45
INEQUALITY / GINI INDEX
18,678
TOTAL POPULATION
9,452
MALE POPULATION
9,226
FEMALE POPULATION
102.45
MALES / 100 FEMALES
97.61
FEMALES / 100 MALES
36.4
MEDIAN AGE
3.2
AVG FAMILY SIZE
2.4
AVG HOUSEHOLD SIZE
9,697
LABOR FORCE [ PEOPLE ]
66.0%
PERCENT IN LABOR FORCE
9.1%
UNEMPLOYMENT RATE
Income in Martinsburg
Income Overview in Martinsburg
Per Capita Income in Martinsburg is $28,739, while median incomes of families and households are $61,053 and $55,240 respectively.
| Characteristic | Number | Measure |
| Per Capita Income | 18,678 | $28,739 |
| Median Family Income | 4,203 | $61,053 |
| Mean Family Income | 4,203 | $83,928 |
| Median Household Income | 7,590 | $55,240 |
| Mean Household Income | 7,590 | $71,259 |
| Income Deficit | 4,203 | $0 |
| Wage / Income Gap (%) | 18,678 | 39.02% |
| Wage / Income Gap ($) | 18,678 | 60.98¢ per $1 |
| Gini / Inequality Index | 18,678 | 0.45 |
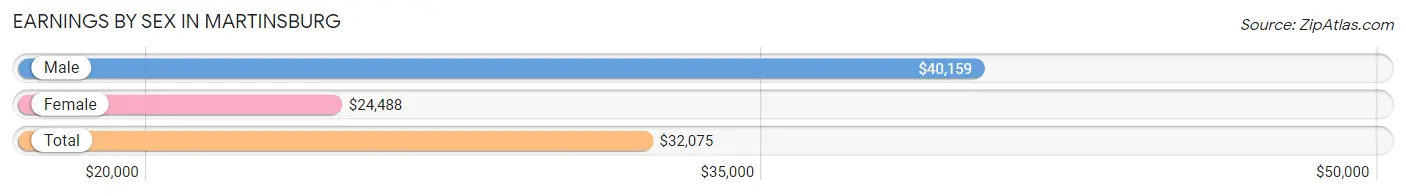
Earnings by Sex in Martinsburg
Average Earnings in Martinsburg are $32,075, $40,159 for men and $24,488 for women, a difference of 39.0%.
| Sex | Number | Average Earnings |
| Male | 5,247 (54.6%) | $40,159 |
| Female | 4,370 (45.4%) | $24,488 |
| Total | 9,617 (100.0%) | $32,075 |
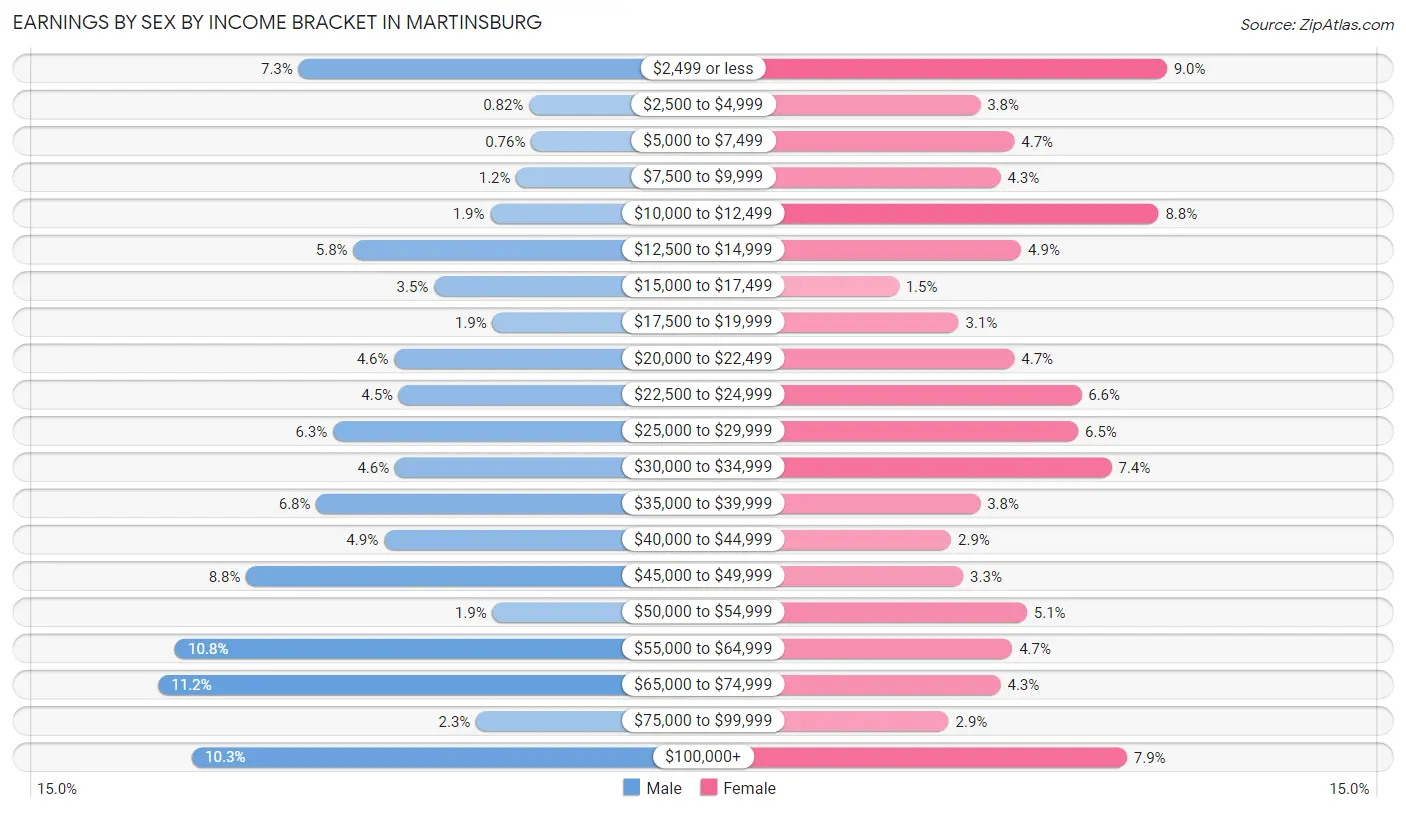
Earnings by Sex by Income Bracket in Martinsburg
The most common earnings brackets in Martinsburg are $65,000 to $74,999 for men (590 | 11.2%) and $2,499 or less for women (393 | 9.0%).
| Income | Male | Female |
| $2,499 or less | 383 (7.3%) | 393 (9.0%) |
| $2,500 to $4,999 | 43 (0.8%) | 164 (3.7%) |
| $5,000 to $7,499 | 40 (0.8%) | 206 (4.7%) |
| $7,500 to $9,999 | 62 (1.2%) | 189 (4.3%) |
| $10,000 to $12,499 | 100 (1.9%) | 383 (8.8%) |
| $12,500 to $14,999 | 302 (5.8%) | 214 (4.9%) |
| $15,000 to $17,499 | 183 (3.5%) | 64 (1.5%) |
| $17,500 to $19,999 | 97 (1.8%) | 137 (3.1%) |
| $20,000 to $22,499 | 242 (4.6%) | 206 (4.7%) |
| $22,500 to $24,999 | 235 (4.5%) | 288 (6.6%) |
| $25,000 to $29,999 | 332 (6.3%) | 284 (6.5%) |
| $30,000 to $34,999 | 241 (4.6%) | 325 (7.4%) |
| $35,000 to $39,999 | 357 (6.8%) | 164 (3.7%) |
| $40,000 to $44,999 | 257 (4.9%) | 128 (2.9%) |
| $45,000 to $49,999 | 460 (8.8%) | 143 (3.3%) |
| $50,000 to $54,999 | 97 (1.8%) | 221 (5.1%) |
| $55,000 to $64,999 | 565 (10.8%) | 203 (4.6%) |
| $65,000 to $74,999 | 590 (11.2%) | 189 (4.3%) |
| $75,000 to $99,999 | 121 (2.3%) | 125 (2.9%) |
| $100,000+ | 540 (10.3%) | 344 (7.9%) |
| Total | 5,247 (100.0%) | 4,370 (100.0%) |
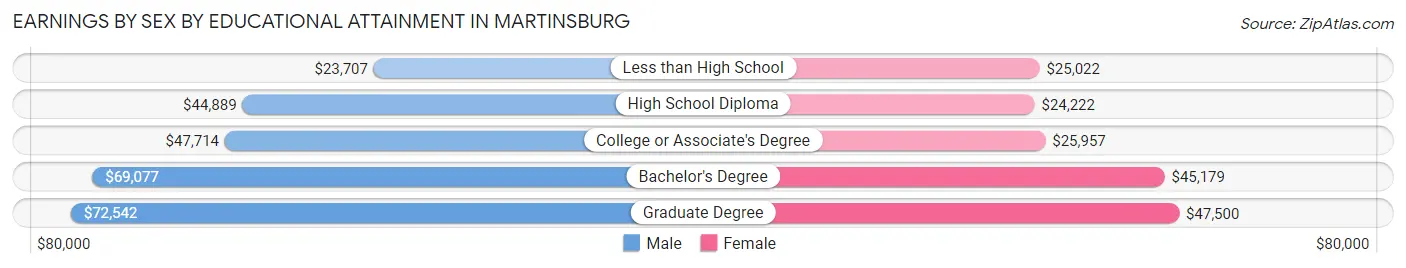
Earnings by Sex by Educational Attainment in Martinsburg
Average earnings in Martinsburg are $47,006 for men and $30,254 for women, a difference of 35.6%. Men with an educational attainment of graduate degree enjoy the highest average annual earnings of $72,542, while those with less than high school education earn the least with $23,707. Women with an educational attainment of graduate degree earn the most with the average annual earnings of $47,500, while those with high school diploma education have the smallest earnings of $24,222.
| Educational Attainment | Male Income | Female Income |
| Less than High School | $23,707 | $25,022 |
| High School Diploma | $44,889 | $24,222 |
| College or Associate's Degree | $47,714 | $25,957 |
| Bachelor's Degree | $69,077 | $45,179 |
| Graduate Degree | $72,542 | $47,500 |
| Total | $47,006 | $30,254 |
Family Income in Martinsburg
Family Income Brackets in Martinsburg
According to the Martinsburg family income data, there are 761 families falling into the $50,000 to $74,999 income range, which is the most common income bracket and makes up 18.1% of all families. Conversely, the $10,000 to $14,999 income bracket is the least frequent group with only 55 families (1.3%) belonging to this category.
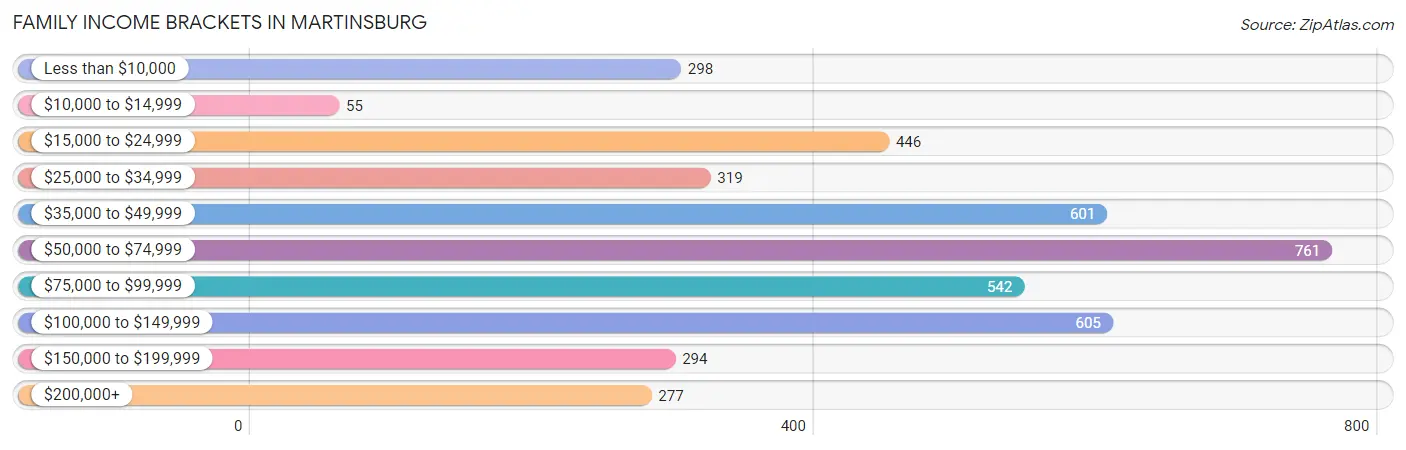
| Income Bracket | # Families | % Families |
| Less than $10,000 | 298 | 7.1% |
| $10,000 to $14,999 | 55 | 1.3% |
| $15,000 to $24,999 | 446 | 10.6% |
| $25,000 to $34,999 | 319 | 7.6% |
| $35,000 to $49,999 | 601 | 14.3% |
| $50,000 to $74,999 | 761 | 18.1% |
| $75,000 to $99,999 | 542 | 12.9% |
| $100,000 to $149,999 | 605 | 14.4% |
| $150,000 to $199,999 | 294 | 7.0% |
| $200,000+ | 277 | 6.6% |
Family Income by Famaliy Size in Martinsburg
5-person families (451 | 10.7%) account for the highest median family income in Martinsburg with $148,208 per family, while 2-person families (1,890 | 45.0%) have the highest median income of $30,631 per family member.
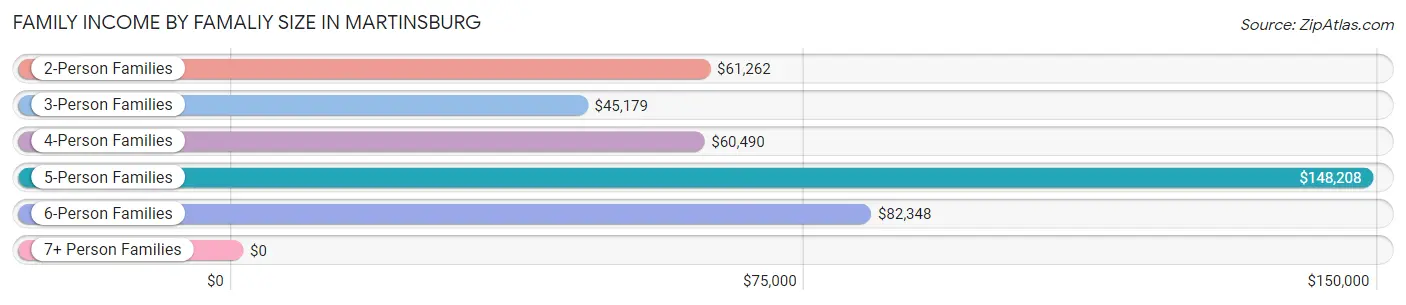
| Income Bracket | # Families | Median Income |
| 2-Person Families | 1,890 (45.0%) | $61,262 |
| 3-Person Families | 808 (19.2%) | $45,179 |
| 4-Person Families | 740 (17.6%) | $60,490 |
| 5-Person Families | 451 (10.7%) | $148,208 |
| 6-Person Families | 120 (2.9%) | $82,348 |
| 7+ Person Families | 194 (4.6%) | $0 |
| Total | 4,203 (100.0%) | $61,053 |
Family Income by Number of Earners in Martinsburg
The median family income in Martinsburg is $61,053, with families comprising 3+ earners (527) having the highest median family income of $156,583, while families with 1 earner (1,916) have the lowest median family income of $41,471, accounting for 12.5% and 45.6% of families, respectively.
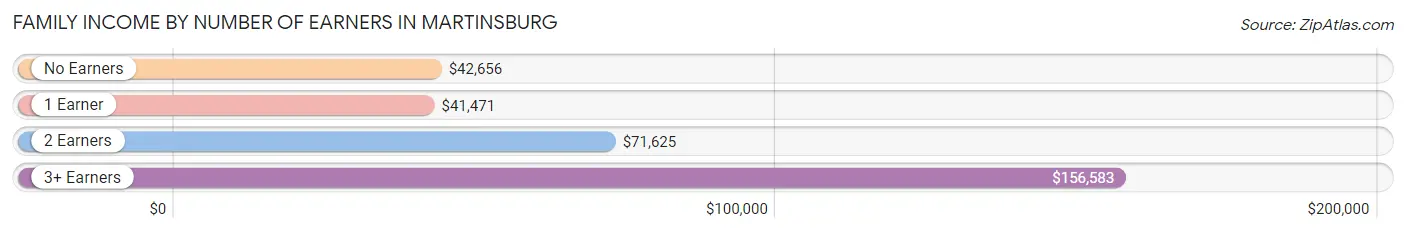
| Number of Earners | # Families | Median Income |
| No Earners | 418 (10.0%) | $42,656 |
| 1 Earner | 1,916 (45.6%) | $41,471 |
| 2 Earners | 1,342 (31.9%) | $71,625 |
| 3+ Earners | 527 (12.5%) | $156,583 |
| Total | 4,203 (100.0%) | $61,053 |
Household Income in Martinsburg
Household Income Brackets in Martinsburg
With 1,548 households falling in the category, the $50,000 to $74,999 income range is the most frequent in Martinsburg, accounting for 20.4% of all households. In contrast, only 281 households (3.7%) fall into the $200,000+ income bracket, making it the least populous group.
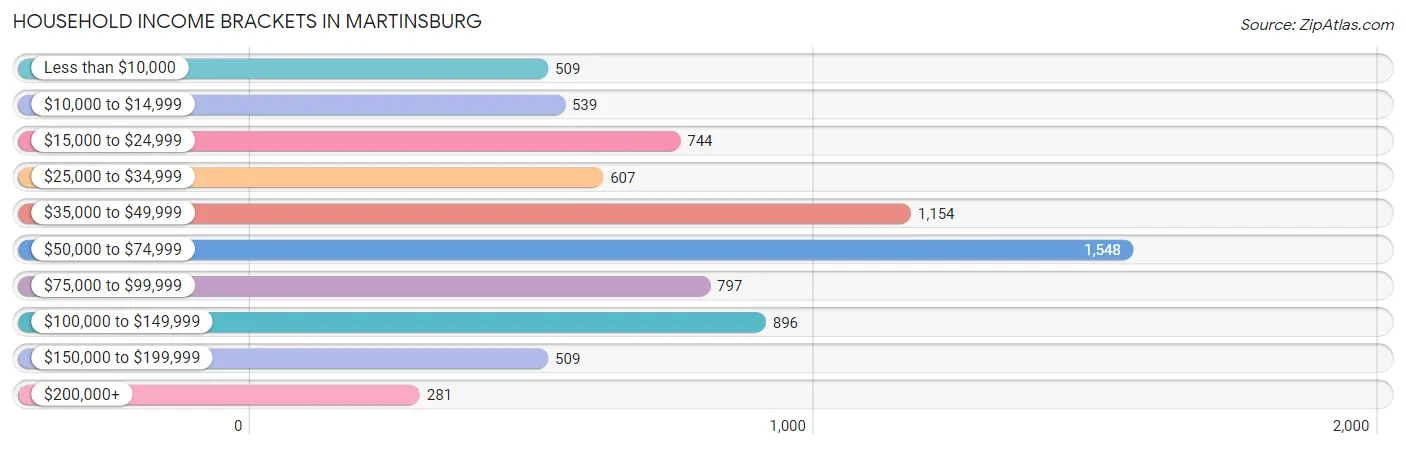
| Income Bracket | # Households | % Households |
| Less than $10,000 | 509 | 6.7% |
| $10,000 to $14,999 | 539 | 7.1% |
| $15,000 to $24,999 | 744 | 9.8% |
| $25,000 to $34,999 | 607 | 8.0% |
| $35,000 to $49,999 | 1,154 | 15.2% |
| $50,000 to $74,999 | 1,548 | 20.4% |
| $75,000 to $99,999 | 797 | 10.5% |
| $100,000 to $149,999 | 896 | 11.8% |
| $150,000 to $199,999 | 509 | 6.7% |
| $200,000+ | 281 | 3.7% |
Household Income by Householder Age in Martinsburg
The median household income in Martinsburg is $55,240, with the highest median household income of $66,208 found in the 25 to 44 years age bracket for the primary householder. A total of 2,559 households (33.7%) fall into this category. Meanwhile, the 65+ years age bracket for the primary householder has the lowest median household income of $44,070, with 1,981 households (26.1%) in this group.
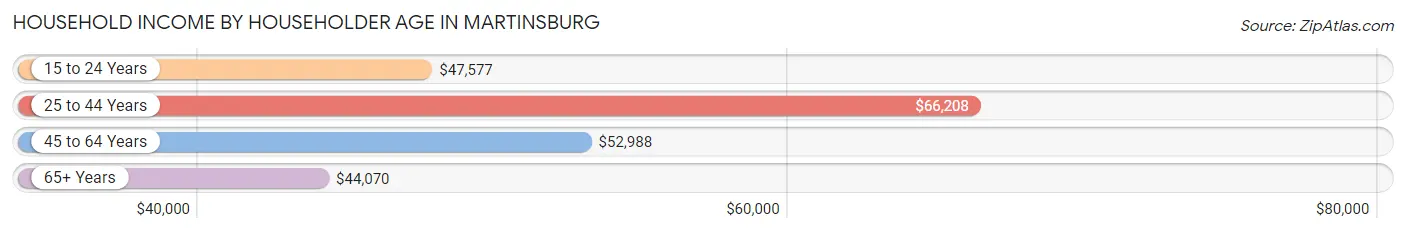
| Income Bracket | # Households | Median Income |
| 15 to 24 Years | 540 (7.1%) | $47,577 |
| 25 to 44 Years | 2,559 (33.7%) | $66,208 |
| 45 to 64 Years | 2,510 (33.1%) | $52,988 |
| 65+ Years | 1,981 (26.1%) | $44,070 |
| Total | 7,590 (100.0%) | $55,240 |
Poverty in Martinsburg
Income Below Poverty by Sex and Age in Martinsburg
With 19.8% poverty level for males and 29.7% for females among the residents of Martinsburg, 5 year old males and 16 and 17 year old females are the most vulnerable to poverty, with 67 males (41.9%) and 193 females (62.3%) in their respective age groups living below the poverty level.
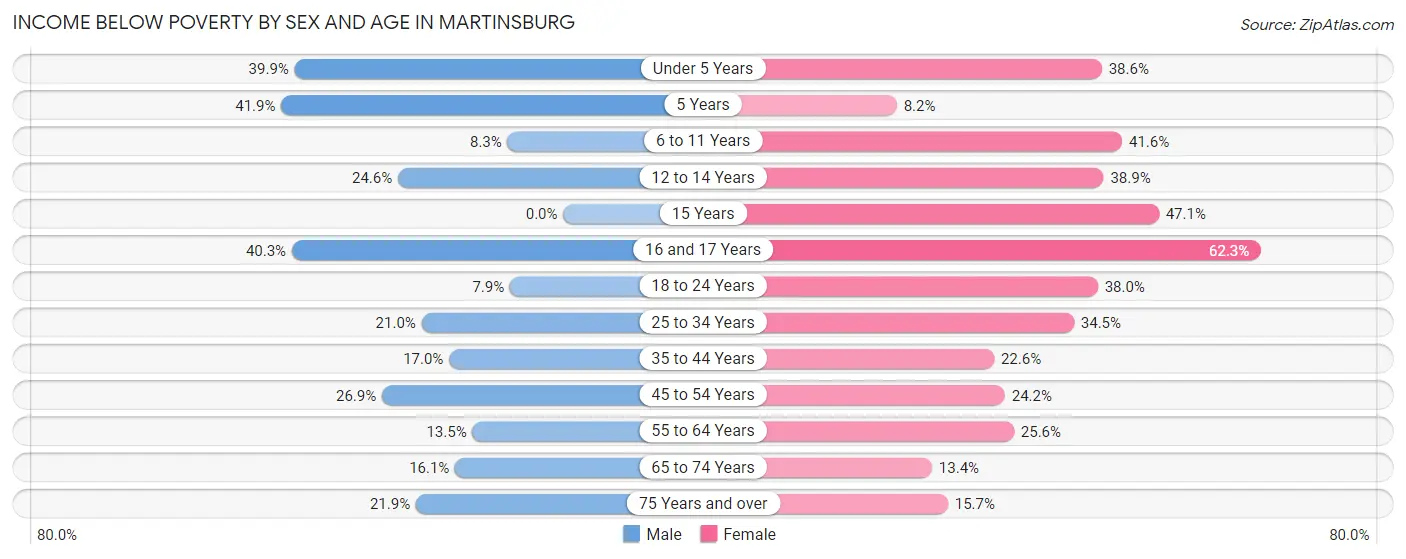
| Age Bracket | Male | Female |
| Under 5 Years | 249 (39.9%) | 166 (38.6%) |
| 5 Years | 67 (41.9%) | 4 (8.2%) |
| 6 to 11 Years | 64 (8.3%) | 360 (41.6%) |
| 12 to 14 Years | 95 (24.5%) | 136 (38.9%) |
| 15 Years | 0 (0.0%) | 32 (47.1%) |
| 16 and 17 Years | 133 (40.3%) | 193 (62.3%) |
| 18 to 24 Years | 67 (7.9%) | 353 (38.0%) |
| 25 to 34 Years | 315 (21.0%) | 408 (34.5%) |
| 35 to 44 Years | 190 (17.0%) | 273 (22.6%) |
| 45 to 54 Years | 294 (26.9%) | 219 (24.2%) |
| 55 to 64 Years | 141 (13.5%) | 358 (25.6%) |
| 65 to 74 Years | 167 (16.1%) | 128 (13.4%) |
| 75 Years and over | 70 (21.9%) | 71 (15.7%) |
| Total | 1,852 (19.8%) | 2,701 (29.7%) |
Income Above Poverty by Sex and Age in Martinsburg
According to the poverty statistics in Martinsburg, males aged 15 years and females aged 5 years are the age groups that are most secure financially, with 100.0% of males and 91.8% of females in these age groups living above the poverty line.
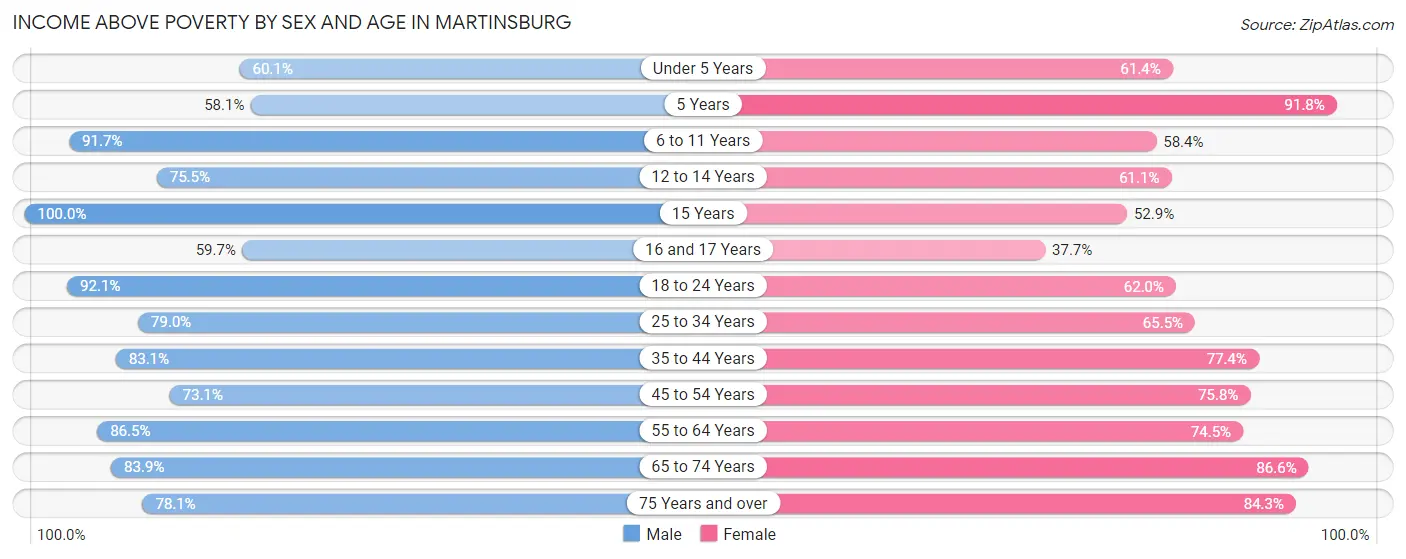
| Age Bracket | Male | Female |
| Under 5 Years | 375 (60.1%) | 264 (61.4%) |
| 5 Years | 93 (58.1%) | 45 (91.8%) |
| 6 to 11 Years | 709 (91.7%) | 505 (58.4%) |
| 12 to 14 Years | 292 (75.4%) | 214 (61.1%) |
| 15 Years | 111 (100.0%) | 36 (52.9%) |
| 16 and 17 Years | 197 (59.7%) | 117 (37.7%) |
| 18 to 24 Years | 780 (92.1%) | 576 (62.0%) |
| 25 to 34 Years | 1,182 (79.0%) | 776 (65.5%) |
| 35 to 44 Years | 931 (83.1%) | 935 (77.4%) |
| 45 to 54 Years | 798 (73.1%) | 686 (75.8%) |
| 55 to 64 Years | 904 (86.5%) | 1,043 (74.5%) |
| 65 to 74 Years | 873 (83.9%) | 829 (86.6%) |
| 75 Years and over | 250 (78.1%) | 380 (84.3%) |
| Total | 7,495 (80.2%) | 6,406 (70.3%) |
Income Below Poverty Among Married-Couple Families in Martinsburg
The poverty statistics for married-couple families in Martinsburg show that 12.1% or 283 of the total 2,331 families live below the poverty line. Families with 3 or 4 children have the highest poverty rate of 61.4%, comprising of 143 families. On the other hand, families with 5 or more children have the lowest poverty rate of 0.0%, which includes 0 families.
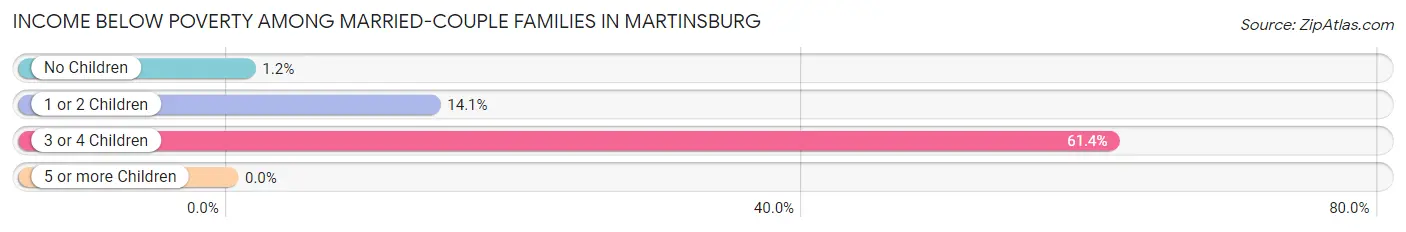
| Children | Above Poverty | Below Poverty |
| No Children | 1,147 (98.8%) | 14 (1.2%) |
| 1 or 2 Children | 768 (85.9%) | 126 (14.1%) |
| 3 or 4 Children | 90 (38.6%) | 143 (61.4%) |
| 5 or more Children | 43 (100.0%) | 0 (0.0%) |
| Total | 2,048 (87.9%) | 283 (12.1%) |
Income Below Poverty Among Single-Parent Households in Martinsburg
According to the poverty data in Martinsburg, 4.1% or 35 single-father households and 44.6% or 452 single-mother households are living below the poverty line. Among single-father households, those with 1 or 2 children have the highest poverty rate, with 26 households (6.7%) experiencing poverty. Likewise, among single-mother households, those with 5 or more children have the highest poverty rate, with 10 households (100.0%) falling below the poverty line.
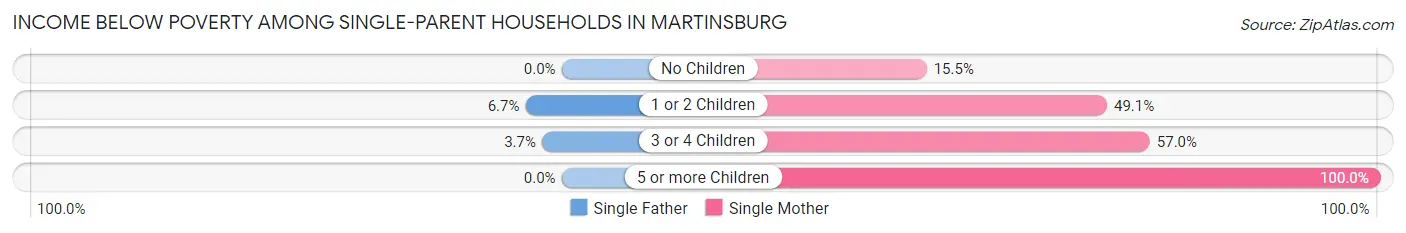
| Children | Single Father | Single Mother |
| No Children | 0 (0.0%) | 28 (15.5%) |
| 1 or 2 Children | 26 (6.7%) | 341 (49.1%) |
| 3 or 4 Children | 9 (3.7%) | 73 (57.0%) |
| 5 or more Children | 0 (0.0%) | 10 (100.0%) |
| Total | 35 (4.1%) | 452 (44.6%) |
Income Below Poverty Among Married-Couple vs Single-Parent Households in Martinsburg
The poverty data for Martinsburg shows that 283 of the married-couple family households (12.1%) and 487 of the single-parent households (26.0%) are living below the poverty level. Within the married-couple family households, those with 3 or 4 children have the highest poverty rate, with 143 households (61.4%) falling below the poverty line. Among the single-parent households, those with 5 or more children have the highest poverty rate, with 10 household (100.0%) living below poverty.
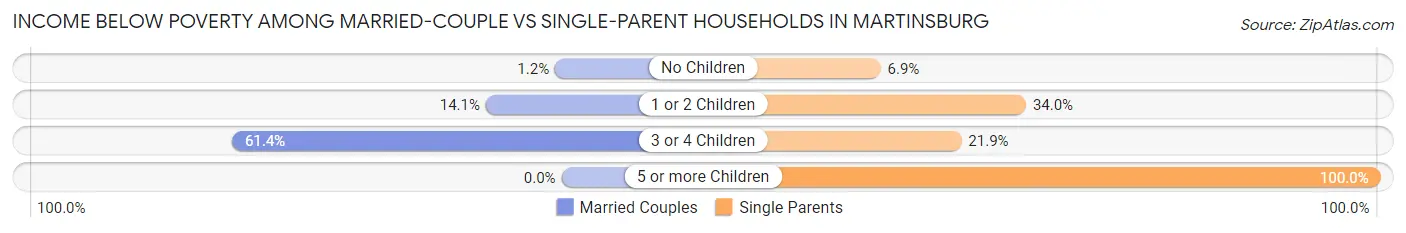
| Children | Married-Couple Families | Single-Parent Households |
| No Children | 14 (1.2%) | 28 (6.9%) |
| 1 or 2 Children | 126 (14.1%) | 367 (34.0%) |
| 3 or 4 Children | 143 (61.4%) | 82 (21.9%) |
| 5 or more Children | 0 (0.0%) | 10 (100.0%) |
| Total | 283 (12.1%) | 487 (26.0%) |
Race in Martinsburg
The most populous races in Martinsburg are White / Caucasian (13,246 | 70.9%), Black / African American (2,495 | 13.4%), and Two or more Races (2,115 | 11.3%).
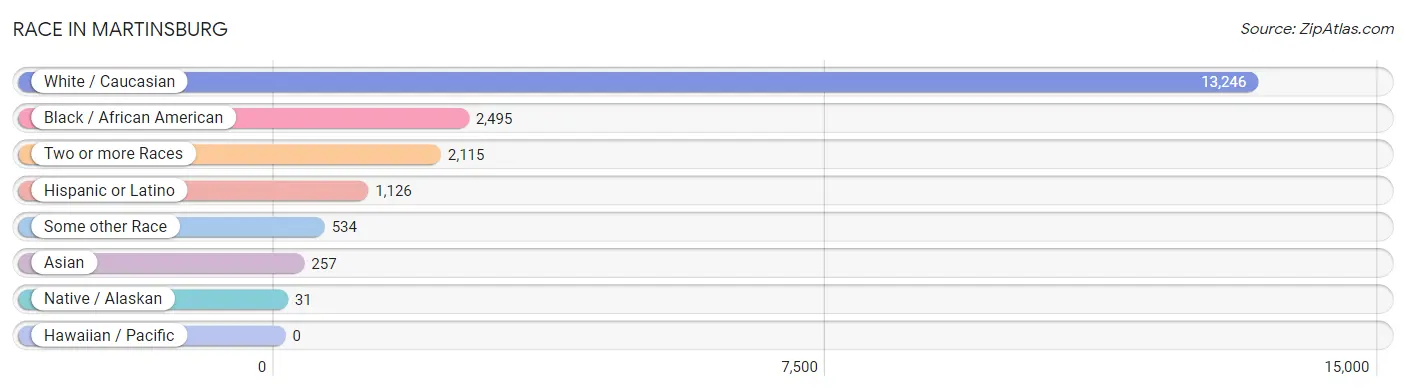
| Race | # Population | % Population |
| Asian | 257 | 1.4% |
| Black / African American | 2,495 | 13.4% |
| Hawaiian / Pacific | 0 | 0.0% |
| Hispanic or Latino | 1,126 | 6.0% |
| Native / Alaskan | 31 | 0.2% |
| White / Caucasian | 13,246 | 70.9% |
| Two or more Races | 2,115 | 11.3% |
| Some other Race | 534 | 2.9% |
| Total | 18,678 | 100.0% |
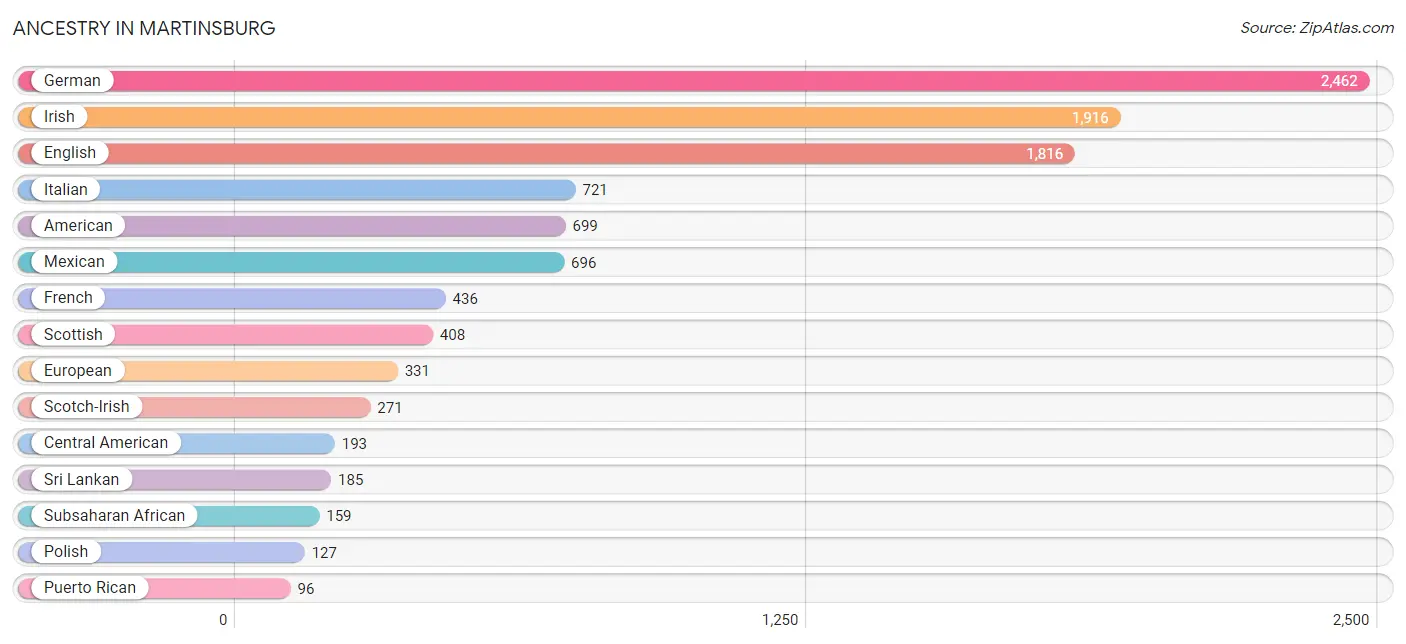
Ancestry in Martinsburg
The most populous ancestries reported in Martinsburg are German (2,462 | 13.2%), Irish (1,916 | 10.3%), English (1,816 | 9.7%), Italian (721 | 3.9%), and American (699 | 3.7%), together accounting for 40.8% of all Martinsburg residents.
| Ancestry | # Population | % Population |
| African | 8 | 0.0% |
| American | 699 | 3.7% |
| Apache | 26 | 0.1% |
| Austrian | 12 | 0.1% |
| Bhutanese | 53 | 0.3% |
| British | 64 | 0.3% |
| Burmese | 8 | 0.0% |
| Central American | 193 | 1.0% |
| Cherokee | 77 | 0.4% |
| Costa Rican | 41 | 0.2% |
| Croatian | 27 | 0.1% |
| Crow | 4 | 0.0% |
| Czech | 9 | 0.1% |
| Danish | 15 | 0.1% |
| Dominican | 28 | 0.2% |
| Dutch | 51 | 0.3% |
| Eastern European | 16 | 0.1% |
| Ecuadorian | 18 | 0.1% |
| English | 1,816 | 9.7% |
| Ethiopian | 56 | 0.3% |
| European | 331 | 1.8% |
| French | 436 | 2.3% |
| French Canadian | 54 | 0.3% |
| German | 2,462 | 13.2% |
| Ghanaian | 61 | 0.3% |
| Greek | 33 | 0.2% |
| Guatemalan | 66 | 0.4% |
| Hungarian | 16 | 0.1% |
| Indian (Asian) | 28 | 0.2% |
| Irish | 1,916 | 10.3% |
| Italian | 721 | 3.9% |
| Jamaican | 8 | 0.0% |
| Korean | 42 | 0.2% |
| Latvian | 18 | 0.1% |
| Mexican | 696 | 3.7% |
| Mexican American Indian | 6 | 0.0% |
| Nigerian | 4 | 0.0% |
| Northern European | 70 | 0.4% |
| Norwegian | 66 | 0.4% |
| Pakistani | 62 | 0.3% |
| Panamanian | 7 | 0.0% |
| Pennsylvania German | 15 | 0.1% |
| Polish | 127 | 0.7% |
| Portuguese | 15 | 0.1% |
| Puerto Rican | 96 | 0.5% |
| Romanian | 30 | 0.2% |
| Russian | 70 | 0.4% |
| Salvadoran | 79 | 0.4% |
| Scandinavian | 21 | 0.1% |
| Scotch-Irish | 271 | 1.5% |
| Scottish | 408 | 2.2% |
| Sioux | 37 | 0.2% |
| Slovak | 12 | 0.1% |
| South American | 18 | 0.1% |
| Spaniard | 12 | 0.1% |
| Spanish | 62 | 0.3% |
| Sri Lankan | 185 | 1.0% |
| Subsaharan African | 159 | 0.9% |
| Swedish | 41 | 0.2% |
| Swiss | 19 | 0.1% |
| Turkish | 13 | 0.1% |
| Welsh | 37 | 0.2% |
| West Indian | 9 | 0.1% |
| Zimbabwean | 28 | 0.2% | View All 64 Rows |
Immigrants in Martinsburg
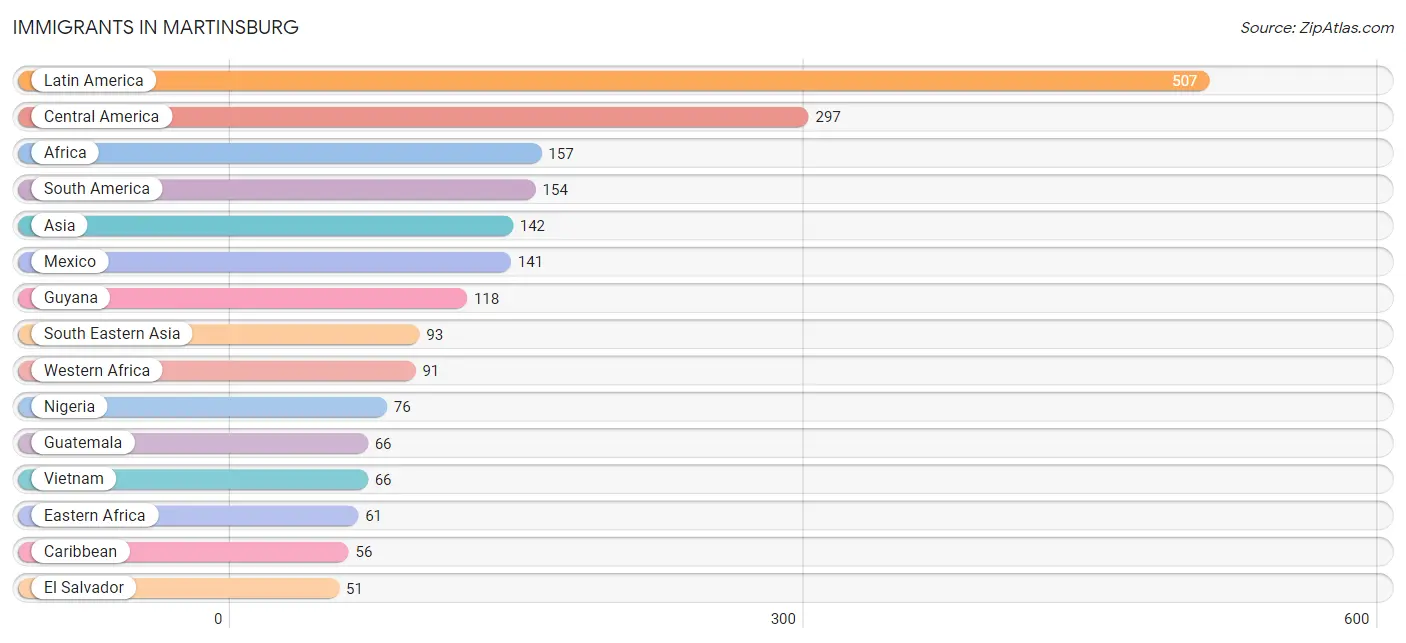
The most numerous immigrant groups reported in Martinsburg came from Latin America (507 | 2.7%), Central America (297 | 1.6%), Africa (157 | 0.8%), South America (154 | 0.8%), and Asia (142 | 0.8%), together accounting for 6.7% of all Martinsburg residents.
| Immigration Origin | # Population | % Population |
| Africa | 157 | 0.8% |
| Asia | 142 | 0.8% |
| Brazil | 18 | 0.1% |
| Cameroon | 5 | 0.0% |
| Canada | 37 | 0.2% |
| Caribbean | 56 | 0.3% |
| Central America | 297 | 1.6% |
| China | 28 | 0.2% |
| Costa Rica | 29 | 0.2% |
| Dominican Republic | 19 | 0.1% |
| Eastern Africa | 61 | 0.3% |
| Eastern Asia | 49 | 0.3% |
| Ecuador | 18 | 0.1% |
| El Salvador | 51 | 0.3% |
| Ethiopia | 33 | 0.2% |
| Europe | 2 | 0.0% |
| Ghana | 15 | 0.1% |
| Guatemala | 66 | 0.4% |
| Guyana | 118 | 0.6% |
| Japan | 14 | 0.1% |
| Korea | 7 | 0.0% |
| Latin America | 507 | 2.7% |
| Mexico | 141 | 0.7% |
| Middle Africa | 5 | 0.0% |
| Nicaragua | 10 | 0.1% |
| Nigeria | 76 | 0.4% |
| South America | 154 | 0.8% |
| South Eastern Asia | 93 | 0.5% |
| Southern Europe | 2 | 0.0% |
| Spain | 2 | 0.0% |
| Thailand | 27 | 0.1% |
| Trinidad and Tobago | 28 | 0.2% |
| Vietnam | 66 | 0.4% |
| Western Africa | 91 | 0.5% |
| Zimbabwe | 28 | 0.2% | View All 35 Rows |
Sex and Age in Martinsburg
Sex and Age in Martinsburg
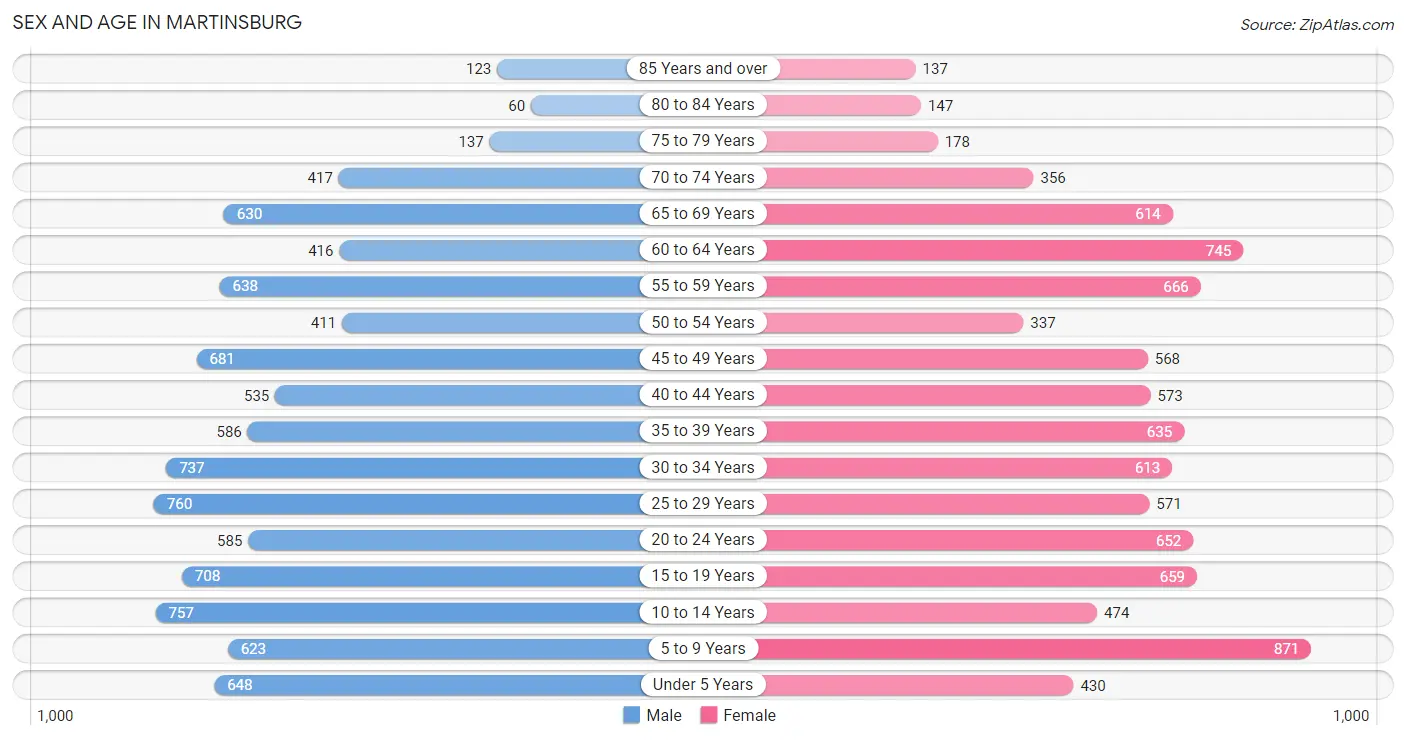
The most populous age groups in Martinsburg are 25 to 29 Years (760 | 8.0%) for men and 5 to 9 Years (871 | 9.4%) for women.
| Age Bracket | Male | Female |
| Under 5 Years | 648 (6.9%) | 430 (4.7%) |
| 5 to 9 Years | 623 (6.6%) | 871 (9.4%) |
| 10 to 14 Years | 757 (8.0%) | 474 (5.1%) |
| 15 to 19 Years | 708 (7.5%) | 659 (7.1%) |
| 20 to 24 Years | 585 (6.2%) | 652 (7.1%) |
| 25 to 29 Years | 760 (8.0%) | 571 (6.2%) |
| 30 to 34 Years | 737 (7.8%) | 613 (6.6%) |
| 35 to 39 Years | 586 (6.2%) | 635 (6.9%) |
| 40 to 44 Years | 535 (5.7%) | 573 (6.2%) |
| 45 to 49 Years | 681 (7.2%) | 568 (6.2%) |
| 50 to 54 Years | 411 (4.3%) | 337 (3.6%) |
| 55 to 59 Years | 638 (6.8%) | 666 (7.2%) |
| 60 to 64 Years | 416 (4.4%) | 745 (8.1%) |
| 65 to 69 Years | 630 (6.7%) | 614 (6.7%) |
| 70 to 74 Years | 417 (4.4%) | 356 (3.9%) |
| 75 to 79 Years | 137 (1.5%) | 178 (1.9%) |
| 80 to 84 Years | 60 (0.6%) | 147 (1.6%) |
| 85 Years and over | 123 (1.3%) | 137 (1.5%) |
| Total | 9,452 (100.0%) | 9,226 (100.0%) |
Families and Households in Martinsburg
Median Family Size in Martinsburg
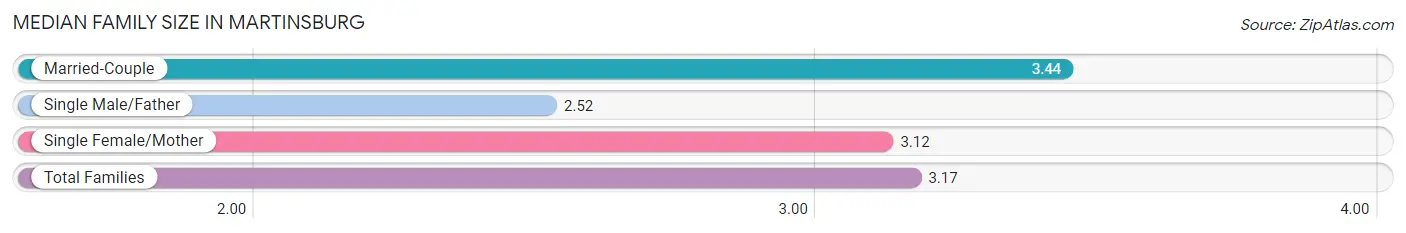
The median family size in Martinsburg is 3.17 persons per family, with married-couple families (2,331 | 55.5%) accounting for the largest median family size of 3.44 persons per family. On the other hand, single male/father families (858 | 20.4%) represent the smallest median family size with 2.52 persons per family.
| Family Type | # Families | Family Size |
| Married-Couple | 2,331 (55.5%) | 3.44 |
| Single Male/Father | 858 (20.4%) | 2.52 |
| Single Female/Mother | 1,014 (24.1%) | 3.12 |
| Total Families | 4,203 (100.0%) | 3.17 |
Median Household Size in Martinsburg
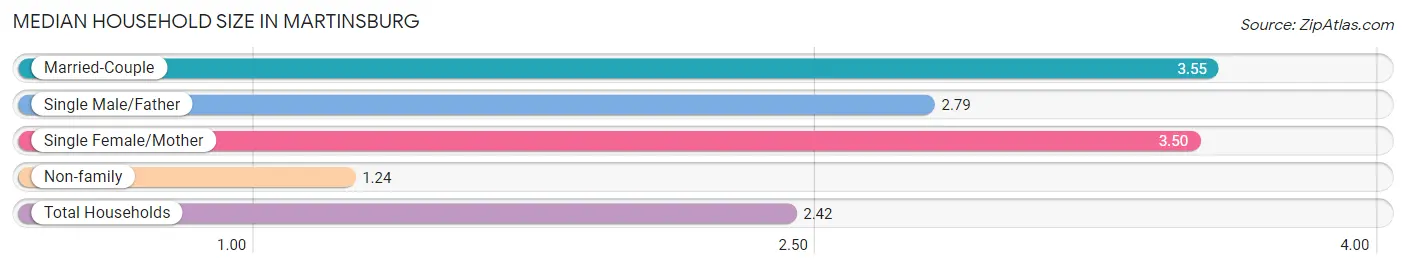
The median household size in Martinsburg is 2.42 persons per household, with married-couple households (2,331 | 30.7%) accounting for the largest median household size of 3.55 persons per household. non-family households (3,387 | 44.6%) represent the smallest median household size with 1.24 persons per household.
| Household Type | # Households | Household Size |
| Married-Couple | 2,331 (30.7%) | 3.55 |
| Single Male/Father | 858 (11.3%) | 2.79 |
| Single Female/Mother | 1,014 (13.4%) | 3.50 |
| Non-family | 3,387 (44.6%) | 1.24 |
| Total Households | 7,590 (100.0%) | 2.42 |
Household Size by Marriage Status in Martinsburg
Out of a total of 7,590 households in Martinsburg, 4,203 (55.4%) are family households, while 3,387 (44.6%) are nonfamily households. The most numerous type of family households are 2-person households, comprising 1,456, and the most common type of nonfamily households are 1-person households, comprising 2,667.
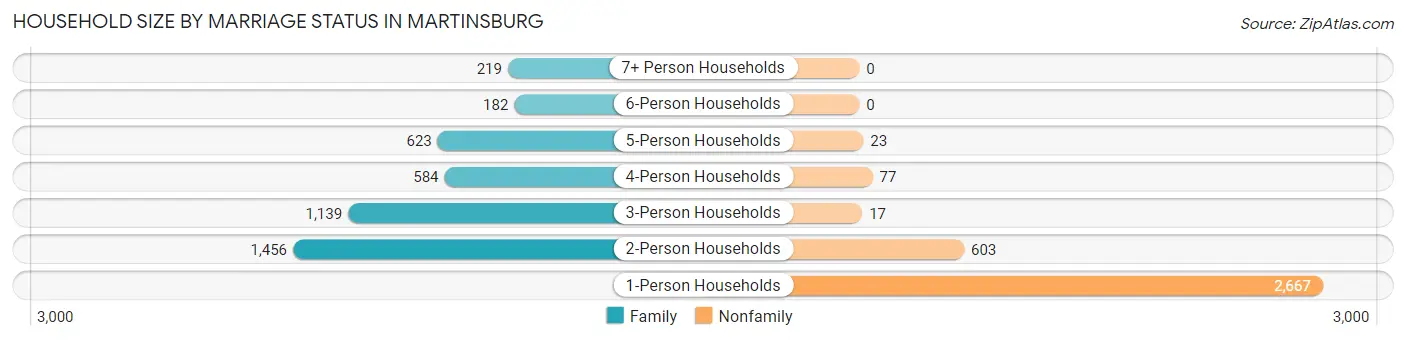
| Household Size | Family Households | Nonfamily Households |
| 1-Person Households | - | 2,667 (35.1%) |
| 2-Person Households | 1,456 (19.2%) | 603 (7.9%) |
| 3-Person Households | 1,139 (15.0%) | 17 (0.2%) |
| 4-Person Households | 584 (7.7%) | 77 (1.0%) |
| 5-Person Households | 623 (8.2%) | 23 (0.3%) |
| 6-Person Households | 182 (2.4%) | 0 (0.0%) |
| 7+ Person Households | 219 (2.9%) | 0 (0.0%) |
| Total | 4,203 (55.4%) | 3,387 (44.6%) |
Female Fertility in Martinsburg
Fertility by Age in Martinsburg
Average fertility rate in Martinsburg is 101.0 births per 1,000 women. Women in the age bracket of 20 to 34 years have the highest fertility rate with 212.0 births per 1,000 women. Women in the age bracket of 20 to 34 years acount for 89.4% of all women with births.
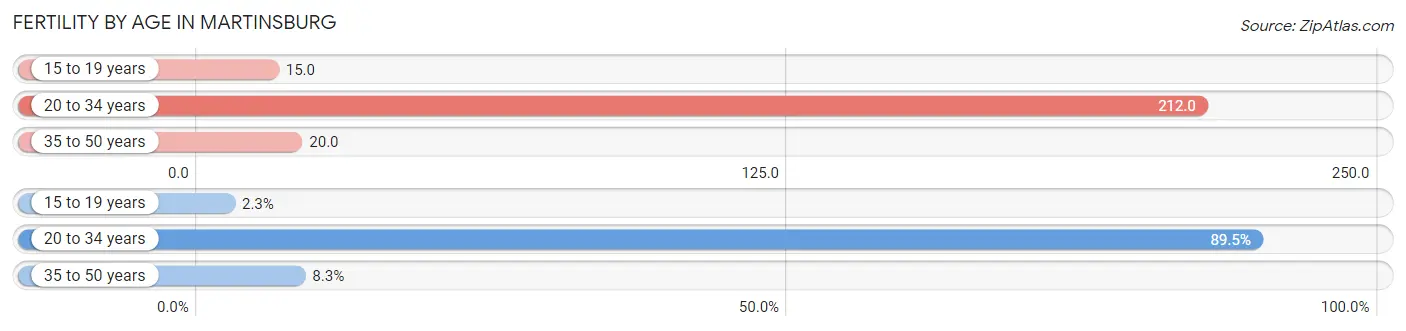
| Age Bracket | Women with Births | Births / 1,000 Women |
| 15 to 19 years | 10 (2.3%) | 15.0 |
| 20 to 34 years | 390 (89.4%) | 212.0 |
| 35 to 50 years | 36 (8.3%) | 20.0 |
| Total | 436 (100.0%) | 101.0 |
Fertility by Age by Marriage Status in Martinsburg
37.2% of women with births (436) in Martinsburg are married. The highest percentage of unmarried women with births falls into 15 to 19 years age bracket with 100.0% of them unmarried at the time of birth, while the lowest percentage of unmarried women with births belong to 20 to 34 years age bracket with 58.5% of them unmarried.
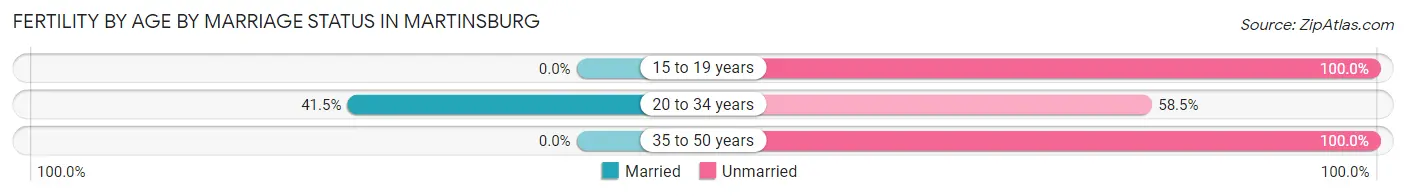
| Age Bracket | Married | Unmarried |
| 15 to 19 years | 0 (0.0%) | 10 (100.0%) |
| 20 to 34 years | 162 (41.5%) | 228 (58.5%) |
| 35 to 50 years | 0 (0.0%) | 36 (100.0%) |
| Total | 162 (37.2%) | 274 (62.8%) |
Fertility by Education in Martinsburg
Average fertility rate in Martinsburg is 101.0 births per 1,000 women. Women with the education attainment of high school diploma have the highest fertility rate of 233.0 births per 1,000 women, while women with the education attainment of less than high school have the lowest fertility at 25.0 births per 1,000 women. Women with the education attainment of high school diploma represent 75.5% of all women with births.
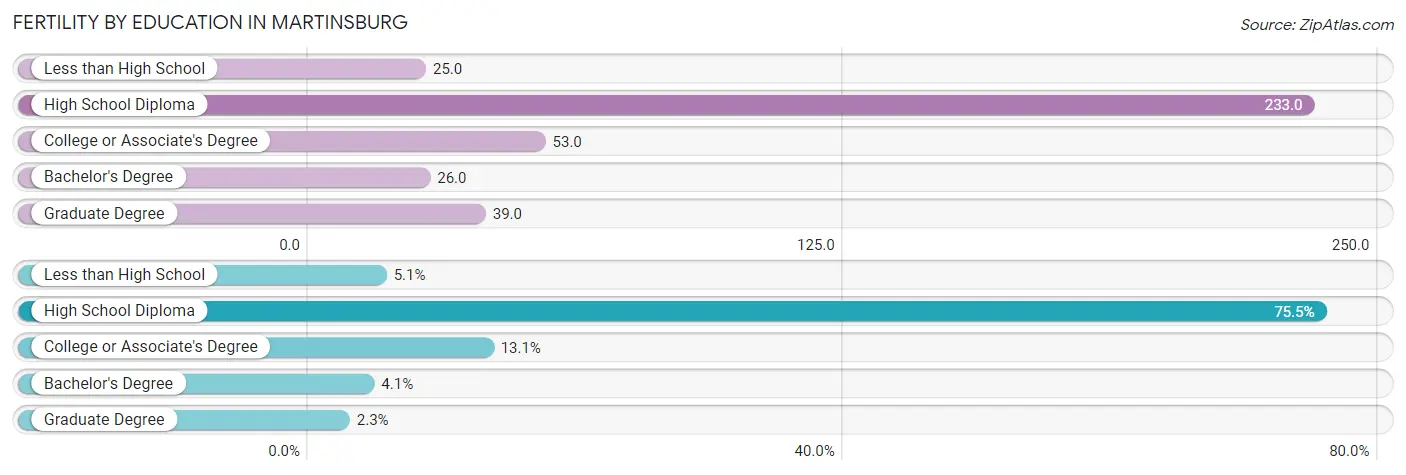
| Educational Attainment | Women with Births | Births / 1,000 Women |
| Less than High School | 22 (5.1%) | 25.0 |
| High School Diploma | 329 (75.5%) | 233.0 |
| College or Associate's Degree | 57 (13.1%) | 53.0 |
| Bachelor's Degree | 18 (4.1%) | 26.0 |
| Graduate Degree | 10 (2.3%) | 39.0 |
| Total | 436 (100.0%) | 101.0 |
Fertility by Education by Marriage Status in Martinsburg
62.8% of women with births in Martinsburg are unmarried. Women with the educational attainment of bachelor's degree are most likely to be married with 100.0% of them married at childbirth, while women with the educational attainment of less than high school are least likely to be married with 100.0% of them unmarried at childbirth.
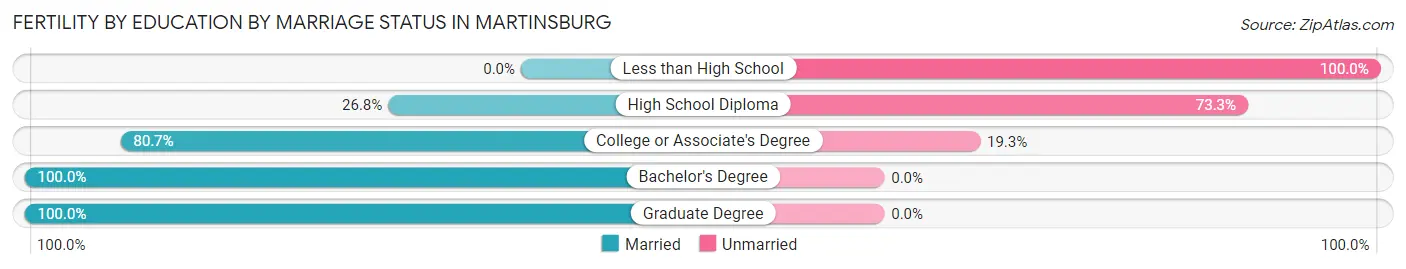
| Educational Attainment | Married | Unmarried |
| Less than High School | 0 (0.0%) | 22 (100.0%) |
| High School Diploma | 88 (26.8%) | 241 (73.3%) |
| College or Associate's Degree | 46 (80.7%) | 11 (19.3%) |
| Bachelor's Degree | 18 (100.0%) | 0 (0.0%) |
| Graduate Degree | 10 (100.0%) | 0 (0.0%) |
| Total | 162 (37.2%) | 274 (62.8%) |
Employment Characteristics in Martinsburg
Employment by Class of Employer in Martinsburg
Among the 8,743 employed individuals in Martinsburg, private company employees (6,160 | 70.5%), local government employees (584 | 6.7%), and state government employees (518 | 5.9%) make up the most common classes of employment.
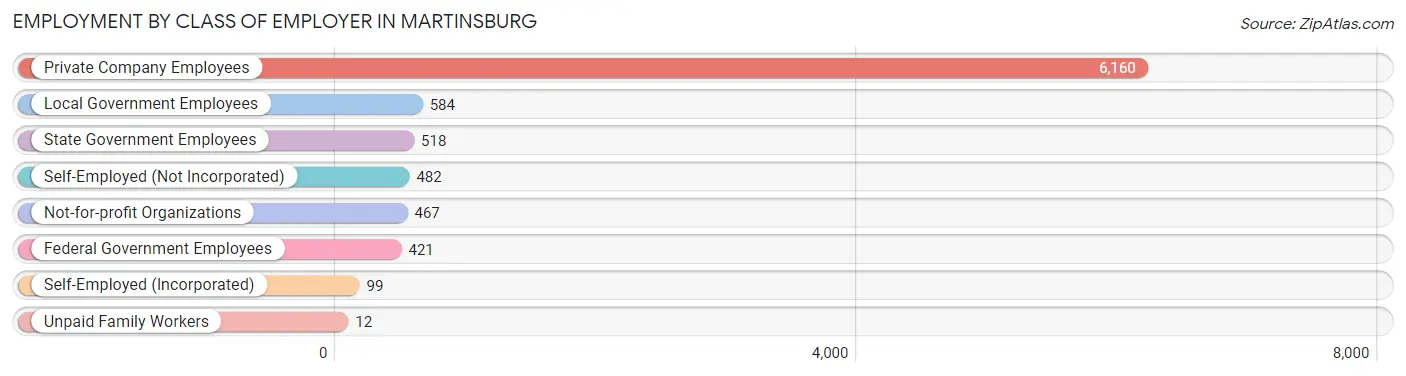
| Employer Class | # Employees | % Employees |
| Private Company Employees | 6,160 | 70.5% |
| Self-Employed (Incorporated) | 99 | 1.1% |
| Self-Employed (Not Incorporated) | 482 | 5.5% |
| Not-for-profit Organizations | 467 | 5.3% |
| Local Government Employees | 584 | 6.7% |
| State Government Employees | 518 | 5.9% |
| Federal Government Employees | 421 | 4.8% |
| Unpaid Family Workers | 12 | 0.1% |
| Total | 8,743 | 100.0% |
Employment Status by Age in Martinsburg
According to the labor force statistics for Martinsburg, out of the total population over 16 years of age (14,693), 66.0% or 9,697 individuals are in the labor force, with 9.1% or 882 of them unemployed. The age group with the highest labor force participation rate is 35 to 44 years, with 90.4% or 2,105 individuals in the labor force. Within the labor force, the 16 to 19 years age range has the highest percentage of unemployed individuals, with 19.6% or 112 of them being unemployed.
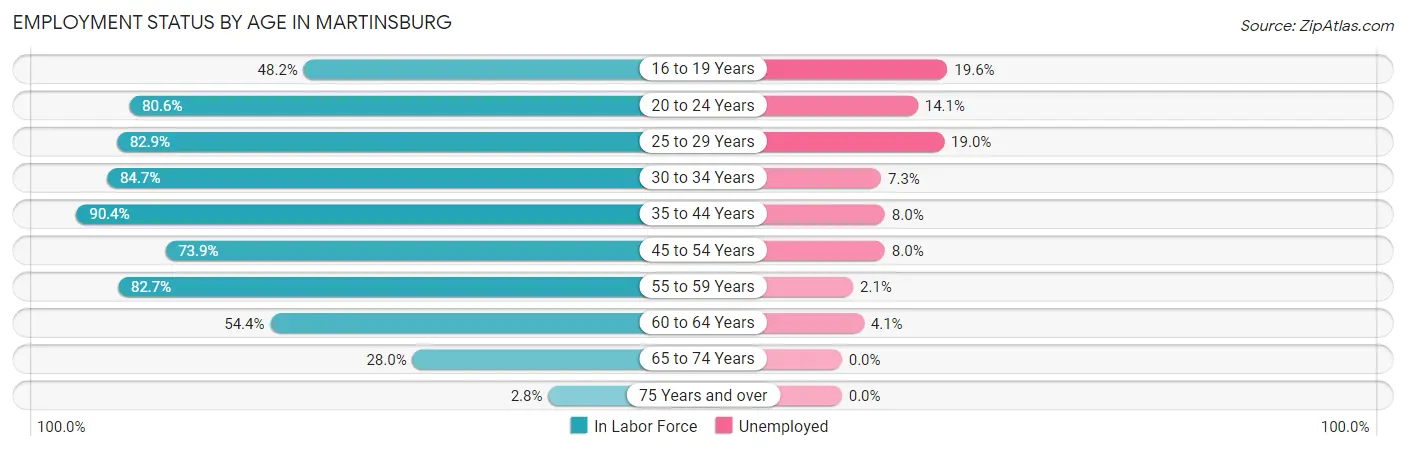
| Age Bracket | In Labor Force | Unemployed |
| 16 to 19 Years | 571 (48.2%) | 112 (19.6%) |
| 20 to 24 Years | 997 (80.6%) | 141 (14.1%) |
| 25 to 29 Years | 1,103 (82.9%) | 210 (19.0%) |
| 30 to 34 Years | 1,143 (84.7%) | 83 (7.3%) |
| 35 to 44 Years | 2,105 (90.4%) | 168 (8.0%) |
| 45 to 54 Years | 1,476 (73.9%) | 118 (8.0%) |
| 55 to 59 Years | 1,078 (82.7%) | 23 (2.1%) |
| 60 to 64 Years | 632 (54.4%) | 26 (4.1%) |
| 65 to 74 Years | 565 (28.0%) | 0 (0.0%) |
| 75 Years and over | 22 (2.8%) | 0 (0.0%) |
| Total | 9,697 (66.0%) | 882 (9.1%) |
Employment Status by Educational Attainment in Martinsburg
According to labor force statistics for Martinsburg, 79.6% of individuals (7,540) out of the total population between 25 and 64 years of age (9,472) are in the labor force, with 8.4% or 633 of them being unemployed. The group with the highest labor force participation rate are those with the educational attainment of bachelor's degree or higher, with 88.7% or 1,850 individuals in the labor force. Within the labor force, individuals with less than high school education have the highest percentage of unemployment, with 27.1% or 180 of them being unemployed.
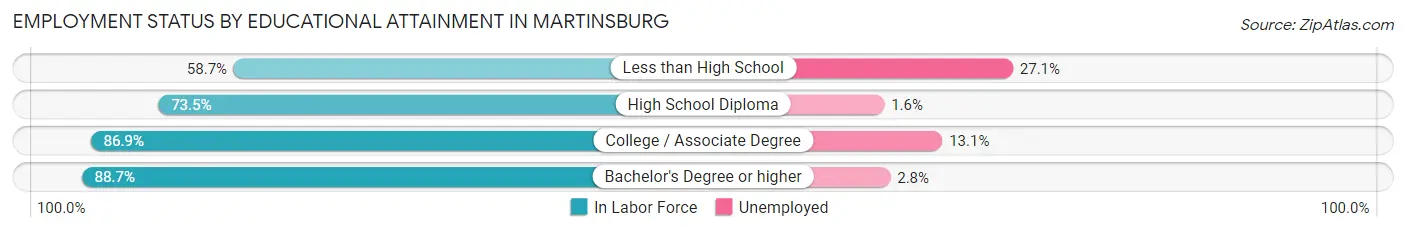
| Educational Attainment | In Labor Force | Unemployed |
| Less than High School | 665 (58.7%) | 307 (27.1%) |
| High School Diploma | 2,260 (73.5%) | 49 (1.6%) |
| College / Associate Degree | 2,762 (86.9%) | 416 (13.1%) |
| Bachelor's Degree or higher | 1,850 (88.7%) | 58 (2.8%) |
| Total | 7,540 (79.6%) | 796 (8.4%) |
Employment Occupations by Sex in Martinsburg
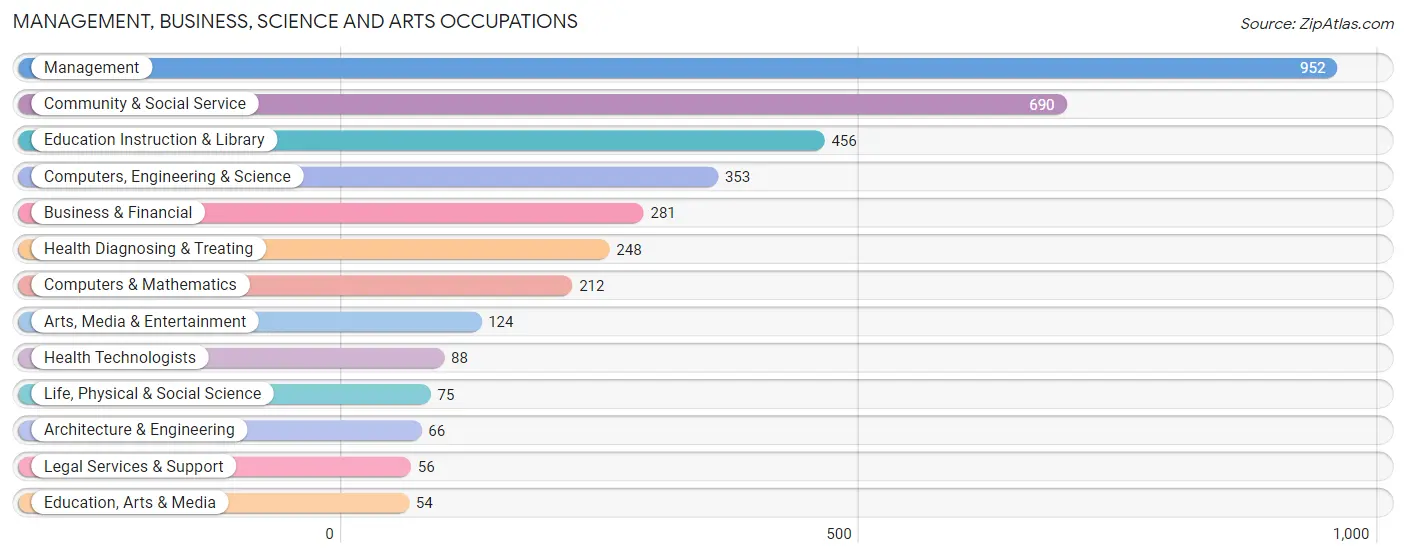
Management, Business, Science and Arts Occupations
The most common Management, Business, Science and Arts occupations in Martinsburg are Management (952 | 10.8%), Community & Social Service (690 | 7.8%), Education Instruction & Library (456 | 5.2%), Computers, Engineering & Science (353 | 4.0%), and Business & Financial (281 | 3.2%).
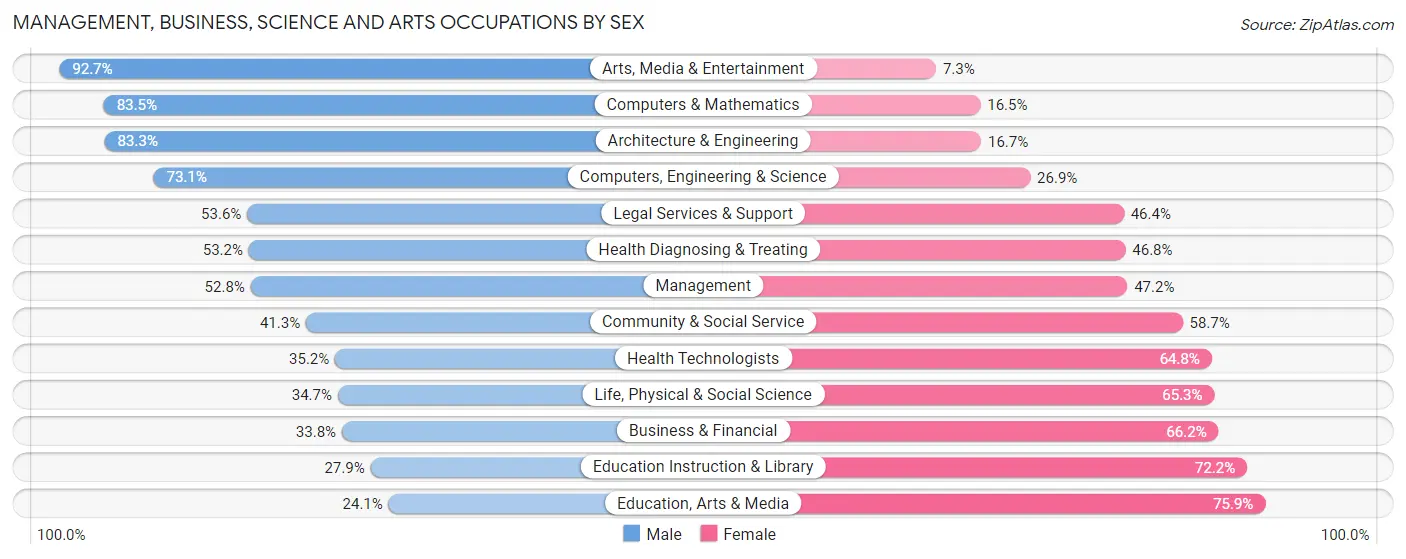
Management, Business, Science and Arts Occupations by Sex
Within the Management, Business, Science and Arts occupations in Martinsburg, the most male-oriented occupations are Arts, Media & Entertainment (92.7%), Computers & Mathematics (83.5%), and Architecture & Engineering (83.3%), while the most female-oriented occupations are Education, Arts & Media (75.9%), Education Instruction & Library (72.2%), and Business & Financial (66.2%).
| Occupation | Male | Female |
| Management | 503 (52.8%) | 449 (47.2%) |
| Business & Financial | 95 (33.8%) | 186 (66.2%) |
| Computers, Engineering & Science | 258 (73.1%) | 95 (26.9%) |
| Computers & Mathematics | 177 (83.5%) | 35 (16.5%) |
| Architecture & Engineering | 55 (83.3%) | 11 (16.7%) |
| Life, Physical & Social Science | 26 (34.7%) | 49 (65.3%) |
| Community & Social Service | 285 (41.3%) | 405 (58.7%) |
| Education, Arts & Media | 13 (24.1%) | 41 (75.9%) |
| Legal Services & Support | 30 (53.6%) | 26 (46.4%) |
| Education Instruction & Library | 127 (27.9%) | 329 (72.2%) |
| Arts, Media & Entertainment | 115 (92.7%) | 9 (7.3%) |
| Health Diagnosing & Treating | 132 (53.2%) | 116 (46.8%) |
| Health Technologists | 31 (35.2%) | 57 (64.8%) |
| Total (Category) | 1,273 (50.4%) | 1,251 (49.6%) |
| Total (Overall) | 5,018 (57.0%) | 3,781 (43.0%) |
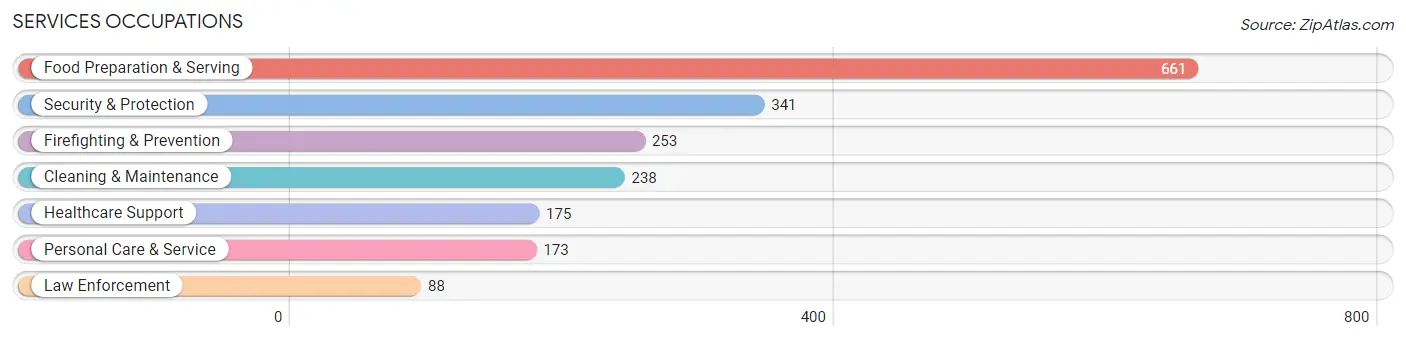
Services Occupations
The most common Services occupations in Martinsburg are Food Preparation & Serving (661 | 7.5%), Security & Protection (341 | 3.9%), Firefighting & Prevention (253 | 2.9%), Cleaning & Maintenance (238 | 2.7%), and Healthcare Support (175 | 2.0%).
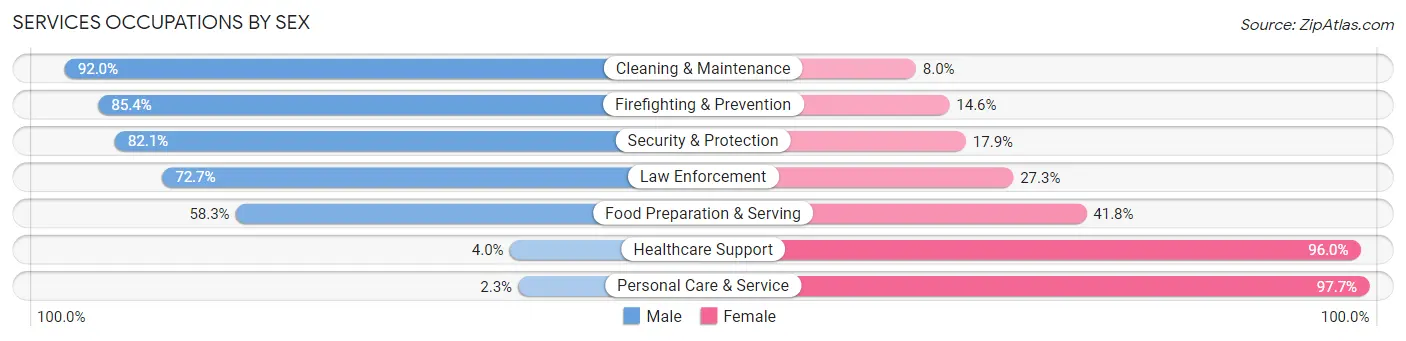
Services Occupations by Sex
Within the Services occupations in Martinsburg, the most male-oriented occupations are Cleaning & Maintenance (92.0%), Firefighting & Prevention (85.4%), and Security & Protection (82.1%), while the most female-oriented occupations are Personal Care & Service (97.7%), Healthcare Support (96.0%), and Food Preparation & Serving (41.7%).
| Occupation | Male | Female |
| Healthcare Support | 7 (4.0%) | 168 (96.0%) |
| Security & Protection | 280 (82.1%) | 61 (17.9%) |
| Firefighting & Prevention | 216 (85.4%) | 37 (14.6%) |
| Law Enforcement | 64 (72.7%) | 24 (27.3%) |
| Food Preparation & Serving | 385 (58.3%) | 276 (41.7%) |
| Cleaning & Maintenance | 219 (92.0%) | 19 (8.0%) |
| Personal Care & Service | 4 (2.3%) | 169 (97.7%) |
| Total (Category) | 895 (56.4%) | 693 (43.6%) |
| Total (Overall) | 5,018 (57.0%) | 3,781 (43.0%) |
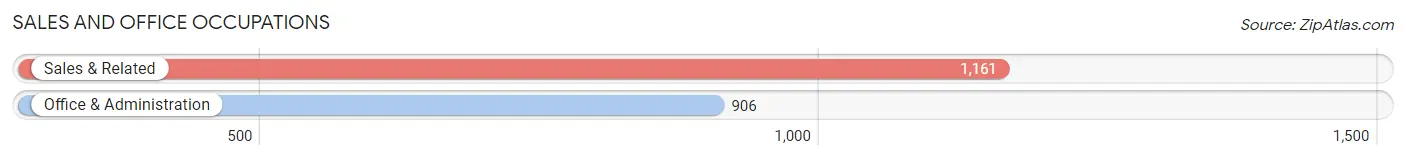
Sales and Office Occupations
The most common Sales and Office occupations in Martinsburg are Sales & Related (1,161 | 13.2%), and Office & Administration (906 | 10.3%).
Sales and Office Occupations by Sex
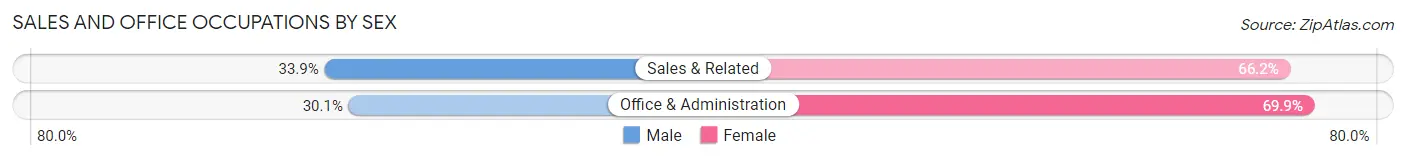
| Occupation | Male | Female |
| Sales & Related | 393 (33.9%) | 768 (66.1%) |
| Office & Administration | 273 (30.1%) | 633 (69.9%) |
| Total (Category) | 666 (32.2%) | 1,401 (67.8%) |
| Total (Overall) | 5,018 (57.0%) | 3,781 (43.0%) |
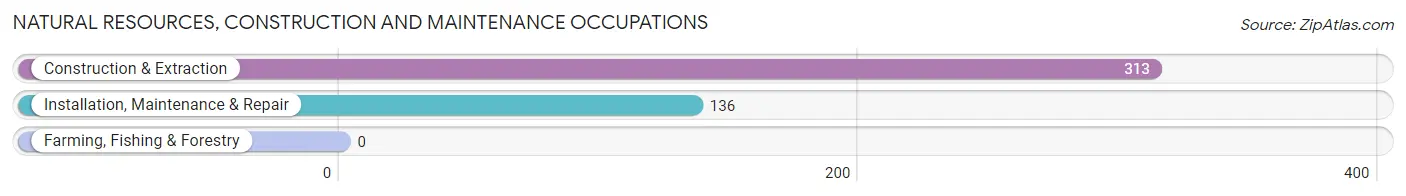
Natural Resources, Construction and Maintenance Occupations
The most common Natural Resources, Construction and Maintenance occupations in Martinsburg are Construction & Extraction (313 | 3.6%), and Installation, Maintenance & Repair (136 | 1.5%).
Natural Resources, Construction and Maintenance Occupations by Sex
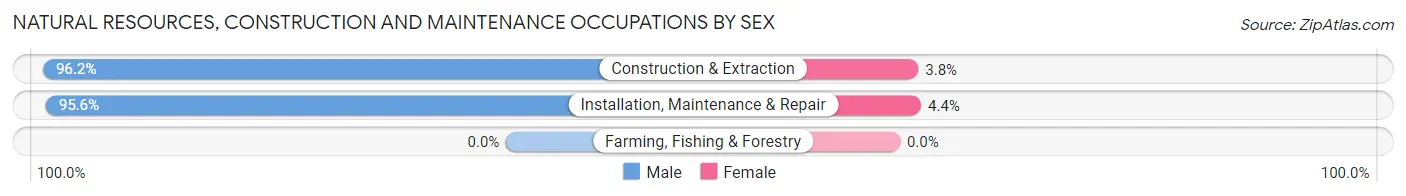
| Occupation | Male | Female |
| Farming, Fishing & Forestry | 0 (0.0%) | 0 (0.0%) |
| Construction & Extraction | 301 (96.2%) | 12 (3.8%) |
| Installation, Maintenance & Repair | 130 (95.6%) | 6 (4.4%) |
| Total (Category) | 431 (96.0%) | 18 (4.0%) |
| Total (Overall) | 5,018 (57.0%) | 3,781 (43.0%) |
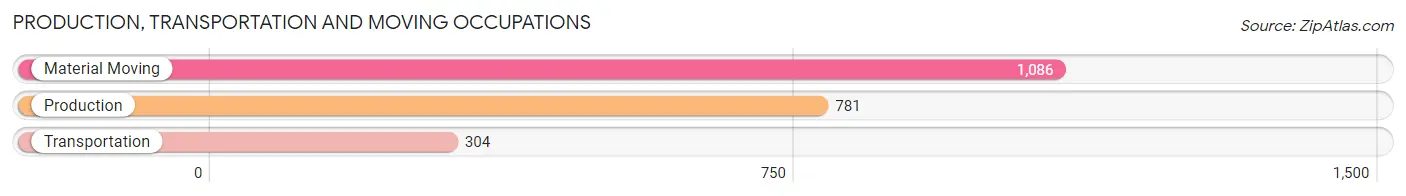
Production, Transportation and Moving Occupations
The most common Production, Transportation and Moving occupations in Martinsburg are Material Moving (1,086 | 12.3%), Production (781 | 8.9%), and Transportation (304 | 3.5%).
Production, Transportation and Moving Occupations by Sex
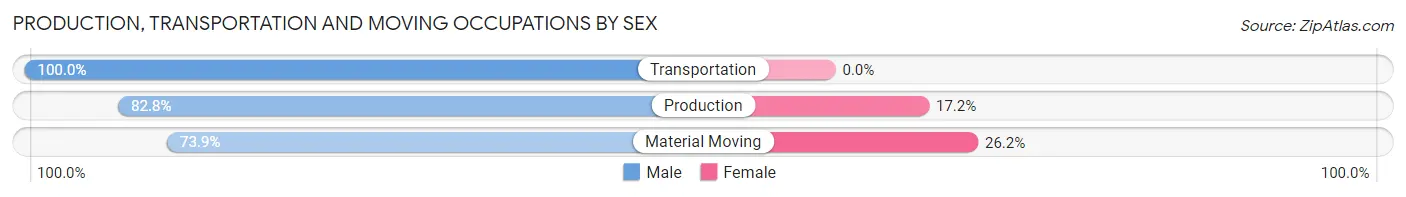
| Occupation | Male | Female |
| Production | 647 (82.8%) | 134 (17.2%) |
| Transportation | 304 (100.0%) | 0 (0.0%) |
| Material Moving | 802 (73.9%) | 284 (26.2%) |
| Total (Category) | 1,753 (80.7%) | 418 (19.3%) |
| Total (Overall) | 5,018 (57.0%) | 3,781 (43.0%) |
Employment Industries by Sex in Martinsburg
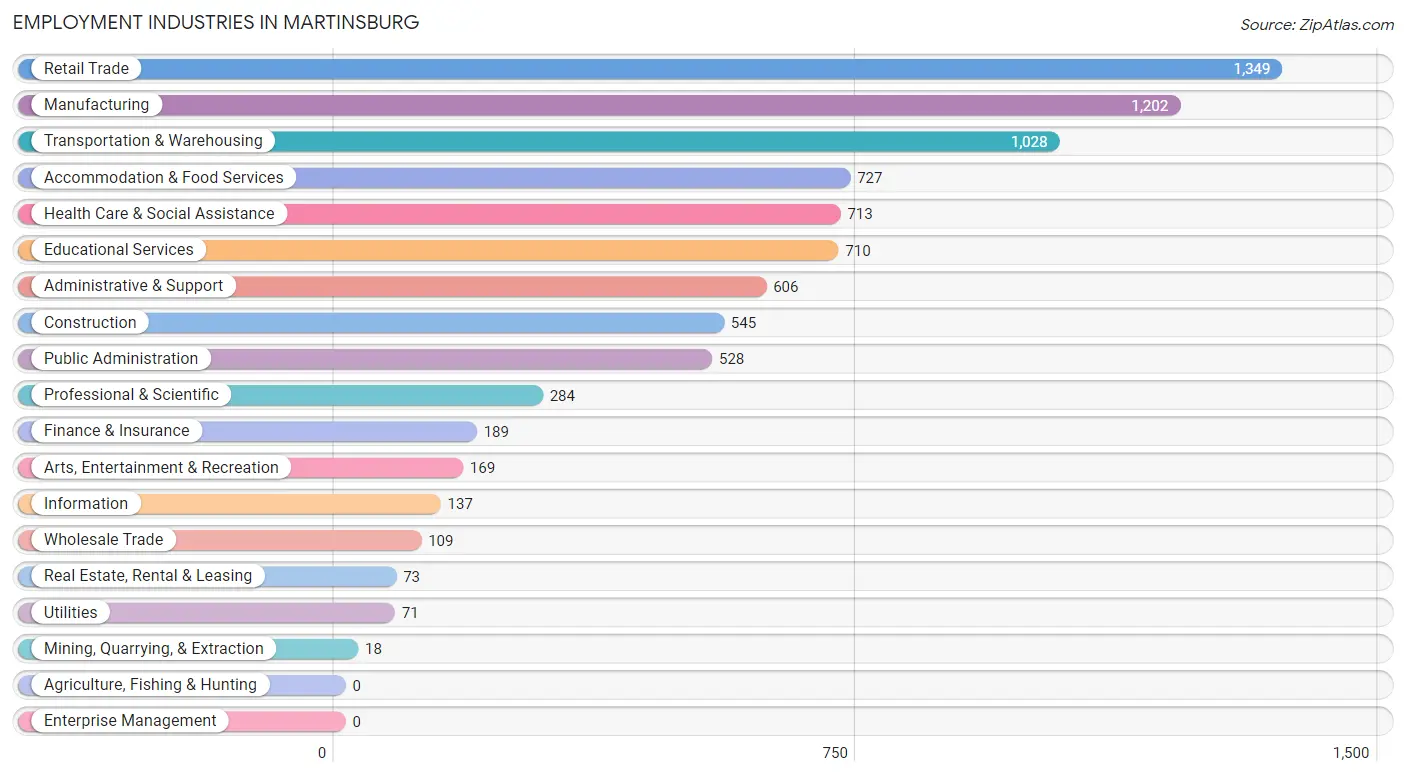
Employment Industries in Martinsburg
The major employment industries in Martinsburg include Retail Trade (1,349 | 15.3%), Manufacturing (1,202 | 13.7%), Transportation & Warehousing (1,028 | 11.7%), Accommodation & Food Services (727 | 8.3%), and Health Care & Social Assistance (713 | 8.1%).
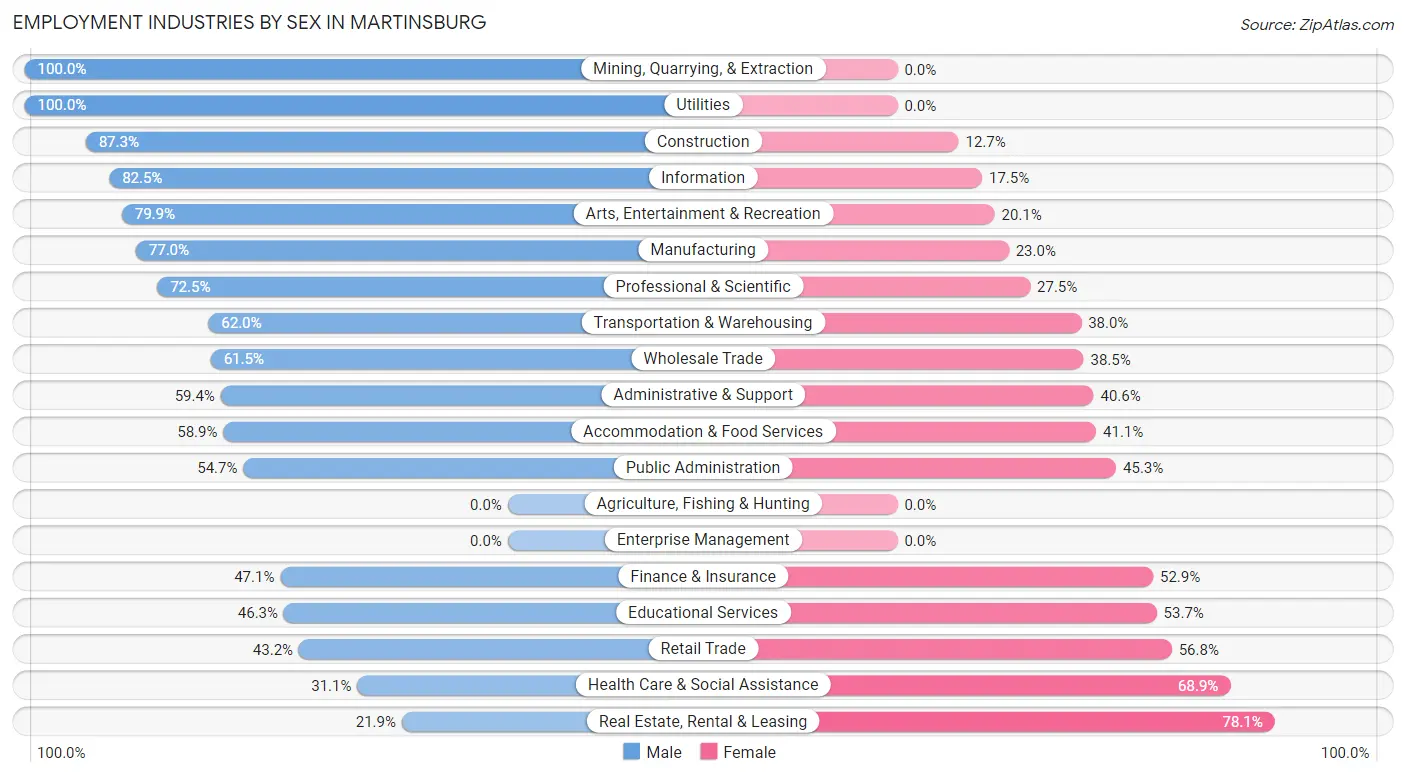
Employment Industries by Sex in Martinsburg
The Martinsburg industries that see more men than women are Mining, Quarrying, & Extraction (100.0%), Utilities (100.0%), and Construction (87.3%), whereas the industries that tend to have a higher number of women are Real Estate, Rental & Leasing (78.1%), Health Care & Social Assistance (68.9%), and Retail Trade (56.8%).
| Industry | Male | Female |
| Agriculture, Fishing & Hunting | 0 (0.0%) | 0 (0.0%) |
| Mining, Quarrying, & Extraction | 18 (100.0%) | 0 (0.0%) |
| Construction | 476 (87.3%) | 69 (12.7%) |
| Manufacturing | 925 (77.0%) | 277 (23.0%) |
| Wholesale Trade | 67 (61.5%) | 42 (38.5%) |
| Retail Trade | 583 (43.2%) | 766 (56.8%) |
| Transportation & Warehousing | 637 (62.0%) | 391 (38.0%) |
| Utilities | 71 (100.0%) | 0 (0.0%) |
| Information | 113 (82.5%) | 24 (17.5%) |
| Finance & Insurance | 89 (47.1%) | 100 (52.9%) |
| Real Estate, Rental & Leasing | 16 (21.9%) | 57 (78.1%) |
| Professional & Scientific | 206 (72.5%) | 78 (27.5%) |
| Enterprise Management | 0 (0.0%) | 0 (0.0%) |
| Administrative & Support | 360 (59.4%) | 246 (40.6%) |
| Educational Services | 329 (46.3%) | 381 (53.7%) |
| Health Care & Social Assistance | 222 (31.1%) | 491 (68.9%) |
| Arts, Entertainment & Recreation | 135 (79.9%) | 34 (20.1%) |
| Accommodation & Food Services | 428 (58.9%) | 299 (41.1%) |
| Public Administration | 289 (54.7%) | 239 (45.3%) |
| Total | 5,018 (57.0%) | 3,781 (43.0%) |
Education in Martinsburg
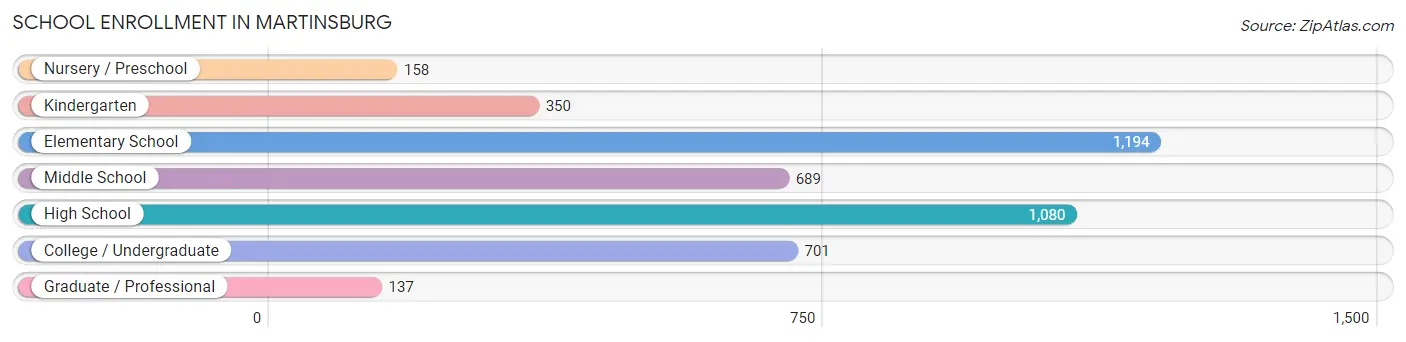
School Enrollment in Martinsburg
The most common levels of schooling among the 4,309 students in Martinsburg are elementary school (1,194 | 27.7%), high school (1,080 | 25.1%), and college / undergraduate (701 | 16.3%).
| School Level | # Students | % Students |
| Nursery / Preschool | 158 | 3.7% |
| Kindergarten | 350 | 8.1% |
| Elementary School | 1,194 | 27.7% |
| Middle School | 689 | 16.0% |
| High School | 1,080 | 25.1% |
| College / Undergraduate | 701 | 16.3% |
| Graduate / Professional | 137 | 3.2% |
| Total | 4,309 | 100.0% |
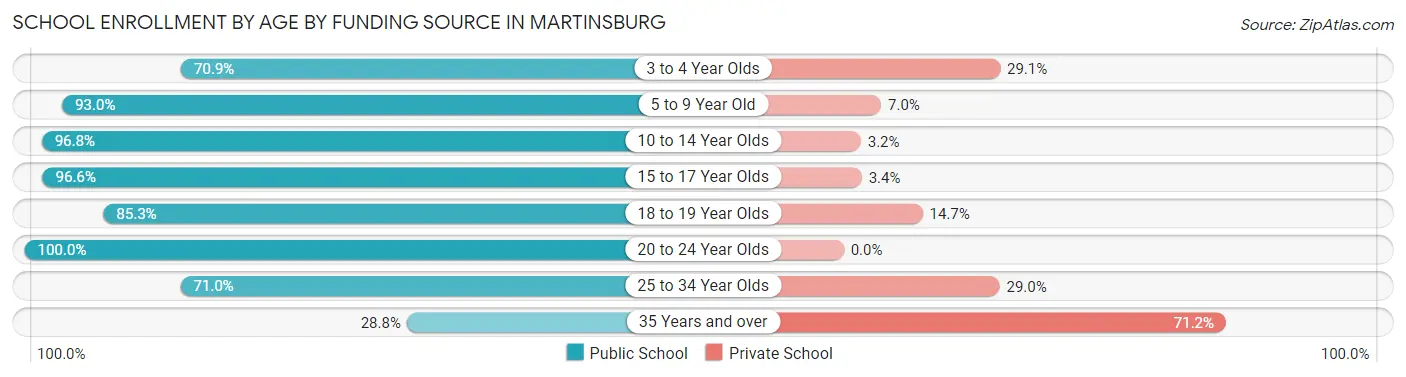
School Enrollment by Age by Funding Source in Martinsburg
Out of a total of 4,309 students who are enrolled in schools in Martinsburg, 543 (12.6%) attend a private institution, while the remaining 3,766 (87.4%) are enrolled in public schools. The age group of 35 years and over has the highest likelihood of being enrolled in private schools, with 289 (71.2% in the age bracket) enrolled. Conversely, the age group of 20 to 24 year olds has the lowest likelihood of being enrolled in a private school, with 181 (100.0% in the age bracket) attending a public institution.
| Age Bracket | Public School | Private School |
| 3 to 4 Year Olds | 73 (70.9%) | 30 (29.1%) |
| 5 to 9 Year Old | 1,308 (93.0%) | 98 (7.0%) |
| 10 to 14 Year Olds | 1,185 (96.8%) | 39 (3.2%) |
| 15 to 17 Year Olds | 632 (96.6%) | 22 (3.4%) |
| 18 to 19 Year Olds | 180 (85.3%) | 31 (14.7%) |
| 20 to 24 Year Olds | 181 (100.0%) | 0 (0.0%) |
| 25 to 34 Year Olds | 88 (71.0%) | 36 (29.0%) |
| 35 Years and over | 117 (28.8%) | 289 (71.2%) |
| Total | 3,766 (87.4%) | 543 (12.6%) |
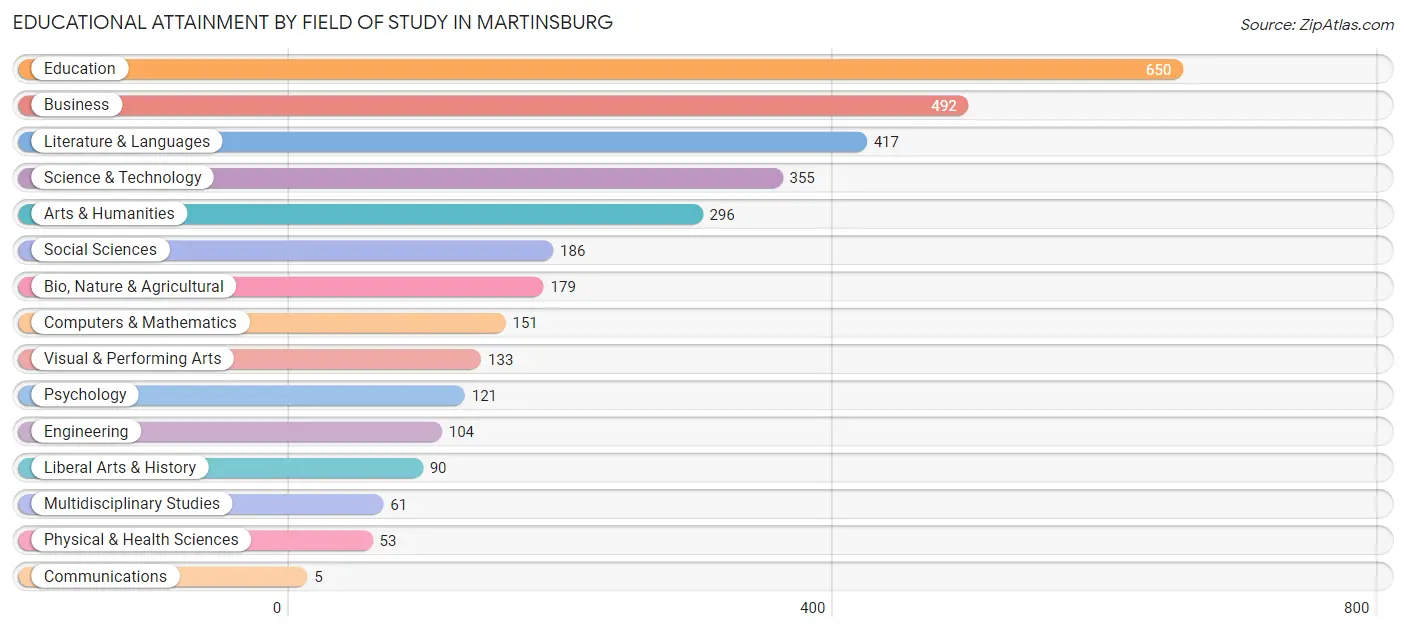
Educational Attainment by Field of Study in Martinsburg
Education (650 | 19.7%), business (492 | 14.9%), literature & languages (417 | 12.7%), science & technology (355 | 10.8%), and arts & humanities (296 | 9.0%) are the most common fields of study among 3,293 individuals in Martinsburg who have obtained a bachelor's degree or higher.
| Field of Study | # Graduates | % Graduates |
| Computers & Mathematics | 151 | 4.6% |
| Bio, Nature & Agricultural | 179 | 5.4% |
| Physical & Health Sciences | 53 | 1.6% |
| Psychology | 121 | 3.7% |
| Social Sciences | 186 | 5.7% |
| Engineering | 104 | 3.2% |
| Multidisciplinary Studies | 61 | 1.8% |
| Science & Technology | 355 | 10.8% |
| Business | 492 | 14.9% |
| Education | 650 | 19.7% |
| Literature & Languages | 417 | 12.7% |
| Liberal Arts & History | 90 | 2.7% |
| Visual & Performing Arts | 133 | 4.0% |
| Communications | 5 | 0.2% |
| Arts & Humanities | 296 | 9.0% |
| Total | 3,293 | 100.0% |
Transportation & Commute in Martinsburg
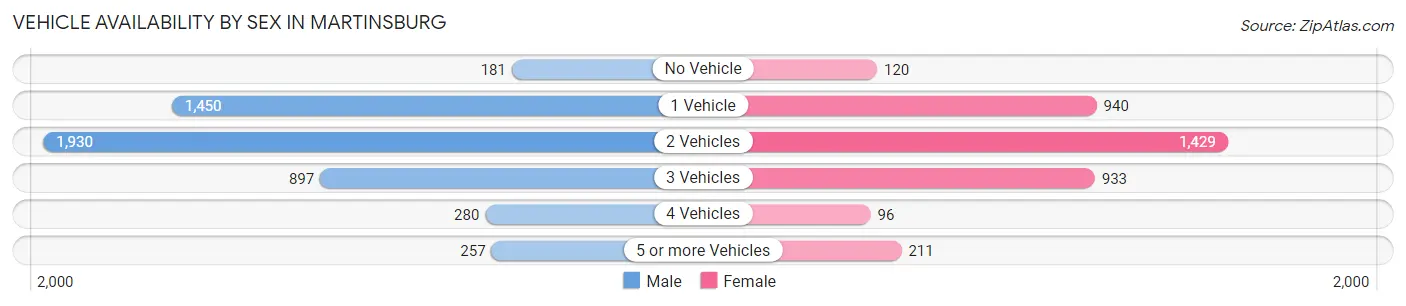
Vehicle Availability by Sex in Martinsburg
The most prevalent vehicle ownership categories in Martinsburg are males with 2 vehicles (1,930, accounting for 38.6%) and females with 2 vehicles (1,429, making up 51.8%).
| Vehicles Available | Male | Female |
| No Vehicle | 181 (3.6%) | 120 (3.2%) |
| 1 Vehicle | 1,450 (29.0%) | 940 (25.2%) |
| 2 Vehicles | 1,930 (38.6%) | 1,429 (38.3%) |
| 3 Vehicles | 897 (18.0%) | 933 (25.0%) |
| 4 Vehicles | 280 (5.6%) | 96 (2.6%) |
| 5 or more Vehicles | 257 (5.1%) | 211 (5.7%) |
| Total | 4,995 (100.0%) | 3,729 (100.0%) |
Commute Time in Martinsburg
The most frequently occuring commute durations in Martinsburg are 20 to 24 minutes (1,866 commuters, 22.9%), 15 to 19 minutes (1,318 commuters, 16.2%), and 30 to 34 minutes (1,169 commuters, 14.3%).
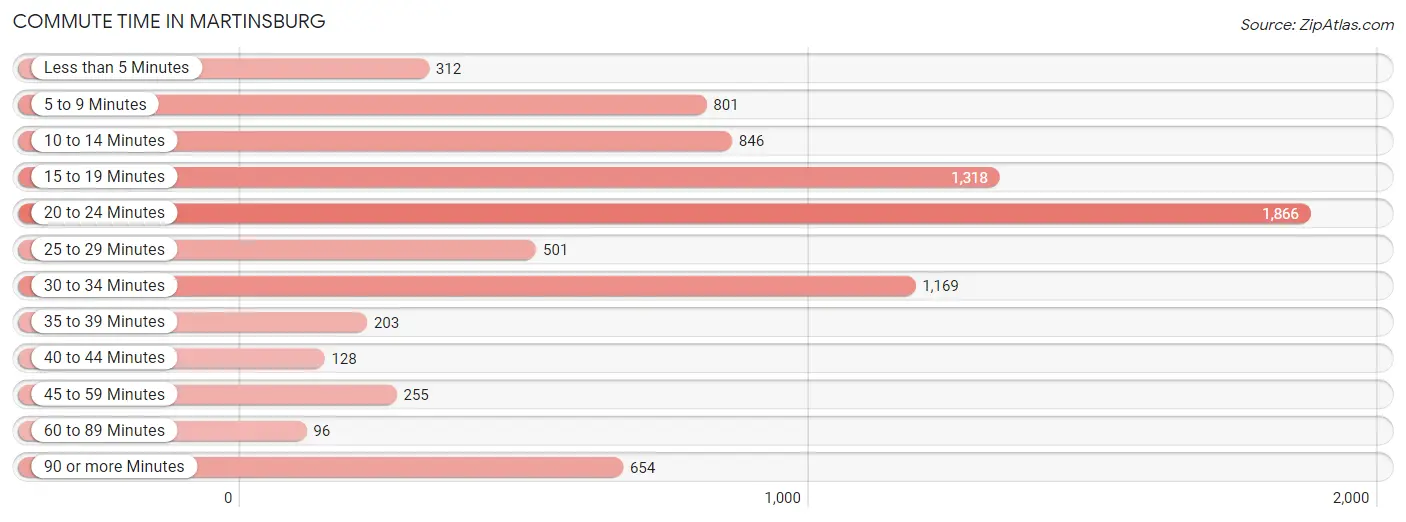
| Commute Time | # Commuters | % Commuters |
| Less than 5 Minutes | 312 | 3.8% |
| 5 to 9 Minutes | 801 | 9.8% |
| 10 to 14 Minutes | 846 | 10.4% |
| 15 to 19 Minutes | 1,318 | 16.2% |
| 20 to 24 Minutes | 1,866 | 22.9% |
| 25 to 29 Minutes | 501 | 6.1% |
| 30 to 34 Minutes | 1,169 | 14.3% |
| 35 to 39 Minutes | 203 | 2.5% |
| 40 to 44 Minutes | 128 | 1.6% |
| 45 to 59 Minutes | 255 | 3.1% |
| 60 to 89 Minutes | 96 | 1.2% |
| 90 or more Minutes | 654 | 8.0% |
Commute Time by Sex in Martinsburg
The most common commute times in Martinsburg are 20 to 24 minutes (1,359 commuters, 28.1%) for males and 15 to 19 minutes (680 commuters, 20.5%) for females.
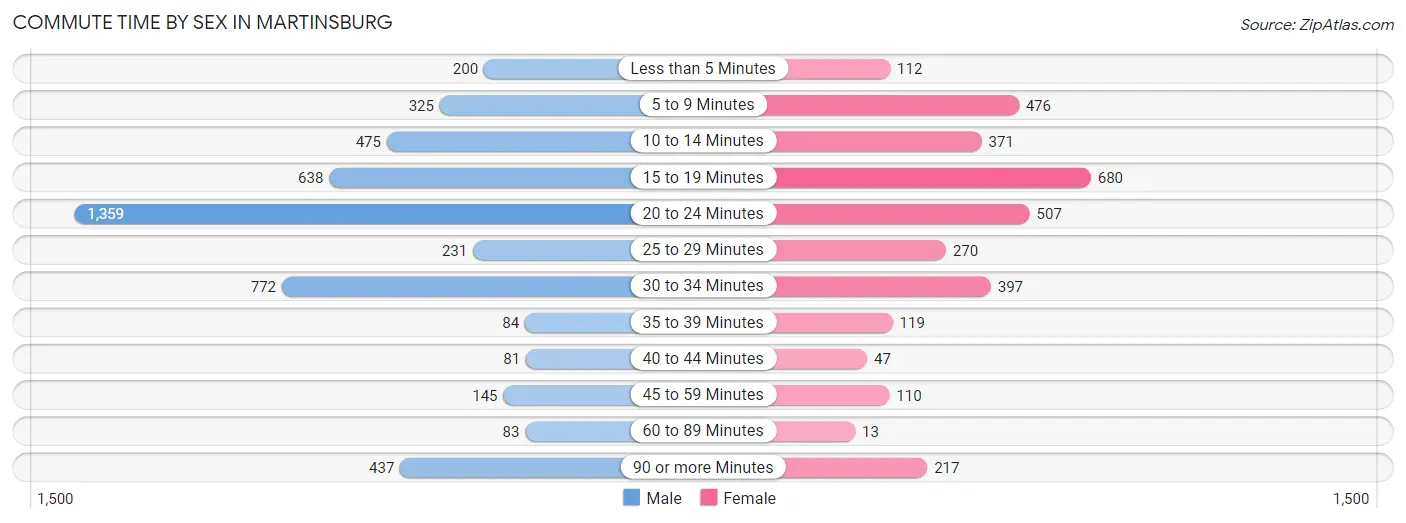
| Commute Time | Male | Female |
| Less than 5 Minutes | 200 (4.1%) | 112 (3.4%) |
| 5 to 9 Minutes | 325 (6.7%) | 476 (14.3%) |
| 10 to 14 Minutes | 475 (9.8%) | 371 (11.2%) |
| 15 to 19 Minutes | 638 (13.2%) | 680 (20.5%) |
| 20 to 24 Minutes | 1,359 (28.1%) | 507 (15.3%) |
| 25 to 29 Minutes | 231 (4.8%) | 270 (8.1%) |
| 30 to 34 Minutes | 772 (16.0%) | 397 (12.0%) |
| 35 to 39 Minutes | 84 (1.7%) | 119 (3.6%) |
| 40 to 44 Minutes | 81 (1.7%) | 47 (1.4%) |
| 45 to 59 Minutes | 145 (3.0%) | 110 (3.3%) |
| 60 to 89 Minutes | 83 (1.7%) | 13 (0.4%) |
| 90 or more Minutes | 437 (9.0%) | 217 (6.5%) |
Time of Departure to Work by Sex in Martinsburg
The most frequent times of departure to work in Martinsburg are 4:00 PM to 11:59 PM (958, 19.8%) for males and 4:00 PM to 11:59 PM (492, 14.8%) for females.
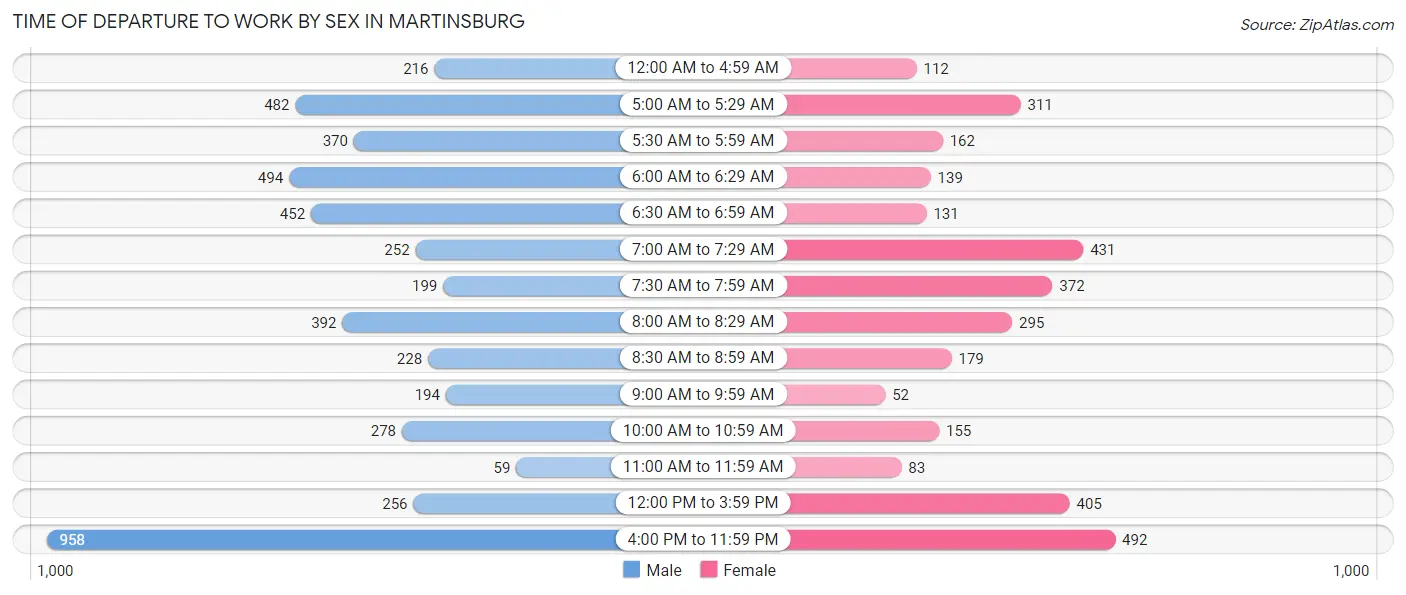
| Time of Departure | Male | Female |
| 12:00 AM to 4:59 AM | 216 (4.5%) | 112 (3.4%) |
| 5:00 AM to 5:29 AM | 482 (10.0%) | 311 (9.4%) |
| 5:30 AM to 5:59 AM | 370 (7.7%) | 162 (4.9%) |
| 6:00 AM to 6:29 AM | 494 (10.2%) | 139 (4.2%) |
| 6:30 AM to 6:59 AM | 452 (9.4%) | 131 (4.0%) |
| 7:00 AM to 7:29 AM | 252 (5.2%) | 431 (13.0%) |
| 7:30 AM to 7:59 AM | 199 (4.1%) | 372 (11.2%) |
| 8:00 AM to 8:29 AM | 392 (8.1%) | 295 (8.9%) |
| 8:30 AM to 8:59 AM | 228 (4.7%) | 179 (5.4%) |
| 9:00 AM to 9:59 AM | 194 (4.0%) | 52 (1.6%) |
| 10:00 AM to 10:59 AM | 278 (5.8%) | 155 (4.7%) |
| 11:00 AM to 11:59 AM | 59 (1.2%) | 83 (2.5%) |
| 12:00 PM to 3:59 PM | 256 (5.3%) | 405 (12.2%) |
| 4:00 PM to 11:59 PM | 958 (19.8%) | 492 (14.8%) |
| Total | 4,830 (100.0%) | 3,319 (100.0%) |
Housing Occupancy in Martinsburg
Occupancy by Ownership in Martinsburg
Of the total 7,590 dwellings in Martinsburg, owner-occupied units account for 3,735 (49.2%), while renter-occupied units make up 3,855 (50.8%).
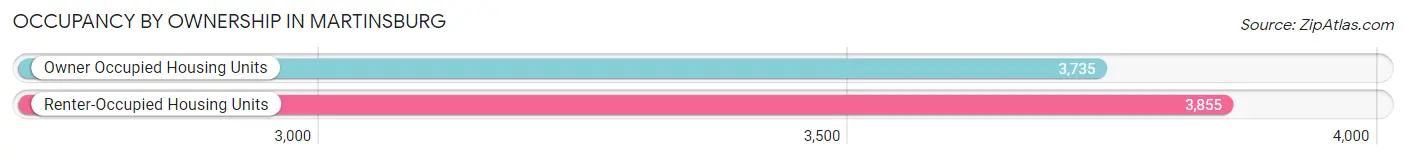
| Occupancy | # Housing Units | % Housing Units |
| Owner Occupied Housing Units | 3,735 | 49.2% |
| Renter-Occupied Housing Units | 3,855 | 50.8% |
| Total Occupied Housing Units | 7,590 | 100.0% |
Occupancy by Household Size in Martinsburg
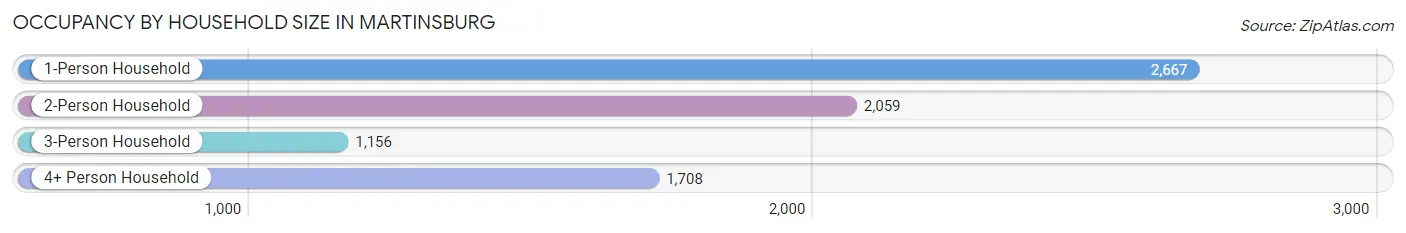
| Household Size | # Housing Units | % Housing Units |
| 1-Person Household | 2,667 | 35.1% |
| 2-Person Household | 2,059 | 27.1% |
| 3-Person Household | 1,156 | 15.2% |
| 4+ Person Household | 1,708 | 22.5% |
| Total Housing Units | 7,590 | 100.0% |
Occupancy by Ownership by Household Size in Martinsburg
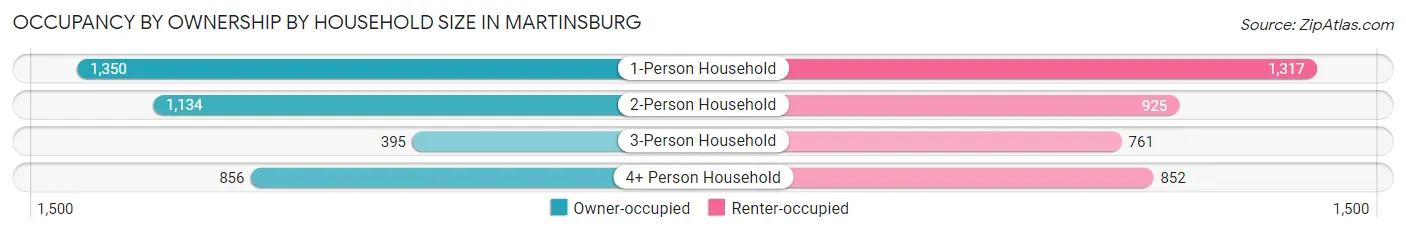
| Household Size | Owner-occupied | Renter-occupied |
| 1-Person Household | 1,350 (50.6%) | 1,317 (49.4%) |
| 2-Person Household | 1,134 (55.1%) | 925 (44.9%) |
| 3-Person Household | 395 (34.2%) | 761 (65.8%) |
| 4+ Person Household | 856 (50.1%) | 852 (49.9%) |
| Total Housing Units | 3,735 (49.2%) | 3,855 (50.8%) |
Occupancy by Educational Attainment in Martinsburg
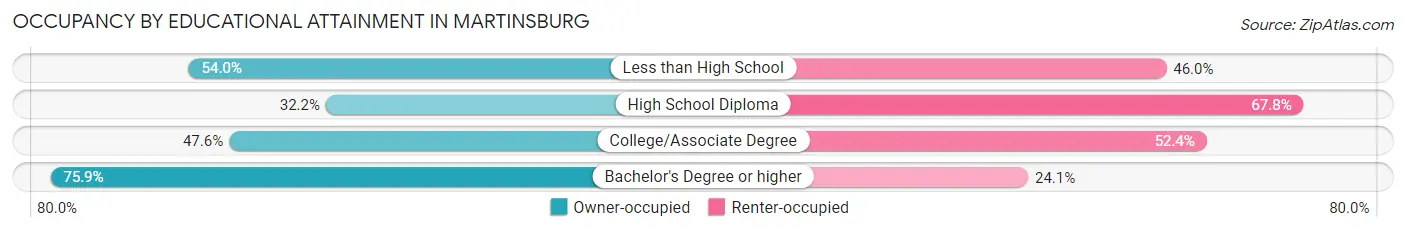
| Household Size | Owner-occupied | Renter-occupied |
| Less than High School | 224 (54.0%) | 191 (46.0%) |
| High School Diploma | 892 (32.2%) | 1,876 (67.8%) |
| College/Associate Degree | 1,220 (47.6%) | 1,344 (52.4%) |
| Bachelor's Degree or higher | 1,399 (75.9%) | 444 (24.1%) |
Occupancy by Age of Householder in Martinsburg
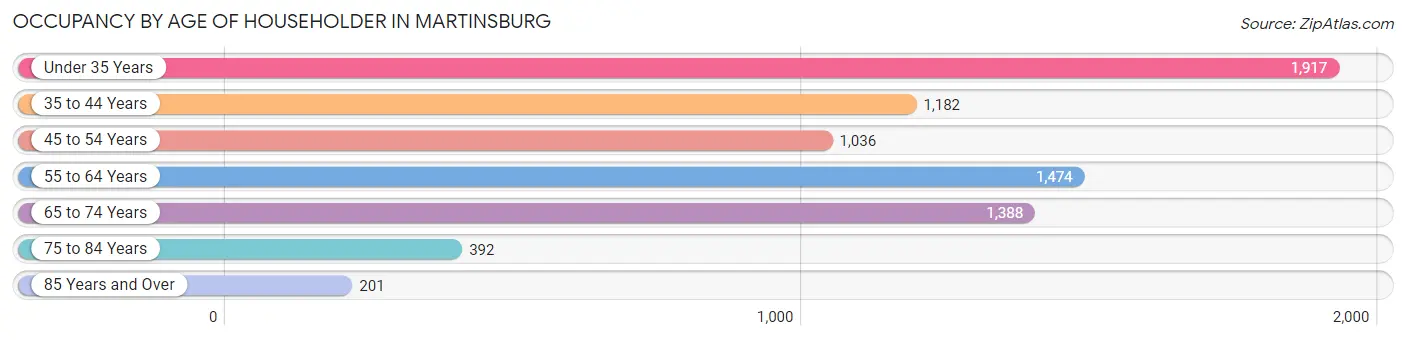
| Age Bracket | # Households | % Households |
| Under 35 Years | 1,917 | 25.3% |
| 35 to 44 Years | 1,182 | 15.6% |
| 45 to 54 Years | 1,036 | 13.7% |
| 55 to 64 Years | 1,474 | 19.4% |
| 65 to 74 Years | 1,388 | 18.3% |
| 75 to 84 Years | 392 | 5.2% |
| 85 Years and Over | 201 | 2.6% |
| Total | 7,590 | 100.0% |
Housing Finances in Martinsburg
Median Income by Occupancy in Martinsburg
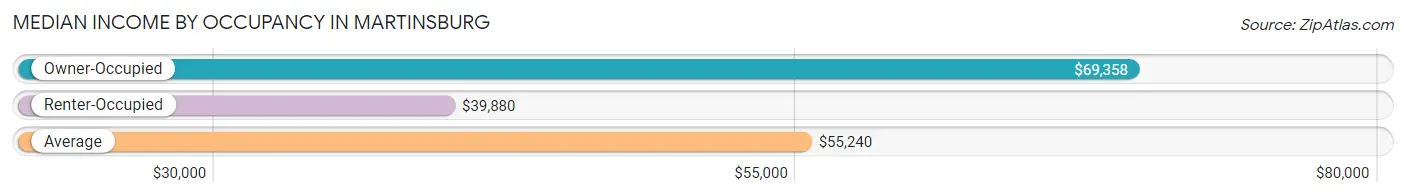
| Occupancy Type | # Households | Median Income |
| Owner-Occupied | 3,735 (49.2%) | $69,358 |
| Renter-Occupied | 3,855 (50.8%) | $39,880 |
| Average | 7,590 (100.0%) | $55,240 |
Occupancy by Householder Income Bracket in Martinsburg
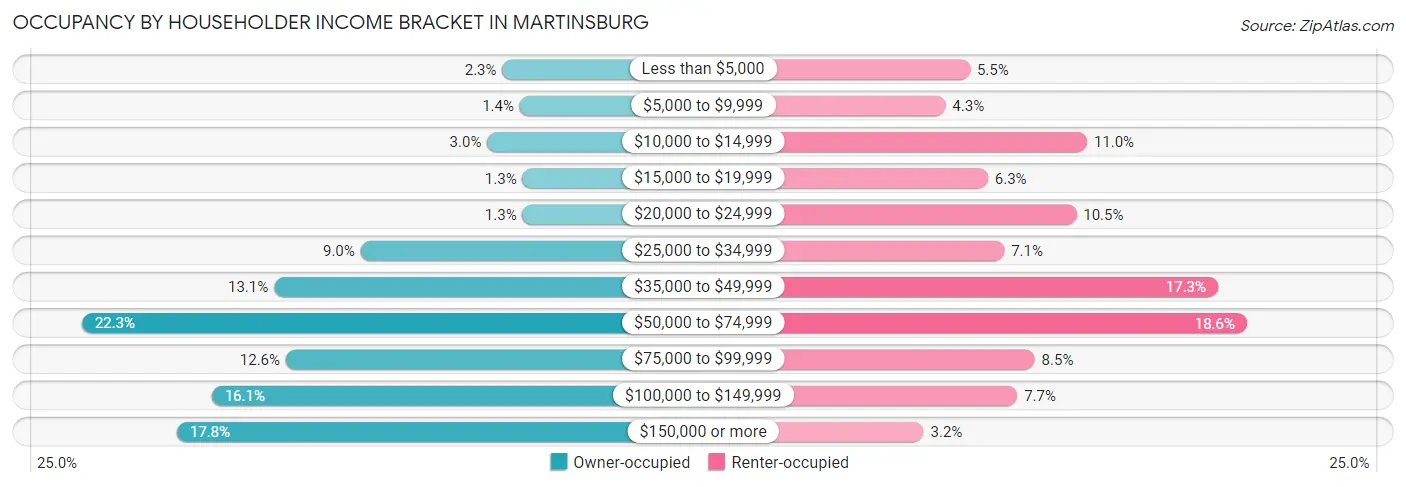
| Income Bracket | Owner-occupied | Renter-occupied |
| Less than $5,000 | 84 (2.2%) | 210 (5.4%) |
| $5,000 to $9,999 | 53 (1.4%) | 165 (4.3%) |
| $10,000 to $14,999 | 111 (3.0%) | 425 (11.0%) |
| $15,000 to $19,999 | 48 (1.3%) | 243 (6.3%) |
| $20,000 to $24,999 | 48 (1.3%) | 405 (10.5%) |
| $25,000 to $34,999 | 336 (9.0%) | 273 (7.1%) |
| $35,000 to $49,999 | 490 (13.1%) | 665 (17.2%) |
| $50,000 to $74,999 | 832 (22.3%) | 718 (18.6%) |
| $75,000 to $99,999 | 469 (12.6%) | 329 (8.5%) |
| $100,000 to $149,999 | 601 (16.1%) | 297 (7.7%) |
| $150,000 or more | 663 (17.7%) | 125 (3.2%) |
| Total | 3,735 (100.0%) | 3,855 (100.0%) |
Monthly Housing Cost Tiers in Martinsburg

| Monthly Cost | Owner-occupied | Renter-occupied |
| Less than $300 | 175 (4.7%) | 212 (5.5%) |
| $300 to $499 | 738 (19.8%) | 168 (4.4%) |
| $500 to $799 | 400 (10.7%) | 444 (11.5%) |
| $800 to $999 | 391 (10.5%) | 865 (22.4%) |
| $1,000 to $1,499 | 893 (23.9%) | 1,710 (44.4%) |
| $1,500 to $1,999 | 602 (16.1%) | 294 (7.6%) |
| $2,000 to $2,499 | 214 (5.7%) | 11 (0.3%) |
| $2,500 to $2,999 | 139 (3.7%) | 0 (0.0%) |
| $3,000 or more | 183 (4.9%) | 0 (0.0%) |
| Total | 3,735 (100.0%) | 3,855 (100.0%) |
Physical Housing Characteristics in Martinsburg
Housing Structures in Martinsburg
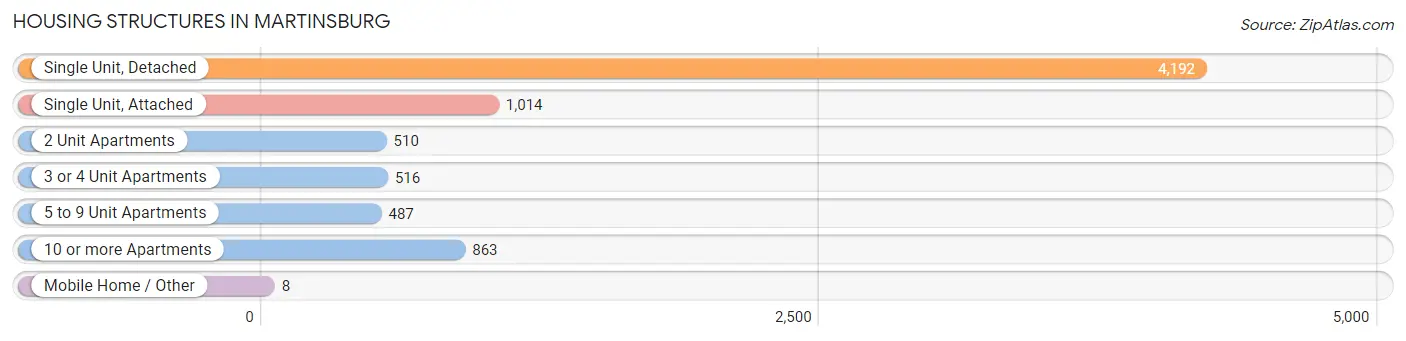
| Structure Type | # Housing Units | % Housing Units |
| Single Unit, Detached | 4,192 | 55.2% |
| Single Unit, Attached | 1,014 | 13.4% |
| 2 Unit Apartments | 510 | 6.7% |
| 3 or 4 Unit Apartments | 516 | 6.8% |
| 5 to 9 Unit Apartments | 487 | 6.4% |
| 10 or more Apartments | 863 | 11.4% |
| Mobile Home / Other | 8 | 0.1% |
| Total | 7,590 | 100.0% |
Housing Structures by Occupancy in Martinsburg
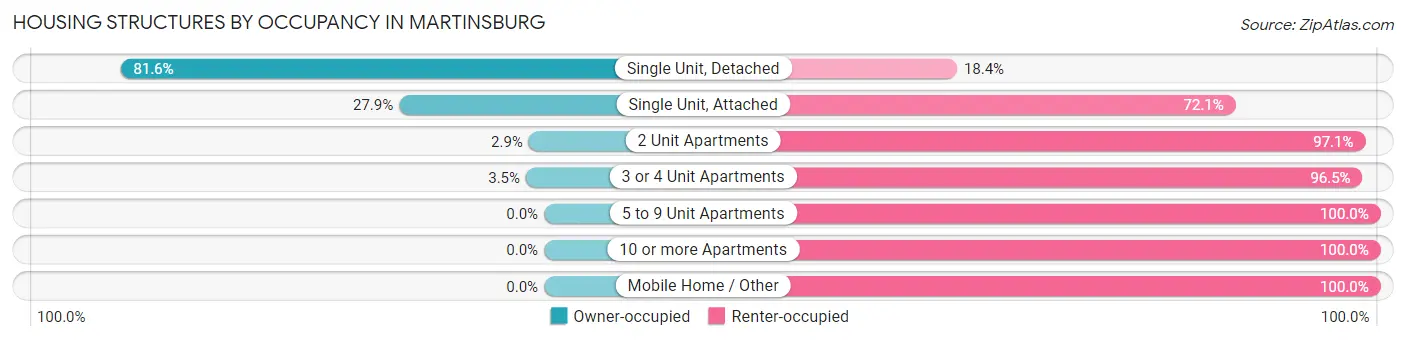
| Structure Type | Owner-occupied | Renter-occupied |
| Single Unit, Detached | 3,419 (81.6%) | 773 (18.4%) |
| Single Unit, Attached | 283 (27.9%) | 731 (72.1%) |
| 2 Unit Apartments | 15 (2.9%) | 495 (97.1%) |
| 3 or 4 Unit Apartments | 18 (3.5%) | 498 (96.5%) |
| 5 to 9 Unit Apartments | 0 (0.0%) | 487 (100.0%) |
| 10 or more Apartments | 0 (0.0%) | 863 (100.0%) |
| Mobile Home / Other | 0 (0.0%) | 8 (100.0%) |
| Total | 3,735 (49.2%) | 3,855 (50.8%) |
Housing Structures by Number of Rooms in Martinsburg
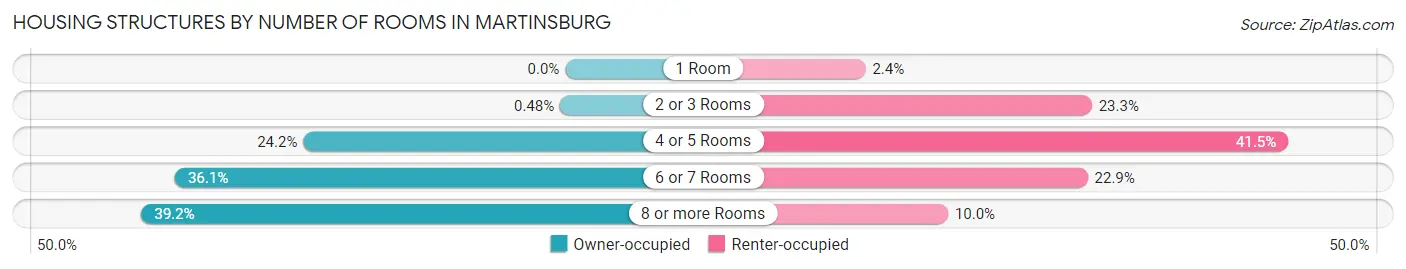
| Number of Rooms | Owner-occupied | Renter-occupied |
| 1 Room | 0 (0.0%) | 91 (2.4%) |
| 2 or 3 Rooms | 18 (0.5%) | 898 (23.3%) |
| 4 or 5 Rooms | 905 (24.2%) | 1,598 (41.4%) |
| 6 or 7 Rooms | 1,348 (36.1%) | 883 (22.9%) |
| 8 or more Rooms | 1,464 (39.2%) | 385 (10.0%) |
| Total | 3,735 (100.0%) | 3,855 (100.0%) |
Housing Structure by Heating Type in Martinsburg
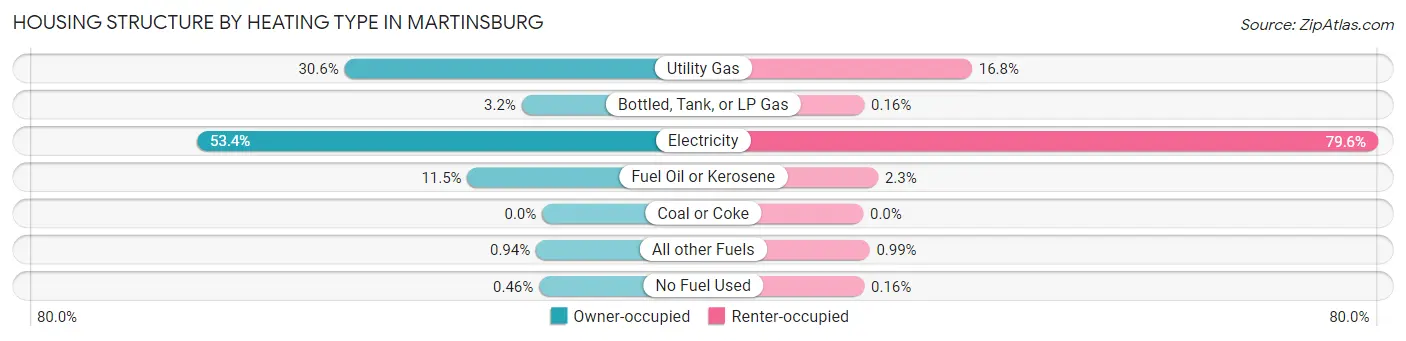
| Heating Type | Owner-occupied | Renter-occupied |
| Utility Gas | 1,141 (30.5%) | 648 (16.8%) |
| Bottled, Tank, or LP Gas | 118 (3.2%) | 6 (0.2%) |
| Electricity | 1,993 (53.4%) | 3,068 (79.6%) |
| Fuel Oil or Kerosene | 431 (11.5%) | 89 (2.3%) |
| Coal or Coke | 0 (0.0%) | 0 (0.0%) |
| All other Fuels | 35 (0.9%) | 38 (1.0%) |
| No Fuel Used | 17 (0.5%) | 6 (0.2%) |
| Total | 3,735 (100.0%) | 3,855 (100.0%) |
Household Vehicle Usage in Martinsburg
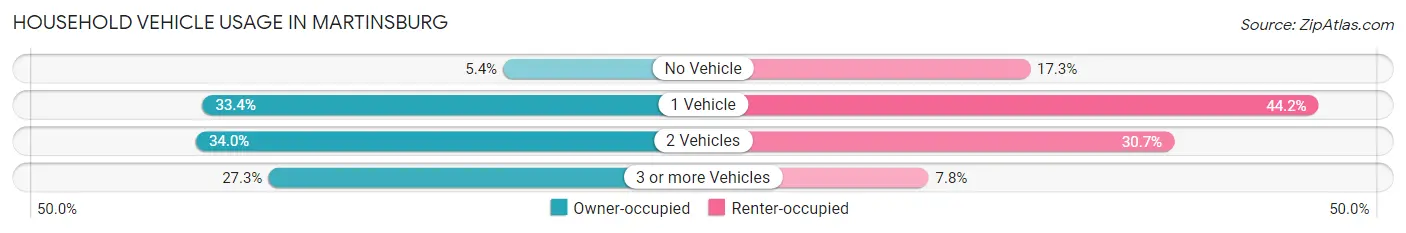
| Vehicles per Household | Owner-occupied | Renter-occupied |
| No Vehicle | 200 (5.3%) | 666 (17.3%) |
| 1 Vehicle | 1,247 (33.4%) | 1,704 (44.2%) |
| 2 Vehicles | 1,270 (34.0%) | 1,184 (30.7%) |
| 3 or more Vehicles | 1,018 (27.3%) | 301 (7.8%) |
| Total | 3,735 (100.0%) | 3,855 (100.0%) |
Real Estate & Mortgages in Martinsburg
Real Estate and Mortgage Overview in Martinsburg
| Characteristic | Without Mortgage | With Mortgage |
| Housing Units | 1,123 | 2,612 |
| Median Property Value | $171,900 | $217,200 |
| Median Household Income | $49,279 | $604 |
| Monthly Housing Costs | $420 | $183 |
| Real Estate Taxes | $1,071 | $25 |
Property Value by Mortgage Status in Martinsburg
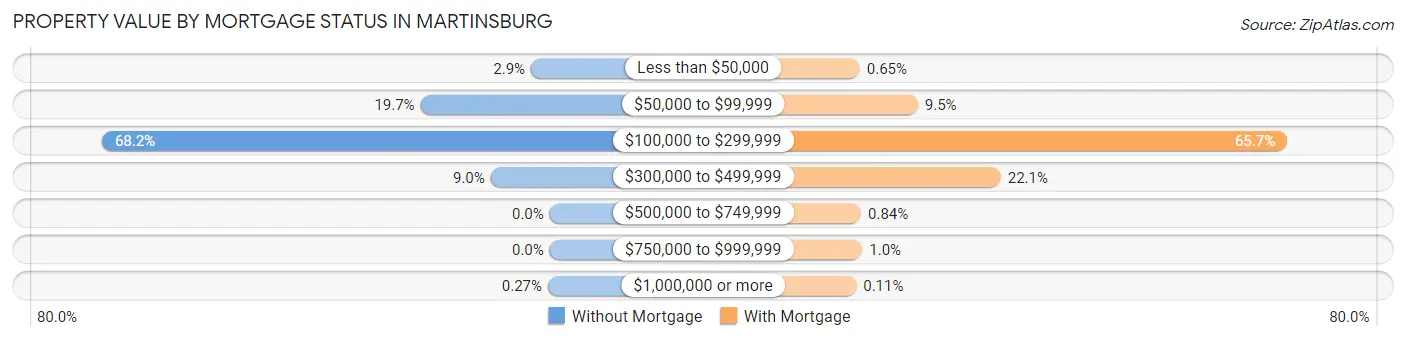
| Property Value | Without Mortgage | With Mortgage |
| Less than $50,000 | 32 (2.9%) | 17 (0.6%) |
| $50,000 to $99,999 | 221 (19.7%) | 248 (9.5%) |
| $100,000 to $299,999 | 766 (68.2%) | 1,717 (65.7%) |
| $300,000 to $499,999 | 101 (9.0%) | 578 (22.1%) |
| $500,000 to $749,999 | 0 (0.0%) | 22 (0.8%) |
| $750,000 to $999,999 | 0 (0.0%) | 27 (1.0%) |
| $1,000,000 or more | 3 (0.3%) | 3 (0.1%) |
| Total | 1,123 (100.0%) | 2,612 (100.0%) |
Household Income by Mortgage Status in Martinsburg
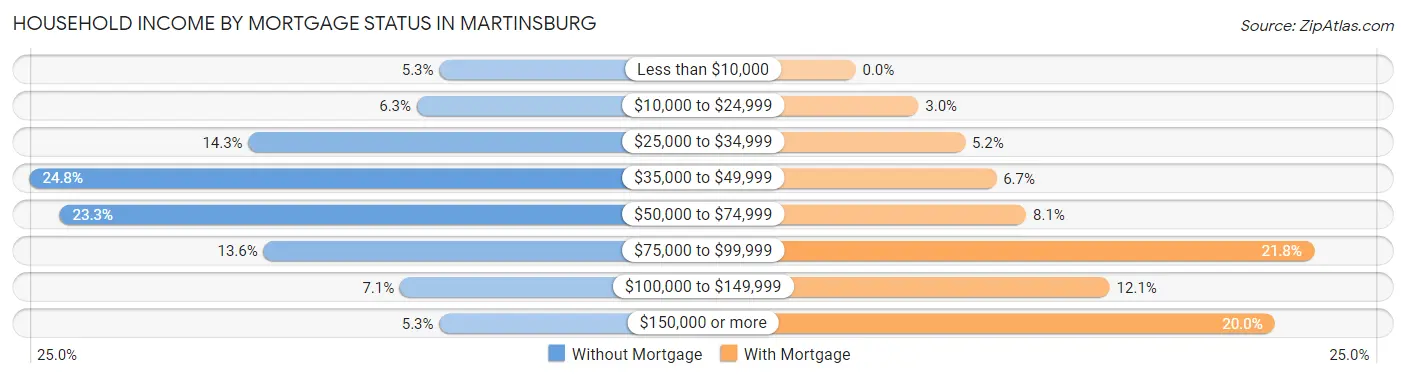
| Household Income | Without Mortgage | With Mortgage |
| Less than $10,000 | 59 (5.2%) | 0 (0.0%) |
| $10,000 to $24,999 | 71 (6.3%) | 78 (3.0%) |
| $25,000 to $34,999 | 161 (14.3%) | 136 (5.2%) |
| $35,000 to $49,999 | 278 (24.8%) | 175 (6.7%) |
| $50,000 to $74,999 | 262 (23.3%) | 212 (8.1%) |
| $75,000 to $99,999 | 153 (13.6%) | 570 (21.8%) |
| $100,000 to $149,999 | 80 (7.1%) | 316 (12.1%) |
| $150,000 or more | 59 (5.2%) | 521 (20.0%) |
| Total | 1,123 (100.0%) | 2,612 (100.0%) |
Property Value to Household Income Ratio in Martinsburg
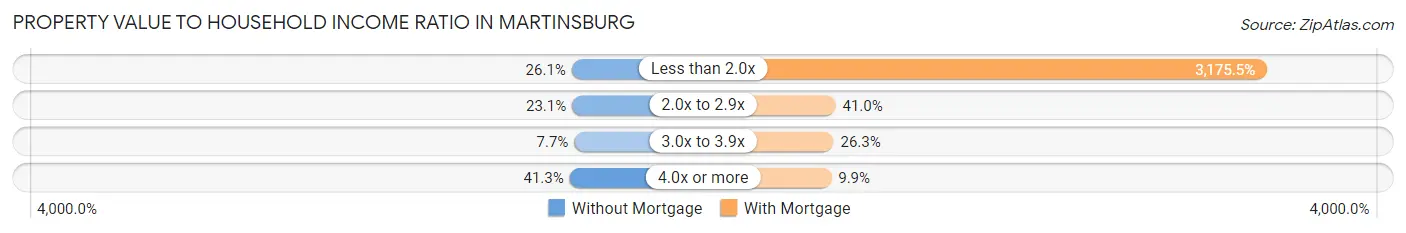
| Value-to-Income Ratio | Without Mortgage | With Mortgage |
| Less than 2.0x | 293 (26.1%) | 82,944 (3,175.5%) |
| 2.0x to 2.9x | 259 (23.1%) | 1,071 (41.0%) |
| 3.0x to 3.9x | 86 (7.7%) | 686 (26.3%) |
| 4.0x or more | 464 (41.3%) | 259 (9.9%) |
| Total | 1,123 (100.0%) | 2,612 (100.0%) |
Real Estate Taxes by Mortgage Status in Martinsburg
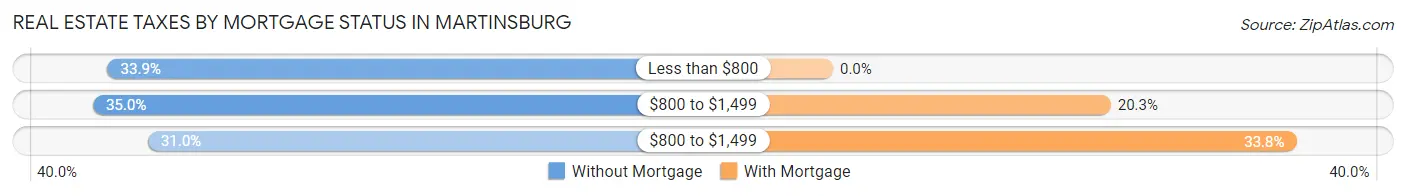
| Property Taxes | Without Mortgage | With Mortgage |
| Less than $800 | 381 (33.9%) | 0 (0.0%) |
| $800 to $1,499 | 393 (35.0%) | 530 (20.3%) |
| $800 to $1,499 | 348 (31.0%) | 884 (33.8%) |
| Total | 1,123 (100.0%) | 2,612 (100.0%) |
Health & Disability in Martinsburg
Health Insurance Coverage by Age in Martinsburg
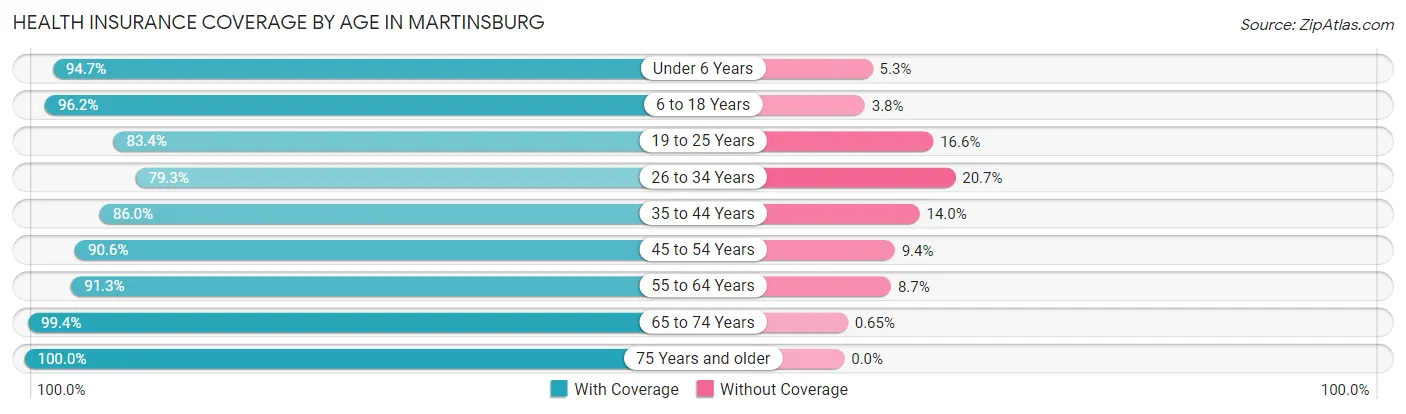
| Age Bracket | With Coverage | Without Coverage |
| Under 6 Years | 1,273 (94.7%) | 71 (5.3%) |
| 6 to 18 Years | 3,302 (96.2%) | 131 (3.8%) |
| 19 to 25 Years | 1,534 (83.4%) | 305 (16.6%) |
| 26 to 34 Years | 1,942 (79.3%) | 507 (20.7%) |
| 35 to 44 Years | 2,002 (86.0%) | 327 (14.0%) |
| 45 to 54 Years | 1,809 (90.6%) | 188 (9.4%) |
| 55 to 64 Years | 2,233 (91.3%) | 213 (8.7%) |
| 65 to 74 Years | 1,984 (99.4%) | 13 (0.6%) |
| 75 Years and older | 771 (100.0%) | 0 (0.0%) |
| Total | 16,850 (90.6%) | 1,755 (9.4%) |
Health Insurance Coverage by Citizenship Status in Martinsburg
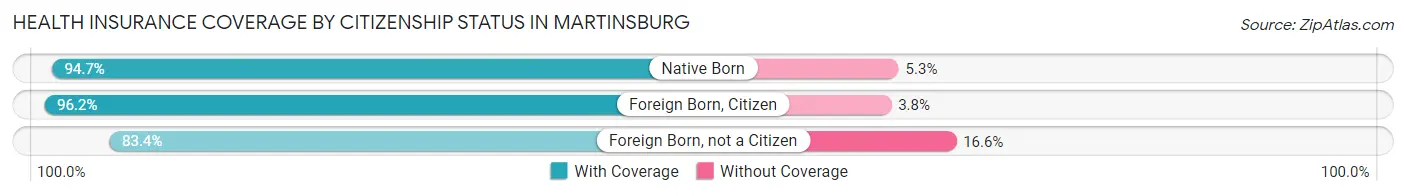
| Citizenship Status | With Coverage | Without Coverage |
| Native Born | 1,273 (94.7%) | 71 (5.3%) |
| Foreign Born, Citizen | 3,302 (96.2%) | 131 (3.8%) |
| Foreign Born, not a Citizen | 1,534 (83.4%) | 305 (16.6%) |
Health Insurance Coverage by Household Income in Martinsburg
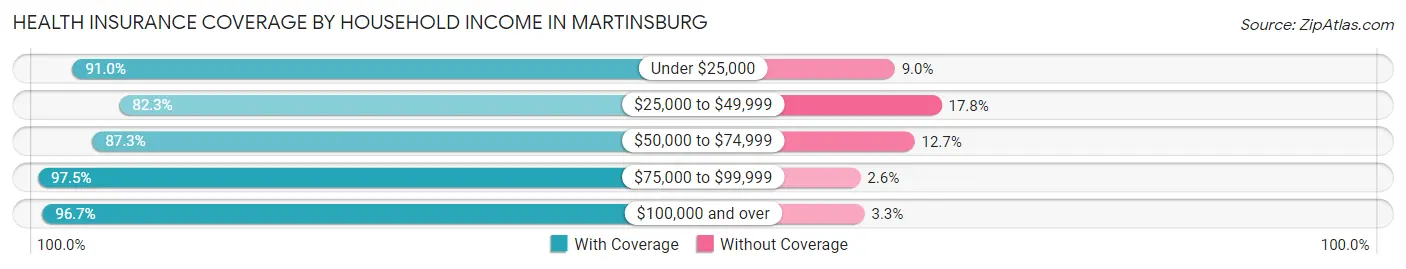
| Household Income | With Coverage | Without Coverage |
| Under $25,000 | 3,103 (91.0%) | 306 (9.0%) |
| $25,000 to $49,999 | 3,623 (82.3%) | 782 (17.7%) |
| $50,000 to $74,999 | 2,984 (87.3%) | 434 (12.7%) |
| $75,000 to $99,999 | 1,721 (97.5%) | 45 (2.5%) |
| $100,000 and over | 5,212 (96.7%) | 179 (3.3%) |
Public vs Private Health Insurance Coverage by Age in Martinsburg
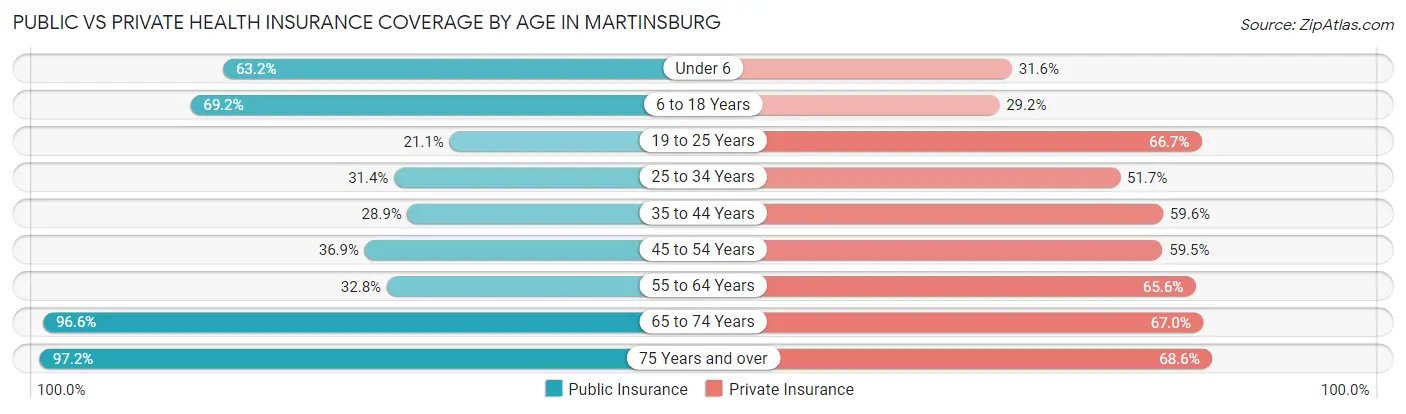
| Age Bracket | Public Insurance | Private Insurance |
| Under 6 | 849 (63.2%) | 424 (31.6%) |
| 6 to 18 Years | 2,377 (69.2%) | 1,003 (29.2%) |
| 19 to 25 Years | 388 (21.1%) | 1,227 (66.7%) |
| 25 to 34 Years | 769 (31.4%) | 1,265 (51.6%) |
| 35 to 44 Years | 673 (28.9%) | 1,388 (59.6%) |
| 45 to 54 Years | 736 (36.9%) | 1,188 (59.5%) |
| 55 to 64 Years | 801 (32.8%) | 1,604 (65.6%) |
| 65 to 74 Years | 1,929 (96.6%) | 1,338 (67.0%) |
| 75 Years and over | 749 (97.2%) | 529 (68.6%) |
| Total | 9,271 (49.8%) | 9,966 (53.6%) |
Disability Status by Sex by Age in Martinsburg
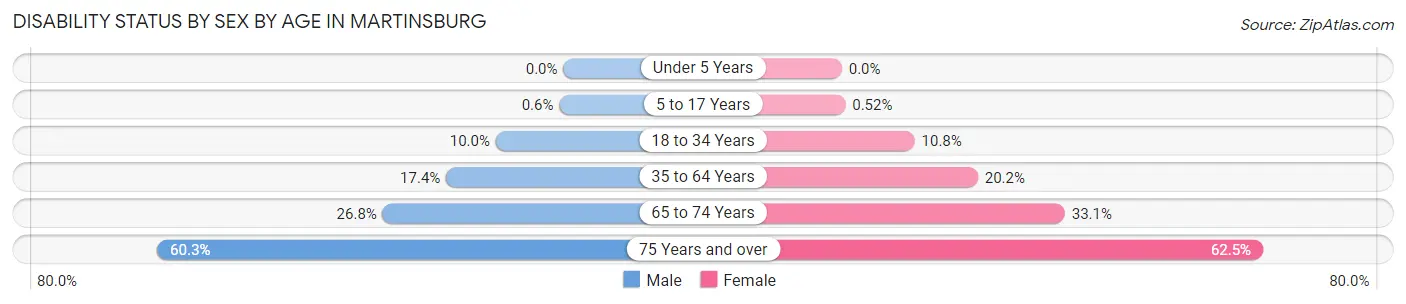
| Age Bracket | Male | Female |
| Under 5 Years | 0 (0.0%) | 0 (0.0%) |
| 5 to 17 Years | 11 (0.6%) | 9 (0.5%) |
| 18 to 34 Years | 235 (10.0%) | 227 (10.8%) |
| 35 to 64 Years | 567 (17.4%) | 710 (20.2%) |
| 65 to 74 Years | 279 (26.8%) | 317 (33.1%) |
| 75 Years and over | 193 (60.3%) | 282 (62.5%) |
Disability Class by Sex by Age in Martinsburg
Disability Class: Hearing Difficulty
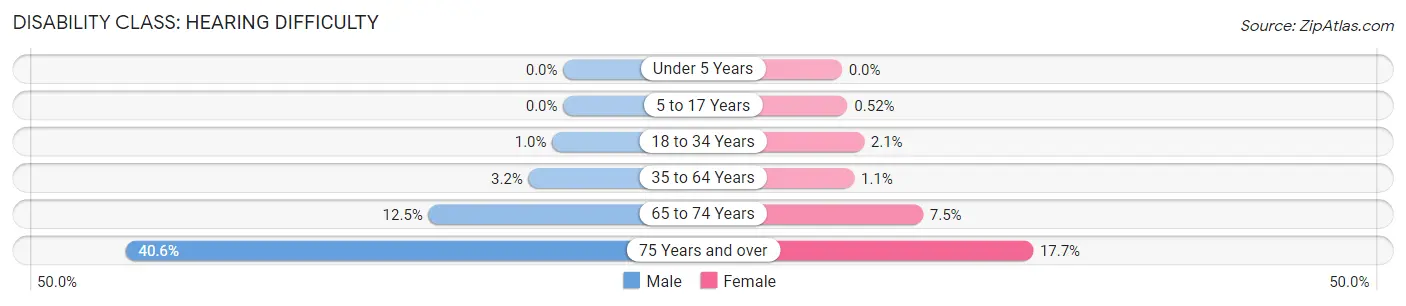
| Age Bracket | Male | Female |
| Under 5 Years | 0 (0.0%) | 0 (0.0%) |
| 5 to 17 Years | 0 (0.0%) | 9 (0.5%) |
| 18 to 34 Years | 24 (1.0%) | 43 (2.1%) |
| 35 to 64 Years | 105 (3.2%) | 40 (1.1%) |
| 65 to 74 Years | 130 (12.5%) | 72 (7.5%) |
| 75 Years and over | 130 (40.6%) | 80 (17.7%) |
Disability Class: Vision Difficulty
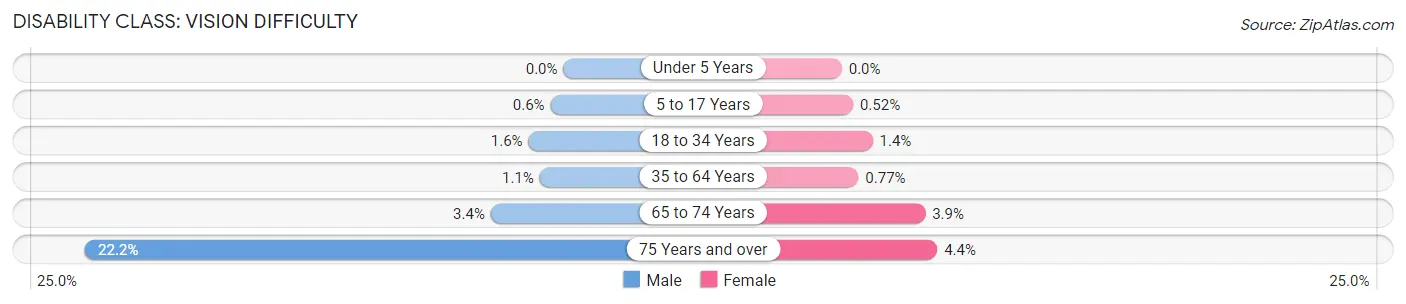
| Age Bracket | Male | Female |
| Under 5 Years | 0 (0.0%) | 0 (0.0%) |
| 5 to 17 Years | 11 (0.6%) | 9 (0.5%) |
| 18 to 34 Years | 38 (1.6%) | 30 (1.4%) |
| 35 to 64 Years | 36 (1.1%) | 27 (0.8%) |
| 65 to 74 Years | 35 (3.4%) | 37 (3.9%) |
| 75 Years and over | 71 (22.2%) | 20 (4.4%) |
Disability Class: Cognitive Difficulty
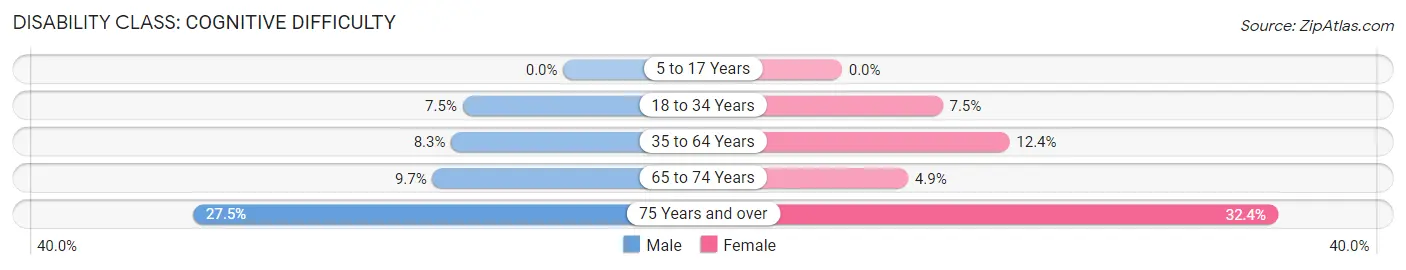
| Age Bracket | Male | Female |
| 5 to 17 Years | 0 (0.0%) | 0 (0.0%) |
| 18 to 34 Years | 175 (7.5%) | 157 (7.5%) |
| 35 to 64 Years | 271 (8.3%) | 437 (12.4%) |
| 65 to 74 Years | 101 (9.7%) | 47 (4.9%) |
| 75 Years and over | 88 (27.5%) | 146 (32.4%) |
Disability Class: Ambulatory Difficulty
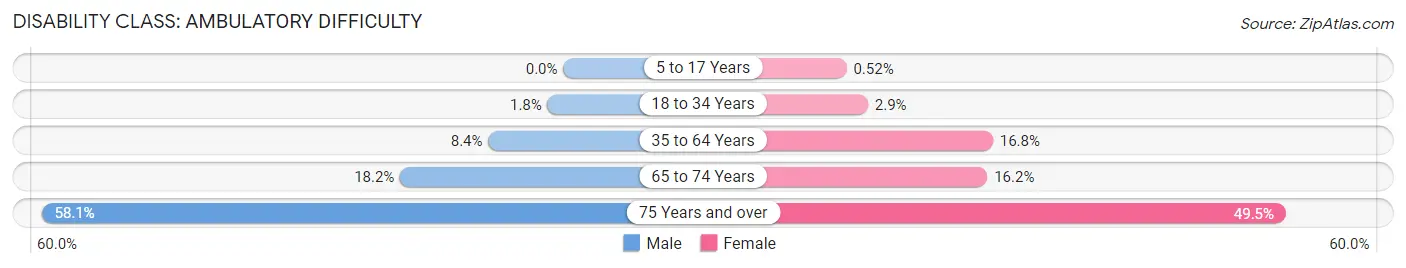
| Age Bracket | Male | Female |
| 5 to 17 Years | 0 (0.0%) | 9 (0.5%) |
| 18 to 34 Years | 41 (1.8%) | 61 (2.9%) |
| 35 to 64 Years | 272 (8.4%) | 591 (16.8%) |
| 65 to 74 Years | 189 (18.2%) | 155 (16.2%) |
| 75 Years and over | 186 (58.1%) | 223 (49.4%) |
Disability Class: Self-Care Difficulty
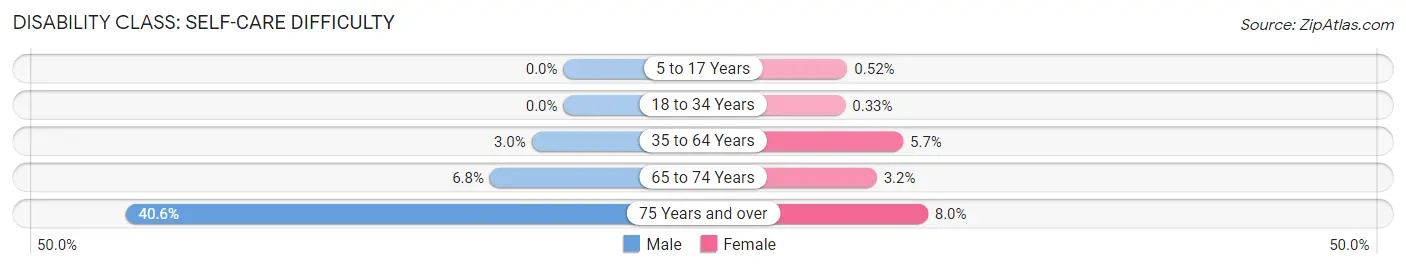
| Age Bracket | Male | Female |
| 5 to 17 Years | 0 (0.0%) | 9 (0.5%) |
| 18 to 34 Years | 0 (0.0%) | 7 (0.3%) |
| 35 to 64 Years | 96 (2.9%) | 200 (5.7%) |
| 65 to 74 Years | 71 (6.8%) | 31 (3.2%) |
| 75 Years and over | 130 (40.6%) | 36 (8.0%) |
Technology Access in Martinsburg
Computing Device Access in Martinsburg
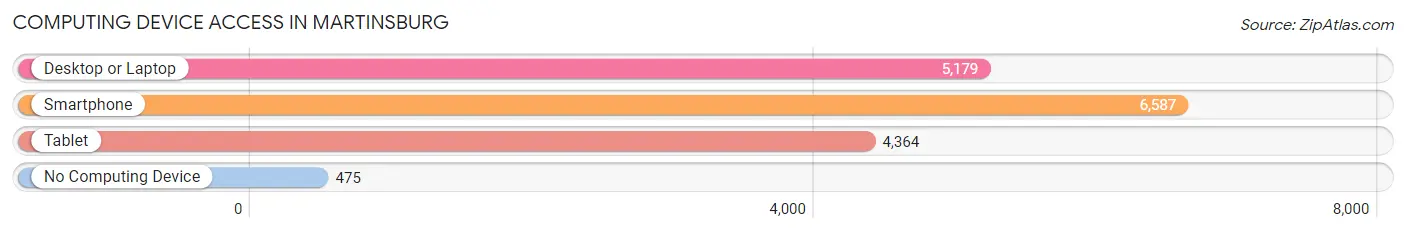
| Device Type | # Households | % Households |
| Desktop or Laptop | 5,179 | 68.2% |
| Smartphone | 6,587 | 86.8% |
| Tablet | 4,364 | 57.5% |
| No Computing Device | 475 | 6.3% |
| Total | 7,590 | 100.0% |
Internet Access in Martinsburg
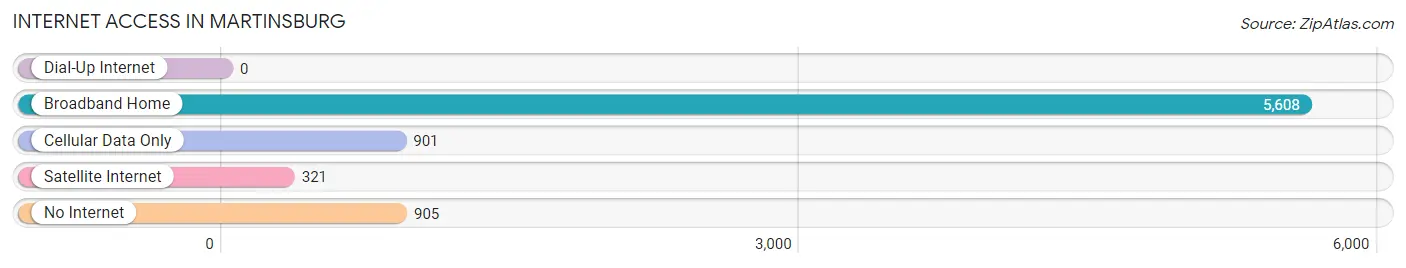
| Internet Type | # Households | % Households |
| Dial-Up Internet | 0 | 0.0% |
| Broadband Home | 5,608 | 73.9% |
| Cellular Data Only | 901 | 11.9% |
| Satellite Internet | 321 | 4.2% |
| No Internet | 905 | 11.9% |
| Total | 7,590 | 100.0% |
Martinsburg Summary
Martinsburg, West Virginia is a city located in Berkeley County, West Virginia, United States. It is the county seat of Berkeley County and is part of the Hagerstown-Martinsburg, MD-WV Metropolitan Statistical Area. As of the 2010 census, the city had a population of 17,227, making it the largest city in the Eastern Panhandle region of West Virginia.
History
The area that is now Martinsburg was first settled in 1778 by Adam Stephen, a veteran of the American Revolutionary War. Stephen named the settlement Martinsburgh in honor of Colonel Thomas Bryan Martin, a nephew of Thomas Fairfax, 6th Lord Fairfax of Cameron. The town was incorporated in 1778 and was named the county seat of Berkeley County in 1772.
During the American Civil War, Martinsburg was a major transportation hub for the Confederate Army. The town was occupied by Union forces in July 1861 and remained under Union control until the end of the war. After the war, the town experienced a period of growth and prosperity, becoming an important railroad center.
Geography
Martinsburg is located in the Eastern Panhandle region of West Virginia, at the intersection of Interstate 81 and U.S. Route 11. The city is situated in the Appalachian Mountains, approximately 70 miles northwest of Washington, D.C. and 50 miles south of Harrisburg, Pennsylvania.
The city has a total area of 8.2 square miles, all of which is land. The city is located in the Potomac River watershed and is surrounded by the Opequon Creek to the north, the Tuscarora Creek to the east, and the Shenandoah River to the south.
Economy
Martinsburg is the economic center of the Eastern Panhandle region of West Virginia. The city is home to several major employers, including the U.S. Department of Veterans Affairs, the U.S. Department of Defense, and the U.S. Department of Homeland Security. The city is also home to several major manufacturing companies, including Procter & Gamble, Kraft Foods, and Nestle.
The city is also home to several major retail outlets, including Walmart, Target, and Lowe's. The city is also home to several major medical facilities, including Berkeley Medical Center and City Hospital.
Demographics
As of the 2010 census, the city had a population of 17,227. The racial makeup of the city was 79.2% White, 14.3% African American, 0.3% Native American, 1.2% Asian, 0.1% Pacific Islander, 2.2% from other races, and 2.9% from two or more races. Hispanic or Latino of any race were 4.3% of the population.
The median income for a household in the city was $37,837, and the median income for a family was $45,945. The per capita income for the city was $20,845. About 11.2% of families and 14.2% of the population were below the poverty line, including 20.2% of those under age 18 and 8.2% of those age 65 or over.
Common Questions
What is Per Capita Income in Martinsburg?
Per Capita income in Martinsburg is $28,739.
What is the Median Family Income in Martinsburg?
Median Family Income in Martinsburg is $61,053.
What is the Median Household income in Martinsburg?
Median Household Income in Martinsburg is $55,240.
What is Income or Wage Gap in Martinsburg?
Income or Wage Gap in Martinsburg is 39.0%.
Women in Martinsburg earn 61.0 cents for every dollar earned by a man.
What is Inequality or Gini Index in Martinsburg?
Inequality or Gini Index in Martinsburg is 0.45.
What is the Total Population of Martinsburg?
Total Population of Martinsburg is 18,678.
What is the Total Male Population of Martinsburg?
Total Male Population of Martinsburg is 9,452.
What is the Total Female Population of Martinsburg?
Total Female Population of Martinsburg is 9,226.
What is the Ratio of Males per 100 Females in Martinsburg?
There are 102.45 Males per 100 Females in Martinsburg.
What is the Ratio of Females per 100 Males in Martinsburg?
There are 97.61 Females per 100 Males in Martinsburg.
What is the Median Population Age in Martinsburg?
Median Population Age in Martinsburg is 36.4 Years.
What is the Average Family Size in Martinsburg
Average Family Size in Martinsburg is 3.2 People.
What is the Average Household Size in Martinsburg
Average Household Size in Martinsburg is 2.4 People.
How Large is the Labor Force in Martinsburg?
There are 9,697 People in the Labor Forcein in Martinsburg.
What is the Percentage of People in the Labor Force in Martinsburg?
66.0% of People are in the Labor Force in Martinsburg.
What is the Unemployment Rate in Martinsburg?
Unemployment Rate in Martinsburg is 9.1%.