Zip Codes with the Highest Percentage of Population Employed in Arts, Media & Entertainment in Colchester, VT
RELATED REPORTS & OPTIONS
Arts, Media & Entertainment
Colchester
Compare Zip Codes
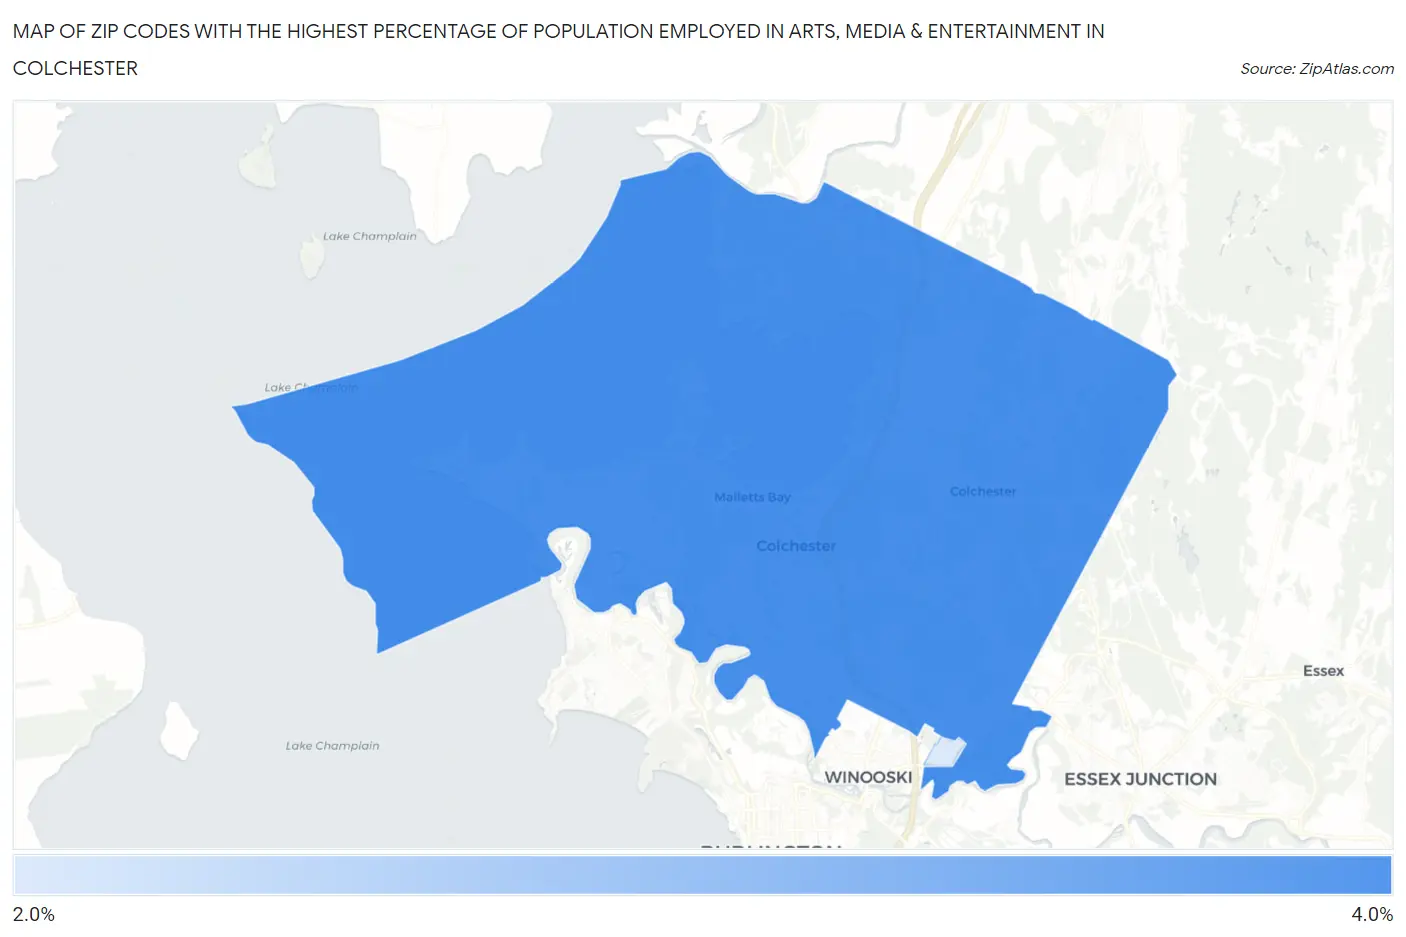
Map of Zip Codes with the Highest Percentage of Population Employed in Arts, Media & Entertainment in Colchester
2.1%
3.1%
Zip Codes with the Highest Percentage of Population Employed in Arts, Media & Entertainment in Colchester, VT
| Zip Code | % Employed | vs State | vs National | |
| 1. | 05446 | 3.1% | 2.7%(+0.410)#66 | 2.1%(+1.02)#3,886 |
| 2. | 05439 | 2.1% | 2.7%(-0.551)#115 | 2.1%(+0.063)#7,152 |
1
Common Questions
What are the Top Zip Codes with the Highest Percentage of Population Employed in Arts, Media & Entertainment in Colchester, VT?
Top Zip Codes with the Highest Percentage of Population Employed in Arts, Media & Entertainment in Colchester, VT are:
What zip code has the Highest Percentage of Population Employed in Arts, Media & Entertainment in Colchester, VT?
05446 has the Highest Percentage of Population Employed in Arts, Media & Entertainment in Colchester, VT with 3.1%.
What is the Percentage of Population Employed in Arts, Media & Entertainment in Vermont?
Percentage of Population Employed in Arts, Media & Entertainment in Vermont is 2.7%.
What is the Percentage of Population Employed in Arts, Media & Entertainment in the United States?
Percentage of Population Employed in Arts, Media & Entertainment in the United States is 2.1%.