Sussex County, VA Map & Demographics
Sussex County Map
Sussex County Overview
$28,788
PER CAPITA INCOME
$77,926
AVG FAMILY INCOME
$59,195
AVG HOUSEHOLD INCOME
6.5%
WAGE / INCOME GAP [ % ]
93.5¢/ $1
WAGE / INCOME GAP [ $ ]
$11,231
FAMILY INCOME DEFICIT
0.43
INEQUALITY / GINI INDEX
10,866
TOTAL POPULATION
6,320
MALE POPULATION
4,546
FEMALE POPULATION
139.02
MALES / 100 FEMALES
71.93
FEMALES / 100 MALES
40.4
MEDIAN AGE
3.3
AVG FAMILY SIZE
2.5
AVG HOUSEHOLD SIZE
4,618
LABOR FORCE [ PEOPLE ]
50.0%
PERCENT IN LABOR FORCE
5.0%
UNEMPLOYMENT RATE
Income in Sussex County
Income Overview in Sussex County
Per Capita Income in Sussex County is $28,788, while median incomes of families and households are $77,926 and $59,195 respectively.
| Characteristic | Number | Measure |
| Per Capita Income | 10,866 | $28,788 |
| Median Family Income | 2,261 | $77,926 |
| Mean Family Income | 2,261 | $93,235 |
| Median Household Income | 3,698 | $59,195 |
| Mean Household Income | 3,698 | $76,942 |
| Income Deficit | 2,261 | $11,231 |
| Wage / Income Gap (%) | 10,866 | 6.50% |
| Wage / Income Gap ($) | 10,866 | 93.50¢ per $1 |
| Gini / Inequality Index | 10,866 | 0.43 |
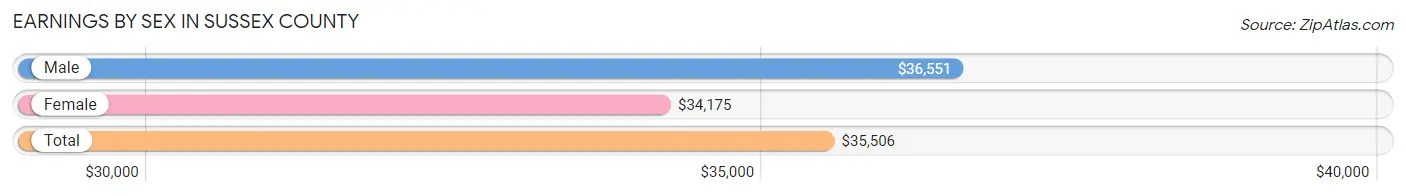
Earnings by Sex in Sussex County
Average Earnings in Sussex County are $35,506, $36,551 for men and $34,175 for women, a difference of 6.5%.
| Sex | Number | Average Earnings |
| Male | 2,834 (58.9%) | $36,551 |
| Female | 1,980 (41.1%) | $34,175 |
| Total | 4,814 (100.0%) | $35,506 |
Earnings by Sex by Income Bracket in Sussex County
The most common earnings brackets in Sussex County are $25,000 to $29,999 for men (488 | 17.2%) and $55,000 to $64,999 for women (191 | 9.7%).
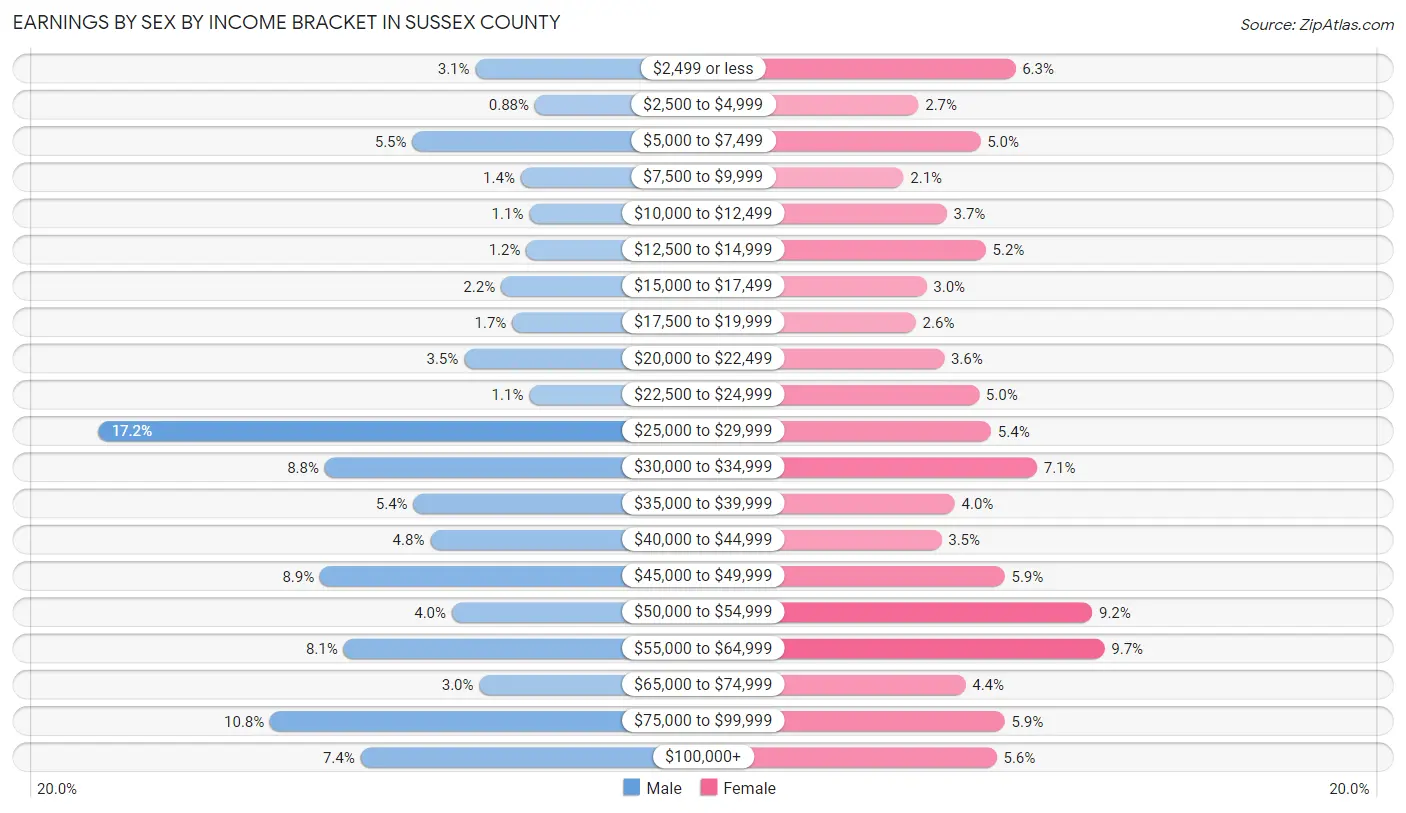
| Income | Male | Female |
| $2,499 or less | 88 (3.1%) | 125 (6.3%) |
| $2,500 to $4,999 | 25 (0.9%) | 53 (2.7%) |
| $5,000 to $7,499 | 155 (5.5%) | 99 (5.0%) |
| $7,500 to $9,999 | 40 (1.4%) | 42 (2.1%) |
| $10,000 to $12,499 | 31 (1.1%) | 74 (3.7%) |
| $12,500 to $14,999 | 34 (1.2%) | 103 (5.2%) |
| $15,000 to $17,499 | 61 (2.1%) | 59 (3.0%) |
| $17,500 to $19,999 | 49 (1.7%) | 51 (2.6%) |
| $20,000 to $22,499 | 100 (3.5%) | 72 (3.6%) |
| $22,500 to $24,999 | 31 (1.1%) | 98 (5.0%) |
| $25,000 to $29,999 | 488 (17.2%) | 107 (5.4%) |
| $30,000 to $34,999 | 248 (8.7%) | 141 (7.1%) |
| $35,000 to $39,999 | 154 (5.4%) | 80 (4.0%) |
| $40,000 to $44,999 | 136 (4.8%) | 70 (3.5%) |
| $45,000 to $49,999 | 253 (8.9%) | 117 (5.9%) |
| $50,000 to $54,999 | 113 (4.0%) | 182 (9.2%) |
| $55,000 to $64,999 | 228 (8.1%) | 191 (9.7%) |
| $65,000 to $74,999 | 84 (3.0%) | 88 (4.4%) |
| $75,000 to $99,999 | 306 (10.8%) | 117 (5.9%) |
| $100,000+ | 210 (7.4%) | 111 (5.6%) |
| Total | 2,834 (100.0%) | 1,980 (100.0%) |
Earnings by Sex by Educational Attainment in Sussex County
Average earnings in Sussex County are $44,356 for men and $37,358 for women, a difference of 15.8%. Men with an educational attainment of bachelor's degree enjoy the highest average annual earnings of $59,261, while those with less than high school education earn the least with $29,489. Women with an educational attainment of graduate degree earn the most with the average annual earnings of $76,339, while those with less than high school education have the smallest earnings of $13,500.
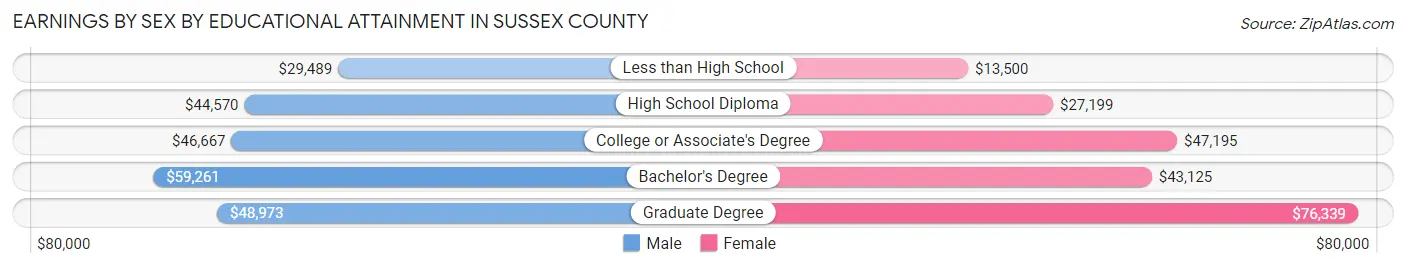
| Educational Attainment | Male Income | Female Income |
| Less than High School | $29,489 | $13,500 |
| High School Diploma | $44,570 | $27,199 |
| College or Associate's Degree | $46,667 | $47,195 |
| Bachelor's Degree | $59,261 | $43,125 |
| Graduate Degree | $48,973 | $76,339 |
| Total | $44,356 | $37,358 |
Family Income in Sussex County
Family Income Brackets in Sussex County
According to the Sussex County family income data, there are 518 families falling into the $100,000 to $149,999 income range, which is the most common income bracket and makes up 22.9% of all families. Conversely, the less than $10,000 income bracket is the least frequent group with only 47 families (2.1%) belonging to this category.
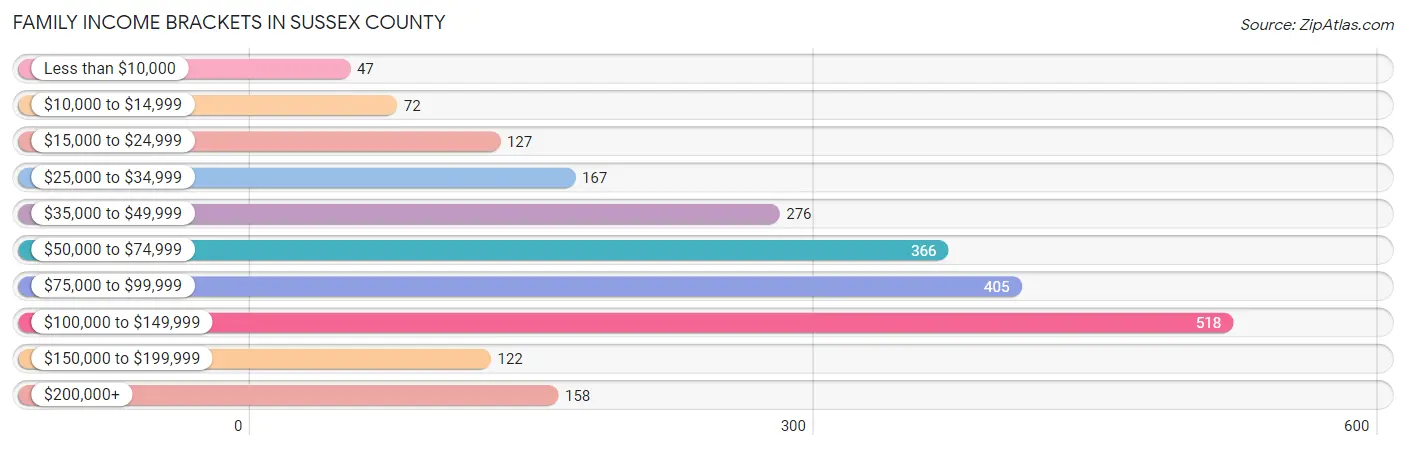
| Income Bracket | # Families | % Families |
| Less than $10,000 | 47 | 2.1% |
| $10,000 to $14,999 | 72 | 3.2% |
| $15,000 to $24,999 | 127 | 5.6% |
| $25,000 to $34,999 | 167 | 7.4% |
| $35,000 to $49,999 | 276 | 12.2% |
| $50,000 to $74,999 | 366 | 16.2% |
| $75,000 to $99,999 | 405 | 17.9% |
| $100,000 to $149,999 | 518 | 22.9% |
| $150,000 to $199,999 | 122 | 5.4% |
| $200,000+ | 158 | 7.0% |
Family Income by Famaliy Size in Sussex County
3-person families (479 | 21.2%) account for the highest median family income in Sussex County with $95,566 per family, while 2-person families (1,328 | 58.7%) have the highest median income of $37,904 per family member.
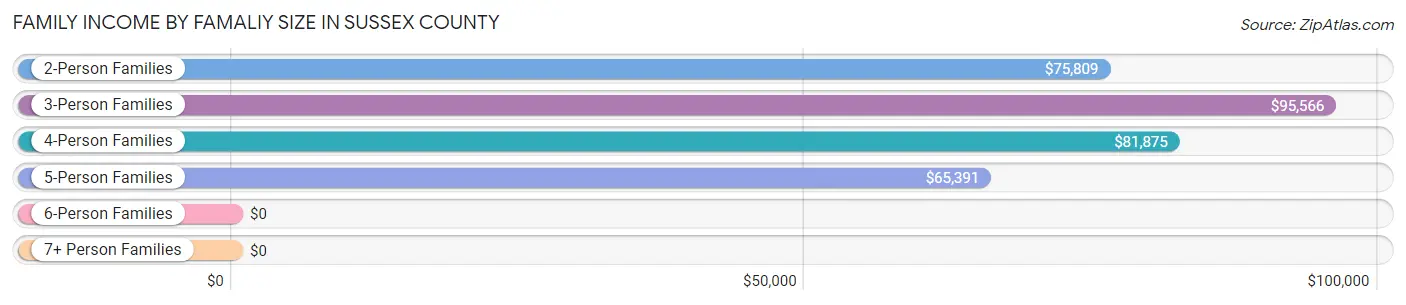
| Income Bracket | # Families | Median Income |
| 2-Person Families | 1,328 (58.7%) | $75,809 |
| 3-Person Families | 479 (21.2%) | $95,566 |
| 4-Person Families | 222 (9.8%) | $81,875 |
| 5-Person Families | 183 (8.1%) | $65,391 |
| 6-Person Families | 33 (1.5%) | $0 |
| 7+ Person Families | 16 (0.7%) | $0 |
| Total | 2,261 (100.0%) | $77,926 |
Family Income by Number of Earners in Sussex County
The median family income in Sussex County is $77,926, with families comprising 3+ earners (204) having the highest median family income of $121,071, while families with no earners (406) have the lowest median family income of $44,750, accounting for 9.0% and 18.0% of families, respectively.
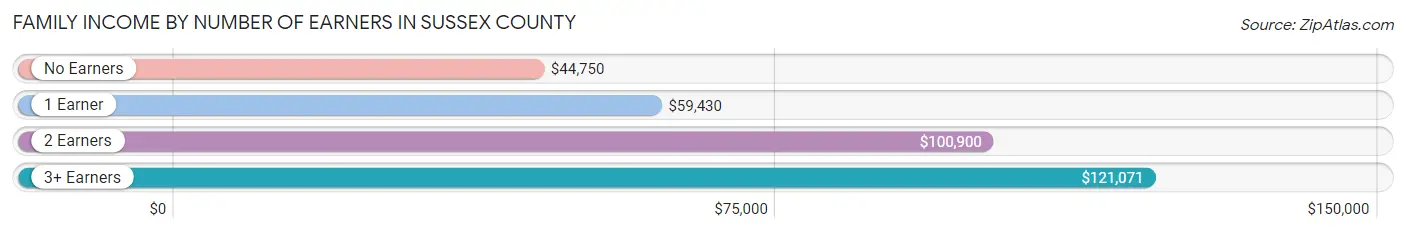
| Number of Earners | # Families | Median Income |
| No Earners | 406 (18.0%) | $44,750 |
| 1 Earner | 907 (40.1%) | $59,430 |
| 2 Earners | 744 (32.9%) | $100,900 |
| 3+ Earners | 204 (9.0%) | $121,071 |
| Total | 2,261 (100.0%) | $77,926 |
Household Income in Sussex County
Household Income Brackets in Sussex County
With 658 households falling in the category, the $50,000 to $74,999 income range is the most frequent in Sussex County, accounting for 17.8% of all households. In contrast, only 166 households (4.5%) fall into the less than $10,000 income bracket, making it the least populous group.
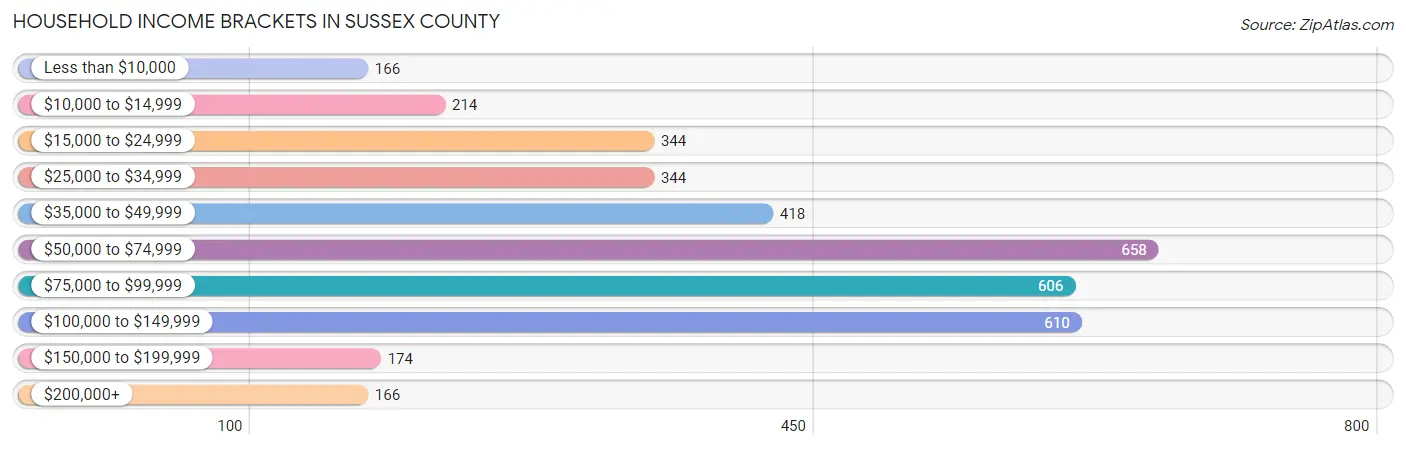
| Income Bracket | # Households | % Households |
| Less than $10,000 | 166 | 4.5% |
| $10,000 to $14,999 | 214 | 5.8% |
| $15,000 to $24,999 | 344 | 9.3% |
| $25,000 to $34,999 | 344 | 9.3% |
| $35,000 to $49,999 | 418 | 11.3% |
| $50,000 to $74,999 | 658 | 17.8% |
| $75,000 to $99,999 | 606 | 16.4% |
| $100,000 to $149,999 | 610 | 16.5% |
| $150,000 to $199,999 | 174 | 4.7% |
| $200,000+ | 166 | 4.5% |
Household Income by Householder Age in Sussex County
The median household income in Sussex County is $59,195, with the highest median household income of $77,960 found in the 45 to 64 years age bracket for the primary householder. A total of 1,538 households (41.6%) fall into this category. Meanwhile, the 15 to 24 years age bracket for the primary householder has the lowest median household income of $30,865, with 49 households (1.3%) in this group.
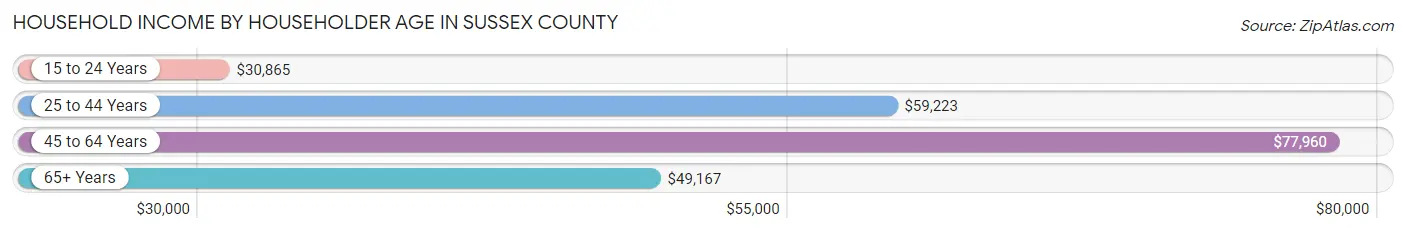
| Income Bracket | # Households | Median Income |
| 15 to 24 Years | 49 (1.3%) | $30,865 |
| 25 to 44 Years | 935 (25.3%) | $59,223 |
| 45 to 64 Years | 1,538 (41.6%) | $77,960 |
| 65+ Years | 1,176 (31.8%) | $49,167 |
| Total | 3,698 (100.0%) | $59,195 |
Poverty in Sussex County
Income Below Poverty by Sex and Age in Sussex County
With 10.6% poverty level for males and 15.1% for females among the residents of Sussex County, 6 to 11 year old males and 5 year old females are the most vulnerable to poverty, with 98 males (31.1%) and 10 females (50.0%) in their respective age groups living below the poverty level.
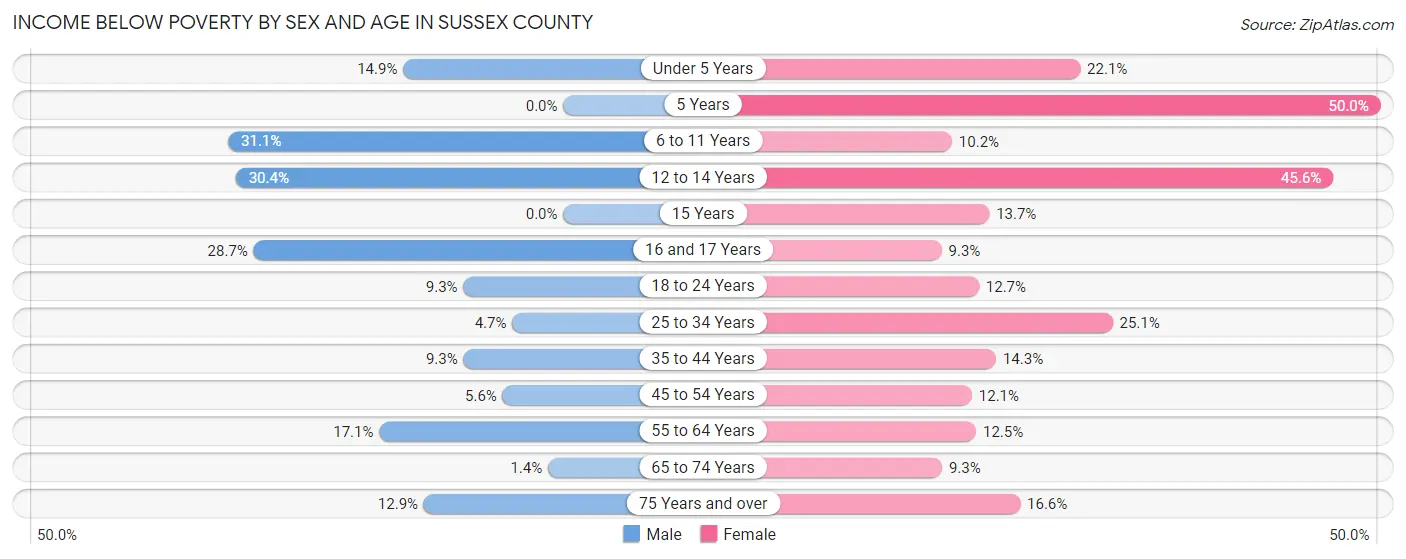
| Age Bracket | Male | Female |
| Under 5 Years | 33 (14.9%) | 48 (22.1%) |
| 5 Years | 0 (0.0%) | 10 (50.0%) |
| 6 to 11 Years | 98 (31.1%) | 38 (10.2%) |
| 12 to 14 Years | 38 (30.4%) | 57 (45.6%) |
| 15 Years | 0 (0.0%) | 13 (13.7%) |
| 16 and 17 Years | 25 (28.7%) | 5 (9.3%) |
| 18 to 24 Years | 65 (9.3%) | 44 (12.7%) |
| 25 to 34 Years | 43 (4.7%) | 96 (25.1%) |
| 35 to 44 Years | 34 (9.3%) | 81 (14.3%) |
| 45 to 54 Years | 40 (5.6%) | 66 (12.1%) |
| 55 to 64 Years | 103 (17.1%) | 87 (12.5%) |
| 65 to 74 Years | 7 (1.4%) | 56 (9.3%) |
| 75 Years and over | 37 (12.9%) | 74 (16.6%) |
| Total | 523 (10.6%) | 675 (15.1%) |
Income Above Poverty by Sex and Age in Sussex County
According to the poverty statistics in Sussex County, males aged 5 years and females aged 16 and 17 years are the age groups that are most secure financially, with 100.0% of males and 90.7% of females in these age groups living above the poverty line.
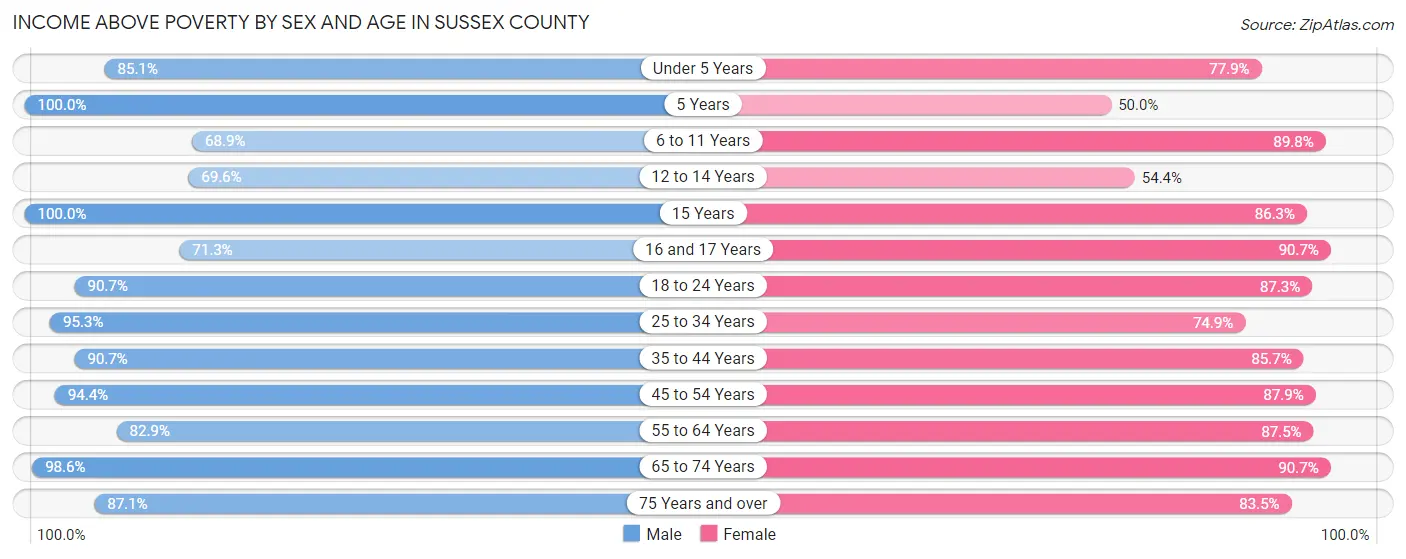
| Age Bracket | Male | Female |
| Under 5 Years | 189 (85.1%) | 169 (77.9%) |
| 5 Years | 73 (100.0%) | 10 (50.0%) |
| 6 to 11 Years | 217 (68.9%) | 334 (89.8%) |
| 12 to 14 Years | 87 (69.6%) | 68 (54.4%) |
| 15 Years | 41 (100.0%) | 82 (86.3%) |
| 16 and 17 Years | 62 (71.3%) | 49 (90.7%) |
| 18 to 24 Years | 636 (90.7%) | 302 (87.3%) |
| 25 to 34 Years | 865 (95.3%) | 286 (74.9%) |
| 35 to 44 Years | 333 (90.7%) | 485 (85.7%) |
| 45 to 54 Years | 670 (94.4%) | 481 (87.9%) |
| 55 to 64 Years | 500 (82.9%) | 611 (87.5%) |
| 65 to 74 Years | 486 (98.6%) | 546 (90.7%) |
| 75 Years and over | 249 (87.1%) | 373 (83.5%) |
| Total | 4,408 (89.4%) | 3,796 (84.9%) |
Income Below Poverty Among Married-Couple Families in Sussex County
The poverty statistics for married-couple families in Sussex County show that 2.1% or 30 of the total 1,419 families live below the poverty line. Families with 5 or more children have the highest poverty rate of 100.0%, comprising of 10 families. On the other hand, families with 1 or 2 children have the lowest poverty rate of 0.0%, which includes 0 families.
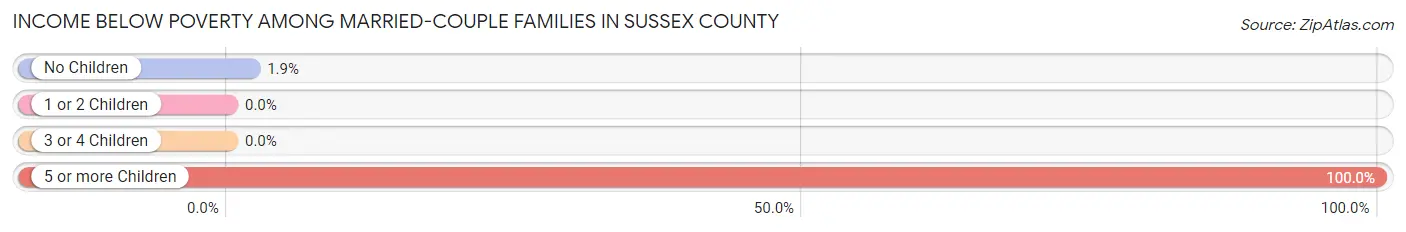
| Children | Above Poverty | Below Poverty |
| No Children | 1,015 (98.1%) | 20 (1.9%) |
| 1 or 2 Children | 298 (100.0%) | 0 (0.0%) |
| 3 or 4 Children | 76 (100.0%) | 0 (0.0%) |
| 5 or more Children | 0 (0.0%) | 10 (100.0%) |
| Total | 1,389 (97.9%) | 30 (2.1%) |
Income Below Poverty Among Single-Parent Households in Sussex County
According to the poverty data in Sussex County, 6.4% or 20 single-father households and 25.6% or 135 single-mother households are living below the poverty line. Among single-father households, those with 1 or 2 children have the highest poverty rate, with 20 households (13.1%) experiencing poverty. Likewise, among single-mother households, those with 3 or 4 children have the highest poverty rate, with 56 households (65.9%) falling below the poverty line.
| Children | Single Father | Single Mother |
| No Children | 0 (0.0%) | 33 (13.9%) |
| 1 or 2 Children | 20 (13.1%) | 46 (22.4%) |
| 3 or 4 Children | 0 (0.0%) | 56 (65.9%) |
| 5 or more Children | 0 (0.0%) | 0 (0.0%) |
| Total | 20 (6.4%) | 135 (25.6%) |
Income Below Poverty Among Married-Couple vs Single-Parent Households in Sussex County
The poverty data for Sussex County shows that 30 of the married-couple family households (2.1%) and 155 of the single-parent households (18.4%) are living below the poverty level. Within the married-couple family households, those with 5 or more children have the highest poverty rate, with 10 households (100.0%) falling below the poverty line. Among the single-parent households, those with 3 or 4 children have the highest poverty rate, with 56 household (50.9%) living below poverty.
| Children | Married-Couple Families | Single-Parent Households |
| No Children | 20 (1.9%) | 33 (8.8%) |
| 1 or 2 Children | 0 (0.0%) | 66 (18.4%) |
| 3 or 4 Children | 0 (0.0%) | 56 (50.9%) |
| 5 or more Children | 10 (100.0%) | 0 (0.0%) |
| Total | 30 (2.1%) | 155 (18.4%) |
Race in Sussex County
The most populous races in Sussex County are Black / African American (5,956 | 54.8%), White / Caucasian (4,528 | 41.7%), and Hispanic or Latino (382 | 3.5%).
| Race | # Population | % Population |
| Asian | 50 | 0.5% |
| Black / African American | 5,956 | 54.8% |
| Hawaiian / Pacific | 0 | 0.0% |
| Hispanic or Latino | 382 | 3.5% |
| Native / Alaskan | 19 | 0.2% |
| White / Caucasian | 4,528 | 41.7% |
| Two or more Races | 253 | 2.3% |
| Some other Race | 60 | 0.5% |
| Total | 10,866 | 100.0% |
Ancestry in Sussex County
The most populous ancestries reported in Sussex County are Subsaharan African (2,330 | 21.4%), African (2,323 | 21.4%), English (844 | 7.8%), American (690 | 6.4%), and Irish (423 | 3.9%), together accounting for 60.8% of all Sussex County residents.
| Ancestry | # Population | % Population |
| African | 2,323 | 21.4% |
| American | 690 | 6.4% |
| Arab | 10 | 0.1% |
| Arapaho | 5 | 0.1% |
| Austrian | 4 | 0.0% |
| Bhutanese | 1 | 0.0% |
| Blackfeet | 25 | 0.2% |
| British | 17 | 0.2% |
| Burmese | 1 | 0.0% |
| Central American | 4 | 0.0% |
| Cherokee | 25 | 0.2% |
| Cuban | 14 | 0.1% |
| Czech | 11 | 0.1% |
| Danish | 14 | 0.1% |
| Dominican | 36 | 0.3% |
| Dutch | 61 | 0.6% |
| Eastern European | 4 | 0.0% |
| English | 844 | 7.8% |
| European | 114 | 1.1% |
| Finnish | 7 | 0.1% |
| French | 147 | 1.3% |
| German | 340 | 3.1% |
| Greek | 1 | 0.0% |
| Haitian | 6 | 0.1% |
| Honduran | 1 | 0.0% |
| Hungarian | 40 | 0.4% |
| Irish | 423 | 3.9% |
| Italian | 111 | 1.0% |
| Korean | 34 | 0.3% |
| Lumbee | 1 | 0.0% |
| Mexican | 237 | 2.2% |
| Moroccan | 10 | 0.1% |
| Polish | 175 | 1.6% |
| Portuguese | 2 | 0.0% |
| Puerto Rican | 51 | 0.5% |
| Russian | 2 | 0.0% |
| Salvadoran | 3 | 0.0% |
| Scandinavian | 13 | 0.1% |
| Scotch-Irish | 53 | 0.5% |
| Scottish | 133 | 1.2% |
| Serbian | 7 | 0.1% |
| Slovak | 4 | 0.0% |
| Spanish American | 40 | 0.4% |
| Sri Lankan | 26 | 0.2% |
| Subsaharan African | 2,330 | 21.4% |
| Swedish | 11 | 0.1% |
| Thai | 14 | 0.1% |
| Ukrainian | 22 | 0.2% |
| West Indian | 7 | 0.1% | View All 49 Rows |
Immigrants in Sussex County
The most numerous immigrant groups reported in Sussex County came from Latin America (110 | 1.0%), Central America (106 | 1.0%), Mexico (98 | 0.9%), Asia (50 | 0.5%), and South Eastern Asia (35 | 0.3%), together accounting for 3.7% of all Sussex County residents.
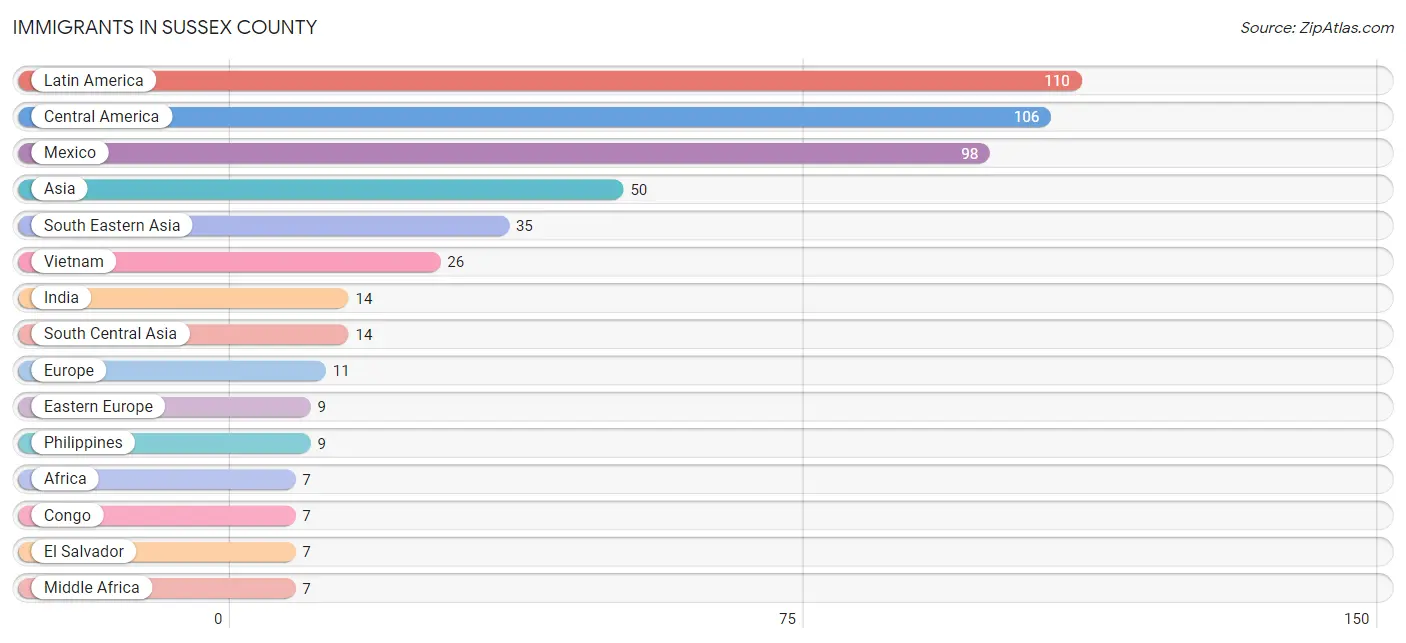
| Immigration Origin | # Population | % Population |
| Africa | 7 | 0.1% |
| Asia | 50 | 0.5% |
| Central America | 106 | 1.0% |
| Congo | 7 | 0.1% |
| Eastern Asia | 1 | 0.0% |
| Eastern Europe | 9 | 0.1% |
| El Salvador | 7 | 0.1% |
| Europe | 11 | 0.1% |
| Germany | 2 | 0.0% |
| Honduras | 1 | 0.0% |
| India | 14 | 0.1% |
| Japan | 1 | 0.0% |
| Latin America | 110 | 1.0% |
| Mexico | 98 | 0.9% |
| Middle Africa | 7 | 0.1% |
| Peru | 4 | 0.0% |
| Philippines | 9 | 0.1% |
| Poland | 2 | 0.0% |
| Serbia | 7 | 0.1% |
| South America | 4 | 0.0% |
| South Central Asia | 14 | 0.1% |
| South Eastern Asia | 35 | 0.3% |
| Vietnam | 26 | 0.2% |
| Western Europe | 2 | 0.0% | View All 24 Rows |
Sex and Age in Sussex County
Sex and Age in Sussex County
The most populous age groups in Sussex County are 30 to 34 Years (741 | 11.7%) for men and 60 to 64 Years (465 | 10.2%) for women.
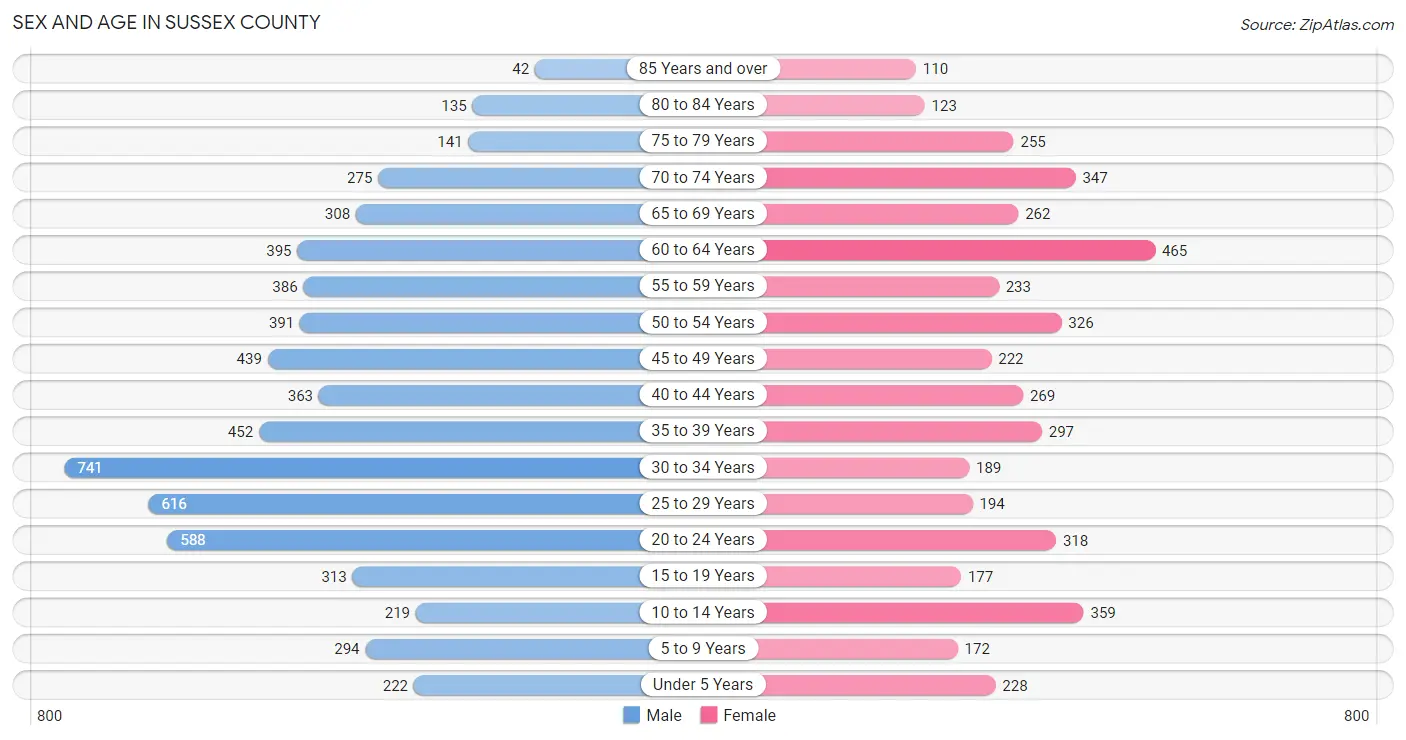
| Age Bracket | Male | Female |
| Under 5 Years | 222 (3.5%) | 228 (5.0%) |
| 5 to 9 Years | 294 (4.6%) | 172 (3.8%) |
| 10 to 14 Years | 219 (3.5%) | 359 (7.9%) |
| 15 to 19 Years | 313 (5.0%) | 177 (3.9%) |
| 20 to 24 Years | 588 (9.3%) | 318 (7.0%) |
| 25 to 29 Years | 616 (9.8%) | 194 (4.3%) |
| 30 to 34 Years | 741 (11.7%) | 189 (4.2%) |
| 35 to 39 Years | 452 (7.1%) | 297 (6.5%) |
| 40 to 44 Years | 363 (5.7%) | 269 (5.9%) |
| 45 to 49 Years | 439 (7.0%) | 222 (4.9%) |
| 50 to 54 Years | 391 (6.2%) | 326 (7.2%) |
| 55 to 59 Years | 386 (6.1%) | 233 (5.1%) |
| 60 to 64 Years | 395 (6.2%) | 465 (10.2%) |
| 65 to 69 Years | 308 (4.9%) | 262 (5.8%) |
| 70 to 74 Years | 275 (4.3%) | 347 (7.6%) |
| 75 to 79 Years | 141 (2.2%) | 255 (5.6%) |
| 80 to 84 Years | 135 (2.1%) | 123 (2.7%) |
| 85 Years and over | 42 (0.7%) | 110 (2.4%) |
| Total | 6,320 (100.0%) | 4,546 (100.0%) |
Families and Households in Sussex County
Median Family Size in Sussex County
The median family size in Sussex County is 3.30 persons per family, with single female/mother families (528 | 23.4%) accounting for the largest median family size of 4.07 persons per family. On the other hand, single male/father families (314 | 13.9%) represent the smallest median family size with 2.75 persons per family.
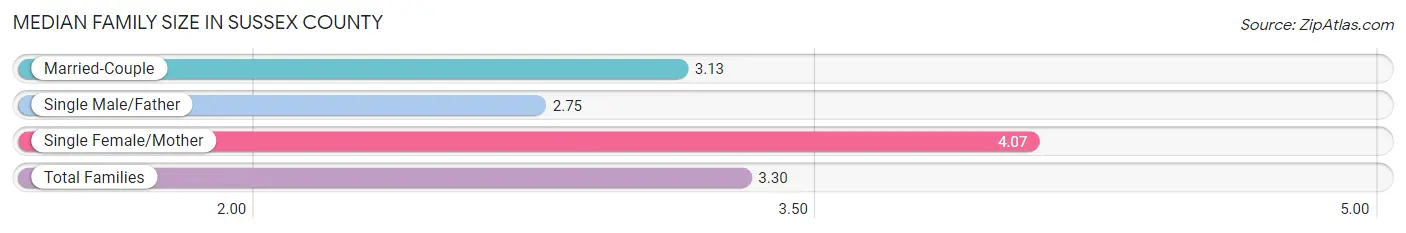
| Family Type | # Families | Family Size |
| Married-Couple | 1,419 (62.8%) | 3.13 |
| Single Male/Father | 314 (13.9%) | 2.75 |
| Single Female/Mother | 528 (23.4%) | 4.07 |
| Total Families | 2,261 (100.0%) | 3.30 |
Median Household Size in Sussex County
The median household size in Sussex County is 2.53 persons per household, with single female/mother households (528 | 14.3%) accounting for the largest median household size of 4.12 persons per household. non-family households (1,437 | 38.9%) represent the smallest median household size with 1.16 persons per household.
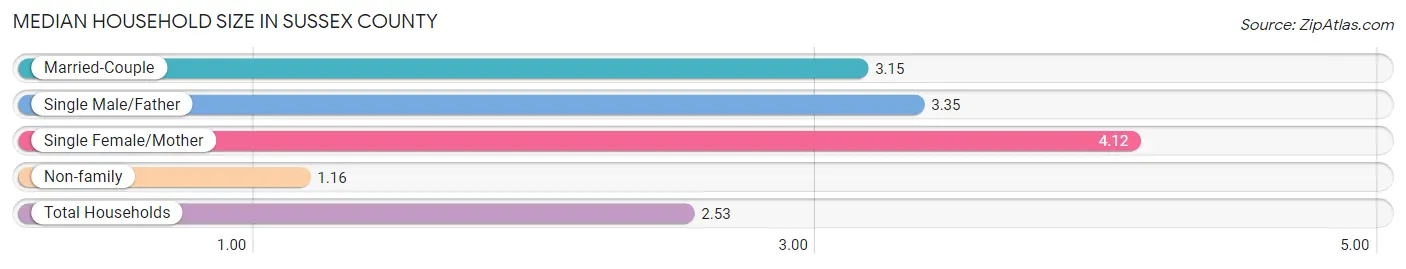
| Household Type | # Households | Household Size |
| Married-Couple | 1,419 (38.4%) | 3.15 |
| Single Male/Father | 314 (8.5%) | 3.35 |
| Single Female/Mother | 528 (14.3%) | 4.12 |
| Non-family | 1,437 (38.9%) | 1.16 |
| Total Households | 3,698 (100.0%) | 2.53 |
Household Size by Marriage Status in Sussex County
Out of a total of 3,698 households in Sussex County, 2,261 (61.1%) are family households, while 1,437 (38.9%) are nonfamily households. The most numerous type of family households are 2-person households, comprising 1,264, and the most common type of nonfamily households are 1-person households, comprising 1,305.
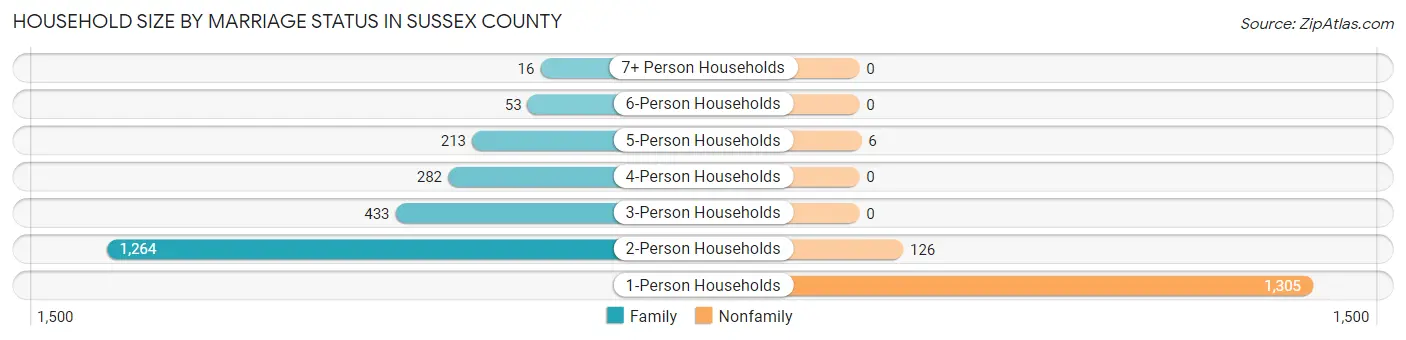
| Household Size | Family Households | Nonfamily Households |
| 1-Person Households | - | 1,305 (35.3%) |
| 2-Person Households | 1,264 (34.2%) | 126 (3.4%) |
| 3-Person Households | 433 (11.7%) | 0 (0.0%) |
| 4-Person Households | 282 (7.6%) | 0 (0.0%) |
| 5-Person Households | 213 (5.8%) | 6 (0.2%) |
| 6-Person Households | 53 (1.4%) | 0 (0.0%) |
| 7+ Person Households | 16 (0.4%) | 0 (0.0%) |
| Total | 2,261 (61.1%) | 1,437 (38.9%) |
Female Fertility in Sussex County
Fertility by Age in Sussex County
Average fertility rate in Sussex County is 78.0 births per 1,000 women. Women in the age bracket of 20 to 34 years have the highest fertility rate with 184.0 births per 1,000 women. Women in the age bracket of 20 to 34 years acount for 96.3% of all women with births.
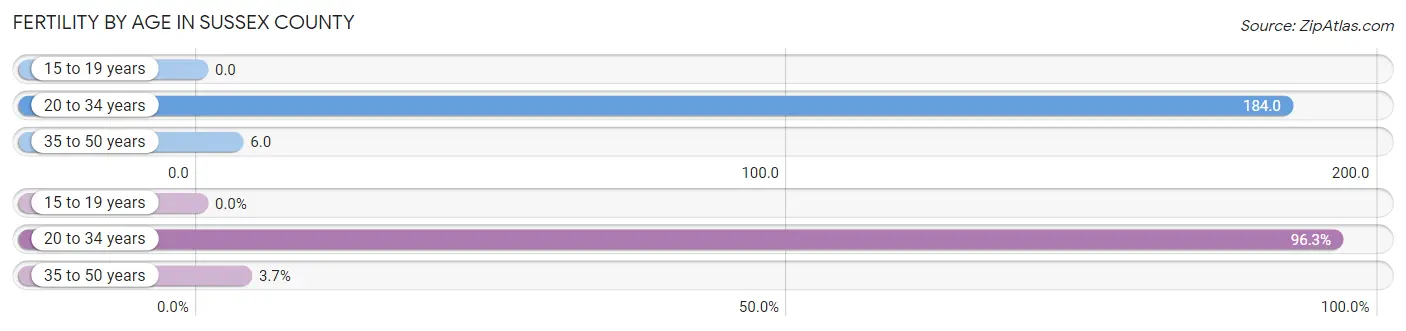
| Age Bracket | Women with Births | Births / 1,000 Women |
| 15 to 19 years | 0 (0.0%) | 0.0 |
| 20 to 34 years | 129 (96.3%) | 184.0 |
| 35 to 50 years | 5 (3.7%) | 6.0 |
| Total | 134 (100.0%) | 78.0 |
Fertility by Age by Marriage Status in Sussex County
6.7% of women with births (134) in Sussex County are married. The highest percentage of unmarried women with births falls into 20 to 34 years age bracket with 93.8% of them unmarried at the time of birth, while the lowest percentage of unmarried women with births belong to 35 to 50 years age bracket with 80.0% of them unmarried.
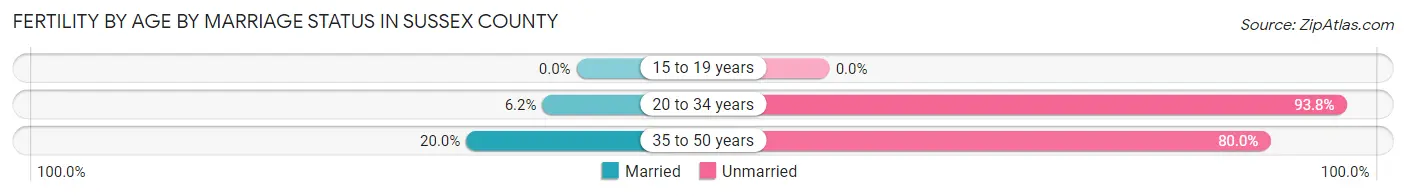
| Age Bracket | Married | Unmarried |
| 15 to 19 years | 0 (0.0%) | 0 (0.0%) |
| 20 to 34 years | 8 (6.2%) | 121 (93.8%) |
| 35 to 50 years | 1 (20.0%) | 4 (80.0%) |
| Total | 9 (6.7%) | 125 (93.3%) |
Fertility by Education in Sussex County
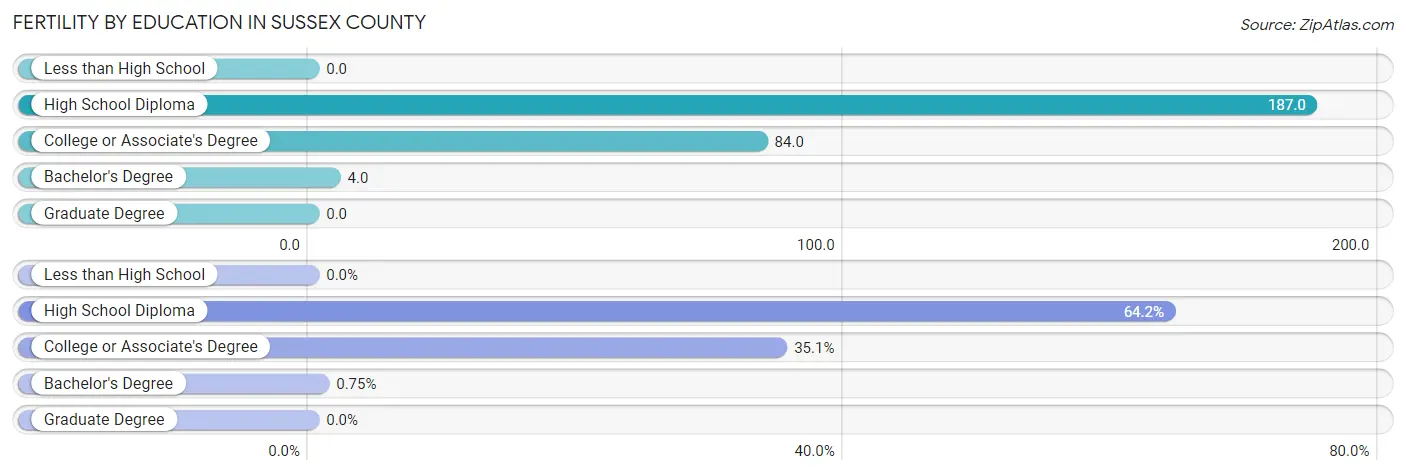
| Educational Attainment | Women with Births | Births / 1,000 Women |
| Less than High School | 0 (0.0%) | 0.0 |
| High School Diploma | 86 (64.2%) | 187.0 |
| College or Associate's Degree | 47 (35.1%) | 84.0 |
| Bachelor's Degree | 1 (0.7%) | 4.0 |
| Graduate Degree | 0 (0.0%) | 0.0 |
| Total | 134 (100.0%) | 78.0 |
Fertility by Education by Marriage Status in Sussex County
93.3% of women with births in Sussex County are unmarried. Women with the educational attainment of bachelor's degree are most likely to be married with 100.0% of them married at childbirth, while women with the educational attainment of high school diploma are least likely to be married with 100.0% of them unmarried at childbirth.
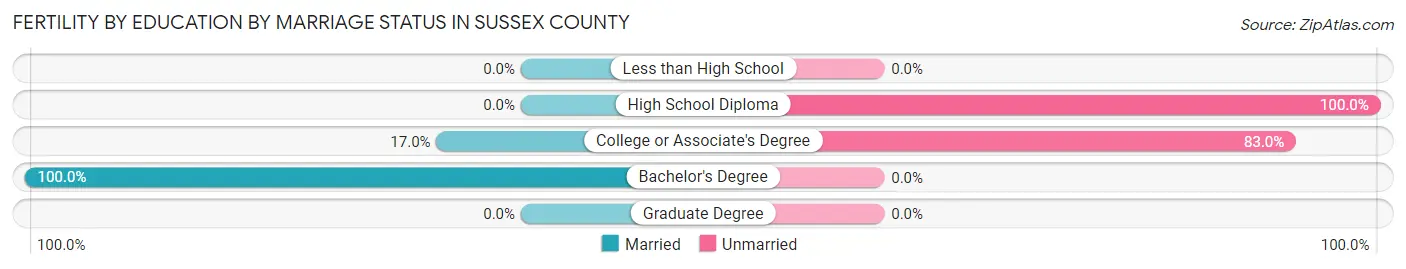
| Educational Attainment | Married | Unmarried |
| Less than High School | 0 (0.0%) | 0 (0.0%) |
| High School Diploma | 0 (0.0%) | 86 (100.0%) |
| College or Associate's Degree | 8 (17.0%) | 39 (83.0%) |
| Bachelor's Degree | 1 (100.0%) | 0 (0.0%) |
| Graduate Degree | 0 (0.0%) | 0 (0.0%) |
| Total | 9 (6.7%) | 125 (93.3%) |
Employment Characteristics in Sussex County
Employment by Class of Employer in Sussex County
Among the 4,307 employed individuals in Sussex County, private company employees (3,033 | 70.4%), local government employees (422 | 9.8%), and state government employees (296 | 6.9%) make up the most common classes of employment.
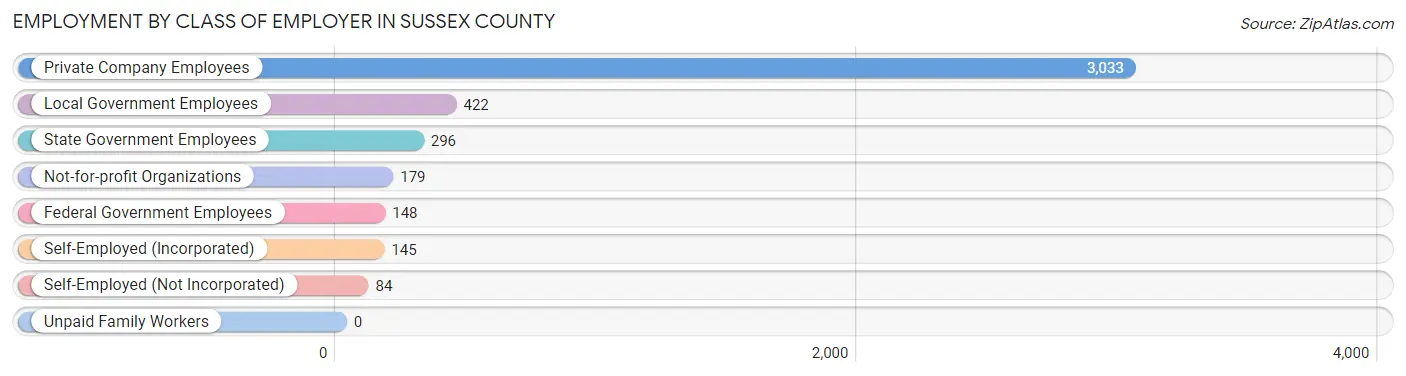
| Employer Class | # Employees | % Employees |
| Private Company Employees | 3,033 | 70.4% |
| Self-Employed (Incorporated) | 145 | 3.4% |
| Self-Employed (Not Incorporated) | 84 | 1.9% |
| Not-for-profit Organizations | 179 | 4.2% |
| Local Government Employees | 422 | 9.8% |
| State Government Employees | 296 | 6.9% |
| Federal Government Employees | 148 | 3.4% |
| Unpaid Family Workers | 0 | 0.0% |
| Total | 4,307 | 100.0% |
Employment Status by Age in Sussex County
According to the labor force statistics for Sussex County, out of the total population over 16 years of age (9,236), 50.0% or 4,618 individuals are in the labor force, with 5.0% or 231 of them unemployed. The age group with the highest labor force participation rate is 45 to 54 years, with 70.4% or 970 individuals in the labor force. Within the labor force, the 20 to 24 years age range has the highest percentage of unemployed individuals, with 16.8% or 97 of them being unemployed.
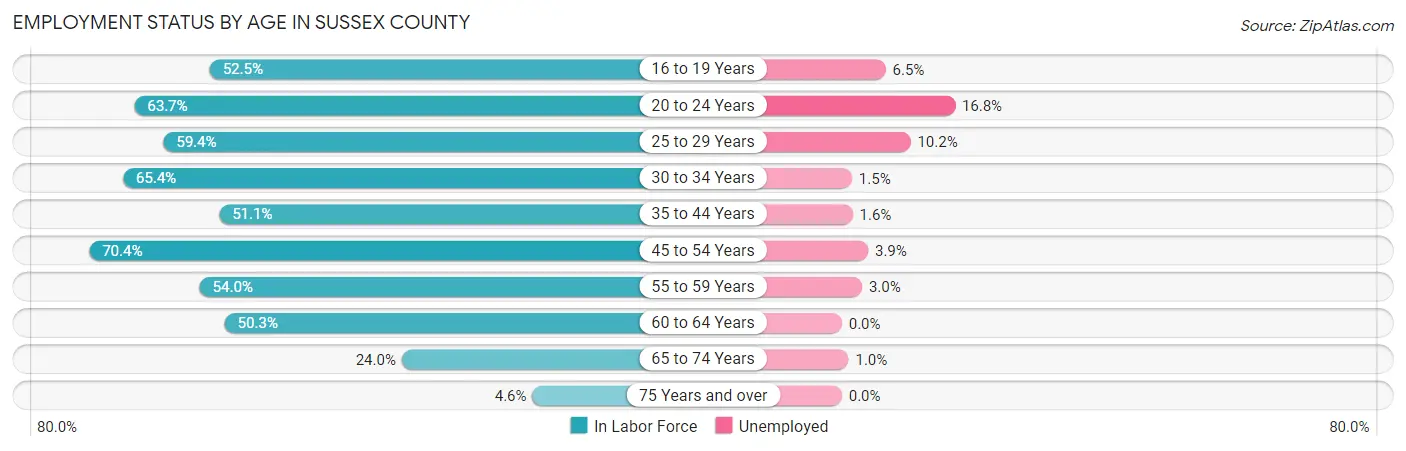
| Age Bracket | In Labor Force | Unemployed |
| 16 to 19 Years | 186 (52.5%) | 12 (6.5%) |
| 20 to 24 Years | 577 (63.7%) | 97 (16.8%) |
| 25 to 29 Years | 481 (59.4%) | 49 (10.2%) |
| 30 to 34 Years | 608 (65.4%) | 9 (1.5%) |
| 35 to 44 Years | 706 (51.1%) | 11 (1.6%) |
| 45 to 54 Years | 970 (70.4%) | 38 (3.9%) |
| 55 to 59 Years | 334 (54.0%) | 10 (3.0%) |
| 60 to 64 Years | 433 (50.3%) | 0 (0.0%) |
| 65 to 74 Years | 286 (24.0%) | 3 (1.0%) |
| 75 Years and over | 37 (4.6%) | 0 (0.0%) |
| Total | 4,618 (50.0%) | 231 (5.0%) |
Employment Status by Educational Attainment in Sussex County
According to labor force statistics for Sussex County, 59.1% of individuals (3,533) out of the total population between 25 and 64 years of age (5,978) are in the labor force, with 3.3% or 117 of them being unemployed. The group with the highest labor force participation rate are those with the educational attainment of bachelor's degree or higher, with 81.6% or 835 individuals in the labor force. Within the labor force, individuals with college / associate degree education have the highest percentage of unemployment, with 4.9% or 62 of them being unemployed.
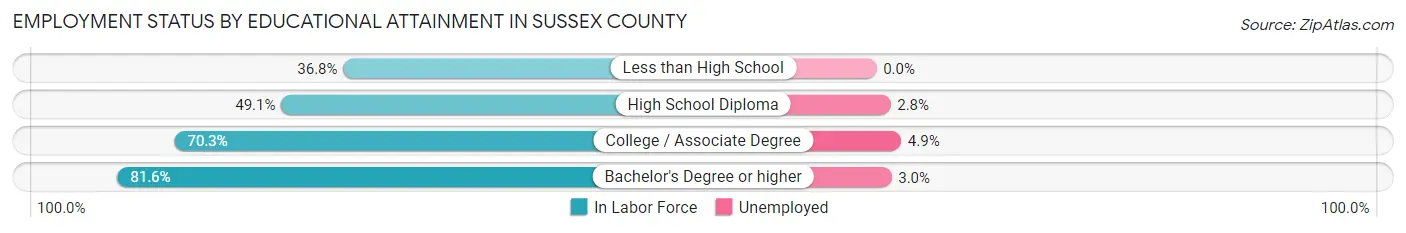
| Educational Attainment | In Labor Force | Unemployed |
| Less than High School | 351 (36.8%) | 0 (0.0%) |
| High School Diploma | 1,083 (49.1%) | 62 (2.8%) |
| College / Associate Degree | 1,263 (70.3%) | 88 (4.9%) |
| Bachelor's Degree or higher | 835 (81.6%) | 31 (3.0%) |
| Total | 3,533 (59.1%) | 197 (3.3%) |
Employment Occupations by Sex in Sussex County
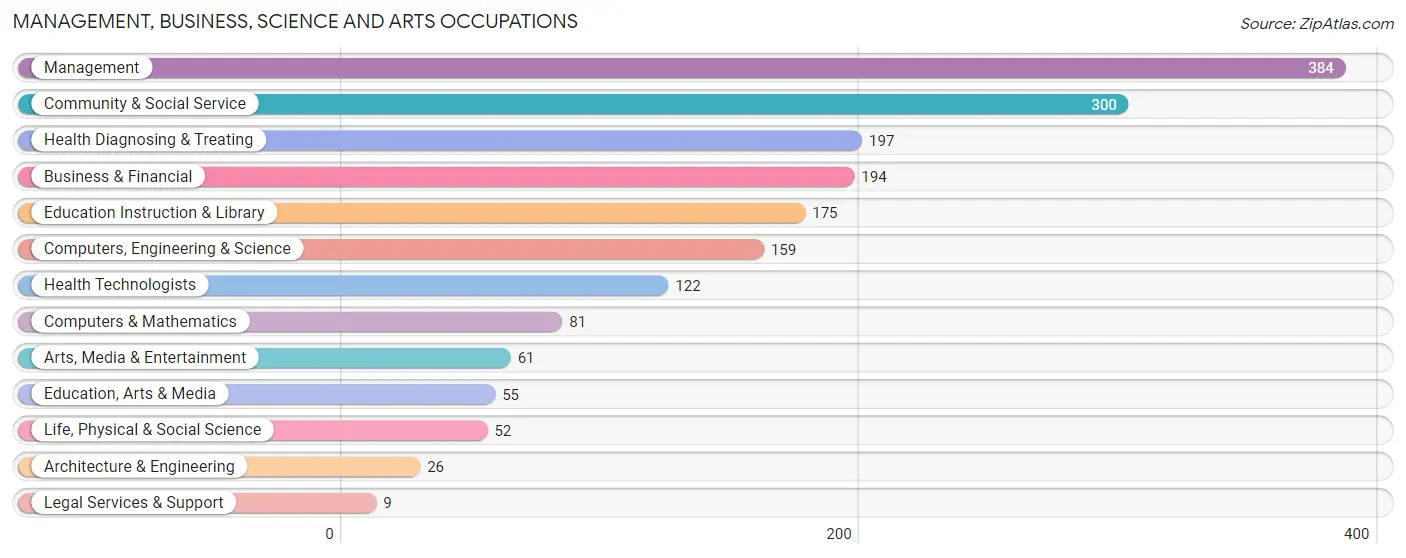
Management, Business, Science and Arts Occupations
The most common Management, Business, Science and Arts occupations in Sussex County are Management (384 | 8.8%), Community & Social Service (300 | 6.9%), Health Diagnosing & Treating (197 | 4.5%), Business & Financial (194 | 4.4%), and Education Instruction & Library (175 | 4.0%).
Management, Business, Science and Arts Occupations by Sex
Within the Management, Business, Science and Arts occupations in Sussex County, the most male-oriented occupations are Architecture & Engineering (100.0%), Life, Physical & Social Science (73.1%), and Management (66.9%), while the most female-oriented occupations are Legal Services & Support (100.0%), Health Diagnosing & Treating (93.9%), and Health Technologists (92.6%).
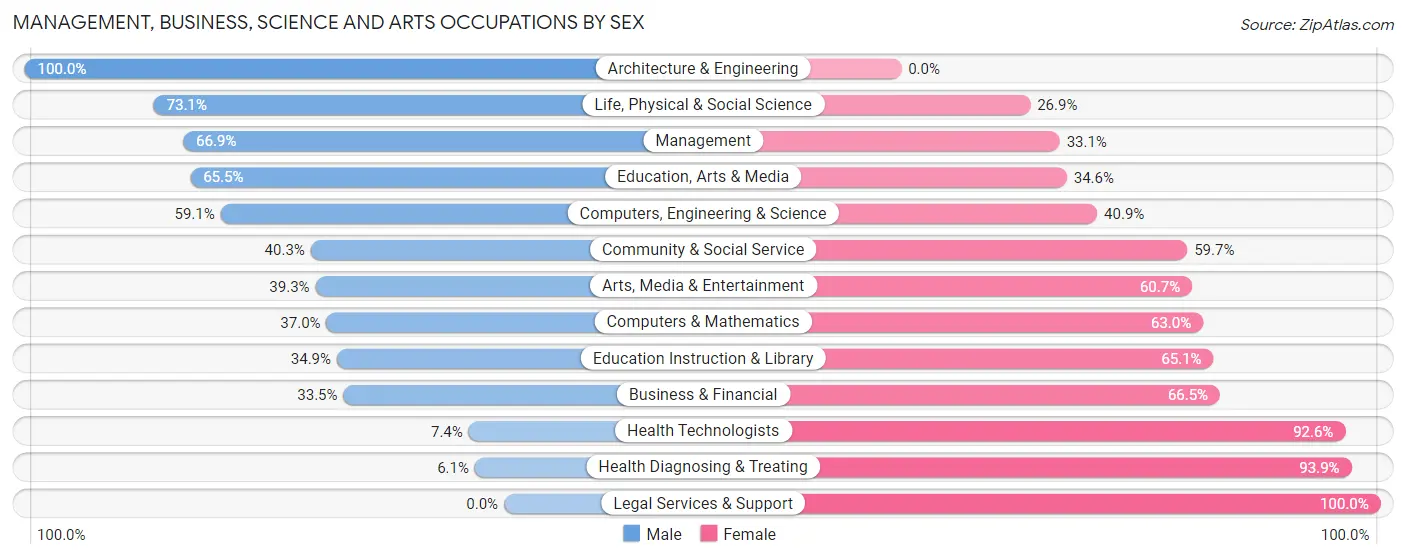
| Occupation | Male | Female |
| Management | 257 (66.9%) | 127 (33.1%) |
| Business & Financial | 65 (33.5%) | 129 (66.5%) |
| Computers, Engineering & Science | 94 (59.1%) | 65 (40.9%) |
| Computers & Mathematics | 30 (37.0%) | 51 (63.0%) |
| Architecture & Engineering | 26 (100.0%) | 0 (0.0%) |
| Life, Physical & Social Science | 38 (73.1%) | 14 (26.9%) |
| Community & Social Service | 121 (40.3%) | 179 (59.7%) |
| Education, Arts & Media | 36 (65.4%) | 19 (34.5%) |
| Legal Services & Support | 0 (0.0%) | 9 (100.0%) |
| Education Instruction & Library | 61 (34.9%) | 114 (65.1%) |
| Arts, Media & Entertainment | 24 (39.3%) | 37 (60.7%) |
| Health Diagnosing & Treating | 12 (6.1%) | 185 (93.9%) |
| Health Technologists | 9 (7.4%) | 113 (92.6%) |
| Total (Category) | 549 (44.5%) | 685 (55.5%) |
| Total (Overall) | 2,707 (61.8%) | 1,675 (38.2%) |
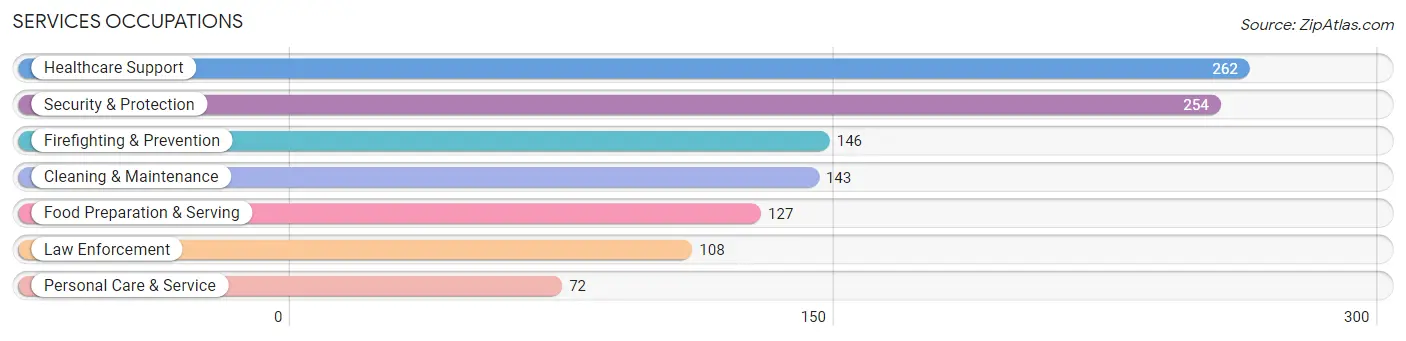
Services Occupations
The most common Services occupations in Sussex County are Healthcare Support (262 | 6.0%), Security & Protection (254 | 5.8%), Firefighting & Prevention (146 | 3.3%), Cleaning & Maintenance (143 | 3.3%), and Food Preparation & Serving (127 | 2.9%).
Services Occupations by Sex
Within the Services occupations in Sussex County, the most male-oriented occupations are Law Enforcement (84.3%), Healthcare Support (77.1%), and Security & Protection (63.0%), while the most female-oriented occupations are Food Preparation & Serving (83.5%), Personal Care & Service (52.8%), and Firefighting & Prevention (52.7%).
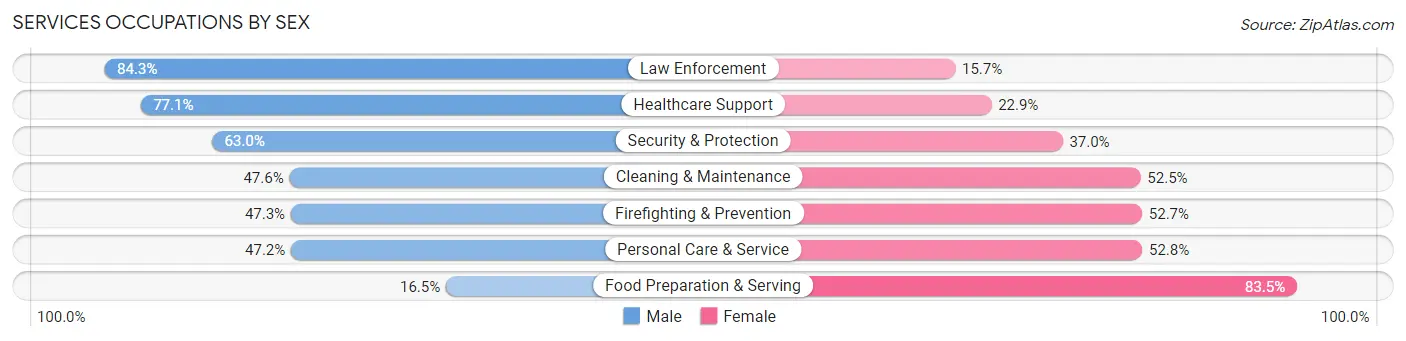
| Occupation | Male | Female |
| Healthcare Support | 202 (77.1%) | 60 (22.9%) |
| Security & Protection | 160 (63.0%) | 94 (37.0%) |
| Firefighting & Prevention | 69 (47.3%) | 77 (52.7%) |
| Law Enforcement | 91 (84.3%) | 17 (15.7%) |
| Food Preparation & Serving | 21 (16.5%) | 106 (83.5%) |
| Cleaning & Maintenance | 68 (47.5%) | 75 (52.4%) |
| Personal Care & Service | 34 (47.2%) | 38 (52.8%) |
| Total (Category) | 485 (56.5%) | 373 (43.5%) |
| Total (Overall) | 2,707 (61.8%) | 1,675 (38.2%) |
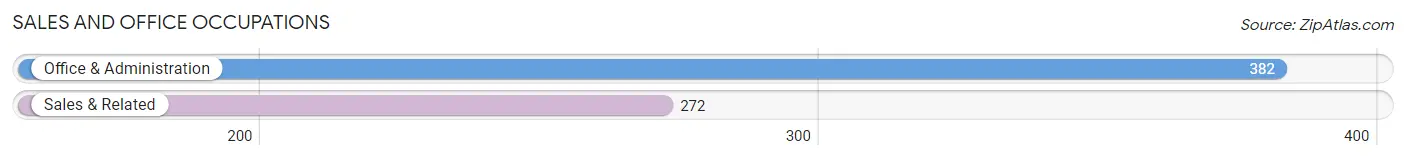
Sales and Office Occupations
The most common Sales and Office occupations in Sussex County are Office & Administration (382 | 8.7%), and Sales & Related (272 | 6.2%).
Sales and Office Occupations by Sex
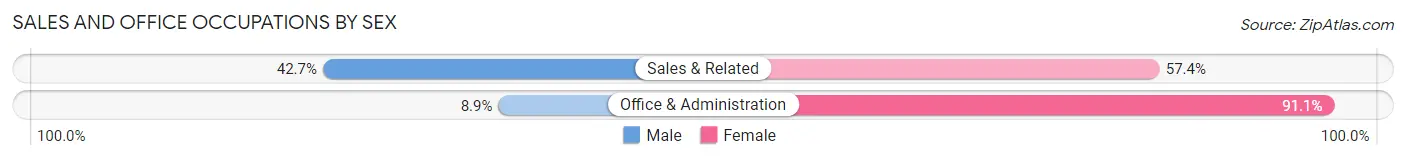
| Occupation | Male | Female |
| Sales & Related | 116 (42.6%) | 156 (57.4%) |
| Office & Administration | 34 (8.9%) | 348 (91.1%) |
| Total (Category) | 150 (22.9%) | 504 (77.1%) |
| Total (Overall) | 2,707 (61.8%) | 1,675 (38.2%) |
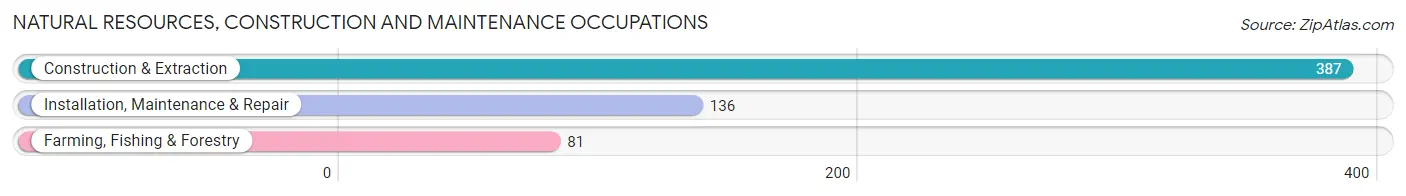
Natural Resources, Construction and Maintenance Occupations
The most common Natural Resources, Construction and Maintenance occupations in Sussex County are Construction & Extraction (387 | 8.8%), Installation, Maintenance & Repair (136 | 3.1%), and Farming, Fishing & Forestry (81 | 1.8%).
Natural Resources, Construction and Maintenance Occupations by Sex
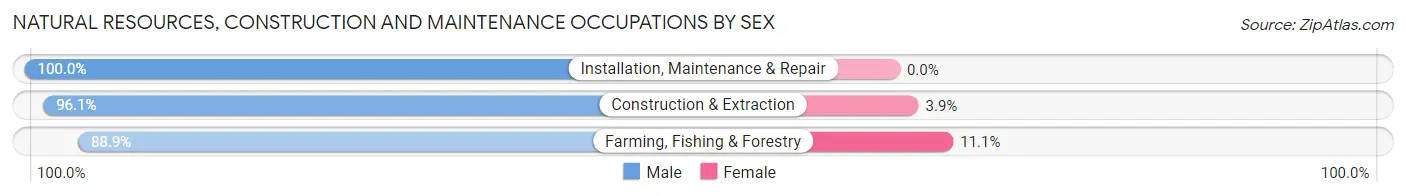
| Occupation | Male | Female |
| Farming, Fishing & Forestry | 72 (88.9%) | 9 (11.1%) |
| Construction & Extraction | 372 (96.1%) | 15 (3.9%) |
| Installation, Maintenance & Repair | 136 (100.0%) | 0 (0.0%) |
| Total (Category) | 580 (96.0%) | 24 (4.0%) |
| Total (Overall) | 2,707 (61.8%) | 1,675 (38.2%) |
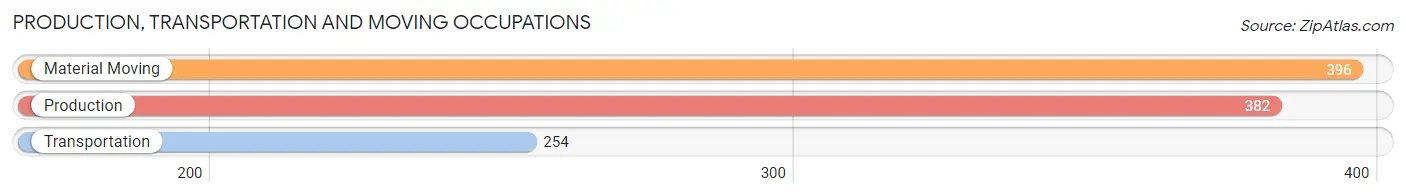
Production, Transportation and Moving Occupations
The most common Production, Transportation and Moving occupations in Sussex County are Material Moving (396 | 9.0%), Production (382 | 8.7%), and Transportation (254 | 5.8%).
Production, Transportation and Moving Occupations by Sex
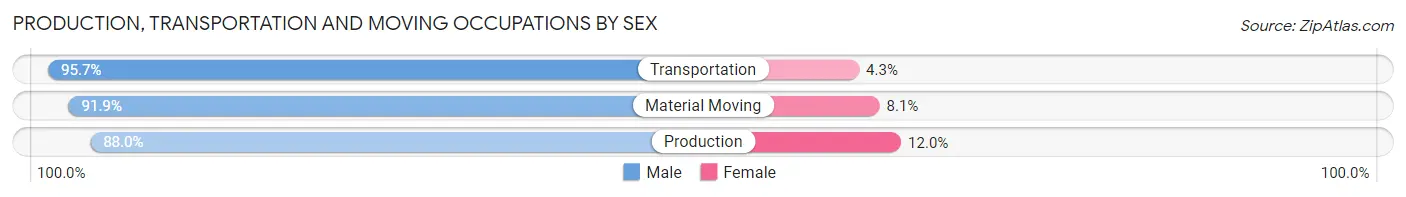
| Occupation | Male | Female |
| Production | 336 (88.0%) | 46 (12.0%) |
| Transportation | 243 (95.7%) | 11 (4.3%) |
| Material Moving | 364 (91.9%) | 32 (8.1%) |
| Total (Category) | 943 (91.4%) | 89 (8.6%) |
| Total (Overall) | 2,707 (61.8%) | 1,675 (38.2%) |
Employment Industries by Sex in Sussex County
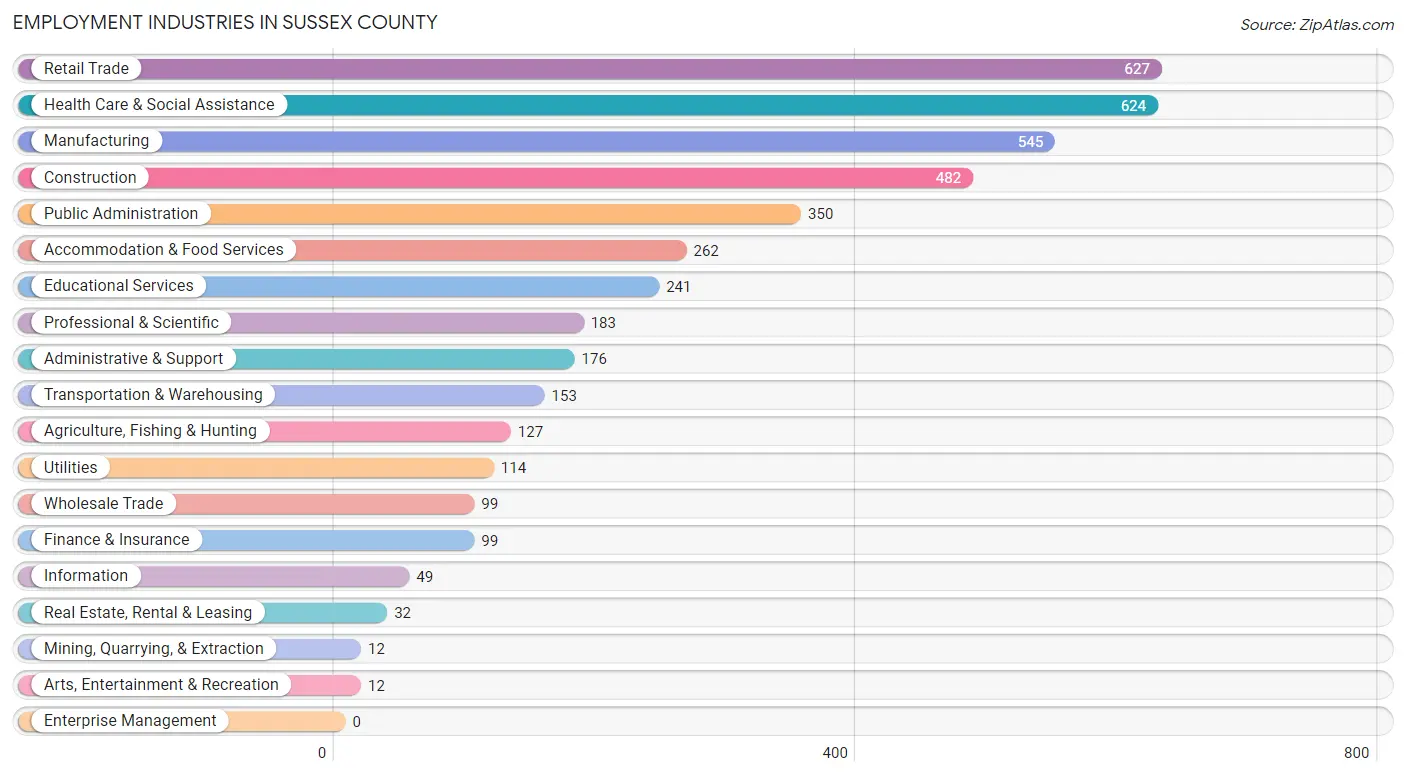
Employment Industries in Sussex County
The major employment industries in Sussex County include Retail Trade (627 | 14.3%), Health Care & Social Assistance (624 | 14.2%), Manufacturing (545 | 12.4%), Construction (482 | 11.0%), and Public Administration (350 | 8.0%).
Employment Industries by Sex in Sussex County
The Sussex County industries that see more men than women are Arts, Entertainment & Recreation (100.0%), Construction (98.8%), and Agriculture, Fishing & Hunting (96.9%), whereas the industries that tend to have a higher number of women are Finance & Insurance (100.0%), Accommodation & Food Services (79.0%), and Educational Services (61.0%).
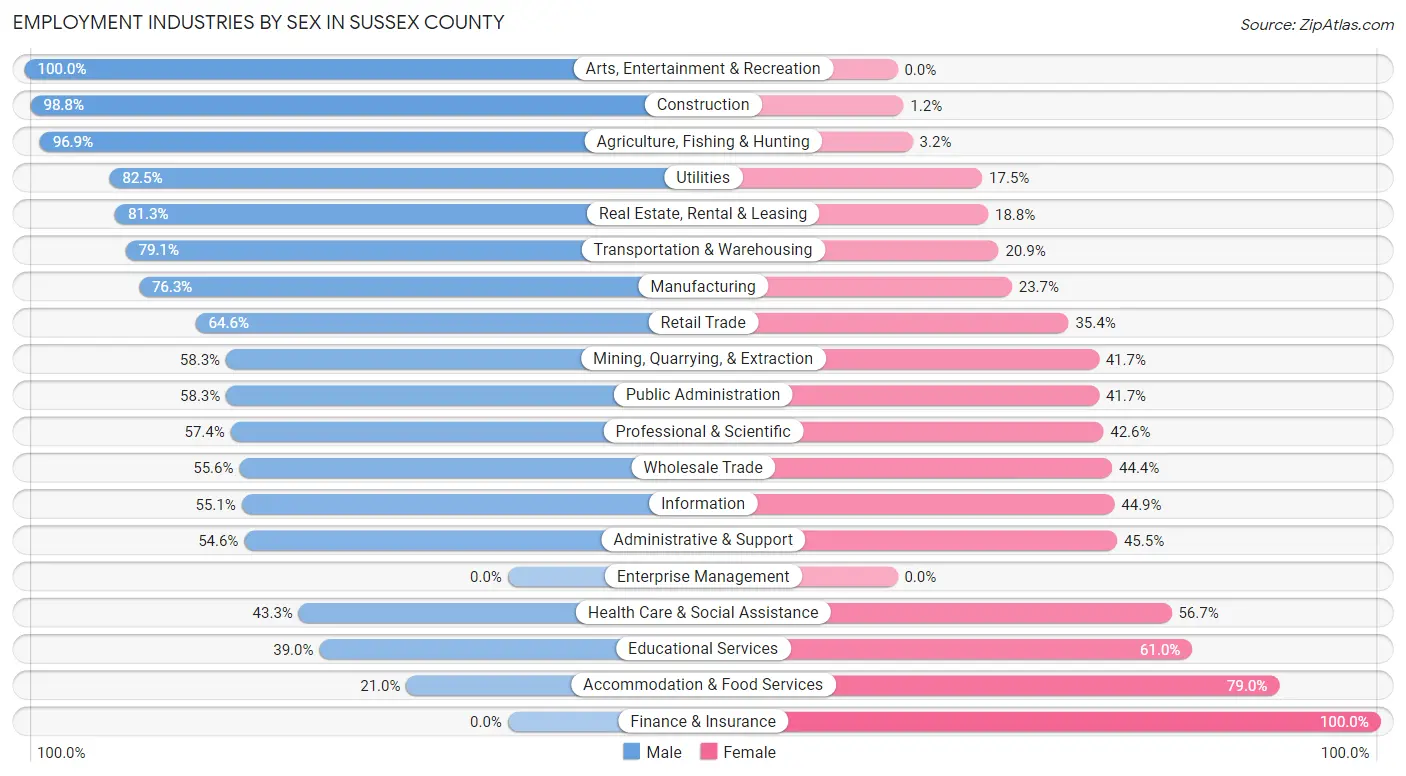
| Industry | Male | Female |
| Agriculture, Fishing & Hunting | 123 (96.9%) | 4 (3.2%) |
| Mining, Quarrying, & Extraction | 7 (58.3%) | 5 (41.7%) |
| Construction | 476 (98.8%) | 6 (1.2%) |
| Manufacturing | 416 (76.3%) | 129 (23.7%) |
| Wholesale Trade | 55 (55.6%) | 44 (44.4%) |
| Retail Trade | 405 (64.6%) | 222 (35.4%) |
| Transportation & Warehousing | 121 (79.1%) | 32 (20.9%) |
| Utilities | 94 (82.5%) | 20 (17.5%) |
| Information | 27 (55.1%) | 22 (44.9%) |
| Finance & Insurance | 0 (0.0%) | 99 (100.0%) |
| Real Estate, Rental & Leasing | 26 (81.2%) | 6 (18.8%) |
| Professional & Scientific | 105 (57.4%) | 78 (42.6%) |
| Enterprise Management | 0 (0.0%) | 0 (0.0%) |
| Administrative & Support | 96 (54.5%) | 80 (45.5%) |
| Educational Services | 94 (39.0%) | 147 (61.0%) |
| Health Care & Social Assistance | 270 (43.3%) | 354 (56.7%) |
| Arts, Entertainment & Recreation | 12 (100.0%) | 0 (0.0%) |
| Accommodation & Food Services | 55 (21.0%) | 207 (79.0%) |
| Public Administration | 204 (58.3%) | 146 (41.7%) |
| Total | 2,707 (61.8%) | 1,675 (38.2%) |
Education in Sussex County
School Enrollment in Sussex County
The most common levels of schooling among the 1,913 students in Sussex County are elementary school (483 | 25.3%), middle school (400 | 20.9%), and high school (400 | 20.9%).
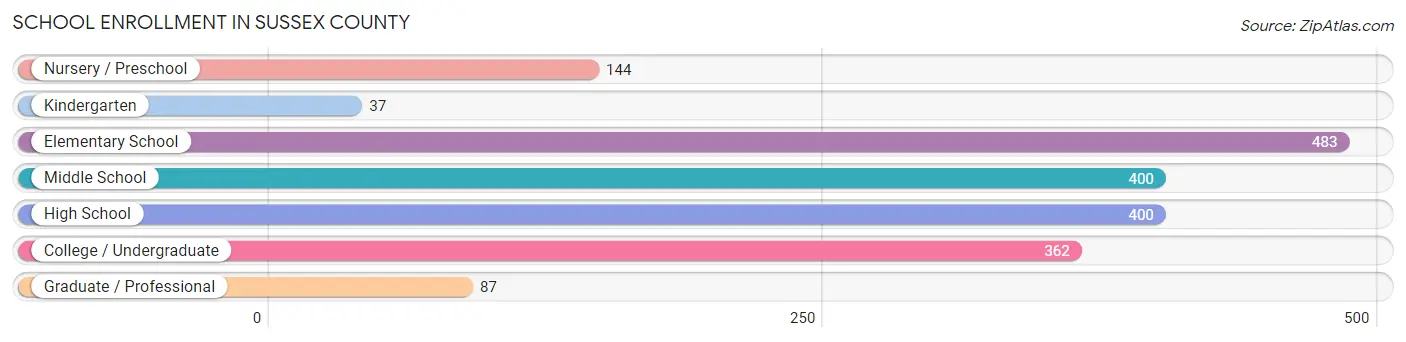
| School Level | # Students | % Students |
| Nursery / Preschool | 144 | 7.5% |
| Kindergarten | 37 | 1.9% |
| Elementary School | 483 | 25.3% |
| Middle School | 400 | 20.9% |
| High School | 400 | 20.9% |
| College / Undergraduate | 362 | 18.9% |
| Graduate / Professional | 87 | 4.5% |
| Total | 1,913 | 100.0% |
School Enrollment by Age by Funding Source in Sussex County
Out of a total of 1,913 students who are enrolled in schools in Sussex County, 409 (21.4%) attend a private institution, while the remaining 1,504 (78.6%) are enrolled in public schools. The age group of 3 to 4 year olds has the highest likelihood of being enrolled in private schools, with 75 (70.1% in the age bracket) enrolled. Conversely, the age group of 25 to 34 year olds has the lowest likelihood of being enrolled in a private school, with 138 (100.0% in the age bracket) attending a public institution.
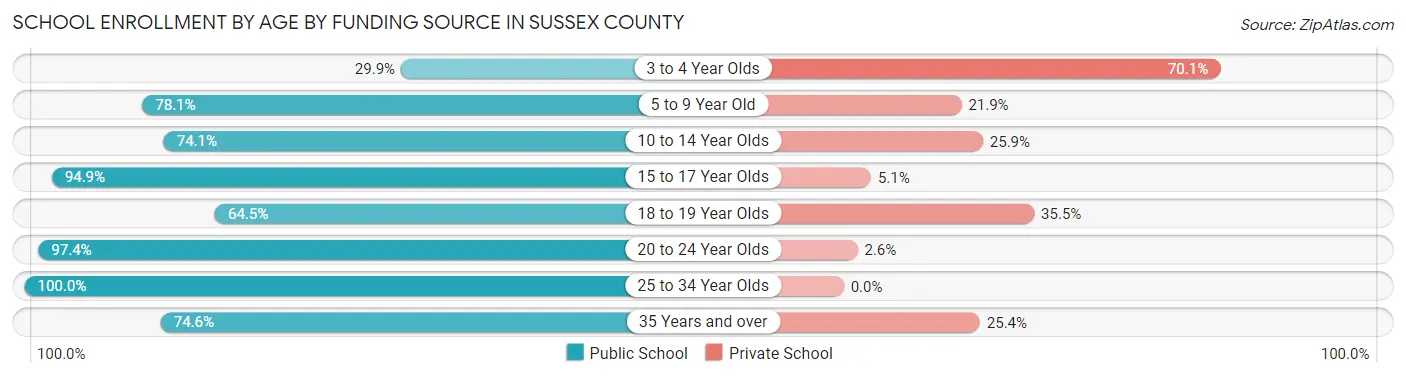
| Age Bracket | Public School | Private School |
| 3 to 4 Year Olds | 32 (29.9%) | 75 (70.1%) |
| 5 to 9 Year Old | 306 (78.1%) | 86 (21.9%) |
| 10 to 14 Year Olds | 420 (74.1%) | 147 (25.9%) |
| 15 to 17 Year Olds | 243 (94.9%) | 13 (5.1%) |
| 18 to 19 Year Olds | 60 (64.5%) | 33 (35.5%) |
| 20 to 24 Year Olds | 151 (97.4%) | 4 (2.6%) |
| 25 to 34 Year Olds | 138 (100.0%) | 0 (0.0%) |
| 35 Years and over | 153 (74.6%) | 52 (25.4%) |
| Total | 1,504 (78.6%) | 409 (21.4%) |
Educational Attainment by Field of Study in Sussex County
Education (196 | 14.2%), arts & humanities (169 | 12.3%), business (165 | 12.0%), liberal arts & history (135 | 9.8%), and science & technology (123 | 8.9%) are the most common fields of study among 1,375 individuals in Sussex County who have obtained a bachelor's degree or higher.
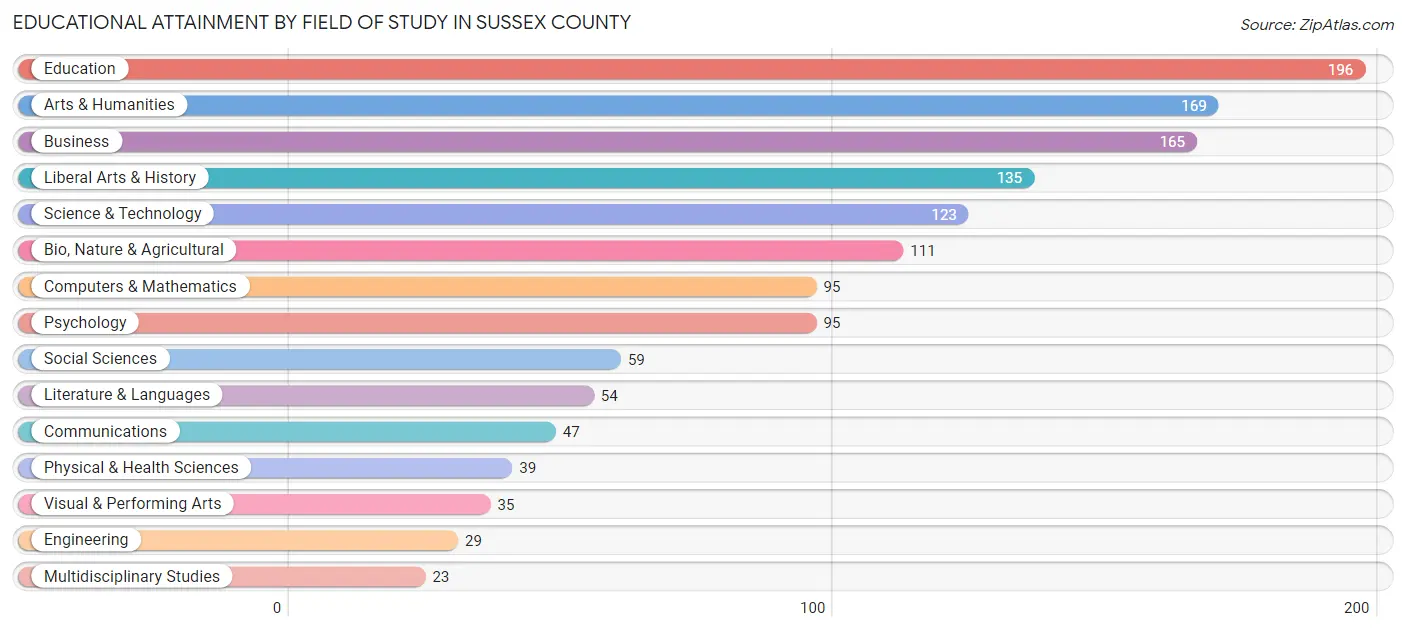
| Field of Study | # Graduates | % Graduates |
| Computers & Mathematics | 95 | 6.9% |
| Bio, Nature & Agricultural | 111 | 8.1% |
| Physical & Health Sciences | 39 | 2.8% |
| Psychology | 95 | 6.9% |
| Social Sciences | 59 | 4.3% |
| Engineering | 29 | 2.1% |
| Multidisciplinary Studies | 23 | 1.7% |
| Science & Technology | 123 | 8.9% |
| Business | 165 | 12.0% |
| Education | 196 | 14.2% |
| Literature & Languages | 54 | 3.9% |
| Liberal Arts & History | 135 | 9.8% |
| Visual & Performing Arts | 35 | 2.5% |
| Communications | 47 | 3.4% |
| Arts & Humanities | 169 | 12.3% |
| Total | 1,375 | 100.0% |
Transportation & Commute in Sussex County
Vehicle Availability by Sex in Sussex County
The most prevalent vehicle ownership categories in Sussex County are males with 2 vehicles (768, accounting for 28.8%) and females with 2 vehicles (574, making up 46.8%).
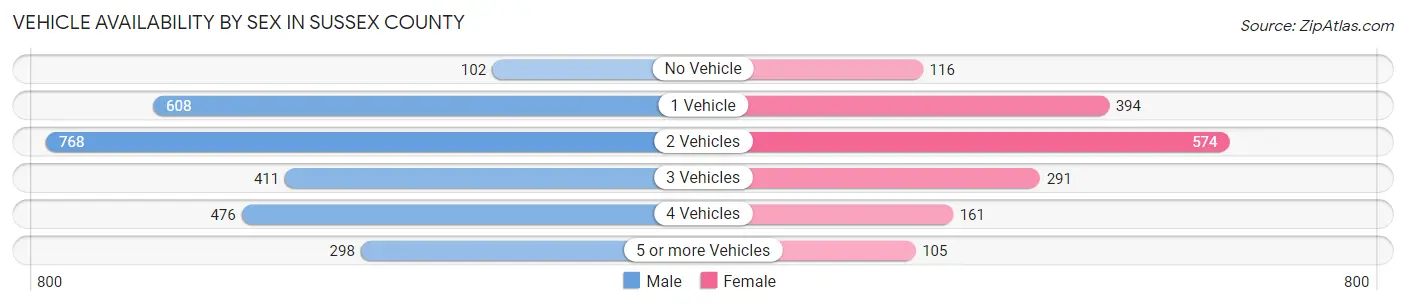
| Vehicles Available | Male | Female |
| No Vehicle | 102 (3.8%) | 116 (7.1%) |
| 1 Vehicle | 608 (22.8%) | 394 (24.0%) |
| 2 Vehicles | 768 (28.8%) | 574 (35.0%) |
| 3 Vehicles | 411 (15.4%) | 291 (17.7%) |
| 4 Vehicles | 476 (17.9%) | 161 (9.8%) |
| 5 or more Vehicles | 298 (11.2%) | 105 (6.4%) |
| Total | 2,663 (100.0%) | 1,641 (100.0%) |
Commute Time in Sussex County
The most frequently occuring commute durations in Sussex County are 45 to 59 minutes (1,058 commuters, 25.7%), 30 to 34 minutes (669 commuters, 16.3%), and 5 to 9 minutes (387 commuters, 9.4%).
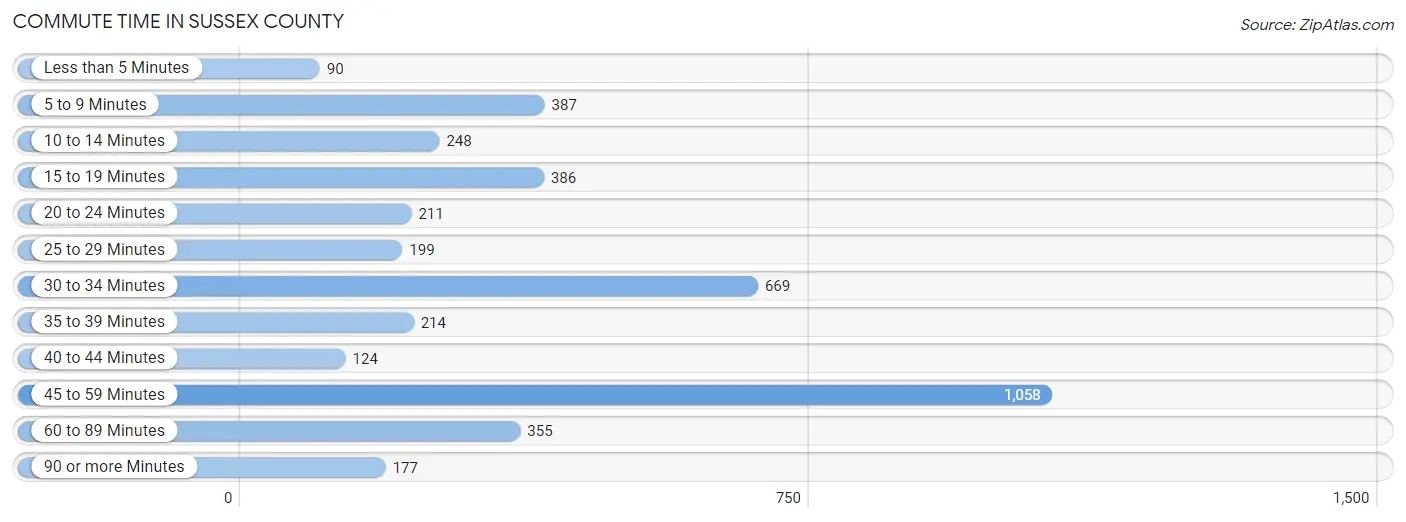
| Commute Time | # Commuters | % Commuters |
| Less than 5 Minutes | 90 | 2.2% |
| 5 to 9 Minutes | 387 | 9.4% |
| 10 to 14 Minutes | 248 | 6.0% |
| 15 to 19 Minutes | 386 | 9.4% |
| 20 to 24 Minutes | 211 | 5.1% |
| 25 to 29 Minutes | 199 | 4.8% |
| 30 to 34 Minutes | 669 | 16.3% |
| 35 to 39 Minutes | 214 | 5.2% |
| 40 to 44 Minutes | 124 | 3.0% |
| 45 to 59 Minutes | 1,058 | 25.7% |
| 60 to 89 Minutes | 355 | 8.6% |
| 90 or more Minutes | 177 | 4.3% |
Commute Time by Sex in Sussex County
The most common commute times in Sussex County are 45 to 59 minutes (734 commuters, 28.0%) for males and 45 to 59 minutes (324 commuters, 21.7%) for females.
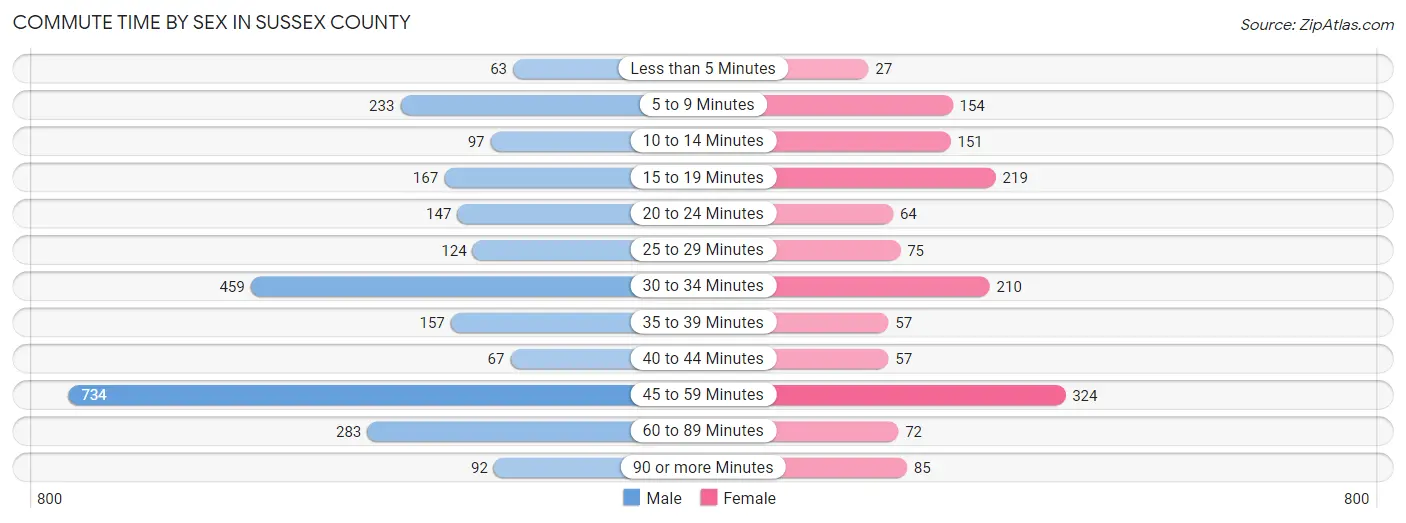
| Commute Time | Male | Female |
| Less than 5 Minutes | 63 (2.4%) | 27 (1.8%) |
| 5 to 9 Minutes | 233 (8.9%) | 154 (10.3%) |
| 10 to 14 Minutes | 97 (3.7%) | 151 (10.1%) |
| 15 to 19 Minutes | 167 (6.4%) | 219 (14.6%) |
| 20 to 24 Minutes | 147 (5.6%) | 64 (4.3%) |
| 25 to 29 Minutes | 124 (4.7%) | 75 (5.0%) |
| 30 to 34 Minutes | 459 (17.5%) | 210 (14.1%) |
| 35 to 39 Minutes | 157 (6.0%) | 57 (3.8%) |
| 40 to 44 Minutes | 67 (2.5%) | 57 (3.8%) |
| 45 to 59 Minutes | 734 (28.0%) | 324 (21.7%) |
| 60 to 89 Minutes | 283 (10.8%) | 72 (4.8%) |
| 90 or more Minutes | 92 (3.5%) | 85 (5.7%) |
Time of Departure to Work by Sex in Sussex County
The most frequent times of departure to work in Sussex County are 7:00 AM to 7:29 AM (386, 14.7%) for males and 6:30 AM to 6:59 AM (245, 16.4%) for females.
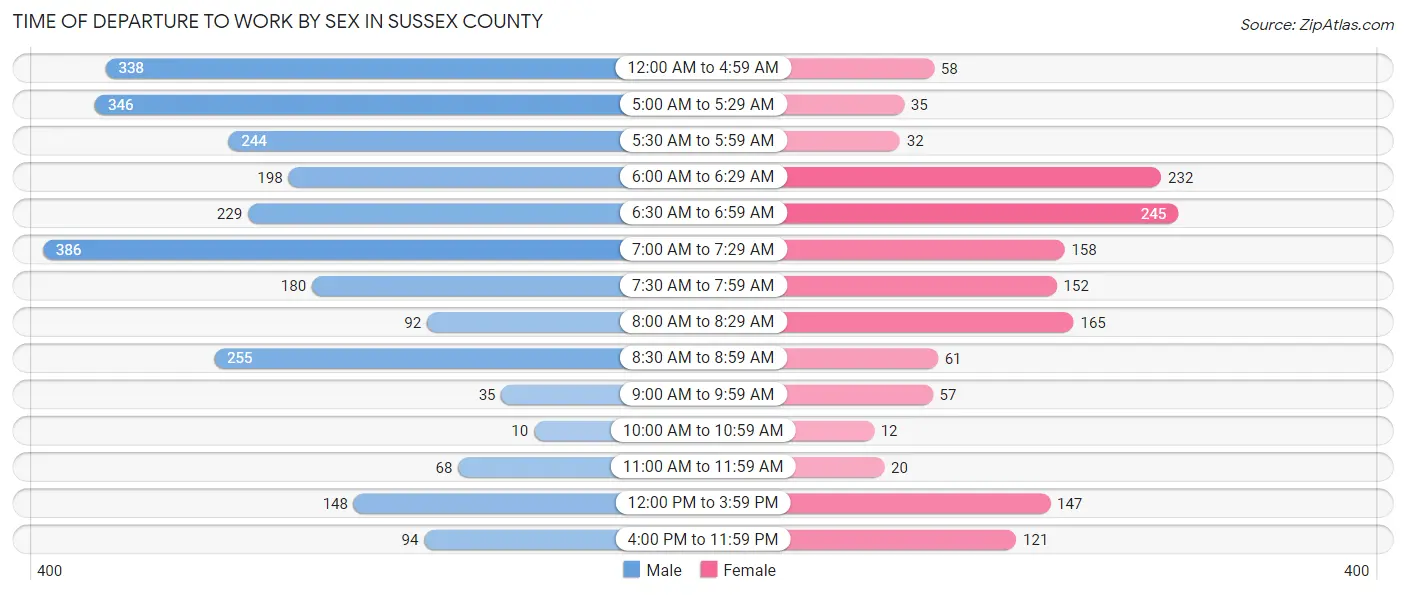
| Time of Departure | Male | Female |
| 12:00 AM to 4:59 AM | 338 (12.9%) | 58 (3.9%) |
| 5:00 AM to 5:29 AM | 346 (13.2%) | 35 (2.3%) |
| 5:30 AM to 5:59 AM | 244 (9.3%) | 32 (2.1%) |
| 6:00 AM to 6:29 AM | 198 (7.5%) | 232 (15.5%) |
| 6:30 AM to 6:59 AM | 229 (8.7%) | 245 (16.4%) |
| 7:00 AM to 7:29 AM | 386 (14.7%) | 158 (10.6%) |
| 7:30 AM to 7:59 AM | 180 (6.9%) | 152 (10.2%) |
| 8:00 AM to 8:29 AM | 92 (3.5%) | 165 (11.0%) |
| 8:30 AM to 8:59 AM | 255 (9.7%) | 61 (4.1%) |
| 9:00 AM to 9:59 AM | 35 (1.3%) | 57 (3.8%) |
| 10:00 AM to 10:59 AM | 10 (0.4%) | 12 (0.8%) |
| 11:00 AM to 11:59 AM | 68 (2.6%) | 20 (1.3%) |
| 12:00 PM to 3:59 PM | 148 (5.6%) | 147 (9.8%) |
| 4:00 PM to 11:59 PM | 94 (3.6%) | 121 (8.1%) |
| Total | 2,623 (100.0%) | 1,495 (100.0%) |
Housing Occupancy in Sussex County
Occupancy by Ownership in Sussex County
Of the total 3,698 dwellings in Sussex County, owner-occupied units account for 2,568 (69.4%), while renter-occupied units make up 1,130 (30.6%).
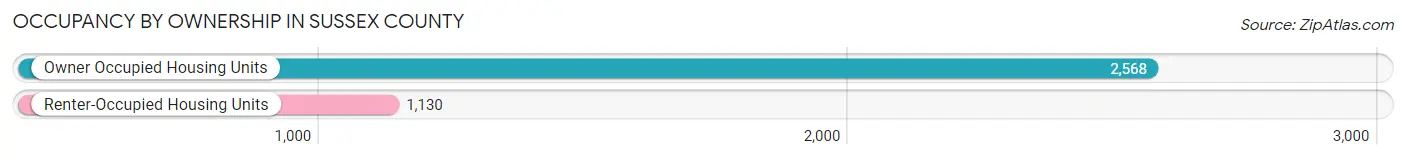
| Occupancy | # Housing Units | % Housing Units |
| Owner Occupied Housing Units | 2,568 | 69.4% |
| Renter-Occupied Housing Units | 1,130 | 30.6% |
| Total Occupied Housing Units | 3,698 | 100.0% |
Occupancy by Household Size in Sussex County
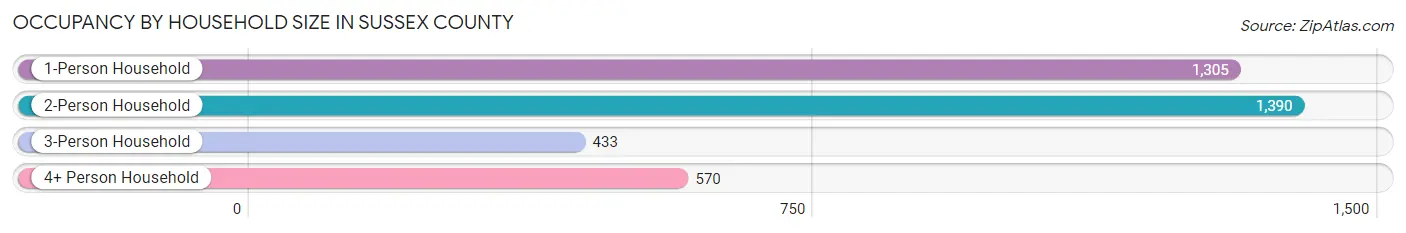
| Household Size | # Housing Units | % Housing Units |
| 1-Person Household | 1,305 | 35.3% |
| 2-Person Household | 1,390 | 37.6% |
| 3-Person Household | 433 | 11.7% |
| 4+ Person Household | 570 | 15.4% |
| Total Housing Units | 3,698 | 100.0% |
Occupancy by Ownership by Household Size in Sussex County
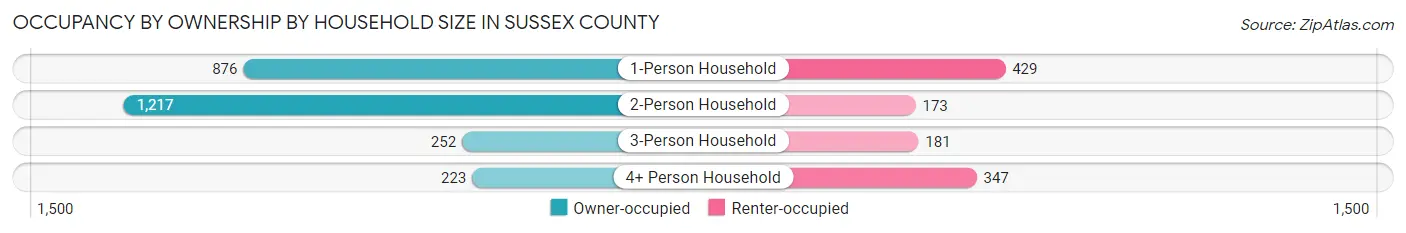
| Household Size | Owner-occupied | Renter-occupied |
| 1-Person Household | 876 (67.1%) | 429 (32.9%) |
| 2-Person Household | 1,217 (87.5%) | 173 (12.4%) |
| 3-Person Household | 252 (58.2%) | 181 (41.8%) |
| 4+ Person Household | 223 (39.1%) | 347 (60.9%) |
| Total Housing Units | 2,568 (69.4%) | 1,130 (30.6%) |
Occupancy by Educational Attainment in Sussex County
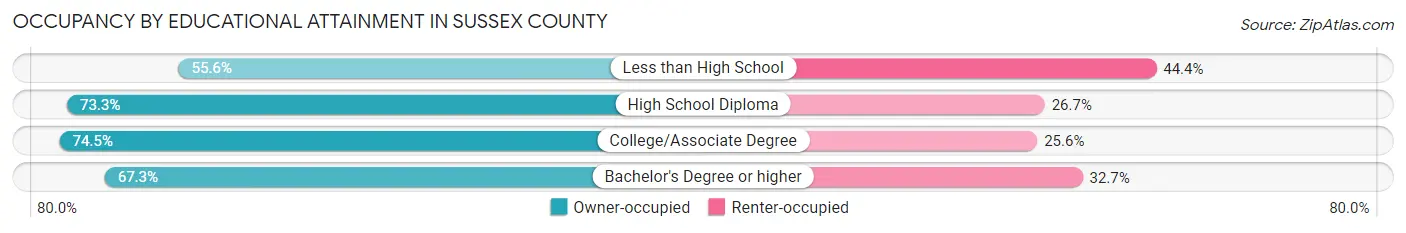
| Household Size | Owner-occupied | Renter-occupied |
| Less than High School | 364 (55.6%) | 291 (44.4%) |
| High School Diploma | 874 (73.3%) | 319 (26.7%) |
| College/Associate Degree | 886 (74.5%) | 304 (25.6%) |
| Bachelor's Degree or higher | 444 (67.3%) | 216 (32.7%) |
Occupancy by Age of Householder in Sussex County
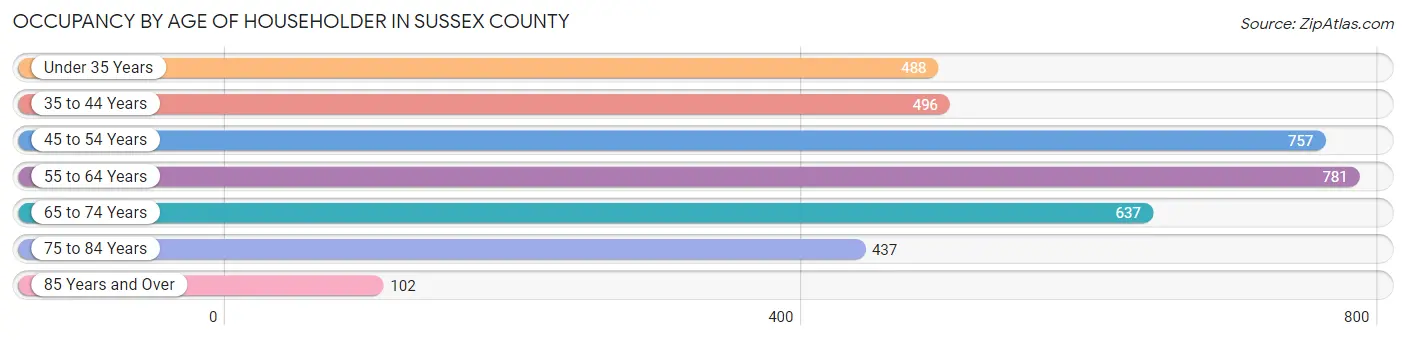
| Age Bracket | # Households | % Households |
| Under 35 Years | 488 | 13.2% |
| 35 to 44 Years | 496 | 13.4% |
| 45 to 54 Years | 757 | 20.5% |
| 55 to 64 Years | 781 | 21.1% |
| 65 to 74 Years | 637 | 17.2% |
| 75 to 84 Years | 437 | 11.8% |
| 85 Years and Over | 102 | 2.8% |
| Total | 3,698 | 100.0% |
Housing Finances in Sussex County
Median Income by Occupancy in Sussex County
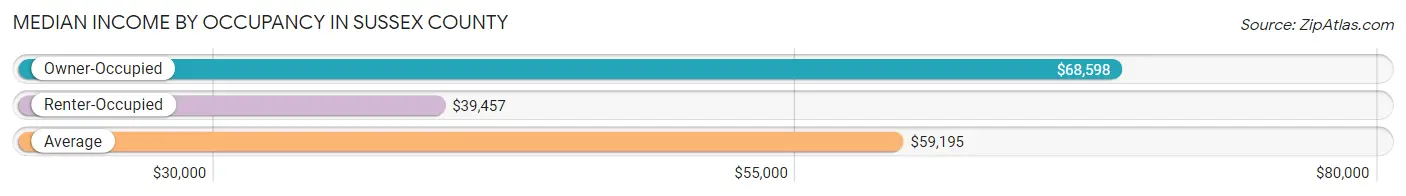
| Occupancy Type | # Households | Median Income |
| Owner-Occupied | 2,568 (69.4%) | $68,598 |
| Renter-Occupied | 1,130 (30.6%) | $39,457 |
| Average | 3,698 (100.0%) | $59,195 |
Occupancy by Householder Income Bracket in Sussex County
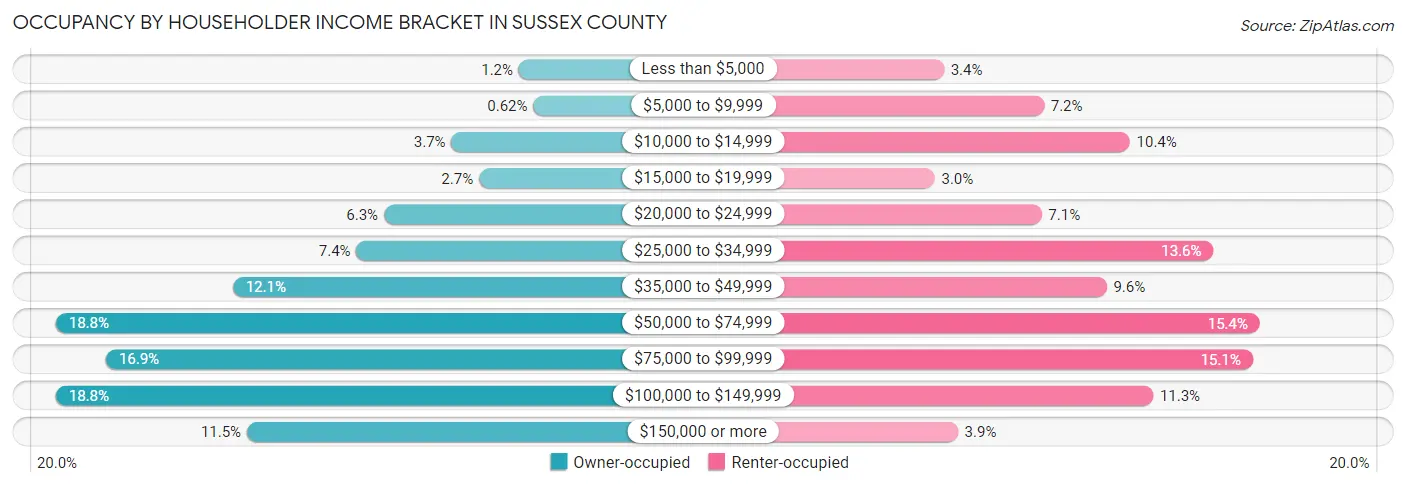
| Income Bracket | Owner-occupied | Renter-occupied |
| Less than $5,000 | 30 (1.2%) | 38 (3.4%) |
| $5,000 to $9,999 | 16 (0.6%) | 81 (7.2%) |
| $10,000 to $14,999 | 96 (3.7%) | 118 (10.4%) |
| $15,000 to $19,999 | 69 (2.7%) | 34 (3.0%) |
| $20,000 to $24,999 | 162 (6.3%) | 80 (7.1%) |
| $25,000 to $34,999 | 189 (7.4%) | 154 (13.6%) |
| $35,000 to $49,999 | 310 (12.1%) | 108 (9.6%) |
| $50,000 to $74,999 | 483 (18.8%) | 174 (15.4%) |
| $75,000 to $99,999 | 434 (16.9%) | 171 (15.1%) |
| $100,000 to $149,999 | 483 (18.8%) | 128 (11.3%) |
| $150,000 or more | 296 (11.5%) | 44 (3.9%) |
| Total | 2,568 (100.0%) | 1,130 (100.0%) |
Monthly Housing Cost Tiers in Sussex County
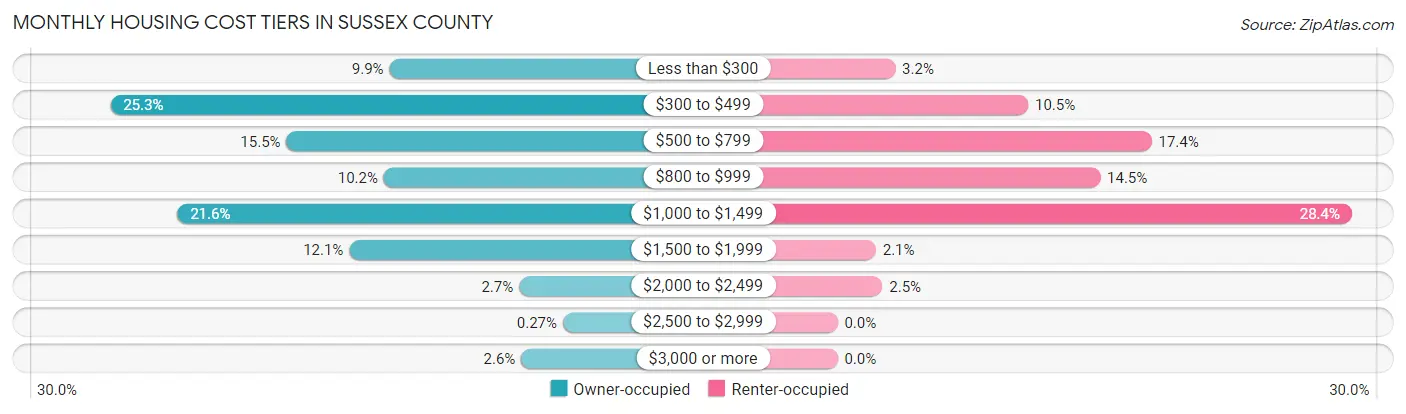
| Monthly Cost | Owner-occupied | Renter-occupied |
| Less than $300 | 253 (9.9%) | 36 (3.2%) |
| $300 to $499 | 649 (25.3%) | 119 (10.5%) |
| $500 to $799 | 399 (15.5%) | 196 (17.3%) |
| $800 to $999 | 261 (10.2%) | 164 (14.5%) |
| $1,000 to $1,499 | 554 (21.6%) | 321 (28.4%) |
| $1,500 to $1,999 | 310 (12.1%) | 24 (2.1%) |
| $2,000 to $2,499 | 69 (2.7%) | 28 (2.5%) |
| $2,500 to $2,999 | 7 (0.3%) | 0 (0.0%) |
| $3,000 or more | 66 (2.6%) | 0 (0.0%) |
| Total | 2,568 (100.0%) | 1,130 (100.0%) |
Physical Housing Characteristics in Sussex County
Housing Structures in Sussex County
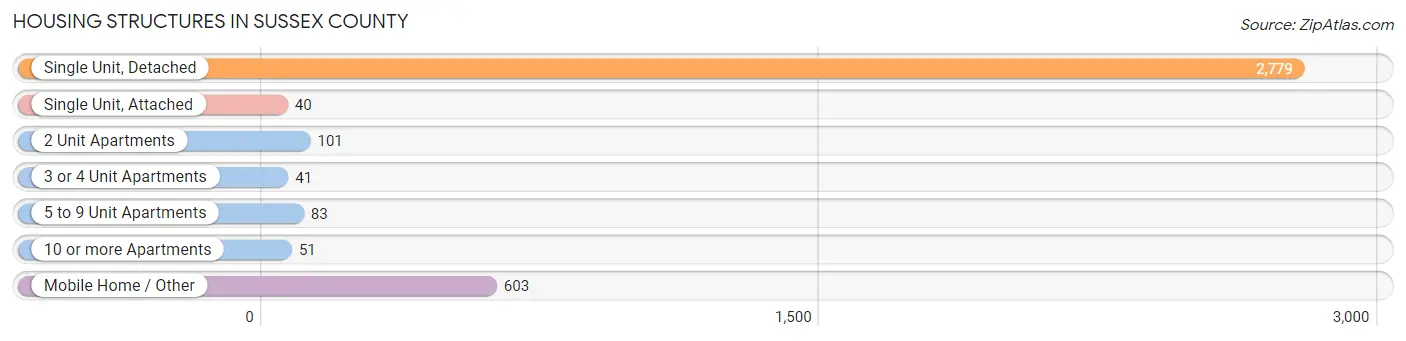
| Structure Type | # Housing Units | % Housing Units |
| Single Unit, Detached | 2,779 | 75.1% |
| Single Unit, Attached | 40 | 1.1% |
| 2 Unit Apartments | 101 | 2.7% |
| 3 or 4 Unit Apartments | 41 | 1.1% |
| 5 to 9 Unit Apartments | 83 | 2.2% |
| 10 or more Apartments | 51 | 1.4% |
| Mobile Home / Other | 603 | 16.3% |
| Total | 3,698 | 100.0% |
Housing Structures by Occupancy in Sussex County
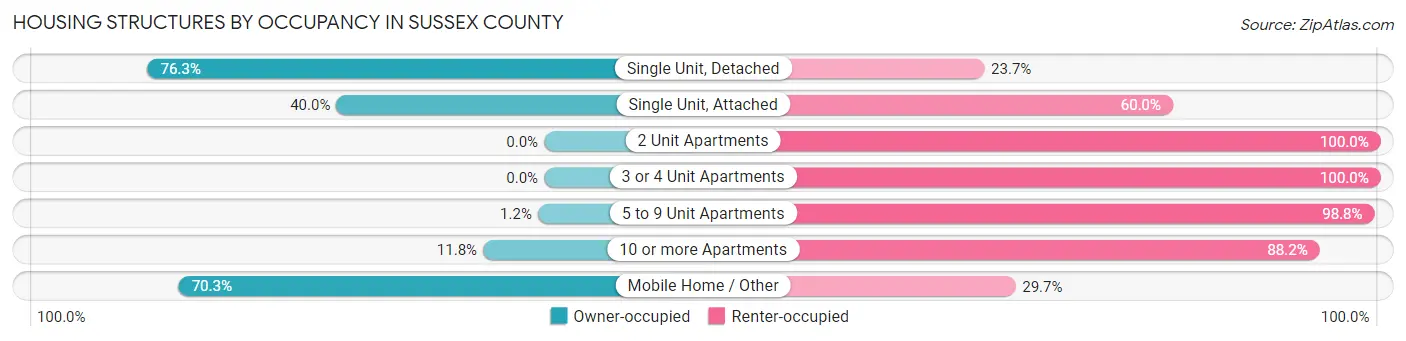
| Structure Type | Owner-occupied | Renter-occupied |
| Single Unit, Detached | 2,121 (76.3%) | 658 (23.7%) |
| Single Unit, Attached | 16 (40.0%) | 24 (60.0%) |
| 2 Unit Apartments | 0 (0.0%) | 101 (100.0%) |
| 3 or 4 Unit Apartments | 0 (0.0%) | 41 (100.0%) |
| 5 to 9 Unit Apartments | 1 (1.2%) | 82 (98.8%) |
| 10 or more Apartments | 6 (11.8%) | 45 (88.2%) |
| Mobile Home / Other | 424 (70.3%) | 179 (29.7%) |
| Total | 2,568 (69.4%) | 1,130 (30.6%) |
Housing Structures by Number of Rooms in Sussex County
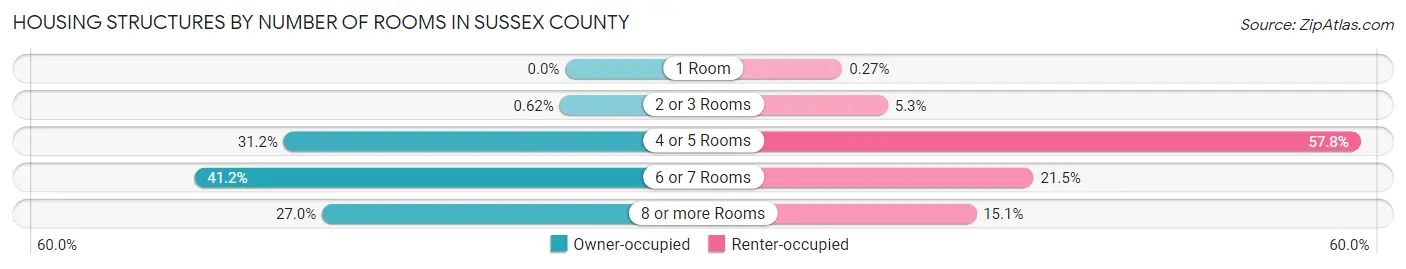
| Number of Rooms | Owner-occupied | Renter-occupied |
| 1 Room | 0 (0.0%) | 3 (0.3%) |
| 2 or 3 Rooms | 16 (0.6%) | 60 (5.3%) |
| 4 or 5 Rooms | 802 (31.2%) | 653 (57.8%) |
| 6 or 7 Rooms | 1,057 (41.2%) | 243 (21.5%) |
| 8 or more Rooms | 693 (27.0%) | 171 (15.1%) |
| Total | 2,568 (100.0%) | 1,130 (100.0%) |
Housing Structure by Heating Type in Sussex County
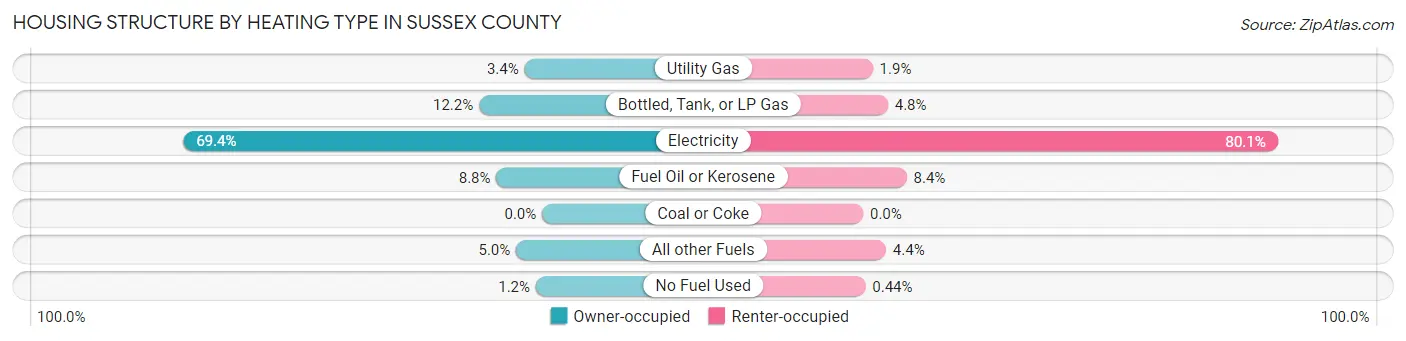
| Heating Type | Owner-occupied | Renter-occupied |
| Utility Gas | 87 (3.4%) | 21 (1.9%) |
| Bottled, Tank, or LP Gas | 313 (12.2%) | 54 (4.8%) |
| Electricity | 1,781 (69.4%) | 905 (80.1%) |
| Fuel Oil or Kerosene | 227 (8.8%) | 95 (8.4%) |
| Coal or Coke | 0 (0.0%) | 0 (0.0%) |
| All other Fuels | 129 (5.0%) | 50 (4.4%) |
| No Fuel Used | 31 (1.2%) | 5 (0.4%) |
| Total | 2,568 (100.0%) | 1,130 (100.0%) |
Household Vehicle Usage in Sussex County
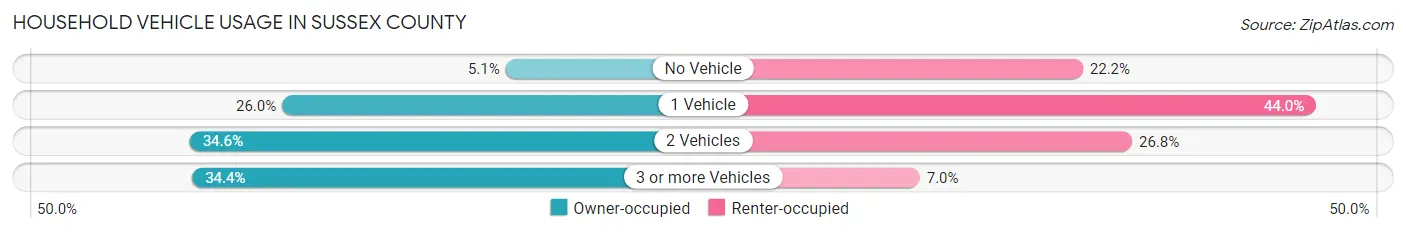
| Vehicles per Household | Owner-occupied | Renter-occupied |
| No Vehicle | 131 (5.1%) | 251 (22.2%) |
| 1 Vehicle | 667 (26.0%) | 497 (44.0%) |
| 2 Vehicles | 888 (34.6%) | 303 (26.8%) |
| 3 or more Vehicles | 882 (34.4%) | 79 (7.0%) |
| Total | 2,568 (100.0%) | 1,130 (100.0%) |
Real Estate & Mortgages in Sussex County
Real Estate and Mortgage Overview in Sussex County
| Characteristic | Without Mortgage | With Mortgage |
| Housing Units | 1,240 | 1,328 |
| Median Property Value | $106,800 | $180,600 |
| Median Household Income | $54,511 | $243 |
| Monthly Housing Costs | $432 | $66 |
| Real Estate Taxes | $720 | $62 |
Property Value by Mortgage Status in Sussex County
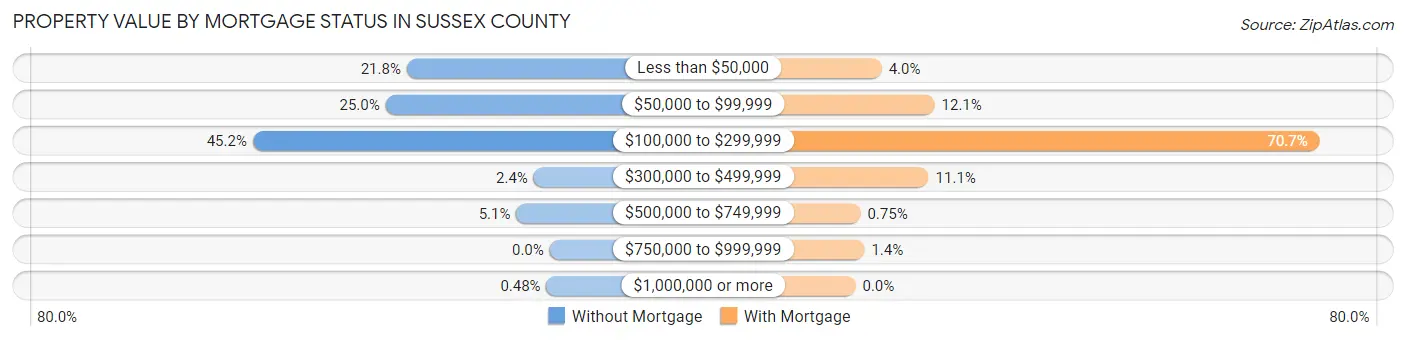
| Property Value | Without Mortgage | With Mortgage |
| Less than $50,000 | 270 (21.8%) | 53 (4.0%) |
| $50,000 to $99,999 | 310 (25.0%) | 160 (12.0%) |
| $100,000 to $299,999 | 561 (45.2%) | 939 (70.7%) |
| $300,000 to $499,999 | 30 (2.4%) | 148 (11.1%) |
| $500,000 to $749,999 | 63 (5.1%) | 10 (0.7%) |
| $750,000 to $999,999 | 0 (0.0%) | 18 (1.4%) |
| $1,000,000 or more | 6 (0.5%) | 0 (0.0%) |
| Total | 1,240 (100.0%) | 1,328 (100.0%) |
Household Income by Mortgage Status in Sussex County
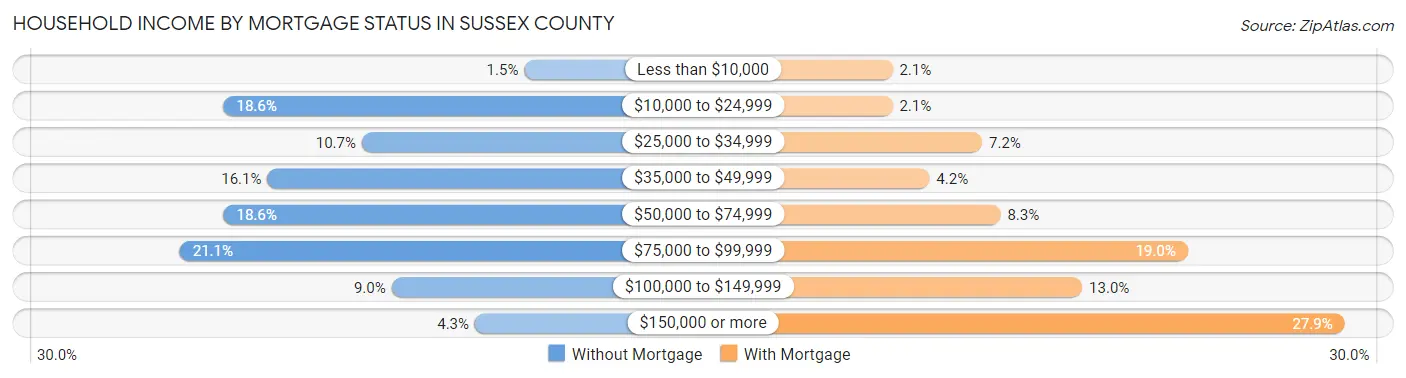
| Household Income | Without Mortgage | With Mortgage |
| Less than $10,000 | 18 (1.5%) | 28 (2.1%) |
| $10,000 to $24,999 | 231 (18.6%) | 28 (2.1%) |
| $25,000 to $34,999 | 133 (10.7%) | 96 (7.2%) |
| $35,000 to $49,999 | 200 (16.1%) | 56 (4.2%) |
| $50,000 to $74,999 | 231 (18.6%) | 110 (8.3%) |
| $75,000 to $99,999 | 262 (21.1%) | 252 (19.0%) |
| $100,000 to $149,999 | 112 (9.0%) | 172 (13.0%) |
| $150,000 or more | 53 (4.3%) | 371 (27.9%) |
| Total | 1,240 (100.0%) | 1,328 (100.0%) |
Property Value to Household Income Ratio in Sussex County
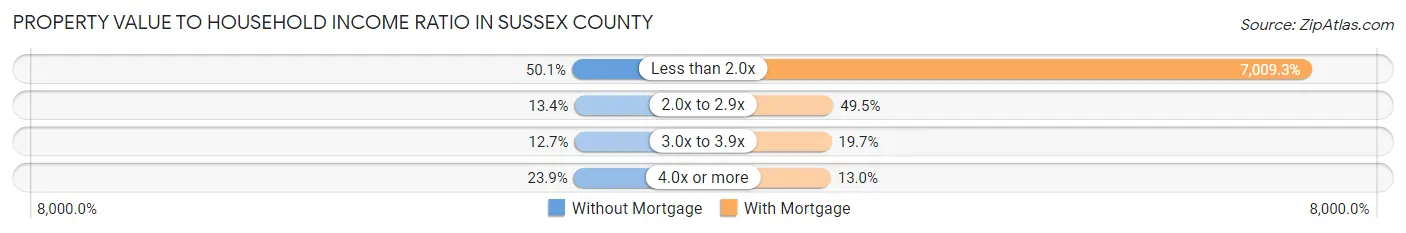
| Value-to-Income Ratio | Without Mortgage | With Mortgage |
| Less than 2.0x | 621 (50.1%) | 93,083 (7,009.3%) |
| 2.0x to 2.9x | 166 (13.4%) | 657 (49.5%) |
| 3.0x to 3.9x | 157 (12.7%) | 262 (19.7%) |
| 4.0x or more | 296 (23.9%) | 172 (13.0%) |
| Total | 1,240 (100.0%) | 1,328 (100.0%) |
Real Estate Taxes by Mortgage Status in Sussex County
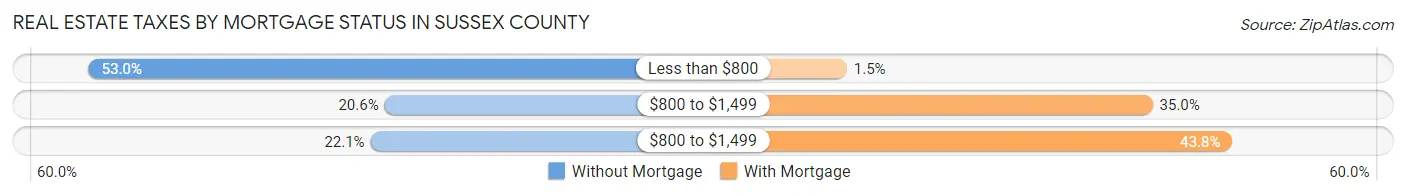
| Property Taxes | Without Mortgage | With Mortgage |
| Less than $800 | 657 (53.0%) | 20 (1.5%) |
| $800 to $1,499 | 255 (20.6%) | 465 (35.0%) |
| $800 to $1,499 | 274 (22.1%) | 581 (43.8%) |
| Total | 1,240 (100.0%) | 1,328 (100.0%) |
Health & Disability in Sussex County
Health Insurance Coverage by Age in Sussex County
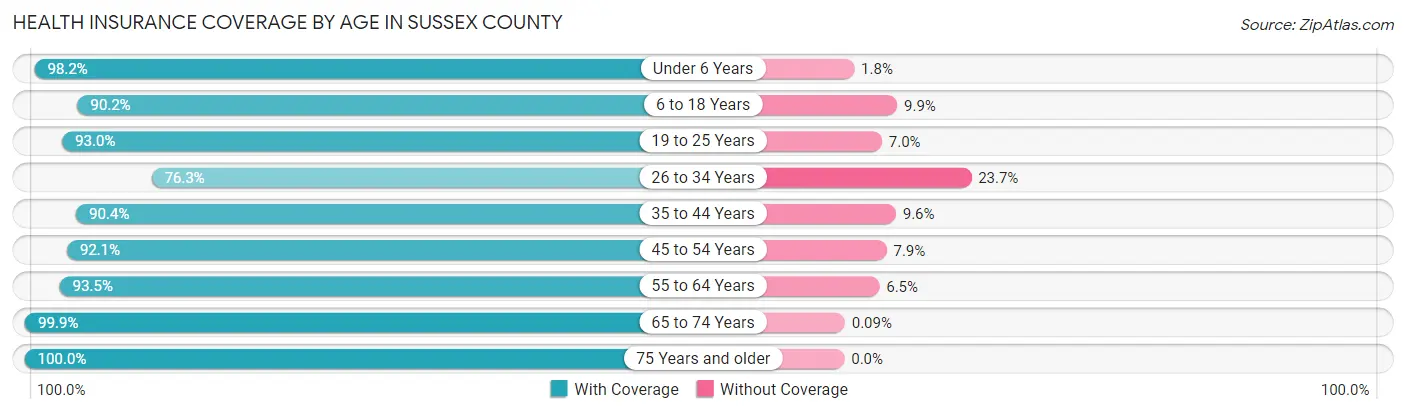
| Age Bracket | With Coverage | Without Coverage |
| Under 6 Years | 533 (98.2%) | 10 (1.8%) |
| 6 to 18 Years | 1,208 (90.1%) | 132 (9.9%) |
| 19 to 25 Years | 956 (93.0%) | 72 (7.0%) |
| 26 to 34 Years | 913 (76.3%) | 283 (23.7%) |
| 35 to 44 Years | 838 (90.4%) | 89 (9.6%) |
| 45 to 54 Years | 1,158 (92.1%) | 99 (7.9%) |
| 55 to 64 Years | 1,216 (93.5%) | 85 (6.5%) |
| 65 to 74 Years | 1,094 (99.9%) | 1 (0.1%) |
| 75 Years and older | 733 (100.0%) | 0 (0.0%) |
| Total | 8,649 (91.8%) | 771 (8.2%) |
Health Insurance Coverage by Citizenship Status in Sussex County
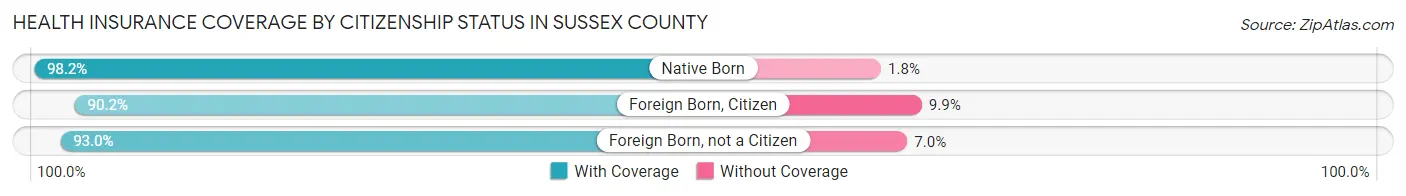
| Citizenship Status | With Coverage | Without Coverage |
| Native Born | 533 (98.2%) | 10 (1.8%) |
| Foreign Born, Citizen | 1,208 (90.1%) | 132 (9.9%) |
| Foreign Born, not a Citizen | 956 (93.0%) | 72 (7.0%) |
Health Insurance Coverage by Household Income in Sussex County
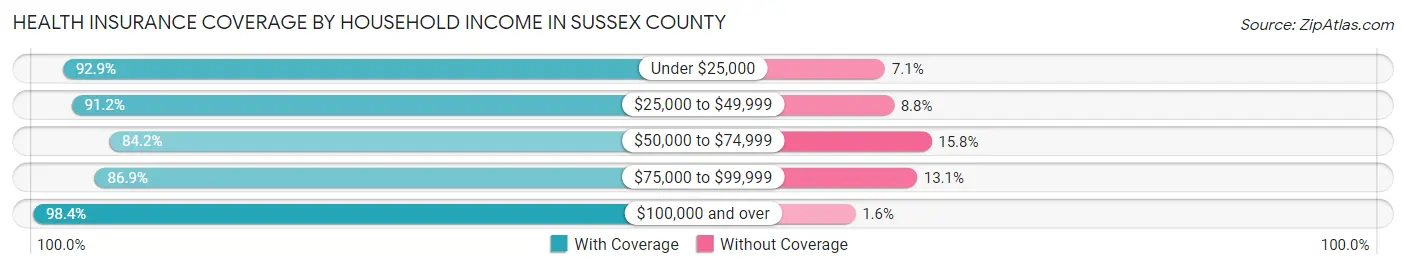
| Household Income | With Coverage | Without Coverage |
| Under $25,000 | 1,157 (92.9%) | 89 (7.1%) |
| $25,000 to $49,999 | 1,390 (91.2%) | 134 (8.8%) |
| $50,000 to $74,999 | 1,446 (84.2%) | 272 (15.8%) |
| $75,000 to $99,999 | 1,463 (86.9%) | 221 (13.1%) |
| $100,000 and over | 3,131 (98.4%) | 50 (1.6%) |
Public vs Private Health Insurance Coverage by Age in Sussex County
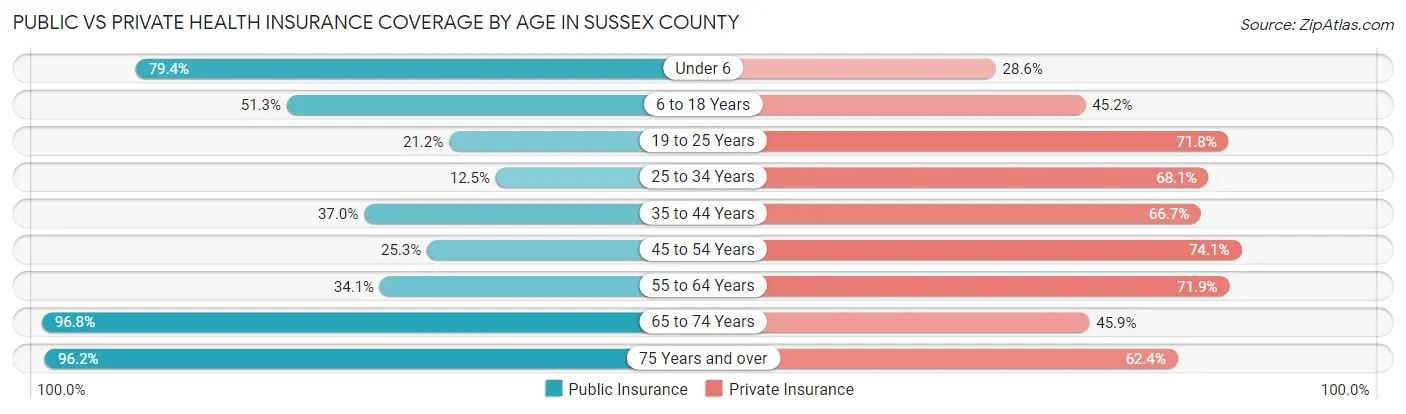
| Age Bracket | Public Insurance | Private Insurance |
| Under 6 | 431 (79.4%) | 155 (28.5%) |
| 6 to 18 Years | 688 (51.3%) | 606 (45.2%) |
| 19 to 25 Years | 218 (21.2%) | 738 (71.8%) |
| 25 to 34 Years | 150 (12.5%) | 814 (68.1%) |
| 35 to 44 Years | 343 (37.0%) | 618 (66.7%) |
| 45 to 54 Years | 318 (25.3%) | 932 (74.1%) |
| 55 to 64 Years | 443 (34.1%) | 936 (71.9%) |
| 65 to 74 Years | 1,060 (96.8%) | 503 (45.9%) |
| 75 Years and over | 705 (96.2%) | 457 (62.4%) |
| Total | 4,356 (46.2%) | 5,759 (61.1%) |
Disability Status by Sex by Age in Sussex County
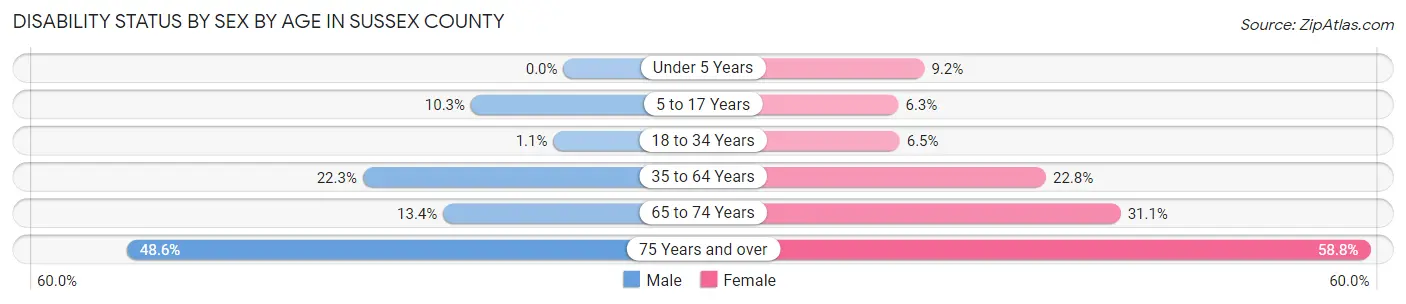
| Age Bracket | Male | Female |
| Under 5 Years | 0 (0.0%) | 21 (9.2%) |
| 5 to 17 Years | 66 (10.3%) | 43 (6.3%) |
| 18 to 34 Years | 18 (1.1%) | 47 (6.5%) |
| 35 to 64 Years | 374 (22.3%) | 412 (22.8%) |
| 65 to 74 Years | 66 (13.4%) | 187 (31.1%) |
| 75 Years and over | 139 (48.6%) | 263 (58.8%) |
Disability Class by Sex by Age in Sussex County
Disability Class: Hearing Difficulty
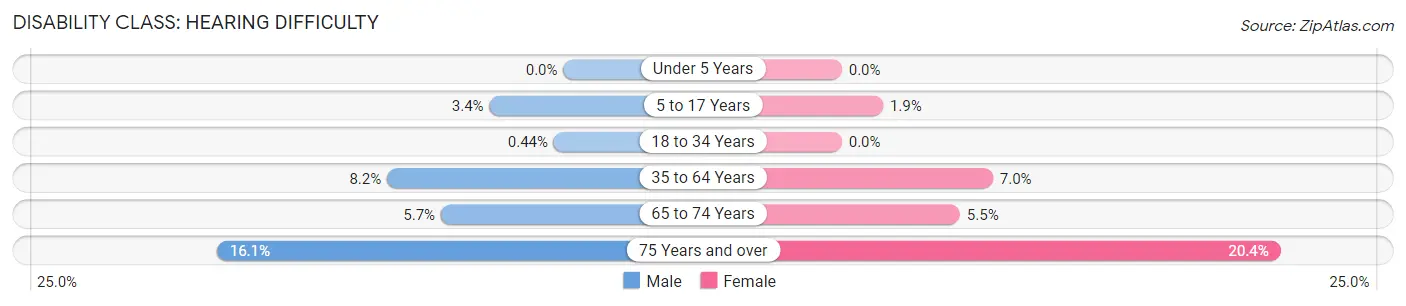
| Age Bracket | Male | Female |
| Under 5 Years | 0 (0.0%) | 0 (0.0%) |
| 5 to 17 Years | 22 (3.4%) | 13 (1.9%) |
| 18 to 34 Years | 7 (0.4%) | 0 (0.0%) |
| 35 to 64 Years | 137 (8.2%) | 127 (7.0%) |
| 65 to 74 Years | 28 (5.7%) | 33 (5.5%) |
| 75 Years and over | 46 (16.1%) | 91 (20.4%) |
Disability Class: Vision Difficulty
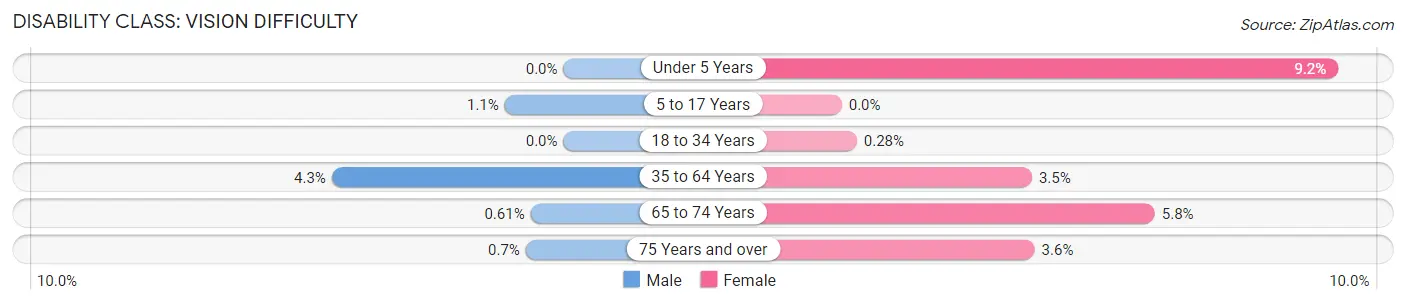
| Age Bracket | Male | Female |
| Under 5 Years | 0 (0.0%) | 21 (9.2%) |
| 5 to 17 Years | 7 (1.1%) | 0 (0.0%) |
| 18 to 34 Years | 0 (0.0%) | 2 (0.3%) |
| 35 to 64 Years | 72 (4.3%) | 64 (3.5%) |
| 65 to 74 Years | 3 (0.6%) | 35 (5.8%) |
| 75 Years and over | 2 (0.7%) | 16 (3.6%) |
Disability Class: Cognitive Difficulty
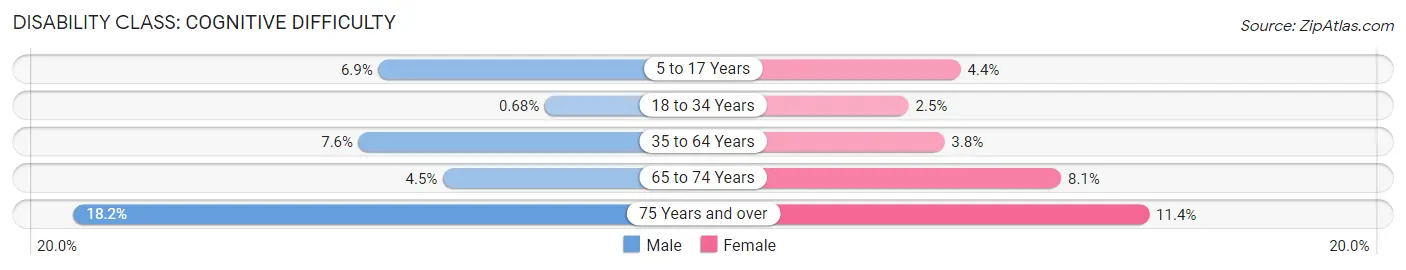
| Age Bracket | Male | Female |
| 5 to 17 Years | 44 (6.9%) | 30 (4.4%) |
| 18 to 34 Years | 11 (0.7%) | 18 (2.5%) |
| 35 to 64 Years | 127 (7.6%) | 69 (3.8%) |
| 65 to 74 Years | 22 (4.5%) | 49 (8.1%) |
| 75 Years and over | 52 (18.2%) | 51 (11.4%) |
Disability Class: Ambulatory Difficulty
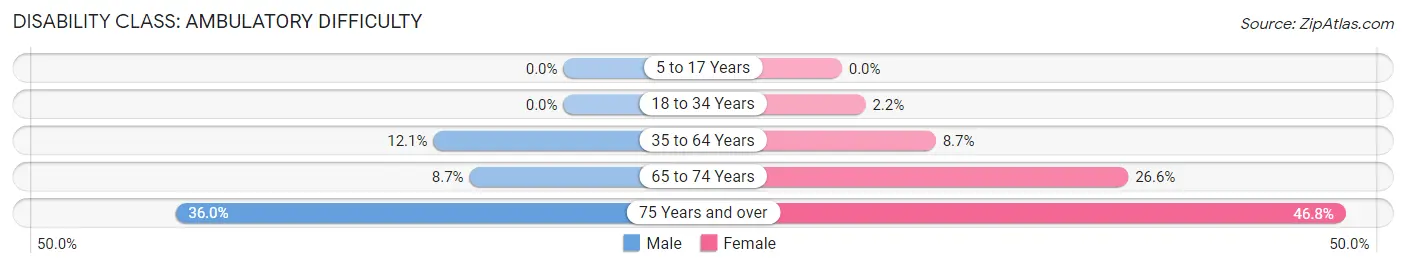
| Age Bracket | Male | Female |
| 5 to 17 Years | 0 (0.0%) | 0 (0.0%) |
| 18 to 34 Years | 0 (0.0%) | 16 (2.2%) |
| 35 to 64 Years | 202 (12.1%) | 158 (8.7%) |
| 65 to 74 Years | 43 (8.7%) | 160 (26.6%) |
| 75 Years and over | 103 (36.0%) | 209 (46.8%) |
Disability Class: Self-Care Difficulty
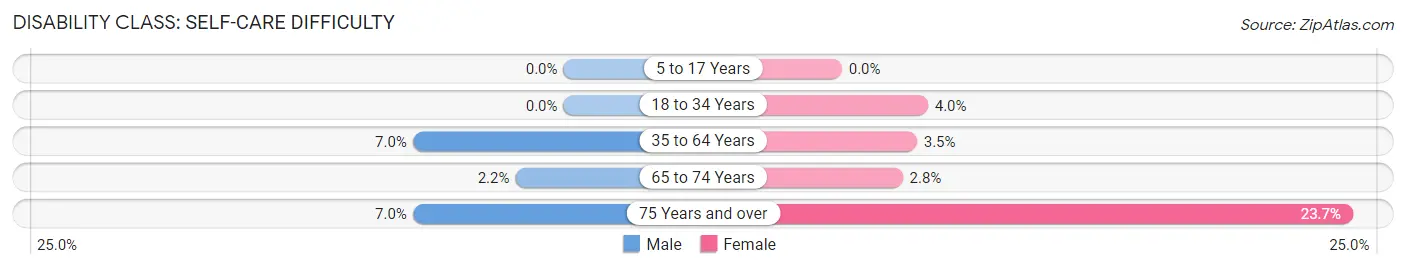
| Age Bracket | Male | Female |
| 5 to 17 Years | 0 (0.0%) | 0 (0.0%) |
| 18 to 34 Years | 0 (0.0%) | 29 (4.0%) |
| 35 to 64 Years | 117 (7.0%) | 63 (3.5%) |
| 65 to 74 Years | 11 (2.2%) | 17 (2.8%) |
| 75 Years and over | 20 (7.0%) | 106 (23.7%) |
Technology Access in Sussex County
Computing Device Access in Sussex County
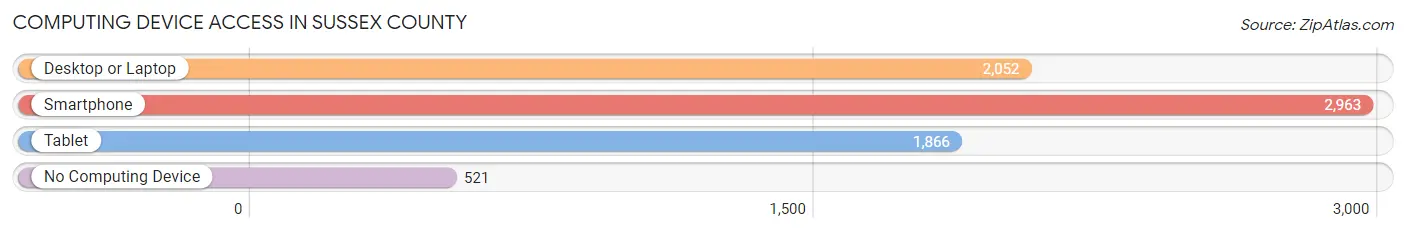
| Device Type | # Households | % Households |
| Desktop or Laptop | 2,052 | 55.5% |
| Smartphone | 2,963 | 80.1% |
| Tablet | 1,866 | 50.5% |
| No Computing Device | 521 | 14.1% |
| Total | 3,698 | 100.0% |
Internet Access in Sussex County
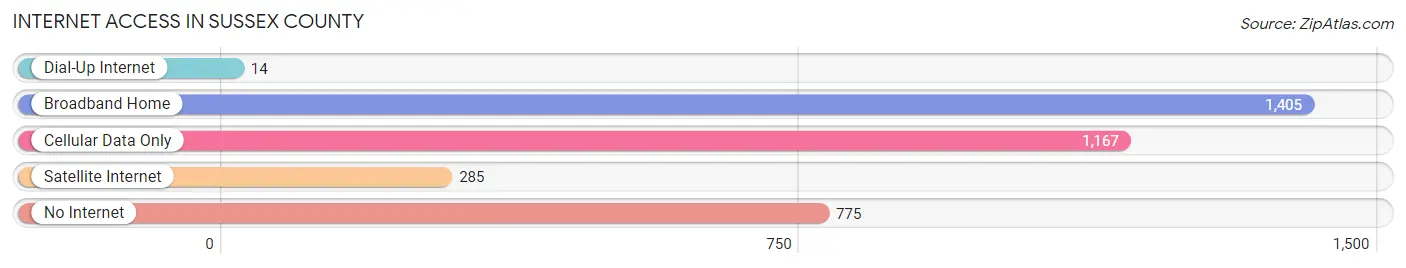
| Internet Type | # Households | % Households |
| Dial-Up Internet | 14 | 0.4% |
| Broadband Home | 1,405 | 38.0% |
| Cellular Data Only | 1,167 | 31.6% |
| Satellite Internet | 285 | 7.7% |
| No Internet | 775 | 21.0% |
| Total | 3,698 | 100.0% |
Sussex County Summary
Sussex County is located in the south-central part of the Commonwealth of Virginia. It is bordered by the counties of Surry, Southampton, Isle of Wight, and Prince George. The county seat is Sussex Courthouse. The county was established in 1754 and named for the English county of Sussex.
Geography
Sussex County is located in the Coastal Plain region of Virginia. It is approximately 545 square miles in size and is divided into seven townships. The terrain is mostly flat with some rolling hills. The county is drained by the Nottoway River and its tributaries. The county is home to several state parks, including the Chippokes Plantation State Park, the Staunton River State Park, and the Twin Lakes State Park.
The climate of Sussex County is humid subtropical, with hot, humid summers and mild winters. The average annual temperature is around 60°F, and the average annual precipitation is around 45 inches.
Economy
The economy of Sussex County is largely based on agriculture. The county is home to several large farms, including the Chippokes Plantation State Park, which is the oldest working plantation in the United States. Other major agricultural products include corn, soybeans, wheat, and hay.
The county is also home to several manufacturing companies, including a paper mill, a furniture factory, and a plastics plant. The county is also home to several retail stores, restaurants, and other businesses.
Demographics
As of the 2010 census, the population of Sussex County was 12,087. The population is predominantly white (87.3%), with African Americans making up 8.3% of the population. Other racial groups include Native Americans (0.7%), Asians (0.6%), and Hispanics (2.1%).
The median household income in Sussex County is $41,945, and the median family income is $50,945. The per capita income is $20,945. The unemployment rate is 5.2%.
The largest employers in Sussex County are the Chippokes Plantation State Park, the Staunton River State Park, and the Twin Lakes State Park. Other major employers include the paper mill, the furniture factory, and the plastics plant.
Conclusion
Sussex County is a rural county located in the south-central part of Virginia. The county is home to several state parks, and its economy is largely based on agriculture. The population is predominantly white, with African Americans making up 8.3% of the population. The median household income is $41,945, and the unemployment rate is 5.2%. The largest employers in the county are the state parks, the paper mill, the furniture factory, and the plastics plant.
Common Questions
What is Per Capita Income in Sussex County?
Per Capita income in Sussex County is $28,788.
What is the Median Family Income in Sussex County?
Median Family Income in Sussex County is $77,926.
What is the Median Household income in Sussex County?
Median Household Income in Sussex County is $59,195.
What is Income or Wage Gap in Sussex County?
Income or Wage Gap in Sussex County is 6.5%.
Women in Sussex County earn 93.5 cents for every dollar earned by a man.
What is Family Income Deficit in Sussex County?
Family Income Deficit in Sussex County is $11,231.
Families that are below poverty line in Sussex County earn $11,231 less on average than the poverty threshold level.
What is Inequality or Gini Index in Sussex County?
Inequality or Gini Index in Sussex County is 0.43.
What is the Total Population of Sussex County?
Total Population of Sussex County is 10,866.
What is the Total Male Population of Sussex County?
Total Male Population of Sussex County is 6,320.
What is the Total Female Population of Sussex County?
Total Female Population of Sussex County is 4,546.
What is the Ratio of Males per 100 Females in Sussex County?
There are 139.02 Males per 100 Females in Sussex County.
What is the Ratio of Females per 100 Males in Sussex County?
There are 71.93 Females per 100 Males in Sussex County.
What is the Median Population Age in Sussex County?
Median Population Age in Sussex County is 40.4 Years.
What is the Average Family Size in Sussex County
Average Family Size in Sussex County is 3.3 People.
What is the Average Household Size in Sussex County
Average Household Size in Sussex County is 2.5 People.
How Large is the Labor Force in Sussex County?
There are 4,618 People in the Labor Forcein in Sussex County.
What is the Percentage of People in the Labor Force in Sussex County?
50.0% of People are in the Labor Force in Sussex County.
What is the Unemployment Rate in Sussex County?
Unemployment Rate in Sussex County is 5.0%.