Area Code 757 Map & Demographics
Area Code 757 Map
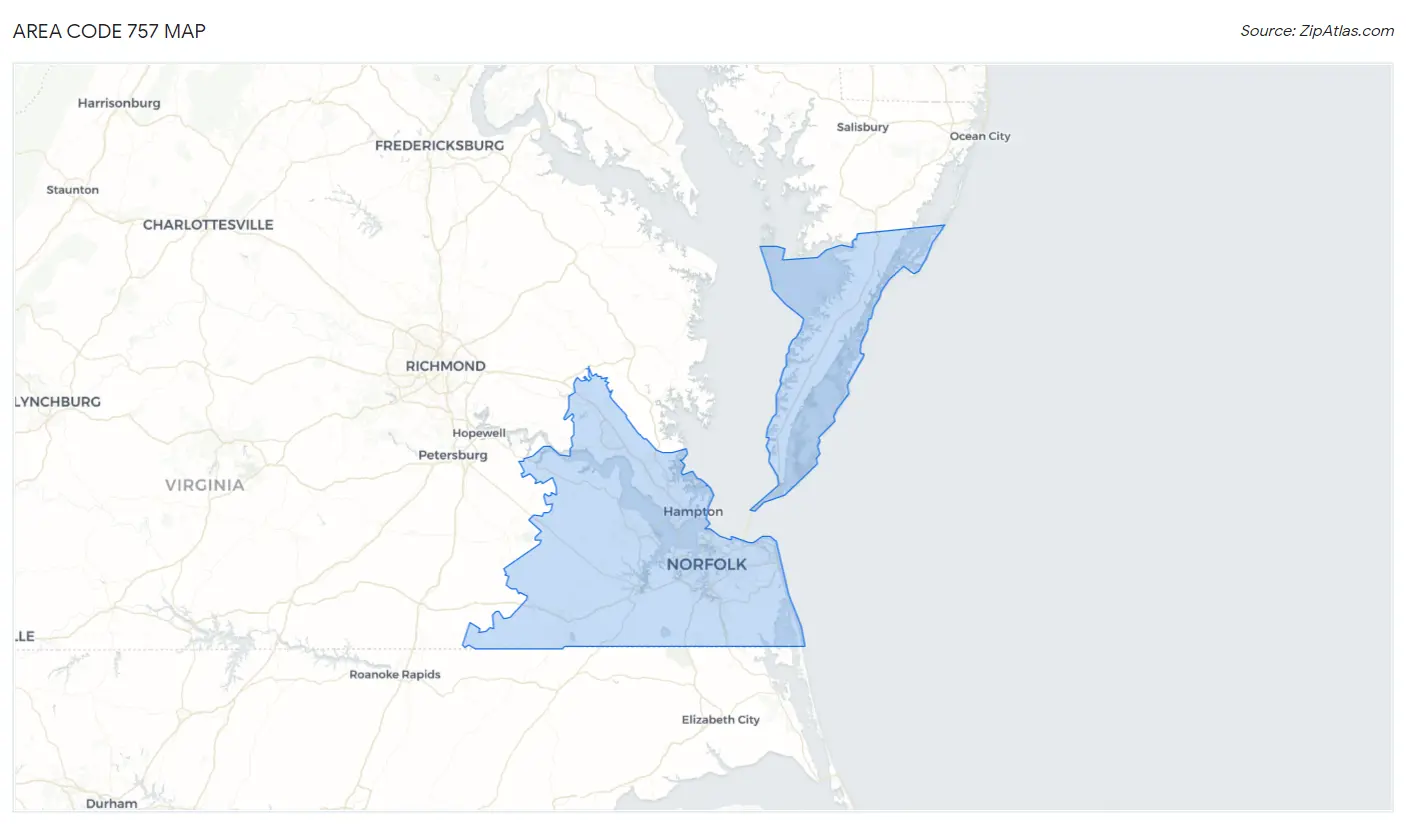
Area Code 757 Overview
$37,741
PER CAPITA INCOME
$90,969
AVG FAMILY INCOME
$73,553
AVG HOUSEHOLD INCOME
30.5%
WAGE / INCOME GAP [ % ]
69.5¢/ $1
WAGE / INCOME GAP [ $ ]
$11,539
FAMILY INCOME DEFICIT
47.95
INEQUALITY / GINI INDEX
1,748,954
TOTAL POPULATION
861,078
MALE POPULATION
887,876
FEMALE POPULATION
96.98
MALES / 100 FEMALES
103.11
FEMALES / 100 MALES
41.0
MEDIAN AGE
3.0
AVG FAMILY SIZE
2.4
AVG HOUSEHOLD SIZE
909,172
LABOR FORCE [ PEOPLE ]
64.7%
PERCENT IN LABOR FORCE
7.1%
UNEMPLOYMENT RATE
Income in Area Code 757
Income Overview in Area Code 757
Per Capita Income in Area Code 757 is $37,741, while median incomes of families and households are $90,969 and $73,553 respectively.
| Characteristic | Number | Measure |
| Per Capita Income | 1,748,954 | $37,741 |
| Median Family Income | 444,435 | $90,969 |
| Mean Family Income | 444,435 | $12,234,139 |
| Median Household Income | 684,804 | $73,553 |
| Mean Household Income | 684,804 | $10,515,234 |
| Income Deficit | 444,435 | $11,539 |
| Wage / Income Gap (%) | 1,748,954 | 30.47% |
| Wage / Income Gap ($) | 1,748,954 | 69.53¢ per $1 |
| Gini / Inequality Index | 1,748,954 | 47.95 |
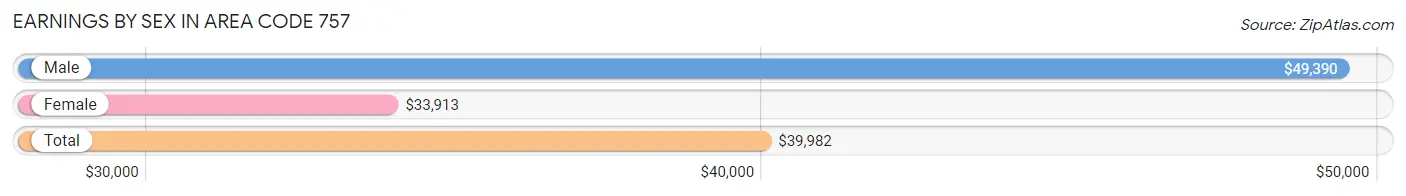
Earnings by Sex in Area Code 757
Average Earnings in Area Code 757 are $39,982, $49,390 for men and $33,913 for women, a difference of 31.3%.
| Sex | Number | Average Earnings |
| Male | 513,309 (52.7%) | $49,390 |
| Female | 461,110 (47.3%) | $33,913 |
| Total | 974,419 (100.0%) | $39,982 |
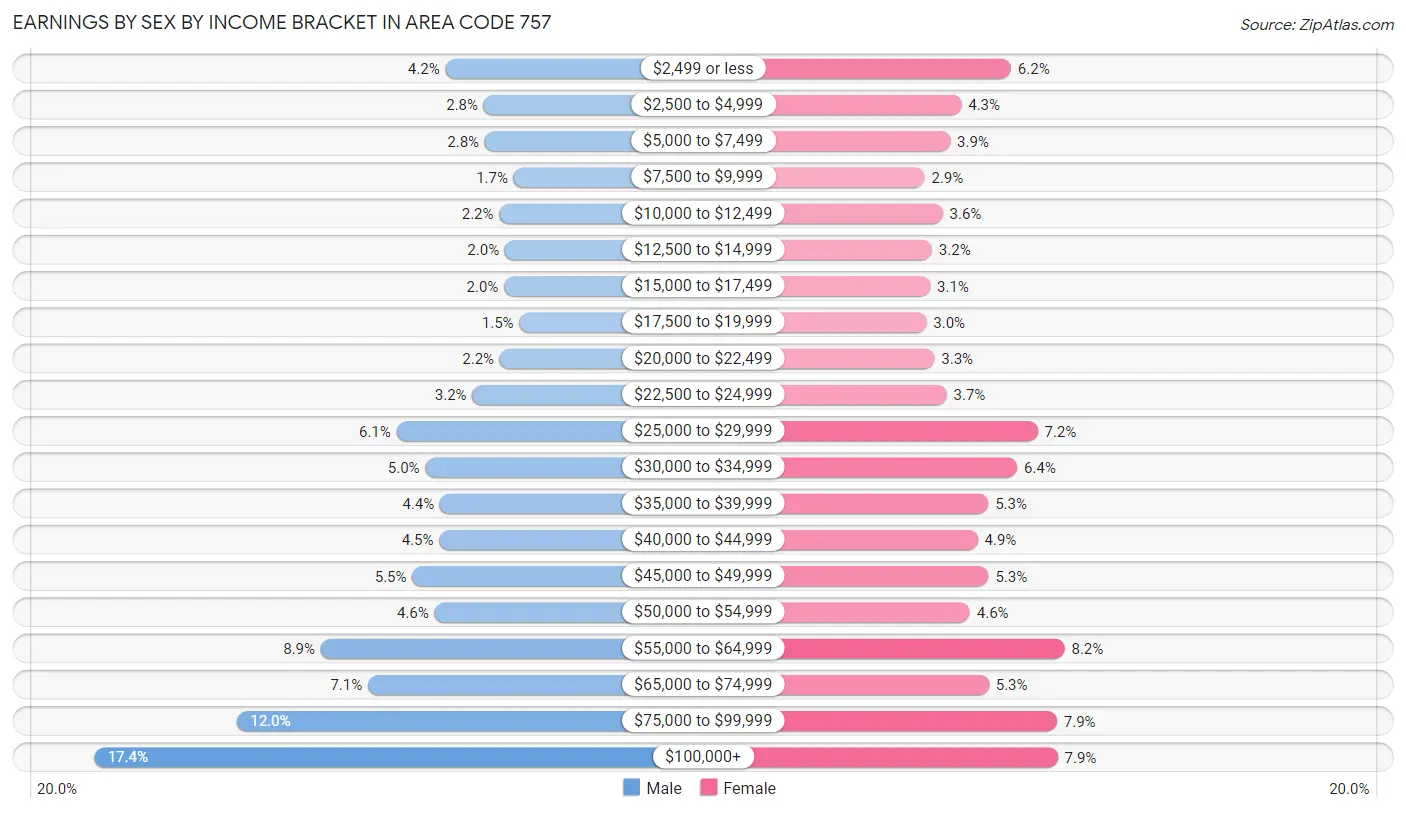
Earnings by Sex by Income Bracket in Area Code 757
The most common earnings brackets in Area Code 757 are $100,000+ for men (89,138 | 17.4%) and $55,000 to $64,999 for women (37,626 | 8.2%).
| Income | Male | Female |
| $2,499 or less | 21,689 (4.2%) | 28,337 (6.1%) |
| $2,500 to $4,999 | 14,310 (2.8%) | 19,761 (4.3%) |
| $5,000 to $7,499 | 14,102 (2.8%) | 17,847 (3.9%) |
| $7,500 to $9,999 | 8,547 (1.7%) | 13,431 (2.9%) |
| $10,000 to $12,499 | 11,364 (2.2%) | 16,549 (3.6%) |
| $12,500 to $14,999 | 10,248 (2.0%) | 14,703 (3.2%) |
| $15,000 to $17,499 | 10,395 (2.0%) | 14,377 (3.1%) |
| $17,500 to $19,999 | 7,471 (1.5%) | 13,733 (3.0%) |
| $20,000 to $22,499 | 11,222 (2.2%) | 15,135 (3.3%) |
| $22,500 to $24,999 | 16,507 (3.2%) | 17,267 (3.7%) |
| $25,000 to $29,999 | 31,112 (6.1%) | 32,969 (7.1%) |
| $30,000 to $34,999 | 25,588 (5.0%) | 29,420 (6.4%) |
| $35,000 to $39,999 | 22,745 (4.4%) | 24,423 (5.3%) |
| $40,000 to $44,999 | 22,915 (4.5%) | 22,590 (4.9%) |
| $45,000 to $49,999 | 28,101 (5.5%) | 24,465 (5.3%) |
| $50,000 to $54,999 | 23,836 (4.6%) | 21,252 (4.6%) |
| $55,000 to $64,999 | 45,700 (8.9%) | 37,626 (8.2%) |
| $65,000 to $74,999 | 36,584 (7.1%) | 24,530 (5.3%) |
| $75,000 to $99,999 | 61,735 (12.0%) | 36,269 (7.9%) |
| $100,000+ | 89,138 (17.4%) | 36,426 (7.9%) |
| Total | 513,309 (100.0%) | 461,110 (100.0%) |
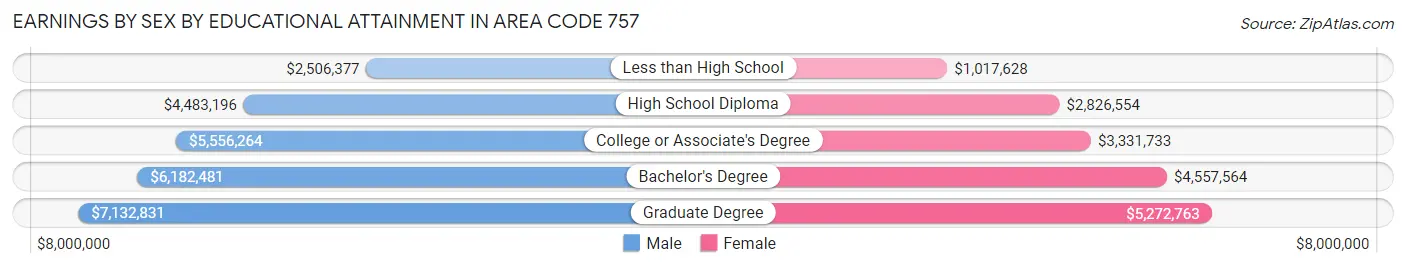
Earnings by Sex by Educational Attainment in Area Code 757
Average earnings in Area Code 757 are $6,110,319 for men and $4,244,185 for women, a difference of 30.5%. Men with an educational attainment of graduate degree enjoy the highest average annual earnings of $7,132,831, while those with less than high school education earn the least with $2,506,377. Women with an educational attainment of graduate degree earn the most with the average annual earnings of $5,272,763, while those with less than high school education have the smallest earnings of $1,017,628.
| Educational Attainment | Male Income | Female Income |
| Less than High School | $2,506,377 | $1,017,628 |
| High School Diploma | $4,483,196 | $2,826,554 |
| College or Associate's Degree | $5,556,264 | $3,331,733 |
| Bachelor's Degree | $6,182,481 | $4,557,564 |
| Graduate Degree | $7,132,831 | $5,272,763 |
| Total | $6,110,319 | $4,244,185 |
Family Income in Area Code 757
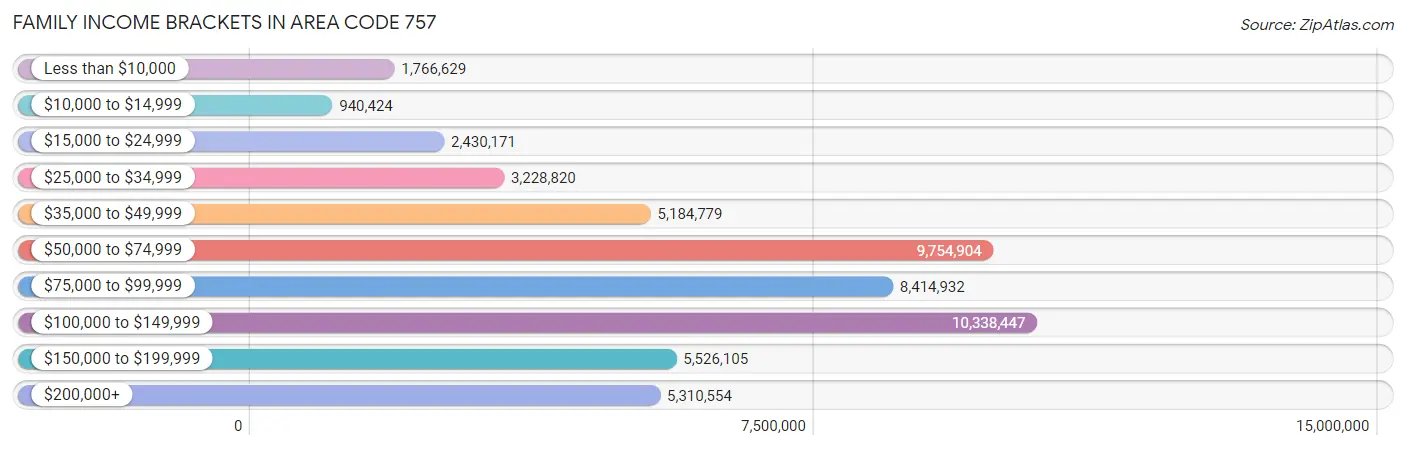
Family Income Brackets in Area Code 757
According to the Area Code 757 family income data, there are 10,338,447 families falling into the $100,000 to $149,999 income range, which is the most common income bracket and makes up 2,326.2% of all families. Conversely, the $10,000 to $14,999 income bracket is the least frequent group with only 940,424 families (211.6%) belonging to this category.
| Income Bracket | # Families | % Families |
| Less than $10,000 | 1,766,629 | 397.5% |
| $10,000 to $14,999 | 940,424 | 211.6% |
| $15,000 to $24,999 | 2,430,171 | 546.8% |
| $25,000 to $34,999 | 3,228,820 | 726.5% |
| $35,000 to $49,999 | 5,184,779 | 1,166.6% |
| $50,000 to $74,999 | 9,754,904 | 2,194.9% |
| $75,000 to $99,999 | 8,414,932 | 1,893.4% |
| $100,000 to $149,999 | 10,338,447 | 2,326.2% |
| $150,000 to $199,999 | 5,526,105 | 1,243.4% |
| $200,000+ | 5,310,554 | 1,194.9% |
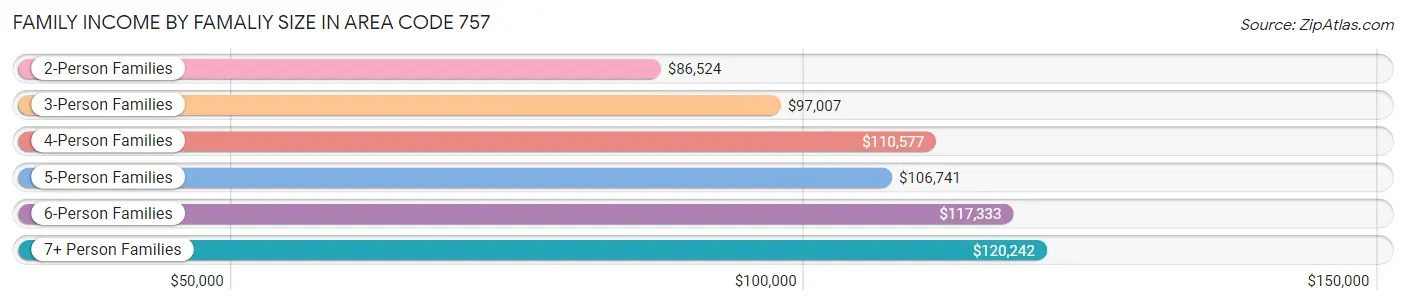
Family Income by Famaliy Size in Area Code 757
7+ person families (4,882 | 1.1%) account for the highest median family income in Area Code 757 with $120,242 per family, while 2-person families (212,157 | 47.7%) have the highest median income of $43,262 per family member.
| Income Bracket | # Families | Median Income |
| 2-Person Families | 212,157 (47.7%) | $86,524 |
| 3-Person Families | 106,537 (24.0%) | $97,007 |
| 4-Person Families | 76,271 (17.2%) | $110,577 |
| 5-Person Families | 33,335 (7.5%) | $106,741 |
| 6-Person Families | 11,253 (2.5%) | $117,333 |
| 7+ Person Families | 4,882 (1.1%) | $120,242 |
| Total | 444,435 (100.0%) | $90,969 |
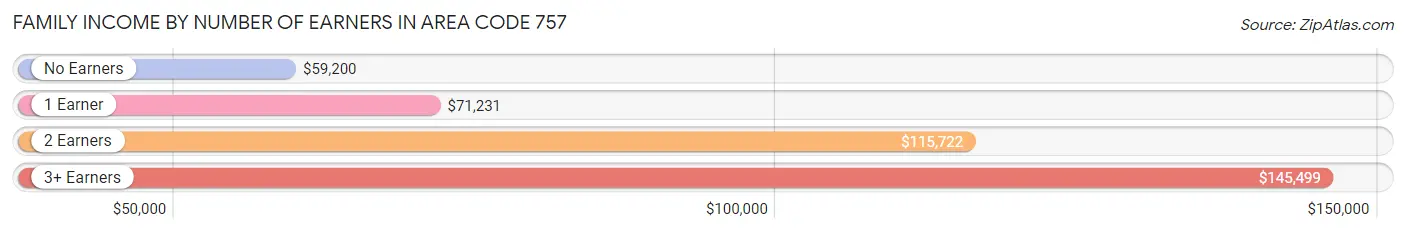
Family Income by Number of Earners in Area Code 757
The median family income in Area Code 757 is $90,969, with families comprising 3+ earners (47,346) having the highest median family income of $145,499, while families with no earners (58,650) have the lowest median family income of $59,200, accounting for 10.6% and 13.2% of families, respectively.
| Number of Earners | # Families | Median Income |
| No Earners | 58,650 (13.2%) | $59,200 |
| 1 Earner | 148,328 (33.4%) | $71,231 |
| 2 Earners | 190,111 (42.8%) | $115,722 |
| 3+ Earners | 47,346 (10.6%) | $145,499 |
| Total | 444,435 (100.0%) | $90,969 |
Household Income in Area Code 757
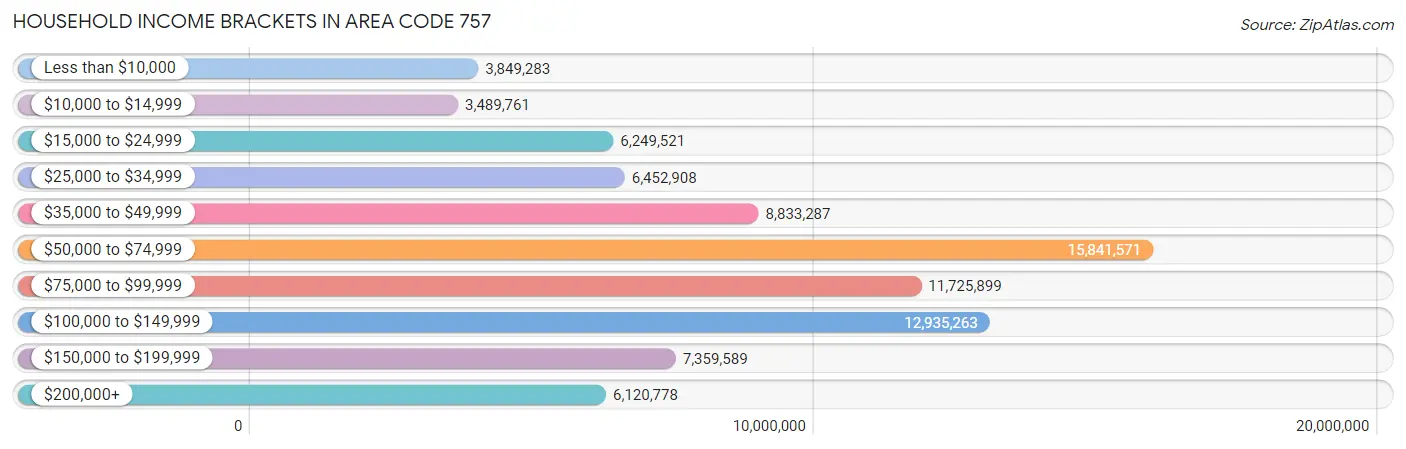
Household Income Brackets in Area Code 757
With 15,841,571 households falling in the category, the $50,000 to $74,999 income range is the most frequent in Area Code 757, accounting for 2,313.3% of all households. In contrast, only 3,489,761 households (509.6%) fall into the $10,000 to $14,999 income bracket, making it the least populous group.
| Income Bracket | # Households | % Households |
| Less than $10,000 | 3,849,283 | 562.1% |
| $10,000 to $14,999 | 3,489,761 | 509.6% |
| $15,000 to $24,999 | 6,249,521 | 912.6% |
| $25,000 to $34,999 | 6,452,908 | 942.3% |
| $35,000 to $49,999 | 8,833,287 | 1,289.9% |
| $50,000 to $74,999 | 15,841,571 | 2,313.3% |
| $75,000 to $99,999 | 11,725,899 | 1,712.3% |
| $100,000 to $149,999 | 12,935,263 | 1,888.9% |
| $150,000 to $199,999 | 7,359,589 | 1,074.7% |
| $200,000+ | 6,120,778 | 893.8% |
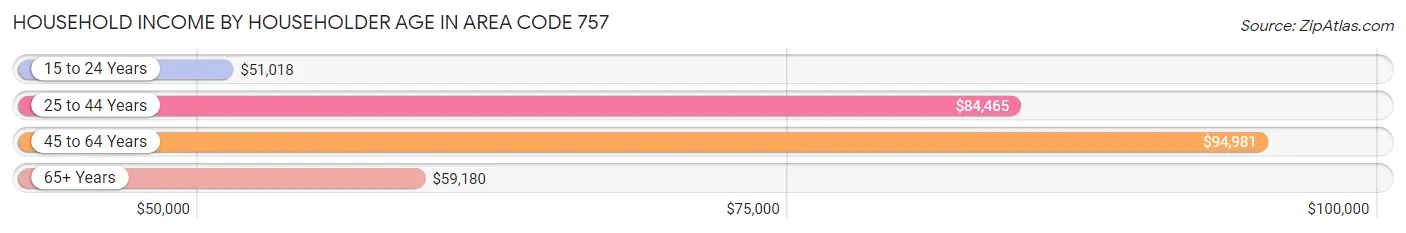
Household Income by Householder Age in Area Code 757
The median household income in Area Code 757 is $73,553, with the highest median household income of $94,981 found in the 45 to 64 years age bracket for the primary householder. A total of 241,152 households (35.2%) fall into this category. Meanwhile, the 15 to 24 years age bracket for the primary householder has the lowest median household income of $51,018, with 29,706 households (4.3%) in this group.
| Income Bracket | # Households | Median Income |
| 15 to 24 Years | 29,706 (4.3%) | $51,018 |
| 25 to 44 Years | 243,293 (35.5%) | $84,465 |
| 45 to 64 Years | 241,152 (35.2%) | $94,981 |
| 65+ Years | 170,653 (24.9%) | $59,180 |
| Total | 684,804 (100.0%) | $73,553 |
Poverty in Area Code 757
Income Below Poverty by Sex and Age in Area Code 757
With 9.5% poverty level for males and 12.5% for females among the residents of Area Code 757, 6 to 11 year old males and 18 to 24 year old females are the most vulnerable to poverty, with 10,918 males (16.8%) and 13,351 females (19.4%) in their respective age groups living below the poverty level.
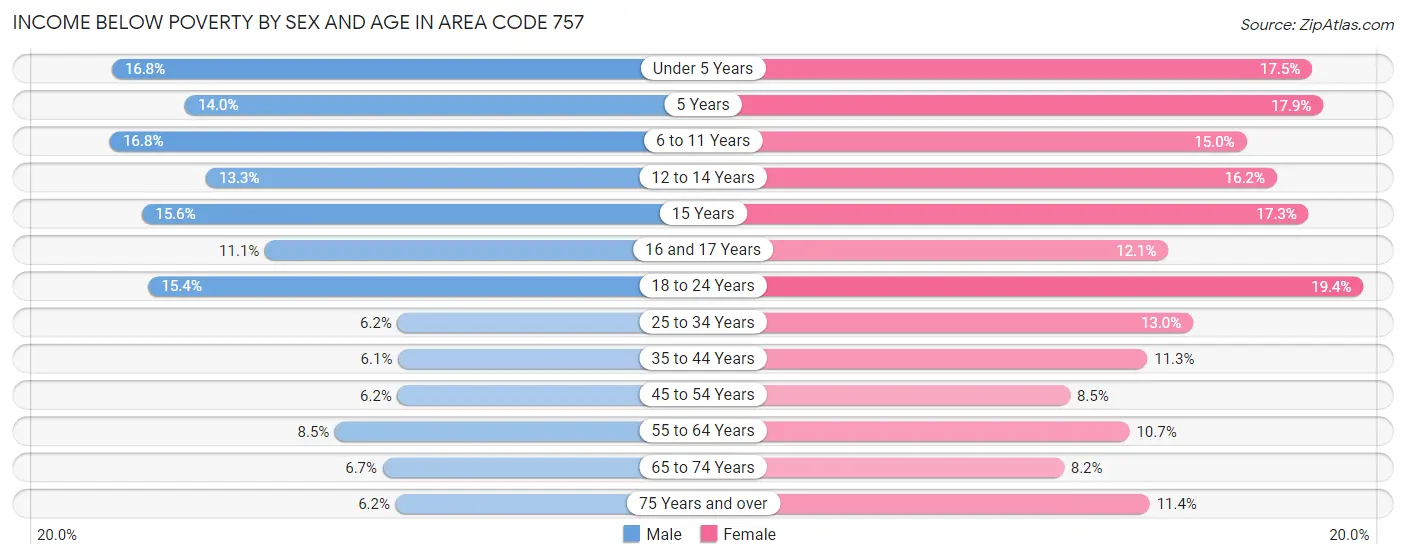
| Age Bracket | Male | Female |
| Under 5 Years | 9,119 (16.8%) | 8,981 (17.5%) |
| 5 Years | 1,422 (14.0%) | 1,771 (17.9%) |
| 6 to 11 Years | 10,918 (16.8%) | 8,987 (15.0%) |
| 12 to 14 Years | 4,454 (13.3%) | 5,398 (16.2%) |
| 15 Years | 1,673 (15.6%) | 1,785 (17.3%) |
| 16 and 17 Years | 2,368 (11.1%) | 2,513 (12.1%) |
| 18 to 24 Years | 11,394 (15.4%) | 13,351 (19.4%) |
| 25 to 34 Years | 7,951 (6.1%) | 16,655 (13.0%) |
| 35 to 44 Years | 6,755 (6.1%) | 12,838 (11.3%) |
| 45 to 54 Years | 5,861 (6.1%) | 8,734 (8.5%) |
| 55 to 64 Years | 8,928 (8.5%) | 12,471 (10.7%) |
| 65 to 74 Years | 4,819 (6.7%) | 7,179 (8.2%) |
| 75 Years and over | 2,642 (6.2%) | 7,236 (11.4%) |
| Total | 78,304 (9.5%) | 107,899 (12.5%) |
Income Above Poverty by Sex and Age in Area Code 757
According to the poverty statistics in Area Code 757, males aged 35 to 44 years and females aged 65 to 74 years are the age groups that are most secure financially, with 93.9% of males and 91.8% of females in these age groups living above the poverty line.
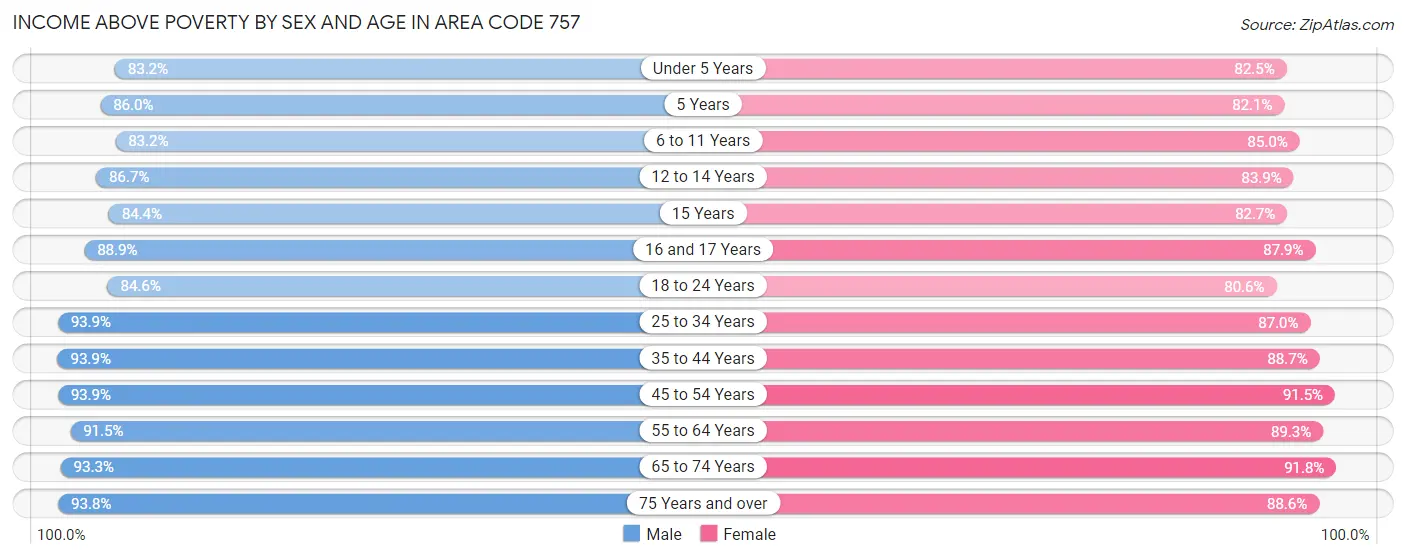
| Age Bracket | Male | Female |
| Under 5 Years | 45,283 (83.2%) | 42,461 (82.5%) |
| 5 Years | 8,703 (86.0%) | 8,141 (82.1%) |
| 6 to 11 Years | 53,951 (83.2%) | 50,855 (85.0%) |
| 12 to 14 Years | 29,126 (86.7%) | 28,017 (83.9%) |
| 15 Years | 9,033 (84.4%) | 8,518 (82.7%) |
| 16 and 17 Years | 19,024 (88.9%) | 18,224 (87.9%) |
| 18 to 24 Years | 62,615 (84.6%) | 55,611 (80.6%) |
| 25 to 34 Years | 121,395 (93.9%) | 111,036 (87.0%) |
| 35 to 44 Years | 103,367 (93.9%) | 100,322 (88.7%) |
| 45 to 54 Years | 89,426 (93.9%) | 94,342 (91.5%) |
| 55 to 64 Years | 96,462 (91.5%) | 104,252 (89.3%) |
| 65 to 74 Years | 67,091 (93.3%) | 79,897 (91.8%) |
| 75 Years and over | 39,847 (93.8%) | 56,092 (88.6%) |
| Total | 745,323 (90.5%) | 757,768 (87.5%) |
Income Below Poverty Among Married-Couple Families in Area Code 757
The poverty statistics for married-couple families in Area Code 757 show that 3.0% or 9,232 of the total 312,052 families live below the poverty line. Families with 5 or more children have the highest poverty rate of 17.4%, comprising of 294 families. On the other hand, families with no children have the lowest poverty rate of 2.4%, which includes 4,477 families.
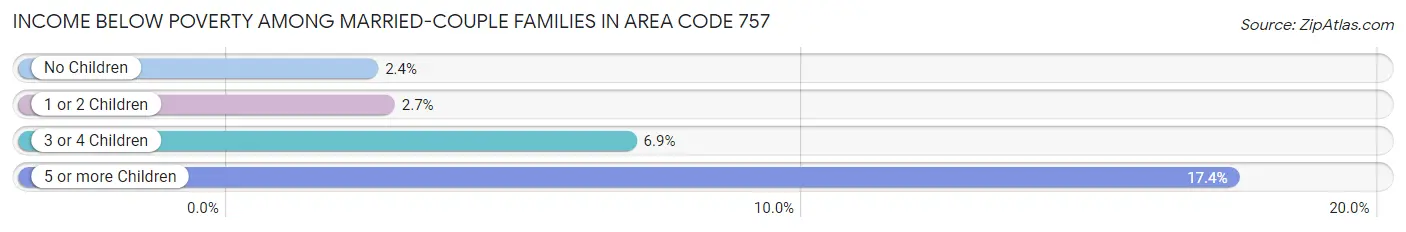
| Children | Above Poverty | Below Poverty |
| No Children | 178,769 (97.6%) | 4,477 (2.4%) |
| 1 or 2 Children | 100,629 (97.3%) | 2,819 (2.7%) |
| 3 or 4 Children | 22,029 (93.1%) | 1,642 (6.9%) |
| 5 or more Children | 1,393 (82.6%) | 294 (17.4%) |
| Total | 302,820 (97.0%) | 9,232 (3.0%) |
Income Below Poverty Among Single-Parent Households in Area Code 757
According to the poverty data in Area Code 757, 8.9% or 2,910 single-father households and 23.7% or 23,683 single-mother households are living below the poverty line. Among single-father households, those with 5 or more children have the highest poverty rate, with 81 households (39.9%) experiencing poverty. Likewise, among single-mother households, those with 5 or more children have the highest poverty rate, with 730 households (70.8%) falling below the poverty line.
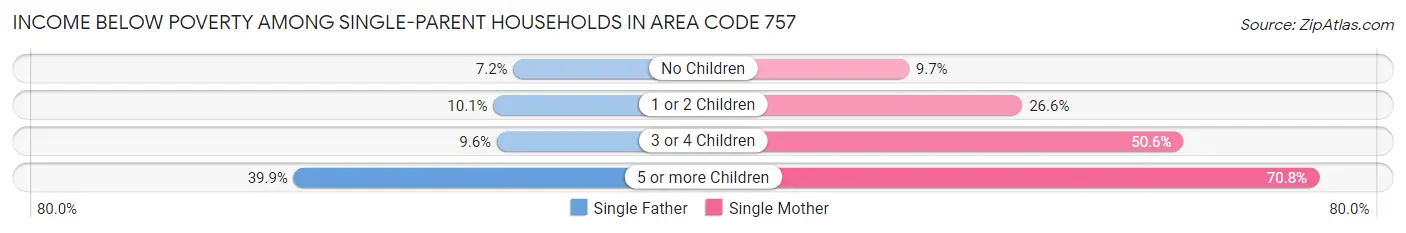
| Children | Single Father | Single Mother |
| No Children | 1,093 (7.2%) | 3,407 (9.7%) |
| 1 or 2 Children | 1,569 (10.1%) | 14,006 (26.6%) |
| 3 or 4 Children | 167 (9.6%) | 5,540 (50.6%) |
| 5 or more Children | 81 (39.9%) | 730 (70.8%) |
| Total | 2,910 (8.9%) | 23,683 (23.7%) |
Income Below Poverty Among Married-Couple vs Single-Parent Households in Area Code 757
The poverty data for Area Code 757 shows that 9,232 of the married-couple family households (3.0%) and 26,593 of the single-parent households (20.1%) are living below the poverty level. Within the married-couple family households, those with 5 or more children have the highest poverty rate, with 294 households (17.4%) falling below the poverty line. Among the single-parent households, those with 5 or more children have the highest poverty rate, with 811 household (65.7%) living below poverty.
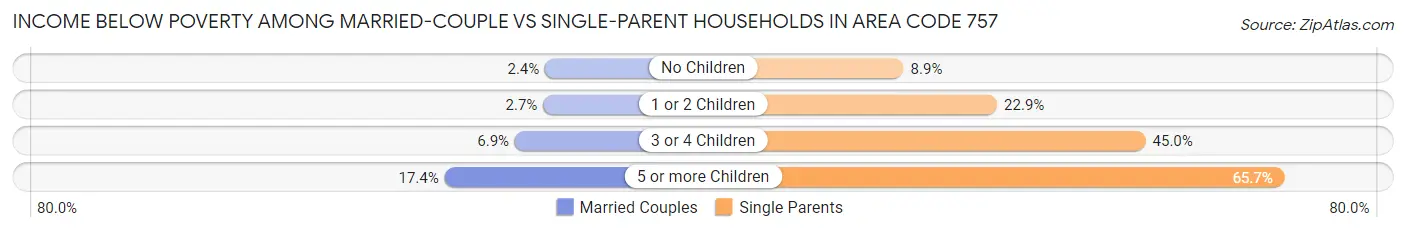
| Children | Married-Couple Families | Single-Parent Households |
| No Children | 4,477 (2.4%) | 4,500 (8.9%) |
| 1 or 2 Children | 2,819 (2.7%) | 15,575 (22.9%) |
| 3 or 4 Children | 1,642 (6.9%) | 5,707 (45.0%) |
| 5 or more Children | 294 (17.4%) | 811 (65.7%) |
| Total | 9,232 (3.0%) | 26,593 (20.1%) |
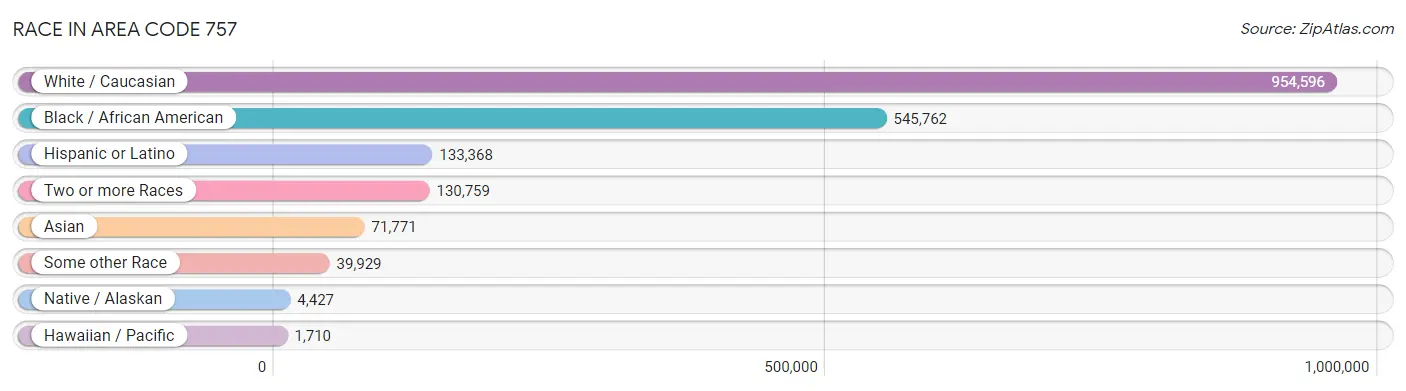
Race in Area Code 757
The most populous races in Area Code 757 are White / Caucasian (954,596 | 54.6%), Black / African American (545,762 | 31.2%), and Hispanic or Latino (133,368 | 7.6%).
| Race | # Population | % Population |
| Asian | 71,771 | 4.1% |
| Black / African American | 545,762 | 31.2% |
| Hawaiian / Pacific | 1,710 | 0.1% |
| Hispanic or Latino | 133,368 | 7.6% |
| Native / Alaskan | 4,427 | 0.3% |
| White / Caucasian | 954,596 | 54.6% |
| Two or more Races | 130,759 | 7.5% |
| Some other Race | 39,929 | 2.3% |
| Total | 1,748,954 | 100.0% |
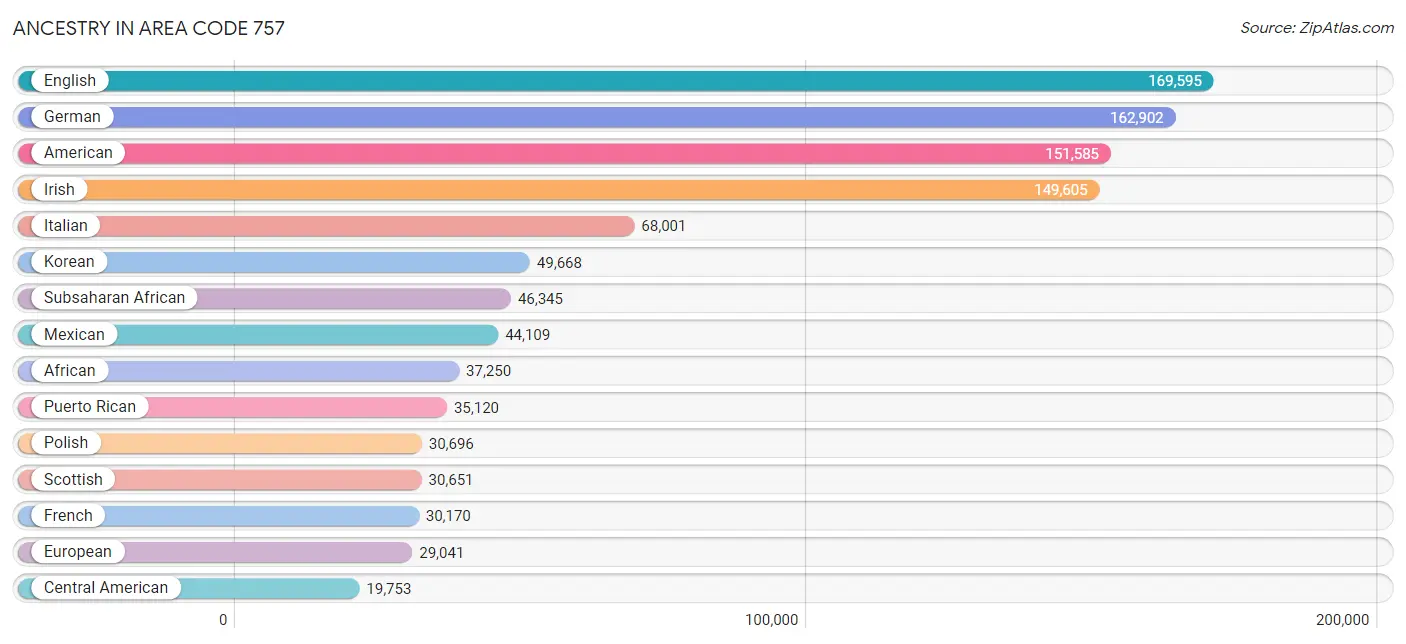
Ancestry in Area Code 757
The most populous ancestries reported in Area Code 757 are English (169,595 | 9.7%), German (162,902 | 9.3%), American (151,585 | 8.7%), Irish (149,605 | 8.6%), and Italian (68,001 | 3.9%), together accounting for 40.1% of all Area Code 757 residents.
| Ancestry | # Population | % Population |
| Afghan | 410 | 0.0% |
| African | 37,250 | 2.1% |
| Alaska Native | 26 | 0.0% |
| Alaskan Athabascan | 15 | 0.0% |
| Albanian | 378 | 0.0% |
| Aleut | 15 | 0.0% |
| Alsatian | 138 | 0.0% |
| American | 151,585 | 8.7% |
| Apache | 312 | 0.0% |
| Arab | 5,832 | 0.3% |
| Arapaho | 50 | 0.0% |
| Argentinean | 590 | 0.0% |
| Armenian | 638 | 0.0% |
| Assyrian / Chaldean / Syriac | 20 | 0.0% |
| Australian | 416 | 0.0% |
| Austrian | 2,396 | 0.1% |
| Bahamian | 346 | 0.0% |
| Bangladeshi | 118 | 0.0% |
| Barbadian | 524 | 0.0% |
| Basque | 74 | 0.0% |
| Belgian | 1,360 | 0.1% |
| Belizean | 382 | 0.0% |
| Bermudan | 113 | 0.0% |
| Bhutanese | 6,283 | 0.4% |
| Blackfeet | 1,205 | 0.1% |
| Bolivian | 781 | 0.0% |
| Brazilian | 1,059 | 0.1% |
| British | 11,080 | 0.6% |
| British West Indian | 536 | 0.0% |
| Bulgarian | 299 | 0.0% |
| Burmese | 8,778 | 0.5% |
| Cajun | 353 | 0.0% |
| Cambodian | 145 | 0.0% |
| Canadian | 2,470 | 0.1% |
| Cape Verdean | 402 | 0.0% |
| Celtic | 234 | 0.0% |
| Central American | 19,753 | 1.1% |
| Central American Indian | 1,270 | 0.1% |
| Cherokee | 6,052 | 0.4% |
| Cheyenne | 34 | 0.0% |
| Chickasaw | 93 | 0.0% |
| Chilean | 780 | 0.0% |
| Chippewa | 268 | 0.0% |
| Choctaw | 513 | 0.0% |
| Colombian | 3,045 | 0.2% |
| Comanche | 143 | 0.0% |
| Costa Rican | 297 | 0.0% |
| Creek | 310 | 0.0% |
| Croatian | 764 | 0.0% |
| Crow | 37 | 0.0% |
| Cuban | 6,029 | 0.3% |
| Cypriot | 156 | 0.0% |
| Czech | 3,686 | 0.2% |
| Czechoslovakian | 856 | 0.1% |
| Danish | 3,395 | 0.2% |
| Delaware | 116 | 0.0% |
| Dominican | 4,866 | 0.3% |
| Dutch | 10,369 | 0.6% |
| Dutch West Indian | 112 | 0.0% |
| Eastern European | 4,210 | 0.2% |
| Ecuadorian | 1,643 | 0.1% |
| Egyptian | 1,220 | 0.1% |
| English | 169,595 | 9.7% |
| Estonian | 292 | 0.0% |
| Ethiopian | 1,246 | 0.1% |
| European | 29,041 | 1.7% |
| Fijian | 88 | 0.0% |
| Filipino | 925 | 0.1% |
| Finnish | 1,523 | 0.1% |
| French | 30,170 | 1.7% |
| French American Indian | 7 | 0.0% |
| French Canadian | 7,220 | 0.4% |
| German | 162,902 | 9.3% |
| Ghanaian | 1,136 | 0.1% |
| Greek | 6,572 | 0.4% |
| Guamanian / Chamorro | 1,166 | 0.1% |
| Guatemalan | 4,488 | 0.3% |
| Guyanese | 751 | 0.0% |
| Haitian | 3,358 | 0.2% |
| Honduran | 5,008 | 0.3% |
| Hopi | 31 | 0.0% |
| Hungarian | 4,649 | 0.3% |
| Icelander | 229 | 0.0% |
| Indian (Asian) | 11,806 | 0.7% |
| Indonesian | 238 | 0.0% |
| Inupiat | 99 | 0.0% |
| Iranian | 877 | 0.1% |
| Iraqi | 422 | 0.0% |
| Irish | 149,605 | 8.6% |
| Iroquois | 638 | 0.0% |
| Israeli | 453 | 0.0% |
| Italian | 68,001 | 3.9% |
| Jamaican | 7,817 | 0.4% |
| Japanese | 1,046 | 0.1% |
| Jordanian | 95 | 0.0% |
| Kenyan | 453 | 0.0% |
| Kiowa | 49 | 0.0% |
| Korean | 49,668 | 2.8% |
| Laotian | 423 | 0.0% |
| Latvian | 172 | 0.0% |
| Lebanese | 1,746 | 0.1% |
| Liberian | 343 | 0.0% |
| Lithuanian | 2,168 | 0.1% |
| Lumbee | 561 | 0.0% |
| Luxembourger | 31 | 0.0% |
| Macedonian | 123 | 0.0% |
| Malaysian | 408 | 0.0% |
| Maltese | 22 | 0.0% |
| Menominee | 11 | 0.0% |
| Mexican | 44,109 | 2.5% |
| Mexican American Indian | 1,042 | 0.1% |
| Mongolian | 123 | 0.0% |
| Moroccan | 718 | 0.0% |
| Native Hawaiian | 2,536 | 0.2% |
| Navajo | 303 | 0.0% |
| New Zealander | 19 | 0.0% |
| Nicaraguan | 1,140 | 0.1% |
| Nigerian | 3,023 | 0.2% |
| Northern European | 2,090 | 0.1% |
| Norwegian | 10,759 | 0.6% |
| Osage | 13 | 0.0% |
| Pakistani | 2,701 | 0.2% |
| Palestinian | 331 | 0.0% |
| Panamanian | 2,816 | 0.2% |
| Paraguayan | 157 | 0.0% |
| Pennsylvania German | 632 | 0.0% |
| Peruvian | 2,253 | 0.1% |
| Polish | 30,696 | 1.8% |
| Portuguese | 3,837 | 0.2% |
| Potawatomi | 277 | 0.0% |
| Pueblo | 195 | 0.0% |
| Puerto Rican | 35,120 | 2.0% |
| Puget Sound Salish | 39 | 0.0% |
| Romanian | 1,237 | 0.1% |
| Russian | 6,980 | 0.4% |
| Salvadoran | 6,004 | 0.3% |
| Samoan | 1,280 | 0.1% |
| Scandinavian | 4,232 | 0.2% |
| Scotch-Irish | 16,612 | 0.9% |
| Scottish | 30,651 | 1.8% |
| Seminole | 194 | 0.0% |
| Senegalese | 81 | 0.0% |
| Serbian | 507 | 0.0% |
| Sierra Leonean | 167 | 0.0% |
| Sioux | 379 | 0.0% |
| Slavic | 464 | 0.0% |
| Slovak | 2,274 | 0.1% |
| Slovene | 356 | 0.0% |
| Somali | 5 | 0.0% |
| South African | 515 | 0.0% |
| South American | 11,140 | 0.6% |
| South American Indian | 116 | 0.0% |
| Spaniard | 5,135 | 0.3% |
| Spanish | 2,957 | 0.2% |
| Spanish American | 148 | 0.0% |
| Spanish American Indian | 39 | 0.0% |
| Sri Lankan | 7,910 | 0.4% |
| Subsaharan African | 46,345 | 2.6% |
| Sudanese | 72 | 0.0% |
| Swedish | 10,443 | 0.6% |
| Swiss | 2,378 | 0.1% |
| Syrian | 575 | 0.0% |
| Thai | 9,904 | 0.6% |
| Tlingit-Haida | 15 | 0.0% |
| Tohono O'Odham | 22 | 0.0% |
| Trinidadian and Tobagonian | 1,660 | 0.1% |
| Tsimshian | 4 | 0.0% |
| Turkish | 1,300 | 0.1% |
| U.S. Virgin Islander | 913 | 0.1% |
| Ugandan | 15 | 0.0% |
| Ukrainian | 3,675 | 0.2% |
| Uruguayan | 92 | 0.0% |
| Ute | 34 | 0.0% |
| Venezuelan | 1,578 | 0.1% |
| Vietnamese | 740 | 0.0% |
| Welsh | 10,127 | 0.6% |
| West Indian | 2,327 | 0.1% |
| Yakama | 59 | 0.0% |
| Yaqui | 93 | 0.0% |
| Yugoslavian | 528 | 0.0% |
| Yup'ik | 14 | 0.0% |
| Zimbabwean | 53 | 0.0% | View All 182 Rows |
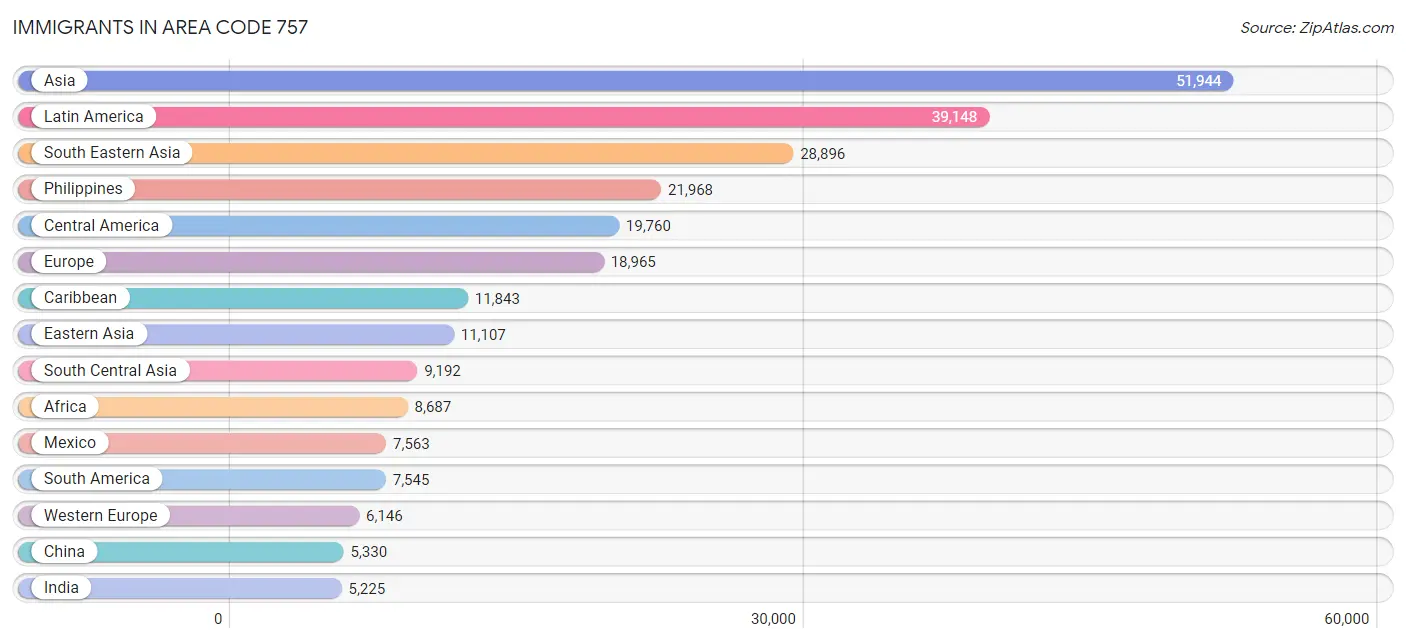
Immigrants in Area Code 757
The most numerous immigrant groups reported in Area Code 757 came from Asia (51,944 | 3.0%), Latin America (39,148 | 2.2%), South Eastern Asia (28,896 | 1.7%), Philippines (21,968 | 1.3%), and Central America (19,760 | 1.1%), together accounting for 9.2% of all Area Code 757 residents.
| Immigration Origin | # Population | % Population |
| Afghanistan | 555 | 0.0% |
| Africa | 8,687 | 0.5% |
| Albania | 93 | 0.0% |
| Argentina | 129 | 0.0% |
| Armenia | 34 | 0.0% |
| Asia | 51,944 | 3.0% |
| Australia | 309 | 0.0% |
| Austria | 147 | 0.0% |
| Azores | 14 | 0.0% |
| Bahamas | 86 | 0.0% |
| Bangladesh | 936 | 0.1% |
| Barbados | 348 | 0.0% |
| Belarus | 243 | 0.0% |
| Belgium | 323 | 0.0% |
| Belize | 62 | 0.0% |
| Bolivia | 461 | 0.0% |
| Bosnia and Herzegovina | 200 | 0.0% |
| Brazil | 1,187 | 0.1% |
| Bulgaria | 218 | 0.0% |
| Cabo Verde | 104 | 0.0% |
| Cambodia | 455 | 0.0% |
| Cameroon | 125 | 0.0% |
| Canada | 2,494 | 0.1% |
| Caribbean | 11,843 | 0.7% |
| Central America | 19,760 | 1.1% |
| Chile | 279 | 0.0% |
| China | 5,330 | 0.3% |
| Colombia | 1,605 | 0.1% |
| Congo | 10 | 0.0% |
| Costa Rica | 200 | 0.0% |
| Croatia | 19 | 0.0% |
| Cuba | 1,545 | 0.1% |
| Czechoslovakia | 250 | 0.0% |
| Denmark | 176 | 0.0% |
| Dominica | 47 | 0.0% |
| Dominican Republic | 2,177 | 0.1% |
| Eastern Africa | 1,643 | 0.1% |
| Eastern Asia | 11,107 | 0.6% |
| Eastern Europe | 4,694 | 0.3% |
| Ecuador | 705 | 0.0% |
| Egypt | 495 | 0.0% |
| El Salvador | 3,864 | 0.2% |
| England | 2,159 | 0.1% |
| Eritrea | 17 | 0.0% |
| Ethiopia | 735 | 0.0% |
| Europe | 18,965 | 1.1% |
| Fiji | 39 | 0.0% |
| France | 888 | 0.1% |
| Germany | 4,215 | 0.2% |
| Ghana | 1,363 | 0.1% |
| Greece | 592 | 0.0% |
| Grenada | 58 | 0.0% |
| Guatemala | 3,101 | 0.2% |
| Guyana | 590 | 0.0% |
| Haiti | 1,919 | 0.1% |
| Honduras | 3,030 | 0.2% |
| Hong Kong | 325 | 0.0% |
| Hungary | 181 | 0.0% |
| India | 5,225 | 0.3% |
| Indonesia | 201 | 0.0% |
| Iran | 385 | 0.0% |
| Iraq | 531 | 0.0% |
| Ireland | 239 | 0.0% |
| Israel | 92 | 0.0% |
| Italy | 1,055 | 0.1% |
| Jamaica | 3,499 | 0.2% |
| Japan | 1,646 | 0.1% |
| Jordan | 103 | 0.0% |
| Kazakhstan | 160 | 0.0% |
| Kenya | 576 | 0.0% |
| Korea | 4,025 | 0.2% |
| Kuwait | 36 | 0.0% |
| Laos | 101 | 0.0% |
| Latin America | 39,148 | 2.2% |
| Lebanon | 319 | 0.0% |
| Liberia | 376 | 0.0% |
| Lithuania | 315 | 0.0% |
| Malaysia | 78 | 0.0% |
| Mexico | 7,563 | 0.4% |
| Micronesia | 96 | 0.0% |
| Middle Africa | 361 | 0.0% |
| Moldova | 146 | 0.0% |
| Morocco | 480 | 0.0% |
| Nepal | 514 | 0.0% |
| Netherlands | 377 | 0.0% |
| Nicaragua | 657 | 0.0% |
| Nigeria | 1,687 | 0.1% |
| North Macedonia | 30 | 0.0% |
| Northern Africa | 1,307 | 0.1% |
| Northern Europe | 5,148 | 0.3% |
| Norway | 78 | 0.0% |
| Oceania | 561 | 0.0% |
| Pakistan | 1,017 | 0.1% |
| Panama | 1,283 | 0.1% |
| Peru | 1,299 | 0.1% |
| Philippines | 21,968 | 1.3% |
| Poland | 497 | 0.0% |
| Portugal | 195 | 0.0% |
| Romania | 401 | 0.0% |
| Russia | 1,157 | 0.1% |
| Saudi Arabia | 104 | 0.0% |
| Scotland | 604 | 0.0% |
| Senegal | 145 | 0.0% |
| Serbia | 170 | 0.0% |
| Sierra Leone | 38 | 0.0% |
| Singapore | 36 | 0.0% |
| South Africa | 417 | 0.0% |
| South America | 7,545 | 0.4% |
| South Central Asia | 9,192 | 0.5% |
| South Eastern Asia | 28,896 | 1.7% |
| Southern Europe | 2,884 | 0.2% |
| Spain | 1,042 | 0.1% |
| Sri Lanka | 148 | 0.0% |
| St. Vincent and the Grenadines | 235 | 0.0% |
| Sudan | 135 | 0.0% |
| Sweden | 223 | 0.0% |
| Switzerland | 175 | 0.0% |
| Syria | 220 | 0.0% |
| Taiwan | 522 | 0.0% |
| Thailand | 1,058 | 0.1% |
| Trinidad and Tobago | 929 | 0.1% |
| Turkey | 888 | 0.1% |
| Uganda | 50 | 0.0% |
| Ukraine | 595 | 0.0% |
| Uruguay | 46 | 0.0% |
| Uzbekistan | 42 | 0.0% |
| Venezuela | 1,113 | 0.1% |
| Vietnam | 4,722 | 0.3% |
| West Indies | 290 | 0.0% |
| Western Africa | 4,537 | 0.3% |
| Western Asia | 2,697 | 0.2% |
| Western Europe | 6,146 | 0.4% |
| Yemen | 8 | 0.0% |
| Zaire | 219 | 0.0% |
| Zimbabwe | 42 | 0.0% | View All 135 Rows |
Sex and Age in Area Code 757
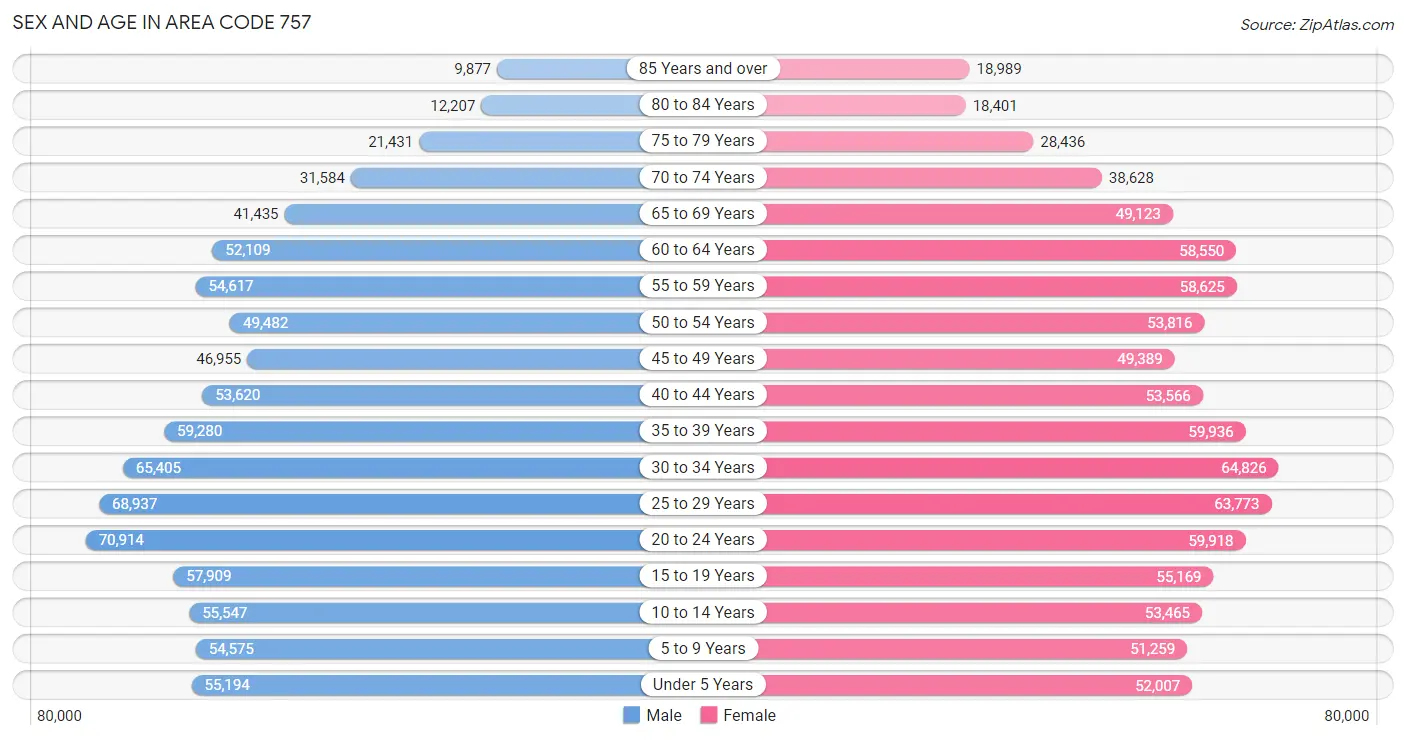
Sex and Age in Area Code 757
The most populous age groups in Area Code 757 are 20 to 24 Years (70,914 | 8.2%) for men and 30 to 34 Years (64,826 | 7.3%) for women.
| Age Bracket | Male | Female |
| Under 5 Years | 55,194 (6.4%) | 52,007 (5.9%) |
| 5 to 9 Years | 54,575 (6.3%) | 51,259 (5.8%) |
| 10 to 14 Years | 55,547 (6.5%) | 53,465 (6.0%) |
| 15 to 19 Years | 57,909 (6.7%) | 55,169 (6.2%) |
| 20 to 24 Years | 70,914 (8.2%) | 59,918 (6.8%) |
| 25 to 29 Years | 68,937 (8.0%) | 63,773 (7.2%) |
| 30 to 34 Years | 65,405 (7.6%) | 64,826 (7.3%) |
| 35 to 39 Years | 59,280 (6.9%) | 59,936 (6.8%) |
| 40 to 44 Years | 53,620 (6.2%) | 53,566 (6.0%) |
| 45 to 49 Years | 46,955 (5.4%) | 49,389 (5.6%) |
| 50 to 54 Years | 49,482 (5.8%) | 53,816 (6.1%) |
| 55 to 59 Years | 54,617 (6.3%) | 58,625 (6.6%) |
| 60 to 64 Years | 52,109 (6.0%) | 58,550 (6.6%) |
| 65 to 69 Years | 41,435 (4.8%) | 49,123 (5.5%) |
| 70 to 74 Years | 31,584 (3.7%) | 38,628 (4.3%) |
| 75 to 79 Years | 21,431 (2.5%) | 28,436 (3.2%) |
| 80 to 84 Years | 12,207 (1.4%) | 18,401 (2.1%) |
| 85 Years and over | 9,877 (1.1%) | 18,989 (2.1%) |
| Total | 861,078 (100.0%) | 887,876 (100.0%) |
Families and Households in Area Code 757
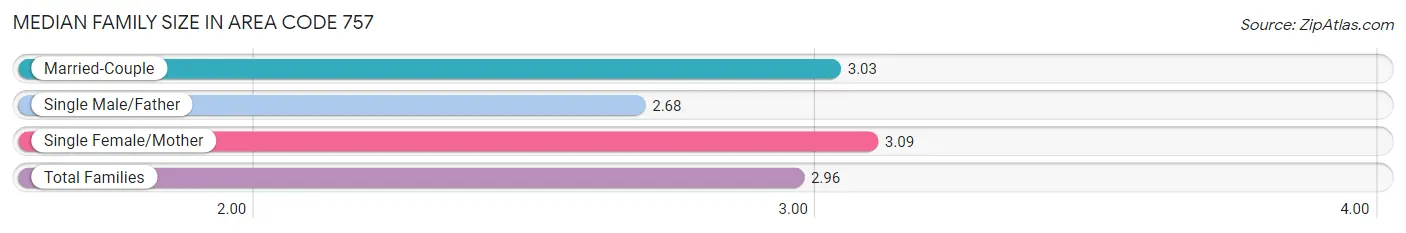
Median Family Size in Area Code 757
The median family size in Area Code 757 is 2.96 persons per family, with single female/mother families (99,713 | 22.4%) accounting for the largest median family size of 3.09226 persons per family. On the other hand, single male/father families (32,670 | 7.3%) represent the smallest median family size with 2.68 persons per family.
| Family Type | # Families | Family Size |
| Married-Couple | 312,052 (70.2%) | 3.03 |
| Single Male/Father | 32,670 (7.3%) | 2.68 |
| Single Female/Mother | 99,713 (22.4%) | 3.09 |
| Total Families | 444,435 (100.0%) | 2.96 |
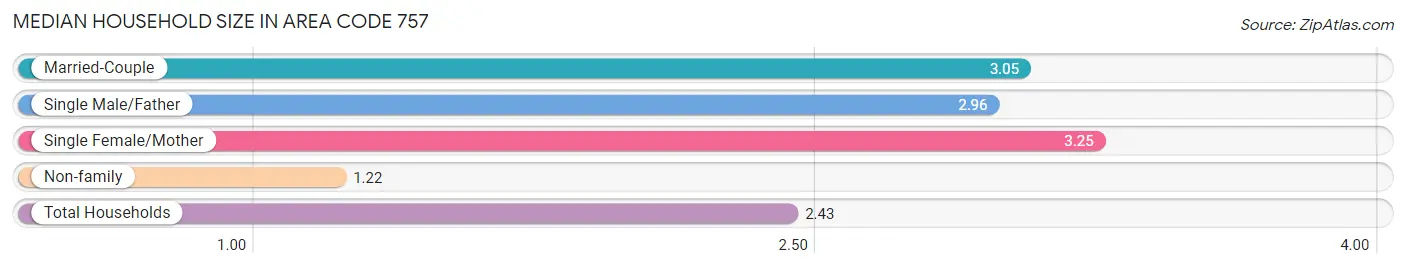
Median Household Size in Area Code 757
The median household size in Area Code 757 is 2.43 persons per household, with single female/mother households (99,713 | 14.6%) accounting for the largest median household size of 3.24698 persons per household. non-family households (240,369 | 35.1%) represent the smallest median household size with 1.22 persons per household.
| Household Type | # Households | Household Size |
| Married-Couple | 312,052 (45.6%) | 3.05 |
| Single Male/Father | 32,670 (4.8%) | 2.96 |
| Single Female/Mother | 99,713 (14.6%) | 3.25 |
| Non-family | 240,369 (35.1%) | 1.22 |
| Total Households | 684,804 (100.0%) | 2.43 |
Household Size by Marriage Status in Area Code 757
Out of a total of 684,804 households in Area Code 757, 444,435 (64.9%) are family households, while 240,369 (35.1%) are nonfamily households. The most numerous type of family households are 2-person households, comprising 198,325, and the most common type of nonfamily households are 1-person households, comprising 195,748.
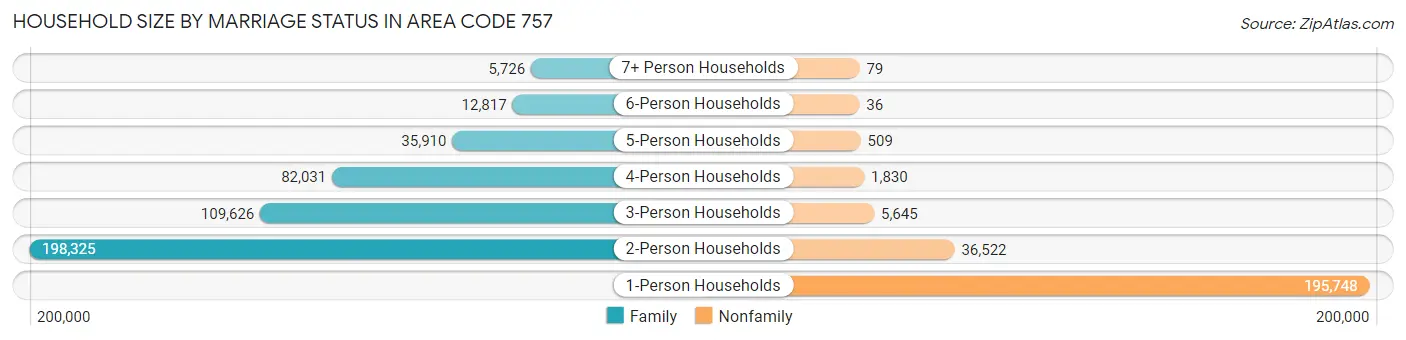
| Household Size | Family Households | Nonfamily Households |
| 1-Person Households | - | 195,748 (28.6%) |
| 2-Person Households | 198,325 (29.0%) | 36,522 (5.3%) |
| 3-Person Households | 109,626 (16.0%) | 5,645 (0.8%) |
| 4-Person Households | 82,031 (12.0%) | 1,830 (0.3%) |
| 5-Person Households | 35,910 (5.2%) | 509 (0.1%) |
| 6-Person Households | 12,817 (1.9%) | 36 (0.0%) |
| 7+ Person Households | 5,726 (0.8%) | 79 (0.0%) |
| Total | 444,435 (64.9%) | 240,369 (35.1%) |
Female Fertility in Area Code 757
Fertility by Age in Area Code 757
Average fertility rate in Area Code 757 is 68.4 births per 1,000 women. Women in the age bracket of 20 to 34 years have the highest fertility rate with 135.5 births per 1,000 women. Women in the age bracket of 20 to 34 years acount for 74.3% of all women with births.
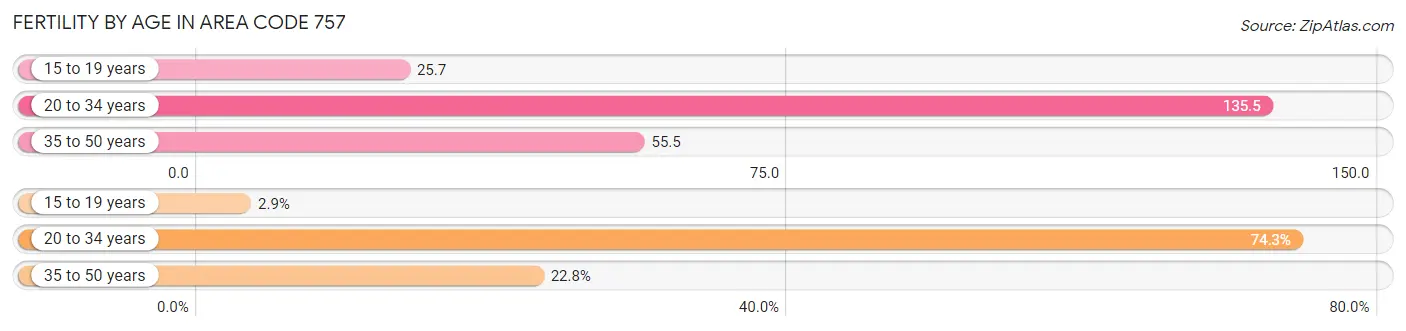
| Age Bracket | Women with Births | Births / 1,000 Women |
| 15 to 19 years | 643 (2.9%) | 25.7 |
| 20 to 34 years | 16,356 (74.3%) | 135.5 |
| 35 to 50 years | 5,014 (22.8%) | 55.5 |
| Total | 22,013 (100.0%) | 68.4 |
Fertility by Age by Marriage Status in Area Code 757
56.5% of women with births (22,013) in Area Code 757 are married. The highest percentage of unmarried women with births falls into 15 to 19 years age bracket with 100.0% of them unmarried at the time of birth, while the lowest percentage of unmarried women with births belong to 35 to 50 years age bracket with 41.0% of them unmarried.
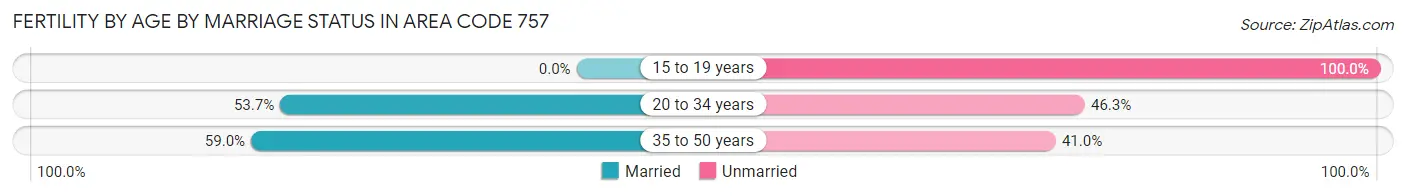
| Age Bracket | Married | Unmarried |
| 15 to 19 years | 0 (0.0%) | 643 (100.0%) |
| 20 to 34 years | 8,786 (53.7%) | 7,570 (46.3%) |
| 35 to 50 years | 2,958 (59.0%) | 2,056 (41.0%) |
| Total | 12,434 (56.5%) | 9,579 (43.5%) |
Fertility by Education in Area Code 757
Average fertility rate in Area Code 757 is 68.4 births per 1,000 women. Women with the education attainment of bachelor's degree have the highest fertility rate of 95.5 births per 1,000 women, while women with the education attainment of less than high school have the lowest fertility at 56.4 births per 1,000 women. Women with the education attainment of college or associate's degree represent 37.1% of all women with births.
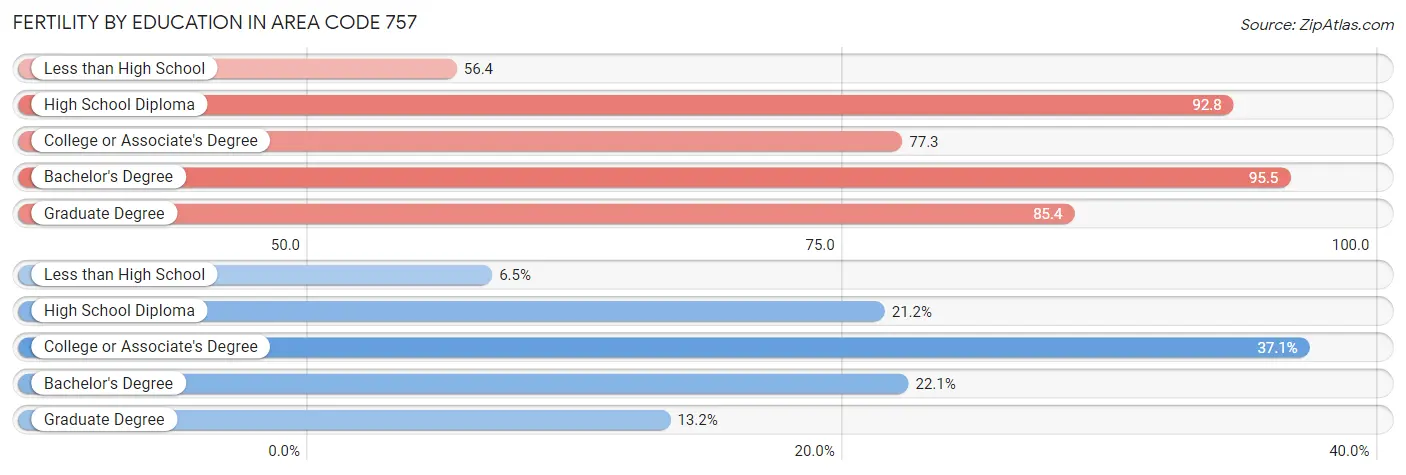
| Educational Attainment | Women with Births | Births / 1,000 Women |
| Less than High School | 1,426 (6.5%) | 56.4 |
| High School Diploma | 4,664 (21.2%) | 92.8 |
| College or Associate's Degree | 8,166 (37.1%) | 77.3 |
| Bachelor's Degree | 4,861 (22.1%) | 95.5 |
| Graduate Degree | 2,896 (13.2%) | 85.4 |
| Total | 22,013 (100.0%) | 68.4 |
Fertility by Education by Marriage Status in Area Code 757
43.5% of women with births in Area Code 757 are unmarried. Women with the educational attainment of graduate degree are most likely to be married with 60.4% of them married at childbirth, while women with the educational attainment of less than high school are least likely to be married with 78.8% of them unmarried at childbirth.
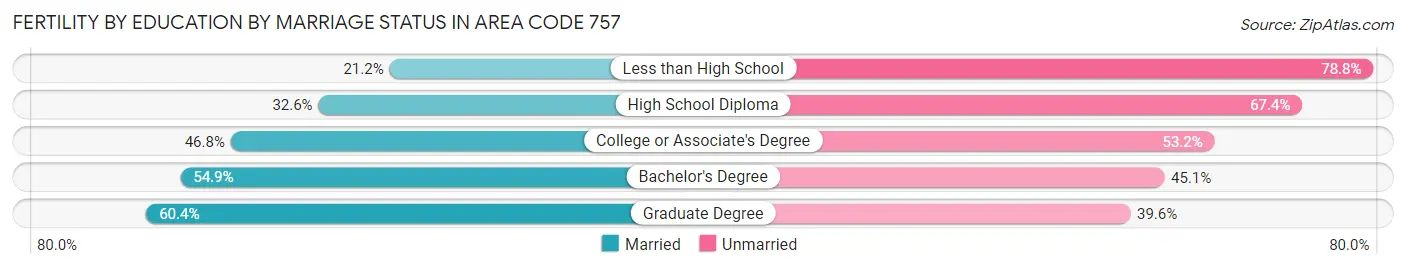
| Educational Attainment | Married | Unmarried |
| Less than High School | 302 (21.2%) | 1,124 (78.8%) |
| High School Diploma | 1,522 (32.6%) | 3,142 (67.4%) |
| College or Associate's Degree | 3,819 (46.8%) | 4,347 (53.2%) |
| Bachelor's Degree | 2,668 (54.9%) | 2,193 (45.1%) |
| Graduate Degree | 1,749 (60.4%) | 1,147 (39.6%) |
| Total | 12,434 (56.5%) | 9,579 (43.5%) |
Employment Characteristics in Area Code 757
Employment by Class of Employer in Area Code 757
Among the 875,592 employed individuals in Area Code 757, private company employees (495,757 | 56.6%), federal government employees (156,162 | 17.8%), and local government employees (69,154 | 7.9%) make up the most common classes of employment.
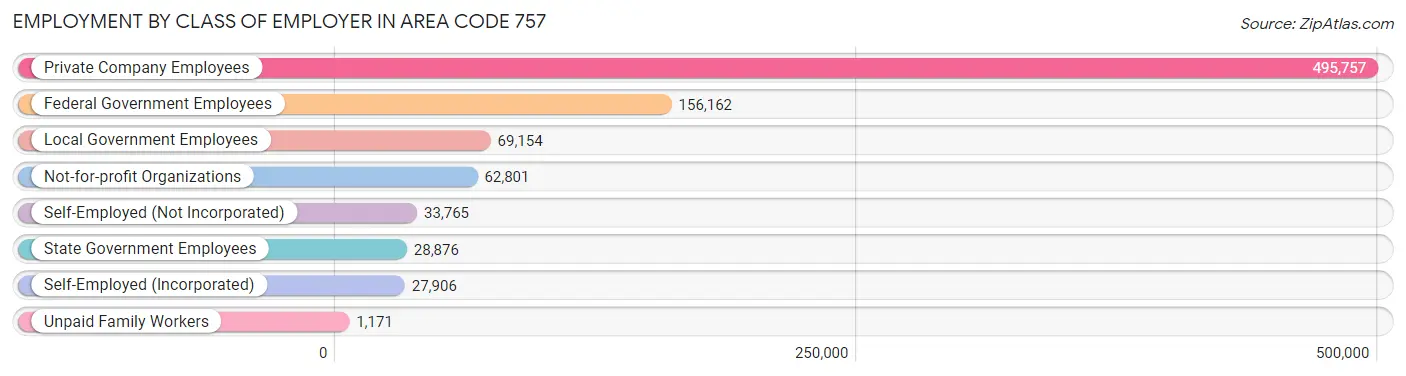
| Employer Class | # Employees | % Employees |
| Private Company Employees | 495,757 | 56.6% |
| Self-Employed (Incorporated) | 27,906 | 3.2% |
| Self-Employed (Not Incorporated) | 33,765 | 3.9% |
| Not-for-profit Organizations | 62,801 | 7.2% |
| Local Government Employees | 69,154 | 7.9% |
| State Government Employees | 28,876 | 3.3% |
| Federal Government Employees | 156,162 | 17.8% |
| Unpaid Family Workers | 1,171 | 0.1% |
| Total | 875,592 | 100.0% |
Employment Status by Age in Area Code 757
According to the labor force statistics for Area Code 757, out of the total population over 16 years of age (1,405,850), 64.7% or 909,163 individuals are in the labor force, with 7.1% or 64,369 of them unemployed. The age group with the highest labor force participation rate is 25 to 29 years, with 85.9% or 113,985 individuals in the labor force. Within the labor force, the 16 to 19 years age range has the highest percentage of unemployed individuals, with 1,532.4% or 748,915 of them being unemployed.
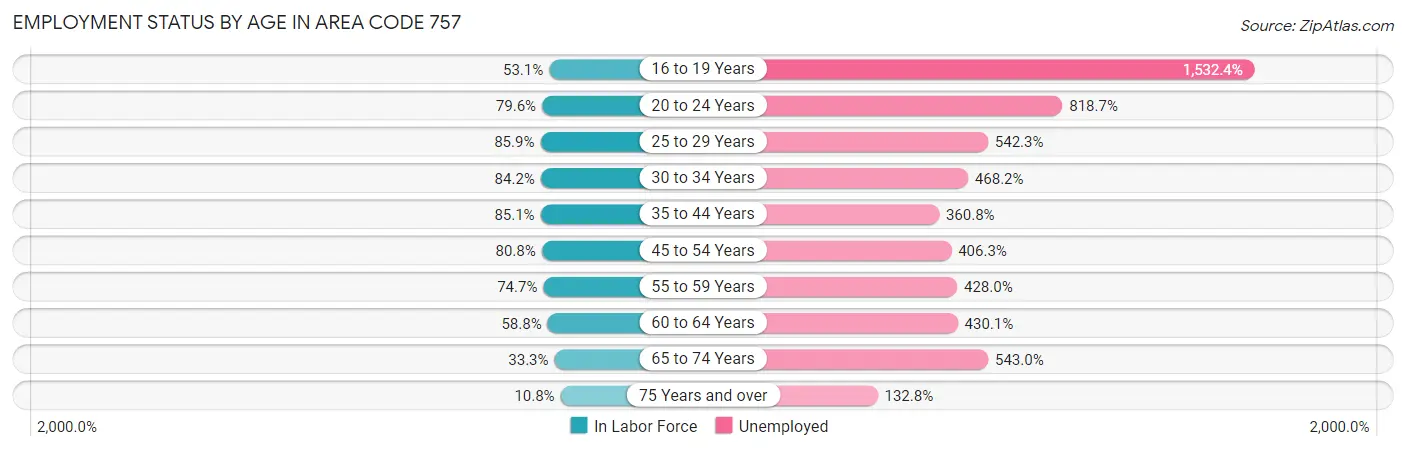
| Age Bracket | In Labor Force | Unemployed |
| 16 to 19 Years | 48,876 (53.1%) | 748,915 (1,532.4%) |
| 20 to 24 Years | 104,113 (79.6%) | 852,398 (818.7%) |
| 25 to 29 Years | 113,979 (85.9%) | 618,141 (542.3%) |
| 30 to 34 Years | 109,700 (84.2%) | 513,648 (468.2%) |
| 35 to 44 Years | 192,551 (85.1%) | 694,738 (360.8%) |
| 45 to 54 Years | 161,400 (80.8%) | 655,732 (406.3%) |
| 55 to 59 Years | 84,555 (74.7%) | 361,908 (428.0%) |
| 60 to 64 Years | 65,091 (58.8%) | 279,952 (430.1%) |
| 65 to 74 Years | 53,518 (33.3%) | 290,614 (543.0%) |
| 75 Years and over | 11,815 (10.8%) | 15,697 (132.8%) |
| Total | 909,172 (64.7%) | 64,378 (7.1%) |
Employment Status by Educational Attainment in Area Code 757
According to labor force statistics for Area Code 757, 78.6% of individuals (717,711) out of the total population between 25 and 64 years of age (912,886) are in the labor force, with 454.4% or 3,261,279 of them being unemployed. The group with the highest labor force participation rate are those with the educational attainment of bachelor's degree or higher, with 86.6% or 279,456 individuals in the labor force. Within the labor force, individuals with less than high school education have the highest percentage of unemployment, with 953.5% or 353,939 of them being unemployed.
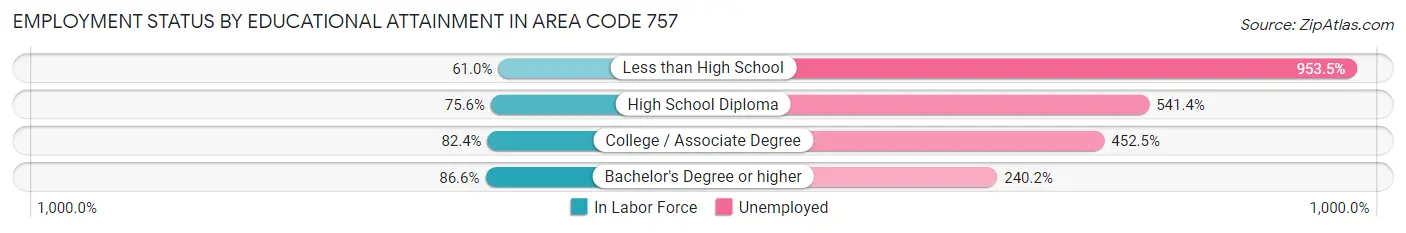
| Educational Attainment | In Labor Force | Unemployed |
| Less than High School | 37,118 (61.0%) | 580,710 (953.5%) |
| High School Diploma | 162,723 (75.6%) | 1,165,012 (541.4%) |
| College / Associate Degree | 258,784 (82.4%) | 1,421,977 (452.5%) |
| Bachelor's Degree or higher | 279,461 (86.6%) | 774,763 (240.2%) |
| Total | 717,683 (78.6%) | 4,148,154 (454.4%) |
Employment Occupations by Sex in Area Code 757
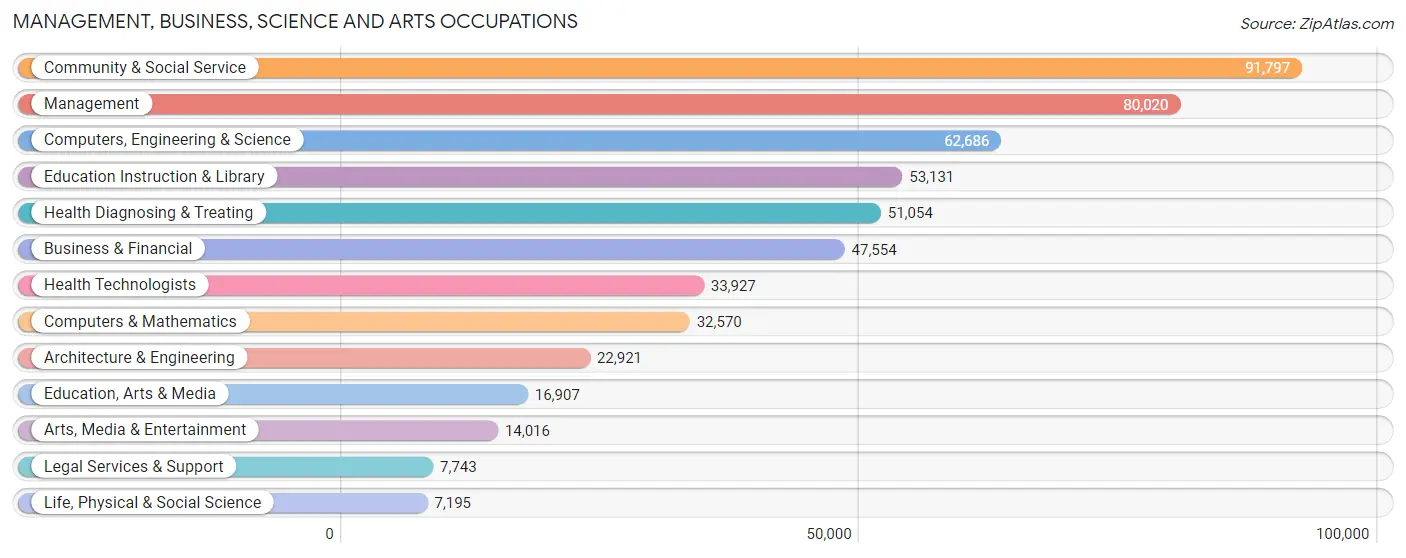
Management, Business, Science and Arts Occupations
The most common Management, Business, Science and Arts occupations in Area Code 757 are Community & Social Service (91,797 | 11.4%), Management (80,020 | 9.9%), Computers, Engineering & Science (62,686 | 7.8%), Education Instruction & Library (53,131 | 6.6%), and Health Diagnosing & Treating (51,054 | 6.3%).
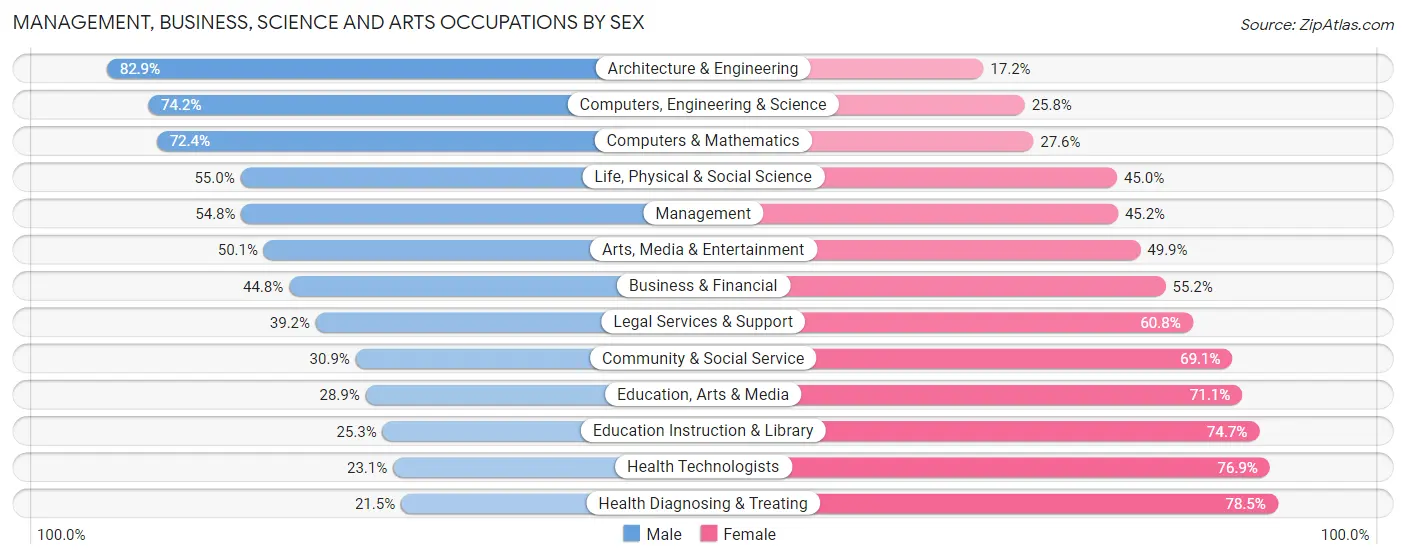
Management, Business, Science and Arts Occupations by Sex
Within the Management, Business, Science and Arts occupations in Area Code 757, the most male-oriented occupations are Architecture & Engineering (82.9%), Computers, Engineering & Science (74.2%), and Computers & Mathematics (72.4%), while the most female-oriented occupations are Health Diagnosing & Treating (78.5%), Health Technologists (76.9%), and Education Instruction & Library (74.7%).
| Occupation | Male | Female |
| Management | 43,831 (54.8%) | 36,189 (45.2%) |
| Business & Financial | 21,322 (44.8%) | 26,232 (55.2%) |
| Computers, Engineering & Science | 46,533 (74.2%) | 16,153 (25.8%) |
| Computers & Mathematics | 23,589 (72.4%) | 8,981 (27.6%) |
| Architecture & Engineering | 18,989 (82.9%) | 3,932 (17.2%) |
| Life, Physical & Social Science | 3,955 (55.0%) | 3,240 (45.0%) |
| Community & Social Service | 28,400 (30.9%) | 63,397 (69.1%) |
| Education, Arts & Media | 4,883 (28.9%) | 12,024 (71.1%) |
| Legal Services & Support | 3,038 (39.2%) | 4,705 (60.8%) |
| Education Instruction & Library | 13,457 (25.3%) | 39,674 (74.7%) |
| Arts, Media & Entertainment | 7,022 (50.1%) | 6,994 (49.9%) |
| Health Diagnosing & Treating | 10,965 (21.5%) | 40,089 (78.5%) |
| Health Technologists | 7,851 (23.1%) | 26,076 (76.9%) |
| Total (Category) | 151,051 (45.4%) | 182,060 (54.6%) |
| Total (Overall) | 405,306 (50.1%) | 402,808 (49.8%) |
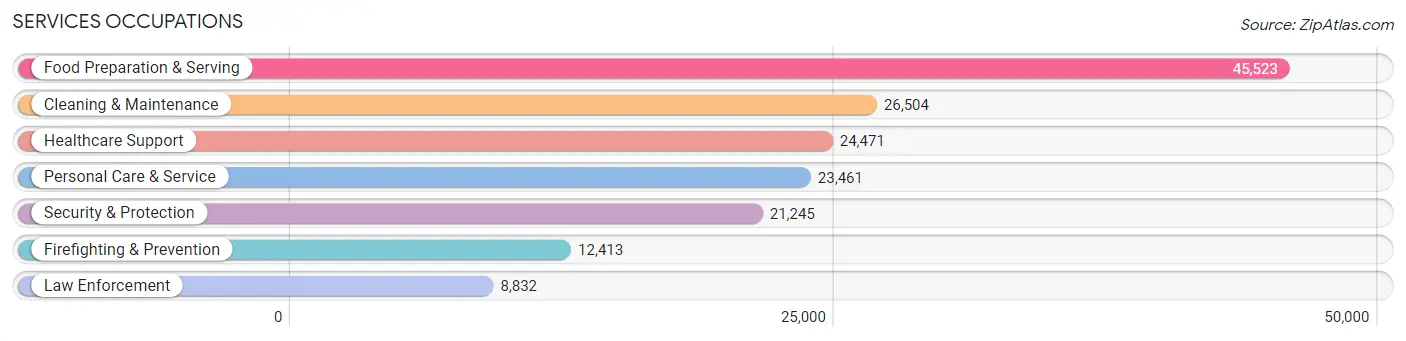
Services Occupations
The most common Services occupations in Area Code 757 are Food Preparation & Serving (45,523 | 5.6%), Cleaning & Maintenance (26,504 | 3.3%), Healthcare Support (24,471 | 3.0%), Personal Care & Service (23,461 | 2.9%), and Security & Protection (21,245 | 2.6%).
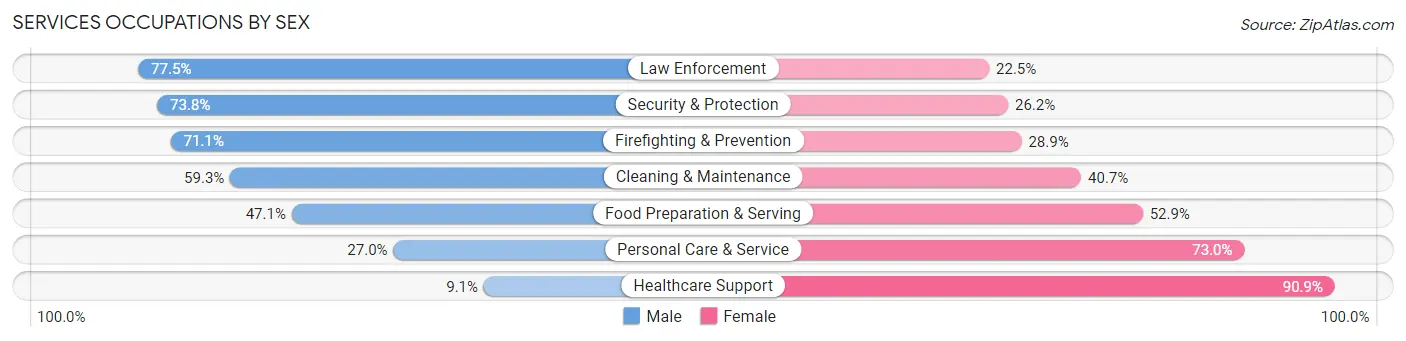
Services Occupations by Sex
Within the Services occupations in Area Code 757, the most male-oriented occupations are Law Enforcement (77.5%), Security & Protection (73.8%), and Firefighting & Prevention (71.1%), while the most female-oriented occupations are Healthcare Support (90.9%), Personal Care & Service (73.0%), and Food Preparation & Serving (52.9%).
| Occupation | Male | Female |
| Healthcare Support | 2,217 (9.1%) | 22,254 (90.9%) |
| Security & Protection | 15,672 (73.8%) | 5,573 (26.2%) |
| Firefighting & Prevention | 8,826 (71.1%) | 3,587 (28.9%) |
| Law Enforcement | 6,846 (77.5%) | 1,986 (22.5%) |
| Food Preparation & Serving | 21,440 (47.1%) | 24,083 (52.9%) |
| Cleaning & Maintenance | 15,714 (59.3%) | 10,790 (40.7%) |
| Personal Care & Service | 6,327 (27.0%) | 17,134 (73.0%) |
| Total (Category) | 61,370 (43.5%) | 79,834 (56.5%) |
| Total (Overall) | 405,306 (50.1%) | 402,808 (49.8%) |
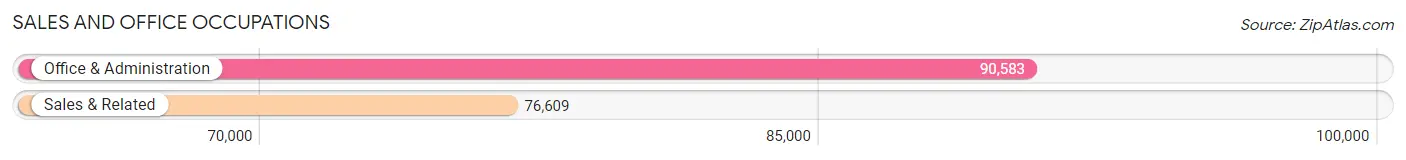
Sales and Office Occupations
The most common Sales and Office occupations in Area Code 757 are Office & Administration (90,583 | 11.2%), and Sales & Related (76,609 | 9.5%).
Sales and Office Occupations by Sex
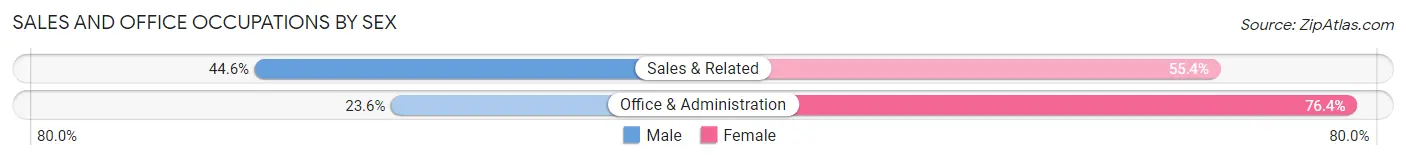
| Occupation | Male | Female |
| Sales & Related | 34,147 (44.6%) | 42,462 (55.4%) |
| Office & Administration | 21,372 (23.6%) | 69,211 (76.4%) |
| Total (Category) | 55,519 (33.2%) | 111,673 (66.8%) |
| Total (Overall) | 405,306 (50.1%) | 402,808 (49.8%) |
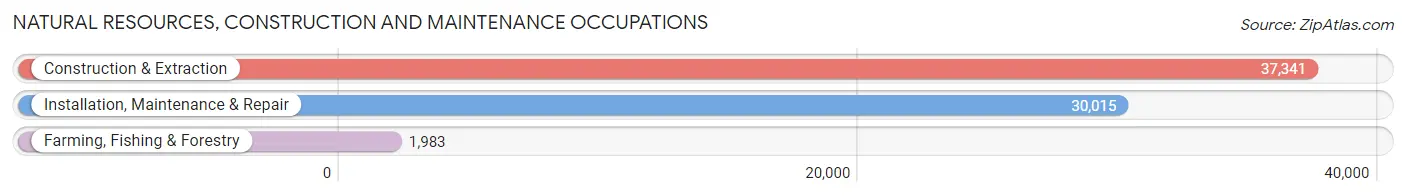
Natural Resources, Construction and Maintenance Occupations
The most common Natural Resources, Construction and Maintenance occupations in Area Code 757 are Construction & Extraction (37,341 | 4.6%), Installation, Maintenance & Repair (30,015 | 3.7%), and Farming, Fishing & Forestry (1,983 | 0.3%).
Natural Resources, Construction and Maintenance Occupations by Sex
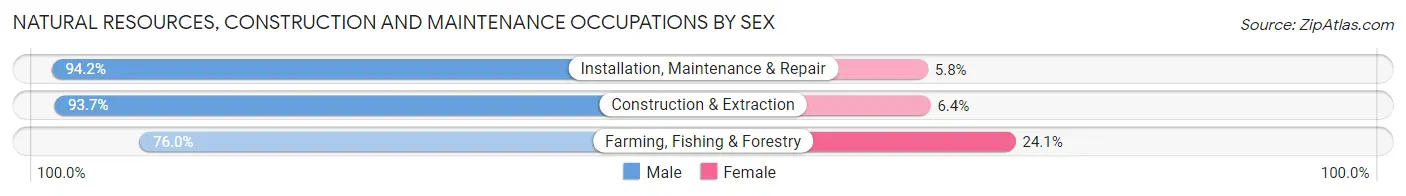
| Occupation | Male | Female |
| Farming, Fishing & Forestry | 1,506 (75.9%) | 477 (24.0%) |
| Construction & Extraction | 34,969 (93.6%) | 2,372 (6.4%) |
| Installation, Maintenance & Repair | 28,270 (94.2%) | 1,745 (5.8%) |
| Total (Category) | 64,745 (93.4%) | 4,594 (6.6%) |
| Total (Overall) | 405,306 (50.1%) | 402,808 (49.8%) |
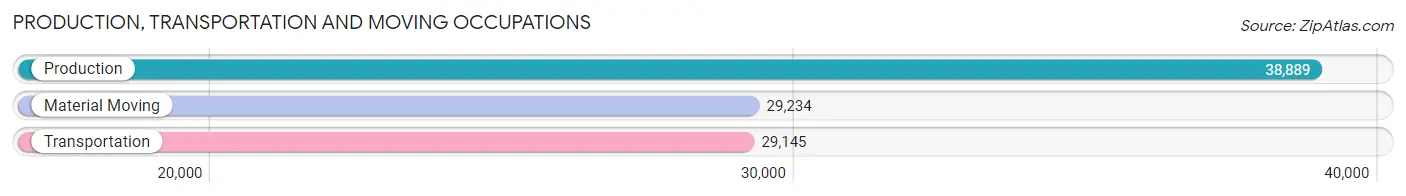
Production, Transportation and Moving Occupations
The most common Production, Transportation and Moving occupations in Area Code 757 are Production (38,889 | 4.8%), Material Moving (29,234 | 3.6%), and Transportation (29,145 | 3.6%).
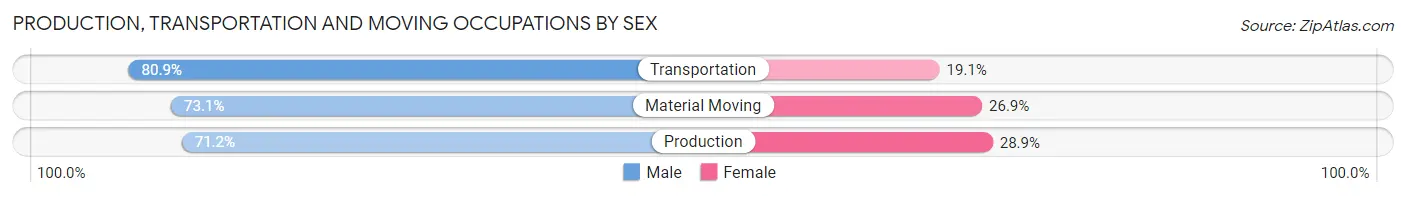
Production, Transportation and Moving Occupations by Sex
| Occupation | Male | Female |
| Production | 27,670 (71.2%) | 11,219 (28.8%) |
| Transportation | 23,579 (80.9%) | 5,566 (19.1%) |
| Material Moving | 21,372 (73.1%) | 7,862 (26.9%) |
| Total (Category) | 72,621 (74.7%) | 24,647 (25.3%) |
| Total (Overall) | 405,306 (50.1%) | 402,808 (49.8%) |
Employment Industries by Sex in Area Code 757
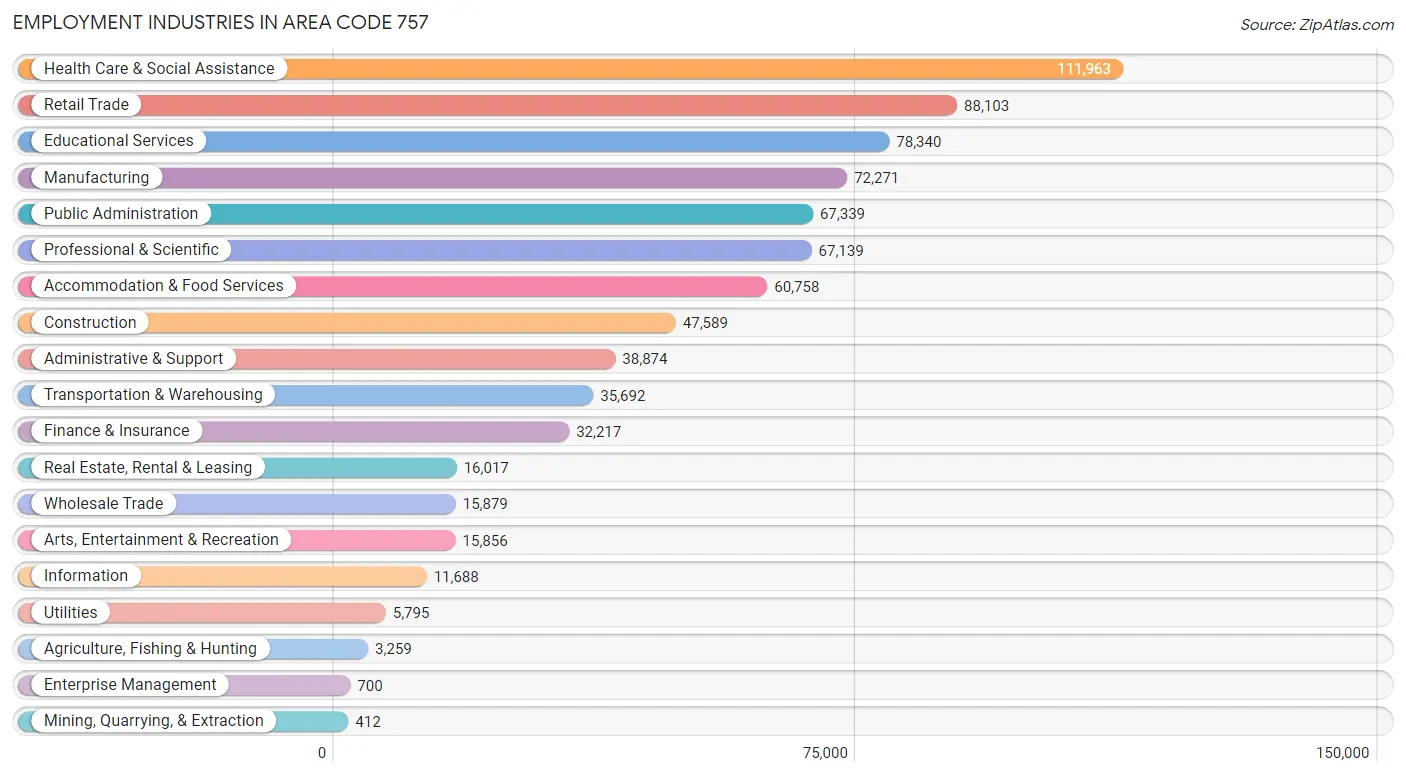
Employment Industries in Area Code 757
The major employment industries in Area Code 757 include Health Care & Social Assistance (111,963 | 13.9%), Retail Trade (88,103 | 10.9%), Educational Services (78,340 | 9.7%), Manufacturing (72,271 | 8.9%), and Public Administration (67,339 | 8.3%).
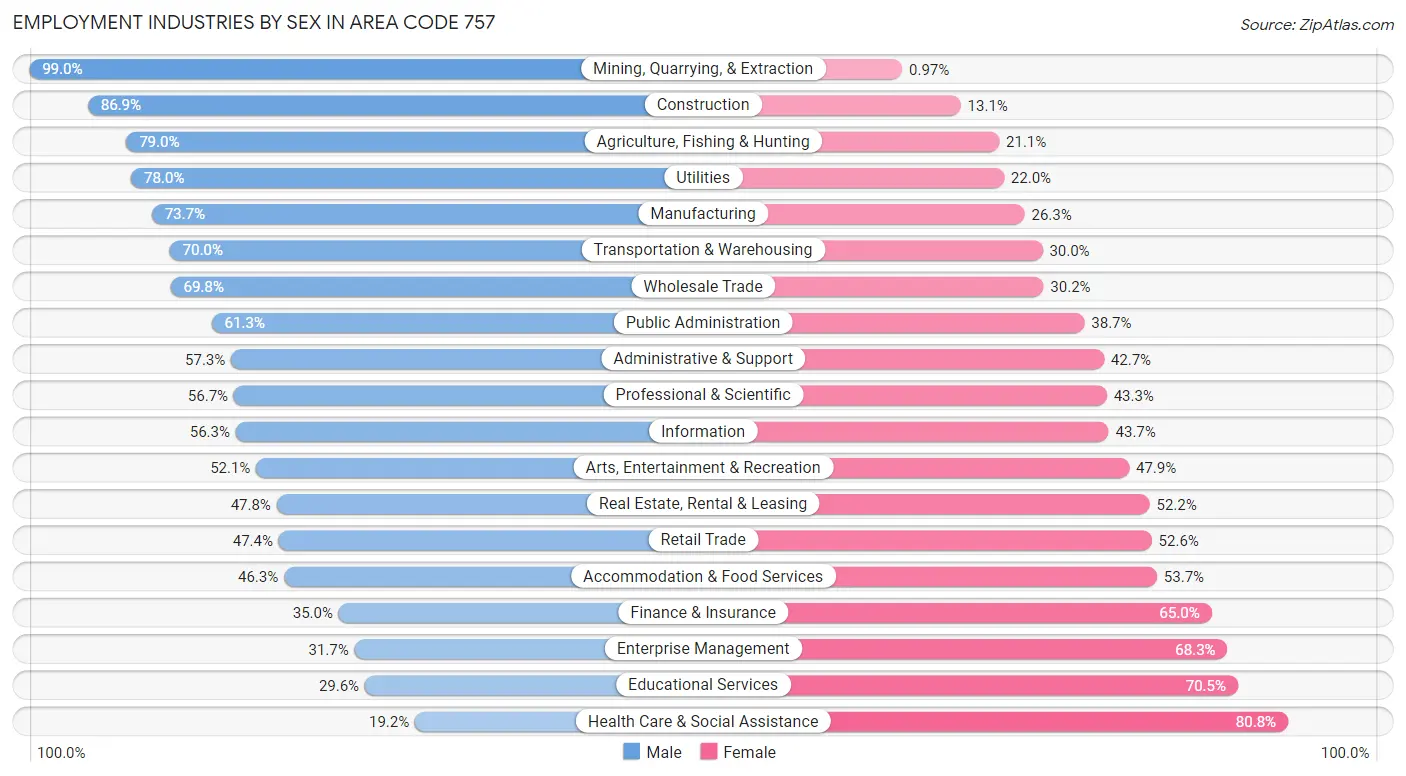
Employment Industries by Sex in Area Code 757
The Area Code 757 industries that see more men than women are Mining, Quarrying, & Extraction (99.0%), Construction (86.9%), and Agriculture, Fishing & Hunting (78.9%), whereas the industries that tend to have a higher number of women are Health Care & Social Assistance (80.8%), Educational Services (70.5%), and Enterprise Management (68.3%).
| Industry | Male | Female |
| Agriculture, Fishing & Hunting | 2,573 (78.9%) | 686 (21.0%) |
| Mining, Quarrying, & Extraction | 408 (99.0%) | 4 (1.0%) |
| Construction | 41,359 (86.9%) | 6,230 (13.1%) |
| Manufacturing | 53,252 (73.7%) | 19,019 (26.3%) |
| Wholesale Trade | 11,081 (69.8%) | 4,798 (30.2%) |
| Retail Trade | 41,744 (47.4%) | 46,359 (52.6%) |
| Transportation & Warehousing | 24,978 (70.0%) | 10,714 (30.0%) |
| Utilities | 4,518 (78.0%) | 1,277 (22.0%) |
| Information | 6,579 (56.3%) | 5,109 (43.7%) |
| Finance & Insurance | 11,267 (35.0%) | 20,950 (65.0%) |
| Real Estate, Rental & Leasing | 7,659 (47.8%) | 8,358 (52.2%) |
| Professional & Scientific | 38,052 (56.7%) | 29,087 (43.3%) |
| Enterprise Management | 222 (31.7%) | 478 (68.3%) |
| Administrative & Support | 22,261 (57.3%) | 16,613 (42.7%) |
| Educational Services | 23,146 (29.5%) | 55,194 (70.5%) |
| Health Care & Social Assistance | 21,478 (19.2%) | 90,485 (80.8%) |
| Arts, Entertainment & Recreation | 8,254 (52.1%) | 7,602 (47.9%) |
| Accommodation & Food Services | 28,125 (46.3%) | 32,633 (53.7%) |
| Public Administration | 41,277 (61.3%) | 26,062 (38.7%) |
| Total | 405,306 (50.1%) | 402,808 (49.8%) |
Education in Area Code 757
School Enrollment in Area Code 757
The most common levels of schooling among the 431,436 students in Area Code 757 are college / undergraduate (101,014 | 23.4%), high school (86,138 | 20.0%), and middle school (85,410 | 19.8%).
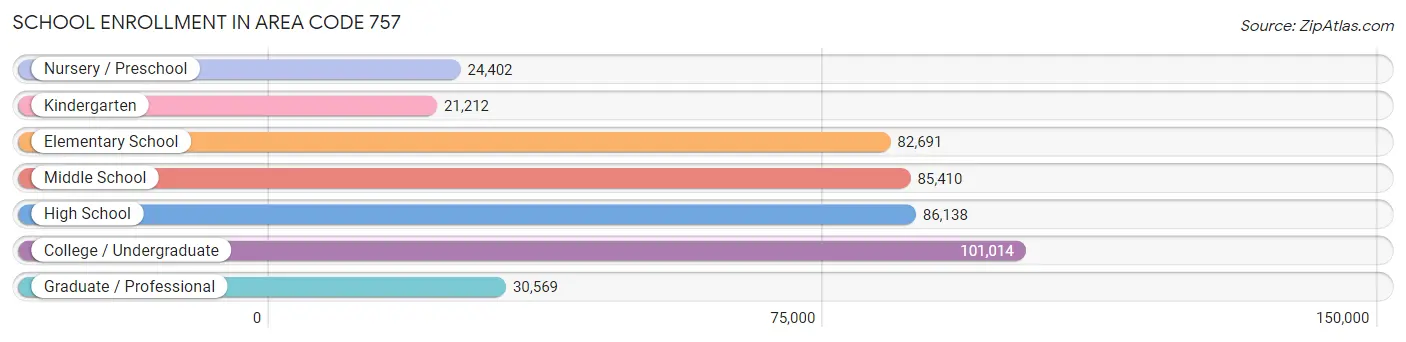
| School Level | # Students | % Students |
| Nursery / Preschool | 24,402 | 5.7% |
| Kindergarten | 21,212 | 4.9% |
| Elementary School | 82,691 | 19.2% |
| Middle School | 85,410 | 19.8% |
| High School | 86,138 | 20.0% |
| College / Undergraduate | 101,014 | 23.4% |
| Graduate / Professional | 30,569 | 7.1% |
| Total | 431,436 | 100.0% |
School Enrollment by Age by Funding Source in Area Code 757
Out of a total of 431,436 students who are enrolled in schools in Area Code 757, 75,536 (17.5%) attend a private institution, while the remaining 355,900 (82.5%) are enrolled in public schools. The age group of 3 to 4 year olds has the highest likelihood of being enrolled in private schools, with 9,801 (49.8% in the age bracket) enrolled. Conversely, the age group of 15 to 17 year olds has the lowest likelihood of being enrolled in a private school, with 55,704 (90.3% in the age bracket) attending a public institution.
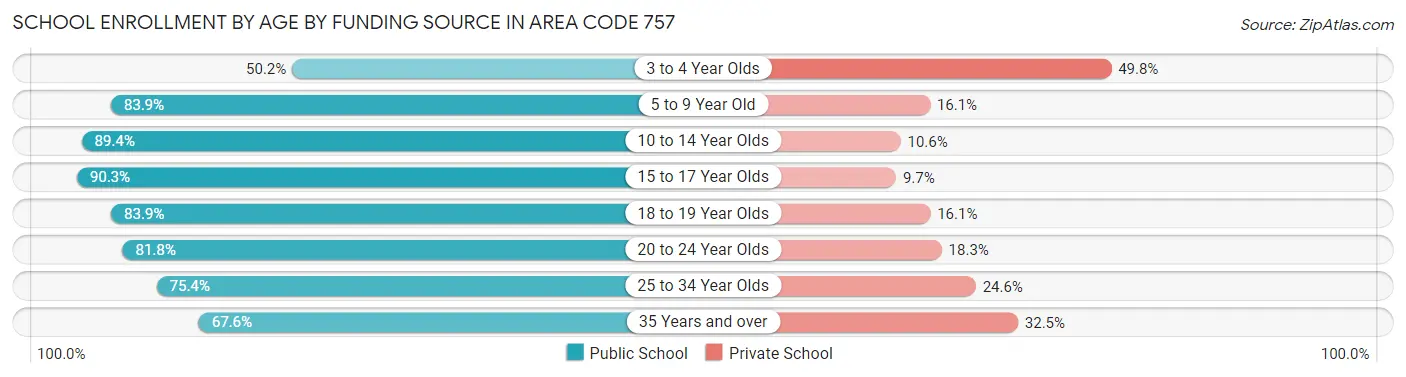
| Age Bracket | Public School | Private School |
| 3 to 4 Year Olds | 9,869 (50.2%) | 9,801 (49.8%) |
| 5 to 9 Year Old | 83,625 (83.9%) | 16,009 (16.1%) |
| 10 to 14 Year Olds | 94,505 (89.4%) | 11,206 (10.6%) |
| 15 to 17 Year Olds | 55,704 (90.3%) | 6,011 (9.7%) |
| 18 to 19 Year Olds | 27,229 (83.9%) | 5,231 (16.1%) |
| 20 to 24 Year Olds | 36,378 (81.8%) | 8,120 (18.2%) |
| 25 to 34 Year Olds | 27,363 (75.4%) | 8,922 (24.6%) |
| 35 Years and over | 21,254 (67.5%) | 10,209 (32.5%) |
| Total | 355,900 (82.5%) | 75,536 (17.5%) |
Educational Attainment by Field of Study in Area Code 757
Business (80,579 | 18.3%), education (48,382 | 11.0%), science & technology (42,120 | 9.6%), social sciences (36,618 | 8.3%), and arts & humanities (36,346 | 8.2%) are the most common fields of study among 441,098 individuals in Area Code 757 who have obtained a bachelor's degree or higher.
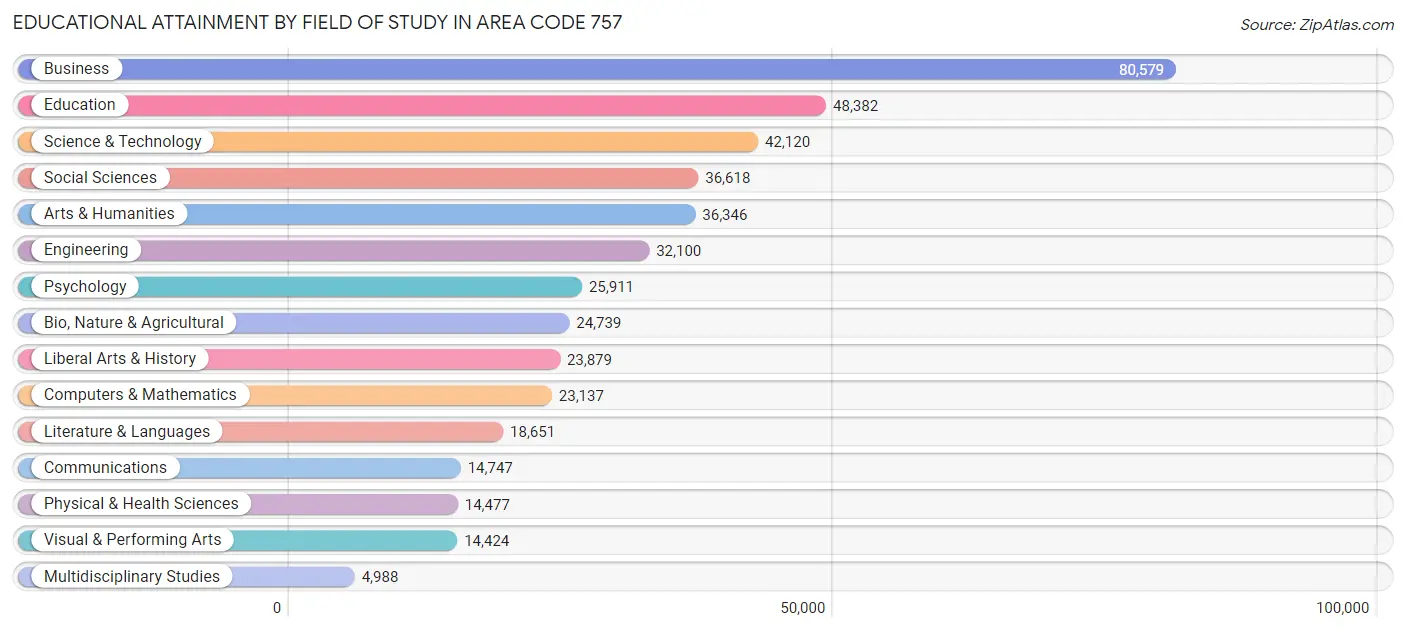
| Field of Study | # Graduates | % Graduates |
| Computers & Mathematics | 23,137 | 5.2% |
| Bio, Nature & Agricultural | 24,739 | 5.6% |
| Physical & Health Sciences | 14,477 | 3.3% |
| Psychology | 25,911 | 5.9% |
| Social Sciences | 36,618 | 8.3% |
| Engineering | 32,100 | 7.3% |
| Multidisciplinary Studies | 4,988 | 1.1% |
| Science & Technology | 42,120 | 9.6% |
| Business | 80,579 | 18.3% |
| Education | 48,382 | 11.0% |
| Literature & Languages | 18,651 | 4.2% |
| Liberal Arts & History | 23,879 | 5.4% |
| Visual & Performing Arts | 14,424 | 3.3% |
| Communications | 14,747 | 3.3% |
| Arts & Humanities | 36,346 | 8.2% |
| Total | 441,098 | 100.0% |
Transportation & Commute in Area Code 757
Vehicle Availability by Sex in Area Code 757
The most prevalent vehicle ownership categories in Area Code 757 are males with 2 vehicles (188,512, accounting for 42.2%) and females with 2 vehicles (155,193, making up 47.0%).
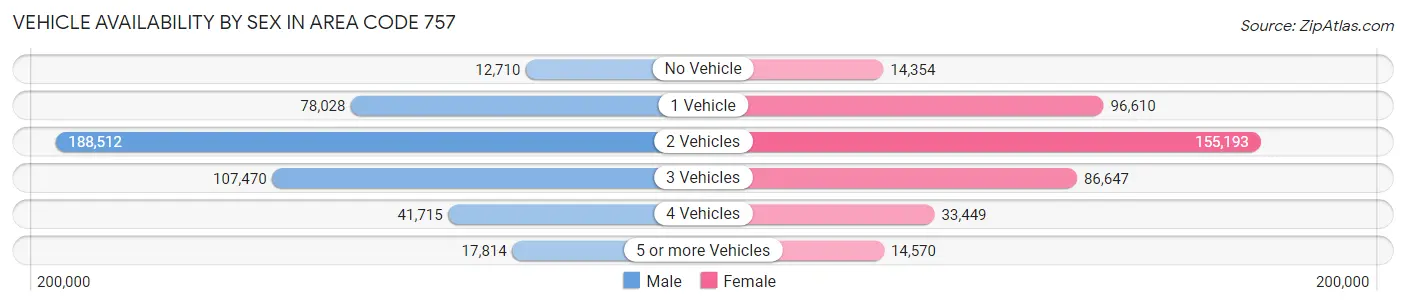
| Vehicles Available | Male | Female |
| No Vehicle | 12,710 (2.9%) | 14,354 (3.6%) |
| 1 Vehicle | 78,028 (17.5%) | 96,610 (24.1%) |
| 2 Vehicles | 188,512 (42.2%) | 155,193 (38.7%) |
| 3 Vehicles | 107,470 (24.1%) | 86,647 (21.6%) |
| 4 Vehicles | 41,715 (9.3%) | 33,449 (8.4%) |
| 5 or more Vehicles | 17,814 (4.0%) | 14,570 (3.6%) |
| Total | 446,249 (100.0%) | 400,823 (100.0%) |
Commute Time in Area Code 757
The most frequently occuring commute durations in Area Code 757 are 15 to 19 minutes (142,377 commuters, 17.9%), 20 to 24 minutes (131,101 commuters, 16.5%), and 30 to 34 minutes (119,438 commuters, 15.0%).
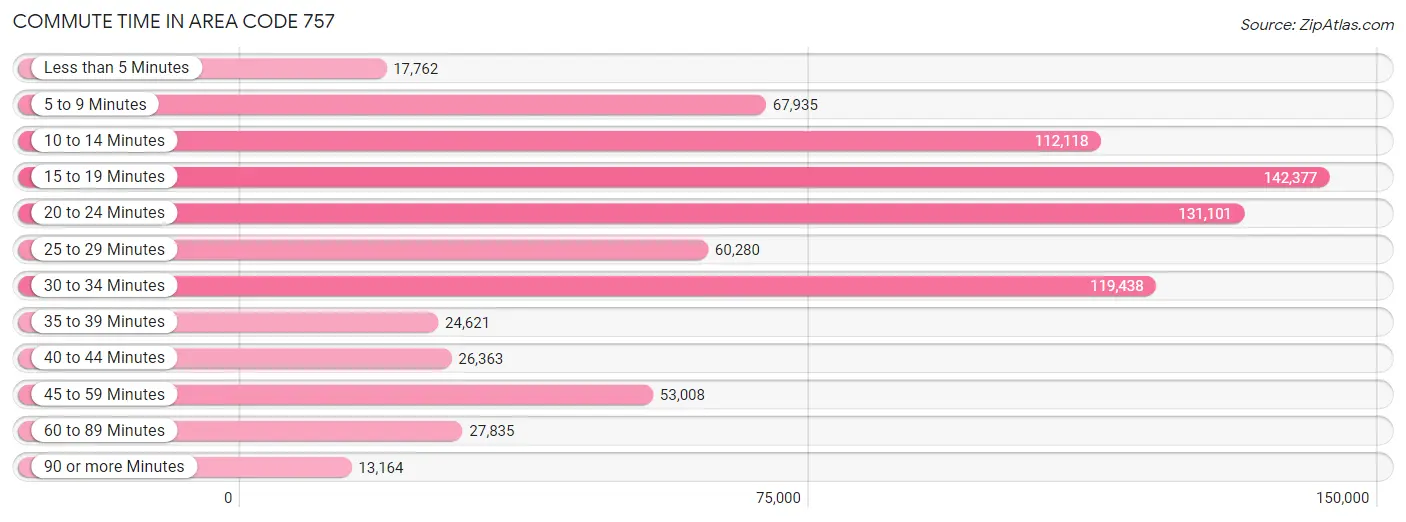
| Commute Time | # Commuters | % Commuters |
| Less than 5 Minutes | 17,762 | 2.2% |
| 5 to 9 Minutes | 67,935 | 8.5% |
| 10 to 14 Minutes | 112,118 | 14.1% |
| 15 to 19 Minutes | 142,377 | 17.9% |
| 20 to 24 Minutes | 131,101 | 16.5% |
| 25 to 29 Minutes | 60,280 | 7.6% |
| 30 to 34 Minutes | 119,438 | 15.0% |
| 35 to 39 Minutes | 24,621 | 3.1% |
| 40 to 44 Minutes | 26,363 | 3.3% |
| 45 to 59 Minutes | 53,008 | 6.7% |
| 60 to 89 Minutes | 27,835 | 3.5% |
| 90 or more Minutes | 13,164 | 1.7% |
Commute Time by Sex in Area Code 757
The most common commute times in Area Code 757 are 15 to 19 minutes (74,646 commuters, 17.3%) for males and 15 to 19 minutes (67,731 commuters, 18.6%) for females.
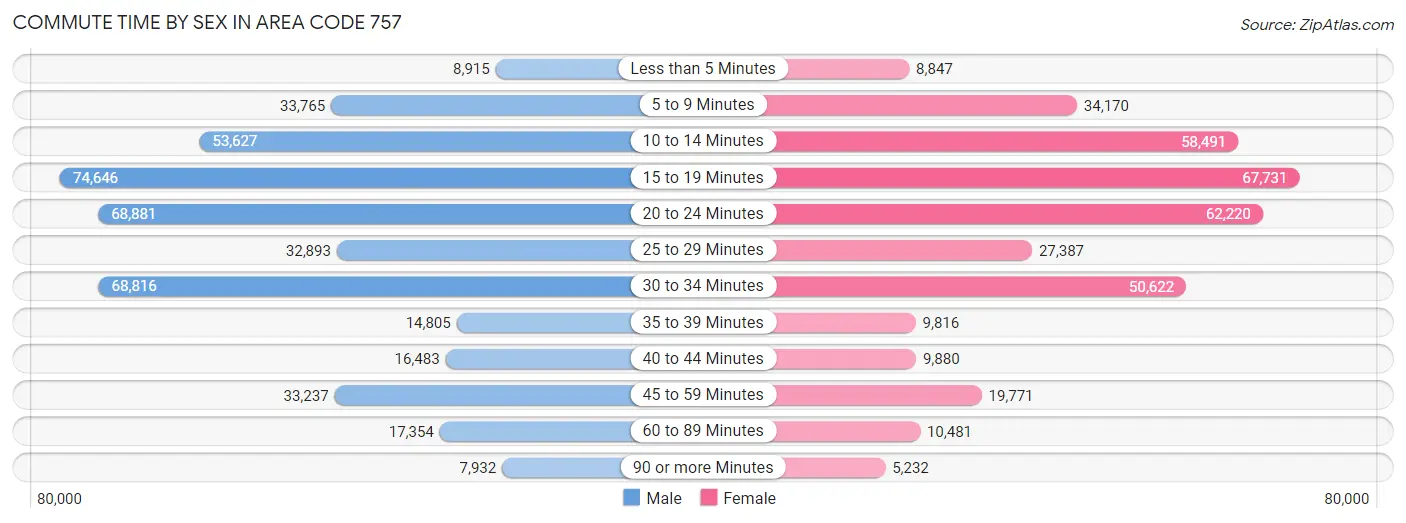
| Commute Time | Male | Female |
| Less than 5 Minutes | 8,915 (2.1%) | 8,847 (2.4%) |
| 5 to 9 Minutes | 33,765 (7.8%) | 34,170 (9.4%) |
| 10 to 14 Minutes | 53,627 (12.4%) | 58,491 (16.0%) |
| 15 to 19 Minutes | 74,646 (17.3%) | 67,731 (18.6%) |
| 20 to 24 Minutes | 68,881 (16.0%) | 62,220 (17.1%) |
| 25 to 29 Minutes | 32,893 (7.6%) | 27,387 (7.5%) |
| 30 to 34 Minutes | 68,816 (16.0%) | 50,622 (13.9%) |
| 35 to 39 Minutes | 14,805 (3.4%) | 9,816 (2.7%) |
| 40 to 44 Minutes | 16,483 (3.8%) | 9,880 (2.7%) |
| 45 to 59 Minutes | 33,237 (7.7%) | 19,771 (5.4%) |
| 60 to 89 Minutes | 17,354 (4.0%) | 10,481 (2.9%) |
| 90 or more Minutes | 7,932 (1.8%) | 5,232 (1.4%) |
Time of Departure to Work by Sex in Area Code 757
The most frequent times of departure to work in Area Code 757 are 7:00 AM to 7:29 AM (57,303, 13.3%) for males and 7:00 AM to 7:29 AM (51,210, 14.0%) for females.
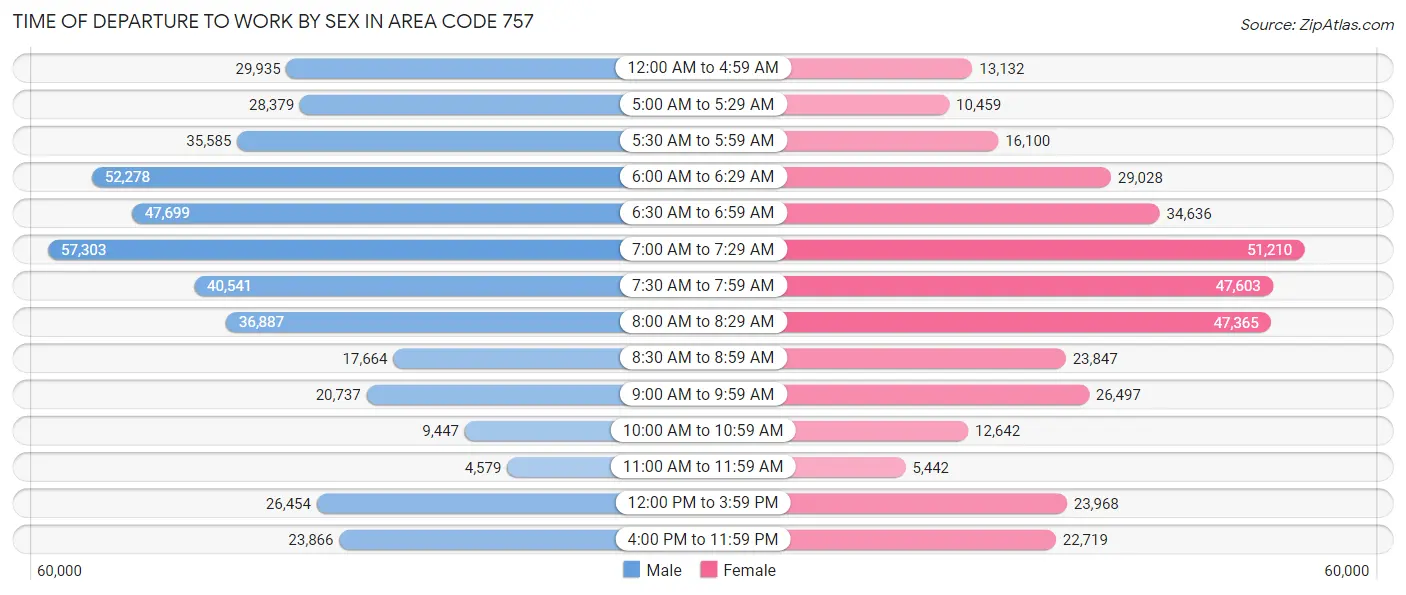
| Time of Departure | Male | Female |
| 12:00 AM to 4:59 AM | 29,935 (6.9%) | 13,132 (3.6%) |
| 5:00 AM to 5:29 AM | 28,379 (6.6%) | 10,459 (2.9%) |
| 5:30 AM to 5:59 AM | 35,585 (8.3%) | 16,100 (4.4%) |
| 6:00 AM to 6:29 AM | 52,278 (12.1%) | 29,028 (8.0%) |
| 6:30 AM to 6:59 AM | 47,699 (11.1%) | 34,636 (9.5%) |
| 7:00 AM to 7:29 AM | 57,303 (13.3%) | 51,210 (14.0%) |
| 7:30 AM to 7:59 AM | 40,541 (9.4%) | 47,603 (13.1%) |
| 8:00 AM to 8:29 AM | 36,887 (8.6%) | 47,365 (13.0%) |
| 8:30 AM to 8:59 AM | 17,664 (4.1%) | 23,847 (6.5%) |
| 9:00 AM to 9:59 AM | 20,737 (4.8%) | 26,497 (7.3%) |
| 10:00 AM to 10:59 AM | 9,447 (2.2%) | 12,642 (3.5%) |
| 11:00 AM to 11:59 AM | 4,579 (1.1%) | 5,442 (1.5%) |
| 12:00 PM to 3:59 PM | 26,454 (6.1%) | 23,968 (6.6%) |
| 4:00 PM to 11:59 PM | 23,866 (5.5%) | 22,719 (6.2%) |
| Total | 431,354 (100.0%) | 364,648 (100.0%) |
Housing Occupancy in Area Code 757
Occupancy by Ownership in Area Code 757
Of the total 684,804 dwellings in Area Code 757, owner-occupied units account for 421,697 (61.6%), while renter-occupied units make up 263,107 (38.4%).
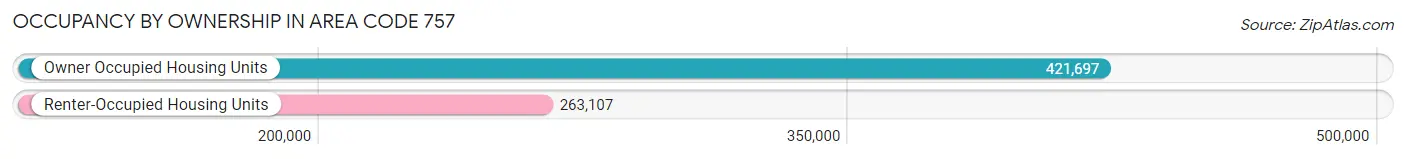
| Occupancy | # Housing Units | % Housing Units |
| Owner Occupied Housing Units | 421,697 | 61.6% |
| Renter-Occupied Housing Units | 263,107 | 38.4% |
| Total Occupied Housing Units | 684,804 | 100.0% |
Occupancy by Household Size in Area Code 757
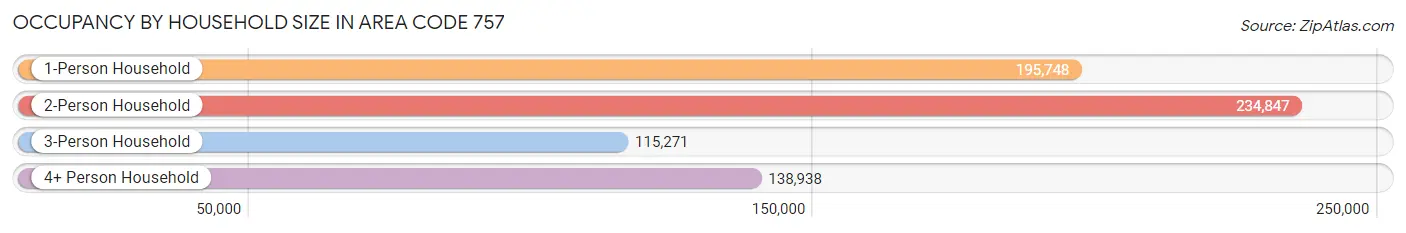
| Household Size | # Housing Units | % Housing Units |
| 1-Person Household | 195,748 | 28.6% |
| 2-Person Household | 234,847 | 34.3% |
| 3-Person Household | 115,271 | 16.8% |
| 4+ Person Household | 138,938 | 20.3% |
| Total Housing Units | 684,804 | 100.0% |
Occupancy by Ownership by Household Size in Area Code 757
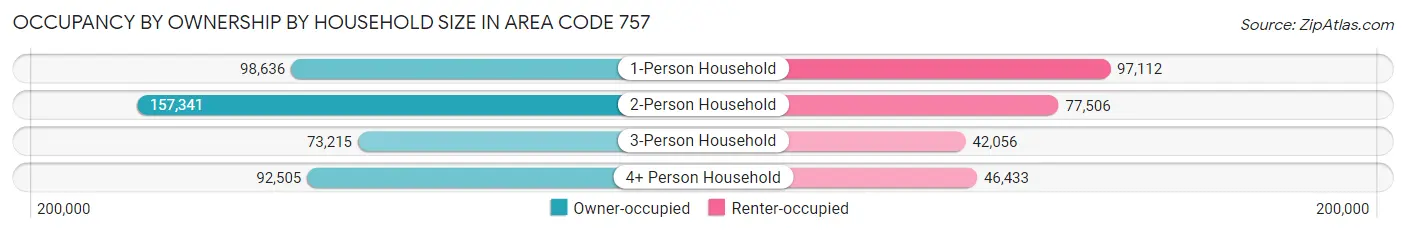
| Household Size | Owner-occupied | Renter-occupied |
| 1-Person Household | 98,636 (50.4%) | 97,112 (49.6%) |
| 2-Person Household | 157,341 (67.0%) | 77,506 (33.0%) |
| 3-Person Household | 73,215 (63.5%) | 42,056 (36.5%) |
| 4+ Person Household | 92,505 (66.6%) | 46,433 (33.4%) |
| Total Housing Units | 421,697 (61.6%) | 263,107 (38.4%) |
Occupancy by Educational Attainment in Area Code 757
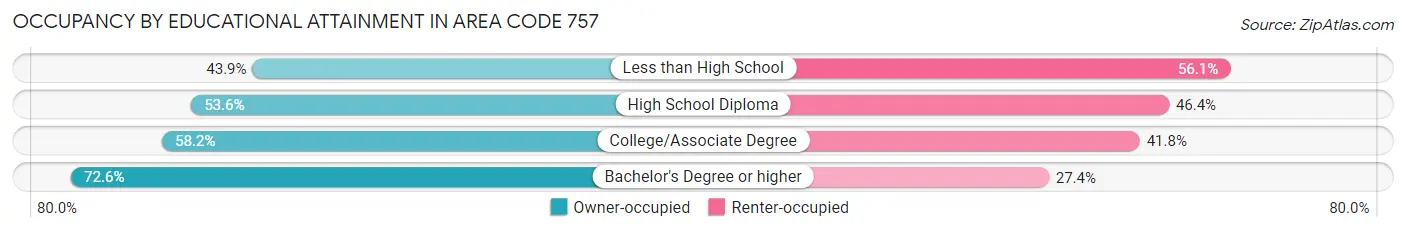
| Household Size | Owner-occupied | Renter-occupied |
| Less than High School | 19,410 (43.9%) | 24,839 (56.1%) |
| High School Diploma | 80,521 (53.6%) | 69,824 (46.4%) |
| College/Associate Degree | 138,111 (58.2%) | 99,203 (41.8%) |
| Bachelor's Degree or higher | 183,655 (72.6%) | 69,241 (27.4%) |
Occupancy by Age of Householder in Area Code 757
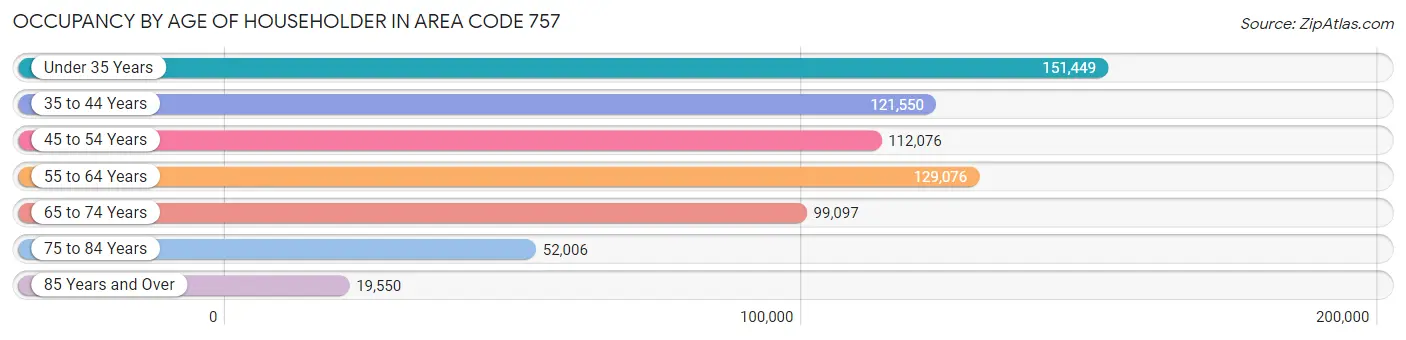
| Age Bracket | # Households | % Households |
| Under 35 Years | 151,449 | 22.1% |
| 35 to 44 Years | 121,550 | 17.7% |
| 45 to 54 Years | 112,076 | 16.4% |
| 55 to 64 Years | 129,076 | 18.9% |
| 65 to 74 Years | 99,097 | 14.5% |
| 75 to 84 Years | 52,006 | 7.6% |
| 85 Years and Over | 19,550 | 2.9% |
| Total | 684,804 | 100.0% |
Housing Finances in Area Code 757
Median Income by Occupancy in Area Code 757
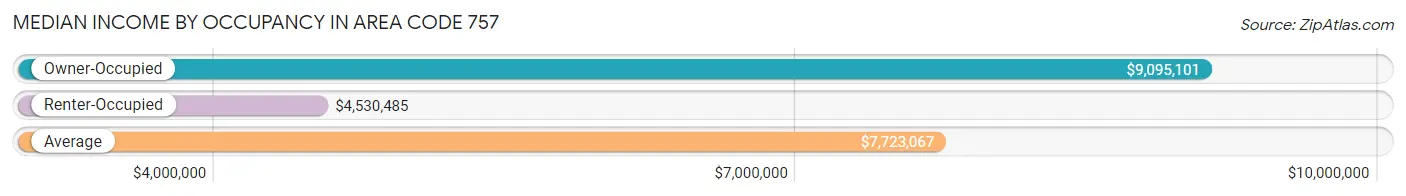
| Occupancy Type | # Households | Median Income |
| Owner-Occupied | 421,697 (61.6%) | $9,095,101 |
| Renter-Occupied | 263,107 (38.4%) | $4,530,485 |
| Average | 684,804 (100.0%) | $7,723,067 |
Occupancy by Householder Income Bracket in Area Code 757
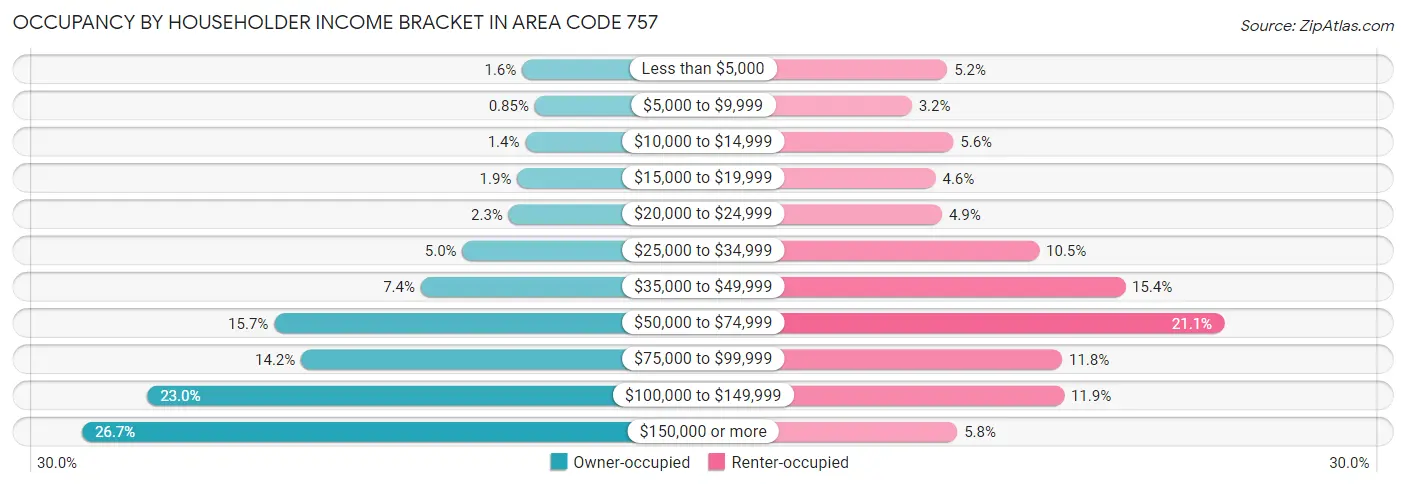
| Income Bracket | Owner-occupied | Renter-occupied |
| Less than $5,000 | 6,628 (1.6%) | 13,780 (5.2%) |
| $5,000 to $9,999 | 3,603 (0.9%) | 8,438 (3.2%) |
| $10,000 to $14,999 | 5,879 (1.4%) | 14,701 (5.6%) |
| $15,000 to $19,999 | 7,795 (1.8%) | 12,016 (4.6%) |
| $20,000 to $24,999 | 9,880 (2.3%) | 12,998 (4.9%) |
| $25,000 to $34,999 | 20,988 (5.0%) | 27,593 (10.5%) |
| $35,000 to $49,999 | 31,018 (7.4%) | 40,530 (15.4%) |
| $50,000 to $74,999 | 66,378 (15.7%) | 55,375 (21.0%) |
| $75,000 to $99,999 | 59,878 (14.2%) | 31,038 (11.8%) |
| $100,000 to $149,999 | 96,952 (23.0%) | 31,347 (11.9%) |
| $150,000 or more | 112,698 (26.7%) | 15,291 (5.8%) |
| Total | 421,697 (100.0%) | 263,107 (100.0%) |
Monthly Housing Cost Tiers in Area Code 757
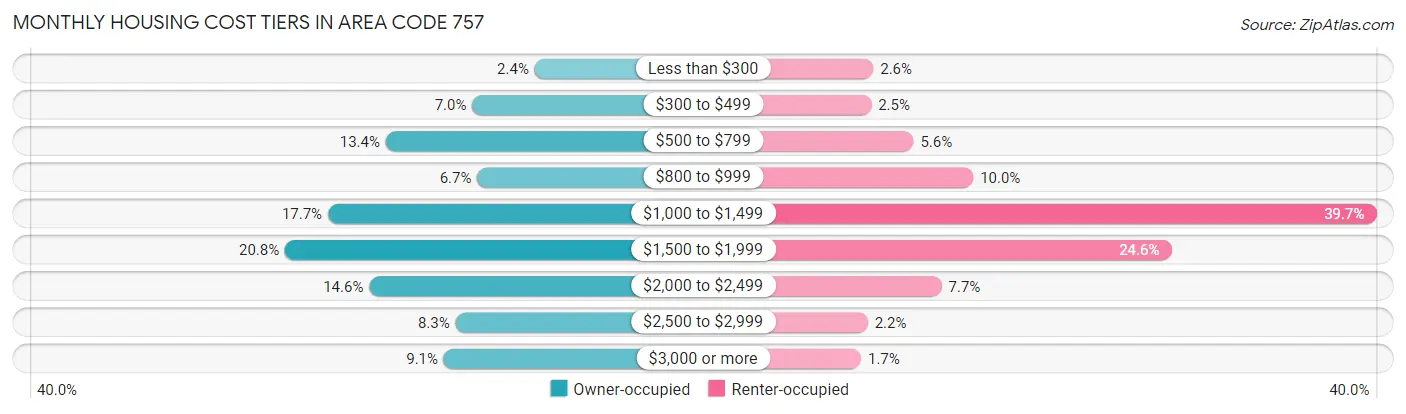
| Monthly Cost | Owner-occupied | Renter-occupied |
| Less than $300 | 10,256 (2.4%) | 6,953 (2.6%) |
| $300 to $499 | 29,633 (7.0%) | 6,551 (2.5%) |
| $500 to $799 | 56,524 (13.4%) | 14,735 (5.6%) |
| $800 to $999 | 28,072 (6.7%) | 26,302 (10.0%) |
| $1,000 to $1,499 | 74,468 (17.7%) | 104,405 (39.7%) |
| $1,500 to $1,999 | 87,782 (20.8%) | 64,673 (24.6%) |
| $2,000 to $2,499 | 61,644 (14.6%) | 20,185 (7.7%) |
| $2,500 to $2,999 | 34,847 (8.3%) | 5,870 (2.2%) |
| $3,000 or more | 38,471 (9.1%) | 4,575 (1.7%) |
| Total | 421,697 (100.0%) | 263,107 (100.0%) |
Physical Housing Characteristics in Area Code 757
Housing Structures in Area Code 757
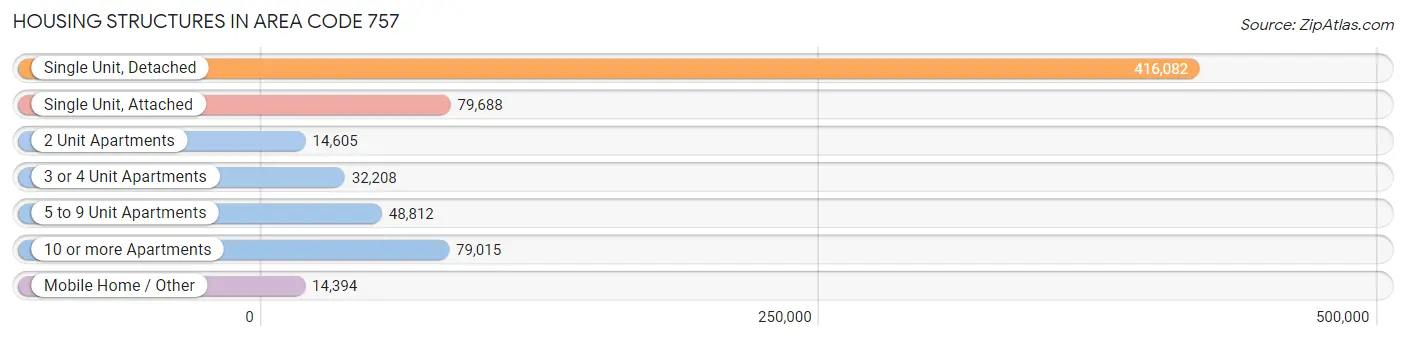
| Structure Type | # Housing Units | % Housing Units |
| Single Unit, Detached | 416,082 | 60.8% |
| Single Unit, Attached | 79,688 | 11.6% |
| 2 Unit Apartments | 14,605 | 2.1% |
| 3 or 4 Unit Apartments | 32,208 | 4.7% |
| 5 to 9 Unit Apartments | 48,812 | 7.1% |
| 10 or more Apartments | 79,015 | 11.5% |
| Mobile Home / Other | 14,394 | 2.1% |
| Total | 684,804 | 100.0% |
Housing Structures by Occupancy in Area Code 757
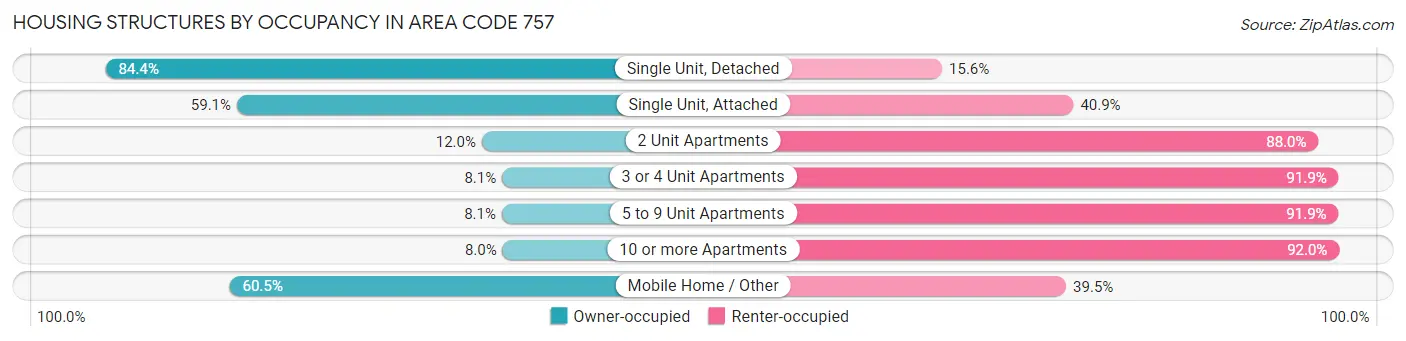
| Structure Type | Owner-occupied | Renter-occupied |
| Single Unit, Detached | 351,252 (84.4%) | 64,830 (15.6%) |
| Single Unit, Attached | 47,123 (59.1%) | 32,565 (40.9%) |
| 2 Unit Apartments | 1,750 (12.0%) | 12,855 (88.0%) |
| 3 or 4 Unit Apartments | 2,598 (8.1%) | 29,610 (91.9%) |
| 5 to 9 Unit Apartments | 3,963 (8.1%) | 44,849 (91.9%) |
| 10 or more Apartments | 6,299 (8.0%) | 72,716 (92.0%) |
| Mobile Home / Other | 8,712 (60.5%) | 5,682 (39.5%) |
| Total | 421,697 (61.6%) | 263,107 (38.4%) |
Housing Structures by Number of Rooms in Area Code 757
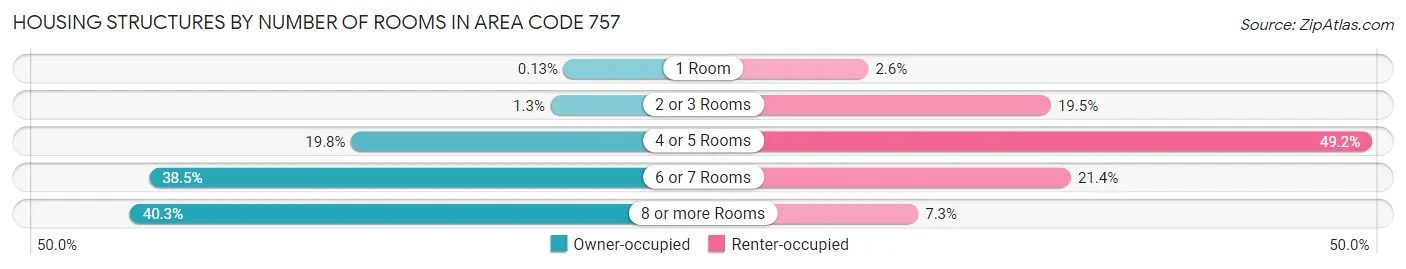
| Number of Rooms | Owner-occupied | Renter-occupied |
| 1 Room | 569 (0.1%) | 6,945 (2.6%) |
| 2 or 3 Rooms | 5,657 (1.3%) | 51,371 (19.5%) |
| 4 or 5 Rooms | 83,420 (19.8%) | 129,469 (49.2%) |
| 6 or 7 Rooms | 162,231 (38.5%) | 56,244 (21.4%) |
| 8 or more Rooms | 169,820 (40.3%) | 19,078 (7.2%) |
| Total | 421,697 (100.0%) | 263,107 (100.0%) |
Housing Structure by Heating Type in Area Code 757
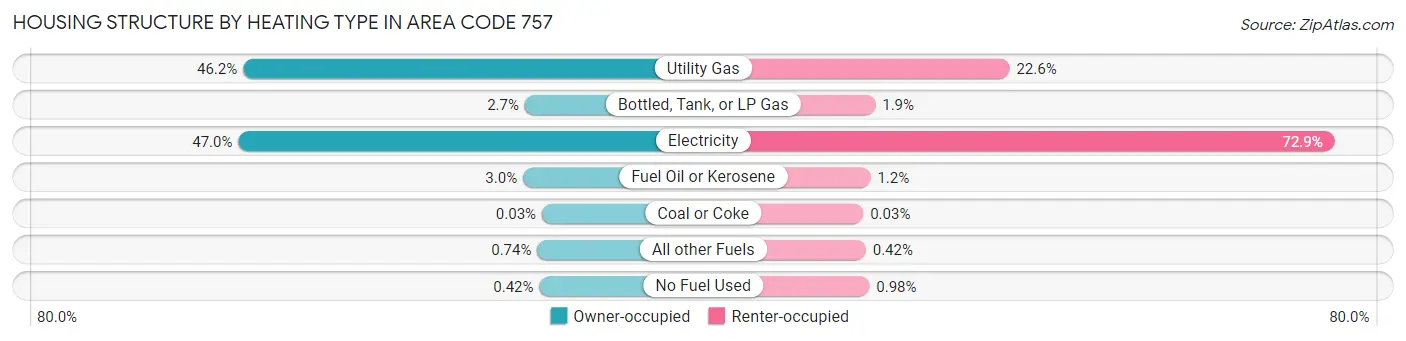
| Heating Type | Owner-occupied | Renter-occupied |
| Utility Gas | 194,932 (46.2%) | 59,568 (22.6%) |
| Bottled, Tank, or LP Gas | 11,277 (2.7%) | 4,971 (1.9%) |
| Electricity | 198,033 (47.0%) | 191,754 (72.9%) |
| Fuel Oil or Kerosene | 12,435 (2.9%) | 3,038 (1.1%) |
| Coal or Coke | 133 (0.0%) | 85 (0.0%) |
| All other Fuels | 3,132 (0.7%) | 1,116 (0.4%) |
| No Fuel Used | 1,755 (0.4%) | 2,575 (1.0%) |
| Total | 421,697 (100.0%) | 263,107 (100.0%) |
Household Vehicle Usage in Area Code 757
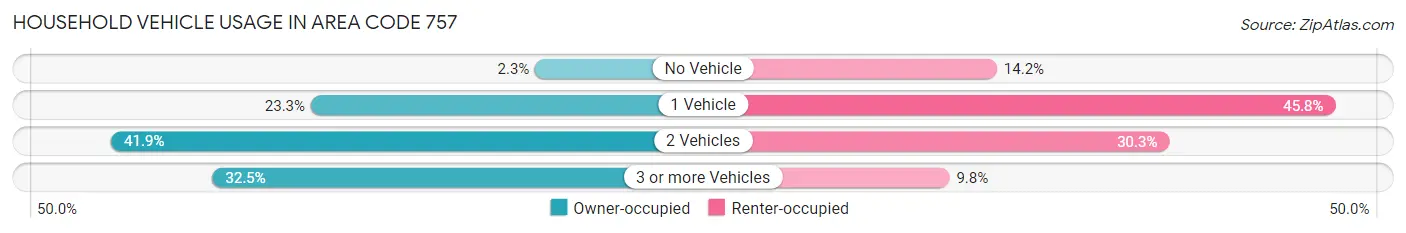
| Vehicles per Household | Owner-occupied | Renter-occupied |
| No Vehicle | 9,853 (2.3%) | 37,335 (14.2%) |
| 1 Vehicle | 98,159 (23.3%) | 120,442 (45.8%) |
| 2 Vehicles | 176,764 (41.9%) | 79,645 (30.3%) |
| 3 or more Vehicles | 136,921 (32.5%) | 25,685 (9.8%) |
| Total | 421,697 (100.0%) | 263,107 (100.0%) |
Real Estate & Mortgages in Area Code 757
Real Estate and Mortgage Overview in Area Code 757
| Characteristic | Without Mortgage | With Mortgage |
| Housing Units | 119,436 | 302,261 |
| Median Property Value | $24,499,600 | $27,190,300 |
| Median Household Income | $6,519,279 | $90,513 |
| Monthly Housing Costs | $58,926 | $37,982 |
| Real Estate Taxes | $214,522 | $12,278 |
Property Value by Mortgage Status in Area Code 757
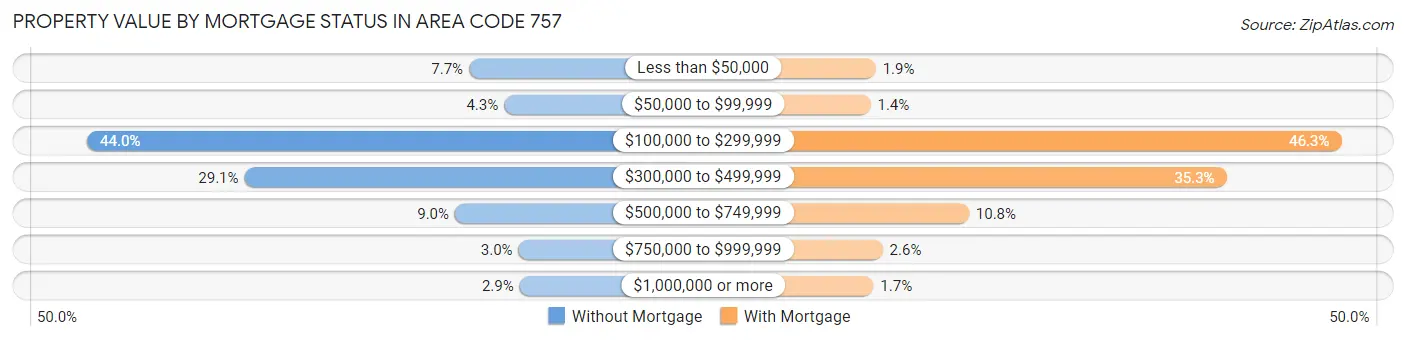
| Property Value | Without Mortgage | With Mortgage |
| Less than $50,000 | 9,172 (7.7%) | 5,807 (1.9%) |
| $50,000 to $99,999 | 5,189 (4.3%) | 4,316 (1.4%) |
| $100,000 to $299,999 | 52,604 (44.0%) | 139,828 (46.3%) |
| $300,000 to $499,999 | 34,725 (29.1%) | 106,773 (35.3%) |
| $500,000 to $749,999 | 10,772 (9.0%) | 32,618 (10.8%) |
| $750,000 to $999,999 | 3,553 (3.0%) | 7,786 (2.6%) |
| $1,000,000 or more | 3,421 (2.9%) | 5,133 (1.7%) |
| Total | 119,436 (100.0%) | 302,261 (100.0%) |
Household Income by Mortgage Status in Area Code 757
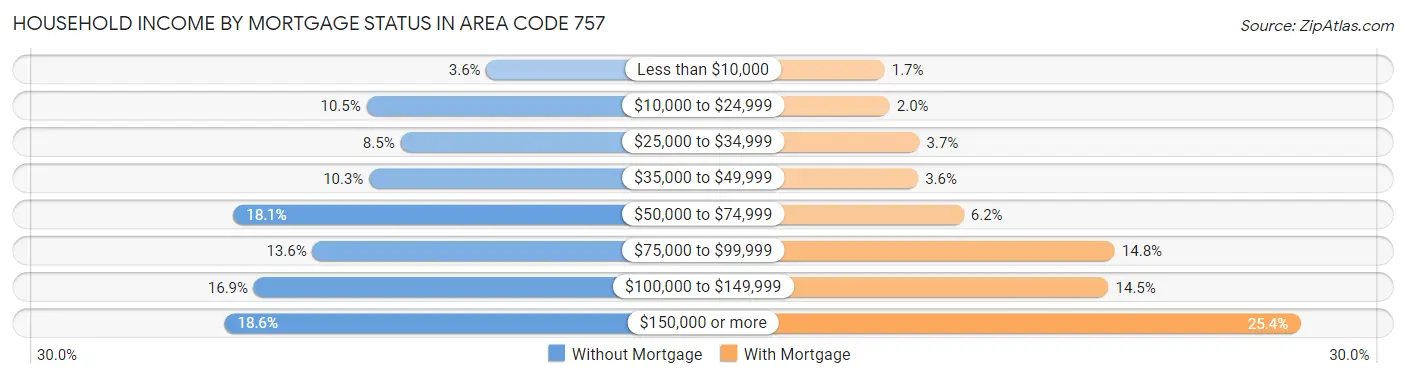
| Household Income | Without Mortgage | With Mortgage |
| Less than $10,000 | 4,314 (3.6%) | 5,060 (1.7%) |
| $10,000 to $24,999 | 12,490 (10.5%) | 5,917 (2.0%) |
| $25,000 to $34,999 | 10,178 (8.5%) | 11,064 (3.7%) |
| $35,000 to $49,999 | 12,319 (10.3%) | 10,810 (3.6%) |
| $50,000 to $74,999 | 21,585 (18.1%) | 18,699 (6.2%) |
| $75,000 to $99,999 | 16,183 (13.6%) | 44,793 (14.8%) |
| $100,000 to $149,999 | 20,182 (16.9%) | 43,695 (14.5%) |
| $150,000 or more | 22,185 (18.6%) | 76,770 (25.4%) |
| Total | 119,436 (100.0%) | 302,261 (100.0%) |
Property Value to Household Income Ratio in Area Code 757
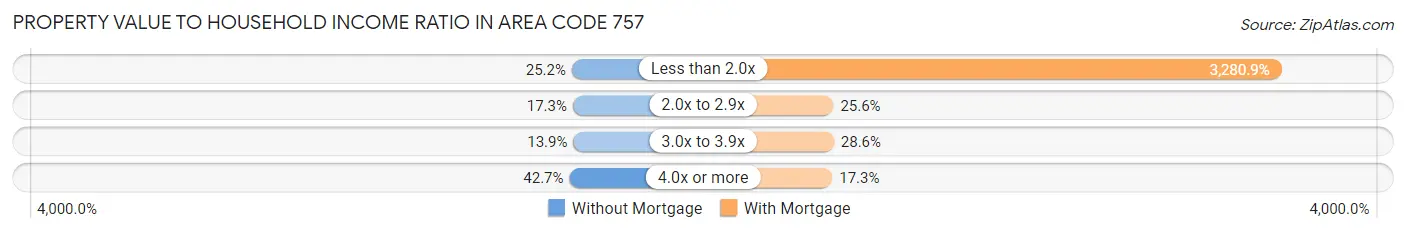
| Value-to-Income Ratio | Without Mortgage | With Mortgage |
| Less than 2.0x | 30,141 (25.2%) | 9,916,796 (3,280.9%) |
| 2.0x to 2.9x | 20,692 (17.3%) | 77,504 (25.6%) |
| 3.0x to 3.9x | 16,537 (13.9%) | 86,337 (28.6%) |
| 4.0x or more | 50,936 (42.6%) | 52,350 (17.3%) |
| Total | 119,436 (100.0%) | 302,261 (100.0%) |
Real Estate Taxes by Mortgage Status in Area Code 757
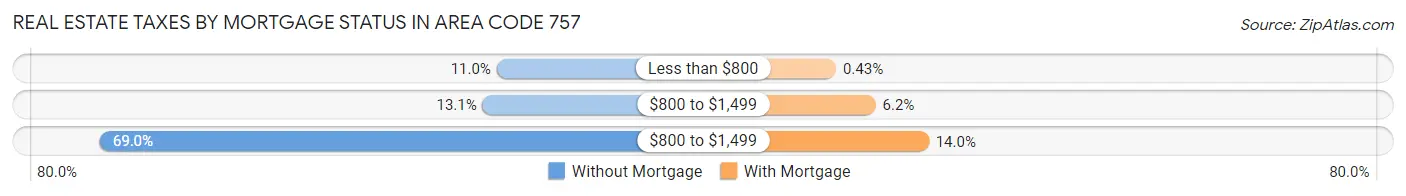
| Property Taxes | Without Mortgage | With Mortgage |
| Less than $800 | 13,156 (11.0%) | 1,296 (0.4%) |
| $800 to $1,499 | 15,617 (13.1%) | 18,791 (6.2%) |
| $800 to $1,499 | 82,413 (69.0%) | 42,244 (14.0%) |
| Total | 119,436 (100.0%) | 302,261 (100.0%) |
Health & Disability in Area Code 757
Health Insurance Coverage by Age in Area Code 757
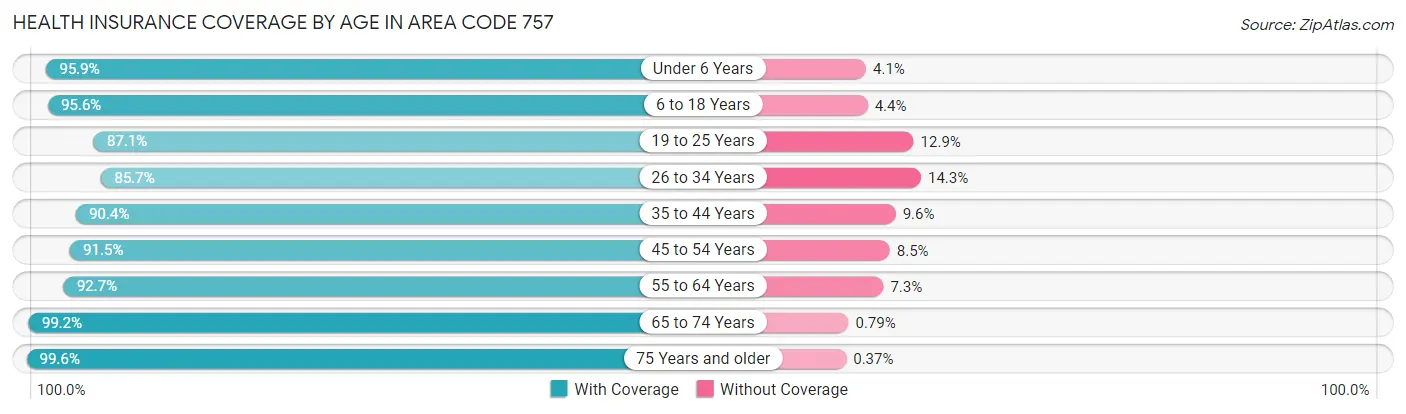
| Age Bracket | With Coverage | Without Coverage |
| Under 6 Years | 122,291 (95.9%) | 5,171 (4.1%) |
| 6 to 18 Years | 268,343 (95.6%) | 12,225 (4.4%) |
| 19 to 25 Years | 128,875 (87.1%) | 19,144 (12.9%) |
| 26 to 34 Years | 177,110 (85.7%) | 29,588 (14.3%) |
| 35 to 44 Years | 186,692 (90.4%) | 19,799 (9.6%) |
| 45 to 54 Years | 177,600 (91.5%) | 16,482 (8.5%) |
| 55 to 64 Years | 205,588 (92.7%) | 16,192 (7.3%) |
| 65 to 74 Years | 157,728 (99.2%) | 1,258 (0.8%) |
| 75 Years and older | 105,422 (99.6%) | 395 (0.4%) |
| Total | 1,529,649 (92.7%) | 120,254 (7.3%) |
Health Insurance Coverage by Citizenship Status in Area Code 757
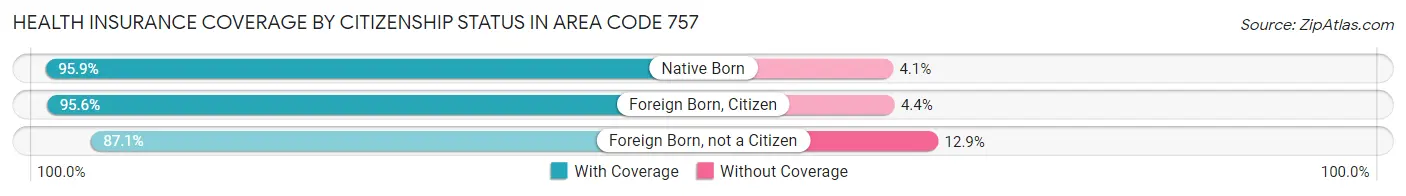
| Citizenship Status | With Coverage | Without Coverage |
| Native Born | 122,291 (95.9%) | 5,171 (4.1%) |
| Foreign Born, Citizen | 268,343 (95.6%) | 12,225 (4.4%) |
| Foreign Born, not a Citizen | 128,875 (87.1%) | 19,144 (12.9%) |
Health Insurance Coverage by Household Income in Area Code 757
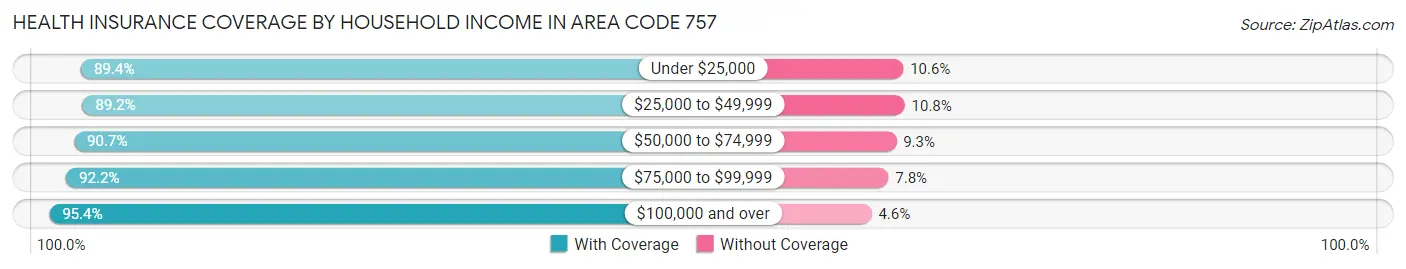
| Household Income | With Coverage | Without Coverage |
| Under $25,000 | 152,006 (89.4%) | 17,963 (10.6%) |
| $25,000 to $49,999 | 207,105 (89.2%) | 25,161 (10.8%) |
| $50,000 to $74,999 | 235,623 (90.7%) | 24,043 (9.3%) |
| $75,000 to $99,999 | 206,390 (92.2%) | 17,444 (7.8%) |
| $100,000 and over | 707,498 (95.4%) | 34,300 (4.6%) |
Public vs Private Health Insurance Coverage by Age in Area Code 757
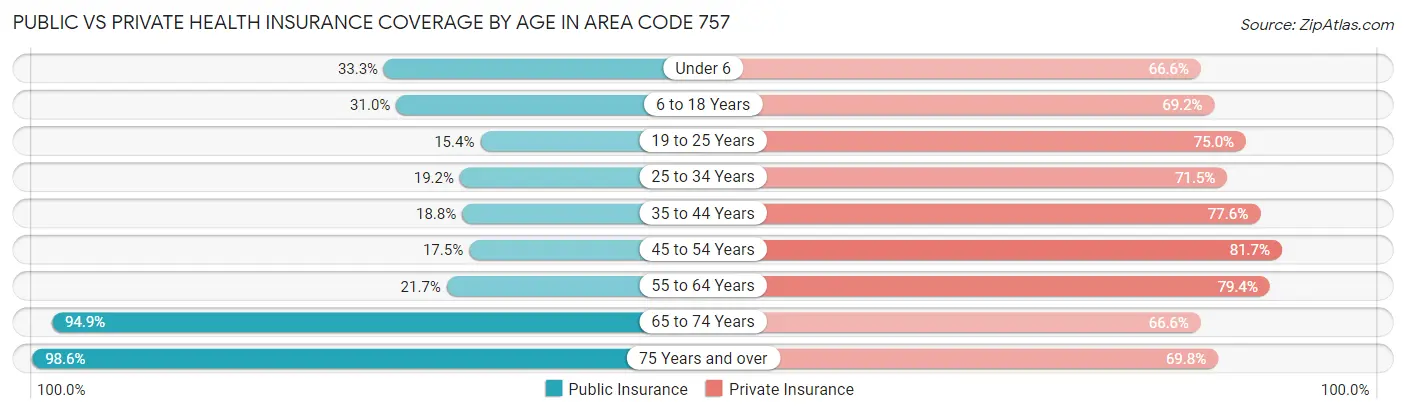
| Age Bracket | Public Insurance | Private Insurance |
| Under 6 | 42,439 (33.3%) | 84,932 (66.6%) |
| 6 to 18 Years | 87,070 (31.0%) | 194,030 (69.2%) |
| 19 to 25 Years | 22,835 (15.4%) | 111,022 (75.0%) |
| 25 to 34 Years | 39,732 (19.2%) | 147,843 (71.5%) |
| 35 to 44 Years | 38,820 (18.8%) | 160,279 (77.6%) |
| 45 to 54 Years | 34,007 (17.5%) | 158,496 (81.7%) |
| 55 to 64 Years | 48,040 (21.7%) | 176,164 (79.4%) |
| 65 to 74 Years | 150,908 (94.9%) | 105,947 (66.6%) |
| 75 Years and over | 104,318 (98.6%) | 73,880 (69.8%) |
| Total | 568,169 (34.4%) | 1,212,593 (73.5%) |
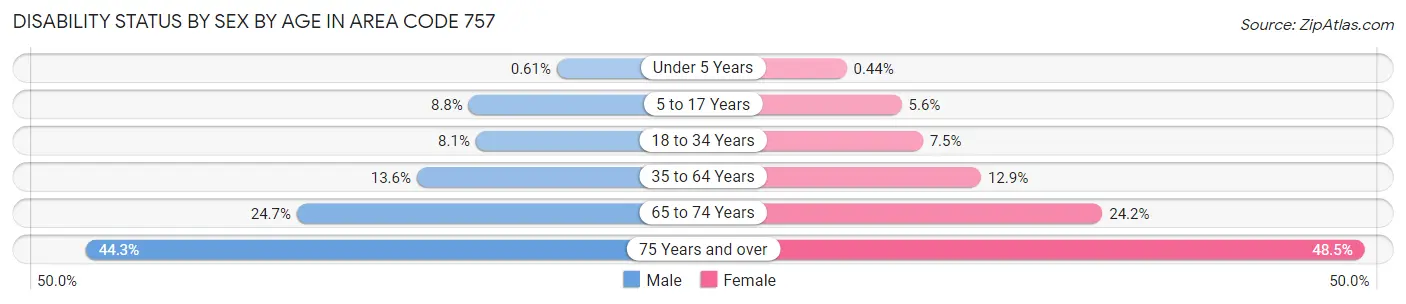
Disability Status by Sex by Age in Area Code 757
| Age Bracket | Male | Female |
| Under 5 Years | 339 (0.6%) | 230 (0.4%) |
| 5 to 17 Years | 12,495 (8.8%) | 7,535 (5.6%) |
| 18 to 34 Years | 14,563 (8.1%) | 14,908 (7.5%) |
| 35 to 64 Years | 39,749 (13.6%) | 42,649 (12.9%) |
| 65 to 74 Years | 17,787 (24.7%) | 21,056 (24.2%) |
| 75 Years and over | 18,825 (44.3%) | 30,720 (48.5%) |
Disability Class by Sex by Age in Area Code 757
Disability Class: Hearing Difficulty
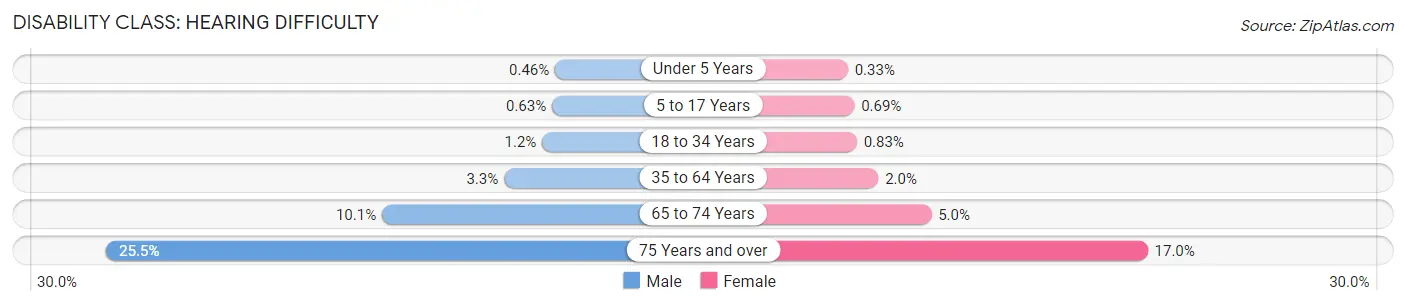
| Age Bracket | Male | Female |
| Under 5 Years | 255 (0.5%) | 173 (0.3%) |
| 5 to 17 Years | 892 (0.6%) | 938 (0.7%) |
| 18 to 34 Years | 2,122 (1.2%) | 1,656 (0.8%) |
| 35 to 64 Years | 9,642 (3.3%) | 6,712 (2.0%) |
| 65 to 74 Years | 7,261 (10.1%) | 4,334 (5.0%) |
| 75 Years and over | 10,819 (25.5%) | 10,785 (17.0%) |
Disability Class: Vision Difficulty
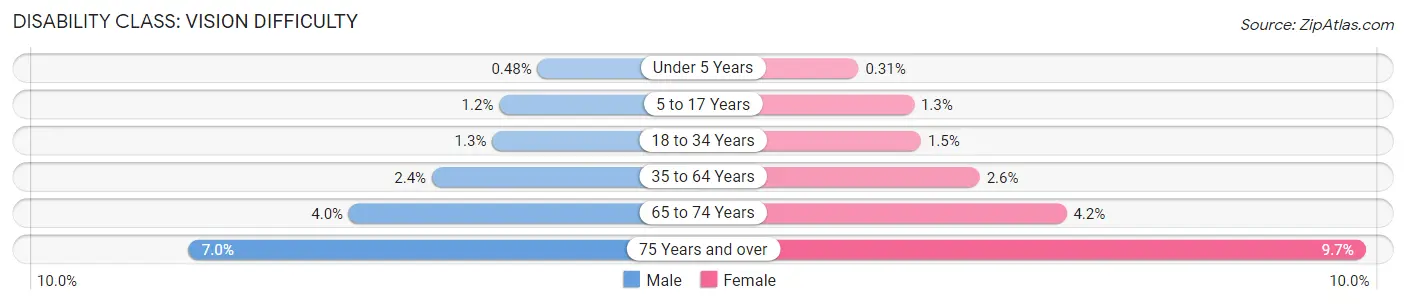
| Age Bracket | Male | Female |
| Under 5 Years | 265 (0.5%) | 160 (0.3%) |
| 5 to 17 Years | 1,694 (1.2%) | 1,820 (1.3%) |
| 18 to 34 Years | 2,365 (1.3%) | 2,925 (1.5%) |
| 35 to 64 Years | 7,145 (2.4%) | 8,451 (2.6%) |
| 65 to 74 Years | 2,865 (4.0%) | 3,634 (4.2%) |
| 75 Years and over | 2,955 (7.0%) | 6,154 (9.7%) |
Disability Class: Cognitive Difficulty
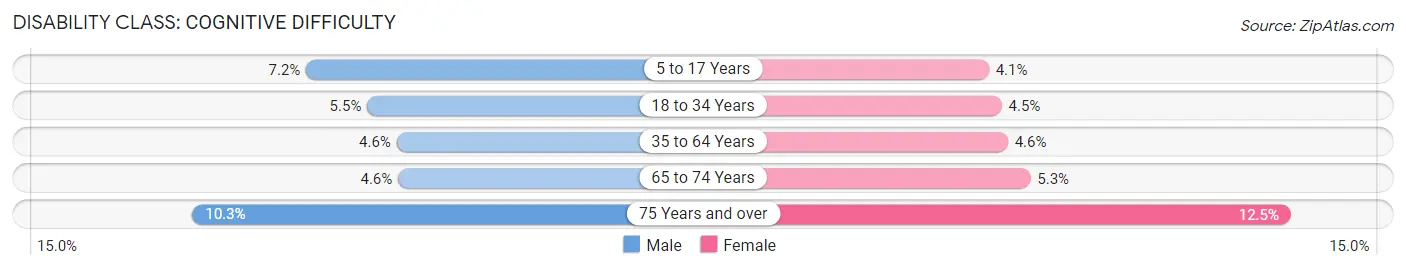
| Age Bracket | Male | Female |
| 5 to 17 Years | 10,185 (7.2%) | 5,550 (4.1%) |
| 18 to 34 Years | 9,771 (5.5%) | 8,838 (4.4%) |
| 35 to 64 Years | 13,562 (4.6%) | 15,258 (4.6%) |
| 65 to 74 Years | 3,311 (4.6%) | 4,569 (5.2%) |
| 75 Years and over | 4,389 (10.3%) | 7,919 (12.5%) |
Disability Class: Ambulatory Difficulty
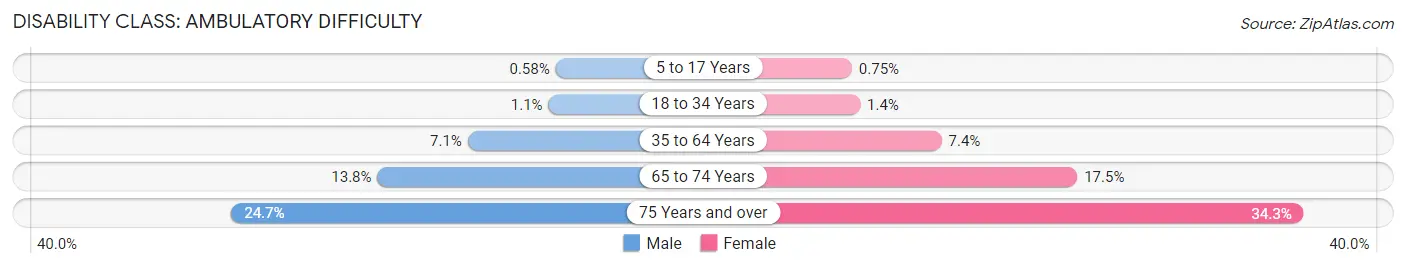
| Age Bracket | Male | Female |
| 5 to 17 Years | 827 (0.6%) | 1,013 (0.7%) |
| 18 to 34 Years | 1,990 (1.1%) | 2,696 (1.4%) |
| 35 to 64 Years | 20,747 (7.1%) | 24,456 (7.4%) |
| 65 to 74 Years | 9,931 (13.8%) | 15,223 (17.5%) |
| 75 Years and over | 10,473 (24.6%) | 21,716 (34.3%) |
Disability Class: Self-Care Difficulty
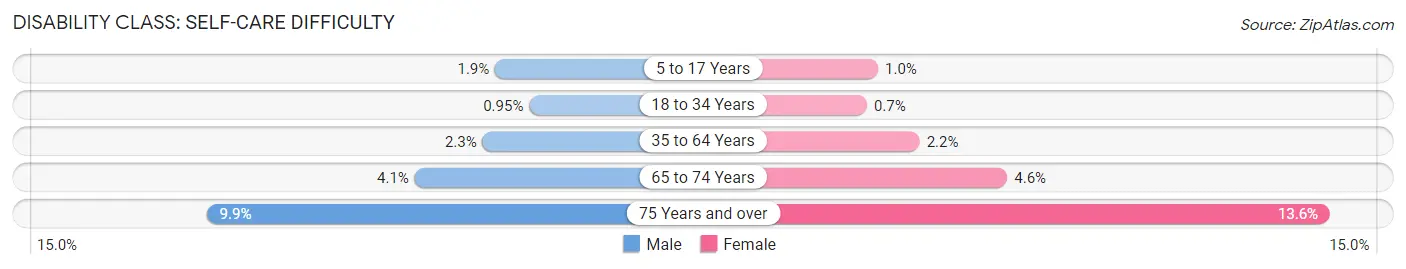
| Age Bracket | Male | Female |
| 5 to 17 Years | 2,704 (1.9%) | 1,369 (1.0%) |
| 18 to 34 Years | 1,701 (0.9%) | 1,396 (0.7%) |
| 35 to 64 Years | 6,577 (2.2%) | 7,178 (2.2%) |
| 65 to 74 Years | 2,978 (4.1%) | 4,017 (4.6%) |
| 75 Years and over | 4,218 (9.9%) | 8,605 (13.6%) |
Technology Access in Area Code 757
Computing Device Access in Area Code 757
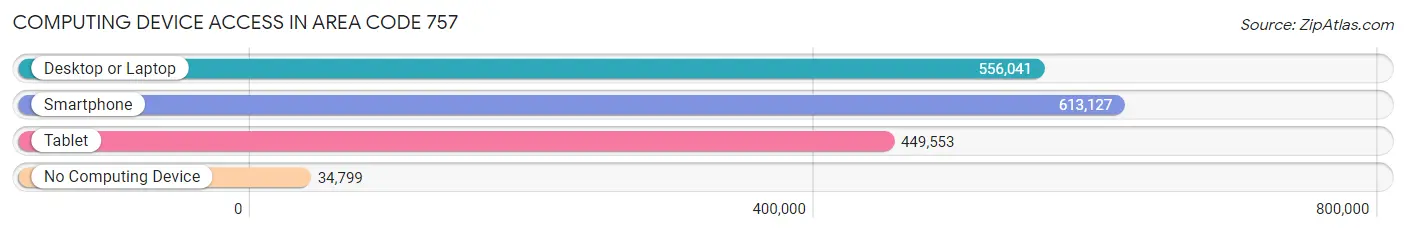
| Device Type | # Households | % Households |
| Desktop or Laptop | 556,041 | 81.2% |
| Smartphone | 613,127 | 89.5% |
| Tablet | 449,553 | 65.6% |
| No Computing Device | 34,799 | 5.1% |
| Total | 684,804 | 100.0% |
Internet Access in Area Code 757
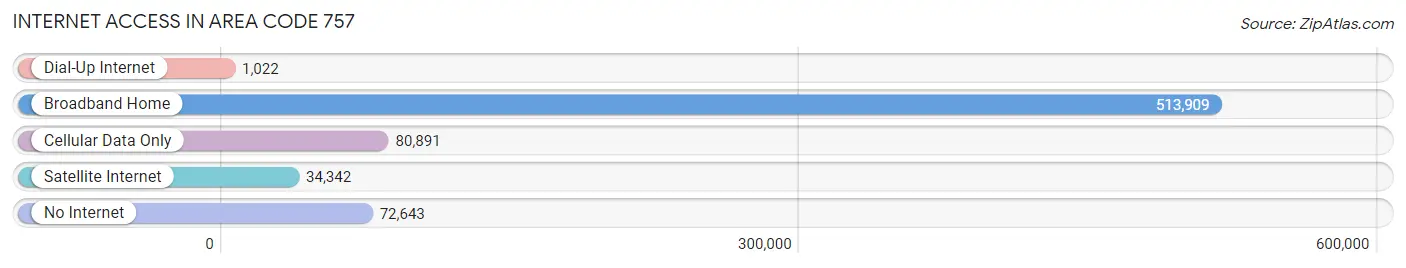
| Internet Type | # Households | % Households |
| Dial-Up Internet | 1,022 | 0.2% |
| Broadband Home | 513,909 | 75.0% |
| Cellular Data Only | 80,891 | 11.8% |
| Satellite Internet | 34,342 | 5.0% |
| No Internet | 72,643 | 10.6% |
| Total | 684,804 | 100.0% |
Area Code 757 Summary
Geography
Area code 757 is located in the southeastern region of Virginia. It covers the Hampton Roads metropolitan area, which includes the cities of Norfolk, Virginia Beach, Chesapeake, Portsmouth, Newport News, Hampton, and Williamsburg.
Social
Area code 757 is home to a diverse population of people from all walks of life. The area is known for its vibrant music and art scene, as well as its many festivals and events. The area is also home to a number of universities and colleges, making it a great place for students to live and learn.
Economics
Area code 757 is a major economic hub in the region. It is home to a number of large corporations, including Norfolk Southern, Dollar Tree, and Sentara Healthcare. The area is also home to a number of military bases, which provide a significant economic boost to the region.
Demographics
Area code 757 is home to a population of over 1.7 million people. The population is diverse, with a mix of African American, White, Hispanic, and Asian residents. The median household income in the area is $60,000, and the unemployment rate is 4.2%.
Common Questions
What is Per Capita Income in Area Code 757?
Per Capita income in Area Code 757 is $37,741.
What is the Median Family Income in Area Code 757?
Median Family Income in Area Code 757 is $90,969.
What is the Median Household income in Area Code 757?
Median Household Income in Area Code 757 is $73,553.
What is Income or Wage Gap in Area Code 757?
Income or Wage Gap in Area Code 757 is 30.5%.
Women in Area Code 757 earn 69.5 cents for every dollar earned by a man.
What is Family Income Deficit in Area Code 757?
Family Income Deficit in Area Code 757 is $11,539.
Families that are below poverty line in Area Code 757 earn $11,539 less on average than the poverty threshold level.
What is Inequality or Gini Index in Area Code 757?
Inequality or Gini Index in Area Code 757 is 47.95.
What is the Total Population of Area Code 757?
Total Population of Area Code 757 is 1,748,954.
What is the Total Male Population of Area Code 757?
Total Male Population of Area Code 757 is 861,078.
What is the Total Female Population of Area Code 757?
Total Female Population of Area Code 757 is 887,876.
What is the Ratio of Males per 100 Females in Area Code 757?
There are 96.98 Males per 100 Females in Area Code 757.
What is the Ratio of Females per 100 Males in Area Code 757?
There are 103.11 Females per 100 Males in Area Code 757.
What is the Median Population Age in Area Code 757?
Median Population Age in Area Code 757 is 41.0 Years.
What is the Average Family Size in Area Code 757
Average Family Size in Area Code 757 is 3.0 People.
What is the Average Household Size in Area Code 757
Average Household Size in Area Code 757 is 2.4 People.
How Large is the Labor Force in Area Code 757?
There are 909,172 People in the Labor Forcein in Area Code 757.
What is the Percentage of People in the Labor Force in Area Code 757?
64.7% of People are in the Labor Force in Area Code 757.
What is the Unemployment Rate in Area Code 757?
Unemployment Rate in Area Code 757 is 7.1%.