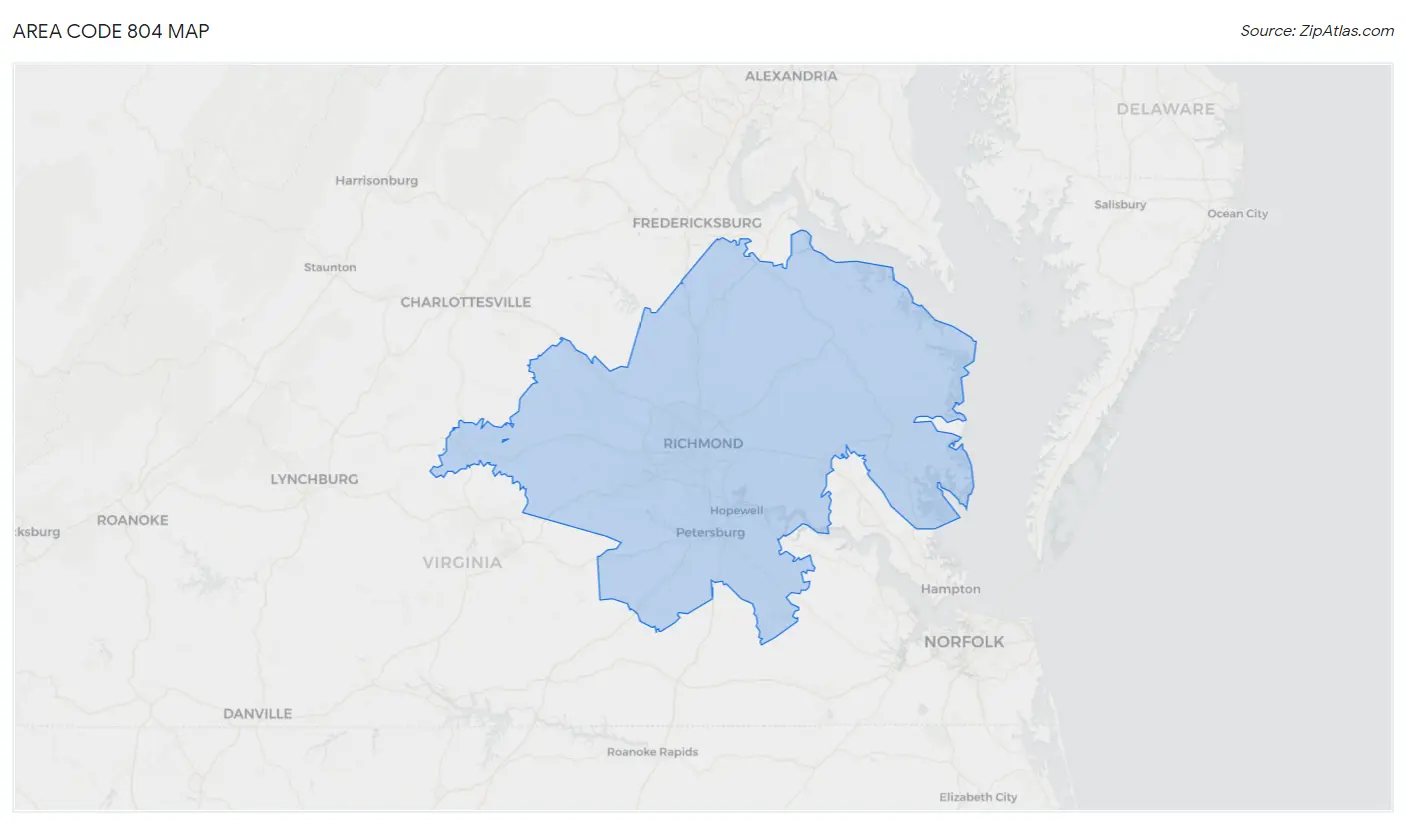
Area Code 804 Map & Demographics
Area Code 804 Map
Area Code 804 Overview
$40,848
PER CAPITA INCOME
$99,123
AVG FAMILY INCOME
$80,995
AVG HOUSEHOLD INCOME
27.9%
WAGE / INCOME GAP [ % ]
72.1¢/ $1
WAGE / INCOME GAP [ $ ]
$9,351
FAMILY INCOME DEFICIT
58.52
INEQUALITY / GINI INDEX
1,448,414
TOTAL POPULATION
707,461
MALE POPULATION
740,953
FEMALE POPULATION
95.48
MALES / 100 FEMALES
104.73
FEMALES / 100 MALES
46.3
MEDIAN AGE
3.0
AVG FAMILY SIZE
2.4
AVG HOUSEHOLD SIZE
691,023
LABOR FORCE [ PEOPLE ]
58.6%
PERCENT IN LABOR FORCE
6.5%
UNEMPLOYMENT RATE
Income in Area Code 804
Income Overview in Area Code 804
Per Capita Income in Area Code 804 is $40,848, while median incomes of families and households are $99,123 and $80,995 respectively.
| Characteristic | Number | Measure |
| Per Capita Income | 1,448,414 | $40,848 |
| Median Family Income | 360,789 | $99,123 |
| Mean Family Income | 360,789 | $16,582,331 |
| Median Household Income | 568,966 | $80,995 |
| Mean Household Income | 568,966 | $14,398,081 |
| Income Deficit | 360,789 | $9,351 |
| Wage / Income Gap (%) | 1,448,414 | 27.89% |
| Wage / Income Gap ($) | 1,448,414 | 72.10¢ per $1 |
| Gini / Inequality Index | 1,448,414 | 58.52 |
Earnings by Sex in Area Code 804
Average Earnings in Area Code 804 are $43,925, $51,906 for men and $38,432 for women, a difference of 26.0%.
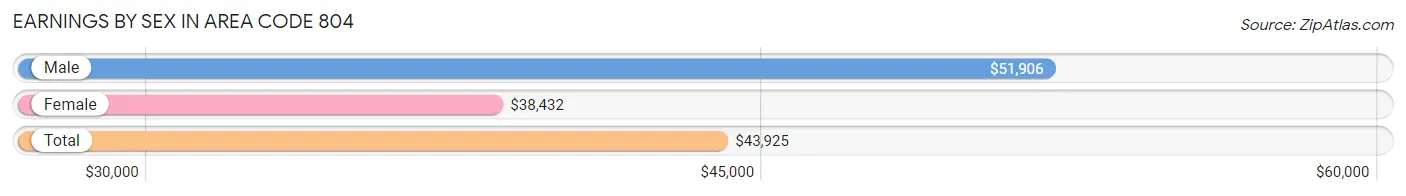
| Sex | Number | Average Earnings |
| Male | 412,031 (51.3%) | $51,906 |
| Female | 391,705 (48.7%) | $38,432 |
| Total | 803,736 (100.0%) | $43,925 |
Earnings by Sex by Income Bracket in Area Code 804
The most common earnings brackets in Area Code 804 are $100,000+ for men (85,351 | 20.7%) and $100,000+ for women (42,191 | 10.8%).
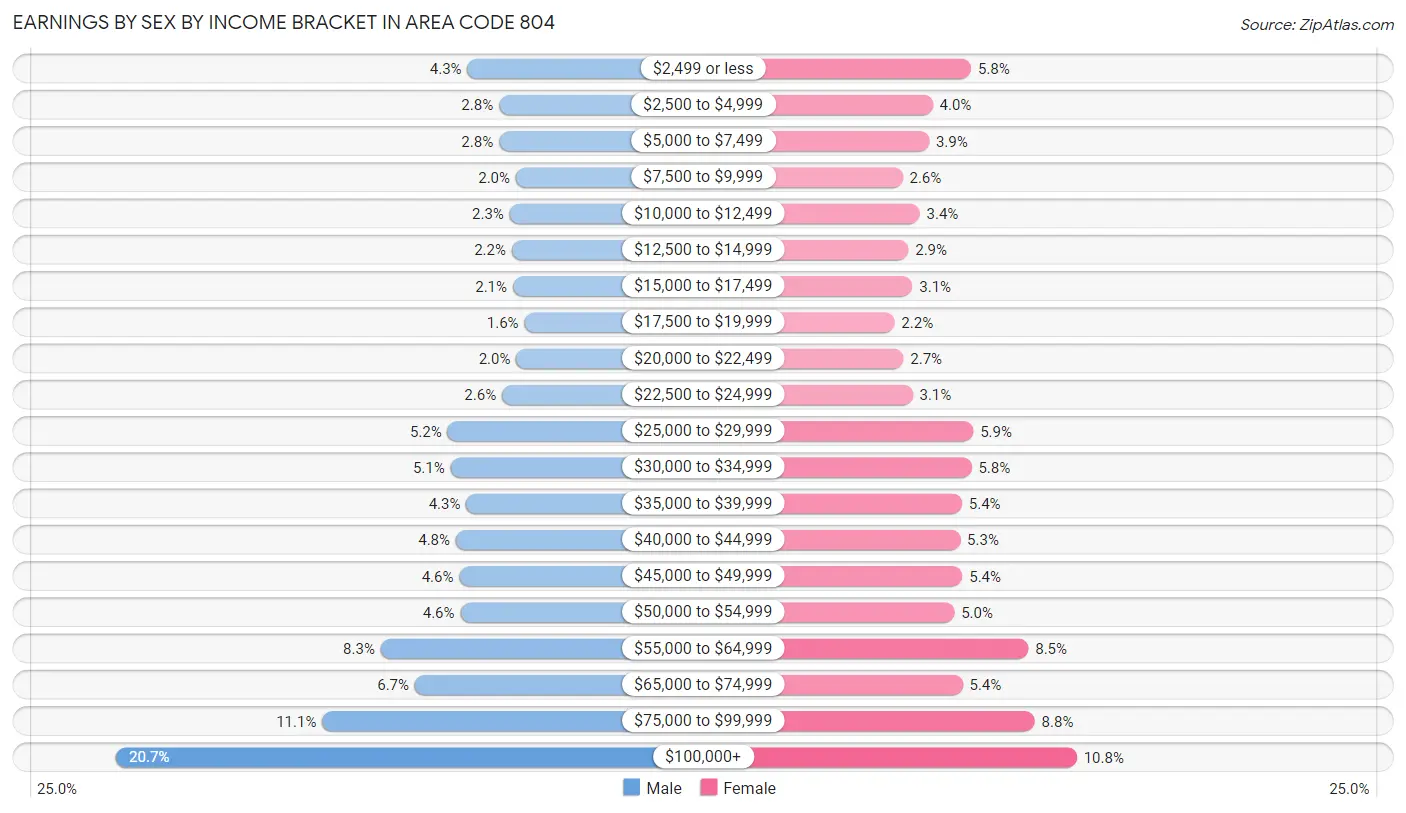
| Income | Male | Female |
| $2,499 or less | 17,538 (4.3%) | 22,781 (5.8%) |
| $2,500 to $4,999 | 11,451 (2.8%) | 15,746 (4.0%) |
| $5,000 to $7,499 | 11,472 (2.8%) | 15,074 (3.8%) |
| $7,500 to $9,999 | 8,208 (2.0%) | 10,240 (2.6%) |
| $10,000 to $12,499 | 9,408 (2.3%) | 13,355 (3.4%) |
| $12,500 to $14,999 | 8,965 (2.2%) | 11,293 (2.9%) |
| $15,000 to $17,499 | 8,766 (2.1%) | 12,008 (3.1%) |
| $17,500 to $19,999 | 6,541 (1.6%) | 8,719 (2.2%) |
| $20,000 to $22,499 | 8,126 (2.0%) | 10,387 (2.6%) |
| $22,500 to $24,999 | 10,893 (2.6%) | 12,055 (3.1%) |
| $25,000 to $29,999 | 21,401 (5.2%) | 23,176 (5.9%) |
| $30,000 to $34,999 | 20,827 (5.1%) | 22,864 (5.8%) |
| $35,000 to $39,999 | 17,761 (4.3%) | 21,128 (5.4%) |
| $40,000 to $44,999 | 19,766 (4.8%) | 20,784 (5.3%) |
| $45,000 to $49,999 | 19,135 (4.6%) | 21,206 (5.4%) |
| $50,000 to $54,999 | 18,904 (4.6%) | 19,700 (5.0%) |
| $55,000 to $64,999 | 34,262 (8.3%) | 33,289 (8.5%) |
| $65,000 to $74,999 | 27,669 (6.7%) | 21,236 (5.4%) |
| $75,000 to $99,999 | 45,587 (11.1%) | 34,473 (8.8%) |
| $100,000+ | 85,351 (20.7%) | 42,191 (10.8%) |
| Total | 412,031 (100.0%) | 391,705 (100.0%) |
Earnings by Sex by Educational Attainment in Area Code 804
Average earnings in Area Code 804 are $7,541,865 for men and $5,158,169 for women, a difference of 31.6%. Men with an educational attainment of graduate degree enjoy the highest average annual earnings of $8,006,052, while those with less than high school education earn the least with $2,488,184. Women with an educational attainment of graduate degree earn the most with the average annual earnings of $5,567,841, while those with less than high school education have the smallest earnings of $947,549.
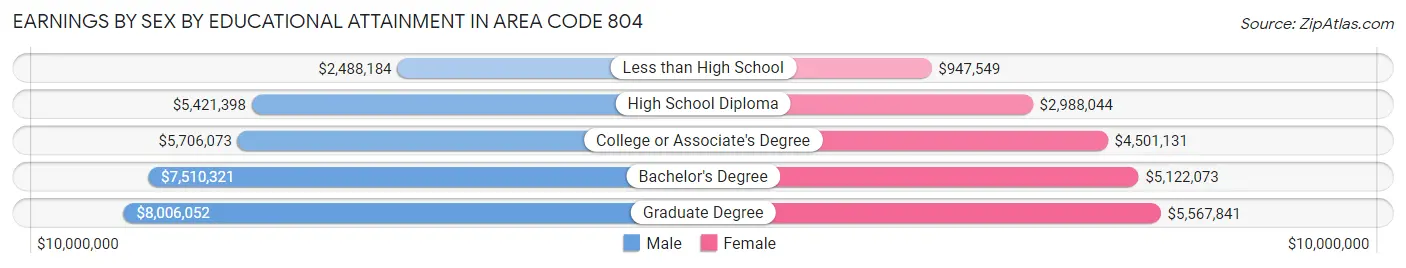
| Educational Attainment | Male Income | Female Income |
| Less than High School | $2,488,184 | $947,549 |
| High School Diploma | $5,421,398 | $2,988,044 |
| College or Associate's Degree | $5,706,073 | $4,501,131 |
| Bachelor's Degree | $7,510,321 | $5,122,073 |
| Graduate Degree | $8,006,052 | $5,567,841 |
| Total | $7,541,865 | $5,158,169 |
Family Income in Area Code 804
Family Income Brackets in Area Code 804
According to the Area Code 804 family income data, there are 11,104,003 families falling into the $100,000 to $149,999 income range, which is the most common income bracket and makes up 3,077.7% of all families. Conversely, the $10,000 to $14,999 income bracket is the least frequent group with only 710,394 families (196.9%) belonging to this category.
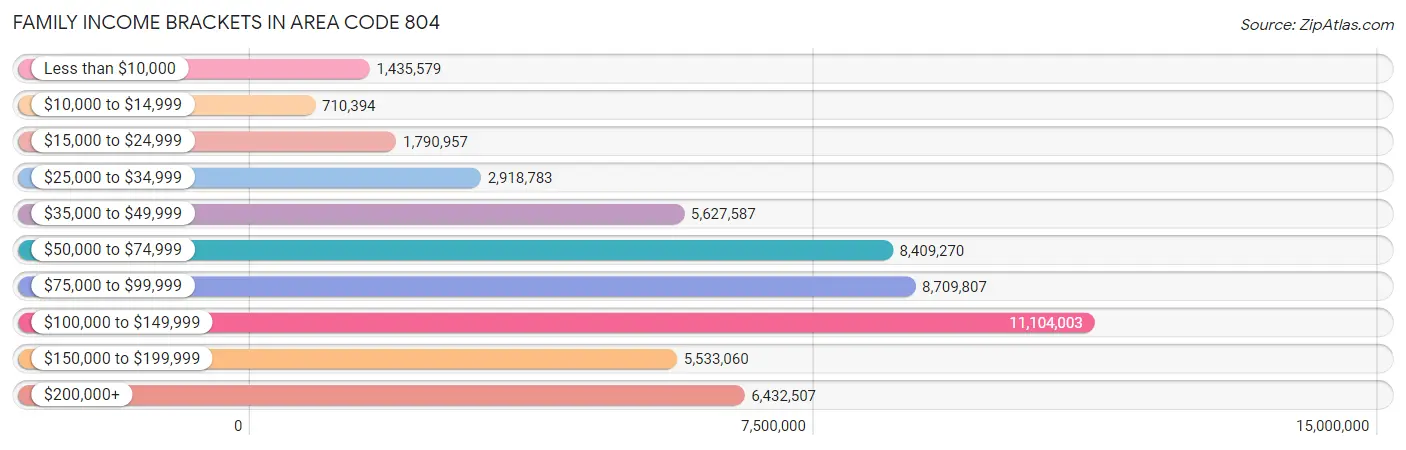
| Income Bracket | # Families | % Families |
| Less than $10,000 | 1,435,579 | 397.9% |
| $10,000 to $14,999 | 710,394 | 196.9% |
| $15,000 to $24,999 | 1,790,957 | 496.4% |
| $25,000 to $34,999 | 2,918,783 | 809.0% |
| $35,000 to $49,999 | 5,627,587 | 1,559.8% |
| $50,000 to $74,999 | 8,409,270 | 2,330.8% |
| $75,000 to $99,999 | 8,709,807 | 2,414.1% |
| $100,000 to $149,999 | 11,104,003 | 3,077.7% |
| $150,000 to $199,999 | 5,533,060 | 1,533.6% |
| $200,000+ | 6,432,507 | 1,782.9% |
Family Income by Famaliy Size in Area Code 804
7+ person families (4,176 | 1.2%) account for the highest median family income in Area Code 804 with $129,208 per family, while 2-person families (177,371 | 49.2%) have the highest median income of $44,821 per family member.
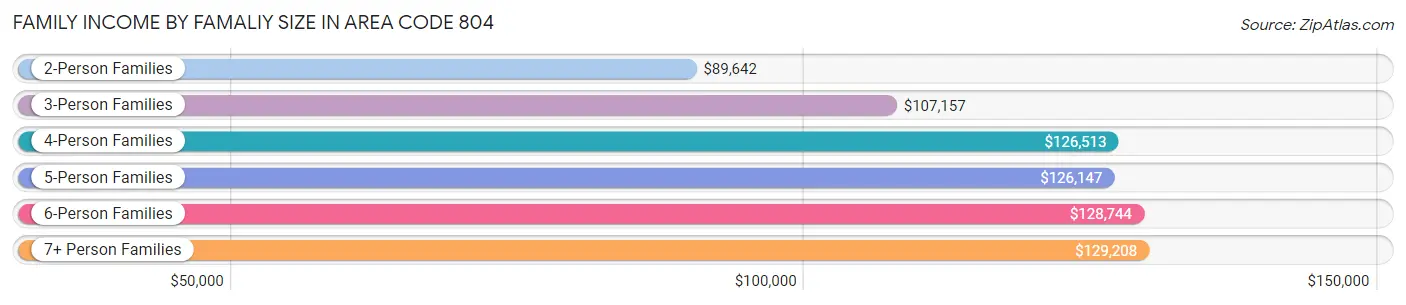
| Income Bracket | # Families | Median Income |
| 2-Person Families | 177,371 (49.2%) | $89,642 |
| 3-Person Families | 81,739 (22.7%) | $107,157 |
| 4-Person Families | 62,067 (17.2%) | $126,513 |
| 5-Person Families | 26,720 (7.4%) | $126,147 |
| 6-Person Families | 8,716 (2.4%) | $128,744 |
| 7+ Person Families | 4,176 (1.2%) | $129,208 |
| Total | 360,789 (100.0%) | $99,123 |
Family Income by Number of Earners in Area Code 804
The median family income in Area Code 804 is $99,123, with families comprising 3+ earners (40,958) having the highest median family income of $154,186, while families with no earners (49,536) have the lowest median family income of $63,586, accounting for 11.4% and 13.7% of families, respectively.
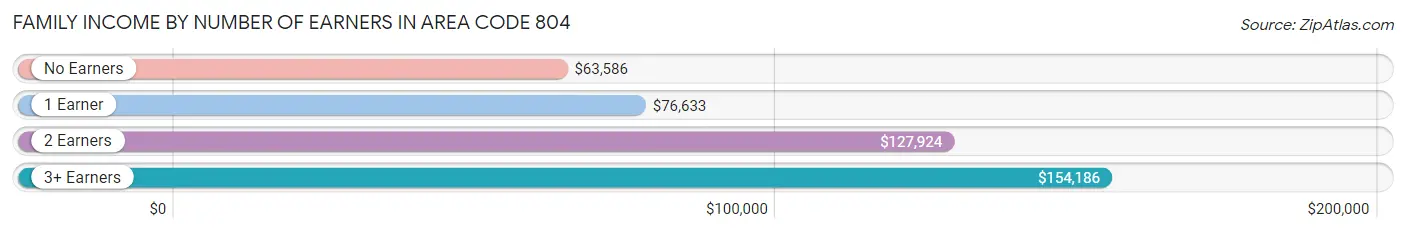
| Number of Earners | # Families | Median Income |
| No Earners | 49,536 (13.7%) | $63,586 |
| 1 Earner | 111,589 (30.9%) | $76,633 |
| 2 Earners | 158,706 (44.0%) | $127,924 |
| 3+ Earners | 40,958 (11.4%) | $154,186 |
| Total | 360,789 (100.0%) | $99,123 |
Household Income in Area Code 804
Household Income Brackets in Area Code 804
With 15,226,099 households falling in the category, the $100,000 to $149,999 income range is the most frequent in Area Code 804, accounting for 2,676.1% of all households. In contrast, only 2,669,020 households (469.1%) fall into the $10,000 to $14,999 income bracket, making it the least populous group.
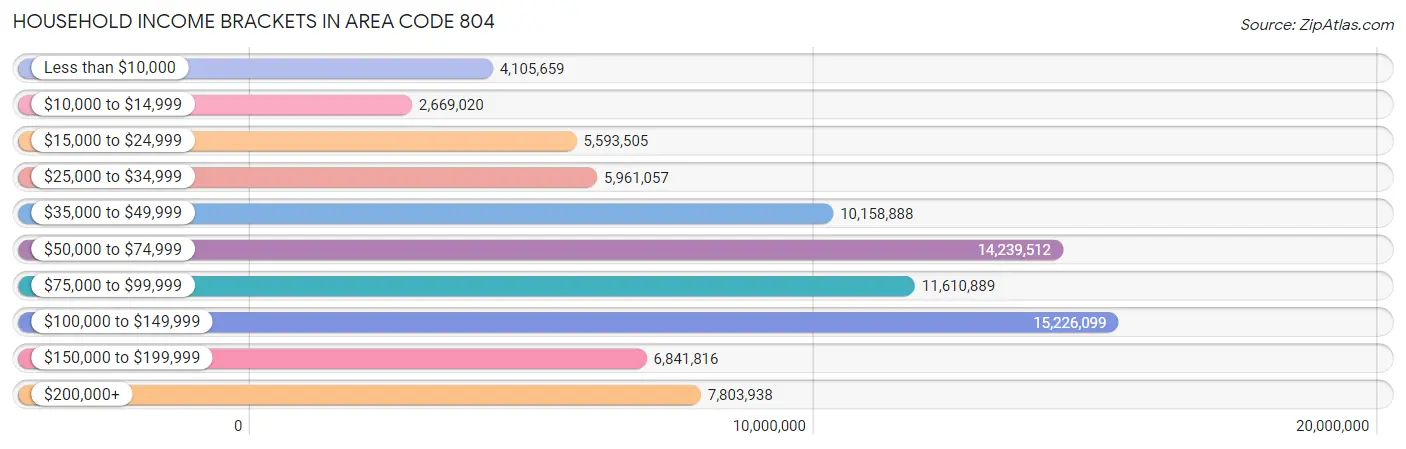
| Income Bracket | # Households | % Households |
| Less than $10,000 | 4,105,659 | 721.6% |
| $10,000 to $14,999 | 2,669,020 | 469.1% |
| $15,000 to $24,999 | 5,593,505 | 983.1% |
| $25,000 to $34,999 | 5,961,057 | 1,047.7% |
| $35,000 to $49,999 | 10,158,888 | 1,785.5% |
| $50,000 to $74,999 | 14,239,512 | 2,502.7% |
| $75,000 to $99,999 | 11,610,889 | 2,040.7% |
| $100,000 to $149,999 | 15,226,099 | 2,676.1% |
| $150,000 to $199,999 | 6,841,816 | 1,202.5% |
| $200,000+ | 7,803,938 | 1,371.6% |
Household Income by Householder Age in Area Code 804
The median household income in Area Code 804 is $80,995, with the highest median household income of $100,090 found in the 45 to 64 years age bracket for the primary householder. A total of 212,216 households (37.3%) fall into this category. Meanwhile, the 15 to 24 years age bracket for the primary householder has the lowest median household income of $48,022, with 16,080 households (2.8%) in this group.
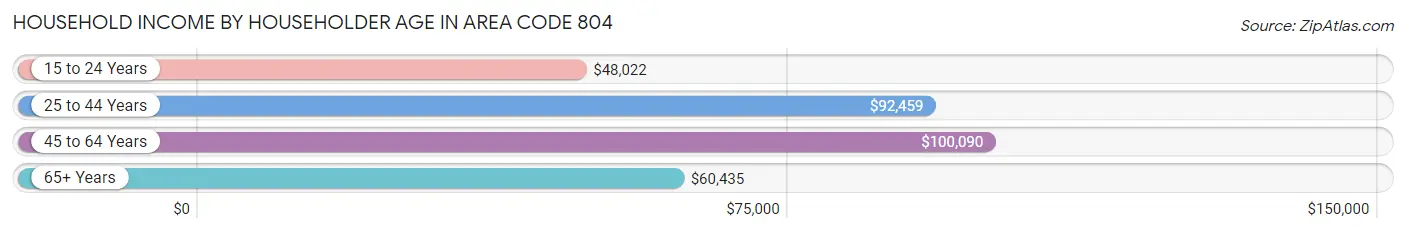
| Income Bracket | # Households | Median Income |
| 15 to 24 Years | 16,080 (2.8%) | $48,022 |
| 25 to 44 Years | 184,071 (32.4%) | $92,459 |
| 45 to 64 Years | 212,216 (37.3%) | $100,090 |
| 65+ Years | 156,599 (27.5%) | $60,435 |
| Total | 568,966 (100.0%) | $80,995 |
Poverty in Area Code 804
Income Below Poverty by Sex and Age in Area Code 804
With 9.2% poverty level for males and 11.2% for females among the residents of Area Code 804, 16 and 17 year old males and 18 to 24 year old females are the most vulnerable to poverty, with 2,884 males (16.3%) and 10,441 females (18.2%) in their respective age groups living below the poverty level.
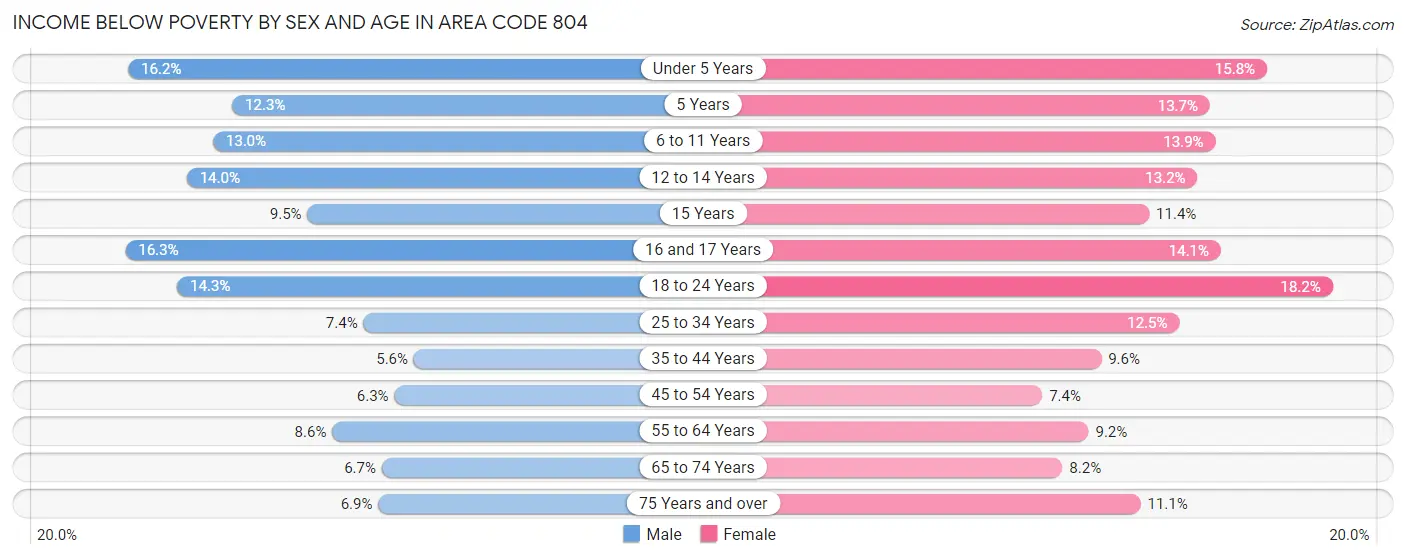
| Age Bracket | Male | Female |
| Under 5 Years | 6,534 (16.2%) | 5,935 (15.8%) |
| 5 Years | 1,010 (12.3%) | 1,022 (13.7%) |
| 6 to 11 Years | 6,612 (13.0%) | 6,450 (13.9%) |
| 12 to 14 Years | 3,844 (14.0%) | 3,514 (13.2%) |
| 15 Years | 867 (9.5%) | 1,100 (11.4%) |
| 16 and 17 Years | 2,884 (16.3%) | 2,277 (14.1%) |
| 18 to 24 Years | 8,347 (14.3%) | 10,441 (18.2%) |
| 25 to 34 Years | 7,092 (7.4%) | 12,695 (12.5%) |
| 35 to 44 Years | 4,945 (5.6%) | 8,992 (9.6%) |
| 45 to 54 Years | 5,504 (6.3%) | 6,932 (7.4%) |
| 55 to 64 Years | 7,869 (8.6%) | 9,369 (9.2%) |
| 65 to 74 Years | 4,539 (6.7%) | 6,496 (8.2%) |
| 75 Years and over | 2,663 (6.9%) | 6,196 (11.1%) |
| Total | 62,710 (9.2%) | 81,419 (11.2%) |
Income Above Poverty by Sex and Age in Area Code 804
According to the poverty statistics in Area Code 804, males aged 35 to 44 years and females aged 45 to 54 years are the age groups that are most secure financially, with 94.5% of males and 92.6% of females in these age groups living above the poverty line.
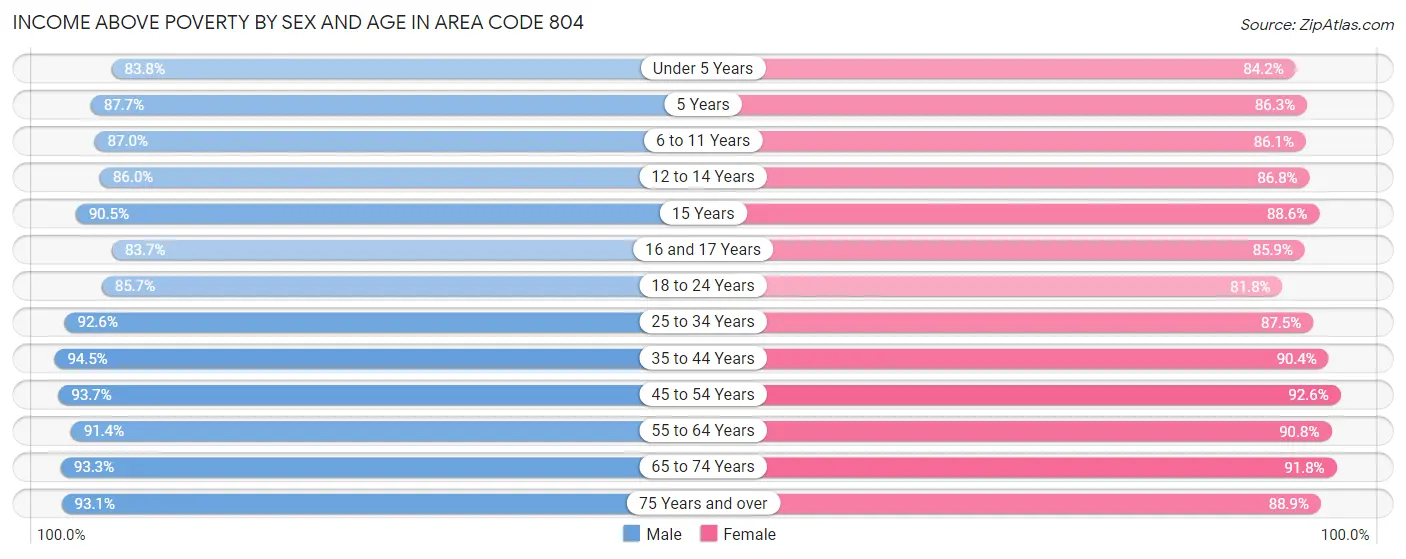
| Age Bracket | Male | Female |
| Under 5 Years | 33,908 (83.8%) | 31,670 (84.2%) |
| 5 Years | 7,201 (87.7%) | 6,461 (86.3%) |
| 6 to 11 Years | 44,227 (87.0%) | 40,059 (86.1%) |
| 12 to 14 Years | 23,647 (86.0%) | 23,101 (86.8%) |
| 15 Years | 8,260 (90.5%) | 8,543 (88.6%) |
| 16 and 17 Years | 14,855 (83.7%) | 13,903 (85.9%) |
| 18 to 24 Years | 49,876 (85.7%) | 46,876 (81.8%) |
| 25 to 34 Years | 88,427 (92.6%) | 88,616 (87.5%) |
| 35 to 44 Years | 84,216 (94.5%) | 84,405 (90.4%) |
| 45 to 54 Years | 82,213 (93.7%) | 86,178 (92.6%) |
| 55 to 64 Years | 83,819 (91.4%) | 92,883 (90.8%) |
| 65 to 74 Years | 62,845 (93.3%) | 72,796 (91.8%) |
| 75 Years and over | 36,080 (93.1%) | 49,669 (88.9%) |
| Total | 619,574 (90.8%) | 645,160 (88.8%) |
Income Below Poverty Among Married-Couple Families in Area Code 804
The poverty statistics for married-couple families in Area Code 804 show that 2.9% or 7,543 of the total 263,846 families live below the poverty line. Families with 5 or more children have the highest poverty rate of 23.5%, comprising of 285 families. On the other hand, families with no children have the lowest poverty rate of 2.4%, which includes 3,835 families.
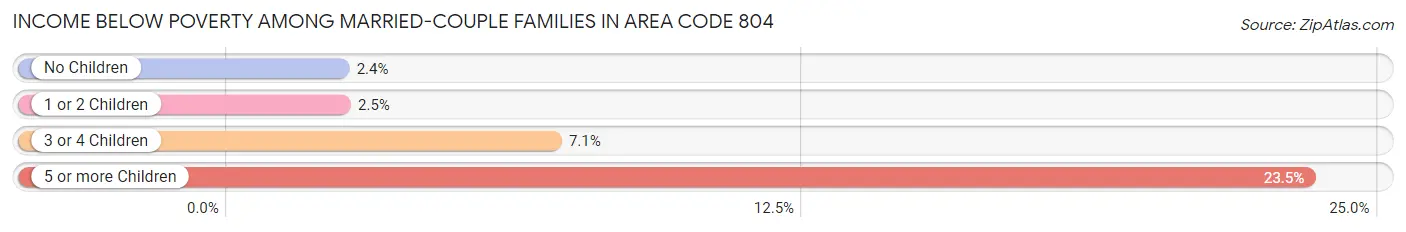
| Children | Above Poverty | Below Poverty |
| No Children | 153,821 (97.6%) | 3,835 (2.4%) |
| 1 or 2 Children | 84,586 (97.5%) | 2,137 (2.5%) |
| 3 or 4 Children | 16,966 (92.9%) | 1,286 (7.0%) |
| 5 or more Children | 930 (76.5%) | 285 (23.5%) |
| Total | 256,303 (97.1%) | 7,543 (2.9%) |
Income Below Poverty Among Single-Parent Households in Area Code 804
According to the poverty data in Area Code 804, 10.2% or 2,499 single-father households and 19.4% or 14,030 single-mother households are living below the poverty line. Among single-father households, those with 3 or 4 children have the highest poverty rate, with 427 households (25.3%) experiencing poverty. Likewise, among single-mother households, those with 5 or more children have the highest poverty rate, with 409 households (73.8%) falling below the poverty line.
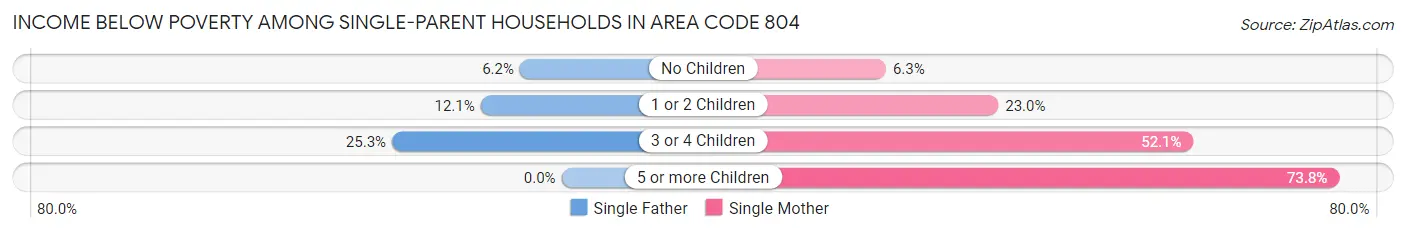
| Children | Single Father | Single Mother |
| No Children | 731 (6.2%) | 1,839 (6.3%) |
| 1 or 2 Children | 1,341 (12.1%) | 8,252 (23.0%) |
| 3 or 4 Children | 427 (25.3%) | 3,530 (52.1%) |
| 5 or more Children | 0 (0.0%) | 409 (73.8%) |
| Total | 2,499 (10.2%) | 14,030 (19.4%) |
Income Below Poverty Among Married-Couple vs Single-Parent Households in Area Code 804
The poverty data for Area Code 804 shows that 7,543 of the married-couple family households (2.9%) and 16,529 of the single-parent households (17.1%) are living below the poverty level. Within the married-couple family households, those with 5 or more children have the highest poverty rate, with 285 households (23.5%) falling below the poverty line. Among the single-parent households, those with 5 or more children have the highest poverty rate, with 409 household (70.8%) living below poverty.
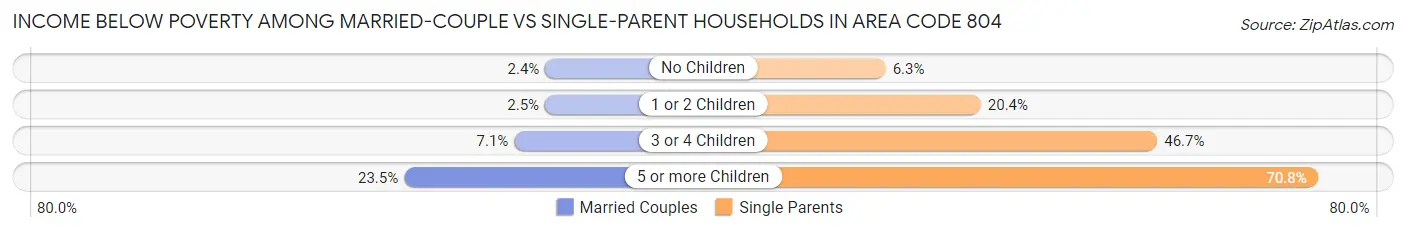
| Children | Married-Couple Families | Single-Parent Households |
| No Children | 3,835 (2.4%) | 2,570 (6.3%) |
| 1 or 2 Children | 2,137 (2.5%) | 9,593 (20.4%) |
| 3 or 4 Children | 1,286 (7.0%) | 3,957 (46.7%) |
| 5 or more Children | 285 (23.5%) | 409 (70.8%) |
| Total | 7,543 (2.9%) | 16,529 (17.1%) |
Race in Area Code 804
The most populous races in Area Code 804 are White / Caucasian (862,103 | 59.5%), Black / African American (406,613 | 28.1%), and Hispanic or Latino (97,182 | 6.7%).
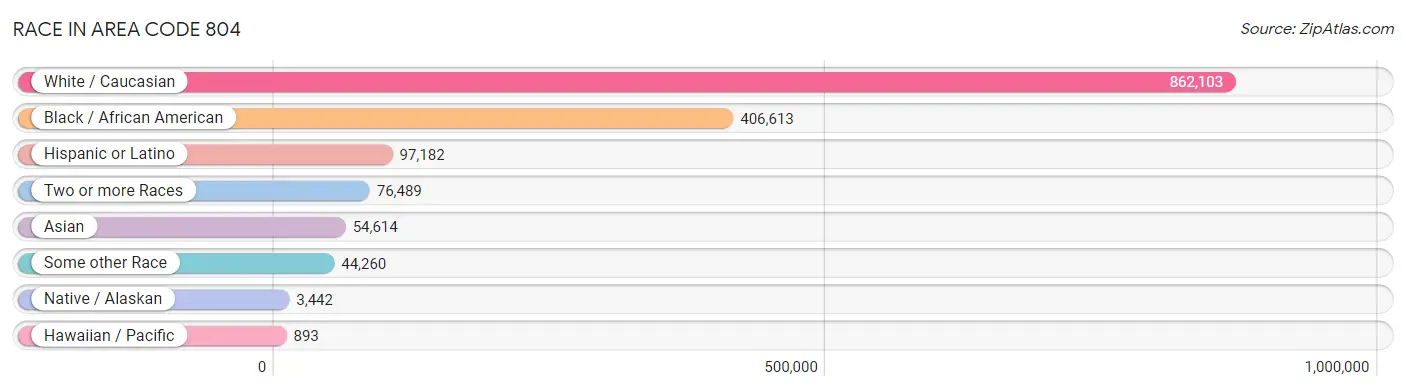
| Race | # Population | % Population |
| Asian | 54,614 | 3.8% |
| Black / African American | 406,613 | 28.1% |
| Hawaiian / Pacific | 893 | 0.1% |
| Hispanic or Latino | 97,182 | 6.7% |
| Native / Alaskan | 3,442 | 0.2% |
| White / Caucasian | 862,103 | 59.5% |
| Two or more Races | 76,489 | 5.3% |
| Some other Race | 44,260 | 3.1% |
| Total | 1,448,414 | 100.0% |
Ancestry in Area Code 804
The most populous ancestries reported in Area Code 804 are English (185,114 | 12.8%), German (132,078 | 9.1%), Irish (121,434 | 8.4%), American (105,540 | 7.3%), and Italian (53,213 | 3.7%), together accounting for 41.2% of all Area Code 804 residents.
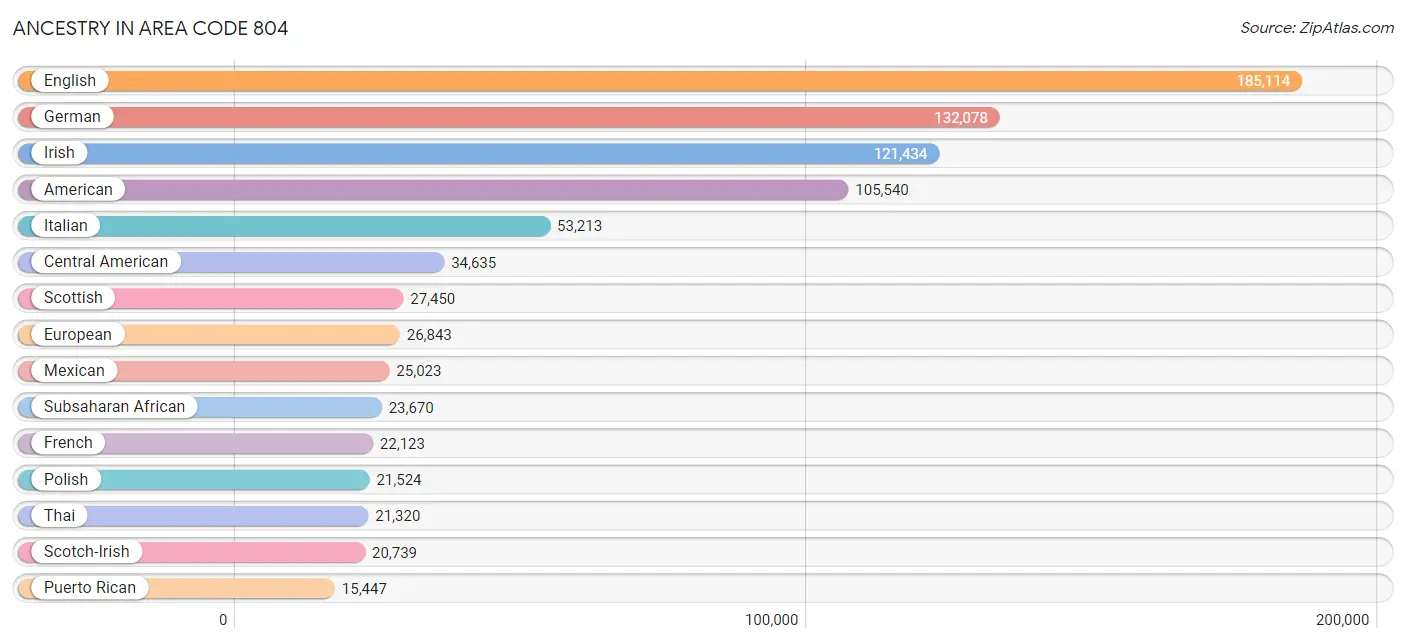
| Ancestry | # Population | % Population |
| Afghan | 1,670 | 0.1% |
| African | 14,926 | 1.0% |
| Alaska Native | 3 | 0.0% |
| Alaskan Athabascan | 17 | 0.0% |
| Albanian | 90 | 0.0% |
| Aleut | 3 | 0.0% |
| Alsatian | 25 | 0.0% |
| American | 105,540 | 7.3% |
| Apache | 220 | 0.0% |
| Arab | 8,728 | 0.6% |
| Arapaho | 5 | 0.0% |
| Argentinean | 539 | 0.0% |
| Armenian | 732 | 0.1% |
| Australian | 186 | 0.0% |
| Austrian | 1,978 | 0.1% |
| Bahamian | 553 | 0.0% |
| Bangladeshi | 48 | 0.0% |
| Barbadian | 481 | 0.0% |
| Basque | 89 | 0.0% |
| Belgian | 637 | 0.0% |
| Belizean | 208 | 0.0% |
| Bhutanese | 3,368 | 0.2% |
| Blackfeet | 967 | 0.1% |
| Bolivian | 698 | 0.1% |
| Brazilian | 1,820 | 0.1% |
| British | 11,946 | 0.8% |
| British West Indian | 287 | 0.0% |
| Bulgarian | 173 | 0.0% |
| Burmese | 6,243 | 0.4% |
| Cajun | 244 | 0.0% |
| Cambodian | 35 | 0.0% |
| Canadian | 1,919 | 0.1% |
| Cape Verdean | 80 | 0.0% |
| Celtic | 274 | 0.0% |
| Central American | 34,635 | 2.4% |
| Central American Indian | 1,255 | 0.1% |
| Cherokee | 4,792 | 0.3% |
| Cheyenne | 14 | 0.0% |
| Chickasaw | 20 | 0.0% |
| Chilean | 643 | 0.0% |
| Chippewa | 65 | 0.0% |
| Choctaw | 380 | 0.0% |
| Colombian | 2,760 | 0.2% |
| Comanche | 97 | 0.0% |
| Costa Rican | 242 | 0.0% |
| Cree | 17 | 0.0% |
| Creek | 159 | 0.0% |
| Croatian | 562 | 0.0% |
| Crow | 52 | 0.0% |
| Cuban | 3,221 | 0.2% |
| Czech | 3,901 | 0.3% |
| Czechoslovakian | 991 | 0.1% |
| Danish | 2,778 | 0.2% |
| Delaware | 20 | 0.0% |
| Dominican | 2,666 | 0.2% |
| Dutch | 9,203 | 0.6% |
| Dutch West Indian | 43 | 0.0% |
| Eastern European | 3,388 | 0.2% |
| Ecuadorian | 726 | 0.1% |
| Egyptian | 1,647 | 0.1% |
| English | 185,114 | 12.8% |
| Estonian | 111 | 0.0% |
| Ethiopian | 1,861 | 0.1% |
| European | 26,843 | 1.8% |
| Fijian | 10 | 0.0% |
| Filipino | 525 | 0.0% |
| Finnish | 706 | 0.1% |
| French | 22,123 | 1.5% |
| French American Indian | 81 | 0.0% |
| French Canadian | 4,173 | 0.3% |
| German | 132,078 | 9.1% |
| German Russian | 20 | 0.0% |
| Ghanaian | 492 | 0.0% |
| Greek | 5,299 | 0.4% |
| Guamanian / Chamorro | 483 | 0.0% |
| Guatemalan | 10,737 | 0.7% |
| Guyanese | 747 | 0.1% |
| Haitian | 970 | 0.1% |
| Honduran | 5,712 | 0.4% |
| Houma | 5 | 0.0% |
| Hungarian | 3,902 | 0.3% |
| Icelander | 714 | 0.1% |
| Indian (Asian) | 9,380 | 0.6% |
| Indonesian | 519 | 0.0% |
| Inupiat | 107 | 0.0% |
| Iranian | 959 | 0.1% |
| Iraqi | 504 | 0.0% |
| Irish | 121,434 | 8.4% |
| Iroquois | 69 | 0.0% |
| Israeli | 602 | 0.0% |
| Italian | 53,213 | 3.7% |
| Jamaican | 4,285 | 0.3% |
| Japanese | 2,366 | 0.2% |
| Jordanian | 324 | 0.0% |
| Kenyan | 176 | 0.0% |
| Korean | 9,592 | 0.7% |
| Laotian | 101 | 0.0% |
| Latvian | 371 | 0.0% |
| Lebanese | 3,236 | 0.2% |
| Liberian | 328 | 0.0% |
| Lithuanian | 1,758 | 0.1% |
| Lumbee | 170 | 0.0% |
| Luxembourger | 113 | 0.0% |
| Macedonian | 71 | 0.0% |
| Malaysian | 278 | 0.0% |
| Maltese | 29 | 0.0% |
| Mexican | 25,023 | 1.7% |
| Mexican American Indian | 346 | 0.0% |
| Mongolian | 48 | 0.0% |
| Moroccan | 612 | 0.0% |
| Native Hawaiian | 436 | 0.0% |
| Navajo | 135 | 0.0% |
| New Zealander | 55 | 0.0% |
| Nicaraguan | 1,201 | 0.1% |
| Nigerian | 1,734 | 0.1% |
| Northern European | 1,505 | 0.1% |
| Norwegian | 6,085 | 0.4% |
| Osage | 96 | 0.0% |
| Pakistani | 1,104 | 0.1% |
| Palestinian | 304 | 0.0% |
| Panamanian | 1,417 | 0.1% |
| Paraguayan | 311 | 0.0% |
| Pennsylvania German | 315 | 0.0% |
| Peruvian | 1,110 | 0.1% |
| Polish | 21,524 | 1.5% |
| Portuguese | 2,862 | 0.2% |
| Potawatomi | 33 | 0.0% |
| Pueblo | 8 | 0.0% |
| Puerto Rican | 15,447 | 1.1% |
| Romanian | 1,229 | 0.1% |
| Russian | 6,200 | 0.4% |
| Salvadoran | 15,022 | 1.0% |
| Samoan | 150 | 0.0% |
| Scandinavian | 3,022 | 0.2% |
| Scotch-Irish | 20,739 | 1.4% |
| Scottish | 27,450 | 1.9% |
| Seminole | 158 | 0.0% |
| Senegalese | 167 | 0.0% |
| Serbian | 209 | 0.0% |
| Shoshone | 35 | 0.0% |
| Sierra Leonean | 716 | 0.1% |
| Sioux | 159 | 0.0% |
| Slavic | 423 | 0.0% |
| Slovak | 2,387 | 0.2% |
| Slovene | 279 | 0.0% |
| Somali | 25 | 0.0% |
| South African | 199 | 0.0% |
| South American | 8,760 | 0.6% |
| South American Indian | 98 | 0.0% |
| Soviet Union | 28 | 0.0% |
| Spaniard | 2,063 | 0.1% |
| Spanish | 1,623 | 0.1% |
| Spanish American | 97 | 0.0% |
| Spanish American Indian | 23 | 0.0% |
| Sri Lankan | 6,944 | 0.5% |
| Subsaharan African | 23,670 | 1.6% |
| Sudanese | 833 | 0.1% |
| Swedish | 7,614 | 0.5% |
| Swiss | 2,408 | 0.2% |
| Syrian | 220 | 0.0% |
| Taiwanese | 1 | 0.0% |
| Thai | 21,320 | 1.5% |
| Tlingit-Haida | 5 | 0.0% |
| Tongan | 68 | 0.0% |
| Trinidadian and Tobagonian | 565 | 0.0% |
| Turkish | 881 | 0.1% |
| U.S. Virgin Islander | 199 | 0.0% |
| Ugandan | 72 | 0.0% |
| Ukrainian | 2,901 | 0.2% |
| Uruguayan | 158 | 0.0% |
| Ute | 12 | 0.0% |
| Venezuelan | 1,573 | 0.1% |
| Vietnamese | 449 | 0.0% |
| Welsh | 9,807 | 0.7% |
| West Indian | 1,313 | 0.1% |
| Yaqui | 94 | 0.0% |
| Yugoslavian | 1,138 | 0.1% |
| Yup'ik | 6 | 0.0% |
| Zimbabwean | 23 | 0.0% | View All 179 Rows |
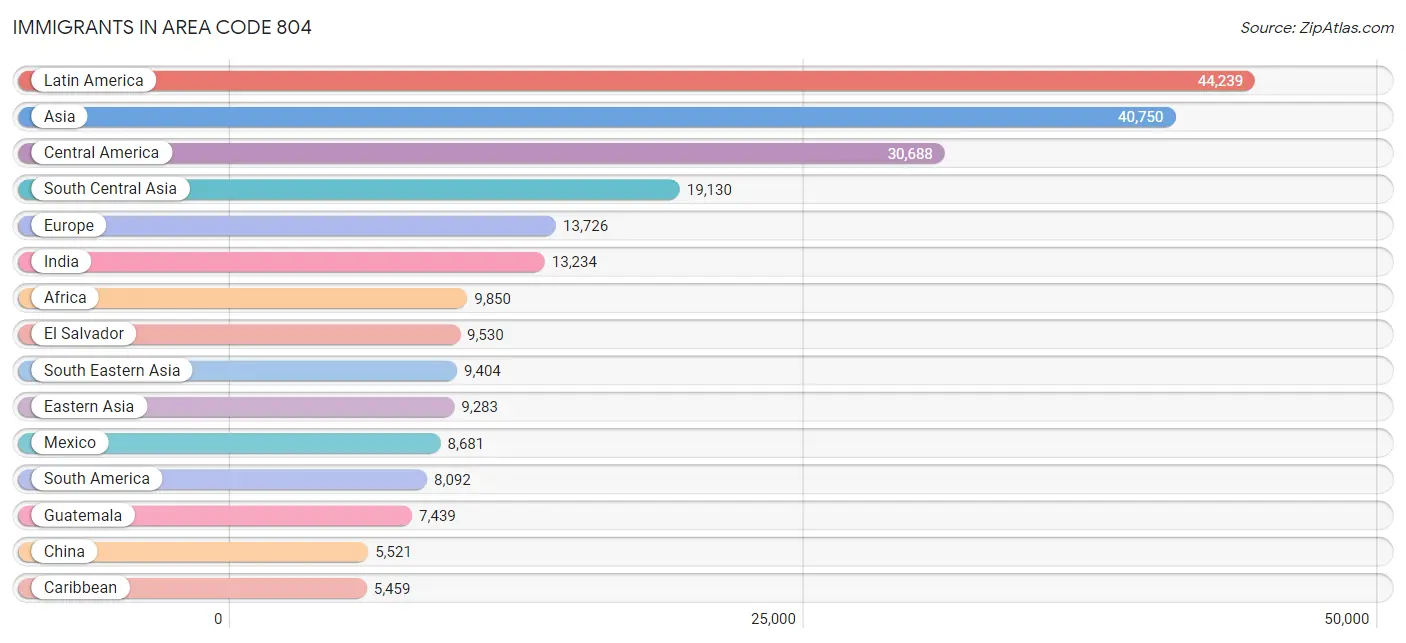
Immigrants in Area Code 804
The most numerous immigrant groups reported in Area Code 804 came from Latin America (44,239 | 3.0%), Asia (40,750 | 2.8%), Central America (30,688 | 2.1%), South Central Asia (19,130 | 1.3%), and Europe (13,726 | 0.9%), together accounting for 10.2% of all Area Code 804 residents.
| Immigration Origin | # Population | % Population |
| Afghanistan | 1,459 | 0.1% |
| Africa | 9,850 | 0.7% |
| Argentina | 300 | 0.0% |
| Armenia | 43 | 0.0% |
| Asia | 40,750 | 2.8% |
| Australia | 214 | 0.0% |
| Austria | 87 | 0.0% |
| Bahamas | 45 | 0.0% |
| Bangladesh | 587 | 0.0% |
| Barbados | 181 | 0.0% |
| Belarus | 56 | 0.0% |
| Belgium | 145 | 0.0% |
| Belize | 195 | 0.0% |
| Bolivia | 379 | 0.0% |
| Bosnia and Herzegovina | 525 | 0.0% |
| Brazil | 1,572 | 0.1% |
| Bulgaria | 79 | 0.0% |
| Cabo Verde | 19 | 0.0% |
| Cambodia | 978 | 0.1% |
| Cameroon | 712 | 0.1% |
| Canada | 1,831 | 0.1% |
| Caribbean | 5,459 | 0.4% |
| Central America | 30,688 | 2.1% |
| Chile | 343 | 0.0% |
| China | 5,521 | 0.4% |
| Colombia | 1,786 | 0.1% |
| Congo | 73 | 0.0% |
| Costa Rica | 181 | 0.0% |
| Croatia | 31 | 0.0% |
| Cuba | 790 | 0.1% |
| Czechoslovakia | 213 | 0.0% |
| Denmark | 33 | 0.0% |
| Dominica | 53 | 0.0% |
| Dominican Republic | 916 | 0.1% |
| Eastern Africa | 2,607 | 0.2% |
| Eastern Asia | 9,283 | 0.6% |
| Eastern Europe | 3,975 | 0.3% |
| Ecuador | 392 | 0.0% |
| Egypt | 1,339 | 0.1% |
| El Salvador | 9,530 | 0.7% |
| England | 2,195 | 0.2% |
| Eritrea | 76 | 0.0% |
| Ethiopia | 1,508 | 0.1% |
| Europe | 13,726 | 0.9% |
| Fiji | 7 | 0.0% |
| France | 616 | 0.0% |
| Germany | 2,783 | 0.2% |
| Ghana | 439 | 0.0% |
| Greece | 432 | 0.0% |
| Grenada | 53 | 0.0% |
| Guatemala | 7,439 | 0.5% |
| Guyana | 695 | 0.1% |
| Haiti | 578 | 0.0% |
| Honduras | 3,881 | 0.3% |
| Hong Kong | 161 | 0.0% |
| Hungary | 147 | 0.0% |
| India | 13,234 | 0.9% |
| Indonesia | 82 | 0.0% |
| Iran | 808 | 0.1% |
| Iraq | 668 | 0.1% |
| Ireland | 255 | 0.0% |
| Israel | 116 | 0.0% |
| Italy | 753 | 0.1% |
| Jamaica | 1,573 | 0.1% |
| Japan | 617 | 0.0% |
| Jordan | 421 | 0.0% |
| Kazakhstan | 170 | 0.0% |
| Kenya | 306 | 0.0% |
| Korea | 3,127 | 0.2% |
| Kuwait | 45 | 0.0% |
| Laos | 99 | 0.0% |
| Latin America | 44,239 | 3.0% |
| Latvia | 46 | 0.0% |
| Lebanon | 689 | 0.1% |
| Liberia | 496 | 0.0% |
| Lithuania | 75 | 0.0% |
| Malaysia | 150 | 0.0% |
| Mexico | 8,681 | 0.6% |
| Micronesia | 10 | 0.0% |
| Middle Africa | 871 | 0.1% |
| Moldova | 71 | 0.0% |
| Morocco | 221 | 0.0% |
| Nepal | 566 | 0.0% |
| Netherlands | 143 | 0.0% |
| Nicaragua | 424 | 0.0% |
| Nigeria | 940 | 0.1% |
| Northern Africa | 2,386 | 0.2% |
| Northern Europe | 4,206 | 0.3% |
| Norway | 40 | 0.0% |
| Oceania | 353 | 0.0% |
| Pakistan | 1,535 | 0.1% |
| Panama | 355 | 0.0% |
| Peru | 674 | 0.1% |
| Philippines | 2,805 | 0.2% |
| Poland | 326 | 0.0% |
| Portugal | 222 | 0.0% |
| Romania | 310 | 0.0% |
| Russia | 1,324 | 0.1% |
| Saudi Arabia | 180 | 0.0% |
| Scotland | 184 | 0.0% |
| Senegal | 112 | 0.0% |
| Serbia | 70 | 0.0% |
| Sierra Leone | 594 | 0.0% |
| Singapore | 160 | 0.0% |
| South Africa | 285 | 0.0% |
| South America | 8,092 | 0.6% |
| South Central Asia | 19,130 | 1.3% |
| South Eastern Asia | 9,404 | 0.6% |
| Southern Europe | 1,678 | 0.1% |
| Spain | 271 | 0.0% |
| Sri Lanka | 244 | 0.0% |
| St. Vincent and the Grenadines | 90 | 0.0% |
| Sudan | 497 | 0.0% |
| Sweden | 146 | 0.0% |
| Switzerland | 84 | 0.0% |
| Taiwan | 716 | 0.1% |
| Thailand | 785 | 0.1% |
| Trinidad and Tobago | 591 | 0.0% |
| Turkey | 256 | 0.0% |
| Uganda | 51 | 0.0% |
| Ukraine | 360 | 0.0% |
| Uruguay | 82 | 0.0% |
| Uzbekistan | 103 | 0.0% |
| Venezuela | 1,647 | 0.1% |
| Vietnam | 3,916 | 0.3% |
| West Indies | 254 | 0.0% |
| Western Africa | 3,311 | 0.2% |
| Western Asia | 2,907 | 0.2% |
| Western Europe | 3,858 | 0.3% |
| Yemen | 210 | 0.0% |
| Zaire | 86 | 0.0% |
| Zimbabwe | 121 | 0.0% | View All 132 Rows |
Sex and Age in Area Code 804
Sex and Age in Area Code 804
The most populous age groups in Area Code 804 are 30 to 34 Years (51,020 | 7.2%) for men and 60 to 64 Years (52,615 | 7.1%) for women.
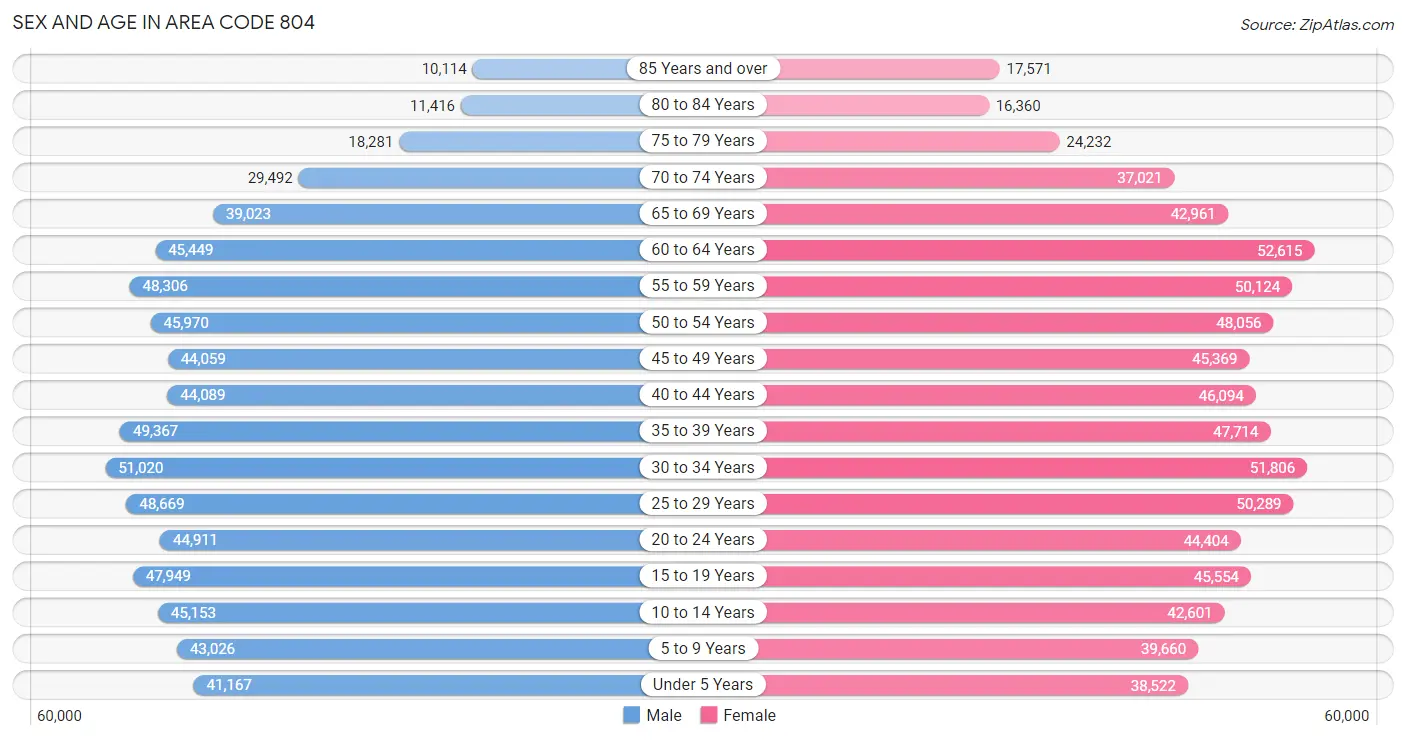
| Age Bracket | Male | Female |
| Under 5 Years | 41,167 (5.8%) | 38,522 (5.2%) |
| 5 to 9 Years | 43,026 (6.1%) | 39,660 (5.3%) |
| 10 to 14 Years | 45,153 (6.4%) | 42,601 (5.8%) |
| 15 to 19 Years | 47,949 (6.8%) | 45,554 (6.1%) |
| 20 to 24 Years | 44,911 (6.4%) | 44,404 (6.0%) |
| 25 to 29 Years | 48,669 (6.9%) | 50,289 (6.8%) |
| 30 to 34 Years | 51,020 (7.2%) | 51,806 (7.0%) |
| 35 to 39 Years | 49,367 (7.0%) | 47,714 (6.4%) |
| 40 to 44 Years | 44,089 (6.2%) | 46,094 (6.2%) |
| 45 to 49 Years | 44,059 (6.2%) | 45,369 (6.1%) |
| 50 to 54 Years | 45,970 (6.5%) | 48,056 (6.5%) |
| 55 to 59 Years | 48,306 (6.8%) | 50,124 (6.8%) |
| 60 to 64 Years | 45,449 (6.4%) | 52,615 (7.1%) |
| 65 to 69 Years | 39,023 (5.5%) | 42,961 (5.8%) |
| 70 to 74 Years | 29,492 (4.2%) | 37,021 (5.0%) |
| 75 to 79 Years | 18,281 (2.6%) | 24,232 (3.3%) |
| 80 to 84 Years | 11,416 (1.6%) | 16,360 (2.2%) |
| 85 Years and over | 10,114 (1.4%) | 17,571 (2.4%) |
| Total | 707,461 (100.0%) | 740,953 (100.0%) |
Families and Households in Area Code 804
Median Family Size in Area Code 804
The median family size in Area Code 804 is 3.00 persons per family, with single female/mother families (72,335 | 20.1%) accounting for the largest median family size of 3.28866 persons per family. On the other hand, married-couple families (263,846 | 73.1%) represent the smallest median family size with 2.90 persons per family.
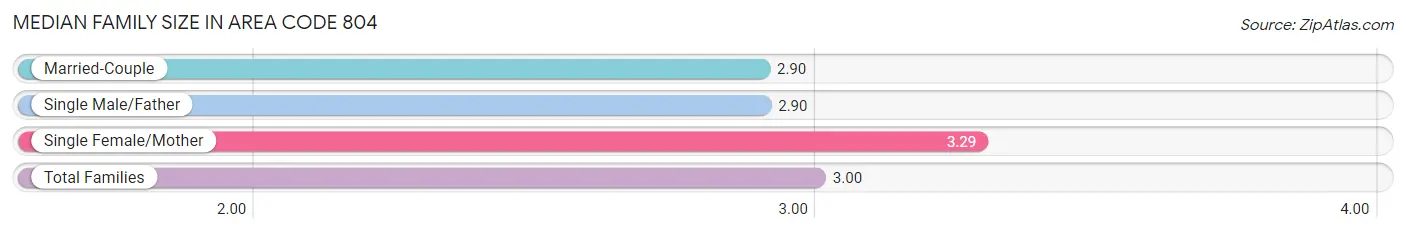
| Family Type | # Families | Family Size |
| Married-Couple | 263,846 (73.1%) | 2.90 |
| Single Male/Father | 24,608 (6.8%) | 2.90 |
| Single Female/Mother | 72,335 (20.1%) | 3.29 |
| Total Families | 360,789 (100.0%) | 3.00 |
Median Household Size in Area Code 804
The median household size in Area Code 804 is 2.41 persons per household, with single female/mother households (72,335 | 12.7%) accounting for the largest median household size of 3.53755 persons per household. non-family households (208,177 | 36.6%) represent the smallest median household size with 1.24 persons per household.
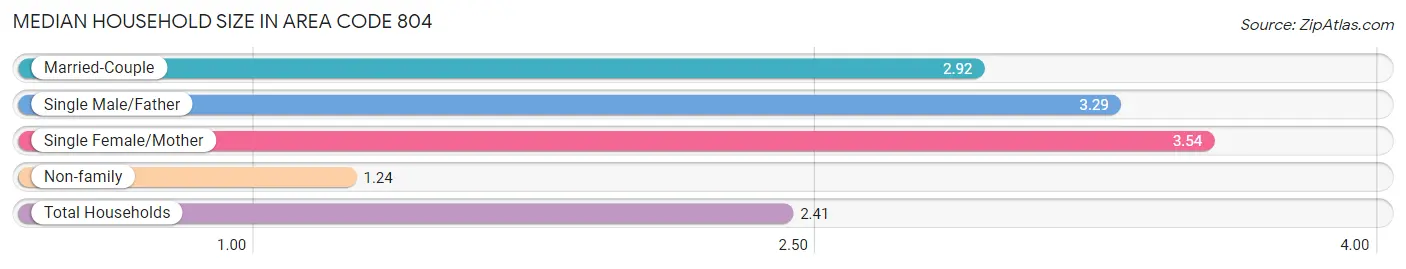
| Household Type | # Households | Household Size |
| Married-Couple | 263,846 (46.4%) | 2.92 |
| Single Male/Father | 24,608 (4.3%) | 3.29 |
| Single Female/Mother | 72,335 (12.7%) | 3.54 |
| Non-family | 208,177 (36.6%) | 1.24 |
| Total Households | 568,966 (100.0%) | 2.41 |
Household Size by Marriage Status in Area Code 804
Out of a total of 568,966 households in Area Code 804, 360,789 (63.4%) are family households, while 208,177 (36.6%) are nonfamily households. The most numerous type of family households are 2-person households, comprising 167,755, and the most common type of nonfamily households are 1-person households, comprising 170,016.
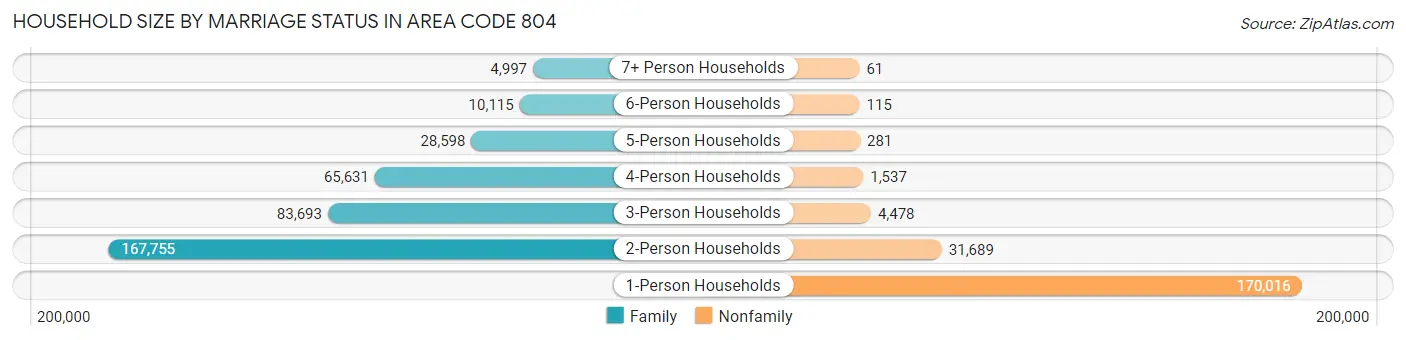
| Household Size | Family Households | Nonfamily Households |
| 1-Person Households | - | 170,016 (29.9%) |
| 2-Person Households | 167,755 (29.5%) | 31,689 (5.6%) |
| 3-Person Households | 83,693 (14.7%) | 4,478 (0.8%) |
| 4-Person Households | 65,631 (11.5%) | 1,537 (0.3%) |
| 5-Person Households | 28,598 (5.0%) | 281 (0.1%) |
| 6-Person Households | 10,115 (1.8%) | 115 (0.0%) |
| 7+ Person Households | 4,997 (0.9%) | 61 (0.0%) |
| Total | 360,789 (63.4%) | 208,177 (36.6%) |
Female Fertility in Area Code 804
Fertility by Age in Area Code 804
Average fertility rate in Area Code 804 is 65.7 births per 1,000 women. Women in the age bracket of 20 to 34 years have the highest fertility rate with 127.2 births per 1,000 women. Women in the age bracket of 20 to 34 years acount for 75.4% of all women with births.
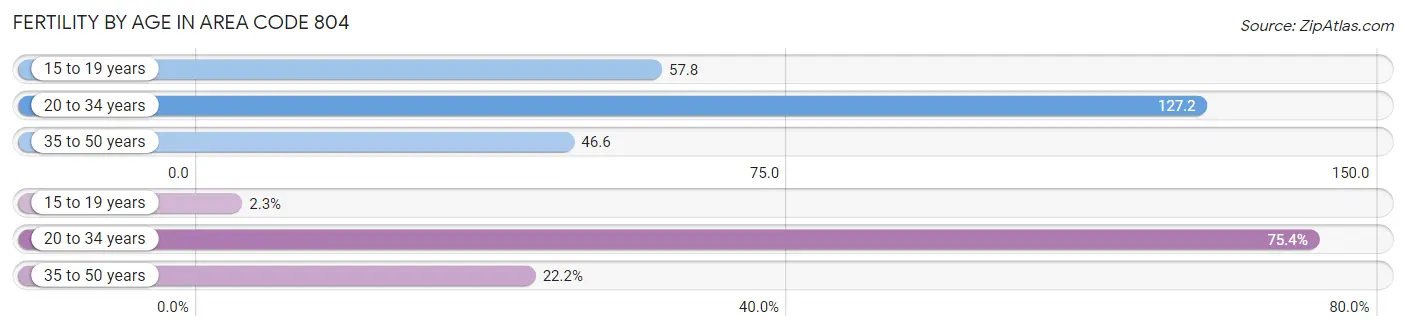
| Age Bracket | Women with Births | Births / 1,000 Women |
| 15 to 19 years | 371 (2.3%) | 57.8 |
| 20 to 34 years | 12,001 (75.4%) | 127.2 |
| 35 to 50 years | 3,538 (22.2%) | 46.6 |
| Total | 15,910 (100.0%) | 65.7 |
Fertility by Age by Marriage Status in Area Code 804
55.8% of women with births (15,910) in Area Code 804 are married. The highest percentage of unmarried women with births falls into 15 to 19 years age bracket with 100.0% of them unmarried at the time of birth, while the lowest percentage of unmarried women with births belong to 35 to 50 years age bracket with 49.0% of them unmarried.
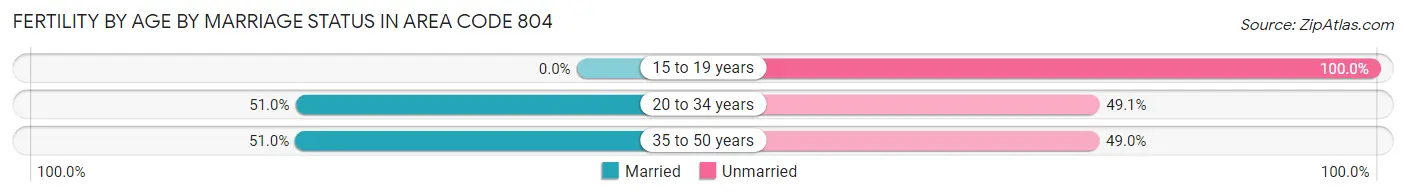
| Age Bracket | Married | Unmarried |
| 15 to 19 years | 0 (0.0%) | 371 (100.0%) |
| 20 to 34 years | 6,114 (50.9%) | 5,887 (49.0%) |
| 35 to 50 years | 1,804 (51.0%) | 1,734 (49.0%) |
| Total | 8,883 (55.8%) | 7,027 (44.2%) |
Fertility by Education in Area Code 804
Average fertility rate in Area Code 804 is 65.7 births per 1,000 women. Women with the education attainment of high school diploma have the highest fertility rate of 115.9 births per 1,000 women, while women with the education attainment of less than high school have the lowest fertility at 76.4 births per 1,000 women. Women with the education attainment of college or associate's degree represent 27.9% of all women with births.
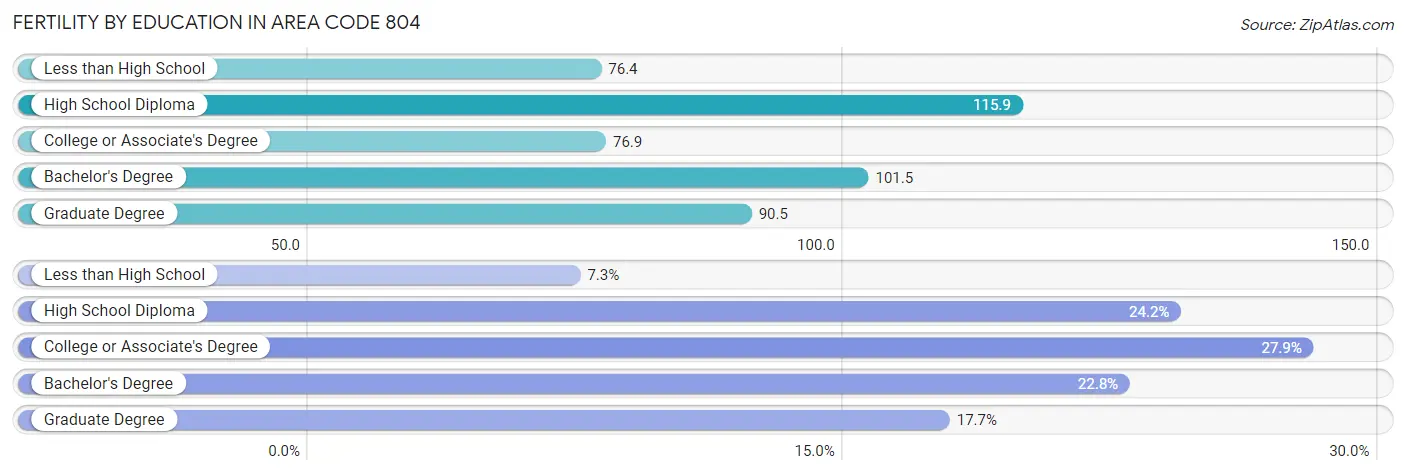
| Educational Attainment | Women with Births | Births / 1,000 Women |
| Less than High School | 1,167 (7.3%) | 76.4 |
| High School Diploma | 3,854 (24.2%) | 115.9 |
| College or Associate's Degree | 4,446 (27.9%) | 76.9 |
| Bachelor's Degree | 3,624 (22.8%) | 101.5 |
| Graduate Degree | 2,819 (17.7%) | 90.5 |
| Total | 15,910 (100.0%) | 65.7 |
Fertility by Education by Marriage Status in Area Code 804
44.2% of women with births in Area Code 804 are unmarried. Women with the educational attainment of graduate degree are most likely to be married with 65.3% of them married at childbirth, while women with the educational attainment of less than high school are least likely to be married with 84.9% of them unmarried at childbirth.
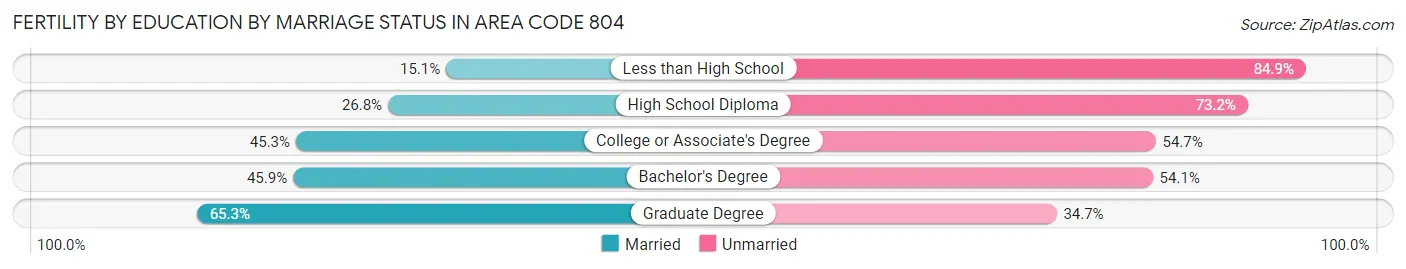
| Educational Attainment | Married | Unmarried |
| Less than High School | 176 (15.1%) | 991 (84.9%) |
| High School Diploma | 1,032 (26.8%) | 2,822 (73.2%) |
| College or Associate's Degree | 2,016 (45.3%) | 2,430 (54.7%) |
| Bachelor's Degree | 1,664 (45.9%) | 1,960 (54.1%) |
| Graduate Degree | 1,841 (65.3%) | 978 (34.7%) |
| Total | 8,883 (55.8%) | 7,027 (44.2%) |
Employment Characteristics in Area Code 804
Employment by Class of Employer in Area Code 804
Among the 720,547 employed individuals in Area Code 804, private company employees (469,908 | 65.2%), local government employees (57,572 | 8.0%), and not-for-profit organizations (52,737 | 7.3%) make up the most common classes of employment.
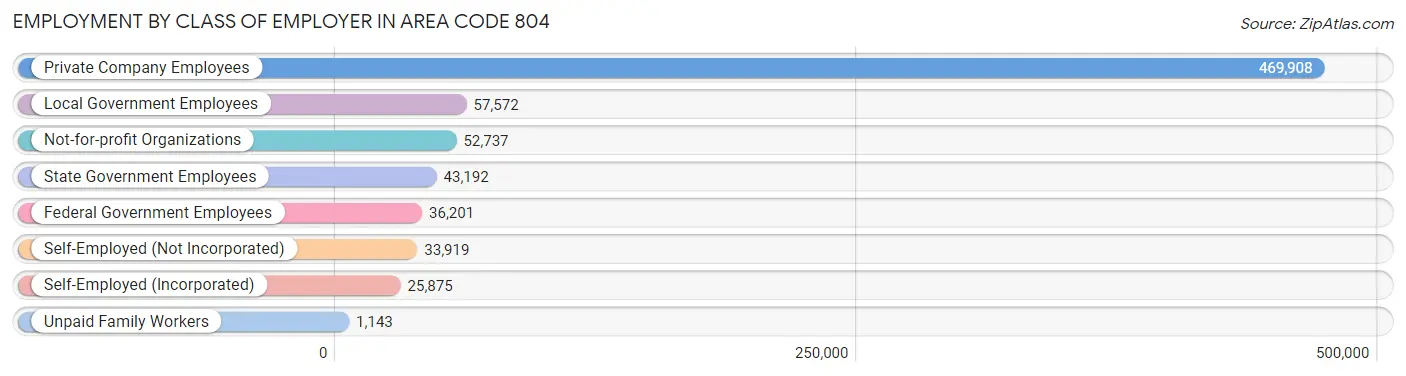
| Employer Class | # Employees | % Employees |
| Private Company Employees | 469,908 | 65.2% |
| Self-Employed (Incorporated) | 25,875 | 3.6% |
| Self-Employed (Not Incorporated) | 33,919 | 4.7% |
| Not-for-profit Organizations | 52,737 | 7.3% |
| Local Government Employees | 57,572 | 8.0% |
| State Government Employees | 43,192 | 6.0% |
| Federal Government Employees | 36,201 | 5.0% |
| Unpaid Family Workers | 1,143 | 0.2% |
| Total | 720,547 | 100.0% |
Employment Status by Age in Area Code 804
According to the labor force statistics for Area Code 804, out of the total population over 16 years of age (1,179,449), 58.6% or 691,039 individuals are in the labor force, with 6.5% or 44,779 of them unemployed. The age group with the highest labor force participation rate is 30 to 34 years, with 84.1% or 86,518 individuals in the labor force. Within the labor force, the 16 to 19 years age range has the highest percentage of unemployed individuals, with 1,859.1% or 693,519 of them being unemployed.
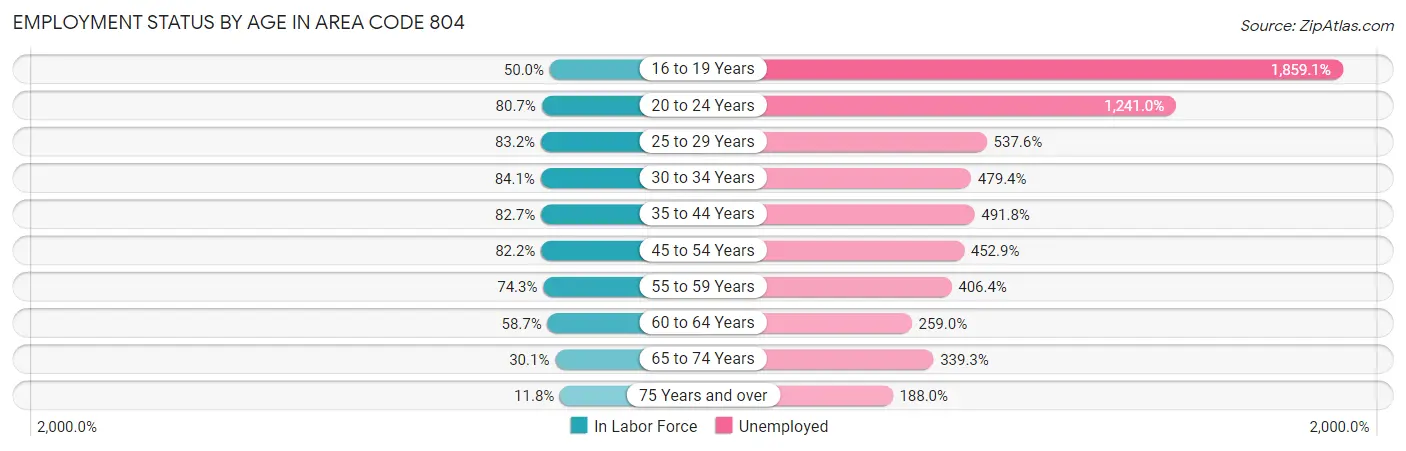
| Age Bracket | In Labor Force | Unemployed |
| 16 to 19 Years | 37,306 (50.0%) | 693,519 (1,859.1%) |
| 20 to 24 Years | 72,051 (80.7%) | 894,140 (1,241.0%) |
| 25 to 29 Years | 82,346 (83.2%) | 442,676 (537.6%) |
| 30 to 34 Years | 86,518 (84.1%) | 414,767 (479.4%) |
| 35 to 44 Years | 154,877 (82.7%) | 761,729 (491.8%) |
| 45 to 54 Years | 150,771 (82.2%) | 682,801 (452.9%) |
| 55 to 59 Years | 73,148 (74.3%) | 297,294 (406.4%) |
| 60 to 64 Years | 57,550 (58.7%) | 149,065 (259.0%) |
| 65 to 74 Years | 44,702 (30.1%) | 151,660 (339.3%) |
| 75 Years and over | 11,593 (11.8%) | 21,789 (188.0%) |
| Total | 691,023 (58.6%) | 44,776 (6.5%) |
Employment Status by Educational Attainment in Area Code 804
According to labor force statistics for Area Code 804, 76.6% of individuals (589,282) out of the total population between 25 and 64 years of age (768,996) are in the labor force, with 522.4% or 3,078,409 of them being unemployed. The group with the highest labor force participation rate are those with the educational attainment of bachelor's degree or higher, with 84.8% or 258,852 individuals in the labor force. Within the labor force, individuals with high school diploma education have the highest percentage of unemployment, with 698.5% or 961,408 of them being unemployed.
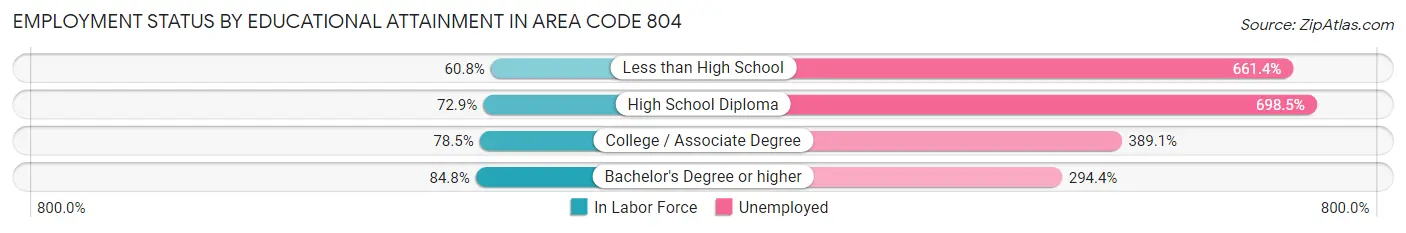
| Educational Attainment | In Labor Force | Unemployed |
| Less than High School | 37,138 (60.8%) | 404,340 (661.4%) |
| High School Diploma | 137,632 (72.9%) | 1,318,621 (698.5%) |
| College / Associate Degree | 167,845 (78.5%) | 832,024 (389.1%) |
| Bachelor's Degree or higher | 258,848 (84.8%) | 898,656 (294.4%) |
| Total | 589,305 (76.6%) | 4,017,235 (522.4%) |
Employment Occupations by Sex in Area Code 804
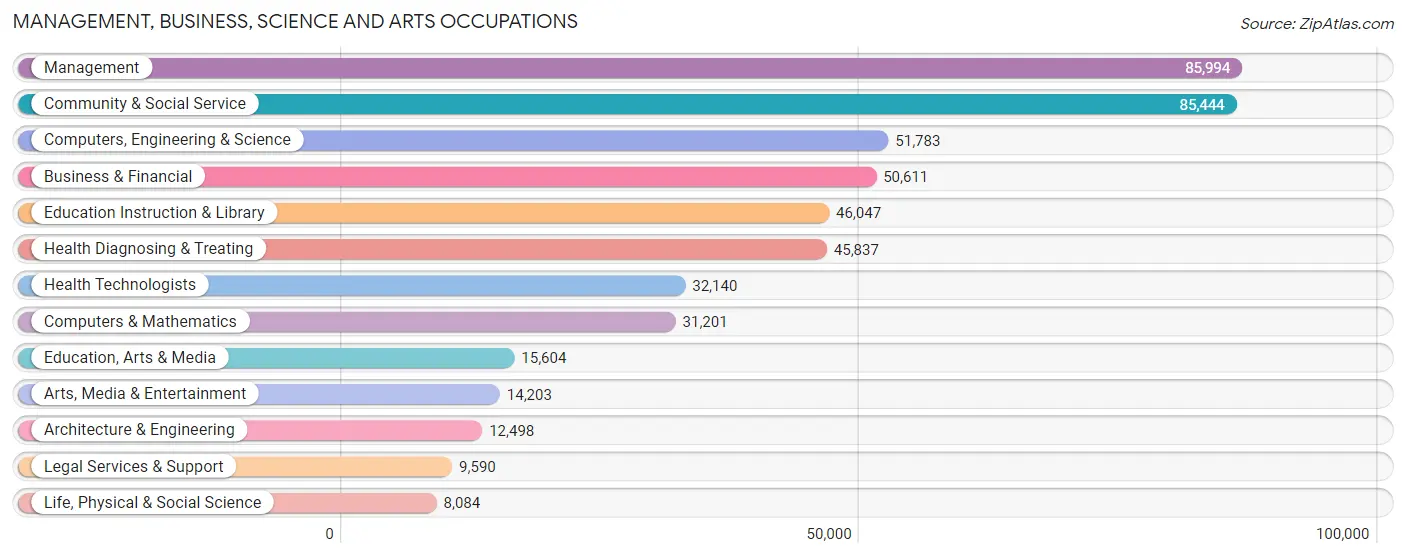
Management, Business, Science and Arts Occupations
The most common Management, Business, Science and Arts occupations in Area Code 804 are Management (85,994 | 11.8%), Community & Social Service (85,444 | 11.8%), Computers, Engineering & Science (51,783 | 7.1%), Business & Financial (50,611 | 7.0%), and Education Instruction & Library (46,047 | 6.3%).
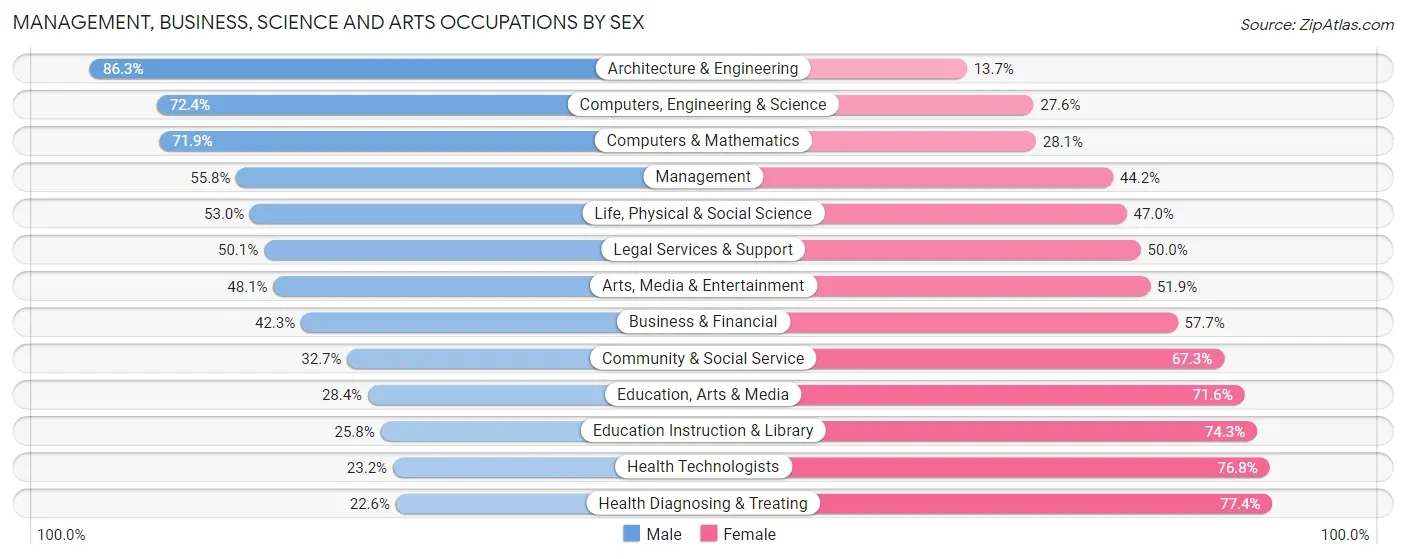
Management, Business, Science and Arts Occupations by Sex
Within the Management, Business, Science and Arts occupations in Area Code 804, the most male-oriented occupations are Architecture & Engineering (86.3%), Computers, Engineering & Science (72.4%), and Computers & Mathematics (71.9%), while the most female-oriented occupations are Health Diagnosing & Treating (77.4%), Health Technologists (76.8%), and Education Instruction & Library (74.3%).
| Occupation | Male | Female |
| Management | 48,009 (55.8%) | 37,985 (44.2%) |
| Business & Financial | 21,426 (42.3%) | 29,185 (57.7%) |
| Computers, Engineering & Science | 37,504 (72.4%) | 14,279 (27.6%) |
| Computers & Mathematics | 22,433 (71.9%) | 8,768 (28.1%) |
| Architecture & Engineering | 10,790 (86.3%) | 1,708 (13.7%) |
| Life, Physical & Social Science | 4,281 (53.0%) | 3,803 (47.0%) |
| Community & Social Service | 27,915 (32.7%) | 57,529 (67.3%) |
| Education, Arts & Media | 4,428 (28.4%) | 11,176 (71.6%) |
| Legal Services & Support | 4,800 (50.0%) | 4,790 (49.9%) |
| Education Instruction & Library | 11,856 (25.8%) | 34,191 (74.3%) |
| Arts, Media & Entertainment | 6,831 (48.1%) | 7,372 (51.9%) |
| Health Diagnosing & Treating | 10,346 (22.6%) | 35,491 (77.4%) |
| Health Technologists | 7,448 (23.2%) | 24,692 (76.8%) |
| Total (Category) | 145,200 (45.4%) | 174,469 (54.6%) |
| Total (Overall) | 369,048 (50.8%) | 356,817 (49.2%) |
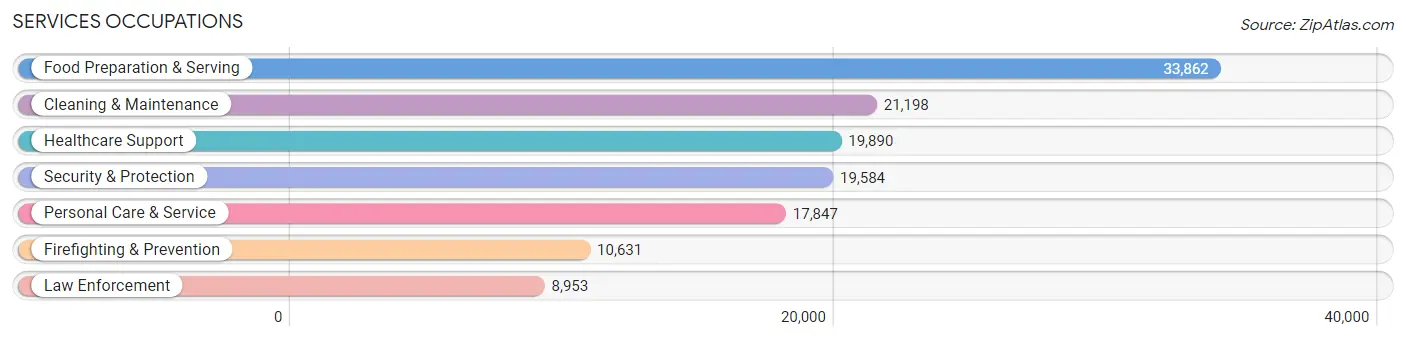
Services Occupations
The most common Services occupations in Area Code 804 are Food Preparation & Serving (33,862 | 4.7%), Cleaning & Maintenance (21,198 | 2.9%), Healthcare Support (19,890 | 2.7%), Security & Protection (19,584 | 2.7%), and Personal Care & Service (17,847 | 2.5%).
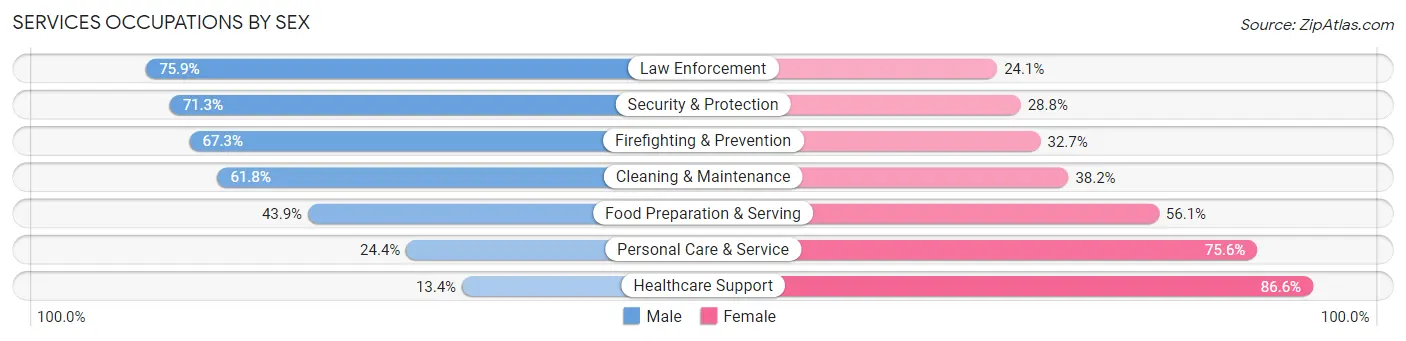
Services Occupations by Sex
Within the Services occupations in Area Code 804, the most male-oriented occupations are Law Enforcement (75.9%), Security & Protection (71.3%), and Firefighting & Prevention (67.3%), while the most female-oriented occupations are Healthcare Support (86.6%), Personal Care & Service (75.6%), and Food Preparation & Serving (56.1%).
| Occupation | Male | Female |
| Healthcare Support | 2,665 (13.4%) | 17,225 (86.6%) |
| Security & Protection | 13,953 (71.3%) | 5,631 (28.7%) |
| Firefighting & Prevention | 7,157 (67.3%) | 3,474 (32.7%) |
| Law Enforcement | 6,796 (75.9%) | 2,157 (24.1%) |
| Food Preparation & Serving | 14,861 (43.9%) | 19,001 (56.1%) |
| Cleaning & Maintenance | 13,101 (61.8%) | 8,097 (38.2%) |
| Personal Care & Service | 4,362 (24.4%) | 13,485 (75.6%) |
| Total (Category) | 48,942 (43.5%) | 63,439 (56.5%) |
| Total (Overall) | 369,048 (50.8%) | 356,817 (49.2%) |
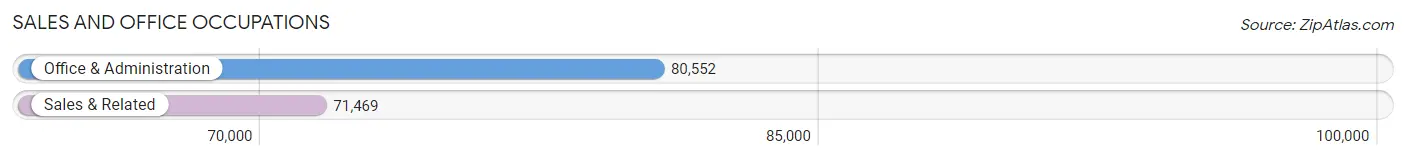
Sales and Office Occupations
The most common Sales and Office occupations in Area Code 804 are Office & Administration (80,552 | 11.1%), and Sales & Related (71,469 | 9.9%).
Sales and Office Occupations by Sex
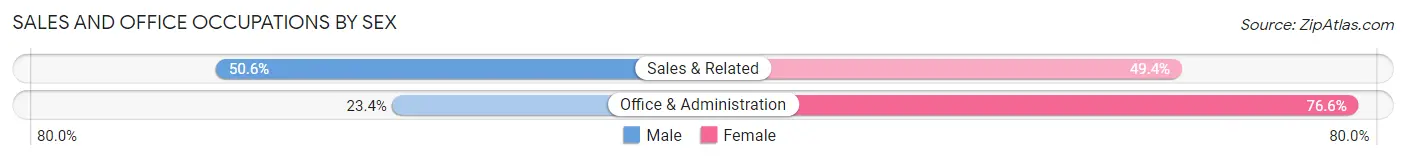
| Occupation | Male | Female |
| Sales & Related | 36,136 (50.6%) | 35,333 (49.4%) |
| Office & Administration | 18,833 (23.4%) | 61,719 (76.6%) |
| Total (Category) | 54,969 (36.2%) | 97,052 (63.8%) |
| Total (Overall) | 369,048 (50.8%) | 356,817 (49.2%) |
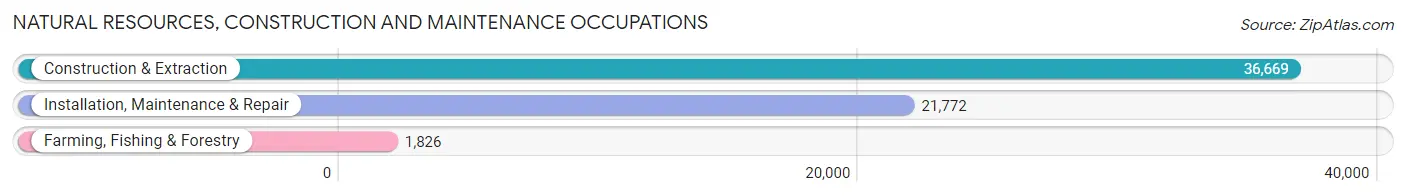
Natural Resources, Construction and Maintenance Occupations
The most common Natural Resources, Construction and Maintenance occupations in Area Code 804 are Construction & Extraction (36,669 | 5.1%), Installation, Maintenance & Repair (21,772 | 3.0%), and Farming, Fishing & Forestry (1,826 | 0.3%).
Natural Resources, Construction and Maintenance Occupations by Sex
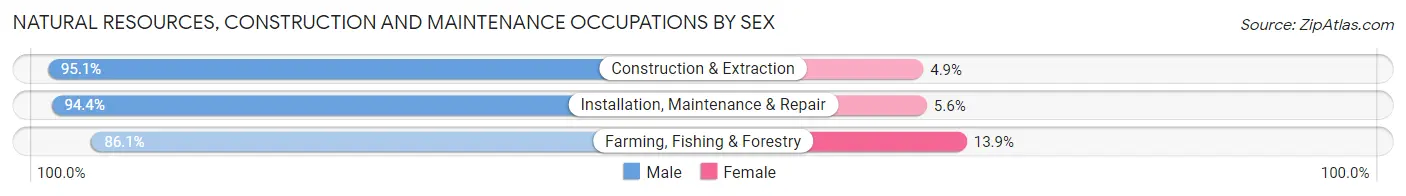
| Occupation | Male | Female |
| Farming, Fishing & Forestry | 1,572 (86.1%) | 254 (13.9%) |
| Construction & Extraction | 34,887 (95.1%) | 1,782 (4.9%) |
| Installation, Maintenance & Repair | 20,548 (94.4%) | 1,224 (5.6%) |
| Total (Category) | 57,007 (94.6%) | 3,260 (5.4%) |
| Total (Overall) | 369,048 (50.8%) | 356,817 (49.2%) |
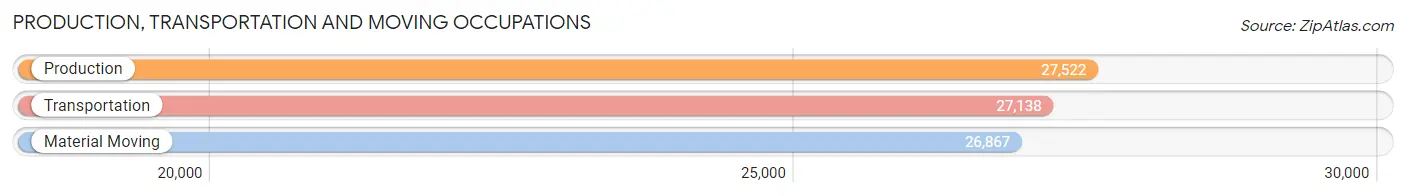
Production, Transportation and Moving Occupations
The most common Production, Transportation and Moving occupations in Area Code 804 are Production (27,522 | 3.8%), Transportation (27,138 | 3.7%), and Material Moving (26,867 | 3.7%).
Production, Transportation and Moving Occupations by Sex
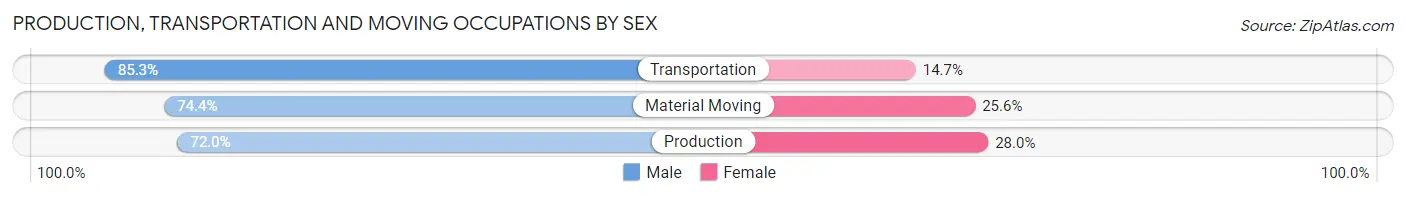
| Occupation | Male | Female |
| Production | 19,809 (72.0%) | 7,713 (28.0%) |
| Transportation | 23,140 (85.3%) | 3,998 (14.7%) |
| Material Moving | 19,981 (74.4%) | 6,886 (25.6%) |
| Total (Category) | 62,930 (77.2%) | 18,597 (22.8%) |
| Total (Overall) | 369,048 (50.8%) | 356,817 (49.2%) |
Employment Industries by Sex in Area Code 804
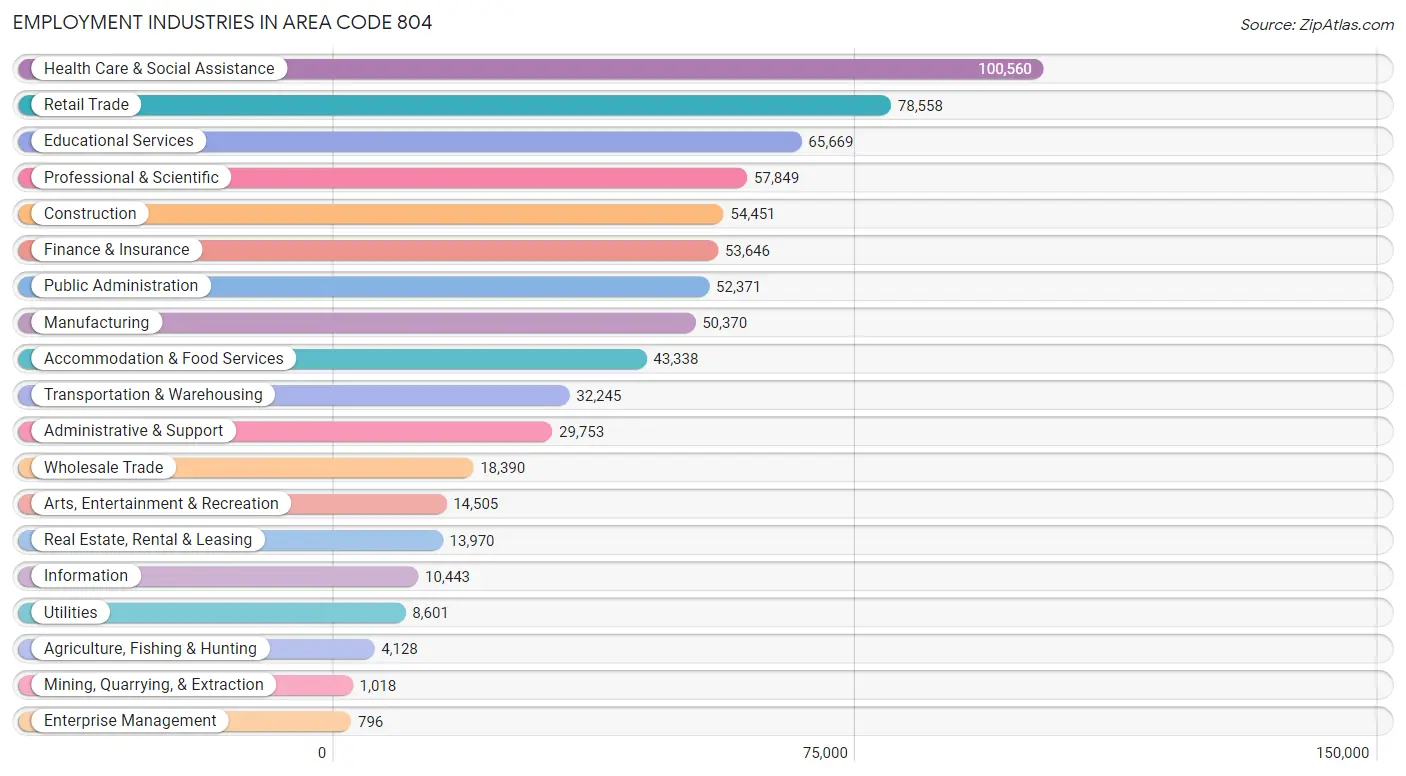
Employment Industries in Area Code 804
The major employment industries in Area Code 804 include Health Care & Social Assistance (100,560 | 13.9%), Retail Trade (78,558 | 10.8%), Educational Services (65,669 | 9.0%), Professional & Scientific (57,849 | 8.0%), and Construction (54,451 | 7.5%).
Employment Industries by Sex in Area Code 804
The Area Code 804 industries that see more men than women are Construction (88.0%), Mining, Quarrying, & Extraction (86.9%), and Agriculture, Fishing & Hunting (76.4%), whereas the industries that tend to have a higher number of women are Health Care & Social Assistance (79.3%), Educational Services (69.6%), and Finance & Insurance (58.7%).
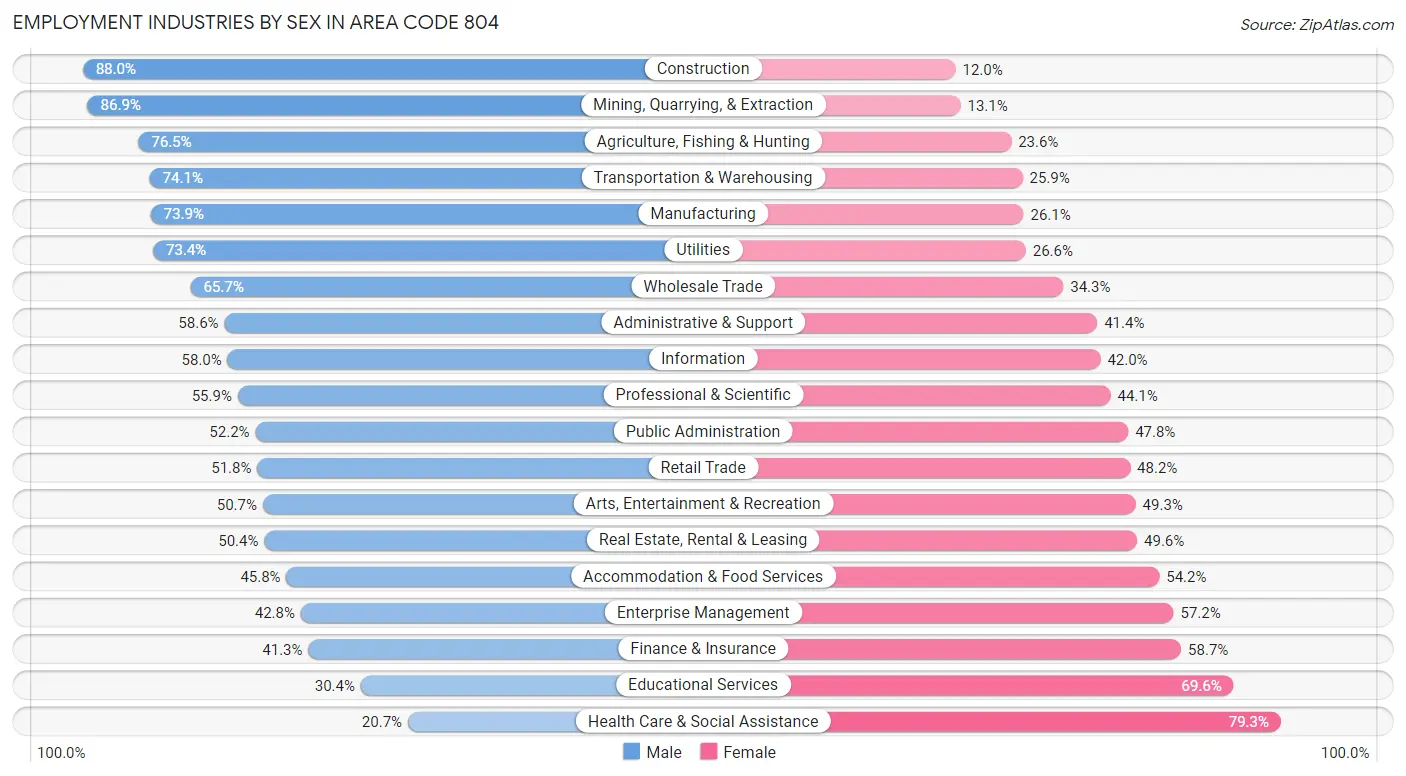
| Industry | Male | Female |
| Agriculture, Fishing & Hunting | 3,156 (76.4%) | 972 (23.5%) |
| Mining, Quarrying, & Extraction | 885 (86.9%) | 133 (13.1%) |
| Construction | 47,903 (88.0%) | 6,548 (12.0%) |
| Manufacturing | 37,225 (73.9%) | 13,145 (26.1%) |
| Wholesale Trade | 12,075 (65.7%) | 6,315 (34.3%) |
| Retail Trade | 40,714 (51.8%) | 37,844 (48.2%) |
| Transportation & Warehousing | 23,896 (74.1%) | 8,349 (25.9%) |
| Utilities | 6,316 (73.4%) | 2,285 (26.6%) |
| Information | 6,055 (58.0%) | 4,388 (42.0%) |
| Finance & Insurance | 22,138 (41.3%) | 31,508 (58.7%) |
| Real Estate, Rental & Leasing | 7,039 (50.4%) | 6,931 (49.6%) |
| Professional & Scientific | 32,334 (55.9%) | 25,515 (44.1%) |
| Enterprise Management | 341 (42.8%) | 455 (57.2%) |
| Administrative & Support | 17,446 (58.6%) | 12,307 (41.4%) |
| Educational Services | 19,967 (30.4%) | 45,702 (69.6%) |
| Health Care & Social Assistance | 20,779 (20.7%) | 79,781 (79.3%) |
| Arts, Entertainment & Recreation | 7,353 (50.7%) | 7,152 (49.3%) |
| Accommodation & Food Services | 19,848 (45.8%) | 23,490 (54.2%) |
| Public Administration | 27,352 (52.2%) | 25,019 (47.8%) |
| Total | 369,048 (50.8%) | 356,817 (49.2%) |
Education in Area Code 804
School Enrollment in Area Code 804
The most common levels of schooling among the 333,533 students in Area Code 804 are high school (74,141 | 22.2%), college / undergraduate (69,965 | 21.0%), and middle school (69,229 | 20.8%).
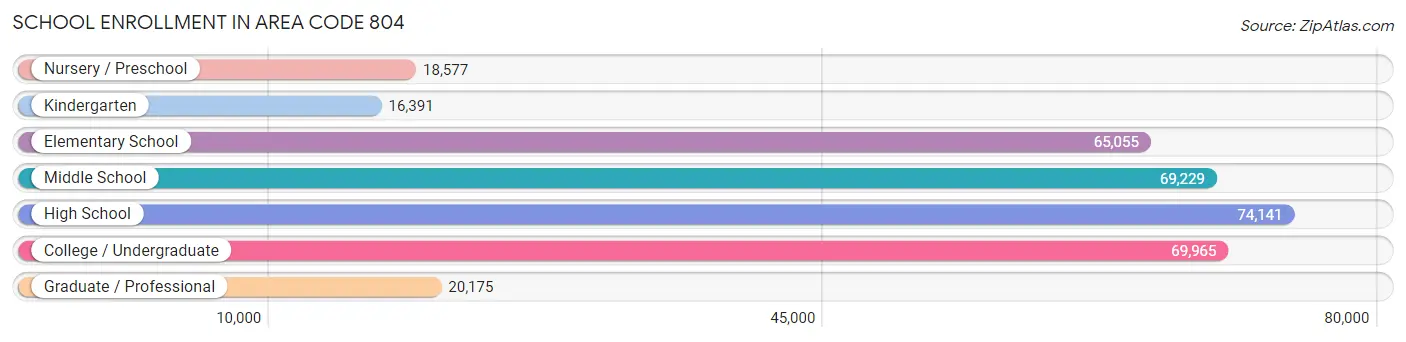
| School Level | # Students | % Students |
| Nursery / Preschool | 18,577 | 5.6% |
| Kindergarten | 16,391 | 4.9% |
| Elementary School | 65,055 | 19.5% |
| Middle School | 69,229 | 20.8% |
| High School | 74,141 | 22.2% |
| College / Undergraduate | 69,965 | 21.0% |
| Graduate / Professional | 20,175 | 6.0% |
| Total | 333,533 | 100.0% |
School Enrollment by Age by Funding Source in Area Code 804
Out of a total of 333,533 students who are enrolled in schools in Area Code 804, 56,902 (17.1%) attend a private institution, while the remaining 276,631 (82.9%) are enrolled in public schools. The age group of 3 to 4 year olds has the highest likelihood of being enrolled in private schools, with 8,080 (55.9% in the age bracket) enrolled. Conversely, the age group of 15 to 17 year olds has the lowest likelihood of being enrolled in a private school, with 46,730 (90.6% in the age bracket) attending a public institution.
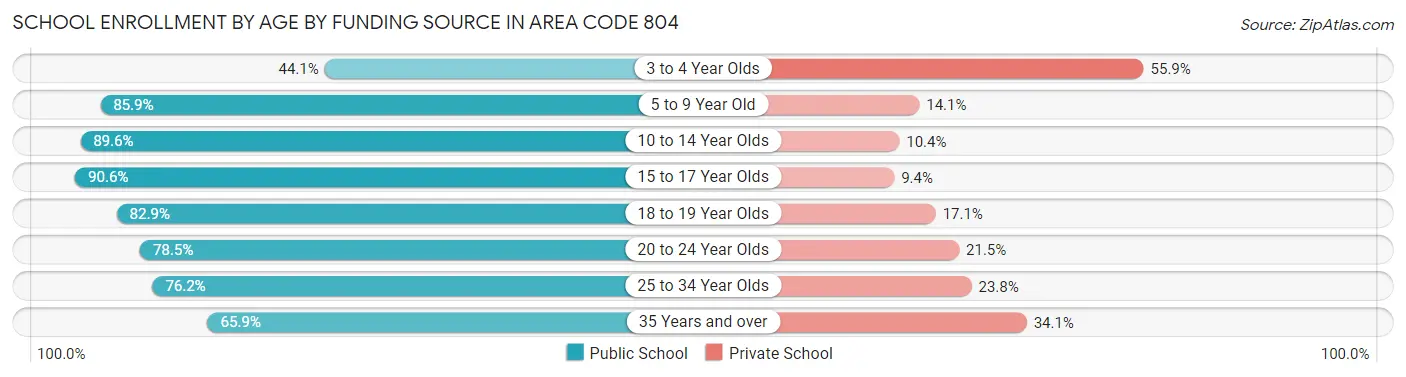
| Age Bracket | Public School | Private School |
| 3 to 4 Year Olds | 6,381 (44.1%) | 8,080 (55.9%) |
| 5 to 9 Year Old | 66,396 (85.9%) | 10,894 (14.1%) |
| 10 to 14 Year Olds | 76,507 (89.6%) | 8,841 (10.4%) |
| 15 to 17 Year Olds | 46,730 (90.6%) | 4,857 (9.4%) |
| 18 to 19 Year Olds | 24,470 (82.9%) | 5,060 (17.1%) |
| 20 to 24 Year Olds | 26,685 (78.5%) | 7,310 (21.5%) |
| 25 to 34 Year Olds | 16,411 (76.2%) | 5,130 (23.8%) |
| 35 Years and over | 13,037 (65.9%) | 6,744 (34.1%) |
| Total | 276,631 (82.9%) | 56,902 (17.1%) |
Educational Attainment by Field of Study in Area Code 804
Business (80,724 | 19.2%), social sciences (39,884 | 9.5%), education (38,639 | 9.2%), science & technology (37,248 | 8.9%), and arts & humanities (29,120 | 6.9%) are the most common fields of study among 420,110 individuals in Area Code 804 who have obtained a bachelor's degree or higher.
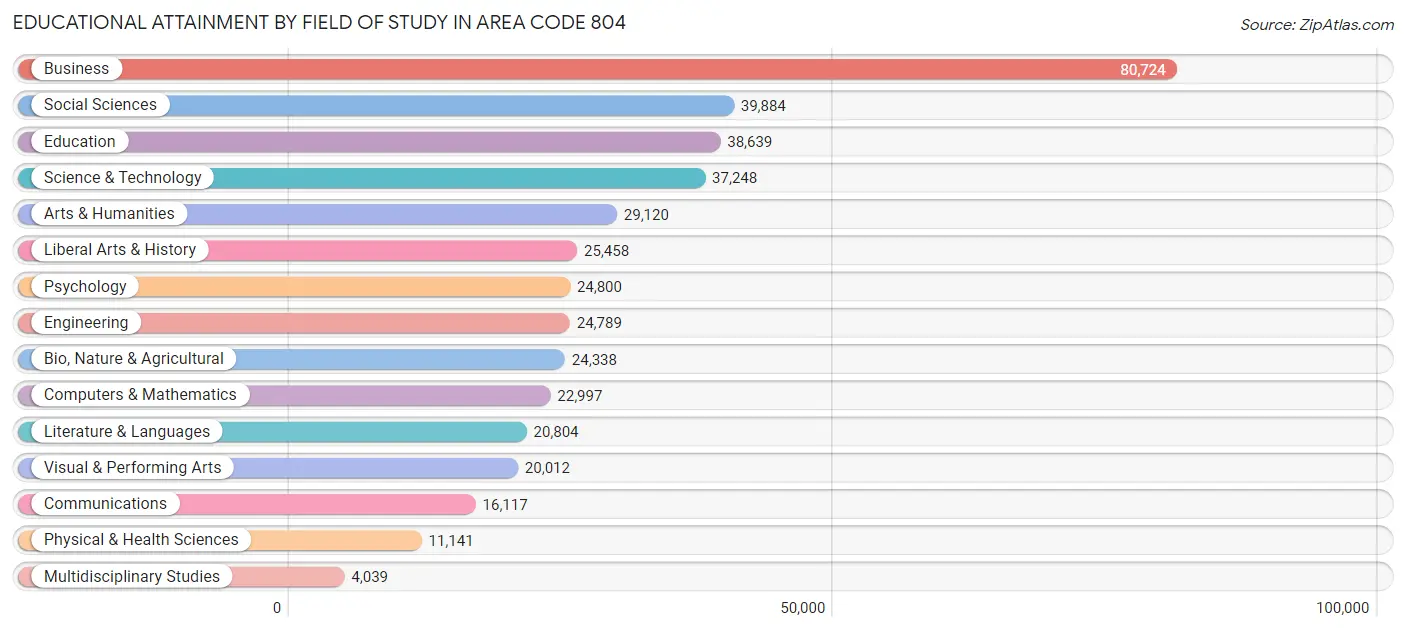
| Field of Study | # Graduates | % Graduates |
| Computers & Mathematics | 22,997 | 5.5% |
| Bio, Nature & Agricultural | 24,338 | 5.8% |
| Physical & Health Sciences | 11,141 | 2.6% |
| Psychology | 24,800 | 5.9% |
| Social Sciences | 39,884 | 9.5% |
| Engineering | 24,789 | 5.9% |
| Multidisciplinary Studies | 4,039 | 1.0% |
| Science & Technology | 37,248 | 8.9% |
| Business | 80,724 | 19.2% |
| Education | 38,639 | 9.2% |
| Literature & Languages | 20,804 | 5.0% |
| Liberal Arts & History | 25,458 | 6.1% |
| Visual & Performing Arts | 20,012 | 4.8% |
| Communications | 16,117 | 3.8% |
| Arts & Humanities | 29,120 | 6.9% |
| Total | 420,110 | 100.0% |
Transportation & Commute in Area Code 804
Vehicle Availability by Sex in Area Code 804
The most prevalent vehicle ownership categories in Area Code 804 are males with 2 vehicles (143,877, accounting for 39.3%) and females with 2 vehicles (129,525, making up 41.5%).
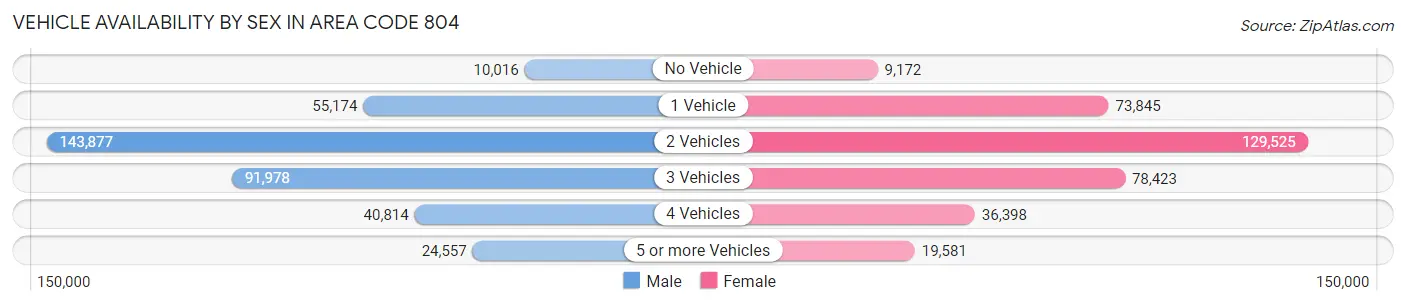
| Vehicles Available | Male | Female |
| No Vehicle | 10,016 (2.7%) | 9,172 (2.6%) |
| 1 Vehicle | 55,174 (15.1%) | 73,845 (21.3%) |
| 2 Vehicles | 143,877 (39.3%) | 129,525 (37.3%) |
| 3 Vehicles | 91,978 (25.1%) | 78,423 (22.6%) |
| 4 Vehicles | 40,814 (11.1%) | 36,398 (10.5%) |
| 5 or more Vehicles | 24,557 (6.7%) | 19,581 (5.6%) |
| Total | 366,416 (100.0%) | 346,944 (100.0%) |
Commute Time in Area Code 804
The most frequently occuring commute durations in Area Code 804 are 20 to 24 minutes (103,964 commuters, 16.8%), 15 to 19 minutes (100,614 commuters, 16.3%), and 30 to 34 minutes (95,982 commuters, 15.5%).
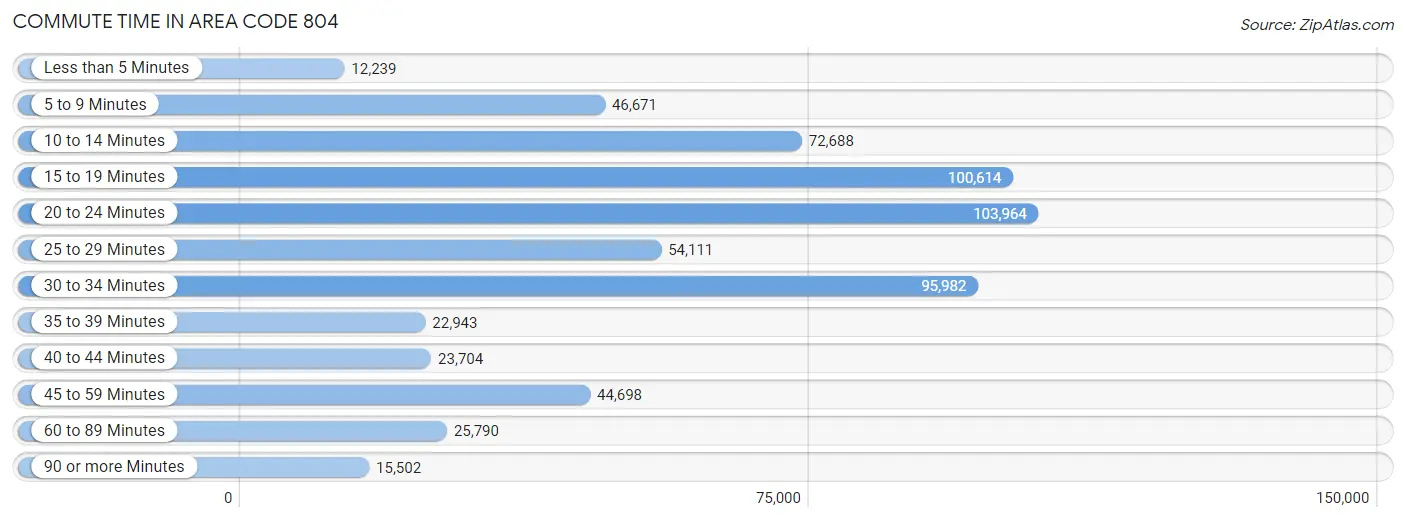
| Commute Time | # Commuters | % Commuters |
| Less than 5 Minutes | 12,239 | 2.0% |
| 5 to 9 Minutes | 46,671 | 7.5% |
| 10 to 14 Minutes | 72,688 | 11.7% |
| 15 to 19 Minutes | 100,614 | 16.3% |
| 20 to 24 Minutes | 103,964 | 16.8% |
| 25 to 29 Minutes | 54,111 | 8.7% |
| 30 to 34 Minutes | 95,982 | 15.5% |
| 35 to 39 Minutes | 22,943 | 3.7% |
| 40 to 44 Minutes | 23,704 | 3.8% |
| 45 to 59 Minutes | 44,698 | 7.2% |
| 60 to 89 Minutes | 25,790 | 4.2% |
| 90 or more Minutes | 15,502 | 2.5% |
Commute Time by Sex in Area Code 804
The most common commute times in Area Code 804 are 20 to 24 minutes (54,473 commuters, 16.9%) for males and 15 to 19 minutes (51,097 commuters, 17.2%) for females.
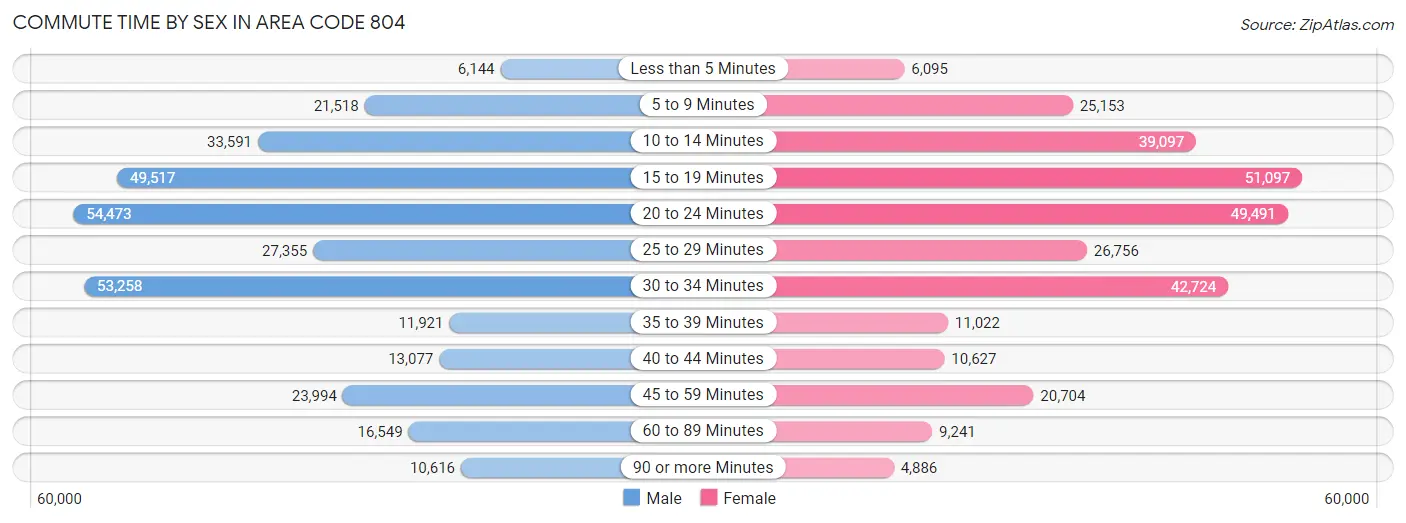
| Commute Time | Male | Female |
| Less than 5 Minutes | 6,144 (1.9%) | 6,095 (2.1%) |
| 5 to 9 Minutes | 21,518 (6.7%) | 25,153 (8.5%) |
| 10 to 14 Minutes | 33,591 (10.4%) | 39,097 (13.2%) |
| 15 to 19 Minutes | 49,517 (15.4%) | 51,097 (17.2%) |
| 20 to 24 Minutes | 54,473 (16.9%) | 49,491 (16.7%) |
| 25 to 29 Minutes | 27,355 (8.5%) | 26,756 (9.0%) |
| 30 to 34 Minutes | 53,258 (16.5%) | 42,724 (14.4%) |
| 35 to 39 Minutes | 11,921 (3.7%) | 11,022 (3.7%) |
| 40 to 44 Minutes | 13,077 (4.1%) | 10,627 (3.6%) |
| 45 to 59 Minutes | 23,994 (7.4%) | 20,704 (7.0%) |
| 60 to 89 Minutes | 16,549 (5.1%) | 9,241 (3.1%) |
| 90 or more Minutes | 10,616 (3.3%) | 4,886 (1.7%) |
Time of Departure to Work by Sex in Area Code 804
The most frequent times of departure to work in Area Code 804 are 7:00 AM to 7:29 AM (45,769, 14.2%) for males and 7:00 AM to 7:29 AM (47,963, 16.2%) for females.
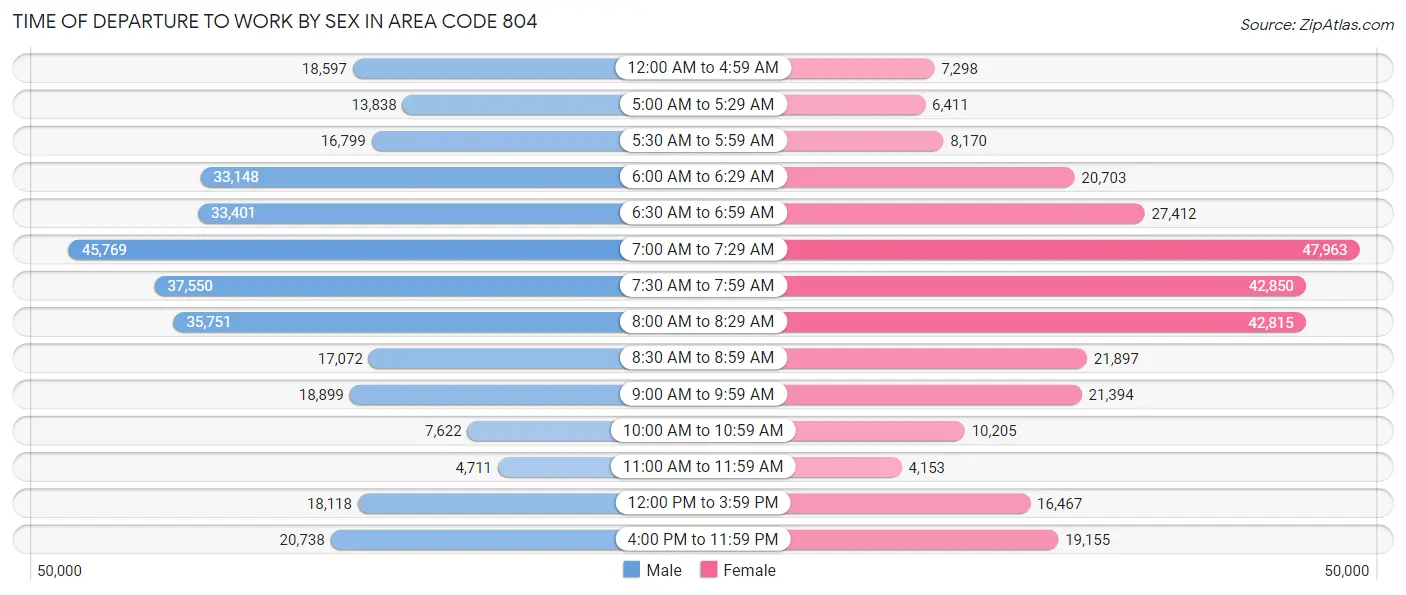
| Time of Departure | Male | Female |
| 12:00 AM to 4:59 AM | 18,597 (5.8%) | 7,298 (2.5%) |
| 5:00 AM to 5:29 AM | 13,838 (4.3%) | 6,411 (2.2%) |
| 5:30 AM to 5:59 AM | 16,799 (5.2%) | 8,170 (2.8%) |
| 6:00 AM to 6:29 AM | 33,148 (10.3%) | 20,703 (7.0%) |
| 6:30 AM to 6:59 AM | 33,401 (10.4%) | 27,412 (9.2%) |
| 7:00 AM to 7:29 AM | 45,769 (14.2%) | 47,963 (16.2%) |
| 7:30 AM to 7:59 AM | 37,550 (11.7%) | 42,850 (14.4%) |
| 8:00 AM to 8:29 AM | 35,751 (11.1%) | 42,815 (14.4%) |
| 8:30 AM to 8:59 AM | 17,072 (5.3%) | 21,897 (7.4%) |
| 9:00 AM to 9:59 AM | 18,899 (5.9%) | 21,394 (7.2%) |
| 10:00 AM to 10:59 AM | 7,622 (2.4%) | 10,205 (3.4%) |
| 11:00 AM to 11:59 AM | 4,711 (1.5%) | 4,153 (1.4%) |
| 12:00 PM to 3:59 PM | 18,118 (5.6%) | 16,467 (5.6%) |
| 4:00 PM to 11:59 PM | 20,738 (6.4%) | 19,155 (6.5%) |
| Total | 322,013 (100.0%) | 296,893 (100.0%) |
Housing Occupancy in Area Code 804
Occupancy by Ownership in Area Code 804
Of the total 568,966 dwellings in Area Code 804, owner-occupied units account for 387,652 (68.1%), while renter-occupied units make up 181,314 (31.9%).
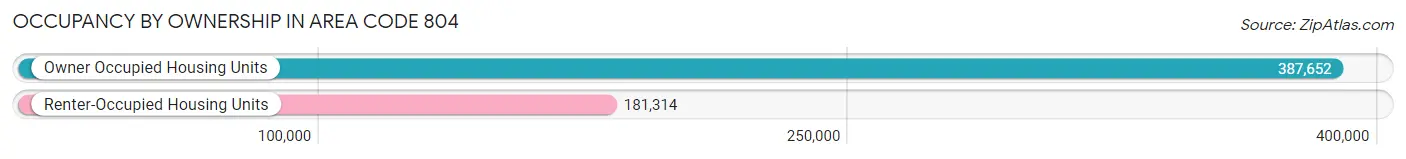
| Occupancy | # Housing Units | % Housing Units |
| Owner Occupied Housing Units | 387,652 | 68.1% |
| Renter-Occupied Housing Units | 181,314 | 31.9% |
| Total Occupied Housing Units | 568,966 | 100.0% |
Occupancy by Household Size in Area Code 804
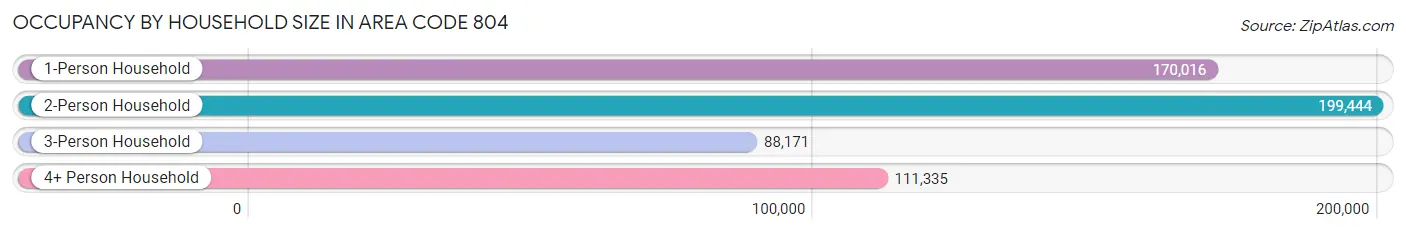
| Household Size | # Housing Units | % Housing Units |
| 1-Person Household | 170,016 | 29.9% |
| 2-Person Household | 199,444 | 35.0% |
| 3-Person Household | 88,171 | 15.5% |
| 4+ Person Household | 111,335 | 19.6% |
| Total Housing Units | 568,966 | 100.0% |
Occupancy by Ownership by Household Size in Area Code 804
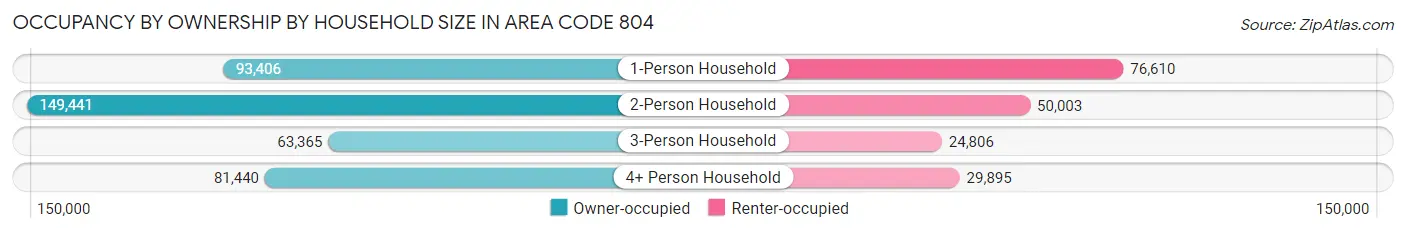
| Household Size | Owner-occupied | Renter-occupied |
| 1-Person Household | 93,406 (54.9%) | 76,610 (45.1%) |
| 2-Person Household | 149,441 (74.9%) | 50,003 (25.1%) |
| 3-Person Household | 63,365 (71.9%) | 24,806 (28.1%) |
| 4+ Person Household | 81,440 (73.2%) | 29,895 (26.9%) |
| Total Housing Units | 387,652 (68.1%) | 181,314 (31.9%) |
Occupancy by Educational Attainment in Area Code 804
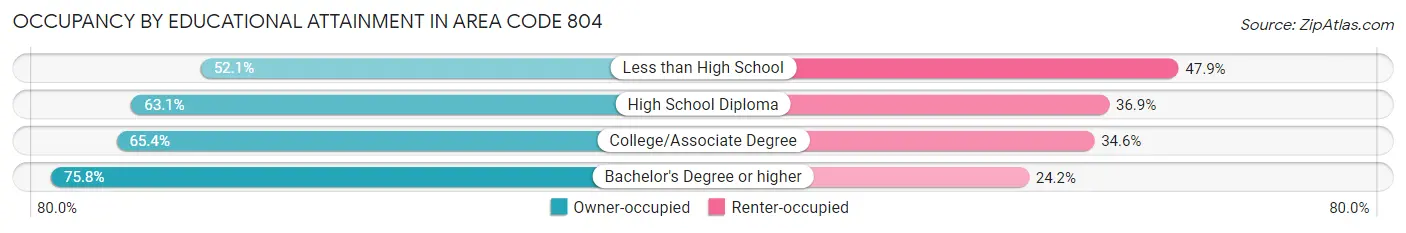
| Household Size | Owner-occupied | Renter-occupied |
| Less than High School | 23,079 (52.1%) | 21,249 (47.9%) |
| High School Diploma | 79,481 (63.1%) | 46,561 (36.9%) |
| College/Associate Degree | 107,272 (65.4%) | 56,702 (34.6%) |
| Bachelor's Degree or higher | 177,820 (75.8%) | 56,802 (24.2%) |
Occupancy by Age of Householder in Area Code 804
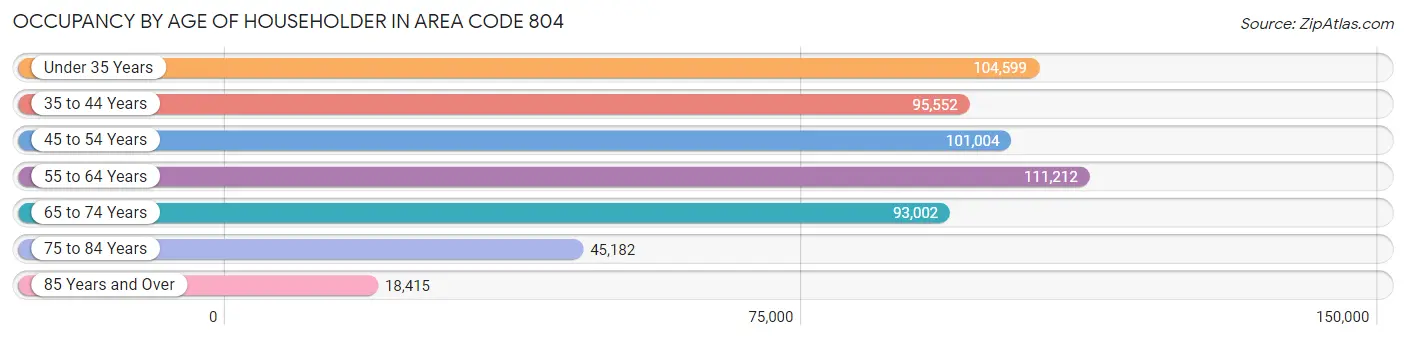
| Age Bracket | # Households | % Households |
| Under 35 Years | 104,599 | 18.4% |
| 35 to 44 Years | 95,552 | 16.8% |
| 45 to 54 Years | 101,004 | 17.7% |
| 55 to 64 Years | 111,212 | 19.6% |
| 65 to 74 Years | 93,002 | 16.4% |
| 75 to 84 Years | 45,182 | 7.9% |
| 85 Years and Over | 18,415 | 3.2% |
| Total | 568,966 | 100.0% |
Housing Finances in Area Code 804
Median Income by Occupancy in Area Code 804
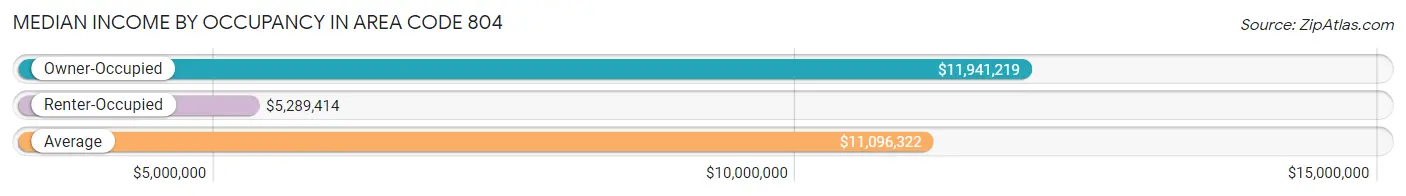
| Occupancy Type | # Households | Median Income |
| Owner-Occupied | 387,652 (68.1%) | $11,941,219 |
| Renter-Occupied | 181,314 (31.9%) | $5,289,414 |
| Average | 568,966 (100.0%) | $11,096,322 |
Occupancy by Householder Income Bracket in Area Code 804
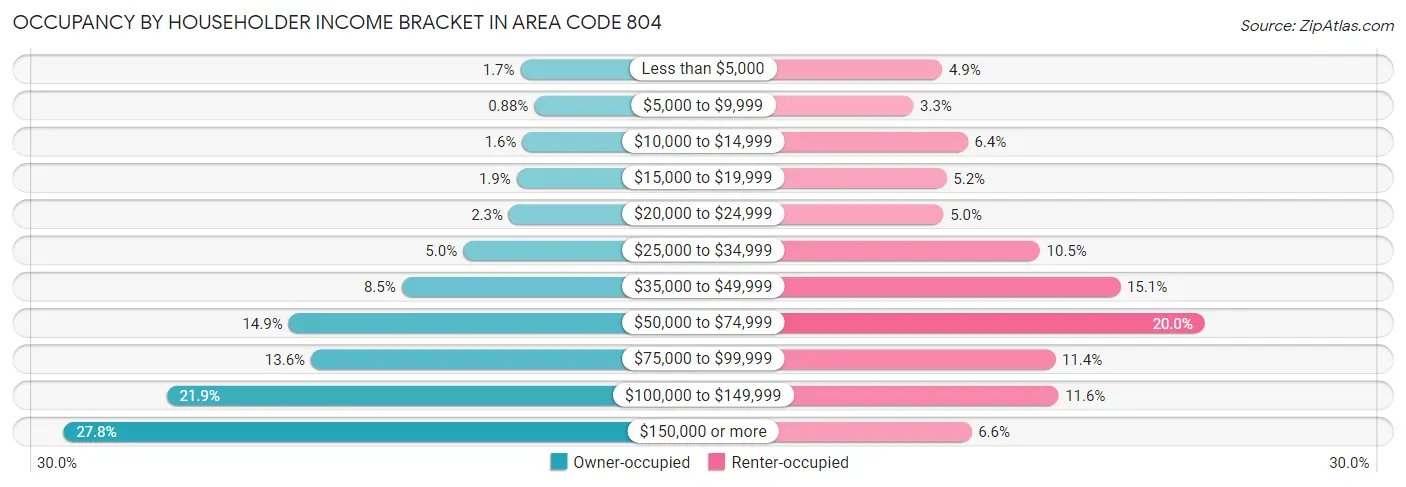
| Income Bracket | Owner-occupied | Renter-occupied |
| Less than $5,000 | 6,489 (1.7%) | 8,949 (4.9%) |
| $5,000 to $9,999 | 3,414 (0.9%) | 5,973 (3.3%) |
| $10,000 to $14,999 | 6,047 (1.6%) | 11,601 (6.4%) |
| $15,000 to $19,999 | 7,335 (1.9%) | 9,409 (5.2%) |
| $20,000 to $24,999 | 9,046 (2.3%) | 9,082 (5.0%) |
| $25,000 to $34,999 | 19,183 (5.0%) | 19,073 (10.5%) |
| $35,000 to $49,999 | 32,800 (8.5%) | 27,399 (15.1%) |
| $50,000 to $74,999 | 57,854 (14.9%) | 36,179 (20.0%) |
| $75,000 to $99,999 | 52,877 (13.6%) | 20,677 (11.4%) |
| $100,000 to $149,999 | 84,865 (21.9%) | 20,992 (11.6%) |
| $150,000 or more | 107,742 (27.8%) | 11,980 (6.6%) |
| Total | 387,652 (100.0%) | 181,314 (100.0%) |
Monthly Housing Cost Tiers in Area Code 804
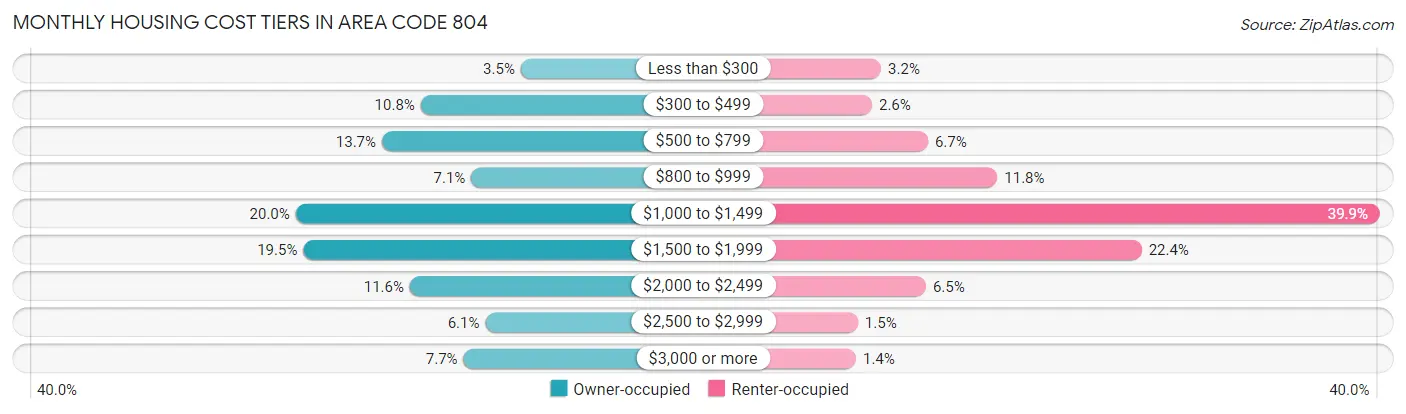
| Monthly Cost | Owner-occupied | Renter-occupied |
| Less than $300 | 13,402 (3.5%) | 5,832 (3.2%) |
| $300 to $499 | 41,977 (10.8%) | 4,630 (2.5%) |
| $500 to $799 | 53,062 (13.7%) | 12,090 (6.7%) |
| $800 to $999 | 27,557 (7.1%) | 21,351 (11.8%) |
| $1,000 to $1,499 | 77,701 (20.0%) | 72,423 (39.9%) |
| $1,500 to $1,999 | 75,526 (19.5%) | 40,640 (22.4%) |
| $2,000 to $2,499 | 45,098 (11.6%) | 11,827 (6.5%) |
| $2,500 to $2,999 | 23,546 (6.1%) | 2,742 (1.5%) |
| $3,000 or more | 29,783 (7.7%) | 2,479 (1.4%) |
| Total | 387,652 (100.0%) | 181,314 (100.0%) |
Physical Housing Characteristics in Area Code 804
Housing Structures in Area Code 804
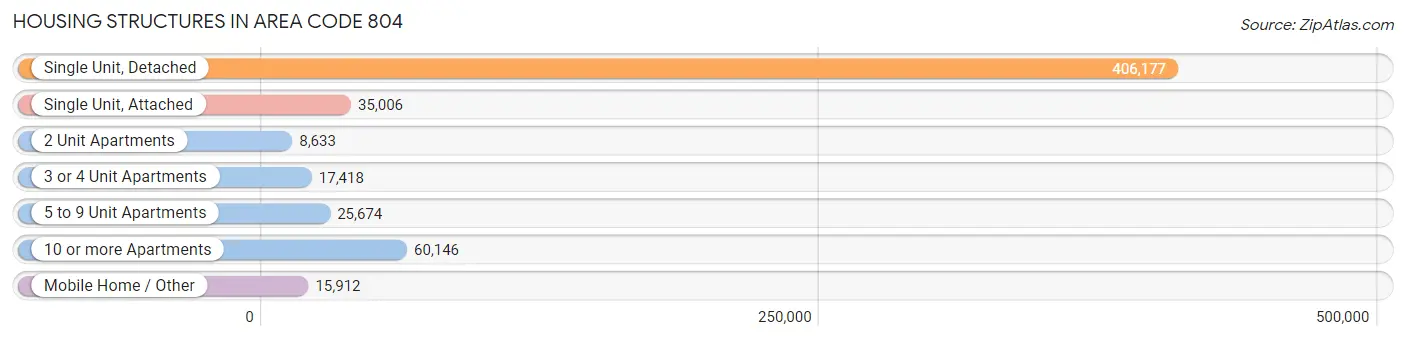
| Structure Type | # Housing Units | % Housing Units |
| Single Unit, Detached | 406,177 | 71.4% |
| Single Unit, Attached | 35,006 | 6.1% |
| 2 Unit Apartments | 8,633 | 1.5% |
| 3 or 4 Unit Apartments | 17,418 | 3.1% |
| 5 to 9 Unit Apartments | 25,674 | 4.5% |
| 10 or more Apartments | 60,146 | 10.6% |
| Mobile Home / Other | 15,912 | 2.8% |
| Total | 568,966 | 100.0% |
Housing Structures by Occupancy in Area Code 804
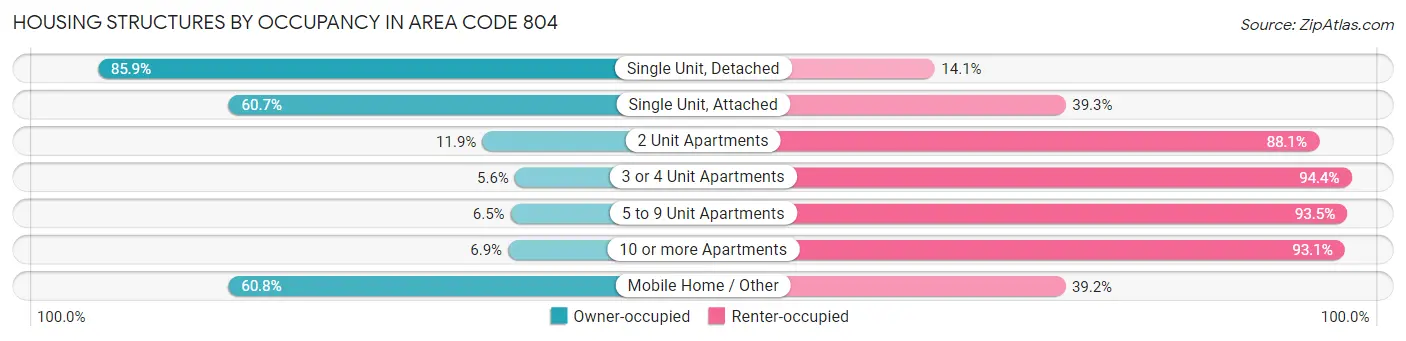
| Structure Type | Owner-occupied | Renter-occupied |
| Single Unit, Detached | 348,890 (85.9%) | 57,287 (14.1%) |
| Single Unit, Attached | 21,250 (60.7%) | 13,756 (39.3%) |
| 2 Unit Apartments | 1,027 (11.9%) | 7,606 (88.1%) |
| 3 or 4 Unit Apartments | 982 (5.6%) | 16,436 (94.4%) |
| 5 to 9 Unit Apartments | 1,658 (6.5%) | 24,016 (93.5%) |
| 10 or more Apartments | 4,175 (6.9%) | 55,971 (93.1%) |
| Mobile Home / Other | 9,670 (60.8%) | 6,242 (39.2%) |
| Total | 387,652 (68.1%) | 181,314 (31.9%) |
Housing Structures by Number of Rooms in Area Code 804
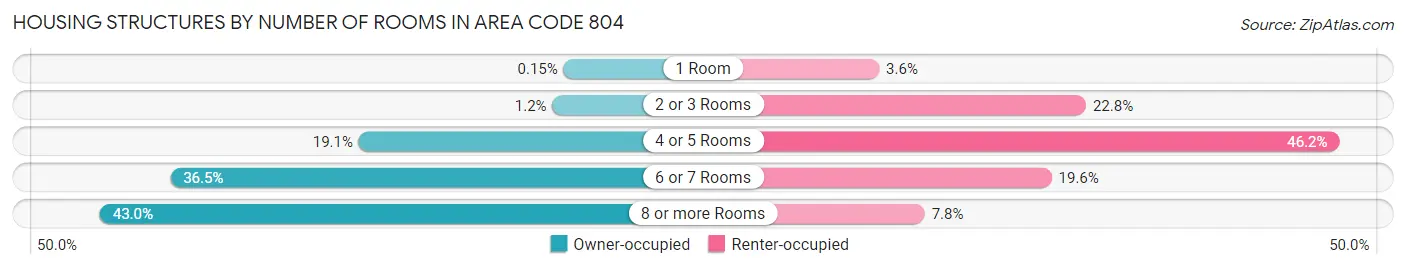
| Number of Rooms | Owner-occupied | Renter-occupied |
| 1 Room | 599 (0.2%) | 6,587 (3.6%) |
| 2 or 3 Rooms | 4,586 (1.2%) | 41,272 (22.8%) |
| 4 or 5 Rooms | 74,016 (19.1%) | 83,743 (46.2%) |
| 6 or 7 Rooms | 141,624 (36.5%) | 35,503 (19.6%) |
| 8 or more Rooms | 166,827 (43.0%) | 14,209 (7.8%) |
| Total | 387,652 (100.0%) | 181,314 (100.0%) |
Housing Structure by Heating Type in Area Code 804
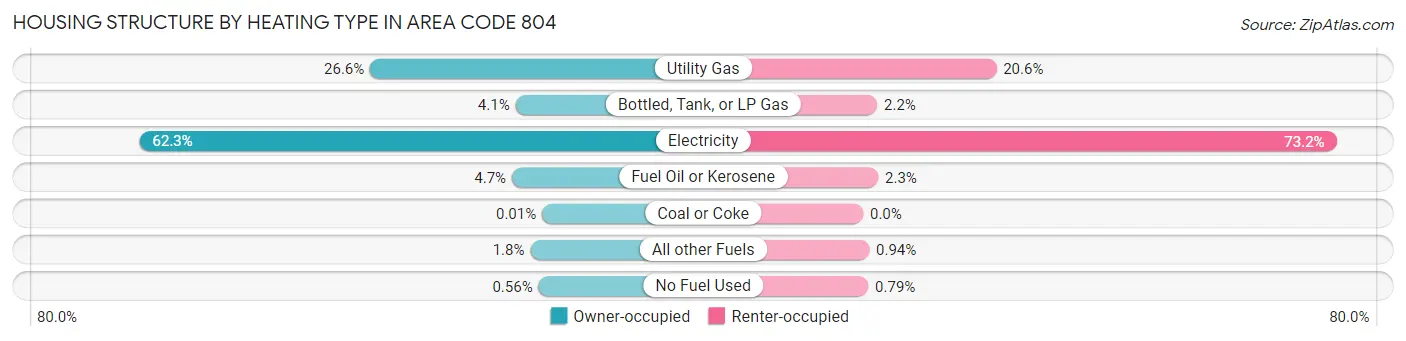
| Heating Type | Owner-occupied | Renter-occupied |
| Utility Gas | 103,060 (26.6%) | 37,334 (20.6%) |
| Bottled, Tank, or LP Gas | 15,937 (4.1%) | 3,934 (2.2%) |
| Electricity | 241,297 (62.3%) | 132,672 (73.2%) |
| Fuel Oil or Kerosene | 18,099 (4.7%) | 4,232 (2.3%) |
| Coal or Coke | 40 (0.0%) | 0 (0.0%) |
| All other Fuels | 7,053 (1.8%) | 1,704 (0.9%) |
| No Fuel Used | 2,166 (0.6%) | 1,438 (0.8%) |
| Total | 387,652 (100.0%) | 181,314 (100.0%) |
Household Vehicle Usage in Area Code 804
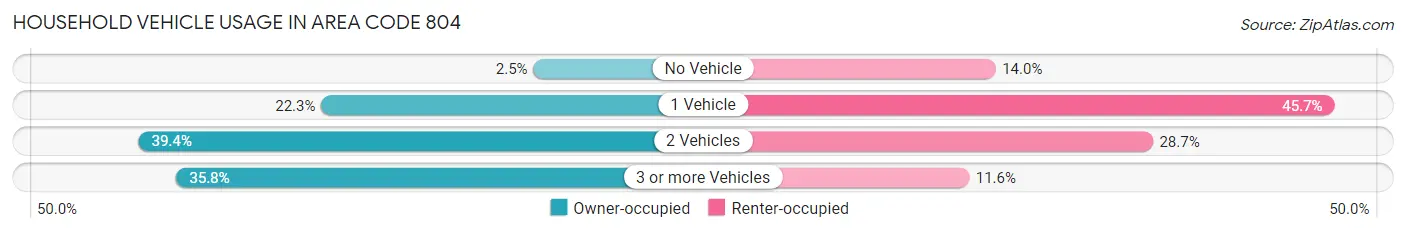
| Vehicles per Household | Owner-occupied | Renter-occupied |
| No Vehicle | 9,691 (2.5%) | 25,437 (14.0%) |
| 1 Vehicle | 86,462 (22.3%) | 82,850 (45.7%) |
| 2 Vehicles | 152,593 (39.4%) | 52,063 (28.7%) |
| 3 or more Vehicles | 138,906 (35.8%) | 20,964 (11.6%) |
| Total | 387,652 (100.0%) | 181,314 (100.0%) |
Real Estate & Mortgages in Area Code 804
Real Estate and Mortgage Overview in Area Code 804
| Characteristic | Without Mortgage | With Mortgage |
| Housing Units | 119,540 | 268,112 |
| Median Property Value | $33,649,998 | $39,794,100 |
| Median Household Income | $7,952,839 | $85,280 |
| Monthly Housing Costs | $67,023 | $29,398 |
| Real Estate Taxes | $227,574 | $7,797 |
Property Value by Mortgage Status in Area Code 804
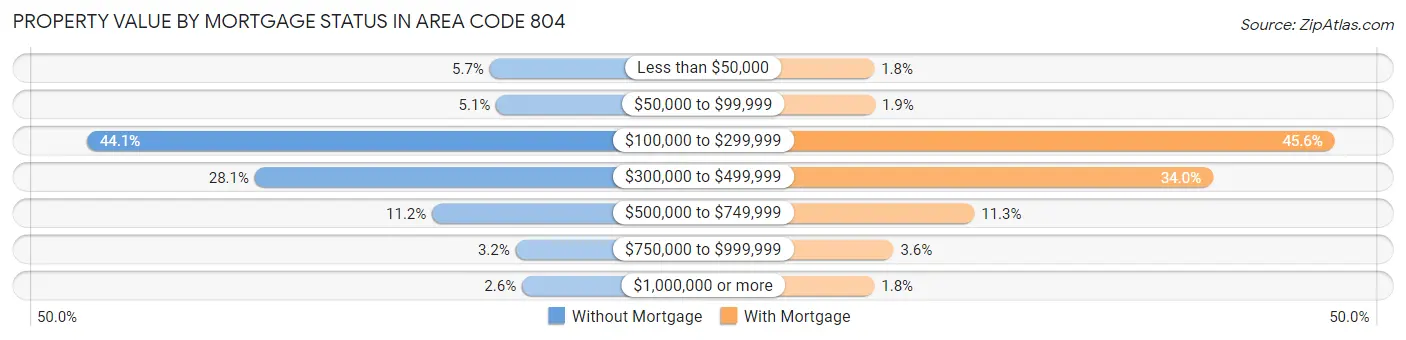
| Property Value | Without Mortgage | With Mortgage |
| Less than $50,000 | 6,822 (5.7%) | 4,761 (1.8%) |
| $50,000 to $99,999 | 6,082 (5.1%) | 4,952 (1.8%) |
| $100,000 to $299,999 | 52,664 (44.1%) | 122,332 (45.6%) |
| $300,000 to $499,999 | 33,565 (28.1%) | 91,260 (34.0%) |
| $500,000 to $749,999 | 13,382 (11.2%) | 30,329 (11.3%) |
| $750,000 to $999,999 | 3,877 (3.2%) | 9,683 (3.6%) |
| $1,000,000 or more | 3,148 (2.6%) | 4,795 (1.8%) |
| Total | 119,540 (100.0%) | 268,112 (100.0%) |
Household Income by Mortgage Status in Area Code 804
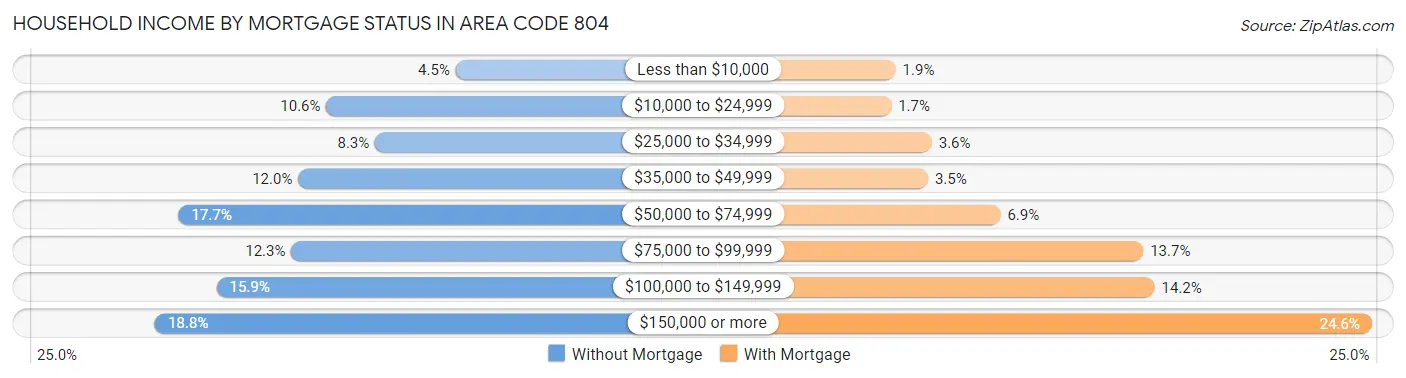
| Household Income | Without Mortgage | With Mortgage |
| Less than $10,000 | 5,347 (4.5%) | 5,130 (1.9%) |
| $10,000 to $24,999 | 12,703 (10.6%) | 4,556 (1.7%) |
| $25,000 to $34,999 | 9,939 (8.3%) | 9,725 (3.6%) |
| $35,000 to $49,999 | 14,312 (12.0%) | 9,244 (3.5%) |
| $50,000 to $74,999 | 21,122 (17.7%) | 18,488 (6.9%) |
| $75,000 to $99,999 | 14,698 (12.3%) | 36,732 (13.7%) |
| $100,000 to $149,999 | 18,957 (15.9%) | 38,179 (14.2%) |
| $150,000 or more | 22,462 (18.8%) | 65,908 (24.6%) |
| Total | 119,540 (100.0%) | 268,112 (100.0%) |
Property Value to Household Income Ratio in Area Code 804
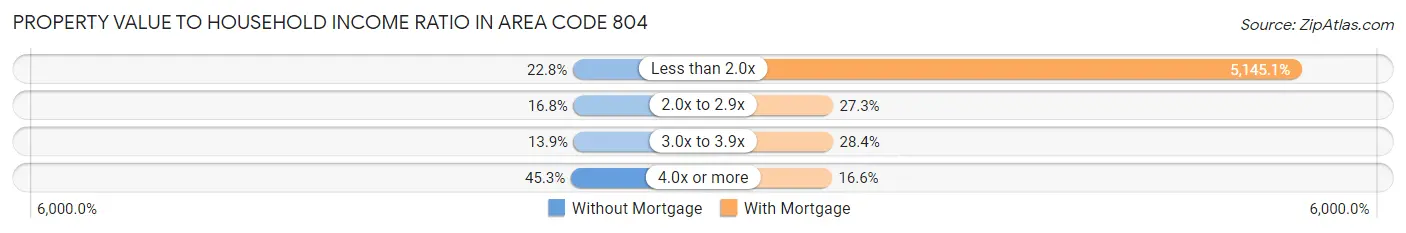
| Value-to-Income Ratio | Without Mortgage | With Mortgage |
| Less than 2.0x | 27,277 (22.8%) | 13,794,509 (5,145.0%) |
| 2.0x to 2.9x | 20,085 (16.8%) | 73,052 (27.3%) |
| 3.0x to 3.9x | 16,589 (13.9%) | 76,218 (28.4%) |
| 4.0x or more | 54,176 (45.3%) | 44,452 (16.6%) |
| Total | 119,540 (100.0%) | 268,112 (100.0%) |
Real Estate Taxes by Mortgage Status in Area Code 804
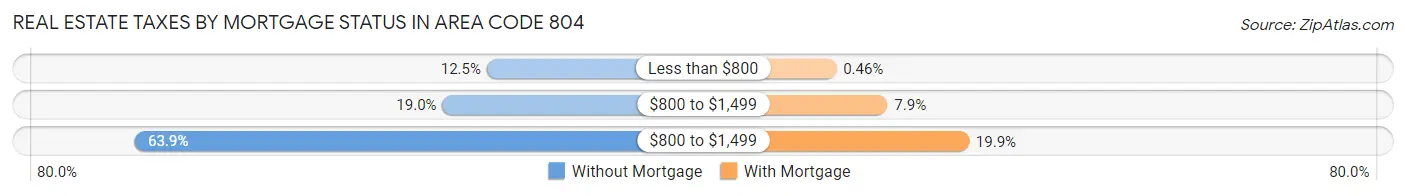
| Property Taxes | Without Mortgage | With Mortgage |
| Less than $800 | 14,906 (12.5%) | 1,243 (0.5%) |
| $800 to $1,499 | 22,654 (19.0%) | 21,300 (7.9%) |
| $800 to $1,499 | 76,340 (63.9%) | 53,229 (19.9%) |
| Total | 119,540 (100.0%) | 268,112 (100.0%) |
Health & Disability in Area Code 804
Health Insurance Coverage by Age in Area Code 804
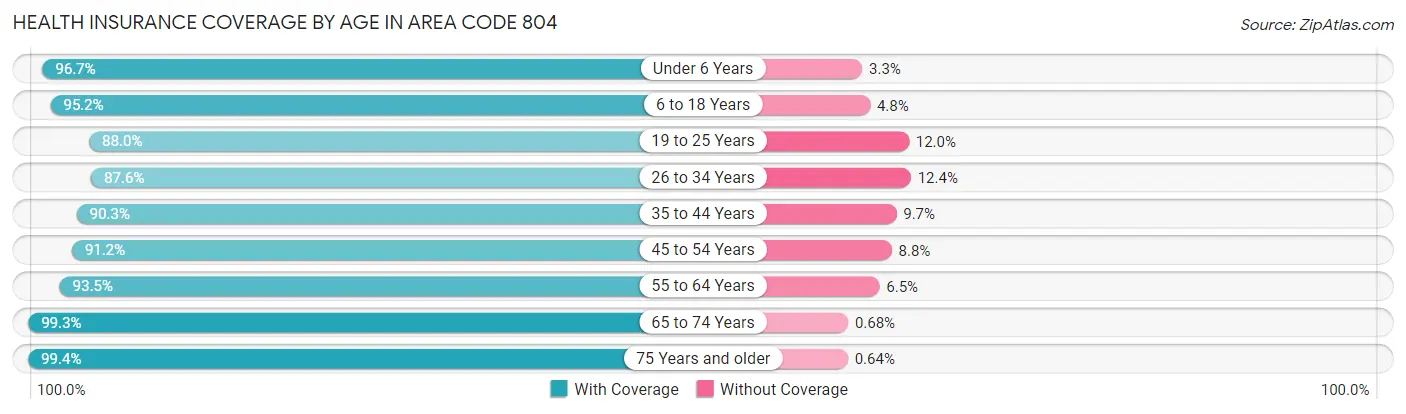
| Age Bracket | With Coverage | Without Coverage |
| Under 6 Years | 92,506 (96.7%) | 3,175 (3.3%) |
| 6 to 18 Years | 217,500 (95.2%) | 10,947 (4.8%) |
| 19 to 25 Years | 108,843 (88.0%) | 14,889 (12.0%) |
| 26 to 34 Years | 153,244 (87.6%) | 21,682 (12.4%) |
| 35 to 44 Years | 162,928 (90.3%) | 17,491 (9.7%) |
| 45 to 54 Years | 164,247 (91.2%) | 15,890 (8.8%) |
| 55 to 64 Years | 181,193 (93.5%) | 12,688 (6.5%) |
| 65 to 74 Years | 145,679 (99.3%) | 997 (0.7%) |
| 75 Years and older | 94,004 (99.4%) | 604 (0.6%) |
| Total | 1,320,144 (93.1%) | 98,363 (6.9%) |
Health Insurance Coverage by Citizenship Status in Area Code 804
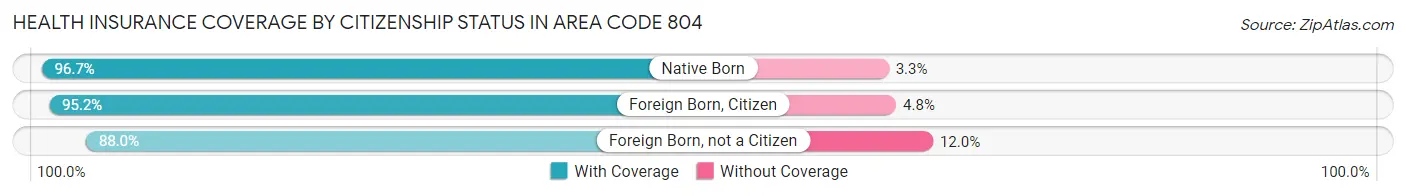
| Citizenship Status | With Coverage | Without Coverage |
| Native Born | 92,506 (96.7%) | 3,175 (3.3%) |
| Foreign Born, Citizen | 217,500 (95.2%) | 10,947 (4.8%) |
| Foreign Born, not a Citizen | 108,843 (88.0%) | 14,889 (12.0%) |
Health Insurance Coverage by Household Income in Area Code 804
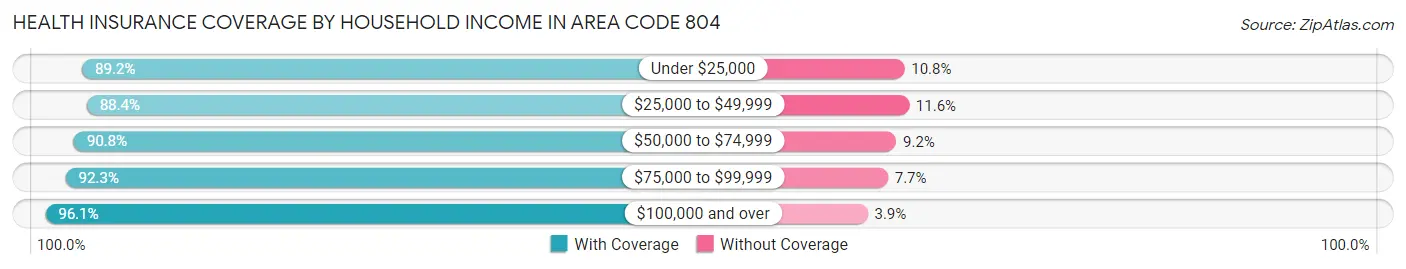
| Household Income | With Coverage | Without Coverage |
| Under $25,000 | 117,981 (89.2%) | 14,250 (10.8%) |
| $25,000 to $49,999 | 168,308 (88.4%) | 22,177 (11.6%) |
| $50,000 to $74,999 | 194,977 (90.8%) | 19,832 (9.2%) |
| $75,000 to $99,999 | 174,544 (92.3%) | 14,520 (7.7%) |
| $100,000 and over | 651,535 (96.1%) | 26,266 (3.9%) |
Public vs Private Health Insurance Coverage by Age in Area Code 804
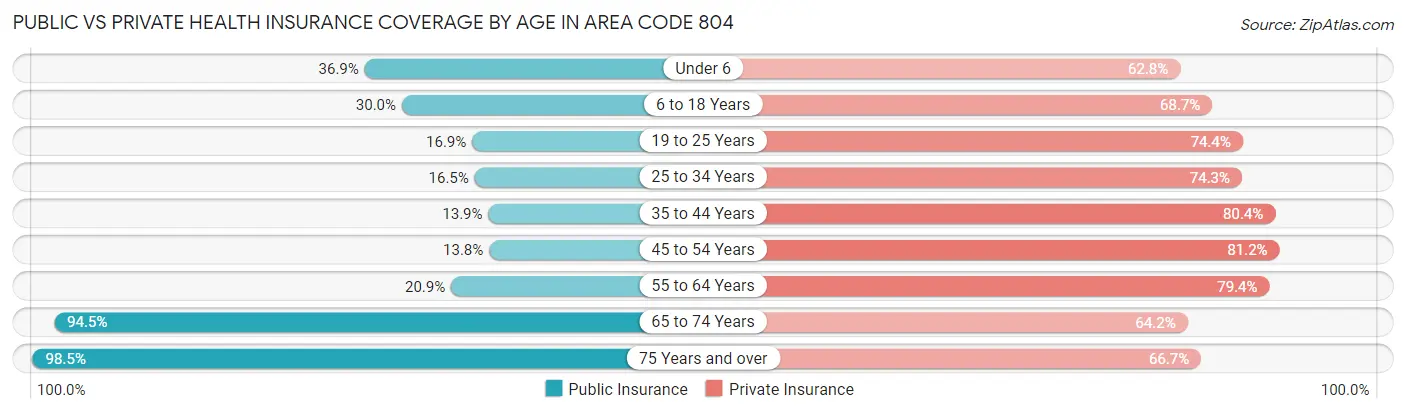
| Age Bracket | Public Insurance | Private Insurance |
| Under 6 | 35,293 (36.9%) | 60,081 (62.8%) |
| 6 to 18 Years | 68,490 (30.0%) | 157,025 (68.7%) |
| 19 to 25 Years | 20,955 (16.9%) | 92,068 (74.4%) |
| 25 to 34 Years | 28,816 (16.5%) | 129,890 (74.3%) |
| 35 to 44 Years | 25,112 (13.9%) | 145,109 (80.4%) |
| 45 to 54 Years | 24,822 (13.8%) | 146,325 (81.2%) |
| 55 to 64 Years | 40,432 (20.8%) | 153,861 (79.4%) |
| 65 to 74 Years | 138,654 (94.5%) | 94,121 (64.2%) |
| 75 Years and over | 93,218 (98.5%) | 63,079 (66.7%) |
| Total | 475,792 (33.5%) | 1,041,559 (73.4%) |
Disability Status by Sex by Age in Area Code 804
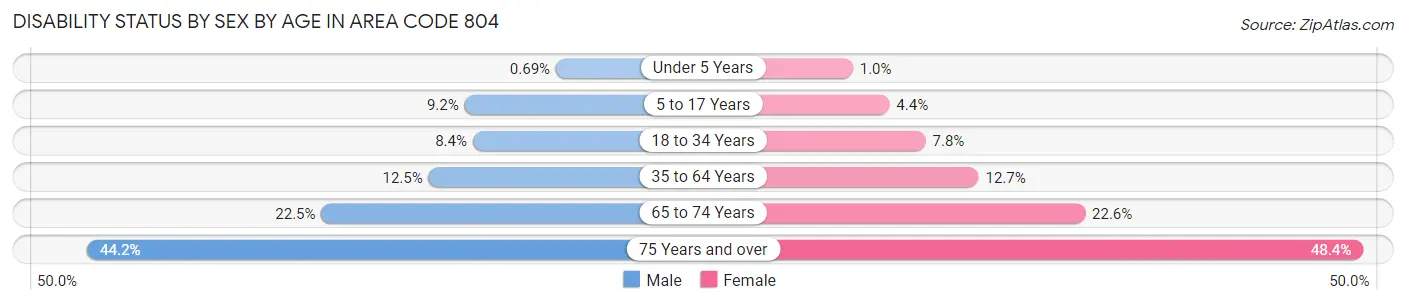
| Age Bracket | Male | Female |
| Under 5 Years | 284 (0.7%) | 394 (1.0%) |
| 5 to 17 Years | 10,544 (9.2%) | 4,778 (4.4%) |
| 18 to 34 Years | 13,082 (8.4%) | 12,783 (7.8%) |
| 35 to 64 Years | 33,263 (12.5%) | 36,614 (12.7%) |
| 65 to 74 Years | 15,132 (22.5%) | 17,906 (22.6%) |
| 75 Years and over | 17,120 (44.2%) | 27,025 (48.4%) |
Disability Class by Sex by Age in Area Code 804
Disability Class: Hearing Difficulty
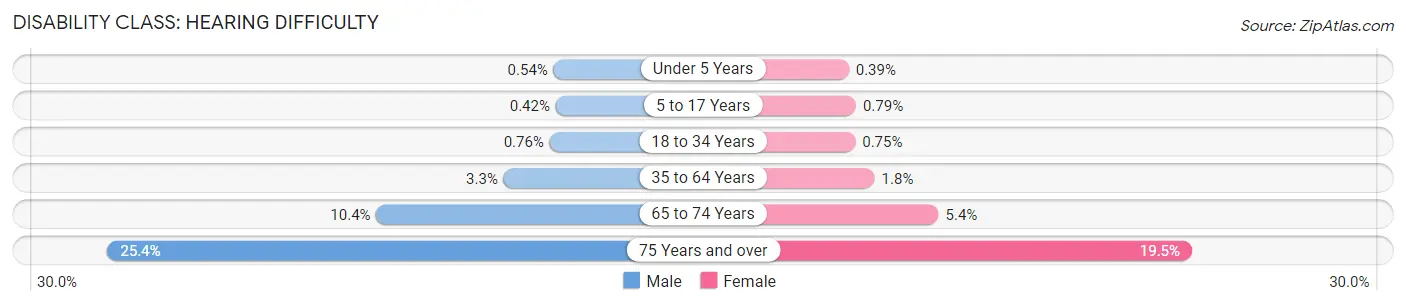
| Age Bracket | Male | Female |
| Under 5 Years | 221 (0.5%) | 149 (0.4%) |
| 5 to 17 Years | 488 (0.4%) | 856 (0.8%) |
| 18 to 34 Years | 1,185 (0.8%) | 1,226 (0.7%) |
| 35 to 64 Years | 8,816 (3.3%) | 5,293 (1.8%) |
| 65 to 74 Years | 7,012 (10.4%) | 4,272 (5.4%) |
| 75 Years and over | 9,837 (25.4%) | 10,888 (19.5%) |
Disability Class: Vision Difficulty
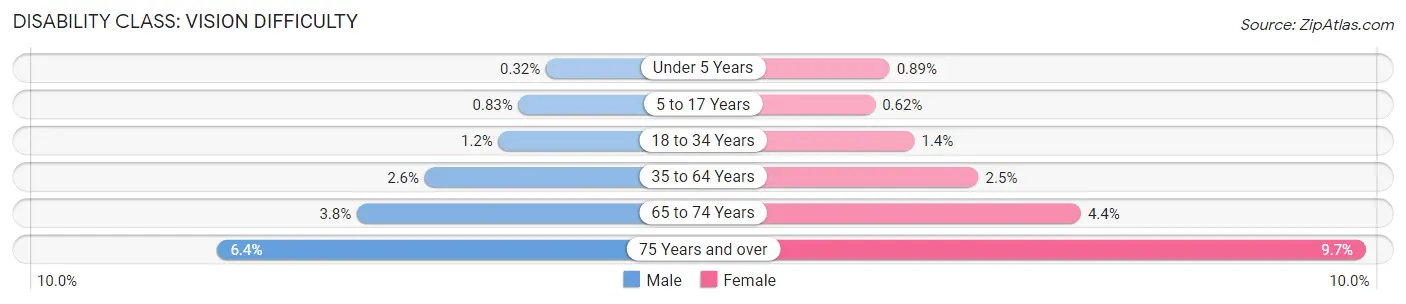
| Age Bracket | Male | Female |
| Under 5 Years | 130 (0.3%) | 342 (0.9%) |
| 5 to 17 Years | 952 (0.8%) | 667 (0.6%) |
| 18 to 34 Years | 1,874 (1.2%) | 2,212 (1.3%) |
| 35 to 64 Years | 6,831 (2.6%) | 7,326 (2.5%) |
| 65 to 74 Years | 2,578 (3.8%) | 3,521 (4.4%) |
| 75 Years and over | 2,487 (6.4%) | 5,424 (9.7%) |
Disability Class: Cognitive Difficulty
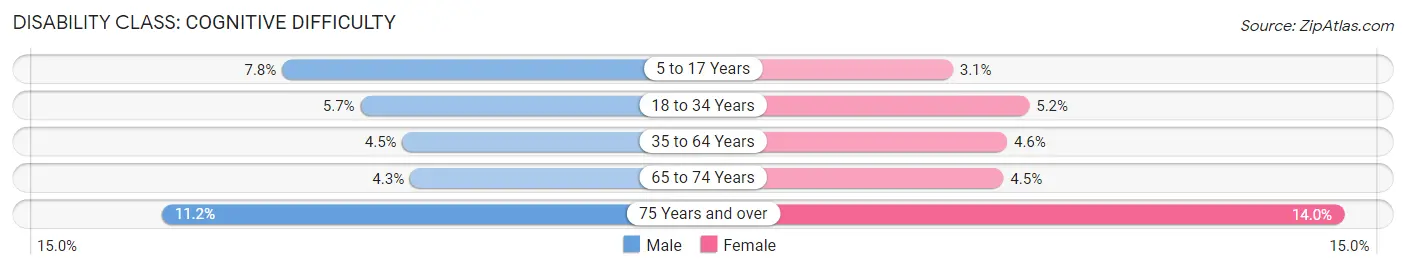
| Age Bracket | Male | Female |
| 5 to 17 Years | 9,002 (7.8%) | 3,344 (3.1%) |
| 18 to 34 Years | 8,801 (5.7%) | 8,586 (5.2%) |
| 35 to 64 Years | 11,908 (4.5%) | 13,272 (4.6%) |
| 65 to 74 Years | 2,877 (4.3%) | 3,566 (4.5%) |
| 75 Years and over | 4,333 (11.2%) | 7,808 (14.0%) |
Disability Class: Ambulatory Difficulty
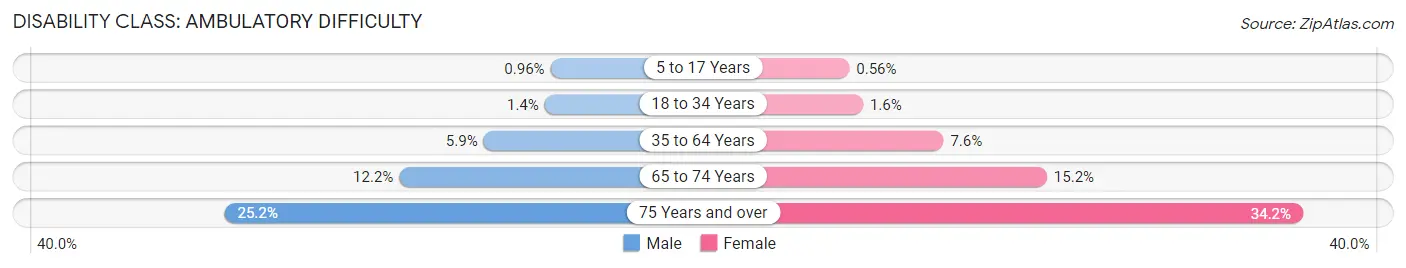
| Age Bracket | Male | Female |
| 5 to 17 Years | 1,106 (1.0%) | 601 (0.6%) |
| 18 to 34 Years | 2,164 (1.4%) | 2,582 (1.6%) |
| 35 to 64 Years | 15,759 (5.9%) | 21,796 (7.5%) |
| 65 to 74 Years | 8,217 (12.2%) | 12,074 (15.2%) |
| 75 Years and over | 9,745 (25.2%) | 19,121 (34.2%) |
Disability Class: Self-Care Difficulty
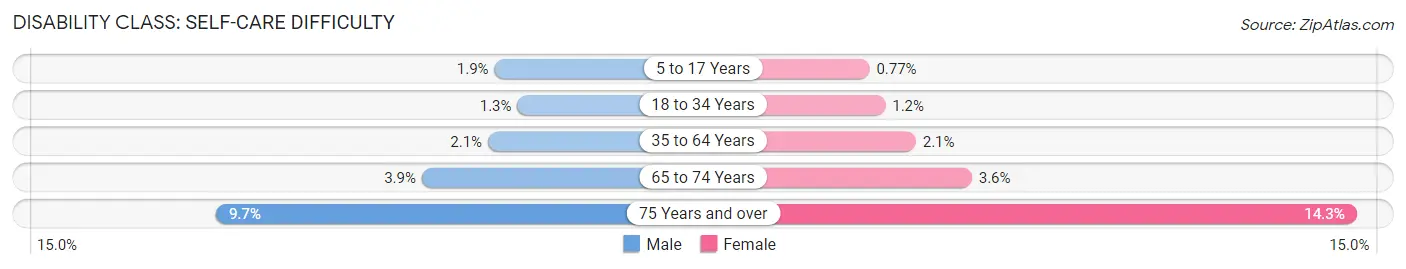
| Age Bracket | Male | Female |
| 5 to 17 Years | 2,210 (1.9%) | 827 (0.8%) |
| 18 to 34 Years | 1,994 (1.3%) | 1,987 (1.2%) |
| 35 to 64 Years | 5,587 (2.1%) | 5,952 (2.1%) |
| 65 to 74 Years | 2,658 (3.9%) | 2,868 (3.6%) |
| 75 Years and over | 3,748 (9.7%) | 8,008 (14.3%) |
Technology Access in Area Code 804
Computing Device Access in Area Code 804
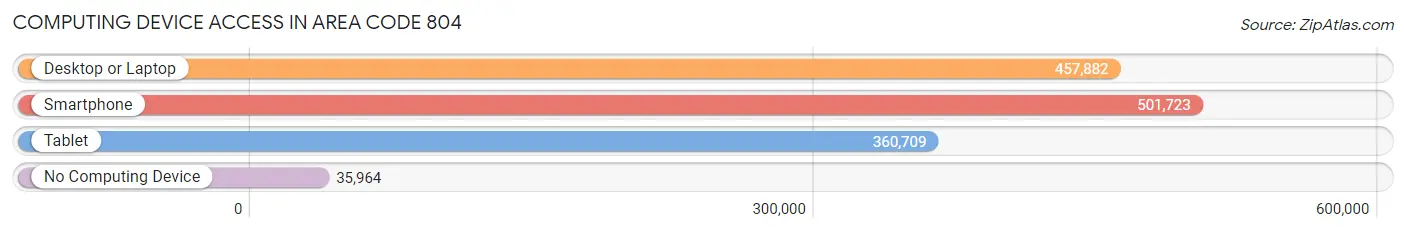
| Device Type | # Households | % Households |
| Desktop or Laptop | 457,882 | 80.5% |
| Smartphone | 501,723 | 88.2% |
| Tablet | 360,709 | 63.4% |
| No Computing Device | 35,964 | 6.3% |
| Total | 568,966 | 100.0% |
Internet Access in Area Code 804
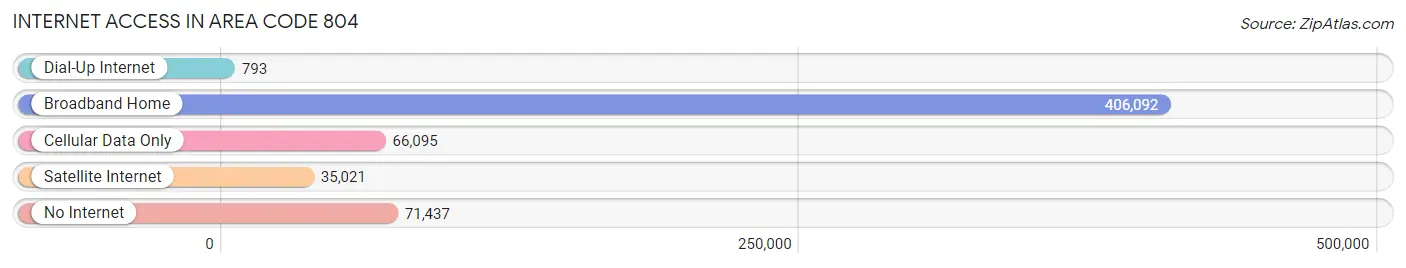
| Internet Type | # Households | % Households |
| Dial-Up Internet | 793 | 0.1% |
| Broadband Home | 406,092 | 71.4% |
| Cellular Data Only | 66,095 | 11.6% |
| Satellite Internet | 35,021 | 6.2% |
| No Internet | 71,437 | 12.6% |
| Total | 568,966 | 100.0% |
Area Code 804 Summary
Geography
Area code 804 is located in the state of Virginia and covers the entire Richmond metropolitan area, as well as parts of the Hampton Roads area. It also covers the counties of Amelia, Charles City, Chesterfield, Dinwiddie, Goochland, Hanover, Henrico, King and Queen, New Kent, Powhatan, Prince George, and Sussex.
Social
Area code 804 is home to a diverse population of people from all walks of life. The area is known for its rich history and culture, and is home to many museums, galleries, and other attractions. The area is also home to a number of universities and colleges, making it a great place to live and learn.
Economics
Area code 804 is a major economic hub in the state of Virginia. The area is home to a number of large corporations, including Dominion Energy, Altria, and Capital One. The area is also home to a number of small businesses, making it a great place to start a business.
Demographics
Area code 804 is home to a population of over 1.7 million people. The area is predominantly white, with African Americans making up the second largest racial group. The area is also home to a large number of immigrants, with the largest groups coming from Mexico, India, and China. The median household income in the area is $60,000, and the median home value is $220,000.
Common Questions
What is Per Capita Income in Area Code 804?
Per Capita income in Area Code 804 is $40,848.
What is the Median Family Income in Area Code 804?
Median Family Income in Area Code 804 is $99,123.
What is the Median Household income in Area Code 804?
Median Household Income in Area Code 804 is $80,995.
What is Income or Wage Gap in Area Code 804?
Income or Wage Gap in Area Code 804 is 27.9%.
Women in Area Code 804 earn 72.1 cents for every dollar earned by a man.
What is Family Income Deficit in Area Code 804?
Family Income Deficit in Area Code 804 is $9,351.
Families that are below poverty line in Area Code 804 earn $9,351 less on average than the poverty threshold level.
What is Inequality or Gini Index in Area Code 804?
Inequality or Gini Index in Area Code 804 is 58.52.
What is the Total Population of Area Code 804?
Total Population of Area Code 804 is 1,448,414.
What is the Total Male Population of Area Code 804?
Total Male Population of Area Code 804 is 707,461.
What is the Total Female Population of Area Code 804?
Total Female Population of Area Code 804 is 740,953.
What is the Ratio of Males per 100 Females in Area Code 804?
There are 95.48 Males per 100 Females in Area Code 804.
What is the Ratio of Females per 100 Males in Area Code 804?
There are 104.73 Females per 100 Males in Area Code 804.
What is the Median Population Age in Area Code 804?
Median Population Age in Area Code 804 is 46.3 Years.
What is the Average Family Size in Area Code 804
Average Family Size in Area Code 804 is 3.0 People.
What is the Average Household Size in Area Code 804
Average Household Size in Area Code 804 is 2.4 People.
How Large is the Labor Force in Area Code 804?
There are 691,023 People in the Labor Forcein in Area Code 804.
What is the Percentage of People in the Labor Force in Area Code 804?
58.6% of People are in the Labor Force in Area Code 804.
What is the Unemployment Rate in Area Code 804?
Unemployment Rate in Area Code 804 is 6.5%.