Area Code 434 Map & Demographics
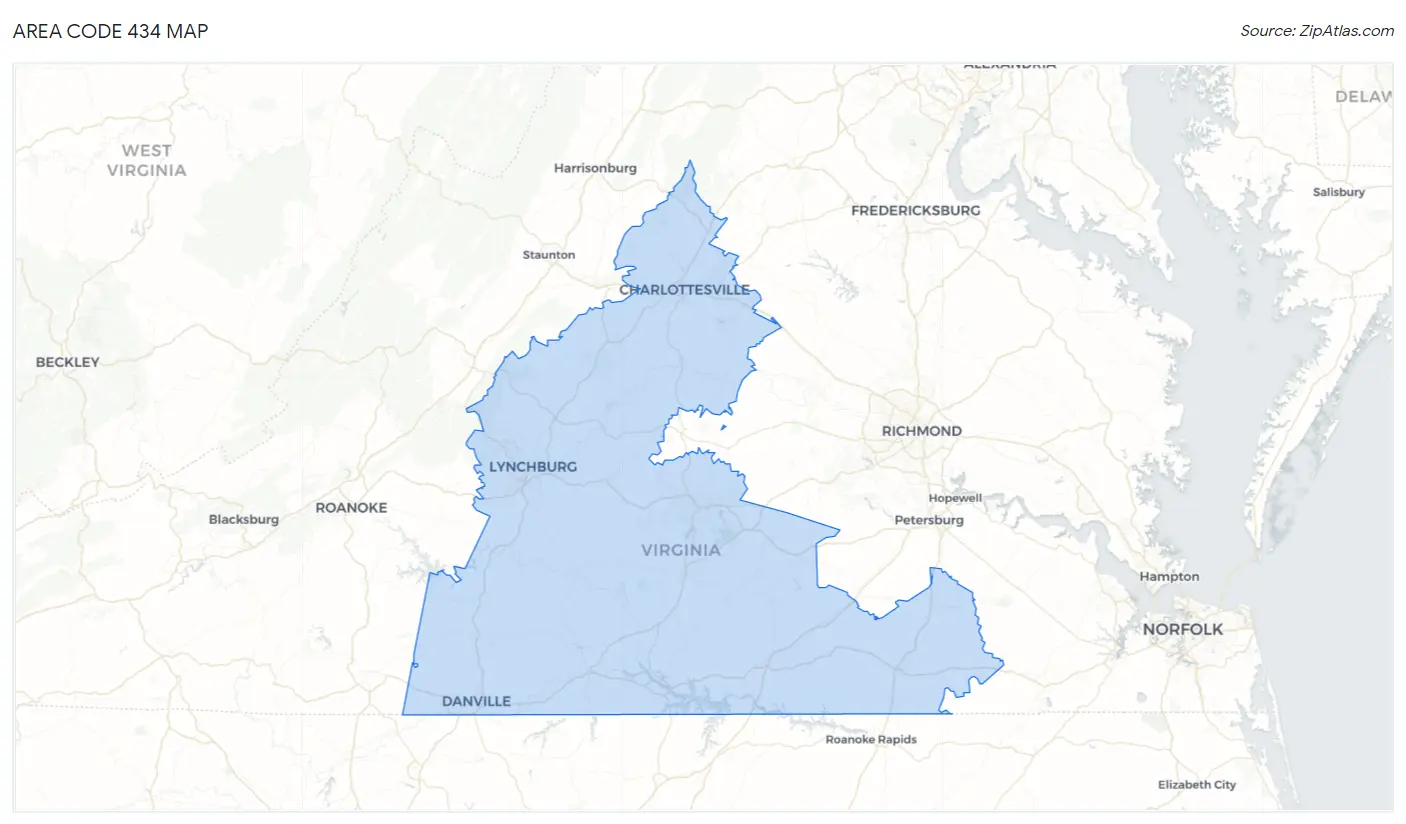
Area Code 434 Map
Area Code 434 Overview
$31,220
PER CAPITA INCOME
$76,408
AVG FAMILY INCOME
$59,143
AVG HOUSEHOLD INCOME
26.1%
WAGE / INCOME GAP [ % ]
73.9¢/ $1
WAGE / INCOME GAP [ $ ]
$9,941
FAMILY INCOME DEFICIT
47.13
INEQUALITY / GINI INDEX
666,437
TOTAL POPULATION
327,048
MALE POPULATION
339,389
FEMALE POPULATION
96.36
MALES / 100 FEMALES
103.77
FEMALES / 100 MALES
45.6
MEDIAN AGE
2.9
AVG FAMILY SIZE
2.4
AVG HOUSEHOLD SIZE
293,260
LABOR FORCE [ PEOPLE ]
53.1%
PERCENT IN LABOR FORCE
5.4%
UNEMPLOYMENT RATE
Income in Area Code 434
Income Overview in Area Code 434
Per Capita Income in Area Code 434 is $31,220, while median incomes of families and households are $76,408 and $59,143 respectively.
| Characteristic | Number | Measure |
| Per Capita Income | 666,437 | $31,220 |
| Median Family Income | 160,072 | $76,408 |
| Mean Family Income | 160,072 | $9,980,075 |
| Median Household Income | 261,116 | $59,143 |
| Mean Household Income | 261,116 | $8,493,216 |
| Income Deficit | 160,072 | $9,941 |
| Wage / Income Gap (%) | 666,437 | 26.11% |
| Wage / Income Gap ($) | 666,437 | 73.89¢ per $1 |
| Gini / Inequality Index | 666,437 | 47.13 |
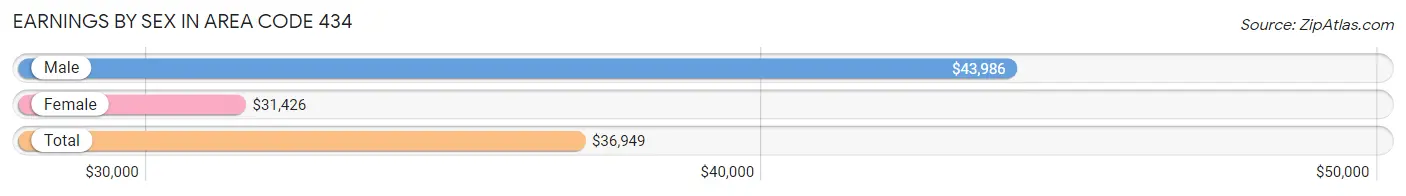
Earnings by Sex in Area Code 434
Average Earnings in Area Code 434 are $36,949, $43,986 for men and $31,426 for women, a difference of 28.5%.
| Sex | Number | Average Earnings |
| Male | 169,380 (50.3%) | $43,986 |
| Female | 167,299 (49.7%) | $31,426 |
| Total | 336,679 (100.0%) | $36,949 |
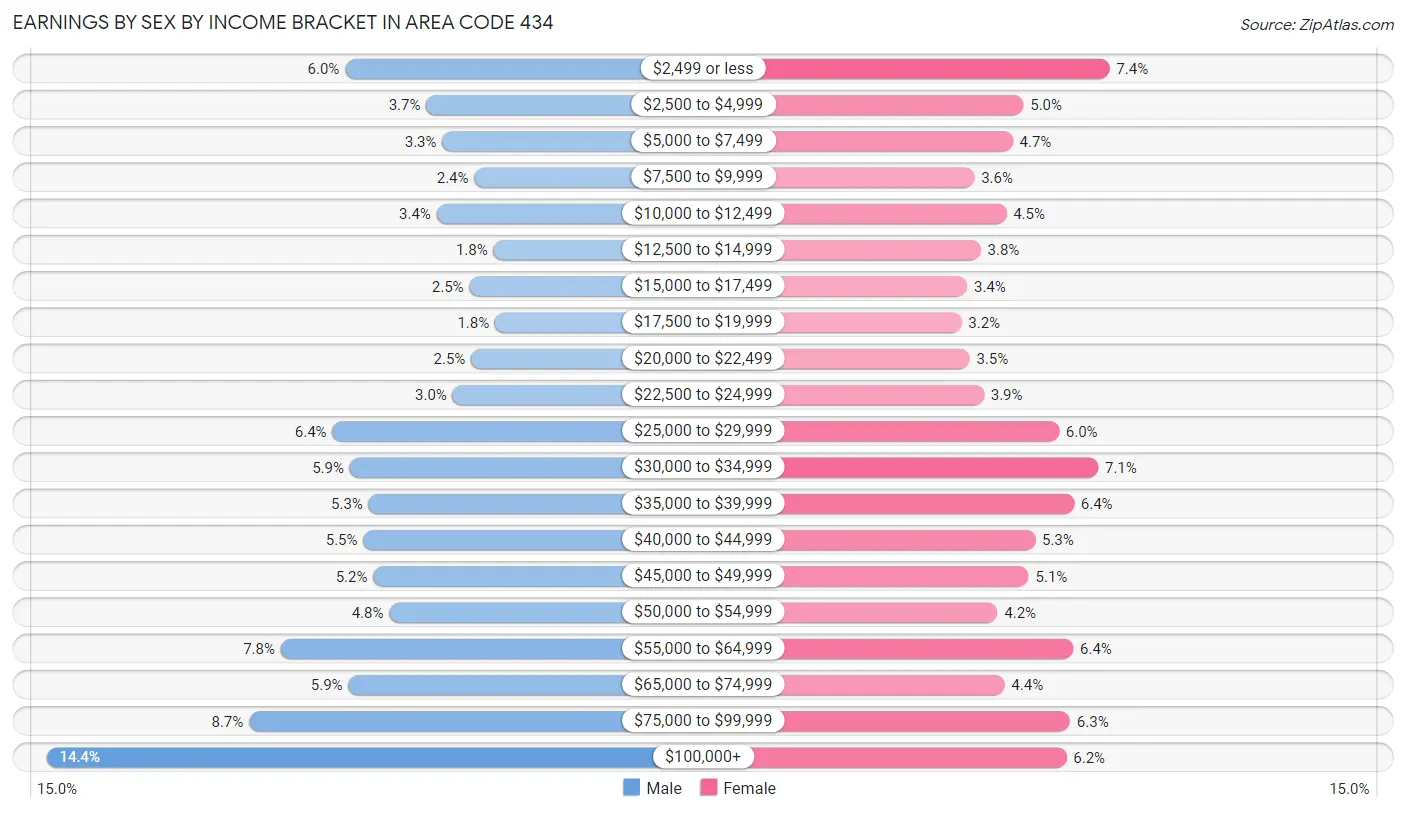
Earnings by Sex by Income Bracket in Area Code 434
The most common earnings brackets in Area Code 434 are $100,000+ for men (24,354 | 14.4%) and $2,499 or less for women (12,352 | 7.4%).
| Income | Male | Female |
| $2,499 or less | 10,142 (6.0%) | 12,352 (7.4%) |
| $2,500 to $4,999 | 6,277 (3.7%) | 8,298 (5.0%) |
| $5,000 to $7,499 | 5,520 (3.3%) | 7,801 (4.7%) |
| $7,500 to $9,999 | 4,001 (2.4%) | 5,994 (3.6%) |
| $10,000 to $12,499 | 5,792 (3.4%) | 7,495 (4.5%) |
| $12,500 to $14,999 | 3,091 (1.8%) | 6,290 (3.8%) |
| $15,000 to $17,499 | 4,232 (2.5%) | 5,663 (3.4%) |
| $17,500 to $19,999 | 3,013 (1.8%) | 5,389 (3.2%) |
| $20,000 to $22,499 | 4,150 (2.5%) | 5,768 (3.5%) |
| $22,500 to $24,999 | 5,032 (3.0%) | 6,442 (3.8%) |
| $25,000 to $29,999 | 10,759 (6.4%) | 9,969 (6.0%) |
| $30,000 to $34,999 | 9,926 (5.9%) | 11,808 (7.1%) |
| $35,000 to $39,999 | 9,031 (5.3%) | 10,681 (6.4%) |
| $40,000 to $44,999 | 9,290 (5.5%) | 8,856 (5.3%) |
| $45,000 to $49,999 | 8,816 (5.2%) | 8,552 (5.1%) |
| $50,000 to $54,999 | 8,044 (4.8%) | 7,083 (4.2%) |
| $55,000 to $64,999 | 13,208 (7.8%) | 10,638 (6.4%) |
| $65,000 to $74,999 | 9,989 (5.9%) | 7,417 (4.4%) |
| $75,000 to $99,999 | 14,713 (8.7%) | 10,485 (6.3%) |
| $100,000+ | 24,354 (14.4%) | 10,318 (6.2%) |
| Total | 169,380 (100.0%) | 167,299 (100.0%) |
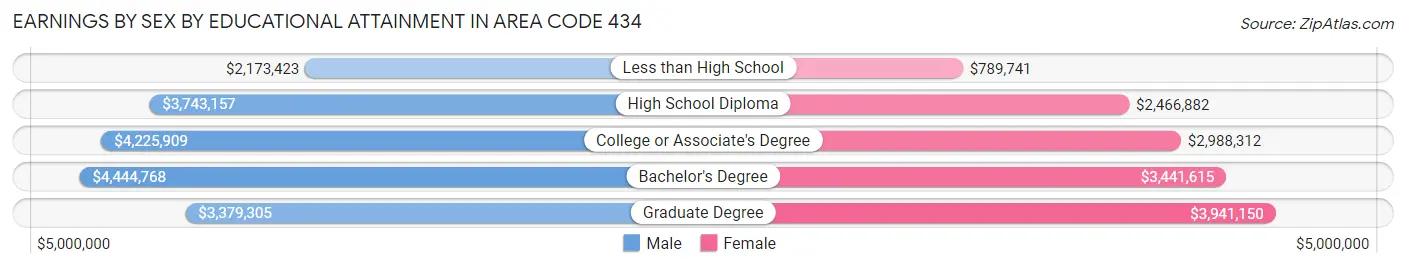
Earnings by Sex by Educational Attainment in Area Code 434
Average earnings in Area Code 434 are $5,097,818 for men and $3,601,994 for women, a difference of 29.3%. Men with an educational attainment of bachelor's degree enjoy the highest average annual earnings of $4,444,768, while those with less than high school education earn the least with $2,173,423. Women with an educational attainment of graduate degree earn the most with the average annual earnings of $3,941,150, while those with less than high school education have the smallest earnings of $789,741.
| Educational Attainment | Male Income | Female Income |
| Less than High School | $2,173,423 | $789,741 |
| High School Diploma | $3,743,157 | $2,466,882 |
| College or Associate's Degree | $4,225,909 | $2,988,312 |
| Bachelor's Degree | $4,444,768 | $3,441,615 |
| Graduate Degree | $3,379,305 | $3,941,150 |
| Total | $5,097,818 | $3,601,994 |
Family Income in Area Code 434
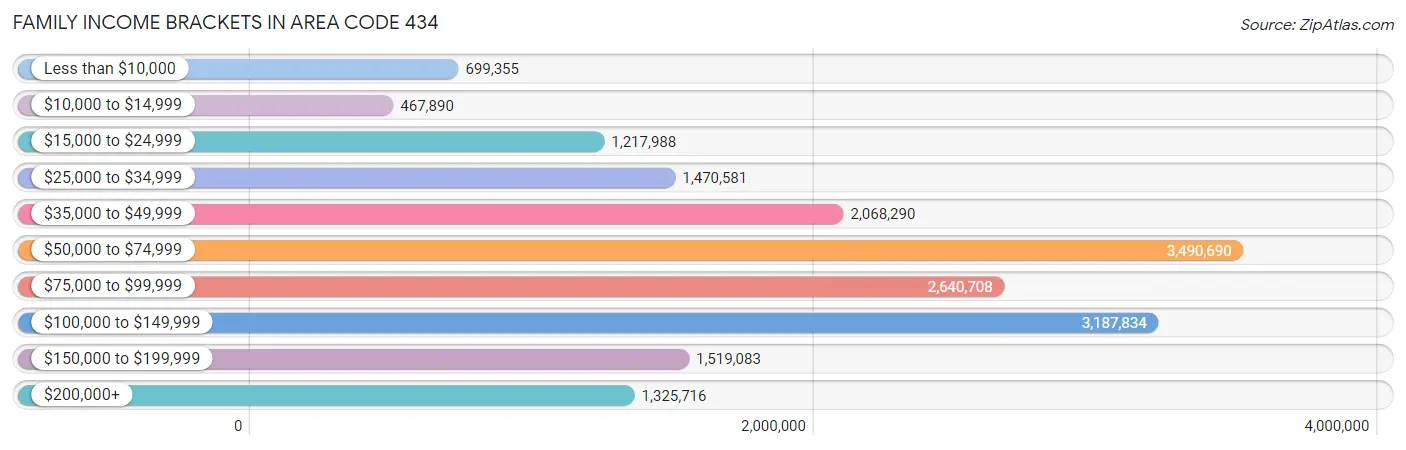
Family Income Brackets in Area Code 434
According to the Area Code 434 family income data, there are 3,490,690 families falling into the $50,000 to $74,999 income range, which is the most common income bracket and makes up 2,180.7% of all families. Conversely, the $10,000 to $14,999 income bracket is the least frequent group with only 467,890 families (292.3%) belonging to this category.
| Income Bracket | # Families | % Families |
| Less than $10,000 | 699,355 | 436.9% |
| $10,000 to $14,999 | 467,890 | 292.3% |
| $15,000 to $24,999 | 1,217,988 | 760.9% |
| $25,000 to $34,999 | 1,470,581 | 918.7% |
| $35,000 to $49,999 | 2,068,290 | 1,292.1% |
| $50,000 to $74,999 | 3,490,690 | 2,180.7% |
| $75,000 to $99,999 | 2,640,708 | 1,649.7% |
| $100,000 to $149,999 | 3,187,834 | 1,991.5% |
| $150,000 to $199,999 | 1,519,083 | 949.0% |
| $200,000+ | 1,325,716 | 828.2% |
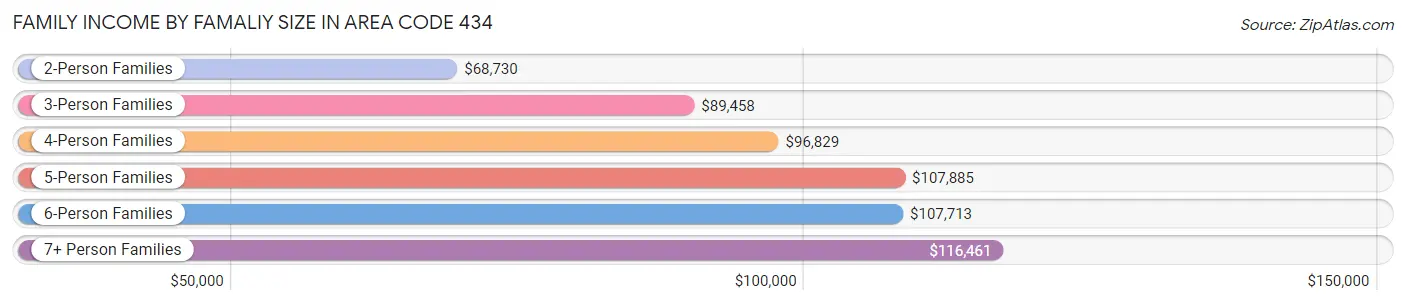
Family Income by Famaliy Size in Area Code 434
7+ person families (2,029 | 1.3%) account for the highest median family income in Area Code 434 with $116,461 per family, while 2-person families (84,541 | 52.8%) have the highest median income of $34,365 per family member.
| Income Bracket | # Families | Median Income |
| 2-Person Families | 84,541 (52.8%) | $68,730 |
| 3-Person Families | 34,721 (21.7%) | $89,458 |
| 4-Person Families | 24,145 (15.1%) | $96,828 |
| 5-Person Families | 10,641 (6.7%) | $107,885 |
| 6-Person Families | 3,995 (2.5%) | $107,713 |
| 7+ Person Families | 2,029 (1.3%) | $116,461 |
| Total | 160,072 (100.0%) | $76,408 |
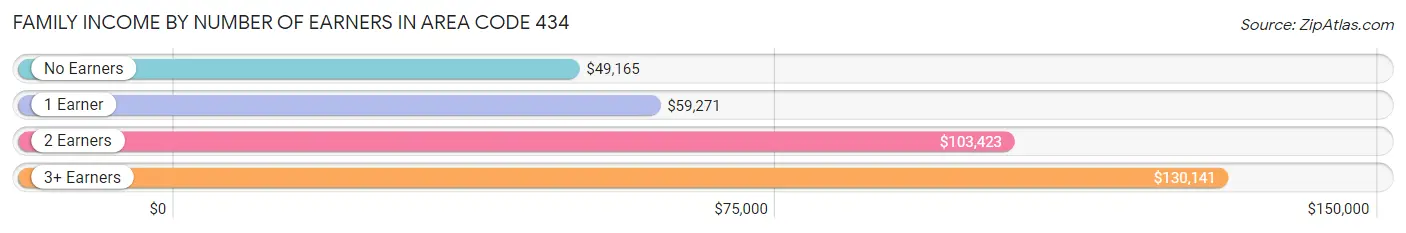
Family Income by Number of Earners in Area Code 434
The median family income in Area Code 434 is $76,408, with families comprising 3+ earners (14,953) having the highest median family income of $130,141, while families with no earners (29,789) have the lowest median family income of $49,165, accounting for 9.3% and 18.6% of families, respectively.
| Number of Earners | # Families | Median Income |
| No Earners | 29,789 (18.6%) | $49,165 |
| 1 Earner | 52,864 (33.0%) | $59,271 |
| 2 Earners | 62,466 (39.0%) | $103,423 |
| 3+ Earners | 14,953 (9.3%) | $130,141 |
| Total | 160,072 (100.0%) | $76,408 |
Household Income in Area Code 434
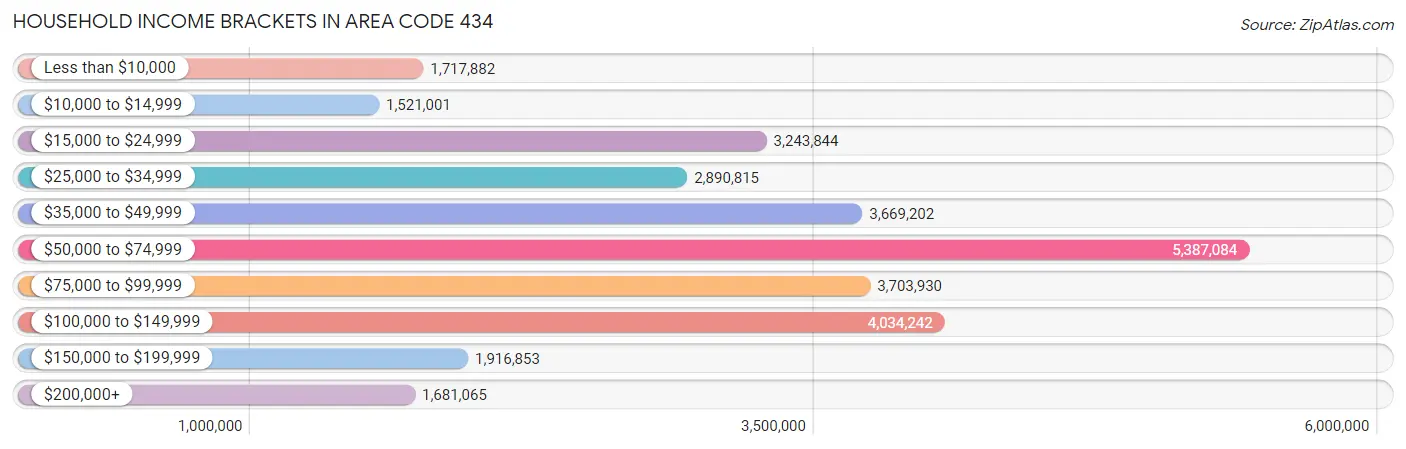
Household Income Brackets in Area Code 434
With 5,387,084 households falling in the category, the $50,000 to $74,999 income range is the most frequent in Area Code 434, accounting for 2,063.1% of all households. In contrast, only 1,521,001 households (582.5%) fall into the $10,000 to $14,999 income bracket, making it the least populous group.
| Income Bracket | # Households | % Households |
| Less than $10,000 | 1,717,882 | 657.9% |
| $10,000 to $14,999 | 1,521,001 | 582.5% |
| $15,000 to $24,999 | 3,243,844 | 1,242.3% |
| $25,000 to $34,999 | 2,890,815 | 1,107.1% |
| $35,000 to $49,999 | 3,669,202 | 1,405.2% |
| $50,000 to $74,999 | 5,387,084 | 2,063.1% |
| $75,000 to $99,999 | 3,703,930 | 1,418.5% |
| $100,000 to $149,999 | 4,034,242 | 1,545.0% |
| $150,000 to $199,999 | 1,916,853 | 734.1% |
| $200,000+ | 1,681,065 | 643.8% |
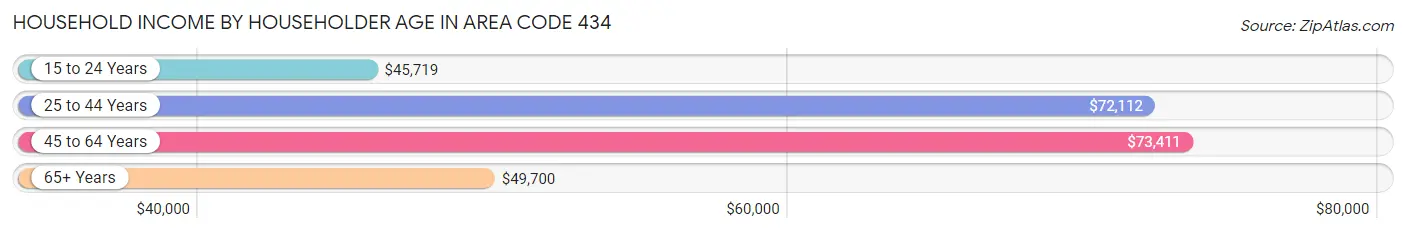
Household Income by Householder Age in Area Code 434
The median household income in Area Code 434 is $59,143, with the highest median household income of $73,411 found in the 45 to 64 years age bracket for the primary householder. A total of 94,954 households (36.4%) fall into this category. Meanwhile, the 15 to 24 years age bracket for the primary householder has the lowest median household income of $45,719, with 12,293 households (4.7%) in this group.
| Income Bracket | # Households | Median Income |
| 15 to 24 Years | 12,293 (4.7%) | $45,719 |
| 25 to 44 Years | 71,151 (27.3%) | $72,112 |
| 45 to 64 Years | 94,954 (36.4%) | $73,411 |
| 65+ Years | 82,718 (31.7%) | $49,700 |
| Total | 261,116 (100.0%) | $59,143 |
Poverty in Area Code 434
Income Below Poverty by Sex and Age in Area Code 434
With 13.5% poverty level for males and 16.4% for females among the residents of Area Code 434, 18 to 24 year old males and 18 to 24 year old females are the most vulnerable to poverty, with 6,942 males (24.4%) and 8,398 females (29.6%) in their respective age groups living below the poverty level.
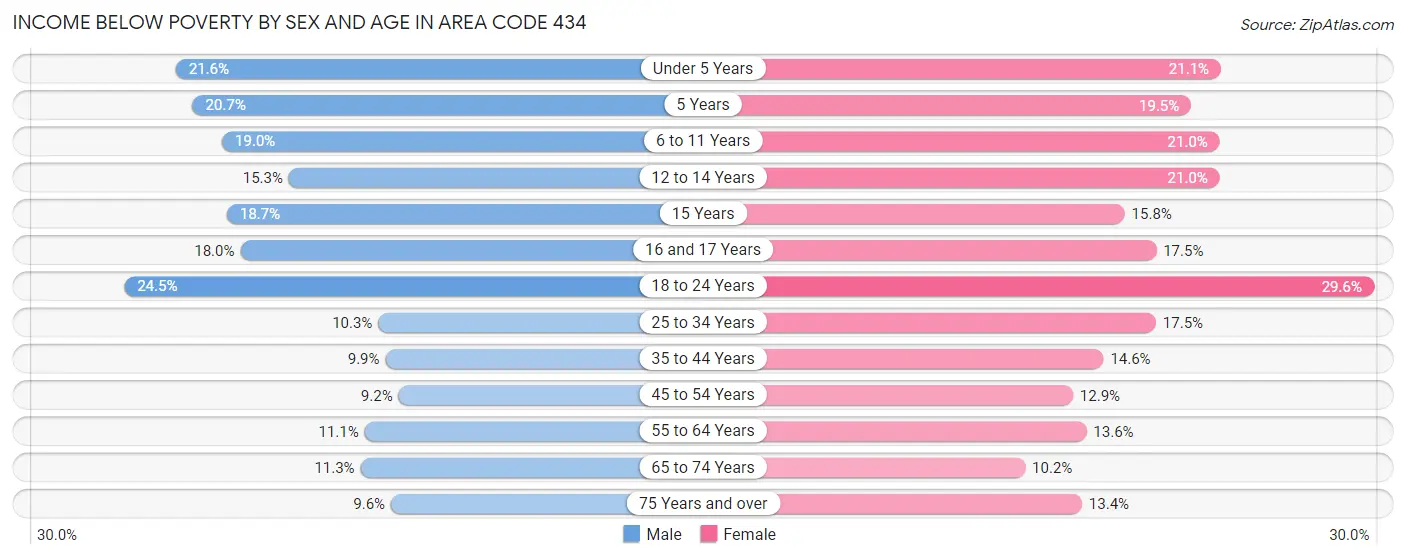
| Age Bracket | Male | Female |
| Under 5 Years | 3,693 (21.6%) | 3,455 (21.1%) |
| 5 Years | 621 (20.6%) | 641 (19.5%) |
| 6 to 11 Years | 4,187 (19.0%) | 4,491 (21.0%) |
| 12 to 14 Years | 1,656 (15.3%) | 2,158 (21.0%) |
| 15 Years | 745 (18.7%) | 581 (15.8%) |
| 16 and 17 Years | 1,319 (18.0%) | 1,238 (17.5%) |
| 18 to 24 Years | 6,942 (24.4%) | 8,398 (29.6%) |
| 25 to 34 Years | 4,141 (10.3%) | 7,097 (17.5%) |
| 35 to 44 Years | 3,298 (9.9%) | 5,217 (14.6%) |
| 45 to 54 Years | 3,306 (9.2%) | 4,950 (12.9%) |
| 55 to 64 Years | 4,525 (11.1%) | 6,235 (13.6%) |
| 65 to 74 Years | 3,838 (11.3%) | 4,018 (10.2%) |
| 75 Years and over | 2,052 (9.6%) | 4,146 (13.4%) |
| Total | 40,323 (13.5%) | 52,625 (16.4%) |
Income Above Poverty by Sex and Age in Area Code 434
According to the poverty statistics in Area Code 434, males aged 45 to 54 years and females aged 65 to 74 years are the age groups that are most secure financially, with 90.8% of males and 89.8% of females in these age groups living above the poverty line.
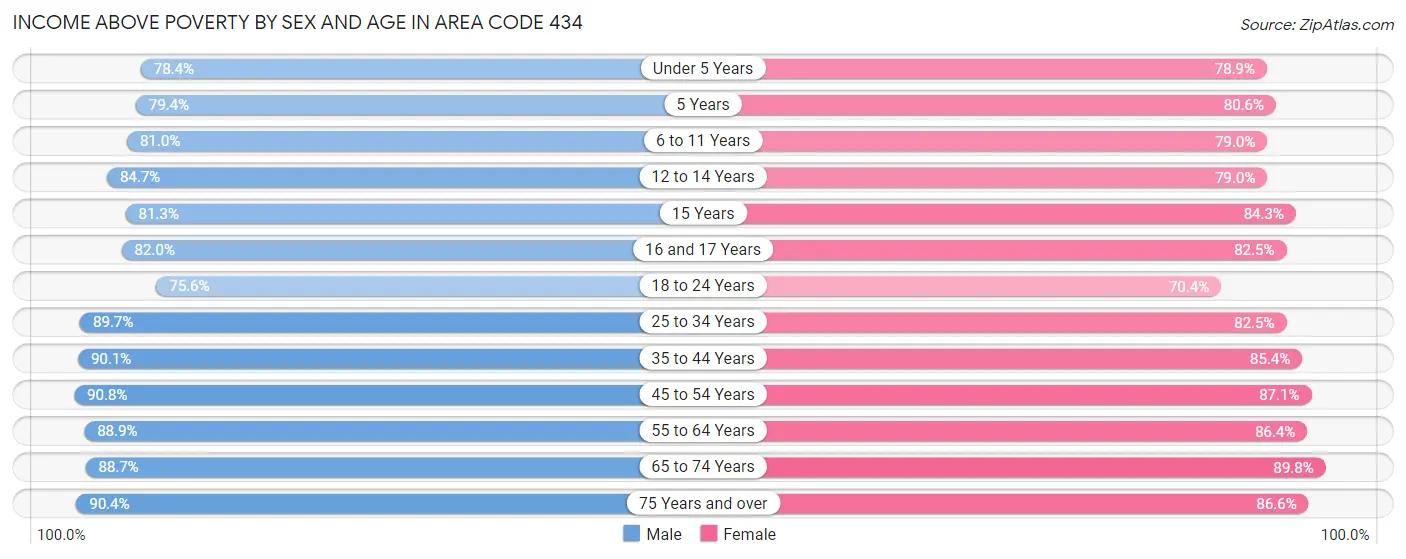
| Age Bracket | Male | Female |
| Under 5 Years | 13,417 (78.4%) | 12,910 (78.9%) |
| 5 Years | 2,386 (79.3%) | 2,655 (80.5%) |
| 6 to 11 Years | 17,840 (81.0%) | 16,857 (79.0%) |
| 12 to 14 Years | 9,172 (84.7%) | 8,098 (79.0%) |
| 15 Years | 3,230 (81.3%) | 3,108 (84.3%) |
| 16 and 17 Years | 6,012 (82.0%) | 5,834 (82.5%) |
| 18 to 24 Years | 21,454 (75.5%) | 19,951 (70.4%) |
| 25 to 34 Years | 36,029 (89.7%) | 33,491 (82.5%) |
| 35 to 44 Years | 29,977 (90.1%) | 30,589 (85.4%) |
| 45 to 54 Years | 32,694 (90.8%) | 33,507 (87.1%) |
| 55 to 64 Years | 36,344 (88.9%) | 39,558 (86.4%) |
| 65 to 74 Years | 30,127 (88.7%) | 35,353 (89.8%) |
| 75 Years and over | 19,320 (90.4%) | 26,855 (86.6%) |
| Total | 258,002 (86.5%) | 268,766 (83.6%) |
Income Below Poverty Among Married-Couple Families in Area Code 434
The poverty statistics for married-couple families in Area Code 434 show that 4.3% or 4,926 of the total 113,820 families live below the poverty line. Families with 5 or more children have the highest poverty rate of 28.2%, comprising of 270 families. On the other hand, families with 1 or 2 children have the lowest poverty rate of 3.3%, which includes 1,067 families.
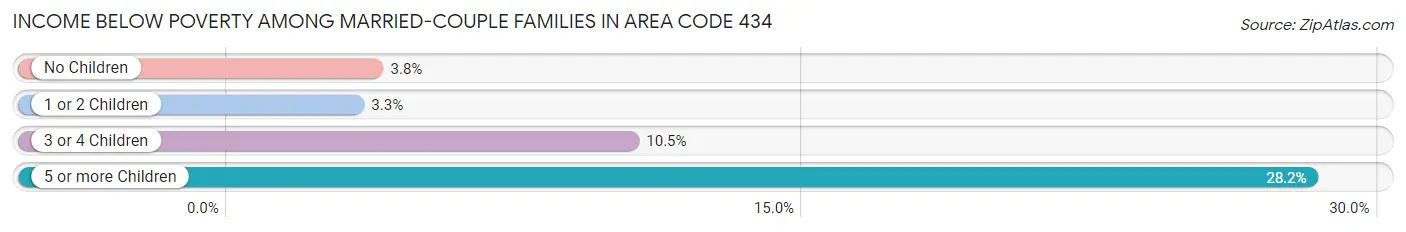
| Children | Above Poverty | Below Poverty |
| No Children | 69,780 (96.2%) | 2,753 (3.8%) |
| 1 or 2 Children | 31,285 (96.7%) | 1,067 (3.3%) |
| 3 or 4 Children | 7,142 (89.5%) | 836 (10.5%) |
| 5 or more Children | 687 (71.8%) | 270 (28.2%) |
| Total | 108,894 (95.7%) | 4,926 (4.3%) |
Income Below Poverty Among Single-Parent Households in Area Code 434
According to the poverty data in Area Code 434, 15.4% or 1,821 single-father households and 26.6% or 9,155 single-mother households are living below the poverty line. Among single-father households, those with 5 or more children have the highest poverty rate, with 20 households (100.0%) experiencing poverty. Likewise, among single-mother households, those with 5 or more children have the highest poverty rate, with 296 households (81.8%) falling below the poverty line.
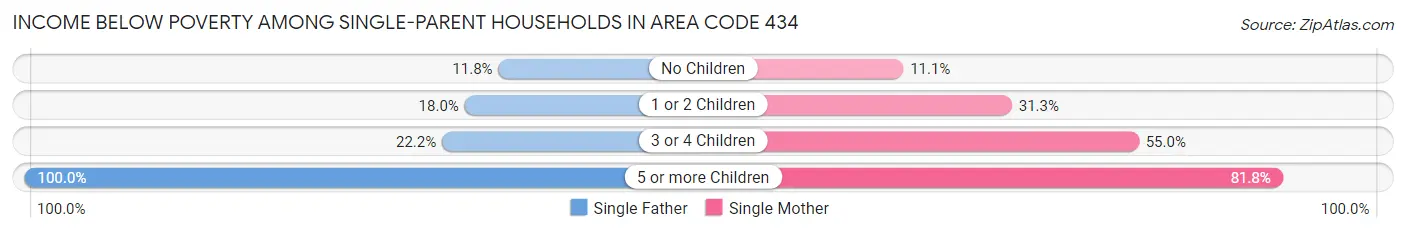
| Children | Single Father | Single Mother |
| No Children | 662 (11.7%) | 1,486 (11.1%) |
| 1 or 2 Children | 968 (18.0%) | 5,301 (31.3%) |
| 3 or 4 Children | 171 (22.2%) | 2,072 (55.0%) |
| 5 or more Children | 20 (100.0%) | 296 (81.8%) |
| Total | 1,821 (15.4%) | 9,155 (26.6%) |
Income Below Poverty Among Married-Couple vs Single-Parent Households in Area Code 434
The poverty data for Area Code 434 shows that 4,926 of the married-couple family households (4.3%) and 10,976 of the single-parent households (23.7%) are living below the poverty level. Within the married-couple family households, those with 5 or more children have the highest poverty rate, with 270 households (28.2%) falling below the poverty line. Among the single-parent households, those with 5 or more children have the highest poverty rate, with 316 household (82.7%) living below poverty.
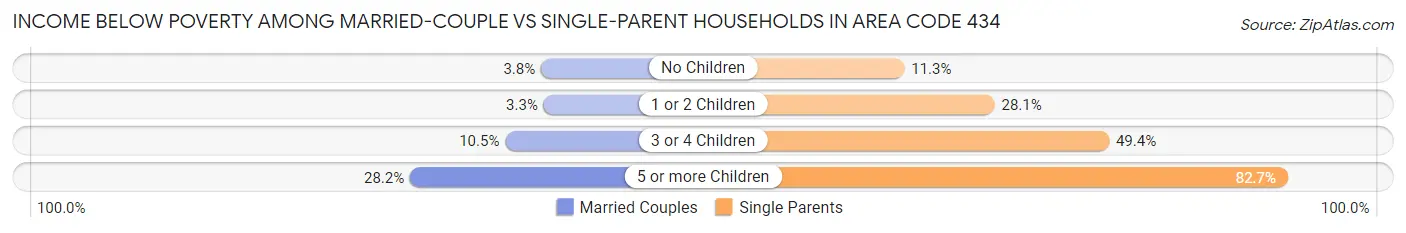
| Children | Married-Couple Families | Single-Parent Households |
| No Children | 2,753 (3.8%) | 2,148 (11.3%) |
| 1 or 2 Children | 1,067 (3.3%) | 6,269 (28.1%) |
| 3 or 4 Children | 836 (10.5%) | 2,243 (49.4%) |
| 5 or more Children | 270 (28.2%) | 316 (82.7%) |
| Total | 4,926 (4.3%) | 10,976 (23.7%) |
Race in Area Code 434
The most populous races in Area Code 434 are White / Caucasian (451,133 | 67.7%), Black / African American (157,881 | 23.7%), and Two or more Races (31,426 | 4.7%).
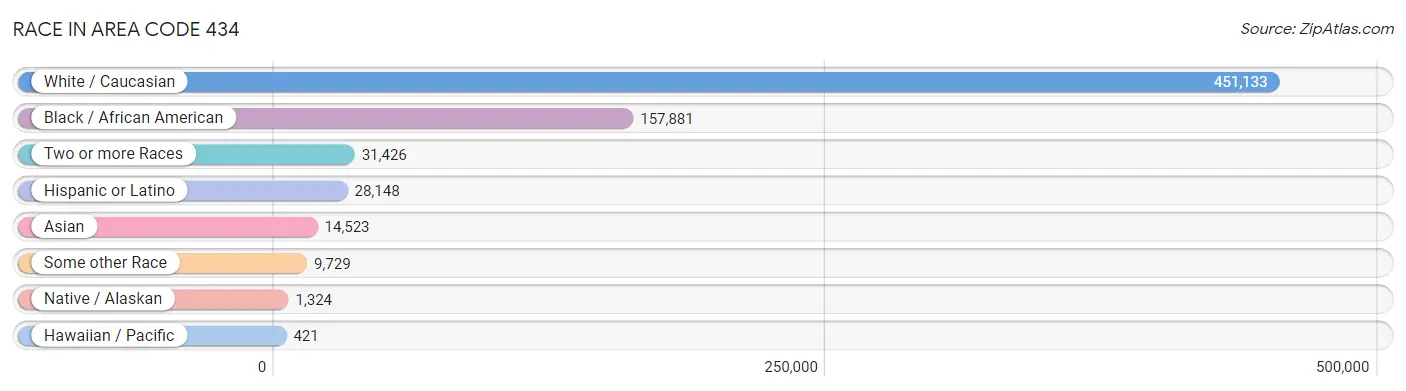
| Race | # Population | % Population |
| Asian | 14,523 | 2.2% |
| Black / African American | 157,881 | 23.7% |
| Hawaiian / Pacific | 421 | 0.1% |
| Hispanic or Latino | 28,148 | 4.2% |
| Native / Alaskan | 1,324 | 0.2% |
| White / Caucasian | 451,133 | 67.7% |
| Two or more Races | 31,426 | 4.7% |
| Some other Race | 9,729 | 1.5% |
| Total | 666,437 | 100.0% |
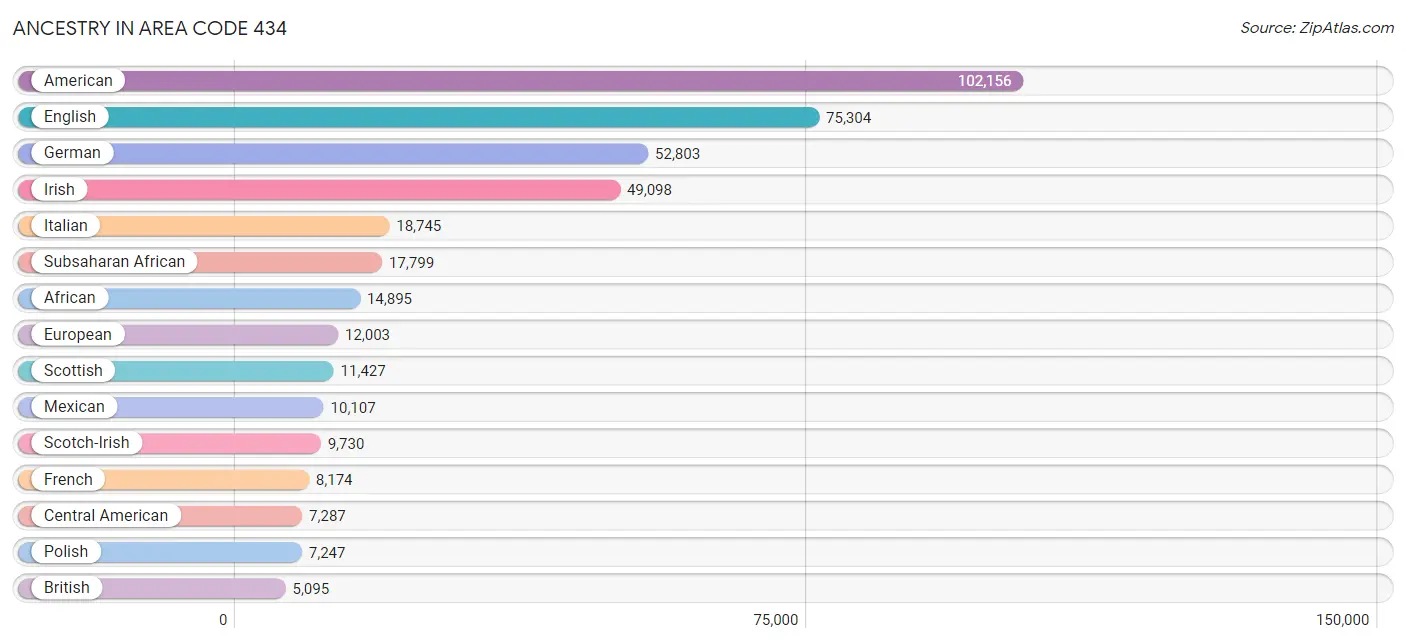
Ancestry in Area Code 434
The most populous ancestries reported in Area Code 434 are American (102,156 | 15.3%), English (75,304 | 11.3%), German (52,803 | 7.9%), Irish (49,098 | 7.4%), and Italian (18,745 | 2.8%), together accounting for 44.7% of all Area Code 434 residents.
| Ancestry | # Population | % Population |
| Afghan | 400 | 0.1% |
| African | 14,895 | 2.2% |
| Albanian | 201 | 0.0% |
| American | 102,156 | 15.3% |
| Apache | 174 | 0.0% |
| Arab | 2,061 | 0.3% |
| Argentinean | 191 | 0.0% |
| Armenian | 149 | 0.0% |
| Australian | 86 | 0.0% |
| Austrian | 879 | 0.1% |
| Bahamian | 16 | 0.0% |
| Barbadian | 82 | 0.0% |
| Basque | 11 | 0.0% |
| Belgian | 189 | 0.0% |
| Bhutanese | 975 | 0.2% |
| Blackfeet | 257 | 0.0% |
| Bolivian | 355 | 0.1% |
| Brazilian | 934 | 0.1% |
| British | 5,095 | 0.8% |
| Bulgarian | 216 | 0.0% |
| Burmese | 2,475 | 0.4% |
| Cajun | 61 | 0.0% |
| Cambodian | 9 | 0.0% |
| Canadian | 1,074 | 0.2% |
| Cape Verdean | 58 | 0.0% |
| Celtic | 23 | 0.0% |
| Central American | 7,287 | 1.1% |
| Central American Indian | 563 | 0.1% |
| Cherokee | 2,574 | 0.4% |
| Cheyenne | 5 | 0.0% |
| Chickasaw | 13 | 0.0% |
| Chilean | 160 | 0.0% |
| Chippewa | 112 | 0.0% |
| Choctaw | 91 | 0.0% |
| Colombian | 260 | 0.0% |
| Costa Rican | 143 | 0.0% |
| Creek | 51 | 0.0% |
| Croatian | 206 | 0.0% |
| Cuban | 947 | 0.1% |
| Cypriot | 76 | 0.0% |
| Czech | 1,185 | 0.2% |
| Czechoslovakian | 241 | 0.0% |
| Danish | 1,200 | 0.2% |
| Delaware | 82 | 0.0% |
| Dominican | 534 | 0.1% |
| Dutch | 4,501 | 0.7% |
| Eastern European | 1,124 | 0.2% |
| Ecuadorian | 75 | 0.0% |
| Egyptian | 325 | 0.1% |
| English | 75,304 | 11.3% |
| Ethiopian | 524 | 0.1% |
| European | 12,003 | 1.8% |
| Filipino | 256 | 0.0% |
| Finnish | 365 | 0.1% |
| French | 8,174 | 1.2% |
| French American Indian | 65 | 0.0% |
| French Canadian | 1,490 | 0.2% |
| German | 52,803 | 7.9% |
| German Russian | 13 | 0.0% |
| Ghanaian | 533 | 0.1% |
| Greek | 1,430 | 0.2% |
| Guamanian / Chamorro | 66 | 0.0% |
| Guatemalan | 1,830 | 0.3% |
| Guyanese | 23 | 0.0% |
| Haitian | 150 | 0.0% |
| Honduran | 1,229 | 0.2% |
| Hungarian | 1,726 | 0.3% |
| Icelander | 8 | 0.0% |
| Indian (Asian) | 4,320 | 0.6% |
| Indonesian | 241 | 0.0% |
| Iranian | 384 | 0.1% |
| Iraqi | 133 | 0.0% |
| Irish | 49,098 | 7.4% |
| Iroquois | 289 | 0.0% |
| Israeli | 107 | 0.0% |
| Italian | 18,745 | 2.8% |
| Jamaican | 762 | 0.1% |
| Japanese | 52 | 0.0% |
| Kenyan | 283 | 0.0% |
| Kiowa | 1 | 0.0% |
| Korean | 2,341 | 0.4% |
| Laotian | 46 | 0.0% |
| Latvian | 75 | 0.0% |
| Lebanese | 791 | 0.1% |
| Liberian | 73 | 0.0% |
| Lithuanian | 632 | 0.1% |
| Lumbee | 74 | 0.0% |
| Malaysian | 81 | 0.0% |
| Maltese | 60 | 0.0% |
| Marshallese | 15 | 0.0% |
| Menominee | 3 | 0.0% |
| Mexican | 10,107 | 1.5% |
| Mexican American Indian | 527 | 0.1% |
| Mongolian | 33 | 0.0% |
| Moroccan | 146 | 0.0% |
| Native Hawaiian | 314 | 0.1% |
| Navajo | 26 | 0.0% |
| New Zealander | 9 | 0.0% |
| Nicaraguan | 241 | 0.0% |
| Nigerian | 796 | 0.1% |
| Northern European | 1,034 | 0.2% |
| Norwegian | 2,777 | 0.4% |
| Okinawan | 13 | 0.0% |
| Osage | 11 | 0.0% |
| Ottawa | 8 | 0.0% |
| Pakistani | 699 | 0.1% |
| Palestinian | 46 | 0.0% |
| Panamanian | 337 | 0.1% |
| Paraguayan | 29 | 0.0% |
| Pennsylvania German | 627 | 0.1% |
| Peruvian | 679 | 0.1% |
| Polish | 7,247 | 1.1% |
| Portuguese | 983 | 0.2% |
| Potawatomi | 10 | 0.0% |
| Pueblo | 34 | 0.0% |
| Puerto Rican | 4,616 | 0.7% |
| Puget Sound Salish | 35 | 0.0% |
| Romanian | 493 | 0.1% |
| Russian | 2,522 | 0.4% |
| Salvadoran | 3,479 | 0.5% |
| Samoan | 81 | 0.0% |
| Scandinavian | 1,420 | 0.2% |
| Scotch-Irish | 9,730 | 1.5% |
| Scottish | 11,427 | 1.7% |
| Seminole | 7 | 0.0% |
| Serbian | 233 | 0.0% |
| Sierra Leonean | 4 | 0.0% |
| Sioux | 54 | 0.0% |
| Slavic | 87 | 0.0% |
| Slovak | 922 | 0.1% |
| Slovene | 50 | 0.0% |
| Somali | 3 | 0.0% |
| South African | 21 | 0.0% |
| South American | 2,375 | 0.4% |
| South American Indian | 64 | 0.0% |
| Spaniard | 512 | 0.1% |
| Spanish | 465 | 0.1% |
| Sri Lankan | 1,468 | 0.2% |
| Subsaharan African | 17,799 | 2.7% |
| Sudanese | 142 | 0.0% |
| Swedish | 3,442 | 0.5% |
| Swiss | 1,267 | 0.2% |
| Syrian | 365 | 0.1% |
| Thai | 3,959 | 0.6% |
| Tongan | 4 | 0.0% |
| Trinidadian and Tobagonian | 216 | 0.0% |
| Tsimshian | 16 | 0.0% |
| Turkish | 253 | 0.0% |
| U.S. Virgin Islander | 5 | 0.0% |
| Ukrainian | 1,487 | 0.2% |
| Uruguayan | 94 | 0.0% |
| Venezuelan | 499 | 0.1% |
| Vietnamese | 231 | 0.0% |
| Welsh | 3,268 | 0.5% |
| West Indian | 56 | 0.0% |
| Yaqui | 22 | 0.0% |
| Yugoslavian | 125 | 0.0% |
| Yup'ik | 8 | 0.0% |
| Zimbabwean | 3 | 0.0% | View All 159 Rows |
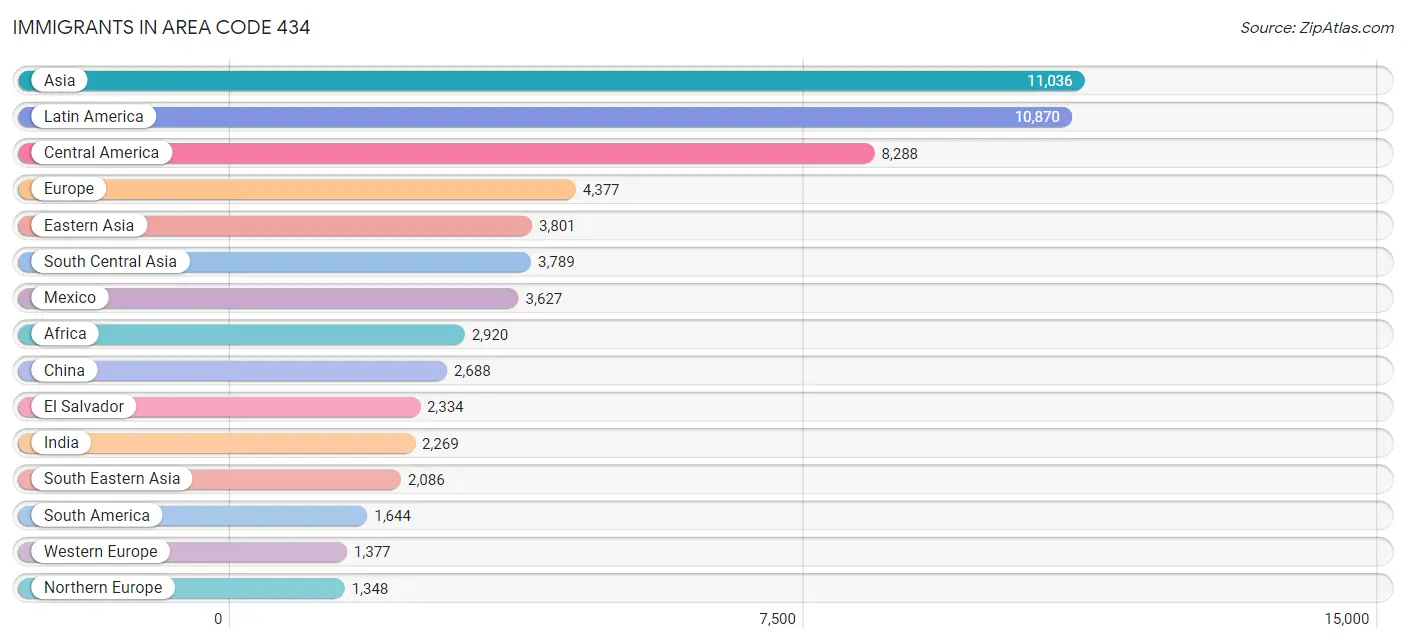
Immigrants in Area Code 434
The most numerous immigrant groups reported in Area Code 434 came from Asia (11,036 | 1.7%), Latin America (10,870 | 1.6%), Central America (8,288 | 1.2%), Europe (4,377 | 0.7%), and Eastern Asia (3,801 | 0.6%), together accounting for 5.8% of all Area Code 434 residents.
| Immigration Origin | # Population | % Population |
| Afghanistan | 453 | 0.1% |
| Africa | 2,920 | 0.4% |
| Albania | 3 | 0.0% |
| Argentina | 140 | 0.0% |
| Asia | 11,036 | 1.7% |
| Australia | 32 | 0.0% |
| Austria | 62 | 0.0% |
| Bahamas | 16 | 0.0% |
| Bangladesh | 253 | 0.0% |
| Belarus | 79 | 0.0% |
| Belgium | 16 | 0.0% |
| Bolivia | 221 | 0.0% |
| Bosnia and Herzegovina | 65 | 0.0% |
| Brazil | 419 | 0.1% |
| Bulgaria | 105 | 0.0% |
| Cabo Verde | 2 | 0.0% |
| Cambodia | 19 | 0.0% |
| Canada | 852 | 0.1% |
| Caribbean | 938 | 0.1% |
| Central America | 8,288 | 1.2% |
| Chile | 82 | 0.0% |
| China | 2,688 | 0.4% |
| Colombia | 188 | 0.0% |
| Congo | 74 | 0.0% |
| Costa Rica | 80 | 0.0% |
| Croatia | 27 | 0.0% |
| Cuba | 81 | 0.0% |
| Czechoslovakia | 55 | 0.0% |
| Denmark | 136 | 0.0% |
| Dominican Republic | 117 | 0.0% |
| Eastern Africa | 758 | 0.1% |
| Eastern Asia | 3,801 | 0.6% |
| Eastern Europe | 1,336 | 0.2% |
| Ecuador | 38 | 0.0% |
| Egypt | 134 | 0.0% |
| El Salvador | 2,334 | 0.4% |
| England | 442 | 0.1% |
| Ethiopia | 465 | 0.1% |
| Europe | 4,377 | 0.7% |
| Fiji | 136 | 0.0% |
| France | 141 | 0.0% |
| Germany | 922 | 0.1% |
| Ghana | 335 | 0.1% |
| Greece | 16 | 0.0% |
| Grenada | 14 | 0.0% |
| Guatemala | 923 | 0.1% |
| Guyana | 22 | 0.0% |
| Haiti | 54 | 0.0% |
| Honduras | 1,009 | 0.2% |
| Hong Kong | 92 | 0.0% |
| Hungary | 38 | 0.0% |
| India | 2,269 | 0.3% |
| Indonesia | 29 | 0.0% |
| Iran | 253 | 0.0% |
| Iraq | 209 | 0.0% |
| Ireland | 146 | 0.0% |
| Israel | 38 | 0.0% |
| Italy | 168 | 0.0% |
| Jamaica | 447 | 0.1% |
| Japan | 178 | 0.0% |
| Jordan | 40 | 0.0% |
| Kazakhstan | 7 | 0.0% |
| Kenya | 215 | 0.0% |
| Korea | 926 | 0.1% |
| Kuwait | 8 | 0.0% |
| Latin America | 10,870 | 1.6% |
| Latvia | 11 | 0.0% |
| Lebanon | 68 | 0.0% |
| Liberia | 73 | 0.0% |
| Lithuania | 33 | 0.0% |
| Malaysia | 40 | 0.0% |
| Mexico | 3,627 | 0.5% |
| Middle Africa | 347 | 0.1% |
| Morocco | 18 | 0.0% |
| Nepal | 100 | 0.0% |
| Netherlands | 167 | 0.0% |
| Nicaragua | 74 | 0.0% |
| Nigeria | 520 | 0.1% |
| Northern Africa | 271 | 0.0% |
| Northern Europe | 1,348 | 0.2% |
| Norway | 39 | 0.0% |
| Oceania | 224 | 0.0% |
| Pakistan | 302 | 0.1% |
| Panama | 241 | 0.0% |
| Peru | 222 | 0.0% |
| Philippines | 725 | 0.1% |
| Poland | 100 | 0.0% |
| Portugal | 6 | 0.0% |
| Romania | 140 | 0.0% |
| Russia | 324 | 0.1% |
| Saudi Arabia | 8 | 0.0% |
| Scotland | 23 | 0.0% |
| Serbia | 69 | 0.0% |
| Sierra Leone | 134 | 0.0% |
| Singapore | 121 | 0.0% |
| South Africa | 13 | 0.0% |
| South America | 1,644 | 0.3% |
| South Central Asia | 3,789 | 0.6% |
| South Eastern Asia | 2,086 | 0.3% |
| Southern Europe | 316 | 0.1% |
| Spain | 116 | 0.0% |
| Sudan | 107 | 0.0% |
| Sweden | 88 | 0.0% |
| Switzerland | 69 | 0.0% |
| Syria | 378 | 0.1% |
| Taiwan | 342 | 0.1% |
| Thailand | 346 | 0.1% |
| Trinidad and Tobago | 191 | 0.0% |
| Turkey | 213 | 0.0% |
| Uganda | 11 | 0.0% |
| Ukraine | 159 | 0.0% |
| Uruguay | 94 | 0.0% |
| Uzbekistan | 66 | 0.0% |
| Venezuela | 199 | 0.0% |
| Vietnam | 634 | 0.1% |
| Western Africa | 1,312 | 0.2% |
| Western Asia | 1,325 | 0.2% |
| Western Europe | 1,377 | 0.2% |
| Yemen | 212 | 0.0% |
| Zaire | 235 | 0.0% |
| Zimbabwe | 55 | 0.0% | View All 121 Rows |
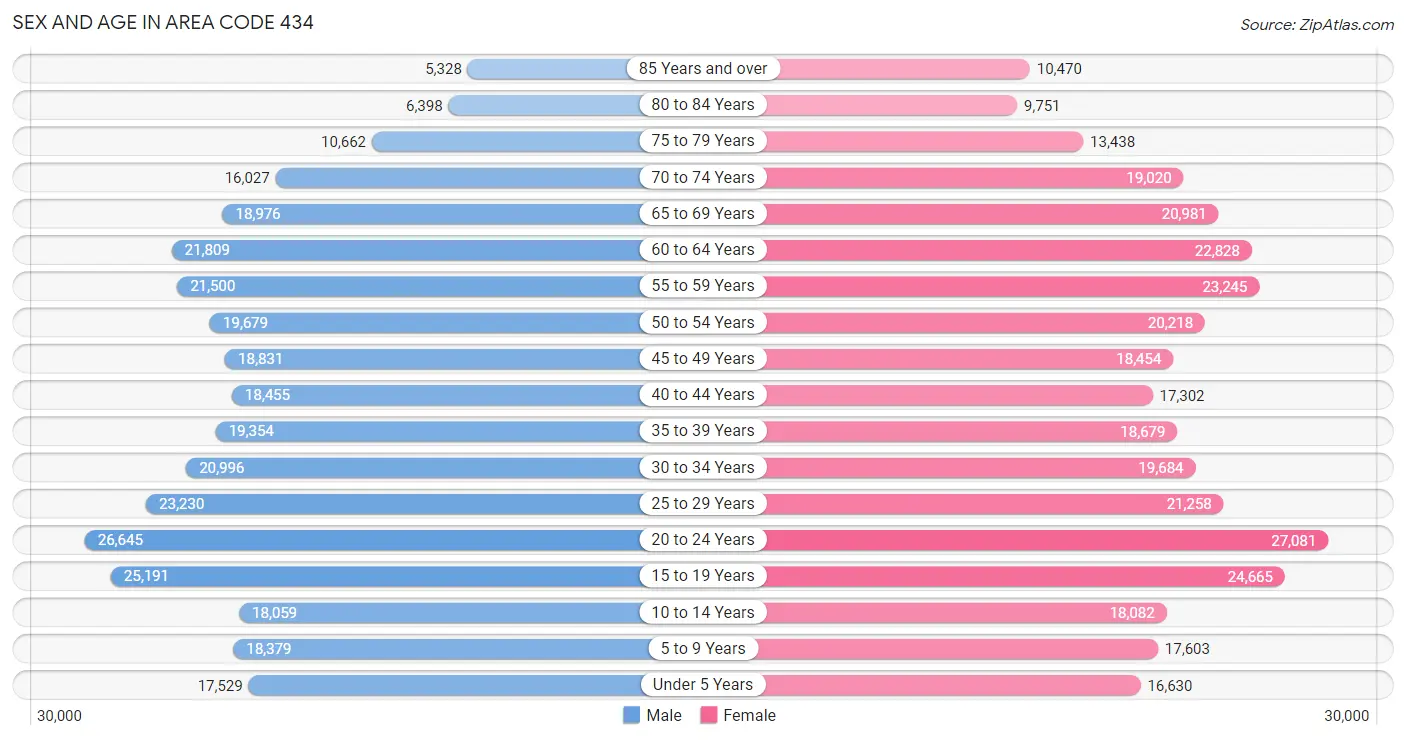
Sex and Age in Area Code 434
Sex and Age in Area Code 434
The most populous age groups in Area Code 434 are 20 to 24 Years (26,645 | 8.2%) for men and 20 to 24 Years (27,081 | 8.0%) for women.
| Age Bracket | Male | Female |
| Under 5 Years | 17,529 (5.4%) | 16,630 (4.9%) |
| 5 to 9 Years | 18,379 (5.6%) | 17,603 (5.2%) |
| 10 to 14 Years | 18,059 (5.5%) | 18,082 (5.3%) |
| 15 to 19 Years | 25,191 (7.7%) | 24,665 (7.3%) |
| 20 to 24 Years | 26,645 (8.2%) | 27,081 (8.0%) |
| 25 to 29 Years | 23,230 (7.1%) | 21,258 (6.3%) |
| 30 to 34 Years | 20,996 (6.4%) | 19,684 (5.8%) |
| 35 to 39 Years | 19,354 (5.9%) | 18,679 (5.5%) |
| 40 to 44 Years | 18,455 (5.6%) | 17,302 (5.1%) |
| 45 to 49 Years | 18,831 (5.8%) | 18,454 (5.4%) |
| 50 to 54 Years | 19,679 (6.0%) | 20,218 (6.0%) |
| 55 to 59 Years | 21,500 (6.6%) | 23,245 (6.9%) |
| 60 to 64 Years | 21,809 (6.7%) | 22,828 (6.7%) |
| 65 to 69 Years | 18,976 (5.8%) | 20,981 (6.2%) |
| 70 to 74 Years | 16,027 (4.9%) | 19,020 (5.6%) |
| 75 to 79 Years | 10,662 (3.3%) | 13,438 (4.0%) |
| 80 to 84 Years | 6,398 (2.0%) | 9,751 (2.9%) |
| 85 Years and over | 5,328 (1.6%) | 10,470 (3.1%) |
| Total | 327,048 (100.0%) | 339,389 (100.0%) |
Families and Households in Area Code 434
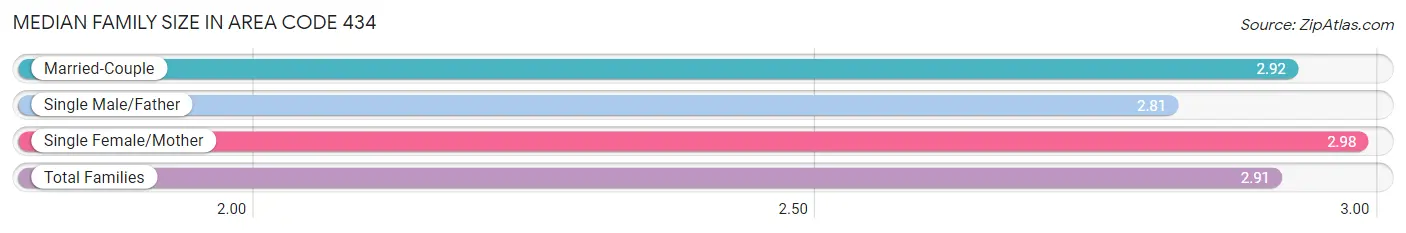
Median Family Size in Area Code 434
The median family size in Area Code 434 is 2.91 persons per family, with single female/mother families (34,461 | 21.5%) accounting for the largest median family size of 2.98342 persons per family. On the other hand, single male/father families (11,791 | 7.4%) represent the smallest median family size with 2.81 persons per family.
| Family Type | # Families | Family Size |
| Married-Couple | 113,820 (71.1%) | 2.92 |
| Single Male/Father | 11,791 (7.4%) | 2.81 |
| Single Female/Mother | 34,461 (21.5%) | 2.98 |
| Total Families | 160,072 (100.0%) | 2.91 |
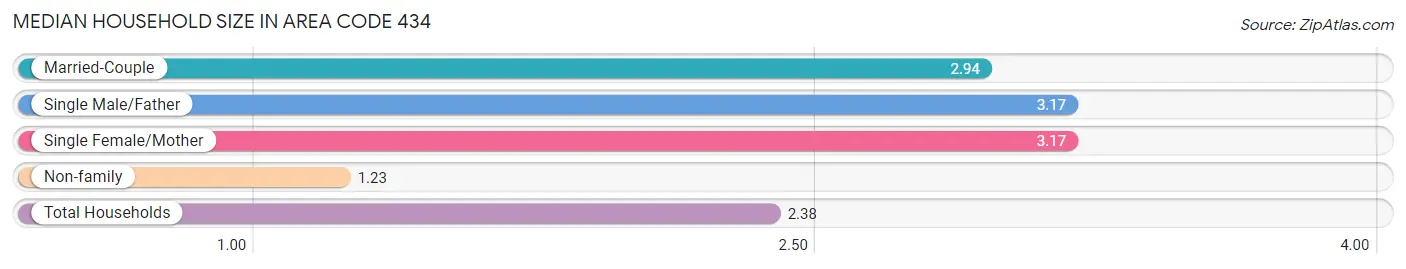
Median Household Size in Area Code 434
The median household size in Area Code 434 is 2.38 persons per household, with single female/mother households (34,461 | 13.2%) accounting for the largest median household size of 3.17342 persons per household. non-family households (101,044 | 38.7%) represent the smallest median household size with 1.23 persons per household.
| Household Type | # Households | Household Size |
| Married-Couple | 113,820 (43.6%) | 2.94 |
| Single Male/Father | 11,791 (4.5%) | 3.17 |
| Single Female/Mother | 34,461 (13.2%) | 3.17 |
| Non-family | 101,044 (38.7%) | 1.23 |
| Total Households | 261,116 (100.0%) | 2.38 |
Household Size by Marriage Status in Area Code 434
Out of a total of 261,116 households in Area Code 434, 160,072 (61.3%) are family households, while 101,044 (38.7%) are nonfamily households. The most numerous type of family households are 2-person households, comprising 80,235, and the most common type of nonfamily households are 1-person households, comprising 82,127.
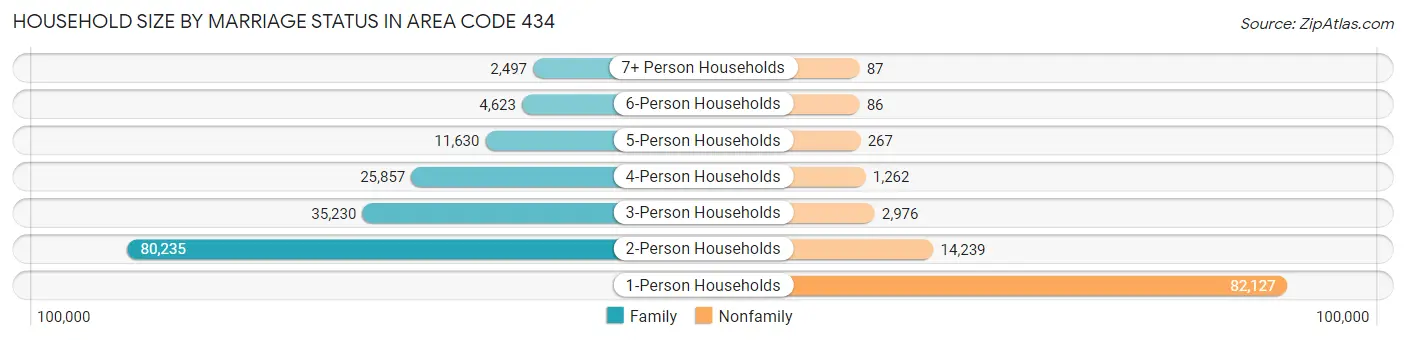
| Household Size | Family Households | Nonfamily Households |
| 1-Person Households | - | 82,127 (31.5%) |
| 2-Person Households | 80,235 (30.7%) | 14,239 (5.4%) |
| 3-Person Households | 35,230 (13.5%) | 2,976 (1.1%) |
| 4-Person Households | 25,857 (9.9%) | 1,262 (0.5%) |
| 5-Person Households | 11,630 (4.4%) | 267 (0.1%) |
| 6-Person Households | 4,623 (1.8%) | 86 (0.0%) |
| 7+ Person Households | 2,497 (1.0%) | 87 (0.0%) |
| Total | 160,072 (61.3%) | 101,044 (38.7%) |
Female Fertility in Area Code 434
Fertility by Age in Area Code 434
Average fertility rate in Area Code 434 is 71.6 births per 1,000 women. Women in the age bracket of 20 to 34 years have the highest fertility rate with 146.9 births per 1,000 women. Women in the age bracket of 20 to 34 years acount for 78.6% of all women with births.
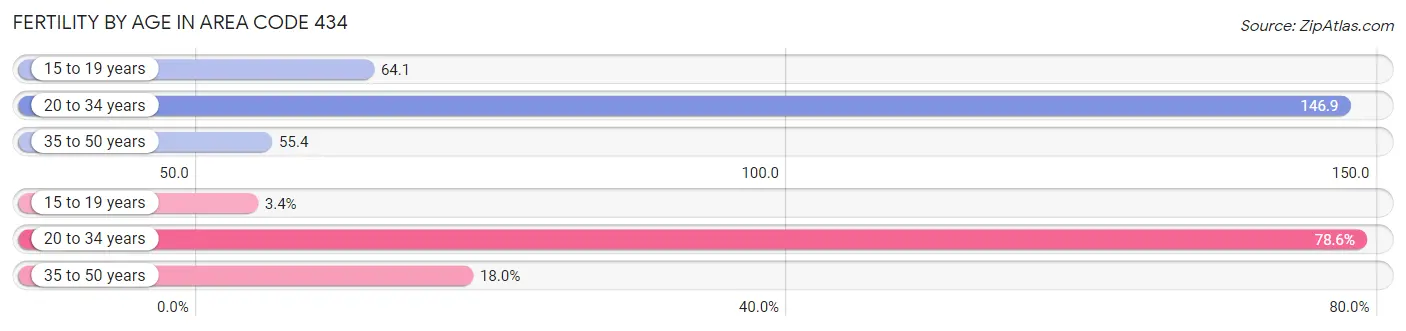
| Age Bracket | Women with Births | Births / 1,000 Women |
| 15 to 19 years | 234 (3.4%) | 64.1 |
| 20 to 34 years | 5,449 (78.6%) | 146.9 |
| 35 to 50 years | 1,246 (18.0%) | 55.4 |
| Total | 6,929 (100.0%) | 71.6 |
Fertility by Age by Marriage Status in Area Code 434
44.4% of women with births (6,929) in Area Code 434 are married. The highest percentage of unmarried women with births falls into 15 to 19 years age bracket with 100.0% of them unmarried at the time of birth, while the lowest percentage of unmarried women with births belong to 20 to 34 years age bracket with 62.1% of them unmarried.
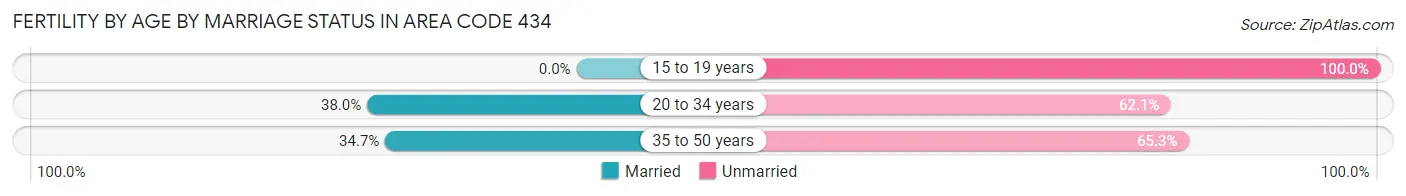
| Age Bracket | Married | Unmarried |
| 15 to 19 years | 0 (0.0%) | 234 (100.0%) |
| 20 to 34 years | 2,068 (38.0%) | 3,381 (62.1%) |
| 35 to 50 years | 432 (34.7%) | 814 (65.3%) |
| Total | 3,076 (44.4%) | 3,853 (55.6%) |
Fertility by Education in Area Code 434
Average fertility rate in Area Code 434 is 71.6 births per 1,000 women. Women with the education attainment of graduate degree have the highest fertility rate of 197.7 births per 1,000 women, while women with the education attainment of bachelor's degree have the lowest fertility at 105.2 births per 1,000 women. Women with the education attainment of college or associate's degree represent 32.8% of all women with births.
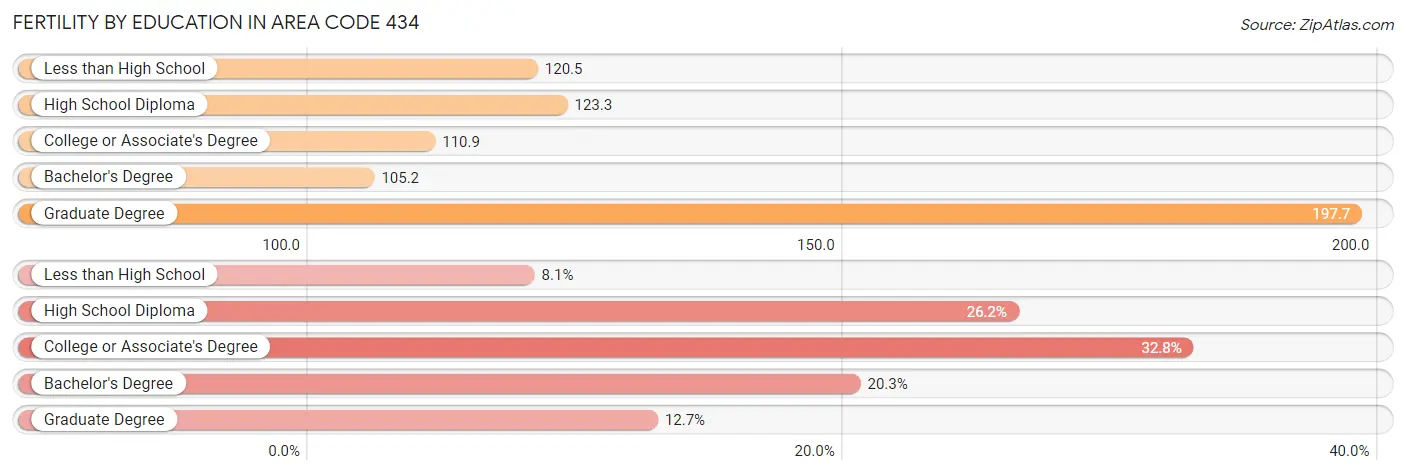
| Educational Attainment | Women with Births | Births / 1,000 Women |
| Less than High School | 559 (8.1%) | 120.5 |
| High School Diploma | 1,816 (26.2%) | 123.3 |
| College or Associate's Degree | 2,270 (32.8%) | 110.9 |
| Bachelor's Degree | 1,405 (20.3%) | 105.2 |
| Graduate Degree | 879 (12.7%) | 197.7 |
| Total | 6,929 (100.0%) | 71.6 |
Fertility by Education by Marriage Status in Area Code 434
55.6% of women with births in Area Code 434 are unmarried. Women with the educational attainment of bachelor's degree are most likely to be married with 28.7% of them married at childbirth, while women with the educational attainment of less than high school are least likely to be married with 91.1% of them unmarried at childbirth.
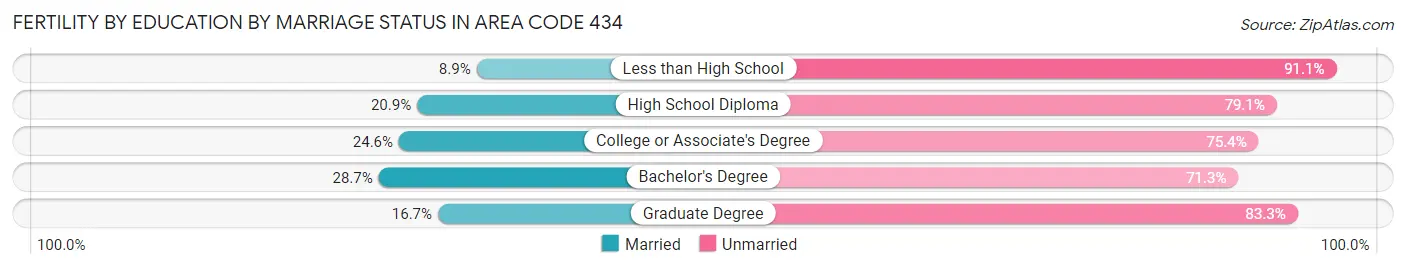
| Educational Attainment | Married | Unmarried |
| Less than High School | 50 (8.9%) | 509 (91.1%) |
| High School Diploma | 380 (20.9%) | 1,436 (79.1%) |
| College or Associate's Degree | 558 (24.6%) | 1,712 (75.4%) |
| Bachelor's Degree | 403 (28.7%) | 1,002 (71.3%) |
| Graduate Degree | 147 (16.7%) | 732 (83.3%) |
| Total | 3,076 (44.4%) | 3,853 (55.6%) |
Employment Characteristics in Area Code 434
Employment by Class of Employer in Area Code 434
Among the 291,564 employed individuals in Area Code 434, private company employees (180,358 | 61.9%), not-for-profit organizations (28,942 | 9.9%), and local government employees (24,507 | 8.4%) make up the most common classes of employment.
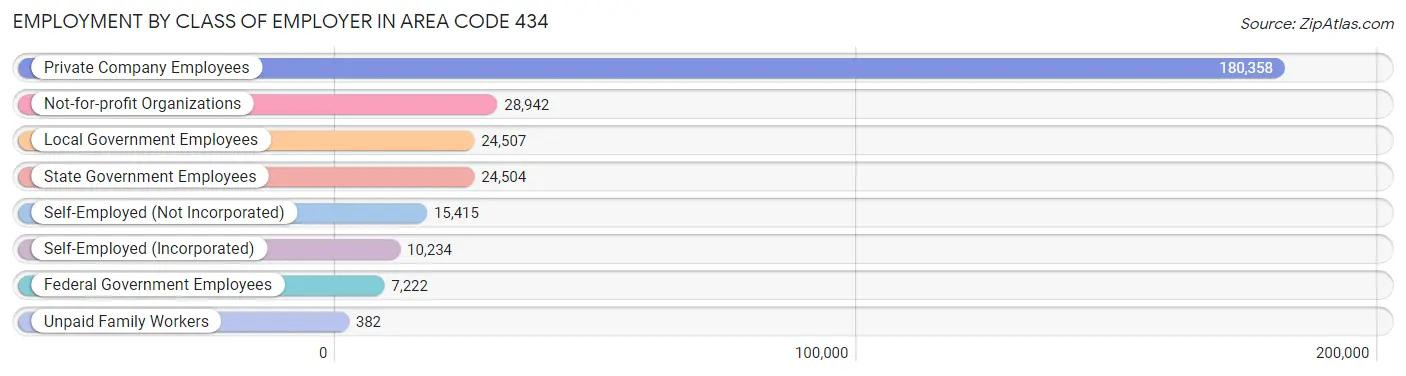
| Employer Class | # Employees | % Employees |
| Private Company Employees | 180,358 | 61.9% |
| Self-Employed (Incorporated) | 10,234 | 3.5% |
| Self-Employed (Not Incorporated) | 15,415 | 5.3% |
| Not-for-profit Organizations | 28,942 | 9.9% |
| Local Government Employees | 24,507 | 8.4% |
| State Government Employees | 24,504 | 8.4% |
| Federal Government Employees | 7,222 | 2.5% |
| Unpaid Family Workers | 382 | 0.1% |
| Total | 291,564 | 100.0% |
Employment Status by Age in Area Code 434
According to the labor force statistics for Area Code 434, out of the total population over 16 years of age (552,459), 53.1% or 293,245 individuals are in the labor force, with 5.3% or 15,689 of them unemployed. The age group with the highest labor force participation rate is 25 to 29 years, with 80.3% or 35,706 individuals in the labor force. Within the labor force, the 20 to 24 years age range has the highest percentage of unemployed individuals, with 931.0% or 360,139 of them being unemployed.
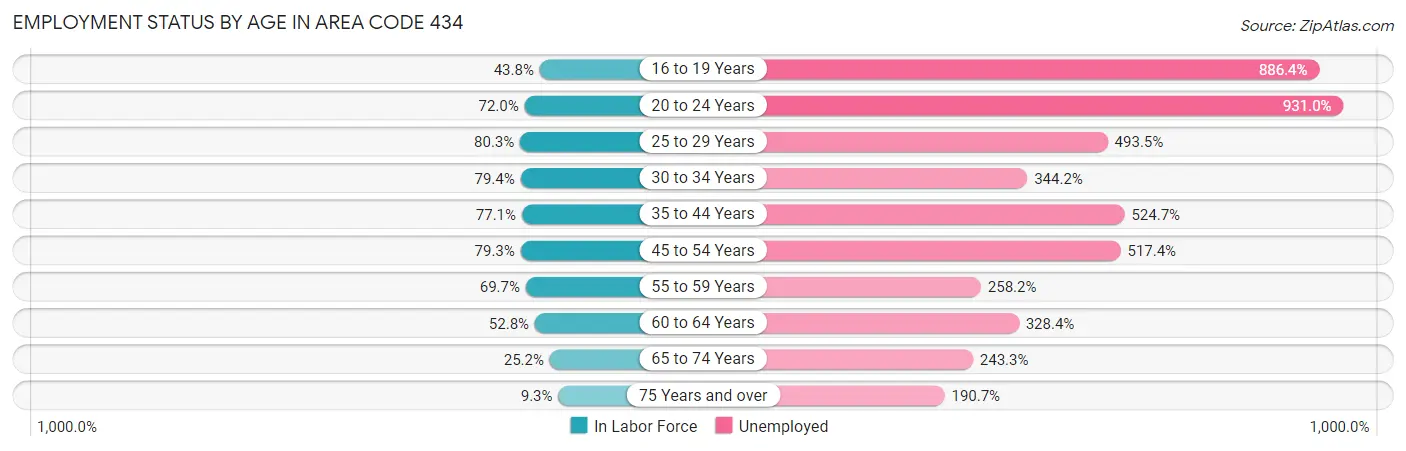
| Age Bracket | In Labor Force | Unemployed |
| 16 to 19 Years | 18,472 (43.8%) | 163,762 (886.4%) |
| 20 to 24 Years | 38,685 (72.0%) | 360,139 (931.0%) |
| 25 to 29 Years | 35,706 (80.3%) | 176,209 (493.5%) |
| 30 to 34 Years | 32,307 (79.4%) | 111,204 (344.2%) |
| 35 to 44 Years | 56,869 (77.1%) | 298,397 (524.7%) |
| 45 to 54 Years | 61,225 (79.3%) | 316,794 (517.4%) |
| 55 to 59 Years | 31,206 (69.7%) | 80,571 (258.2%) |
| 60 to 64 Years | 23,552 (52.8%) | 77,338 (328.4%) |
| 65 to 74 Years | 18,909 (25.2%) | 46,006 (243.3%) |
| 75 Years and over | 5,201 (9.3%) | 9,918 (190.7%) |
| Total | 293,260 (53.1%) | 15,693 (5.3%) |
Employment Status by Educational Attainment in Area Code 434
According to labor force statistics for Area Code 434, 72.0% of individuals (234,213) out of the total population between 25 and 64 years of age (325,522) are in the labor force, with 407.0% or 953,247 of them being unemployed. The group with the highest labor force participation rate are those with the educational attainment of bachelor's degree or higher, with 85.1% or 88,536 individuals in the labor force. Within the labor force, individuals with less than high school education have the highest percentage of unemployment, with 586.6% or 107,489 of them being unemployed.
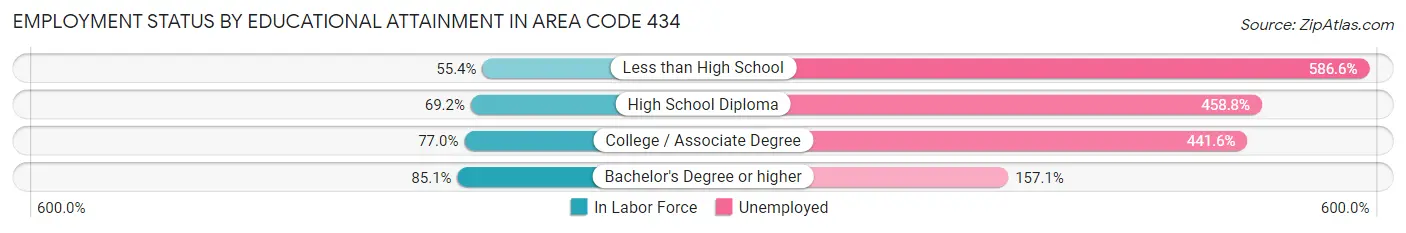
| Educational Attainment | In Labor Force | Unemployed |
| Less than High School | 18,326 (55.4%) | 193,953 (586.6%) |
| High School Diploma | 67,379 (69.2%) | 446,587 (458.8%) |
| College / Associate Degree | 70,185 (77.0%) | 402,434 (441.6%) |
| Bachelor's Degree or higher | 88,532 (85.1%) | 163,367 (157.1%) |
| Total | 234,216 (72.0%) | 1,324,875 (407.0%) |
Employment Occupations by Sex in Area Code 434
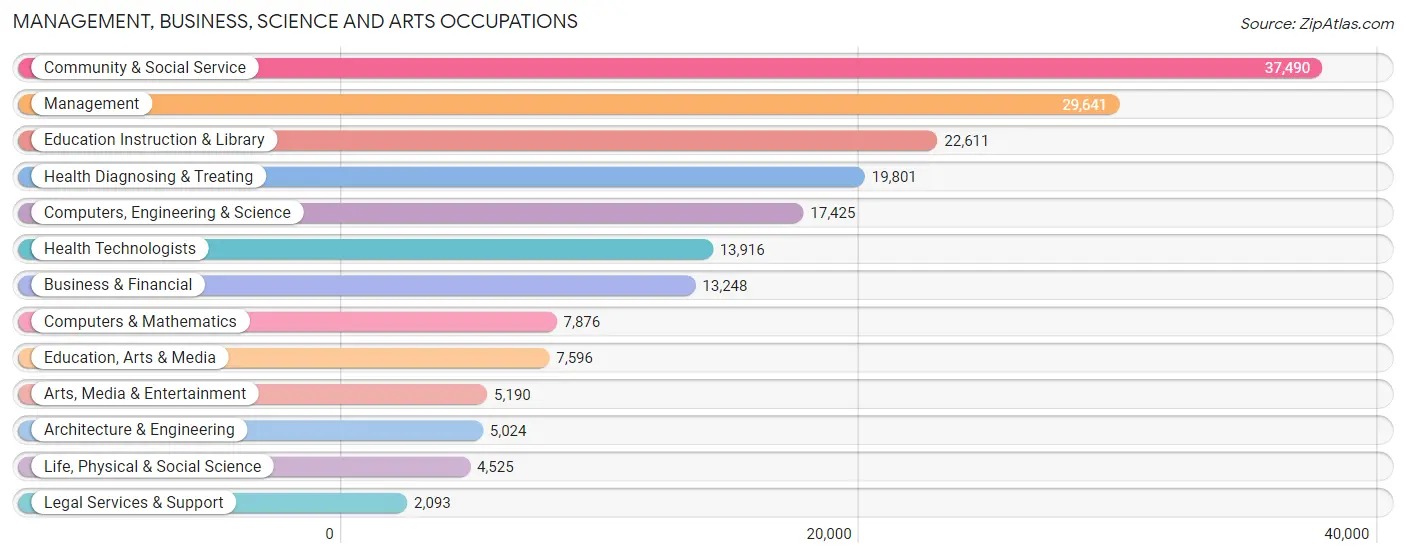
Management, Business, Science and Arts Occupations
The most common Management, Business, Science and Arts occupations in Area Code 434 are Community & Social Service (37,490 | 12.6%), Management (29,641 | 9.9%), Education Instruction & Library (22,611 | 7.6%), Health Diagnosing & Treating (19,801 | 6.6%), and Computers, Engineering & Science (17,425 | 5.8%).
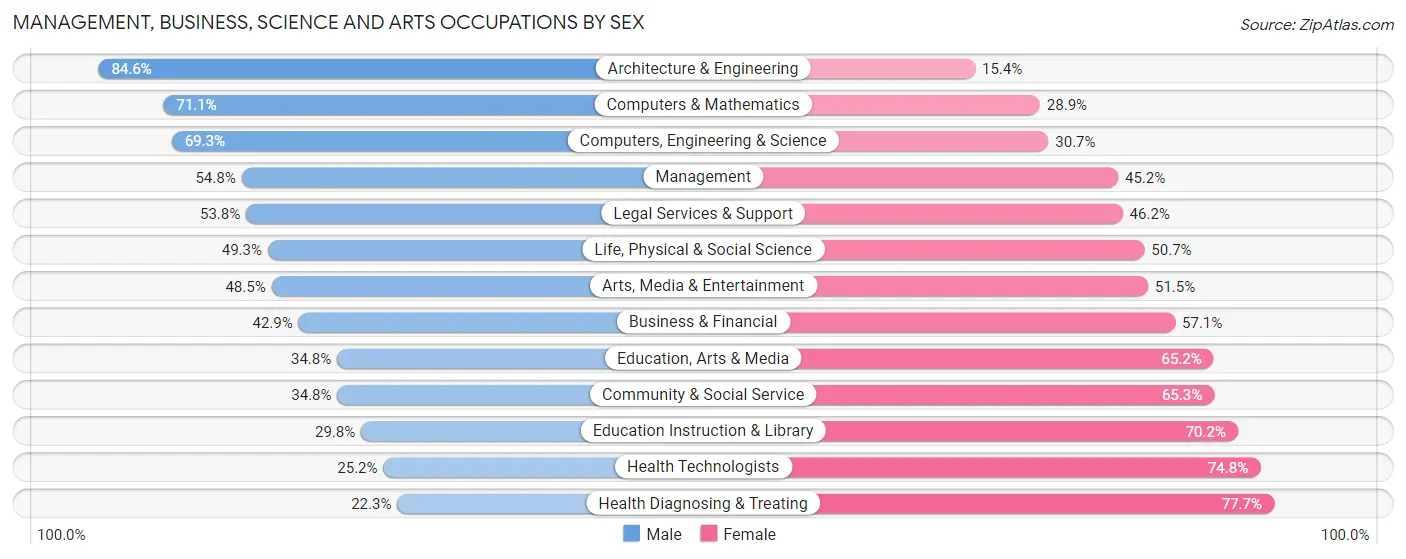
Management, Business, Science and Arts Occupations by Sex
Within the Management, Business, Science and Arts occupations in Area Code 434, the most male-oriented occupations are Architecture & Engineering (84.6%), Computers & Mathematics (71.1%), and Computers, Engineering & Science (69.3%), while the most female-oriented occupations are Health Diagnosing & Treating (77.7%), Health Technologists (74.8%), and Education Instruction & Library (70.2%).
| Occupation | Male | Female |
| Management | 16,232 (54.8%) | 13,409 (45.2%) |
| Business & Financial | 5,678 (42.9%) | 7,570 (57.1%) |
| Computers, Engineering & Science | 12,076 (69.3%) | 5,349 (30.7%) |
| Computers & Mathematics | 5,597 (71.1%) | 2,279 (28.9%) |
| Architecture & Engineering | 4,250 (84.6%) | 774 (15.4%) |
| Life, Physical & Social Science | 2,229 (49.3%) | 2,296 (50.7%) |
| Community & Social Service | 13,028 (34.7%) | 24,462 (65.2%) |
| Education, Arts & Media | 2,646 (34.8%) | 4,950 (65.2%) |
| Legal Services & Support | 1,126 (53.8%) | 967 (46.2%) |
| Education Instruction & Library | 6,739 (29.8%) | 15,872 (70.2%) |
| Arts, Media & Entertainment | 2,517 (48.5%) | 2,673 (51.5%) |
| Health Diagnosing & Treating | 4,409 (22.3%) | 15,392 (77.7%) |
| Health Technologists | 3,501 (25.2%) | 10,415 (74.8%) |
| Total (Category) | 51,423 (43.7%) | 66,182 (56.3%) |
| Total (Overall) | 150,318 (50.4%) | 148,060 (49.6%) |
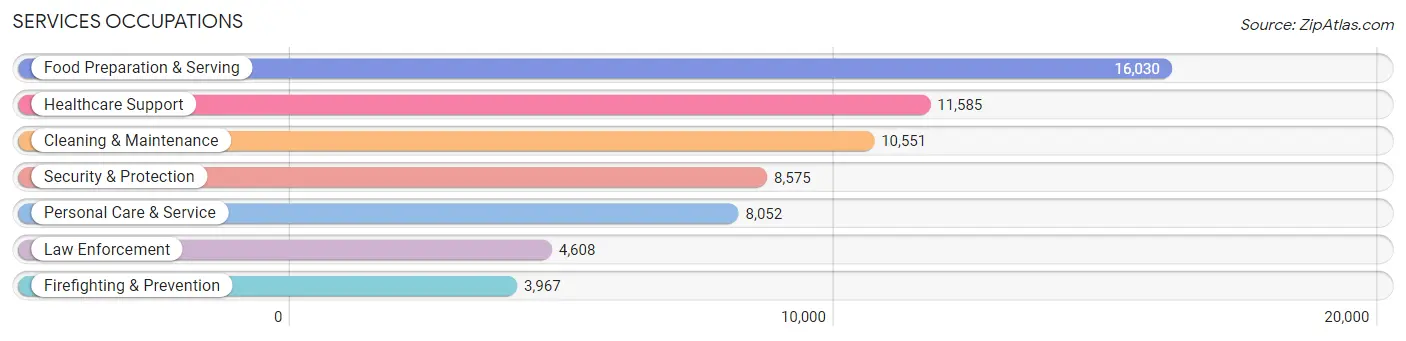
Services Occupations
The most common Services occupations in Area Code 434 are Food Preparation & Serving (16,030 | 5.4%), Healthcare Support (11,585 | 3.9%), Cleaning & Maintenance (10,551 | 3.5%), Security & Protection (8,575 | 2.9%), and Personal Care & Service (8,052 | 2.7%).
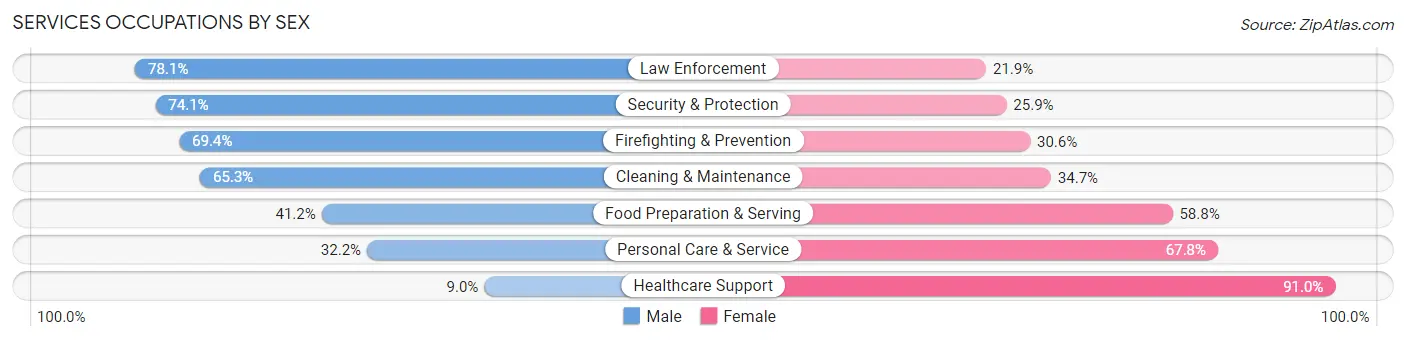
Services Occupations by Sex
Within the Services occupations in Area Code 434, the most male-oriented occupations are Law Enforcement (78.1%), Security & Protection (74.1%), and Firefighting & Prevention (69.4%), while the most female-oriented occupations are Healthcare Support (91.0%), Personal Care & Service (67.8%), and Food Preparation & Serving (58.8%).
| Occupation | Male | Female |
| Healthcare Support | 1,041 (9.0%) | 10,544 (91.0%) |
| Security & Protection | 6,353 (74.1%) | 2,222 (25.9%) |
| Firefighting & Prevention | 2,753 (69.4%) | 1,214 (30.6%) |
| Law Enforcement | 3,600 (78.1%) | 1,008 (21.9%) |
| Food Preparation & Serving | 6,605 (41.2%) | 9,425 (58.8%) |
| Cleaning & Maintenance | 6,887 (65.3%) | 3,664 (34.7%) |
| Personal Care & Service | 2,594 (32.2%) | 5,458 (67.8%) |
| Total (Category) | 23,480 (42.8%) | 31,313 (57.2%) |
| Total (Overall) | 150,318 (50.4%) | 148,060 (49.6%) |
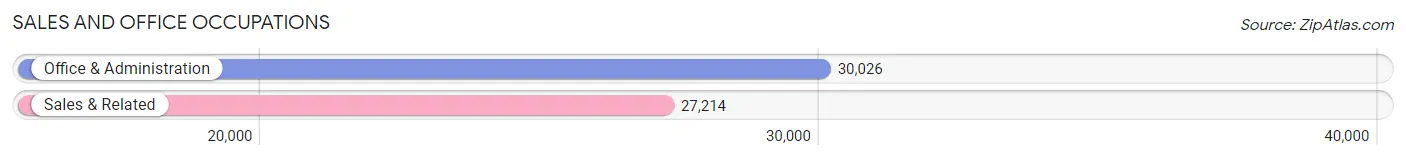
Sales and Office Occupations
The most common Sales and Office occupations in Area Code 434 are Office & Administration (30,026 | 10.1%), and Sales & Related (27,214 | 9.1%).
Sales and Office Occupations by Sex
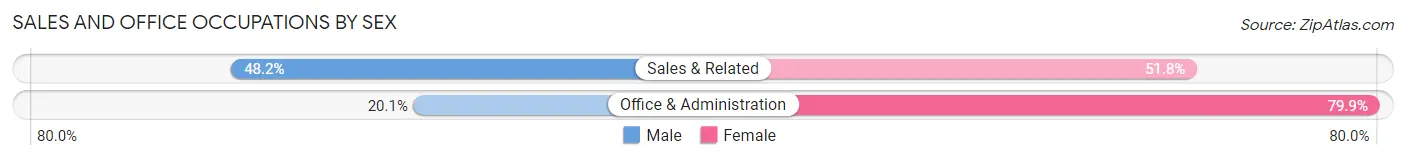
| Occupation | Male | Female |
| Sales & Related | 13,119 (48.2%) | 14,095 (51.8%) |
| Office & Administration | 6,044 (20.1%) | 23,982 (79.9%) |
| Total (Category) | 19,163 (33.5%) | 38,077 (66.5%) |
| Total (Overall) | 150,318 (50.4%) | 148,060 (49.6%) |
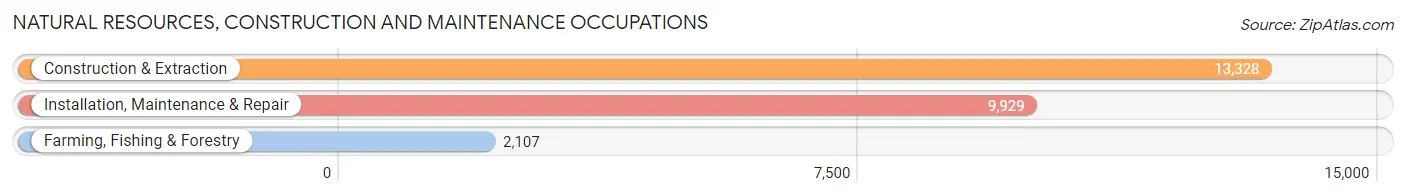
Natural Resources, Construction and Maintenance Occupations
The most common Natural Resources, Construction and Maintenance occupations in Area Code 434 are Construction & Extraction (13,328 | 4.5%), Installation, Maintenance & Repair (9,929 | 3.3%), and Farming, Fishing & Forestry (2,107 | 0.7%).
Natural Resources, Construction and Maintenance Occupations by Sex
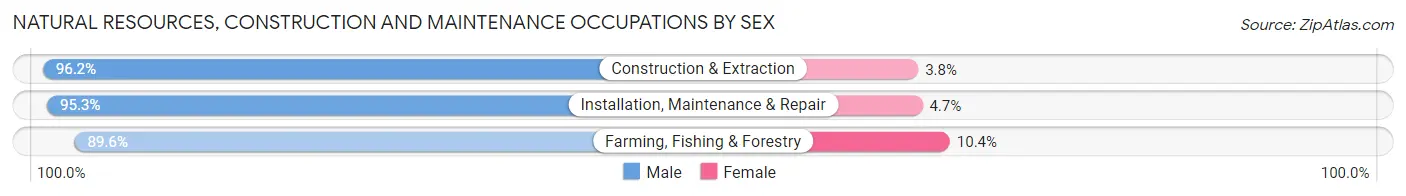
| Occupation | Male | Female |
| Farming, Fishing & Forestry | 1,888 (89.6%) | 219 (10.4%) |
| Construction & Extraction | 12,821 (96.2%) | 507 (3.8%) |
| Installation, Maintenance & Repair | 9,463 (95.3%) | 466 (4.7%) |
| Total (Category) | 24,172 (95.3%) | 1,192 (4.7%) |
| Total (Overall) | 150,318 (50.4%) | 148,060 (49.6%) |
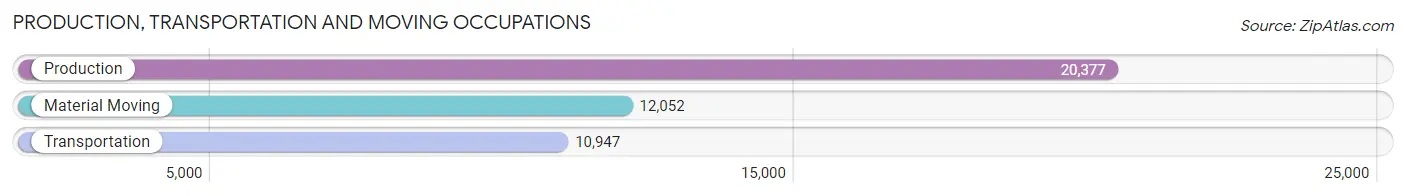
Production, Transportation and Moving Occupations
The most common Production, Transportation and Moving occupations in Area Code 434 are Production (20,377 | 6.8%), Material Moving (12,052 | 4.0%), and Transportation (10,947 | 3.7%).
Production, Transportation and Moving Occupations by Sex
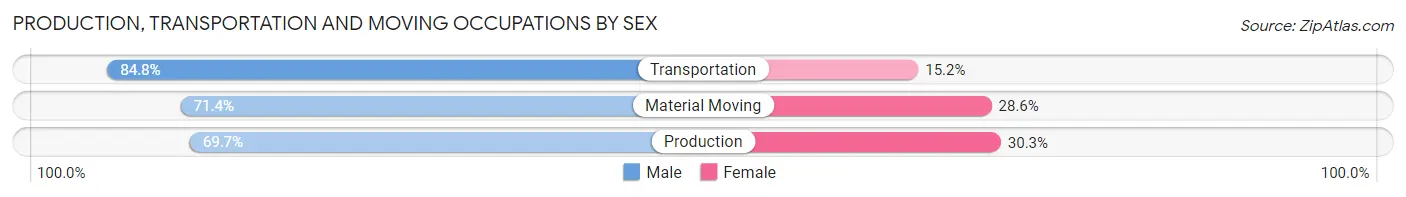
| Occupation | Male | Female |
| Production | 14,196 (69.7%) | 6,181 (30.3%) |
| Transportation | 9,284 (84.8%) | 1,663 (15.2%) |
| Material Moving | 8,600 (71.4%) | 3,452 (28.6%) |
| Total (Category) | 32,080 (74.0%) | 11,296 (26.0%) |
| Total (Overall) | 150,318 (50.4%) | 148,060 (49.6%) |
Employment Industries by Sex in Area Code 434
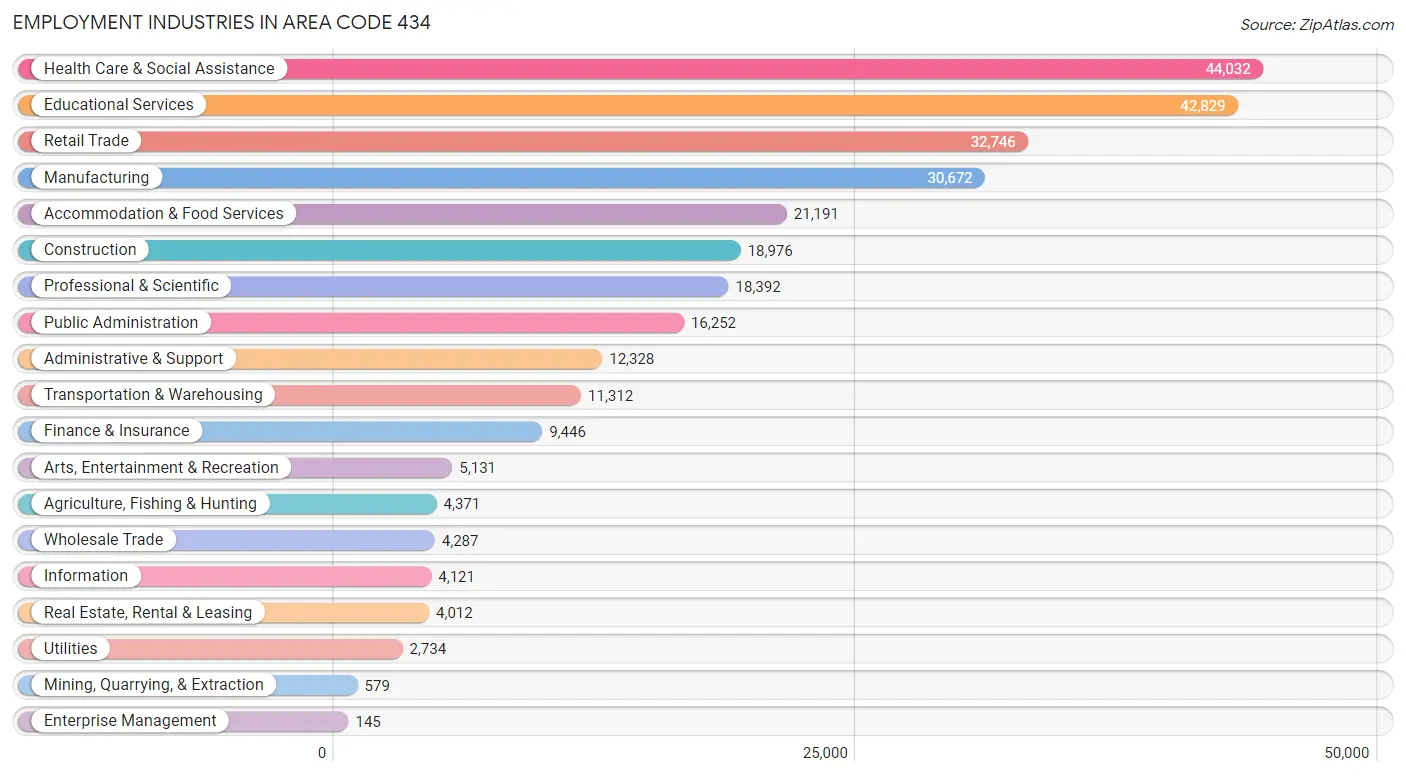
Employment Industries in Area Code 434
The major employment industries in Area Code 434 include Health Care & Social Assistance (44,032 | 14.8%), Educational Services (42,829 | 14.3%), Retail Trade (32,746 | 11.0%), Manufacturing (30,672 | 10.3%), and Accommodation & Food Services (21,191 | 7.1%).
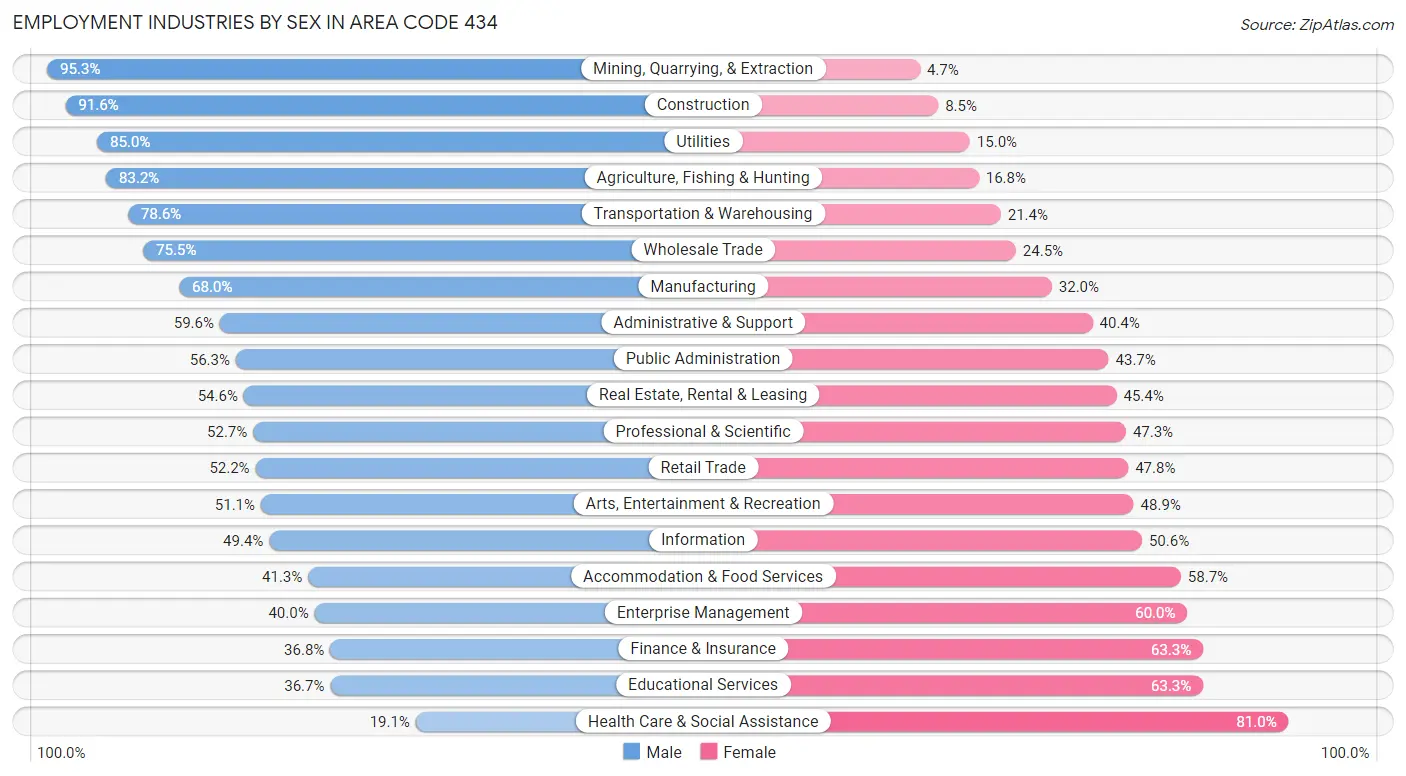
Employment Industries by Sex in Area Code 434
The Area Code 434 industries that see more men than women are Mining, Quarrying, & Extraction (95.3%), Construction (91.5%), and Utilities (85.0%), whereas the industries that tend to have a higher number of women are Health Care & Social Assistance (80.9%), Educational Services (63.3%), and Finance & Insurance (63.2%).
| Industry | Male | Female |
| Agriculture, Fishing & Hunting | 3,635 (83.2%) | 736 (16.8%) |
| Mining, Quarrying, & Extraction | 552 (95.3%) | 27 (4.7%) |
| Construction | 17,372 (91.5%) | 1,604 (8.5%) |
| Manufacturing | 20,865 (68.0%) | 9,807 (32.0%) |
| Wholesale Trade | 3,236 (75.5%) | 1,051 (24.5%) |
| Retail Trade | 17,099 (52.2%) | 15,647 (47.8%) |
| Transportation & Warehousing | 8,892 (78.6%) | 2,420 (21.4%) |
| Utilities | 2,324 (85.0%) | 410 (15.0%) |
| Information | 2,035 (49.4%) | 2,086 (50.6%) |
| Finance & Insurance | 3,471 (36.7%) | 5,975 (63.2%) |
| Real Estate, Rental & Leasing | 2,192 (54.6%) | 1,820 (45.4%) |
| Professional & Scientific | 9,692 (52.7%) | 8,700 (47.3%) |
| Enterprise Management | 58 (40.0%) | 87 (60.0%) |
| Administrative & Support | 7,348 (59.6%) | 4,980 (40.4%) |
| Educational Services | 15,733 (36.7%) | 27,096 (63.3%) |
| Health Care & Social Assistance | 8,386 (19.1%) | 35,646 (80.9%) |
| Arts, Entertainment & Recreation | 2,622 (51.1%) | 2,509 (48.9%) |
| Accommodation & Food Services | 8,757 (41.3%) | 12,434 (58.7%) |
| Public Administration | 9,149 (56.3%) | 7,103 (43.7%) |
| Total | 150,318 (50.4%) | 148,060 (49.6%) |
Education in Area Code 434
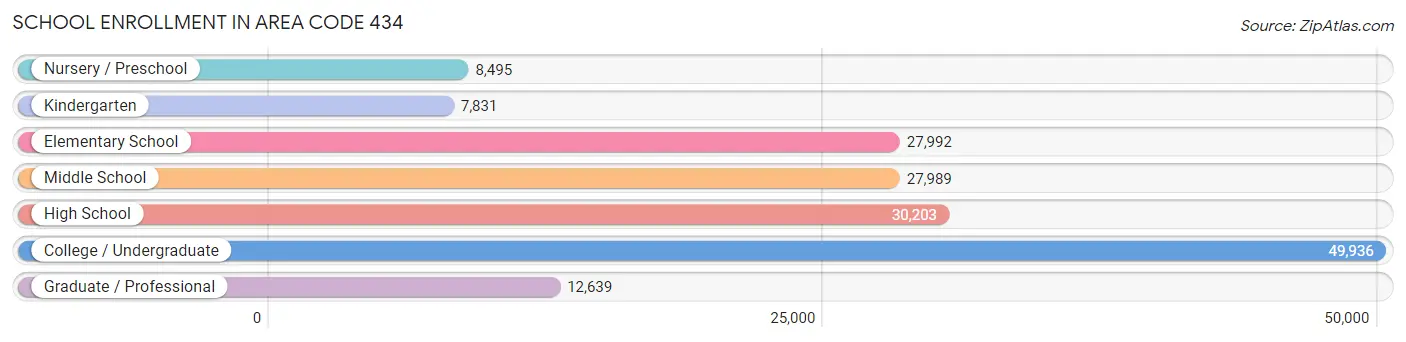
School Enrollment in Area Code 434
The most common levels of schooling among the 165,085 students in Area Code 434 are college / undergraduate (49,936 | 30.2%), high school (30,203 | 18.3%), and elementary school (27,992 | 17.0%).
| School Level | # Students | % Students |
| Nursery / Preschool | 8,495 | 5.1% |
| Kindergarten | 7,831 | 4.7% |
| Elementary School | 27,992 | 17.0% |
| Middle School | 27,989 | 17.0% |
| High School | 30,203 | 18.3% |
| College / Undergraduate | 49,936 | 30.2% |
| Graduate / Professional | 12,639 | 7.7% |
| Total | 165,085 | 100.0% |
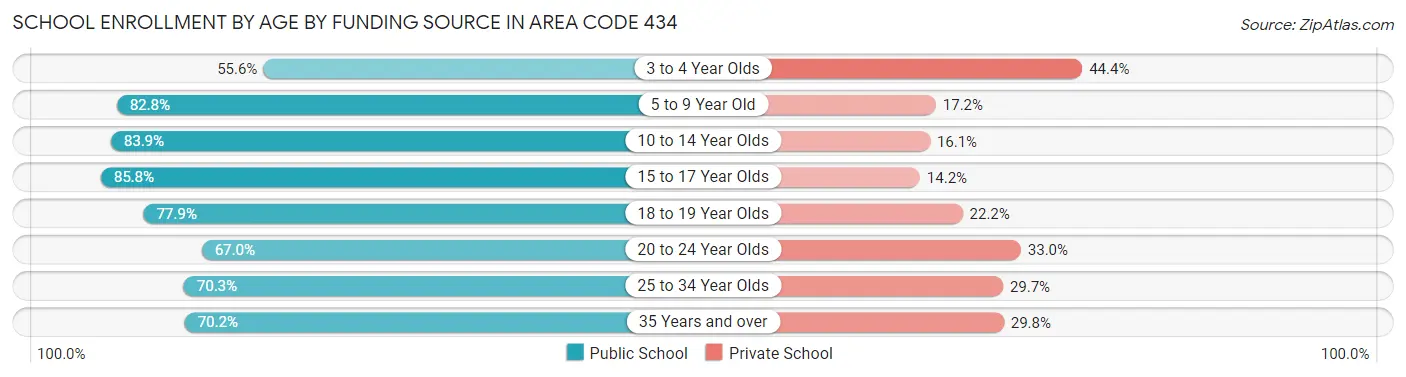
School Enrollment by Age by Funding Source in Area Code 434
Out of a total of 165,085 students who are enrolled in schools in Area Code 434, 36,966 (22.4%) attend a private institution, while the remaining 128,119 (77.6%) are enrolled in public schools. The age group of 3 to 4 year olds has the highest likelihood of being enrolled in private schools, with 3,159 (44.4% in the age bracket) enrolled. Conversely, the age group of 15 to 17 year olds has the lowest likelihood of being enrolled in a private school, with 18,541 (85.8% in the age bracket) attending a public institution.
| Age Bracket | Public School | Private School |
| 3 to 4 Year Olds | 3,949 (55.6%) | 3,159 (44.4%) |
| 5 to 9 Year Old | 27,953 (82.8%) | 5,796 (17.2%) |
| 10 to 14 Year Olds | 29,352 (83.9%) | 5,621 (16.1%) |
| 15 to 17 Year Olds | 18,541 (85.8%) | 3,068 (14.2%) |
| 18 to 19 Year Olds | 17,496 (77.8%) | 4,977 (22.2%) |
| 20 to 24 Year Olds | 18,677 (67.0%) | 9,201 (33.0%) |
| 25 to 34 Year Olds | 7,057 (70.3%) | 2,977 (29.7%) |
| 35 Years and over | 5,095 (70.2%) | 2,166 (29.8%) |
| Total | 128,119 (77.6%) | 36,966 (22.4%) |
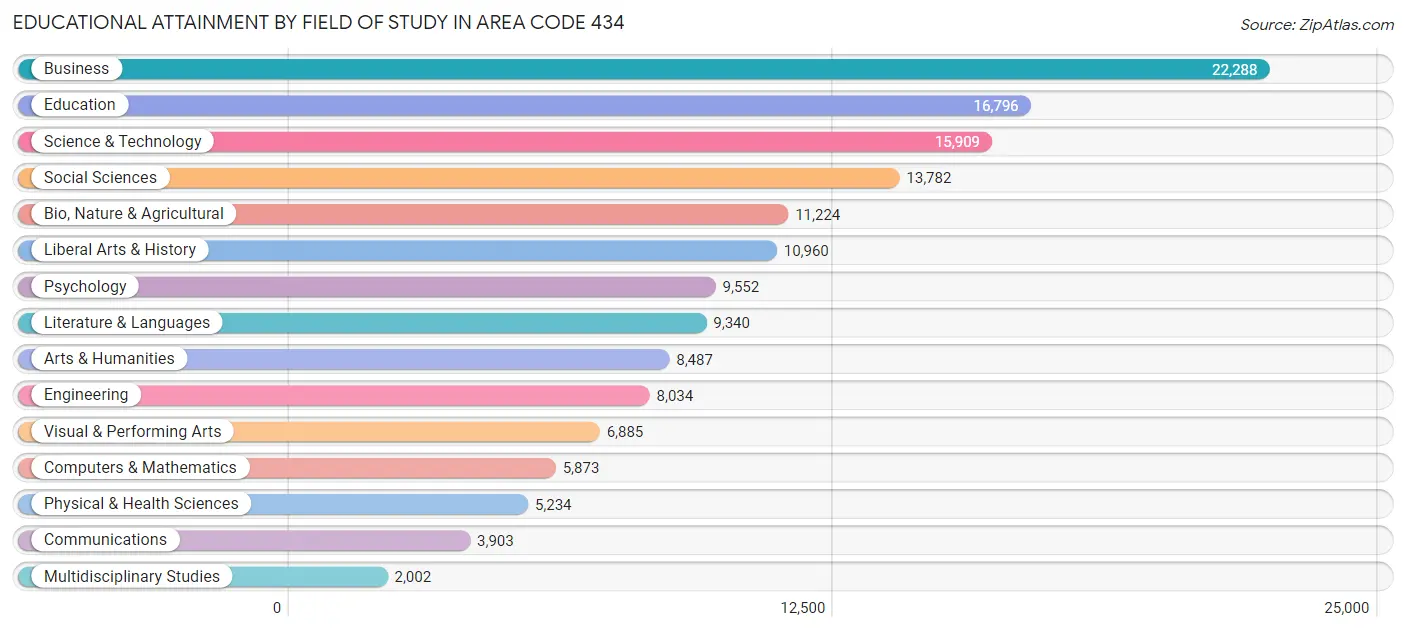
Educational Attainment by Field of Study in Area Code 434
Business (22,288 | 14.8%), education (16,796 | 11.2%), science & technology (15,909 | 10.6%), social sciences (13,782 | 9.2%), and bio, nature & agricultural (11,224 | 7.5%) are the most common fields of study among 150,269 individuals in Area Code 434 who have obtained a bachelor's degree or higher.
| Field of Study | # Graduates | % Graduates |
| Computers & Mathematics | 5,873 | 3.9% |
| Bio, Nature & Agricultural | 11,224 | 7.5% |
| Physical & Health Sciences | 5,234 | 3.5% |
| Psychology | 9,552 | 6.4% |
| Social Sciences | 13,782 | 9.2% |
| Engineering | 8,034 | 5.3% |
| Multidisciplinary Studies | 2,002 | 1.3% |
| Science & Technology | 15,909 | 10.6% |
| Business | 22,288 | 14.8% |
| Education | 16,796 | 11.2% |
| Literature & Languages | 9,340 | 6.2% |
| Liberal Arts & History | 10,960 | 7.3% |
| Visual & Performing Arts | 6,885 | 4.6% |
| Communications | 3,903 | 2.6% |
| Arts & Humanities | 8,487 | 5.7% |
| Total | 150,269 | 100.0% |
Transportation & Commute in Area Code 434
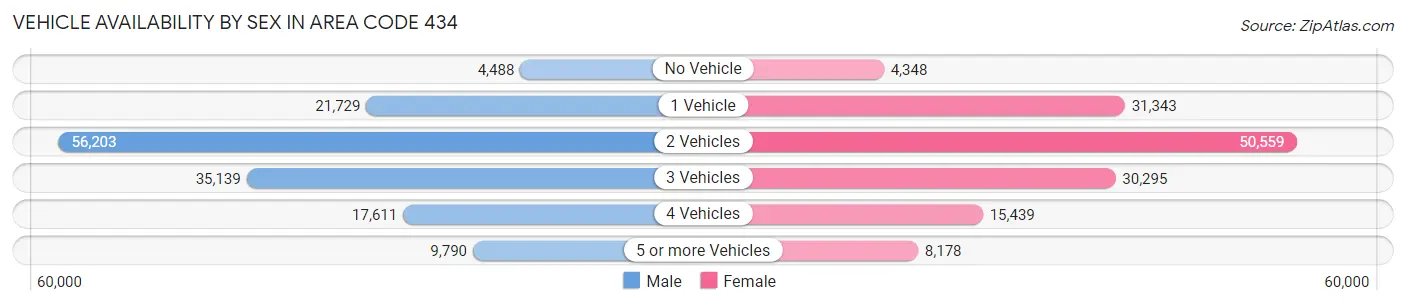
Vehicle Availability by Sex in Area Code 434
The most prevalent vehicle ownership categories in Area Code 434 are males with 2 vehicles (56,203, accounting for 38.8%) and females with 2 vehicles (50,559, making up 40.1%).
| Vehicles Available | Male | Female |
| No Vehicle | 4,488 (3.1%) | 4,348 (3.1%) |
| 1 Vehicle | 21,729 (15.0%) | 31,343 (22.4%) |
| 2 Vehicles | 56,203 (38.8%) | 50,559 (36.1%) |
| 3 Vehicles | 35,139 (24.2%) | 30,295 (21.6%) |
| 4 Vehicles | 17,611 (12.1%) | 15,439 (11.0%) |
| 5 or more Vehicles | 9,790 (6.8%) | 8,178 (5.8%) |
| Total | 144,960 (100.0%) | 140,162 (100.0%) |
Commute Time in Area Code 434
The most frequently occuring commute durations in Area Code 434 are 15 to 19 minutes (46,952 commuters, 17.9%), 10 to 14 minutes (44,579 commuters, 17.0%), and 20 to 24 minutes (37,244 commuters, 14.2%).
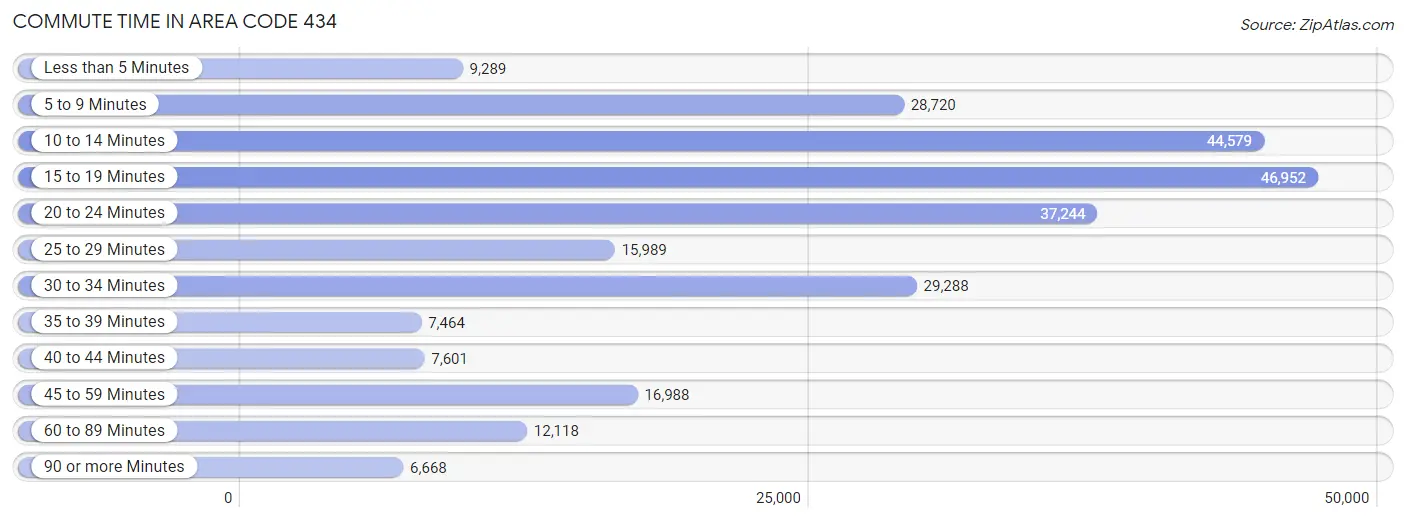
| Commute Time | # Commuters | % Commuters |
| Less than 5 Minutes | 9,289 | 3.5% |
| 5 to 9 Minutes | 28,720 | 10.9% |
| 10 to 14 Minutes | 44,579 | 17.0% |
| 15 to 19 Minutes | 46,952 | 17.9% |
| 20 to 24 Minutes | 37,244 | 14.2% |
| 25 to 29 Minutes | 15,989 | 6.1% |
| 30 to 34 Minutes | 29,288 | 11.1% |
| 35 to 39 Minutes | 7,464 | 2.8% |
| 40 to 44 Minutes | 7,601 | 2.9% |
| 45 to 59 Minutes | 16,988 | 6.5% |
| 60 to 89 Minutes | 12,118 | 4.6% |
| 90 or more Minutes | 6,668 | 2.5% |
Commute Time by Sex in Area Code 434
The most common commute times in Area Code 434 are 15 to 19 minutes (23,094 commuters, 17.2%) for males and 15 to 19 minutes (23,858 commuters, 18.6%) for females.
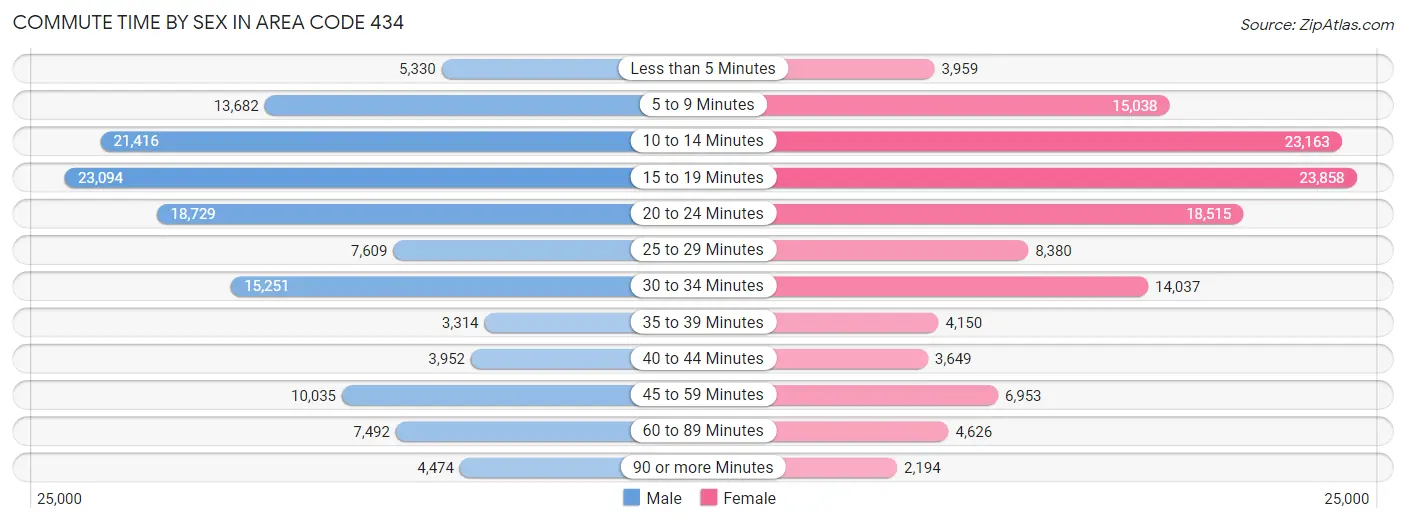
| Commute Time | Male | Female |
| Less than 5 Minutes | 5,330 (4.0%) | 3,959 (3.1%) |
| 5 to 9 Minutes | 13,682 (10.2%) | 15,038 (11.7%) |
| 10 to 14 Minutes | 21,416 (15.9%) | 23,163 (18.0%) |
| 15 to 19 Minutes | 23,094 (17.2%) | 23,858 (18.6%) |
| 20 to 24 Minutes | 18,729 (13.9%) | 18,515 (14.4%) |
| 25 to 29 Minutes | 7,609 (5.7%) | 8,380 (6.5%) |
| 30 to 34 Minutes | 15,251 (11.4%) | 14,037 (10.9%) |
| 35 to 39 Minutes | 3,314 (2.5%) | 4,150 (3.2%) |
| 40 to 44 Minutes | 3,952 (2.9%) | 3,649 (2.8%) |
| 45 to 59 Minutes | 10,035 (7.5%) | 6,953 (5.4%) |
| 60 to 89 Minutes | 7,492 (5.6%) | 4,626 (3.6%) |
| 90 or more Minutes | 4,474 (3.3%) | 2,194 (1.7%) |
Time of Departure to Work by Sex in Area Code 434
The most frequent times of departure to work in Area Code 434 are 7:00 AM to 7:29 AM (19,715, 14.7%) for males and 7:30 AM to 7:59 AM (19,797, 15.4%) for females.
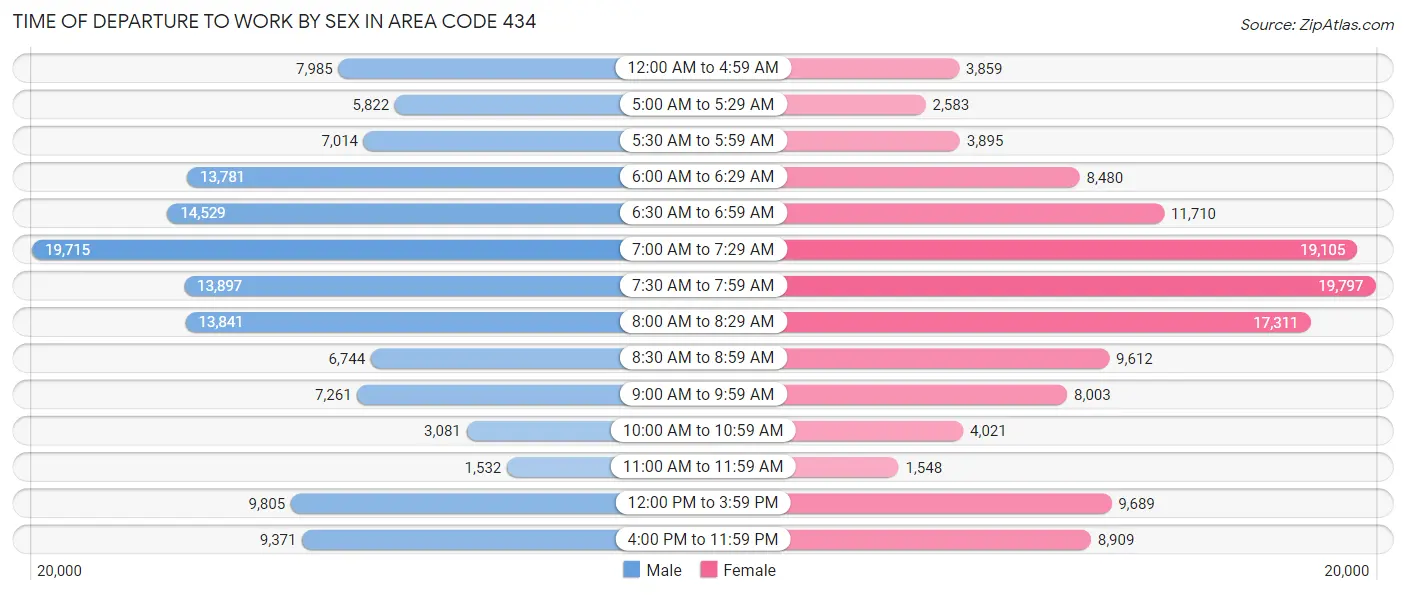
| Time of Departure | Male | Female |
| 12:00 AM to 4:59 AM | 7,985 (5.9%) | 3,859 (3.0%) |
| 5:00 AM to 5:29 AM | 5,822 (4.3%) | 2,583 (2.0%) |
| 5:30 AM to 5:59 AM | 7,014 (5.2%) | 3,895 (3.0%) |
| 6:00 AM to 6:29 AM | 13,781 (10.3%) | 8,480 (6.6%) |
| 6:30 AM to 6:59 AM | 14,529 (10.8%) | 11,710 (9.1%) |
| 7:00 AM to 7:29 AM | 19,715 (14.7%) | 19,105 (14.9%) |
| 7:30 AM to 7:59 AM | 13,897 (10.3%) | 19,797 (15.4%) |
| 8:00 AM to 8:29 AM | 13,841 (10.3%) | 17,311 (13.5%) |
| 8:30 AM to 8:59 AM | 6,744 (5.0%) | 9,612 (7.5%) |
| 9:00 AM to 9:59 AM | 7,261 (5.4%) | 8,003 (6.2%) |
| 10:00 AM to 10:59 AM | 3,081 (2.3%) | 4,021 (3.1%) |
| 11:00 AM to 11:59 AM | 1,532 (1.1%) | 1,548 (1.2%) |
| 12:00 PM to 3:59 PM | 9,805 (7.3%) | 9,689 (7.5%) |
| 4:00 PM to 11:59 PM | 9,371 (7.0%) | 8,909 (6.9%) |
| Total | 134,378 (100.0%) | 128,522 (100.0%) |
Housing Occupancy in Area Code 434
Occupancy by Ownership in Area Code 434
Of the total 261,116 dwellings in Area Code 434, owner-occupied units account for 171,161 (65.5%), while renter-occupied units make up 89,955 (34.4%).
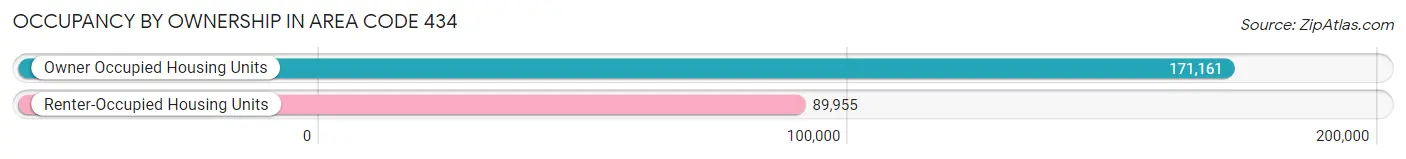
| Occupancy | # Housing Units | % Housing Units |
| Owner Occupied Housing Units | 171,161 | 65.5% |
| Renter-Occupied Housing Units | 89,955 | 34.4% |
| Total Occupied Housing Units | 261,116 | 100.0% |
Occupancy by Household Size in Area Code 434
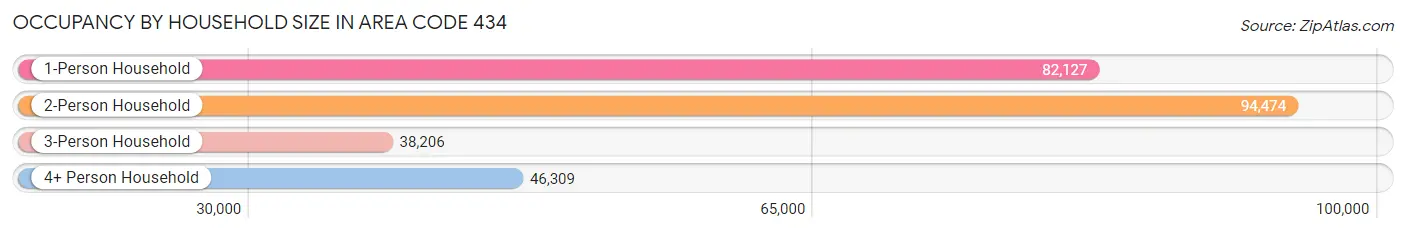
| Household Size | # Housing Units | % Housing Units |
| 1-Person Household | 82,127 | 31.5% |
| 2-Person Household | 94,474 | 36.2% |
| 3-Person Household | 38,206 | 14.6% |
| 4+ Person Household | 46,309 | 17.7% |
| Total Housing Units | 261,116 | 100.0% |
Occupancy by Ownership by Household Size in Area Code 434
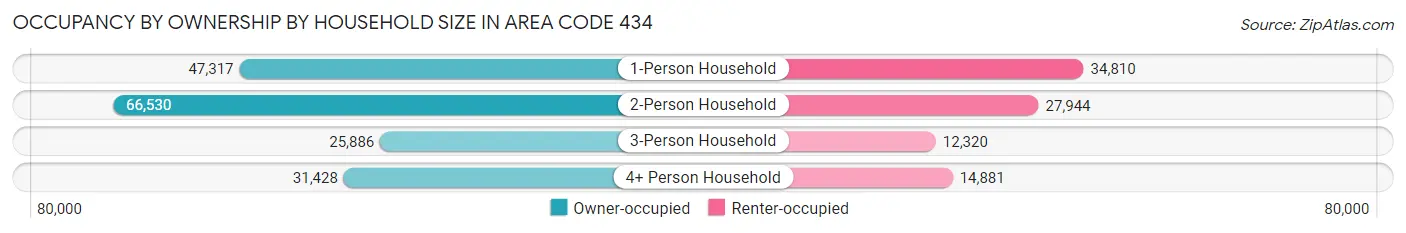
| Household Size | Owner-occupied | Renter-occupied |
| 1-Person Household | 47,317 (57.6%) | 34,810 (42.4%) |
| 2-Person Household | 66,530 (70.4%) | 27,944 (29.6%) |
| 3-Person Household | 25,886 (67.7%) | 12,320 (32.3%) |
| 4+ Person Household | 31,428 (67.9%) | 14,881 (32.1%) |
| Total Housing Units | 171,161 (65.5%) | 89,955 (34.4%) |
Occupancy by Educational Attainment in Area Code 434
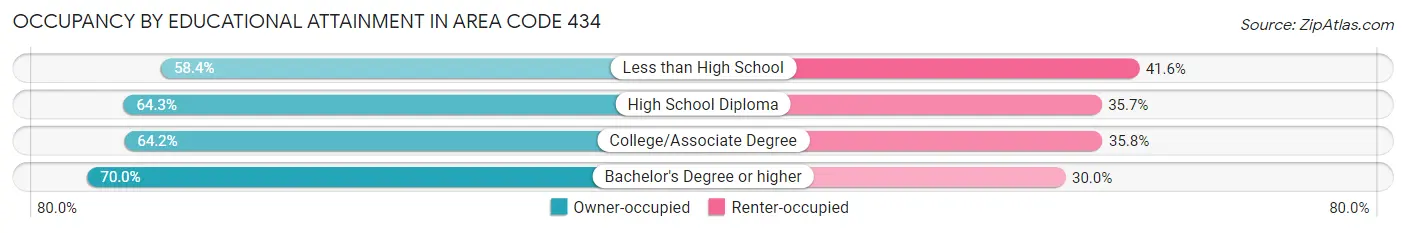
| Household Size | Owner-occupied | Renter-occupied |
| Less than High School | 16,630 (58.4%) | 11,864 (41.6%) |
| High School Diploma | 43,941 (64.3%) | 24,385 (35.7%) |
| College/Associate Degree | 49,002 (64.2%) | 27,358 (35.8%) |
| Bachelor's Degree or higher | 61,588 (70.0%) | 26,348 (30.0%) |
Occupancy by Age of Householder in Area Code 434
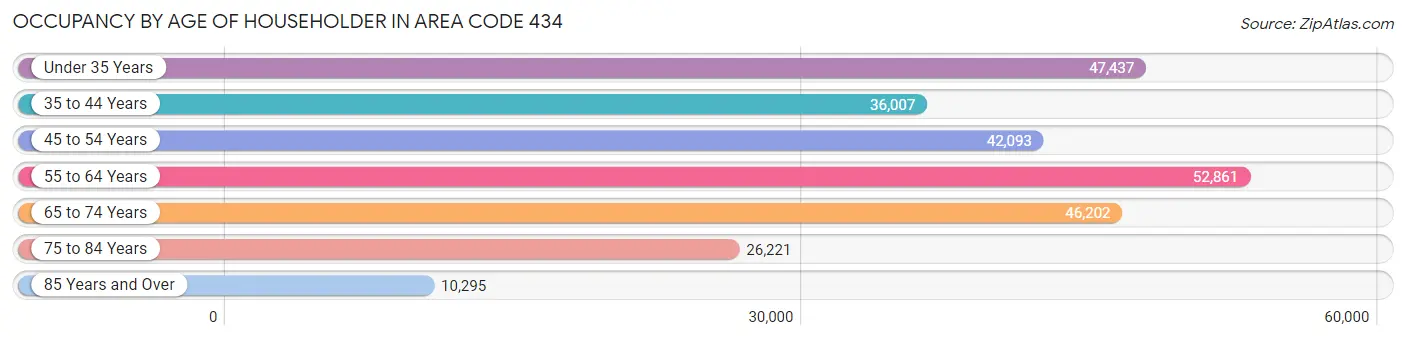
| Age Bracket | # Households | % Households |
| Under 35 Years | 47,437 | 18.2% |
| 35 to 44 Years | 36,007 | 13.8% |
| 45 to 54 Years | 42,093 | 16.1% |
| 55 to 64 Years | 52,861 | 20.2% |
| 65 to 74 Years | 46,202 | 17.7% |
| 75 to 84 Years | 26,221 | 10.0% |
| 85 Years and Over | 10,295 | 3.9% |
| Total | 261,116 | 100.0% |
Housing Finances in Area Code 434
Median Income by Occupancy in Area Code 434
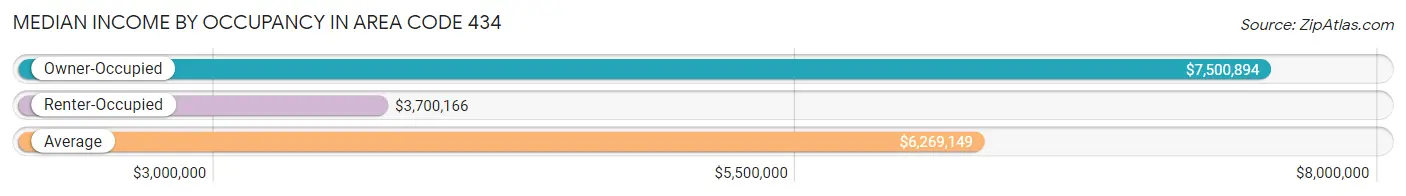
| Occupancy Type | # Households | Median Income |
| Owner-Occupied | 171,161 (65.5%) | $7,500,894 |
| Renter-Occupied | 89,955 (34.4%) | $3,700,166 |
| Average | 261,116 (100.0%) | $6,269,149 |
Occupancy by Householder Income Bracket in Area Code 434
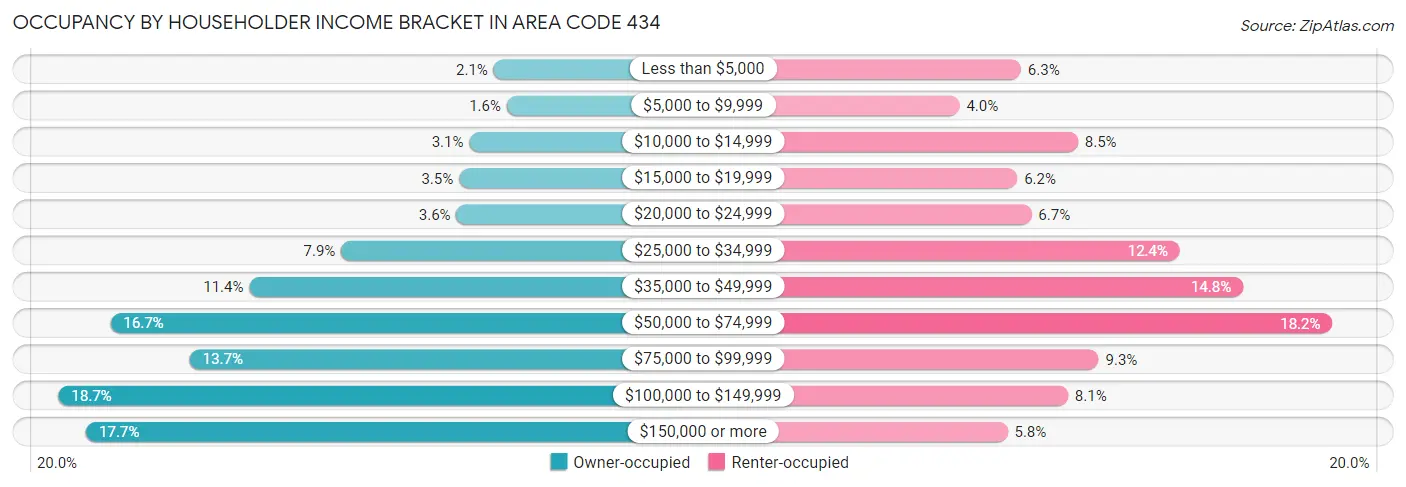
| Income Bracket | Owner-occupied | Renter-occupied |
| Less than $5,000 | 3,643 (2.1%) | 5,666 (6.3%) |
| $5,000 to $9,999 | 2,782 (1.6%) | 3,563 (4.0%) |
| $10,000 to $14,999 | 5,241 (3.1%) | 7,619 (8.5%) |
| $15,000 to $19,999 | 5,906 (3.5%) | 5,538 (6.2%) |
| $20,000 to $24,999 | 6,073 (3.5%) | 6,030 (6.7%) |
| $25,000 to $34,999 | 13,598 (7.9%) | 11,113 (12.3%) |
| $35,000 to $49,999 | 19,579 (11.4%) | 13,279 (14.8%) |
| $50,000 to $74,999 | 28,629 (16.7%) | 16,335 (18.2%) |
| $75,000 to $99,999 | 23,460 (13.7%) | 8,329 (9.3%) |
| $100,000 to $149,999 | 32,026 (18.7%) | 7,277 (8.1%) |
| $150,000 or more | 30,224 (17.7%) | 5,206 (5.8%) |
| Total | 171,161 (100.0%) | 89,955 (100.0%) |
Monthly Housing Cost Tiers in Area Code 434
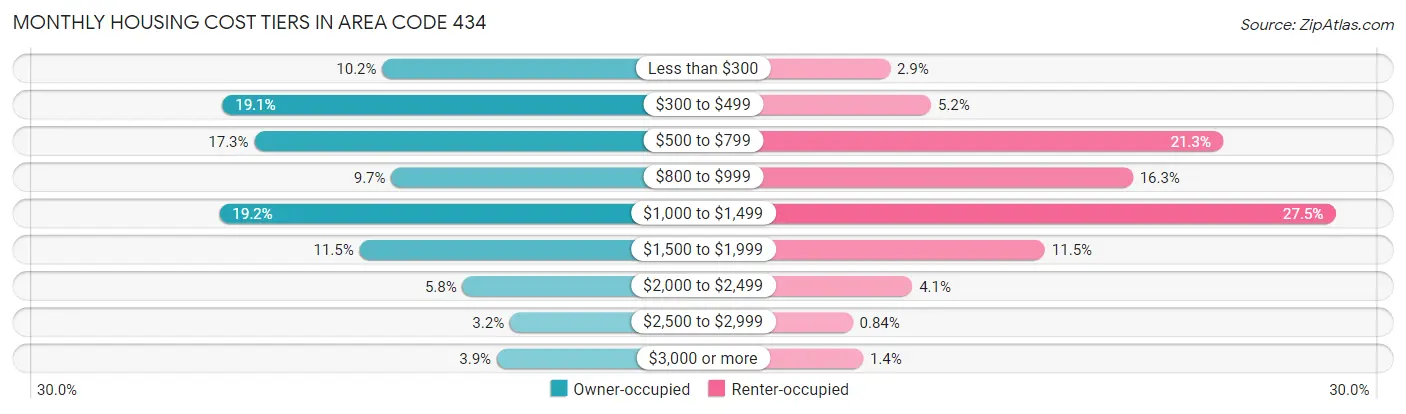
| Monthly Cost | Owner-occupied | Renter-occupied |
| Less than $300 | 17,522 (10.2%) | 2,608 (2.9%) |
| $300 to $499 | 32,657 (19.1%) | 4,647 (5.2%) |
| $500 to $799 | 29,623 (17.3%) | 19,143 (21.3%) |
| $800 to $999 | 16,669 (9.7%) | 14,669 (16.3%) |
| $1,000 to $1,499 | 32,928 (19.2%) | 24,733 (27.5%) |
| $1,500 to $1,999 | 19,675 (11.5%) | 10,305 (11.5%) |
| $2,000 to $2,499 | 9,941 (5.8%) | 3,716 (4.1%) |
| $2,500 to $2,999 | 5,457 (3.2%) | 755 (0.8%) |
| $3,000 or more | 6,689 (3.9%) | 1,265 (1.4%) |
| Total | 171,161 (100.0%) | 89,955 (100.0%) |
Physical Housing Characteristics in Area Code 434
Housing Structures in Area Code 434
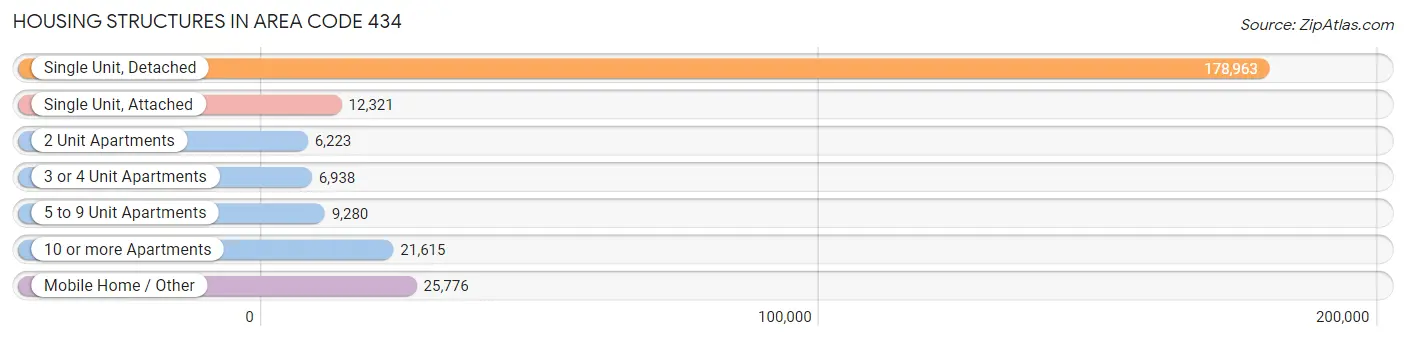
| Structure Type | # Housing Units | % Housing Units |
| Single Unit, Detached | 178,963 | 68.5% |
| Single Unit, Attached | 12,321 | 4.7% |
| 2 Unit Apartments | 6,223 | 2.4% |
| 3 or 4 Unit Apartments | 6,938 | 2.7% |
| 5 to 9 Unit Apartments | 9,280 | 3.5% |
| 10 or more Apartments | 21,615 | 8.3% |
| Mobile Home / Other | 25,776 | 9.9% |
| Total | 261,116 | 100.0% |
Housing Structures by Occupancy in Area Code 434
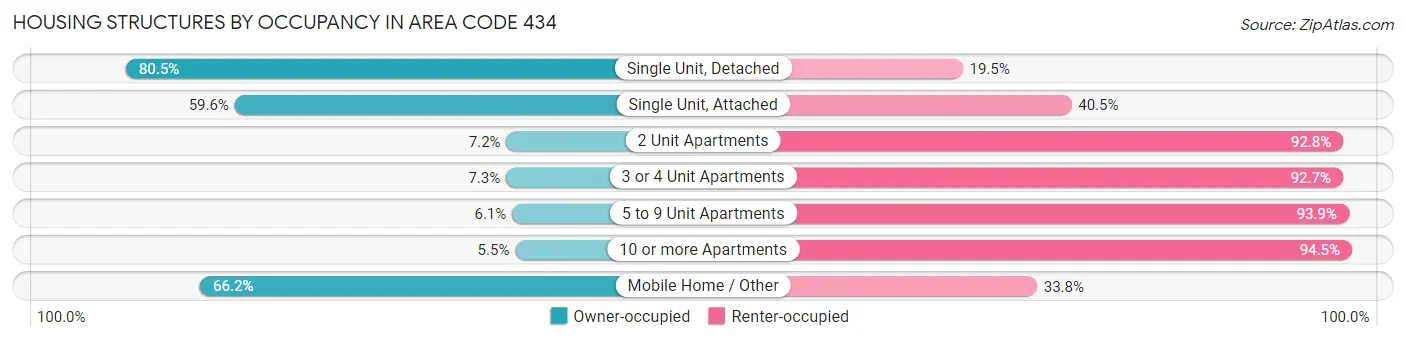
| Structure Type | Owner-occupied | Renter-occupied |
| Single Unit, Detached | 144,043 (80.5%) | 34,920 (19.5%) |
| Single Unit, Attached | 7,337 (59.6%) | 4,984 (40.5%) |
| 2 Unit Apartments | 450 (7.2%) | 5,773 (92.8%) |
| 3 or 4 Unit Apartments | 506 (7.3%) | 6,432 (92.7%) |
| 5 to 9 Unit Apartments | 569 (6.1%) | 8,711 (93.9%) |
| 10 or more Apartments | 1,195 (5.5%) | 20,420 (94.5%) |
| Mobile Home / Other | 17,061 (66.2%) | 8,715 (33.8%) |
| Total | 171,161 (65.5%) | 89,955 (34.4%) |
Housing Structures by Number of Rooms in Area Code 434
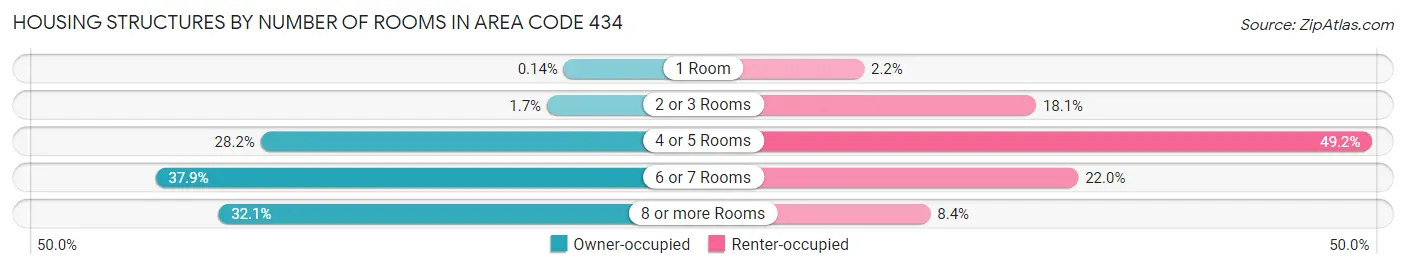
| Number of Rooms | Owner-occupied | Renter-occupied |
| 1 Room | 248 (0.1%) | 2,004 (2.2%) |
| 2 or 3 Rooms | 2,887 (1.7%) | 16,307 (18.1%) |
| 4 or 5 Rooms | 48,221 (28.2%) | 44,294 (49.2%) |
| 6 or 7 Rooms | 64,886 (37.9%) | 19,830 (22.0%) |
| 8 or more Rooms | 54,919 (32.1%) | 7,520 (8.4%) |
| Total | 171,161 (100.0%) | 89,955 (100.0%) |
Housing Structure by Heating Type in Area Code 434
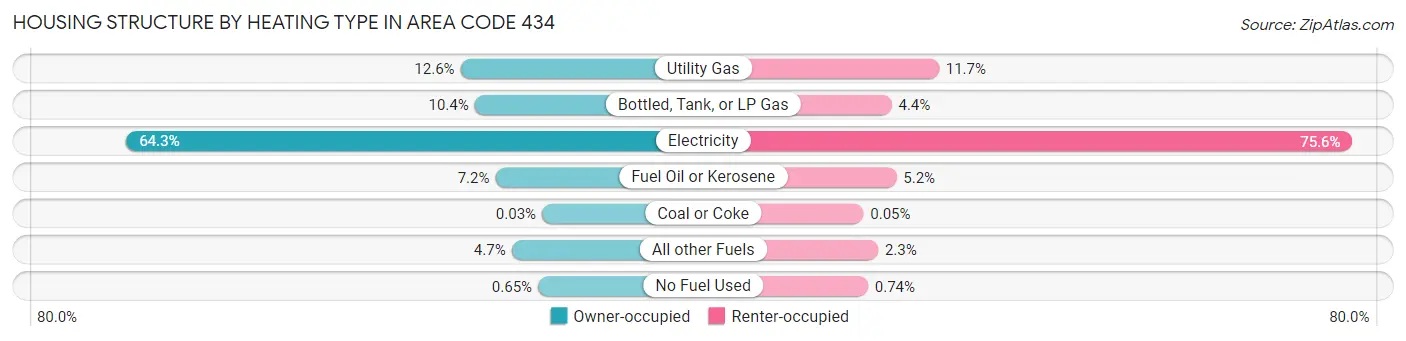
| Heating Type | Owner-occupied | Renter-occupied |
| Utility Gas | 21,619 (12.6%) | 10,537 (11.7%) |
| Bottled, Tank, or LP Gas | 17,869 (10.4%) | 3,954 (4.4%) |
| Electricity | 110,018 (64.3%) | 68,042 (75.6%) |
| Fuel Oil or Kerosene | 12,388 (7.2%) | 4,633 (5.1%) |
| Coal or Coke | 56 (0.0%) | 44 (0.1%) |
| All other Fuels | 8,091 (4.7%) | 2,081 (2.3%) |
| No Fuel Used | 1,120 (0.6%) | 664 (0.7%) |
| Total | 171,161 (100.0%) | 89,955 (100.0%) |
Household Vehicle Usage in Area Code 434
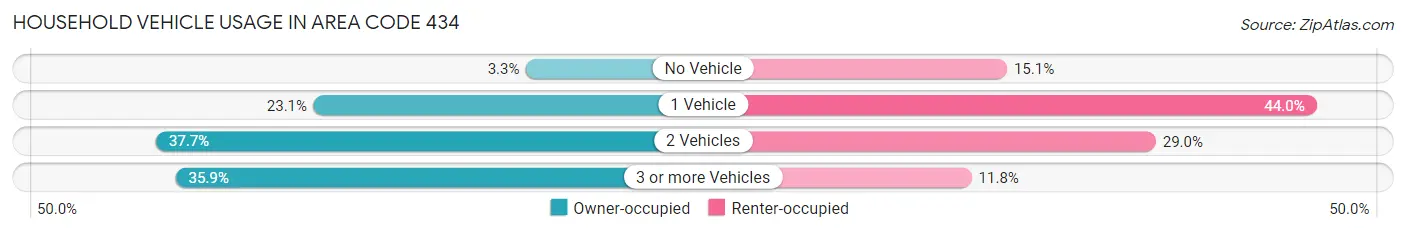
| Vehicles per Household | Owner-occupied | Renter-occupied |
| No Vehicle | 5,579 (3.3%) | 13,610 (15.1%) |
| 1 Vehicle | 39,516 (23.1%) | 39,594 (44.0%) |
| 2 Vehicles | 64,596 (37.7%) | 26,106 (29.0%) |
| 3 or more Vehicles | 61,470 (35.9%) | 10,645 (11.8%) |
| Total | 171,161 (100.0%) | 89,955 (100.0%) |
Real Estate & Mortgages in Area Code 434
Real Estate and Mortgage Overview in Area Code 434
| Characteristic | Without Mortgage | With Mortgage |
| Housing Units | 76,580 | 94,581 |
| Median Property Value | $17,707,100 | $20,731,000 |
| Median Household Income | $5,512,949 | $21,589 |
| Monthly Housing Costs | $44,930 | $6,453 |
| Real Estate Taxes | $112,503 | $2,086 |
Property Value by Mortgage Status in Area Code 434
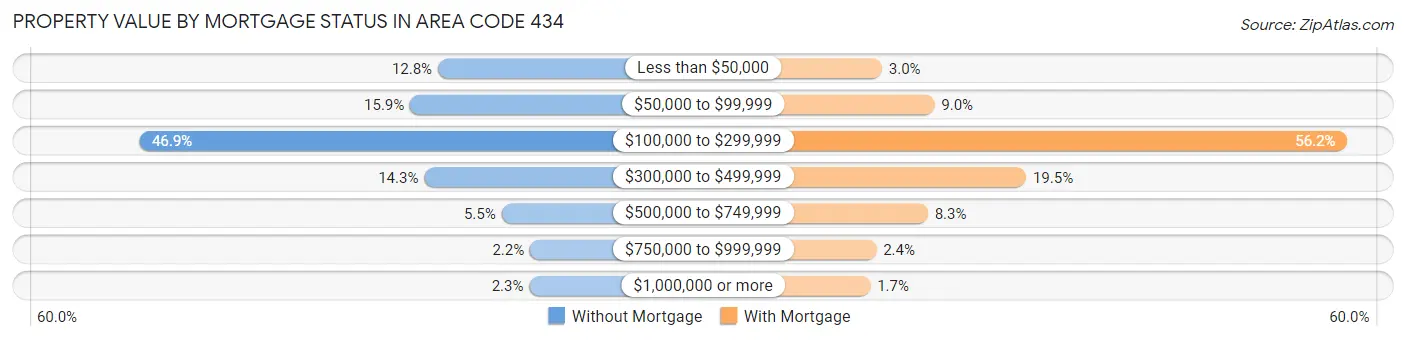
| Property Value | Without Mortgage | With Mortgage |
| Less than $50,000 | 9,771 (12.8%) | 2,847 (3.0%) |
| $50,000 to $99,999 | 12,210 (15.9%) | 8,522 (9.0%) |
| $100,000 to $299,999 | 35,937 (46.9%) | 53,167 (56.2%) |
| $300,000 to $499,999 | 10,973 (14.3%) | 18,426 (19.5%) |
| $500,000 to $749,999 | 4,205 (5.5%) | 7,801 (8.3%) |
| $750,000 to $999,999 | 1,706 (2.2%) | 2,228 (2.4%) |
| $1,000,000 or more | 1,778 (2.3%) | 1,590 (1.7%) |
| Total | 76,580 (100.0%) | 94,581 (100.0%) |
Household Income by Mortgage Status in Area Code 434
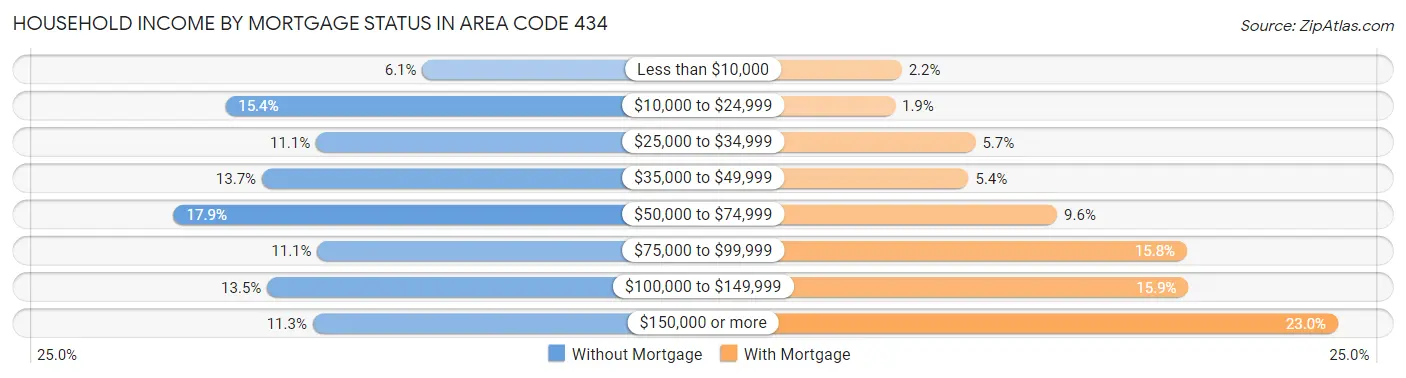
| Household Income | Without Mortgage | With Mortgage |
| Less than $10,000 | 4,644 (6.1%) | 2,081 (2.2%) |
| $10,000 to $24,999 | 11,822 (15.4%) | 1,781 (1.9%) |
| $25,000 to $34,999 | 8,512 (11.1%) | 5,398 (5.7%) |
| $35,000 to $49,999 | 10,495 (13.7%) | 5,086 (5.4%) |
| $50,000 to $74,999 | 13,704 (17.9%) | 9,084 (9.6%) |
| $75,000 to $99,999 | 8,470 (11.1%) | 14,925 (15.8%) |
| $100,000 to $149,999 | 10,298 (13.5%) | 14,990 (15.9%) |
| $150,000 or more | 8,635 (11.3%) | 21,728 (23.0%) |
| Total | 76,580 (100.0%) | 94,581 (100.0%) |
Property Value to Household Income Ratio in Area Code 434
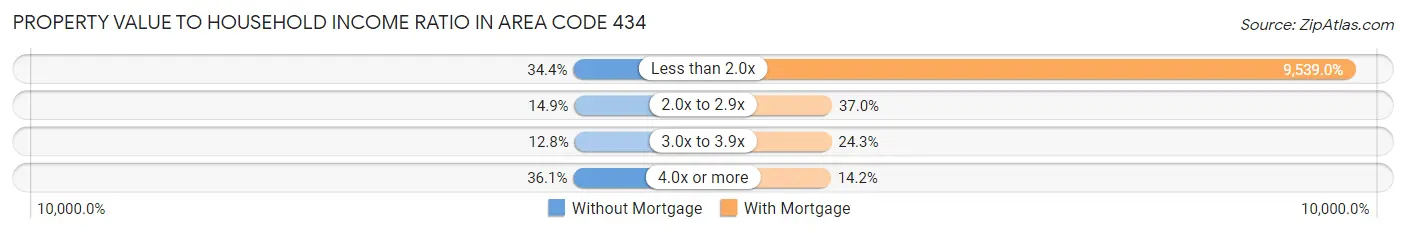
| Value-to-Income Ratio | Without Mortgage | With Mortgage |
| Less than 2.0x | 26,373 (34.4%) | 9,022,099 (9,539.0%) |
| 2.0x to 2.9x | 11,420 (14.9%) | 34,959 (37.0%) |
| 3.0x to 3.9x | 9,790 (12.8%) | 22,958 (24.3%) |
| 4.0x or more | 27,671 (36.1%) | 13,457 (14.2%) |
| Total | 76,580 (100.0%) | 94,581 (100.0%) |
Real Estate Taxes by Mortgage Status in Area Code 434
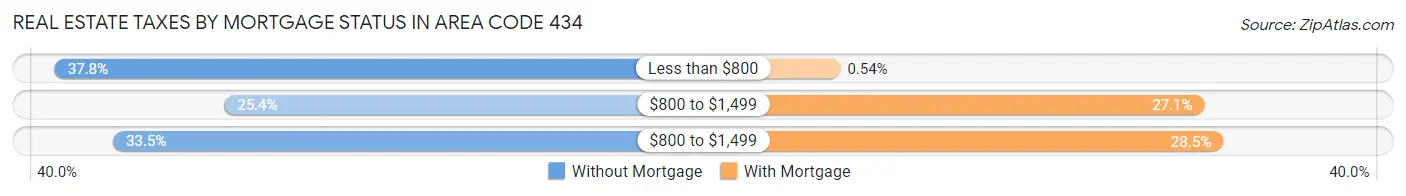
| Property Taxes | Without Mortgage | With Mortgage |
| Less than $800 | 28,936 (37.8%) | 510 (0.5%) |
| $800 to $1,499 | 19,458 (25.4%) | 25,648 (27.1%) |
| $800 to $1,499 | 25,685 (33.5%) | 26,952 (28.5%) |
| Total | 76,580 (100.0%) | 94,581 (100.0%) |
Health & Disability in Area Code 434
Health Insurance Coverage by Age in Area Code 434
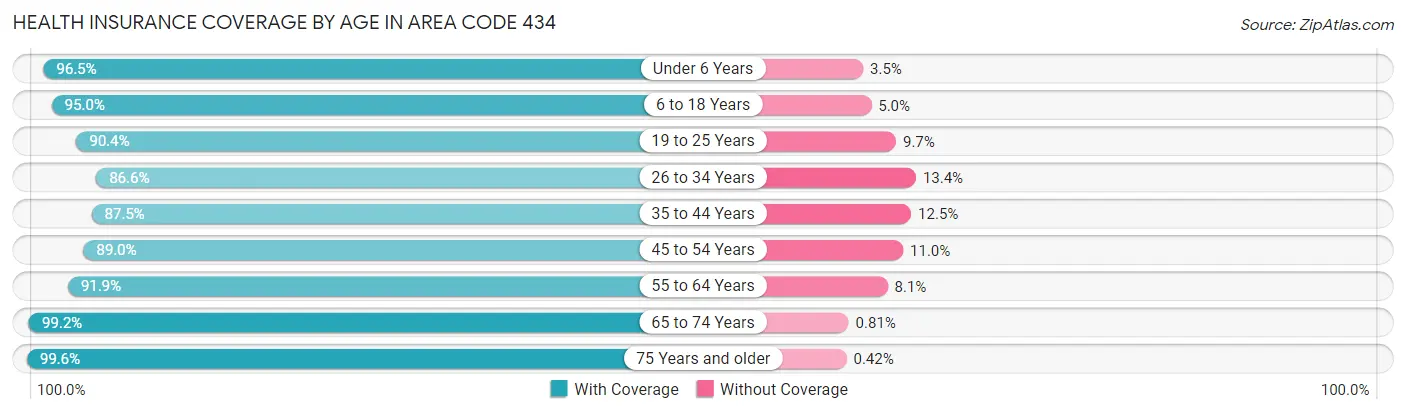
| Age Bracket | With Coverage | Without Coverage |
| Under 6 Years | 39,317 (96.5%) | 1,429 (3.5%) |
| 6 to 18 Years | 95,692 (95.0%) | 5,073 (5.0%) |
| 19 to 25 Years | 68,103 (90.3%) | 7,276 (9.7%) |
| 26 to 34 Years | 62,683 (86.6%) | 9,663 (13.4%) |
| 35 to 44 Years | 60,155 (87.5%) | 8,567 (12.5%) |
| 45 to 54 Years | 66,201 (89.0%) | 8,153 (11.0%) |
| 55 to 64 Years | 79,668 (91.9%) | 6,994 (8.1%) |
| 65 to 74 Years | 72,741 (99.2%) | 595 (0.8%) |
| 75 Years and older | 52,155 (99.6%) | 218 (0.4%) |
| Total | 596,715 (92.6%) | 47,968 (7.4%) |
Health Insurance Coverage by Citizenship Status in Area Code 434
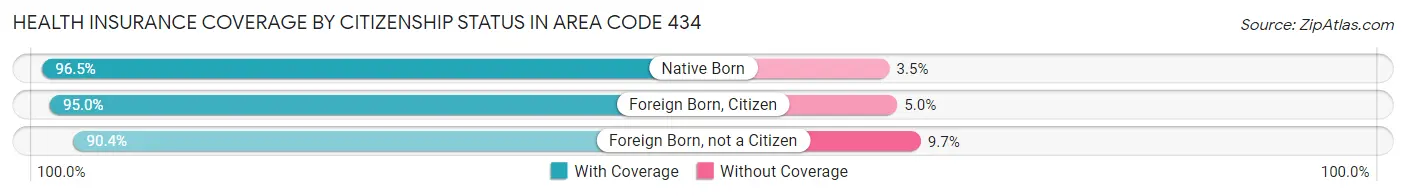
| Citizenship Status | With Coverage | Without Coverage |
| Native Born | 39,317 (96.5%) | 1,429 (3.5%) |
| Foreign Born, Citizen | 95,692 (95.0%) | 5,073 (5.0%) |
| Foreign Born, not a Citizen | 68,103 (90.3%) | 7,276 (9.7%) |
Health Insurance Coverage by Household Income in Area Code 434
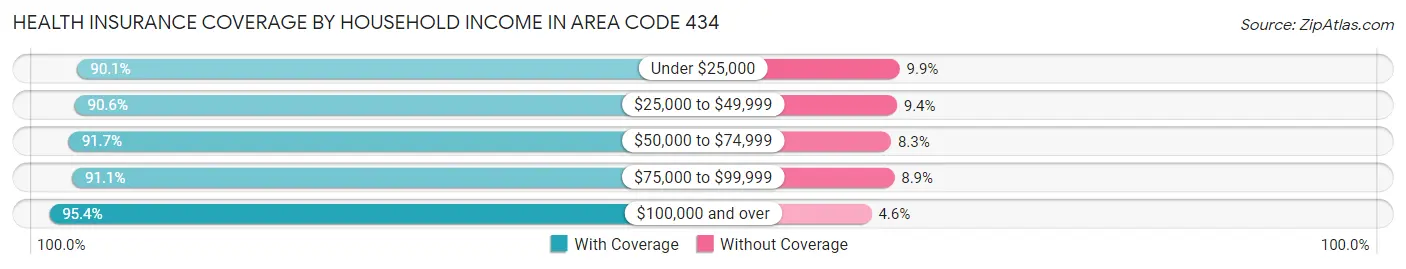
| Household Income | With Coverage | Without Coverage |
| Under $25,000 | 79,274 (90.1%) | 8,703 (9.9%) |
| $25,000 to $49,999 | 106,768 (90.6%) | 11,043 (9.4%) |
| $50,000 to $74,999 | 94,015 (91.7%) | 8,476 (8.3%) |
| $75,000 to $99,999 | 78,411 (91.1%) | 7,661 (8.9%) |
| $100,000 and over | 213,797 (95.4%) | 10,357 (4.6%) |
Public vs Private Health Insurance Coverage by Age in Area Code 434
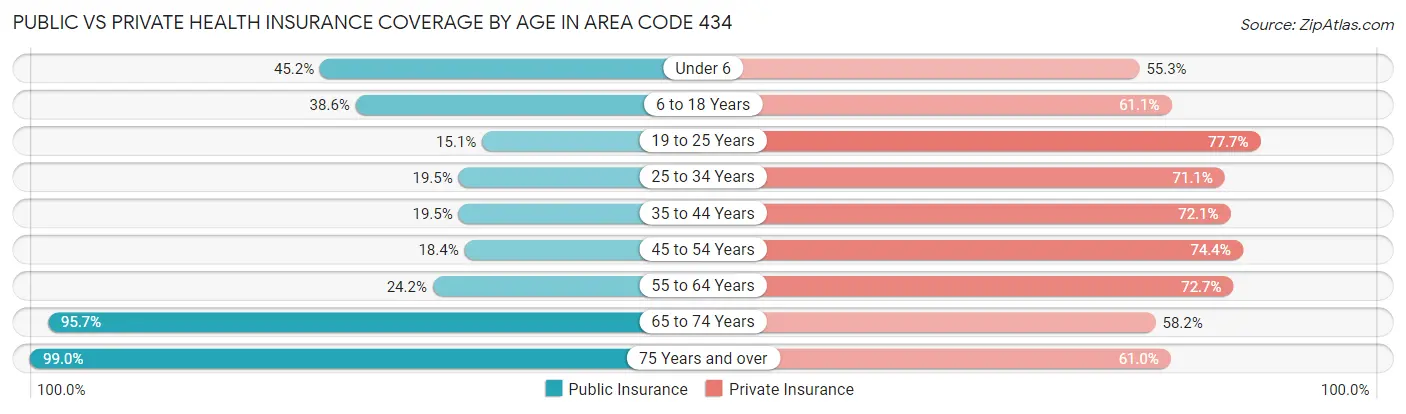
| Age Bracket | Public Insurance | Private Insurance |
| Under 6 | 18,401 (45.2%) | 22,511 (55.2%) |
| 6 to 18 Years | 38,845 (38.6%) | 61,611 (61.1%) |
| 19 to 25 Years | 11,359 (15.1%) | 58,551 (77.7%) |
| 25 to 34 Years | 14,074 (19.5%) | 51,399 (71.1%) |
| 35 to 44 Years | 13,369 (19.5%) | 49,560 (72.1%) |
| 45 to 54 Years | 13,646 (18.3%) | 55,309 (74.4%) |
| 55 to 64 Years | 21,008 (24.2%) | 62,971 (72.7%) |
| 65 to 74 Years | 70,168 (95.7%) | 42,702 (58.2%) |
| 75 Years and over | 51,831 (99.0%) | 31,968 (61.0%) |
| Total | 252,701 (39.2%) | 436,582 (67.7%) |
Disability Status by Sex by Age in Area Code 434
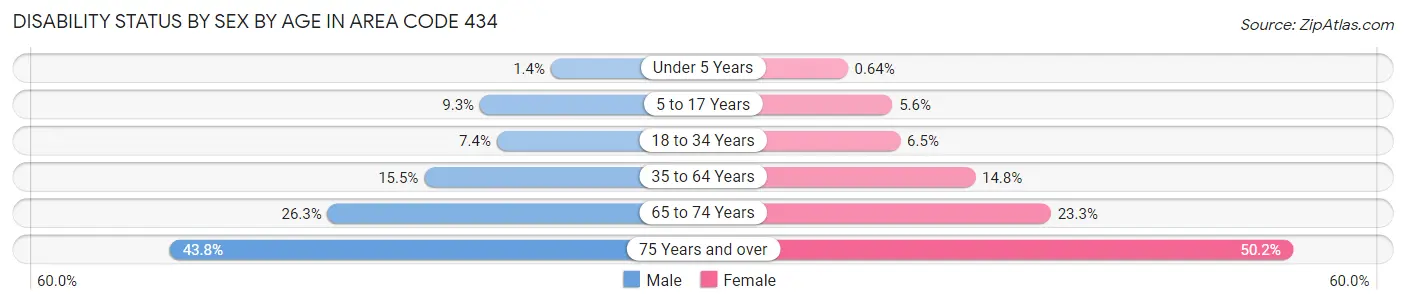
| Age Bracket | Male | Female |
| Under 5 Years | 245 (1.4%) | 106 (0.6%) |
| 5 to 17 Years | 4,443 (9.3%) | 2,613 (5.6%) |
| 18 to 34 Years | 5,889 (7.4%) | 5,289 (6.5%) |
| 35 to 64 Years | 17,018 (15.5%) | 17,798 (14.8%) |
| 65 to 74 Years | 8,919 (26.3%) | 9,162 (23.3%) |
| 75 Years and over | 9,367 (43.8%) | 15,562 (50.2%) |
Disability Class by Sex by Age in Area Code 434
Disability Class: Hearing Difficulty
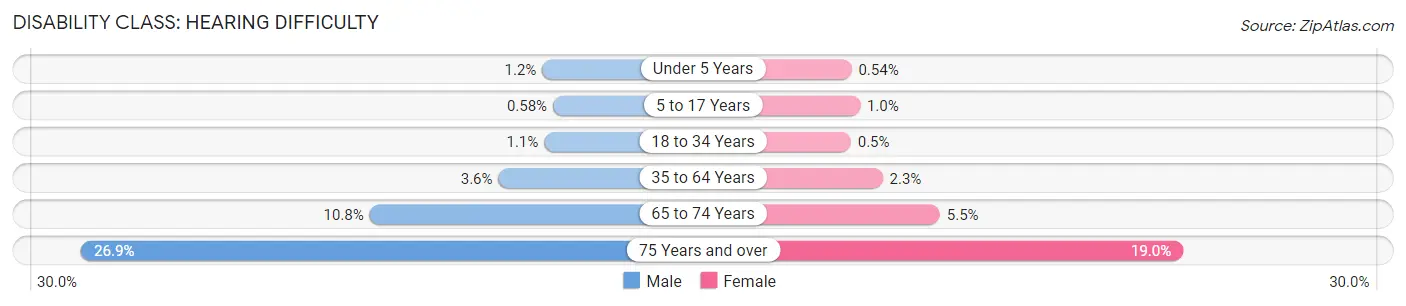
| Age Bracket | Male | Female |
| Under 5 Years | 206 (1.2%) | 90 (0.5%) |
| 5 to 17 Years | 277 (0.6%) | 468 (1.0%) |
| 18 to 34 Years | 850 (1.1%) | 405 (0.5%) |
| 35 to 64 Years | 3,971 (3.6%) | 2,720 (2.3%) |
| 65 to 74 Years | 3,666 (10.8%) | 2,149 (5.5%) |
| 75 Years and over | 5,739 (26.9%) | 5,891 (19.0%) |
Disability Class: Vision Difficulty
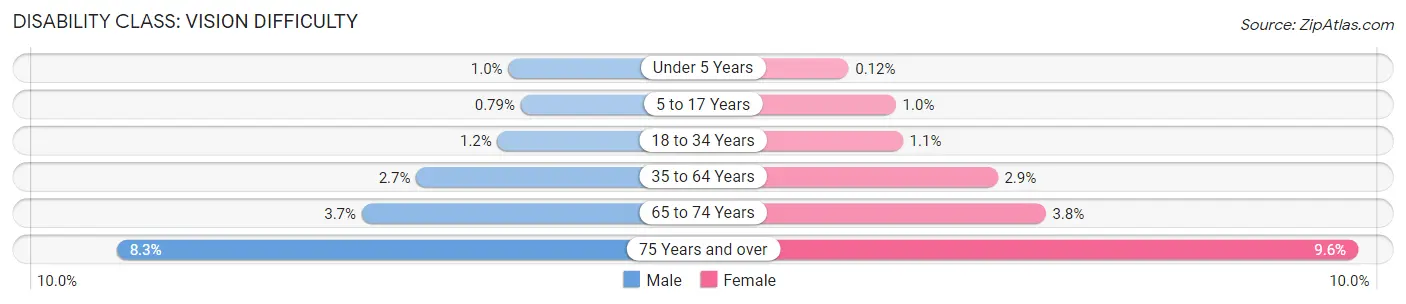
| Age Bracket | Male | Female |
| Under 5 Years | 179 (1.0%) | 20 (0.1%) |
| 5 to 17 Years | 380 (0.8%) | 464 (1.0%) |
| 18 to 34 Years | 972 (1.2%) | 920 (1.1%) |
| 35 to 64 Years | 2,993 (2.7%) | 3,464 (2.9%) |
| 65 to 74 Years | 1,270 (3.7%) | 1,489 (3.8%) |
| 75 Years and over | 1,772 (8.3%) | 2,969 (9.6%) |
Disability Class: Cognitive Difficulty
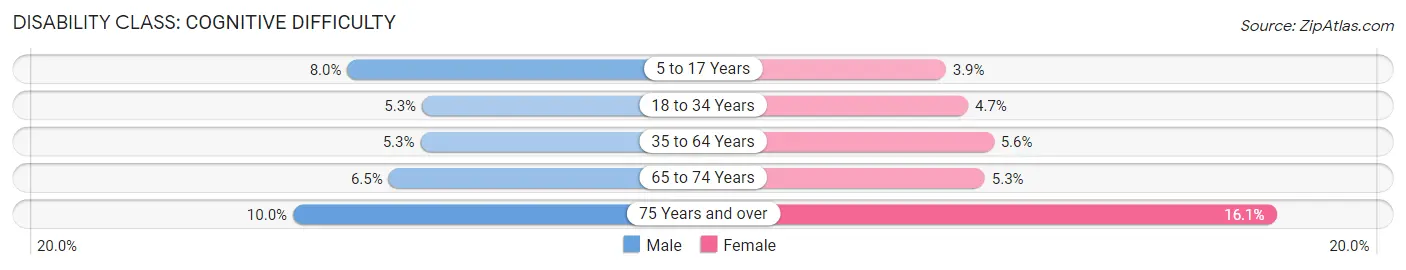
| Age Bracket | Male | Female |
| 5 to 17 Years | 3,834 (8.0%) | 1,792 (3.9%) |
| 18 to 34 Years | 4,164 (5.2%) | 3,817 (4.7%) |
| 35 to 64 Years | 5,833 (5.3%) | 6,761 (5.6%) |
| 65 to 74 Years | 2,206 (6.5%) | 2,092 (5.3%) |
| 75 Years and over | 2,146 (10.0%) | 5,002 (16.1%) |
Disability Class: Ambulatory Difficulty
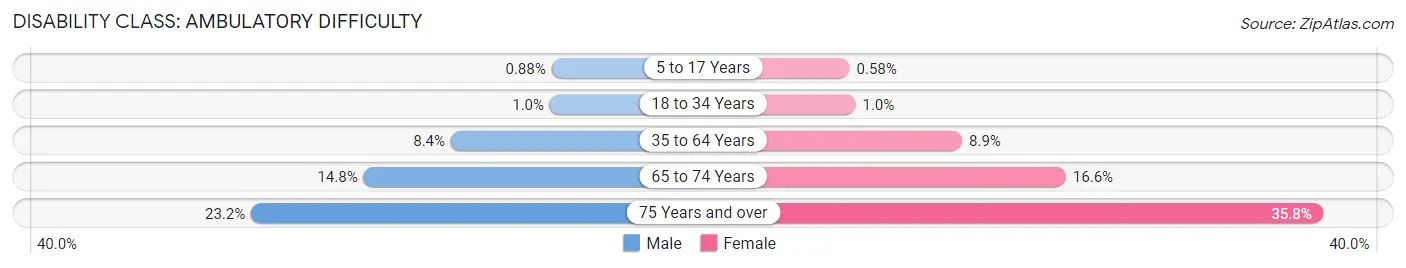
| Age Bracket | Male | Female |
| 5 to 17 Years | 420 (0.9%) | 269 (0.6%) |
| 18 to 34 Years | 790 (1.0%) | 831 (1.0%) |
| 35 to 64 Years | 9,170 (8.4%) | 10,709 (8.9%) |
| 65 to 74 Years | 5,039 (14.8%) | 6,552 (16.6%) |
| 75 Years and over | 4,957 (23.2%) | 11,086 (35.8%) |
Disability Class: Self-Care Difficulty
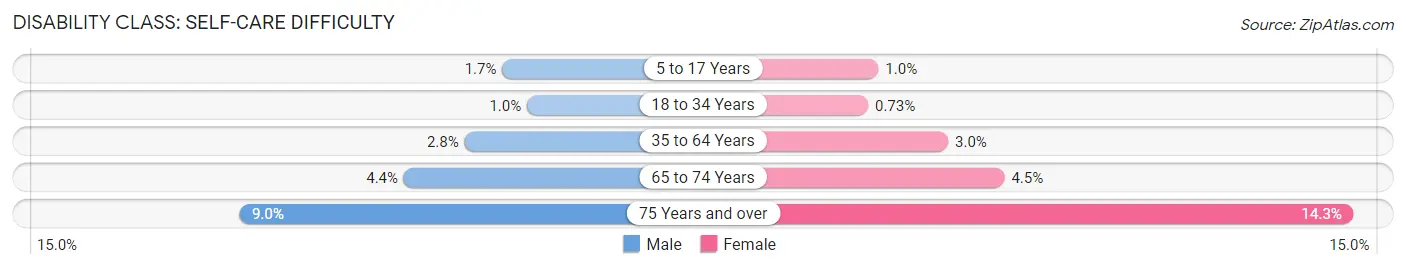
| Age Bracket | Male | Female |
| 5 to 17 Years | 814 (1.7%) | 472 (1.0%) |
| 18 to 34 Years | 798 (1.0%) | 592 (0.7%) |
| 35 to 64 Years | 3,018 (2.8%) | 3,549 (3.0%) |
| 65 to 74 Years | 1,507 (4.4%) | 1,783 (4.5%) |
| 75 Years and over | 1,929 (9.0%) | 4,417 (14.2%) |
Technology Access in Area Code 434
Computing Device Access in Area Code 434
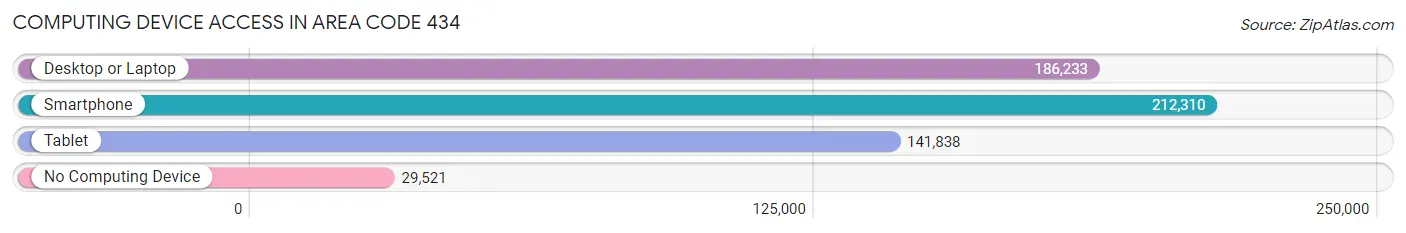
| Device Type | # Households | % Households |
| Desktop or Laptop | 186,233 | 71.3% |
| Smartphone | 212,310 | 81.3% |
| Tablet | 141,838 | 54.3% |
| No Computing Device | 29,521 | 11.3% |
| Total | 261,116 | 100.0% |
Internet Access in Area Code 434
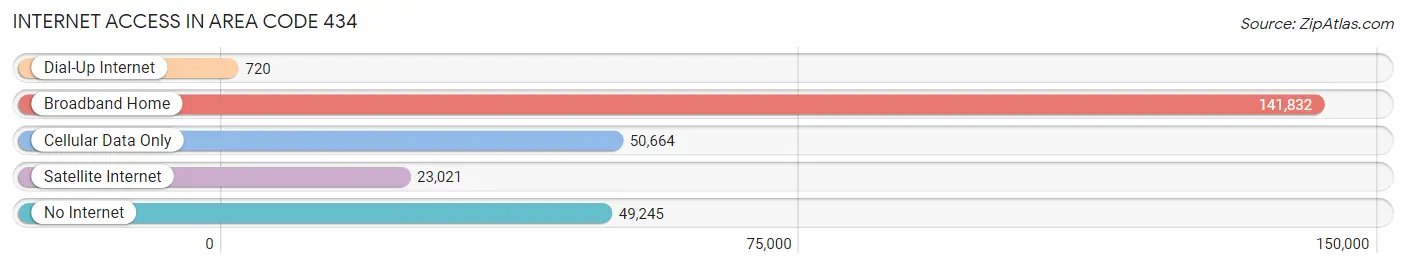
| Internet Type | # Households | % Households |
| Dial-Up Internet | 720 | 0.3% |
| Broadband Home | 141,832 | 54.3% |
| Cellular Data Only | 50,664 | 19.4% |
| Satellite Internet | 23,021 | 8.8% |
| No Internet | 49,245 | 18.9% |
| Total | 261,116 | 100.0% |
Area Code 434 Summary
Geography
Area code 434 is located in the state of Virginia and covers the cities of Lynchburg, Charlottesville, Danville, and Farmville. It also covers parts of the counties of Amherst, Appomattox, Buckingham, Campbell, Charlotte, Cumberland, Halifax, Nelson, Pittsylvania, and Prince Edward.
Social
Area code 434 is home to a diverse population of people from all walks of life. The area is known for its vibrant music and art scene, as well as its many outdoor activities. The area is also home to several universities, including the University of Virginia, Virginia Tech, and Liberty University.
Economics
Area code 434 is home to a thriving economy. The area is home to several major employers, including the University of Virginia, Liberty University, and the Virginia Department of Transportation. The area is also home to several large corporations, such as Walmart, Target, and Lowe's.
Demographics
Area code 434 is home to a population of over 1.2 million people. The area is predominantly white, with African Americans making up about 20% of the population. The median household income is around $50,000, and the median age is around 37 years old.
Common Questions
What is Per Capita Income in Area Code 434?
Per Capita income in Area Code 434 is $31,220.
What is the Median Family Income in Area Code 434?
Median Family Income in Area Code 434 is $76,408.
What is the Median Household income in Area Code 434?
Median Household Income in Area Code 434 is $59,143.
What is Income or Wage Gap in Area Code 434?
Income or Wage Gap in Area Code 434 is 26.1%.
Women in Area Code 434 earn 73.9 cents for every dollar earned by a man.
What is Family Income Deficit in Area Code 434?
Family Income Deficit in Area Code 434 is $9,941.
Families that are below poverty line in Area Code 434 earn $9,941 less on average than the poverty threshold level.
What is Inequality or Gini Index in Area Code 434?
Inequality or Gini Index in Area Code 434 is 47.13.
What is the Total Population of Area Code 434?
Total Population of Area Code 434 is 666,437.
What is the Total Male Population of Area Code 434?
Total Male Population of Area Code 434 is 327,048.
What is the Total Female Population of Area Code 434?
Total Female Population of Area Code 434 is 339,389.
What is the Ratio of Males per 100 Females in Area Code 434?
There are 96.36 Males per 100 Females in Area Code 434.
What is the Ratio of Females per 100 Males in Area Code 434?
There are 103.77 Females per 100 Males in Area Code 434.
What is the Median Population Age in Area Code 434?
Median Population Age in Area Code 434 is 45.6 Years.
What is the Average Family Size in Area Code 434
Average Family Size in Area Code 434 is 2.9 People.
What is the Average Household Size in Area Code 434
Average Household Size in Area Code 434 is 2.4 People.
How Large is the Labor Force in Area Code 434?
There are 293,260 People in the Labor Forcein in Area Code 434.
What is the Percentage of People in the Labor Force in Area Code 434?
53.1% of People are in the Labor Force in Area Code 434.
What is the Unemployment Rate in Area Code 434?
Unemployment Rate in Area Code 434 is 5.4%.