Zip Codes with the Highest Percentage of Population Employed in Farming, Fishing & Forestry in Jackson, TN
RELATED REPORTS & OPTIONS
Farming, Fishing & Forestry
Jackson
Compare Zip Codes
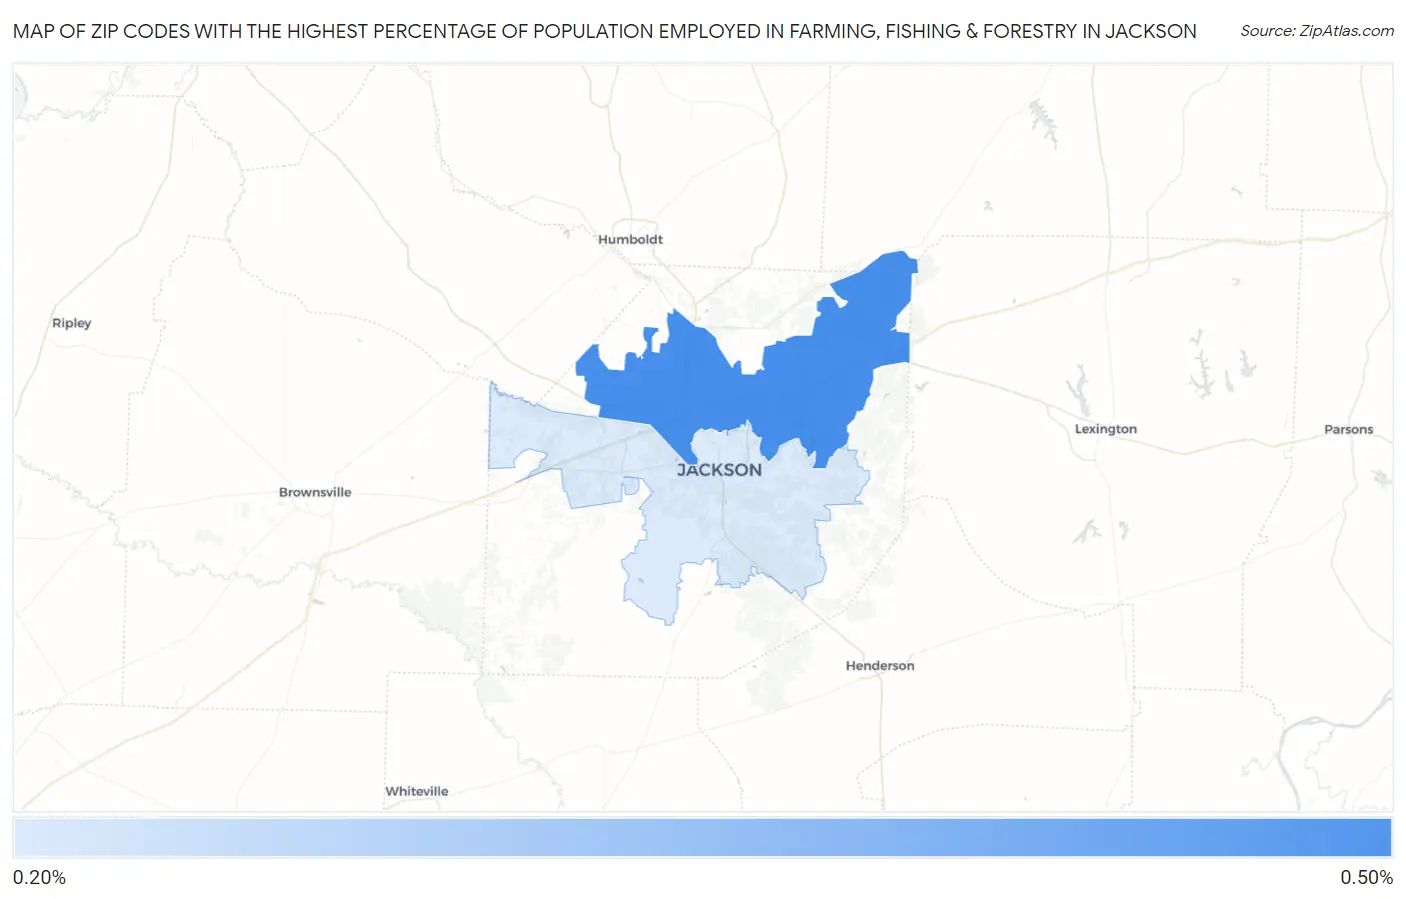
Map of Zip Codes with the Highest Percentage of Population Employed in Farming, Fishing & Forestry in Jackson
0.25%
0.49%
Zip Codes with the Highest Percentage of Population Employed in Farming, Fishing & Forestry in Jackson, TN
| Zip Code | % Employed | vs State | vs National | |
| 1. | 38305 | 0.49% | 0.36%(+0.133)#185 | 0.61%(-0.114)#12,925 |
| 2. | 38301 | 0.25% | 0.36%(-0.108)#232 | 0.61%(-0.356)#15,421 |
1
Common Questions
What are the Top Zip Codes with the Highest Percentage of Population Employed in Farming, Fishing & Forestry in Jackson, TN?
Top Zip Codes with the Highest Percentage of Population Employed in Farming, Fishing & Forestry in Jackson, TN are:
What zip code has the Highest Percentage of Population Employed in Farming, Fishing & Forestry in Jackson, TN?
38305 has the Highest Percentage of Population Employed in Farming, Fishing & Forestry in Jackson, TN with 0.49%.
What is the Percentage of Population Employed in Farming, Fishing & Forestry in Jackson, TN?
Percentage of Population Employed in Farming, Fishing & Forestry in Jackson is 0.35%.
What is the Percentage of Population Employed in Farming, Fishing & Forestry in Tennessee?
Percentage of Population Employed in Farming, Fishing & Forestry in Tennessee is 0.36%.
What is the Percentage of Population Employed in Farming, Fishing & Forestry in the United States?
Percentage of Population Employed in Farming, Fishing & Forestry in the United States is 0.61%.