Zip Codes with the Highest Percentage of Population Employed in Farming, Fishing & Forestry in Nashville, TN
RELATED REPORTS & OPTIONS
Farming, Fishing & Forestry
Nashville
Compare Zip Codes
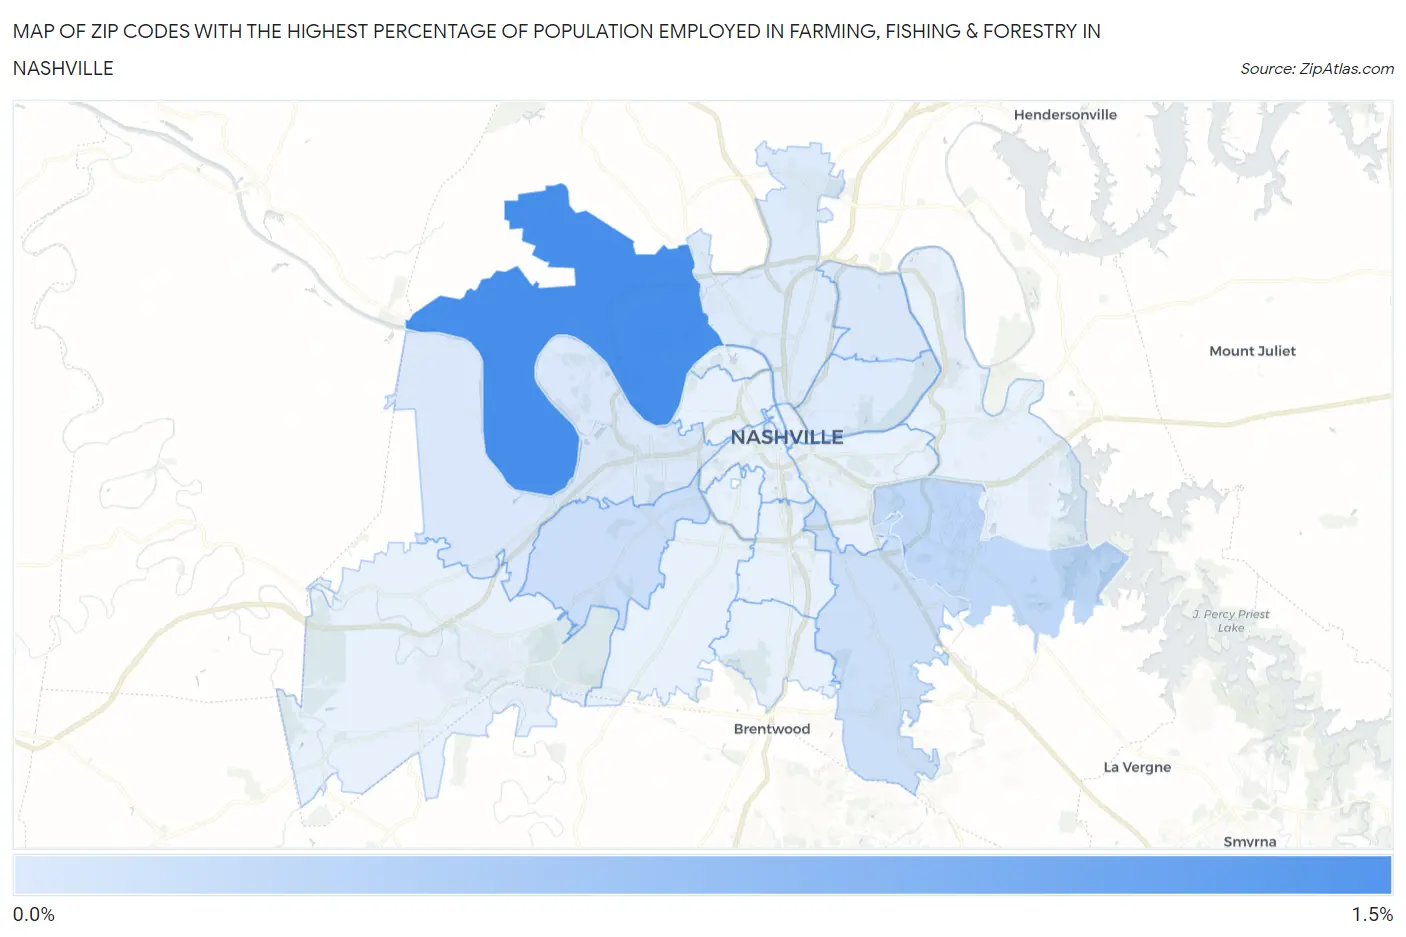
Map of Zip Codes with the Highest Percentage of Population Employed in Farming, Fishing & Forestry in Nashville
0.040%
1.0%
Zip Codes with the Highest Percentage of Population Employed in Farming, Fishing & Forestry in Nashville, TN
| Zip Code | % Employed | vs State | vs National | |
| 1. | 37218 | 1.0% | 0.36%(+0.683)#133 | 0.61%(+0.435)#9,562 |
| 2. | 37217 | 0.23% | 0.36%(-0.126)#242 | 0.61%(-0.374)#15,669 |
| 3. | 37205 | 0.16% | 0.36%(-0.194)#268 | 0.61%(-0.442)#16,685 |
| 4. | 37211 | 0.14% | 0.36%(-0.216)#275 | 0.61%(-0.464)#17,068 |
| 5. | 37216 | 0.069% | 0.36%(-0.289)#309 | 0.61%(-0.537)#18,322 |
| 6. | 37209 | 0.054% | 0.36%(-0.304)#313 | 0.61%(-0.552)#18,599 |
| 7. | 37207 | 0.043% | 0.36%(-0.315)#318 | 0.61%(-0.563)#18,776 |
| 8. | 37206 | 0.040% | 0.36%(-0.318)#320 | 0.61%(-0.566)#18,813 |
1
Common Questions
What are the Top 10 Zip Codes with the Highest Percentage of Population Employed in Farming, Fishing & Forestry in Nashville, TN?
Top 10 Zip Codes with the Highest Percentage of Population Employed in Farming, Fishing & Forestry in Nashville, TN are:
What zip code has the Highest Percentage of Population Employed in Farming, Fishing & Forestry in Nashville, TN?
37218 has the Highest Percentage of Population Employed in Farming, Fishing & Forestry in Nashville, TN with 1.0%.
What is the Percentage of Population Employed in Farming, Fishing & Forestry in Nashville, TN?
Percentage of Population Employed in Farming, Fishing & Forestry in Nashville is 0.11%.
What is the Percentage of Population Employed in Farming, Fishing & Forestry in Tennessee?
Percentage of Population Employed in Farming, Fishing & Forestry in Tennessee is 0.36%.
What is the Percentage of Population Employed in Farming, Fishing & Forestry in the United States?
Percentage of Population Employed in Farming, Fishing & Forestry in the United States is 0.61%.