Zip Codes with the Highest Percentage of Population Employed in Farming, Fishing & Forestry in Franklin, TN
RELATED REPORTS & OPTIONS
Farming, Fishing & Forestry
Franklin
Compare Zip Codes
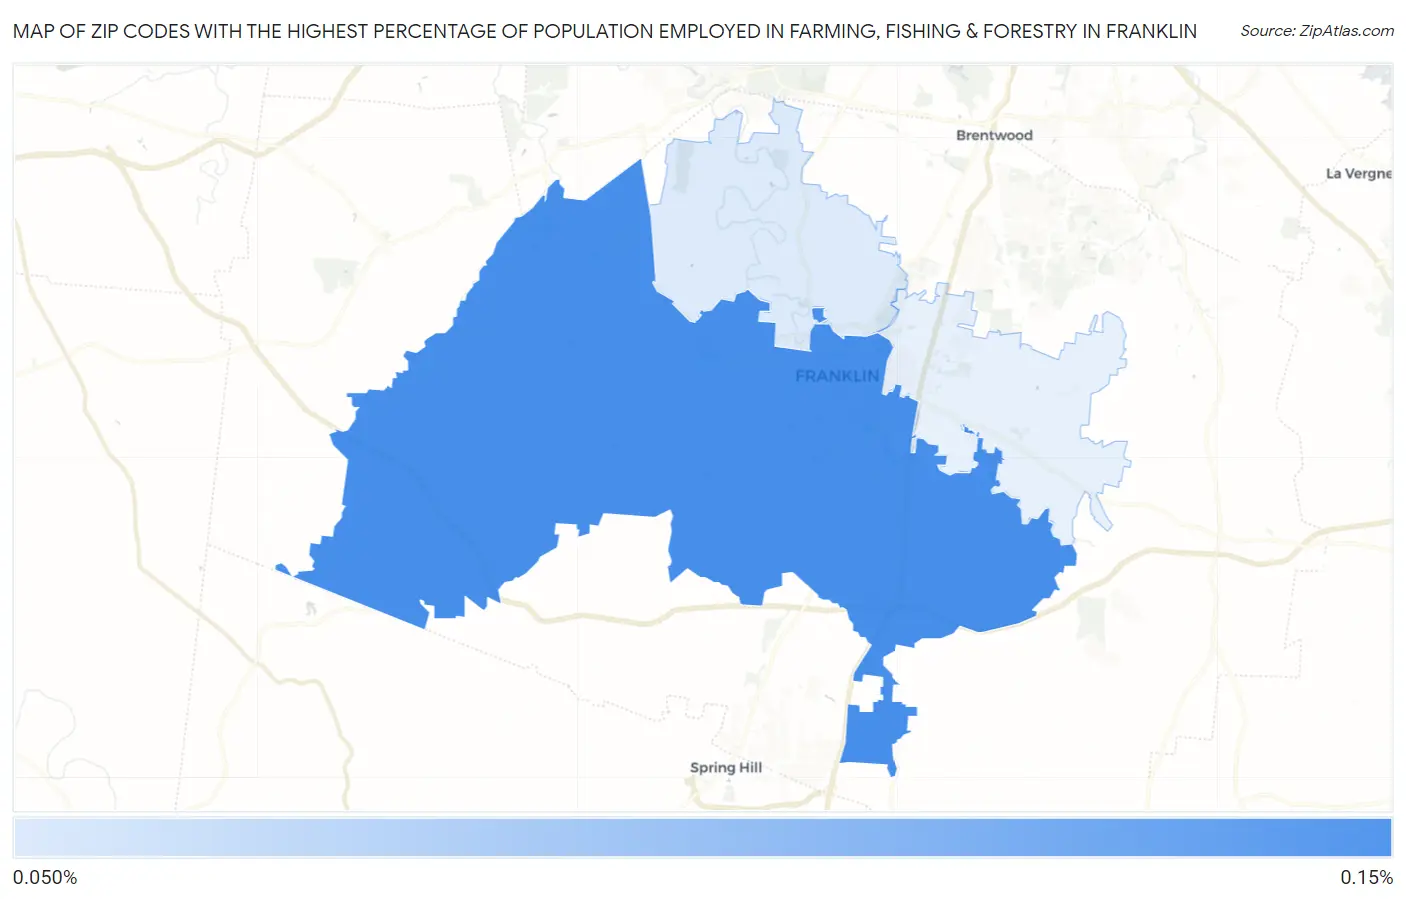
Map of Zip Codes with the Highest Percentage of Population Employed in Farming, Fishing & Forestry in Franklin
0.080%
0.11%
Zip Codes with the Highest Percentage of Population Employed in Farming, Fishing & Forestry in Franklin, TN
| Zip Code | % Employed | vs State | vs National | |
| 1. | 37064 | 0.11% | 0.36%(-0.246)#288 | 0.61%(-0.494)#17,560 |
| 2. | 37069 | 0.080% | 0.36%(-0.278)#300 | 0.61%(-0.526)#18,124 |
1
Common Questions
What are the Top Zip Codes with the Highest Percentage of Population Employed in Farming, Fishing & Forestry in Franklin, TN?
Top Zip Codes with the Highest Percentage of Population Employed in Farming, Fishing & Forestry in Franklin, TN are:
What zip code has the Highest Percentage of Population Employed in Farming, Fishing & Forestry in Franklin, TN?
37064 has the Highest Percentage of Population Employed in Farming, Fishing & Forestry in Franklin, TN with 0.11%.
What is the Percentage of Population Employed in Farming, Fishing & Forestry in Franklin, TN?
Percentage of Population Employed in Farming, Fishing & Forestry in Franklin is 0.054%.
What is the Percentage of Population Employed in Farming, Fishing & Forestry in Tennessee?
Percentage of Population Employed in Farming, Fishing & Forestry in Tennessee is 0.36%.
What is the Percentage of Population Employed in Farming, Fishing & Forestry in the United States?
Percentage of Population Employed in Farming, Fishing & Forestry in the United States is 0.61%.