Zip Codes with the Highest Percentage of Population Employed in Farming, Fishing & Forestry in Knoxville, TN
RELATED REPORTS & OPTIONS
Farming, Fishing & Forestry
Knoxville
Compare Zip Codes
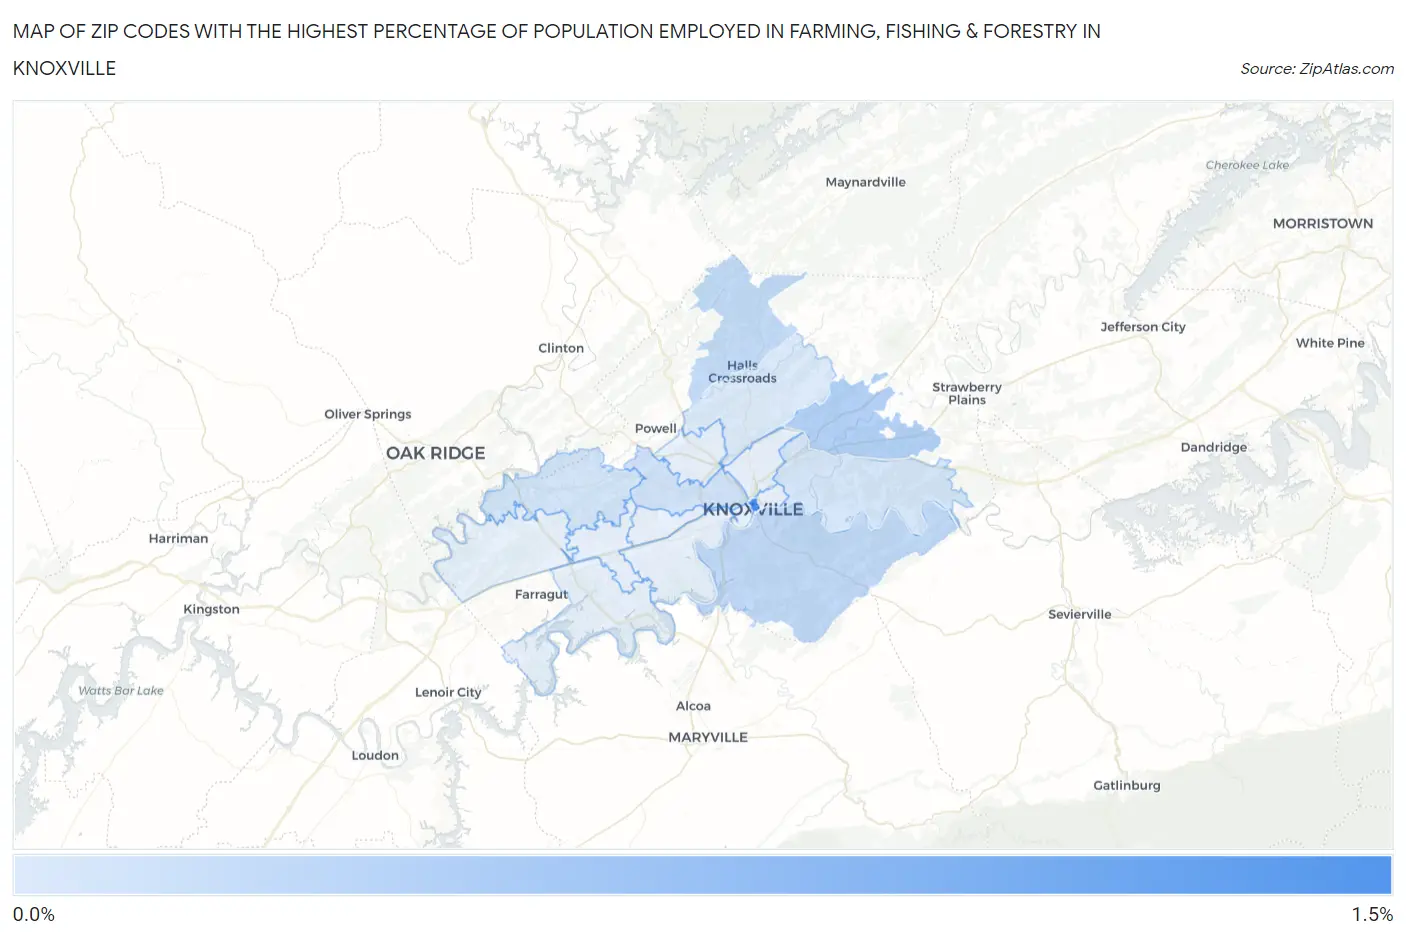
Map of Zip Codes with the Highest Percentage of Population Employed in Farming, Fishing & Forestry in Knoxville
0.052%
1.5%
Zip Codes with the Highest Percentage of Population Employed in Farming, Fishing & Forestry in Knoxville, TN
| Zip Code | % Employed | vs State | vs National | |
| 1. | 37902 | 1.5% | 0.36%(+1.13)#98 | 0.61%(+0.880)#7,925 |
| 2. | 37924 | 0.46% | 0.36%(+0.099)#189 | 0.61%(-0.149)#13,231 |
| 3. | 37920 | 0.32% | 0.36%(-0.033)#217 | 0.61%(-0.281)#14,539 |
| 4. | 37938 | 0.29% | 0.36%(-0.069)#220 | 0.61%(-0.317)#14,962 |
| 5. | 37921 | 0.17% | 0.36%(-0.187)#264 | 0.61%(-0.434)#16,556 |
| 6. | 37931 | 0.14% | 0.36%(-0.216)#276 | 0.61%(-0.464)#17,078 |
| 7. | 37914 | 0.11% | 0.36%(-0.248)#290 | 0.61%(-0.496)#17,586 |
| 8. | 37918 | 0.052% | 0.36%(-0.306)#314 | 0.61%(-0.554)#18,630 |
1
Common Questions
What are the Top 10 Zip Codes with the Highest Percentage of Population Employed in Farming, Fishing & Forestry in Knoxville, TN?
Top 10 Zip Codes with the Highest Percentage of Population Employed in Farming, Fishing & Forestry in Knoxville, TN are:
What zip code has the Highest Percentage of Population Employed in Farming, Fishing & Forestry in Knoxville, TN?
37902 has the Highest Percentage of Population Employed in Farming, Fishing & Forestry in Knoxville, TN with 1.5%.
What is the Percentage of Population Employed in Farming, Fishing & Forestry in Knoxville, TN?
Percentage of Population Employed in Farming, Fishing & Forestry in Knoxville is 0.13%.
What is the Percentage of Population Employed in Farming, Fishing & Forestry in Tennessee?
Percentage of Population Employed in Farming, Fishing & Forestry in Tennessee is 0.36%.
What is the Percentage of Population Employed in Farming, Fishing & Forestry in the United States?
Percentage of Population Employed in Farming, Fishing & Forestry in the United States is 0.61%.