Zip Codes with the Highest Percentage of Population Employed in Farming, Fishing & Forestry in Chattanooga, TN
RELATED REPORTS & OPTIONS
Farming, Fishing & Forestry
Chattanooga
Compare Zip Codes
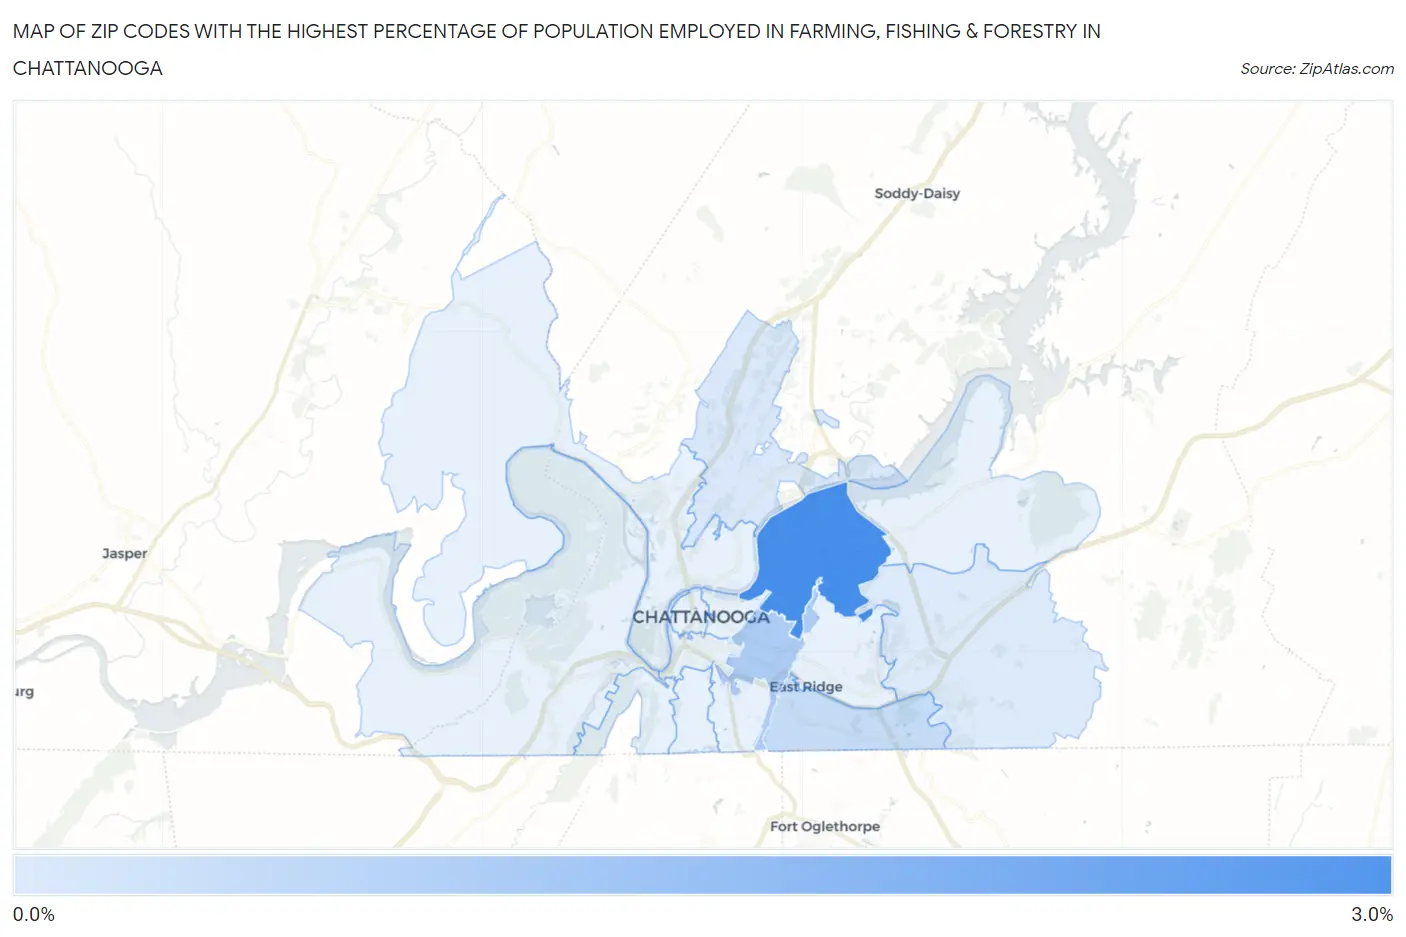
Map of Zip Codes with the Highest Percentage of Population Employed in Farming, Fishing & Forestry in Chattanooga
0.044%
2.7%
Zip Codes with the Highest Percentage of Population Employed in Farming, Fishing & Forestry in Chattanooga, TN
| Zip Code | % Employed | vs State | vs National | |
| 1. | 37406 | 2.7% | 0.36%(+2.39)#53 | 0.61%(+2.14)#5,180 |
| 2. | 37404 | 0.91% | 0.36%(+0.548)#144 | 0.61%(+0.300)#10,202 |
| 3. | 37412 | 0.46% | 0.36%(+0.098)#191 | 0.61%(-0.150)#13,238 |
| 4. | 37415 | 0.089% | 0.36%(-0.268)#294 | 0.61%(-0.516)#17,938 |
| 5. | 37421 | 0.044% | 0.36%(-0.314)#316 | 0.61%(-0.562)#18,756 |
1
Common Questions
What are the Top 10 Zip Codes with the Highest Percentage of Population Employed in Farming, Fishing & Forestry in Chattanooga, TN?
Top 10 Zip Codes with the Highest Percentage of Population Employed in Farming, Fishing & Forestry in Chattanooga, TN are:
What zip code has the Highest Percentage of Population Employed in Farming, Fishing & Forestry in Chattanooga, TN?
37406 has the Highest Percentage of Population Employed in Farming, Fishing & Forestry in Chattanooga, TN with 2.7%.
What is the Percentage of Population Employed in Farming, Fishing & Forestry in Chattanooga, TN?
Percentage of Population Employed in Farming, Fishing & Forestry in Chattanooga is 0.22%.
What is the Percentage of Population Employed in Farming, Fishing & Forestry in Tennessee?
Percentage of Population Employed in Farming, Fishing & Forestry in Tennessee is 0.36%.
What is the Percentage of Population Employed in Farming, Fishing & Forestry in the United States?
Percentage of Population Employed in Farming, Fishing & Forestry in the United States is 0.61%.