Zip Codes with the Highest Percentage of Population Employed in Farming, Fishing & Forestry in Morristown, TN
RELATED REPORTS & OPTIONS
Farming, Fishing & Forestry
Morristown
Compare Zip Codes
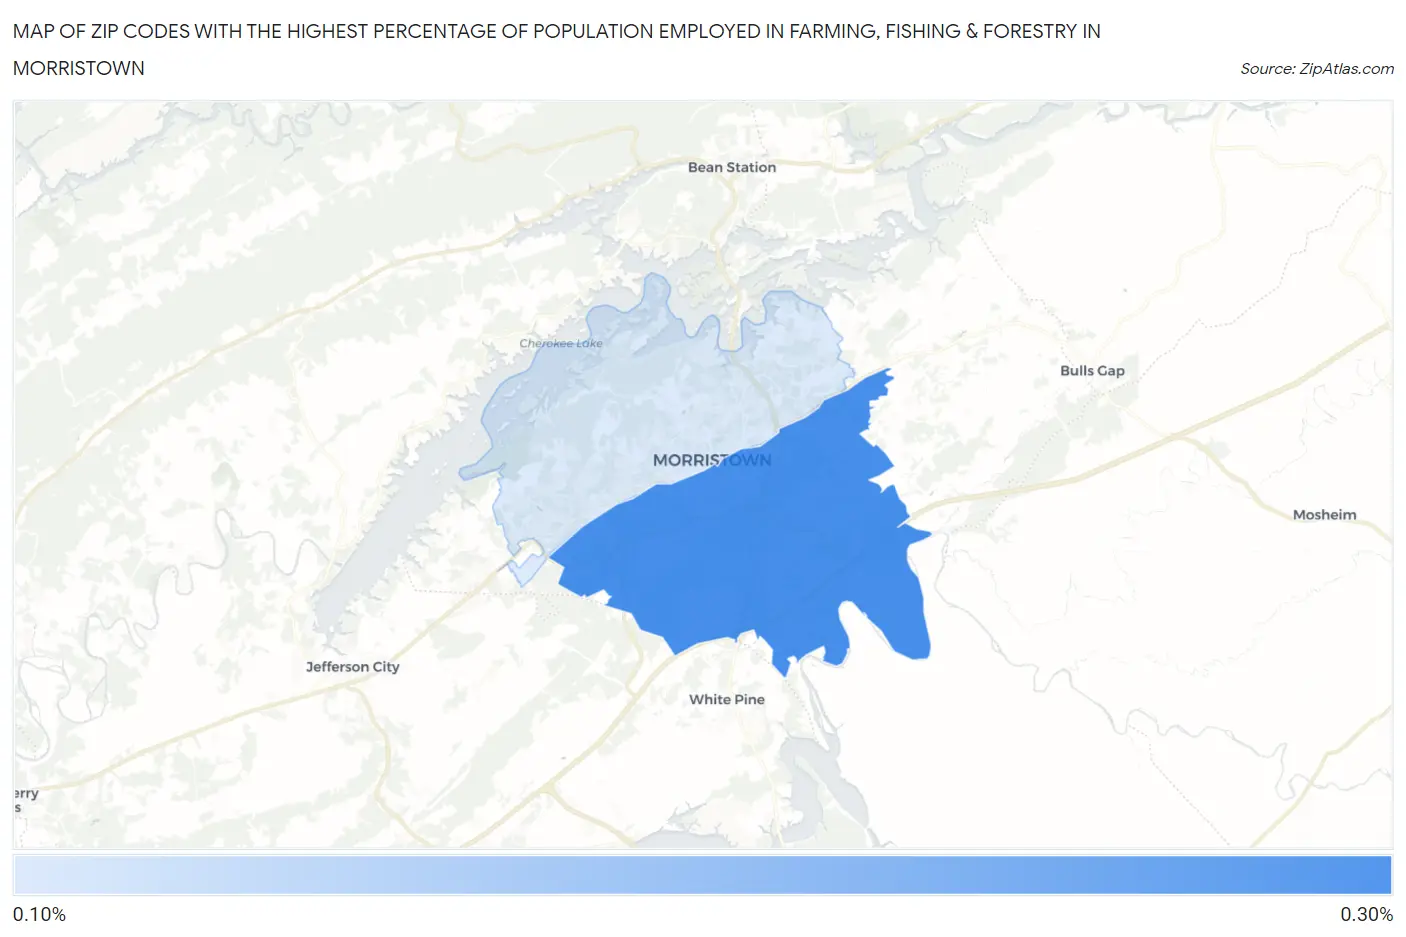
Map of Zip Codes with the Highest Percentage of Population Employed in Farming, Fishing & Forestry in Morristown
0.20%
0.27%
Zip Codes with the Highest Percentage of Population Employed in Farming, Fishing & Forestry in Morristown, TN
| Zip Code | % Employed | vs State | vs National | |
| 1. | 37813 | 0.27% | 0.36%(-0.092)#228 | 0.61%(-0.339)#15,211 |
| 2. | 37814 | 0.20% | 0.36%(-0.158)#252 | 0.61%(-0.406)#16,136 |
1
Common Questions
What are the Top Zip Codes with the Highest Percentage of Population Employed in Farming, Fishing & Forestry in Morristown, TN?
Top Zip Codes with the Highest Percentage of Population Employed in Farming, Fishing & Forestry in Morristown, TN are:
What zip code has the Highest Percentage of Population Employed in Farming, Fishing & Forestry in Morristown, TN?
37813 has the Highest Percentage of Population Employed in Farming, Fishing & Forestry in Morristown, TN with 0.27%.
What is the Percentage of Population Employed in Farming, Fishing & Forestry in Morristown, TN?
Percentage of Population Employed in Farming, Fishing & Forestry in Morristown is 0.14%.
What is the Percentage of Population Employed in Farming, Fishing & Forestry in Tennessee?
Percentage of Population Employed in Farming, Fishing & Forestry in Tennessee is 0.36%.
What is the Percentage of Population Employed in Farming, Fishing & Forestry in the United States?
Percentage of Population Employed in Farming, Fishing & Forestry in the United States is 0.61%.