Zip Codes with the Highest Percentage of Population Employed in Farming, Fishing & Forestry in Maryville, TN
RELATED REPORTS & OPTIONS
Farming, Fishing & Forestry
Maryville
Compare Zip Codes
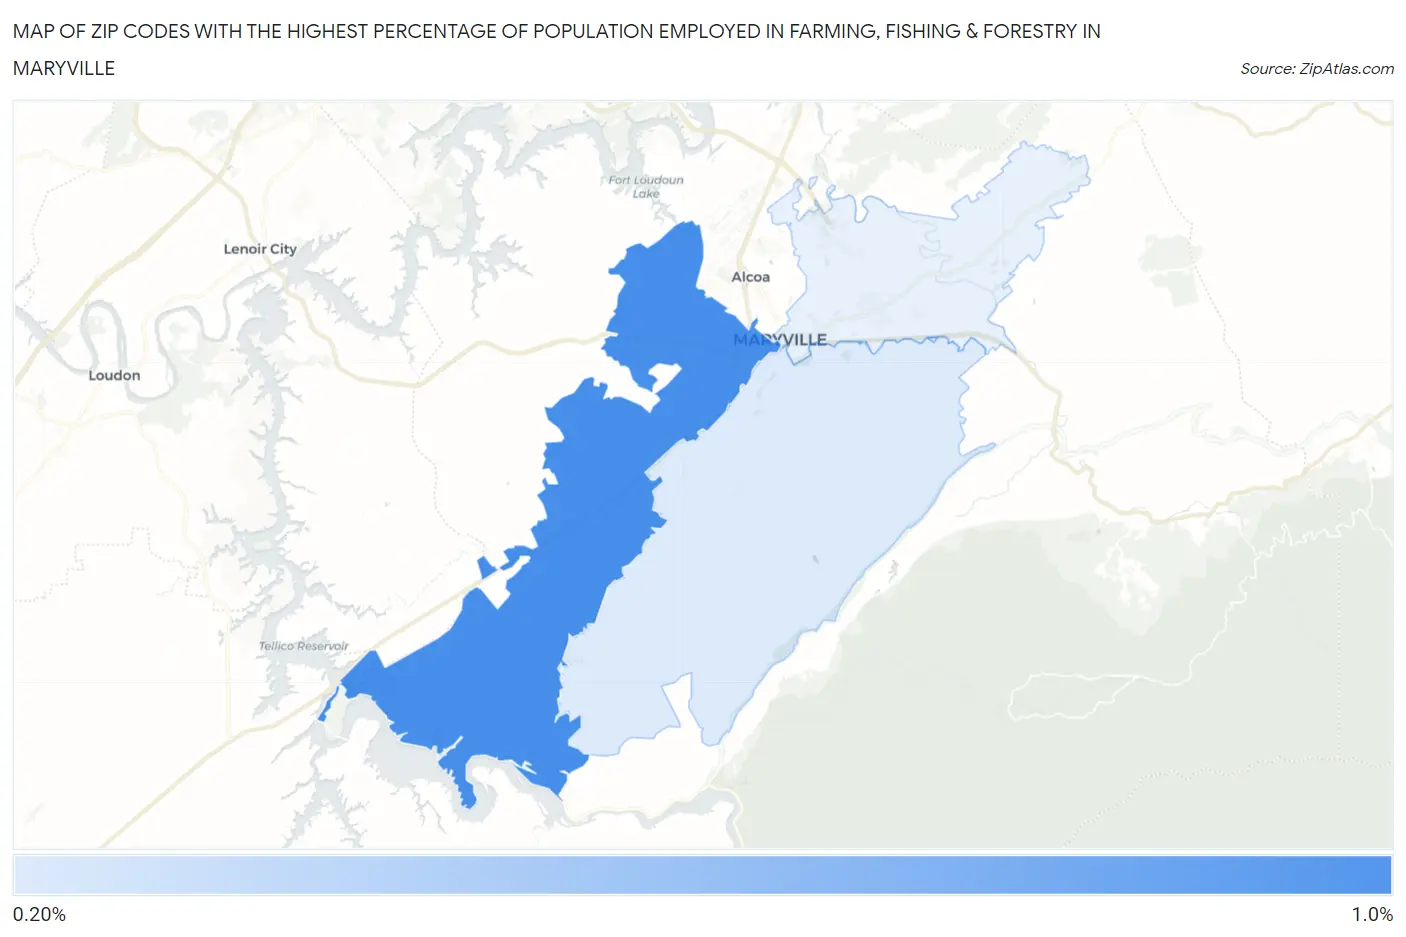
Map of Zip Codes with the Highest Percentage of Population Employed in Farming, Fishing & Forestry in Maryville
0.27%
0.80%
Zip Codes with the Highest Percentage of Population Employed in Farming, Fishing & Forestry in Maryville, TN
| Zip Code | % Employed | vs State | vs National | |
| 1. | 37801 | 0.80% | 0.36%(+0.447)#155 | 0.61%(+0.199)#10,752 |
| 2. | 37803 | 0.27% | 0.36%(-0.084)#226 | 0.61%(-0.332)#15,125 |
1
Common Questions
What are the Top Zip Codes with the Highest Percentage of Population Employed in Farming, Fishing & Forestry in Maryville, TN?
Top Zip Codes with the Highest Percentage of Population Employed in Farming, Fishing & Forestry in Maryville, TN are:
What zip code has the Highest Percentage of Population Employed in Farming, Fishing & Forestry in Maryville, TN?
37801 has the Highest Percentage of Population Employed in Farming, Fishing & Forestry in Maryville, TN with 0.80%.
What is the Percentage of Population Employed in Farming, Fishing & Forestry in Maryville, TN?
Percentage of Population Employed in Farming, Fishing & Forestry in Maryville is 0.39%.
What is the Percentage of Population Employed in Farming, Fishing & Forestry in Tennessee?
Percentage of Population Employed in Farming, Fishing & Forestry in Tennessee is 0.36%.
What is the Percentage of Population Employed in Farming, Fishing & Forestry in the United States?
Percentage of Population Employed in Farming, Fishing & Forestry in the United States is 0.61%.