Roslyn, SD Map & Demographics
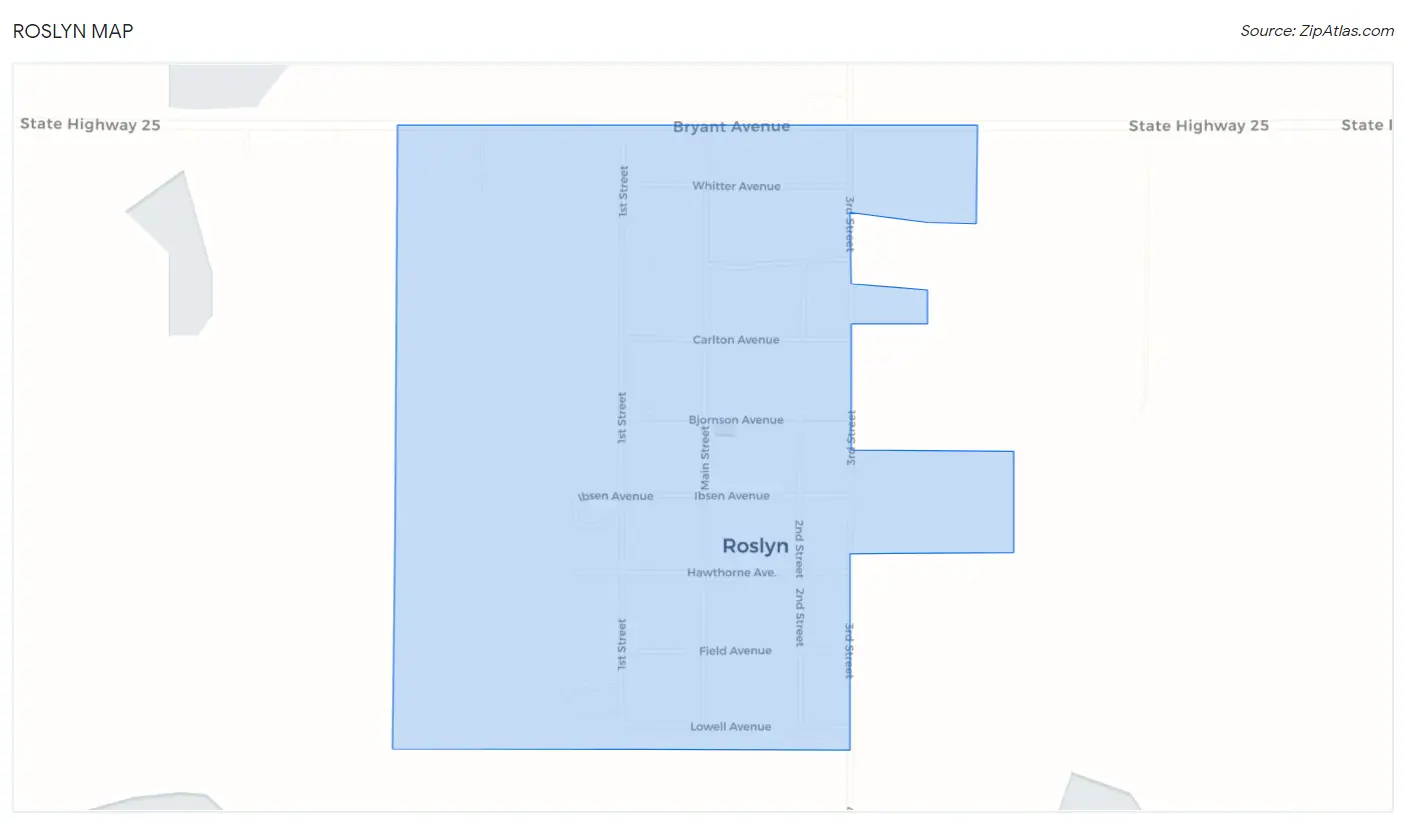
Roslyn Map
Roslyn Overview
$26,603
PER CAPITA INCOME
$85,938
AVG FAMILY INCOME
$62,813
AVG HOUSEHOLD INCOME
38.2%
WAGE / INCOME GAP [ % ]
61.8¢/ $1
WAGE / INCOME GAP [ $ ]
0.33
INEQUALITY / GINI INDEX
183
TOTAL POPULATION
86
MALE POPULATION
97
FEMALE POPULATION
88.66
MALES / 100 FEMALES
112.79
FEMALES / 100 MALES
58.8
MEDIAN AGE
2.7
AVG FAMILY SIZE
2.1
AVG HOUSEHOLD SIZE
72
LABOR FORCE [ PEOPLE ]
48.3%
PERCENT IN LABOR FORCE
Roslyn Zip Codes
Roslyn Area Codes
Income in Roslyn
Income Overview in Roslyn
Per Capita Income in Roslyn is $26,603, while median incomes of families and households are $85,938 and $62,813 respectively.
| Characteristic | Number | Measure |
| Per Capita Income | 183 | $26,603 |
| Median Family Income | 43 | $85,938 |
| Mean Family Income | 43 | $73,756 |
| Median Household Income | 69 | $62,813 |
| Mean Household Income | 69 | $60,832 |
| Income Deficit | 43 | $0 |
| Wage / Income Gap (%) | 183 | 38.19% |
| Wage / Income Gap ($) | 183 | 61.81¢ per $1 |
| Gini / Inequality Index | 183 | 0.33 |
Earnings by Sex in Roslyn
Average Earnings in Roslyn are $40,417, $45,500 for men and $28,125 for women, a difference of 38.2%.
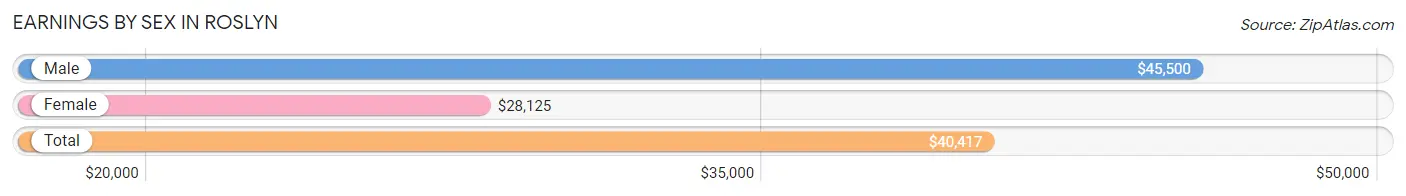
| Sex | Number | Average Earnings |
| Male | 42 (55.3%) | $45,500 |
| Female | 34 (44.7%) | $28,125 |
| Total | 76 (100.0%) | $40,417 |
Earnings by Sex by Income Bracket in Roslyn
The most common earnings brackets in Roslyn are $75,000 to $99,999 for men (10 | 23.8%) and $22,500 to $24,999 for women (7 | 20.6%).
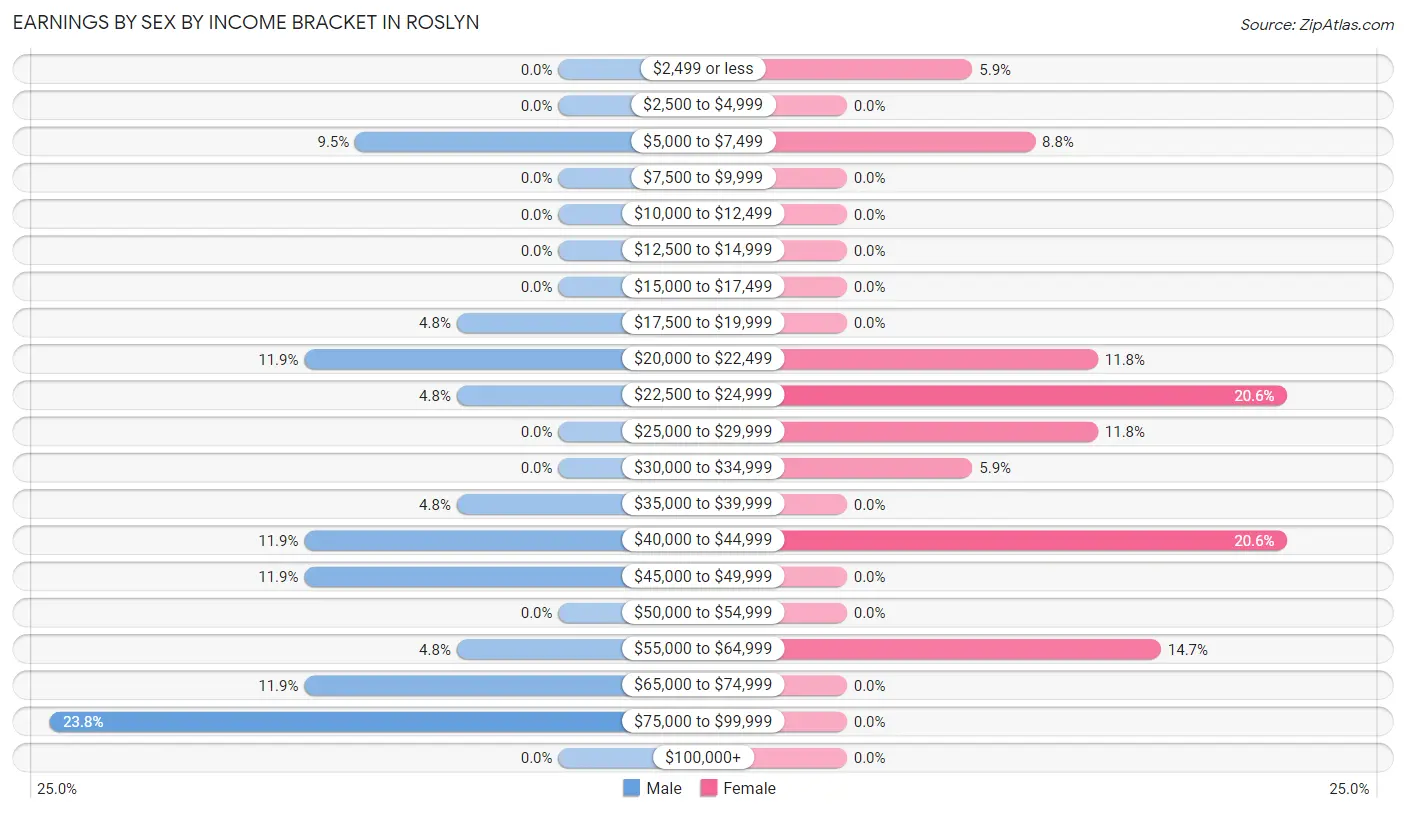
| Income | Male | Female |
| $2,499 or less | 0 (0.0%) | 2 (5.9%) |
| $2,500 to $4,999 | 0 (0.0%) | 0 (0.0%) |
| $5,000 to $7,499 | 4 (9.5%) | 3 (8.8%) |
| $7,500 to $9,999 | 0 (0.0%) | 0 (0.0%) |
| $10,000 to $12,499 | 0 (0.0%) | 0 (0.0%) |
| $12,500 to $14,999 | 0 (0.0%) | 0 (0.0%) |
| $15,000 to $17,499 | 0 (0.0%) | 0 (0.0%) |
| $17,500 to $19,999 | 2 (4.8%) | 0 (0.0%) |
| $20,000 to $22,499 | 5 (11.9%) | 4 (11.8%) |
| $22,500 to $24,999 | 2 (4.8%) | 7 (20.6%) |
| $25,000 to $29,999 | 0 (0.0%) | 4 (11.8%) |
| $30,000 to $34,999 | 0 (0.0%) | 2 (5.9%) |
| $35,000 to $39,999 | 2 (4.8%) | 0 (0.0%) |
| $40,000 to $44,999 | 5 (11.9%) | 7 (20.6%) |
| $45,000 to $49,999 | 5 (11.9%) | 0 (0.0%) |
| $50,000 to $54,999 | 0 (0.0%) | 0 (0.0%) |
| $55,000 to $64,999 | 2 (4.8%) | 5 (14.7%) |
| $65,000 to $74,999 | 5 (11.9%) | 0 (0.0%) |
| $75,000 to $99,999 | 10 (23.8%) | 0 (0.0%) |
| $100,000+ | 0 (0.0%) | 0 (0.0%) |
| Total | 42 (100.0%) | 34 (100.0%) |
Earnings by Sex by Educational Attainment in Roslyn
Average earnings in Roslyn are $45,500 for men and $28,125 for women, a difference of 38.2%. Men with an educational attainment of high school diploma enjoy the highest average annual earnings of $69,688, while those with college or associate's degree education earn the least with $46,875. Women with an educational attainment of high school diploma earn the most with the average annual earnings of $35,000, while those with college or associate's degree education have the smallest earnings of $23,000.
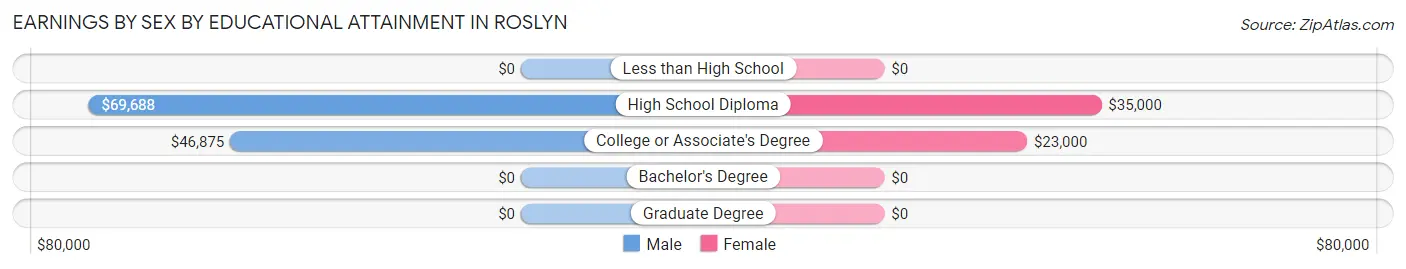
| Educational Attainment | Male Income | Female Income |
| Less than High School | - | - |
| High School Diploma | $69,688 | $35,000 |
| College or Associate's Degree | $46,875 | $23,000 |
| Bachelor's Degree | - | - |
| Graduate Degree | - | - |
| Total | $45,500 | $28,125 |
Family Income in Roslyn
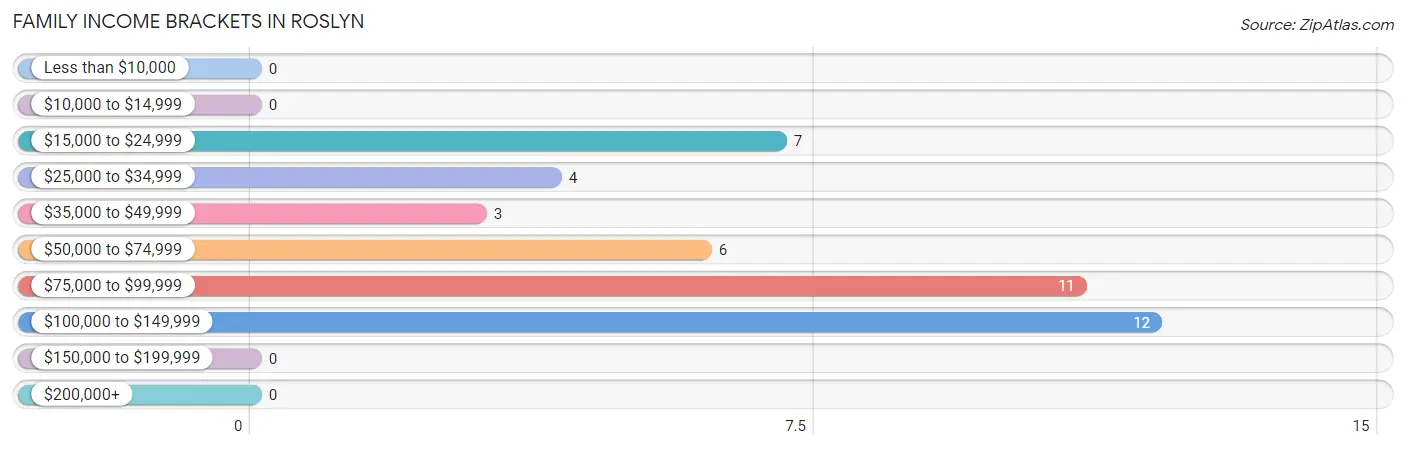
Family Income Brackets in Roslyn
According to the Roslyn family income data, there are 12 families falling into the $100,000 to $149,999 income range, which is the most common income bracket and makes up 27.9% of all families.
| Income Bracket | # Families | % Families |
| Less than $10,000 | 0 | 0.0% |
| $10,000 to $14,999 | 0 | 0.0% |
| $15,000 to $24,999 | 7 | 16.3% |
| $25,000 to $34,999 | 4 | 9.3% |
| $35,000 to $49,999 | 3 | 7.0% |
| $50,000 to $74,999 | 6 | 14.0% |
| $75,000 to $99,999 | 11 | 25.6% |
| $100,000 to $149,999 | 12 | 27.9% |
| $150,000 to $199,999 | 0 | 0.0% |
| $200,000+ | 0 | 0.0% |
Family Income by Famaliy Size in Roslyn
2-person families (27 | 62.8%) account for the highest median family income in Roslyn with $88,750 per family, while 2-person families (27 | 62.8%) have the highest median income of $44,375 per family member.
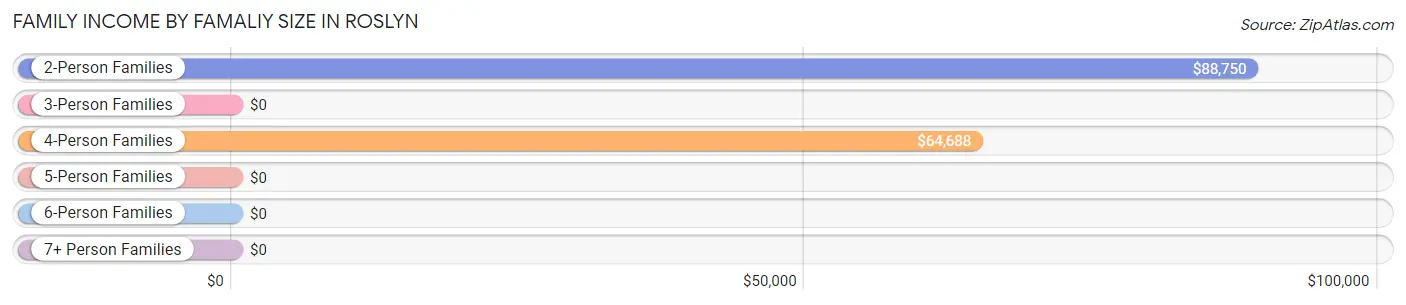
| Income Bracket | # Families | Median Income |
| 2-Person Families | 27 (62.8%) | $88,750 |
| 3-Person Families | 9 (20.9%) | $0 |
| 4-Person Families | 7 (16.3%) | $64,688 |
| 5-Person Families | 0 (0.0%) | $0 |
| 6-Person Families | 0 (0.0%) | $0 |
| 7+ Person Families | 0 (0.0%) | $0 |
| Total | 43 (100.0%) | $85,938 |
Family Income by Number of Earners in Roslyn
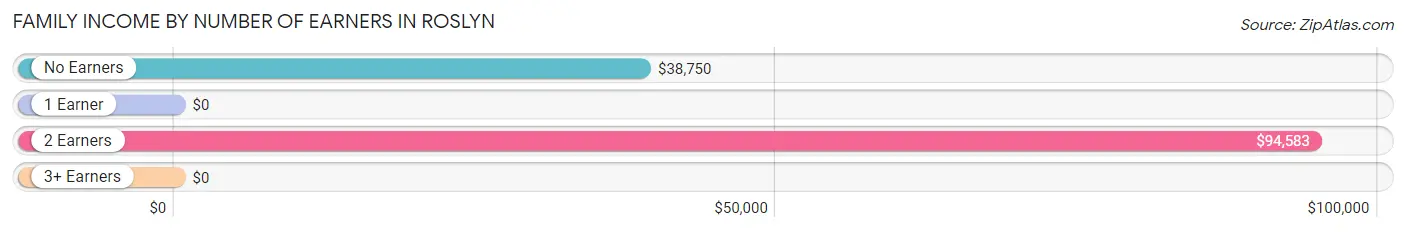
| Number of Earners | # Families | Median Income |
| No Earners | 6 (14.0%) | $38,750 |
| 1 Earner | 16 (37.2%) | $0 |
| 2 Earners | 21 (48.8%) | $94,583 |
| 3+ Earners | 0 (0.0%) | $0 |
| Total | 43 (100.0%) | $85,938 |
Household Income in Roslyn
Household Income Brackets in Roslyn
With 19 households falling in the category, the $15,000 to $24,999 income range is the most frequent in Roslyn, accounting for 27.5% of all households.
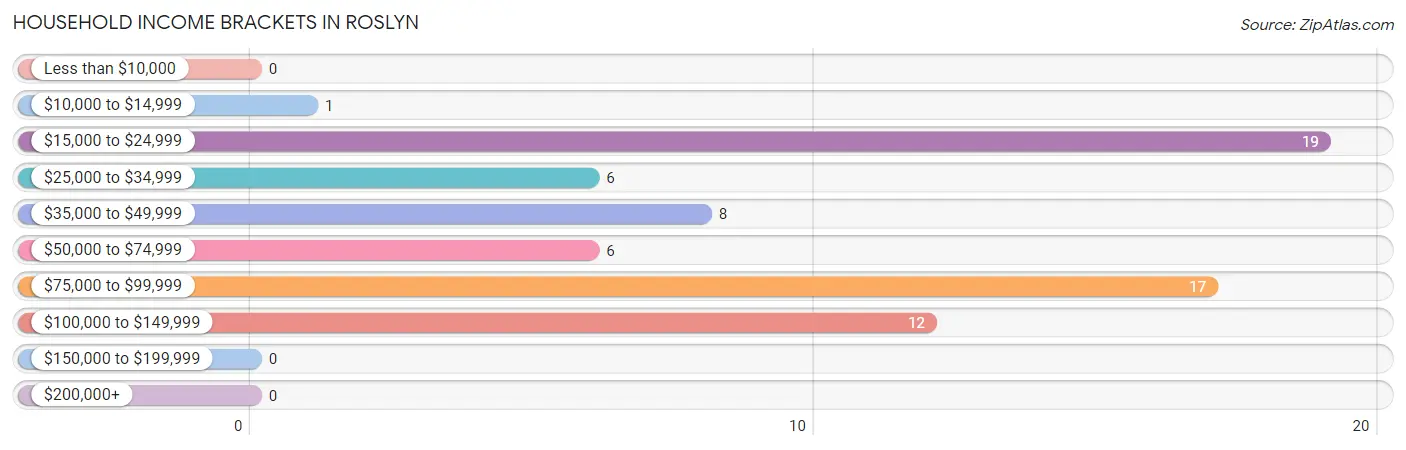
| Income Bracket | # Households | % Households |
| Less than $10,000 | 0 | 0.0% |
| $10,000 to $14,999 | 1 | 1.4% |
| $15,000 to $24,999 | 19 | 27.5% |
| $25,000 to $34,999 | 6 | 8.7% |
| $35,000 to $49,999 | 8 | 11.6% |
| $50,000 to $74,999 | 6 | 8.7% |
| $75,000 to $99,999 | 17 | 24.6% |
| $100,000 to $149,999 | 12 | 17.4% |
| $150,000 to $199,999 | 0 | 0.0% |
| $200,000+ | 0 | 0.0% |
Household Income by Householder Age in Roslyn
The median household income in Roslyn is $62,813, with the highest median household income of $77,250 found in the 45 to 64 years age bracket for the primary householder. A total of 23 households (33.3%) fall into this category.
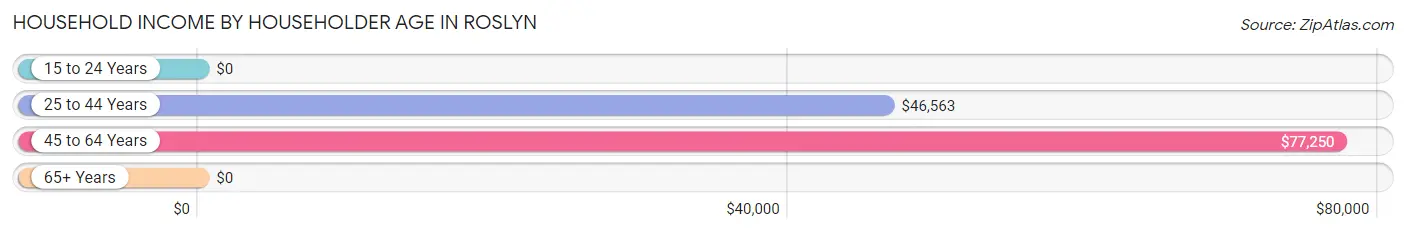
| Income Bracket | # Households | Median Income |
| 15 to 24 Years | 0 (0.0%) | $0 |
| 25 to 44 Years | 23 (33.3%) | $46,563 |
| 45 to 64 Years | 23 (33.3%) | $77,250 |
| 65+ Years | 23 (33.3%) | $0 |
| Total | 69 (100.0%) | $62,813 |
Poverty in Roslyn
Income Below Poverty by Sex and Age in Roslyn
With 3.8% poverty level for males and 4.6% for females among the residents of Roslyn, under 5 year old males and 25 to 34 year old females are the most vulnerable to poverty, with 2 males (18.2%) and 2 females (28.6%) in their respective age groups living below the poverty level.
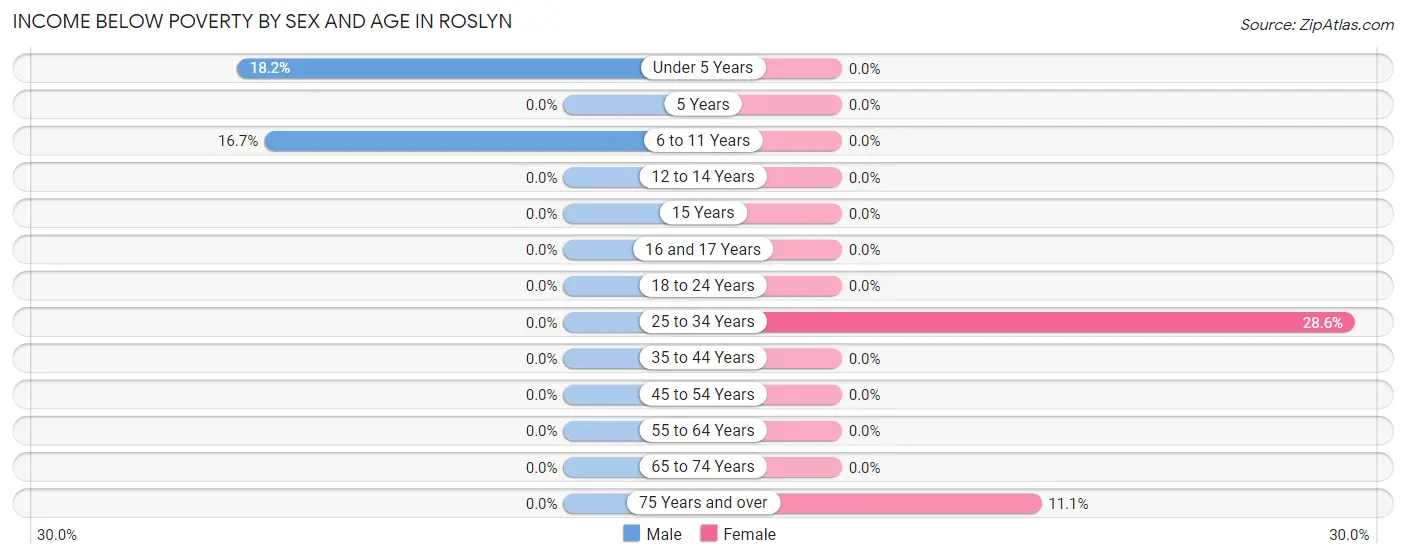
| Age Bracket | Male | Female |
| Under 5 Years | 2 (18.2%) | 0 (0.0%) |
| 5 Years | 0 (0.0%) | 0 (0.0%) |
| 6 to 11 Years | 1 (16.7%) | 0 (0.0%) |
| 12 to 14 Years | 0 (0.0%) | 0 (0.0%) |
| 15 Years | 0 (0.0%) | 0 (0.0%) |
| 16 and 17 Years | 0 (0.0%) | 0 (0.0%) |
| 18 to 24 Years | 0 (0.0%) | 0 (0.0%) |
| 25 to 34 Years | 0 (0.0%) | 2 (28.6%) |
| 35 to 44 Years | 0 (0.0%) | 0 (0.0%) |
| 45 to 54 Years | 0 (0.0%) | 0 (0.0%) |
| 55 to 64 Years | 0 (0.0%) | 0 (0.0%) |
| 65 to 74 Years | 0 (0.0%) | 0 (0.0%) |
| 75 Years and over | 0 (0.0%) | 1 (11.1%) |
| Total | 3 (3.8%) | 3 (4.6%) |
Income Above Poverty by Sex and Age in Roslyn
According to the poverty statistics in Roslyn, males aged 12 to 14 years and females aged 6 to 11 years are the age groups that are most secure financially, with 100.0% of males and 100.0% of females in these age groups living above the poverty line.
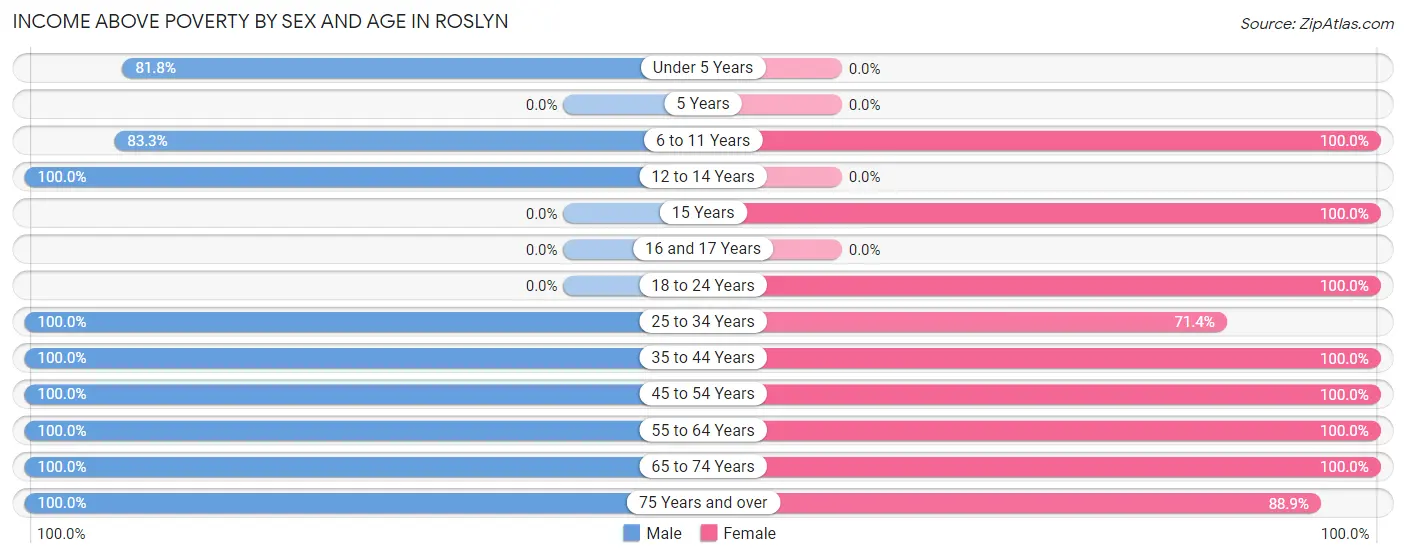
| Age Bracket | Male | Female |
| Under 5 Years | 9 (81.8%) | 0 (0.0%) |
| 5 Years | 0 (0.0%) | 0 (0.0%) |
| 6 to 11 Years | 5 (83.3%) | 8 (100.0%) |
| 12 to 14 Years | 4 (100.0%) | 0 (0.0%) |
| 15 Years | 0 (0.0%) | 5 (100.0%) |
| 16 and 17 Years | 0 (0.0%) | 0 (0.0%) |
| 18 to 24 Years | 0 (0.0%) | 5 (100.0%) |
| 25 to 34 Years | 4 (100.0%) | 5 (71.4%) |
| 35 to 44 Years | 9 (100.0%) | 11 (100.0%) |
| 45 to 54 Years | 5 (100.0%) | 3 (100.0%) |
| 55 to 64 Years | 19 (100.0%) | 11 (100.0%) |
| 65 to 74 Years | 13 (100.0%) | 6 (100.0%) |
| 75 Years and over | 8 (100.0%) | 8 (88.9%) |
| Total | 76 (96.2%) | 62 (95.4%) |
Income Below Poverty Among Married-Couple Families in Roslyn
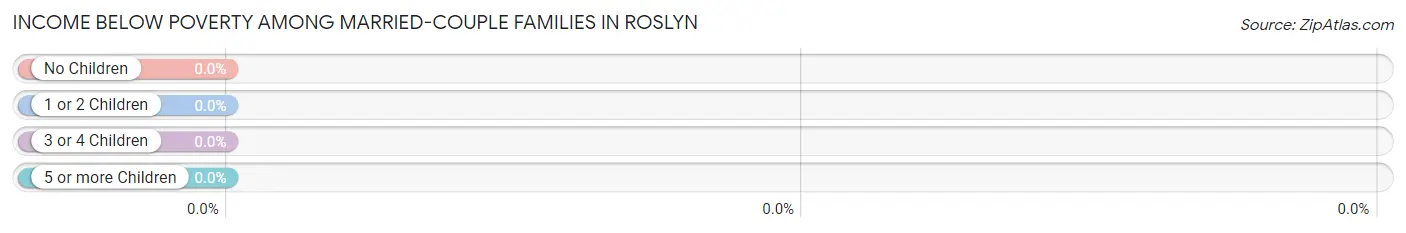
| Children | Above Poverty | Below Poverty |
| No Children | 25 (100.0%) | 0 (0.0%) |
| 1 or 2 Children | 7 (100.0%) | 0 (0.0%) |
| 3 or 4 Children | 0 (0.0%) | 0 (0.0%) |
| 5 or more Children | 0 (0.0%) | 0 (0.0%) |
| Total | 32 (100.0%) | 0 (0.0%) |
Income Below Poverty Among Single-Parent Households in Roslyn
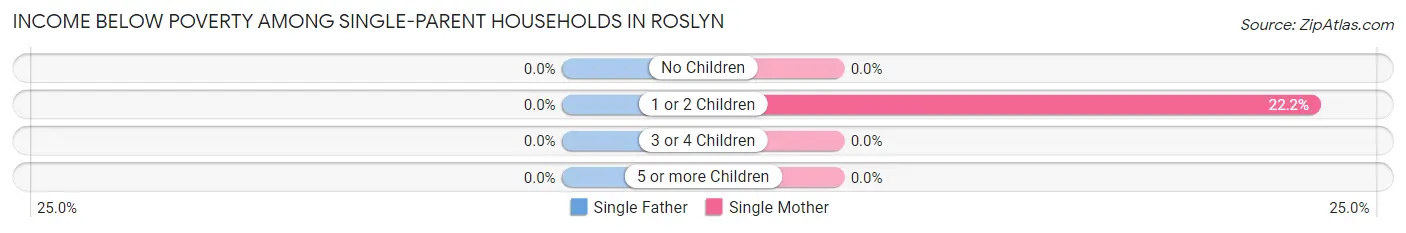
| Children | Single Father | Single Mother |
| No Children | 0 (0.0%) | 0 (0.0%) |
| 1 or 2 Children | 0 (0.0%) | 2 (22.2%) |
| 3 or 4 Children | 0 (0.0%) | 0 (0.0%) |
| 5 or more Children | 0 (0.0%) | 0 (0.0%) |
| Total | 0 (0.0%) | 2 (18.2%) |
Income Below Poverty Among Married-Couple vs Single-Parent Households in Roslyn
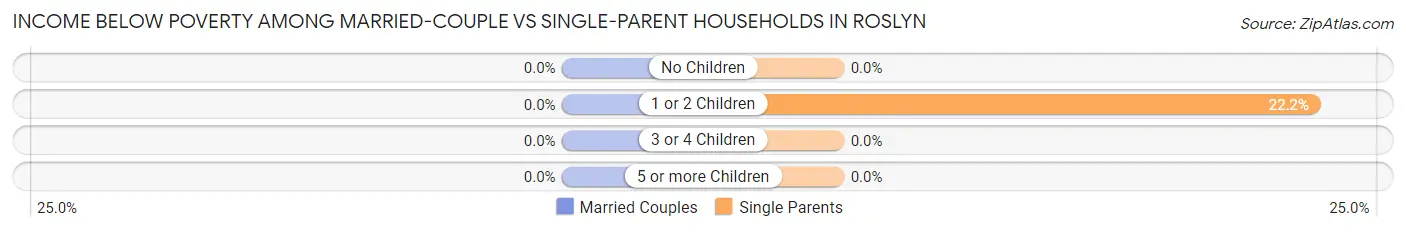
| Children | Married-Couple Families | Single-Parent Households |
| No Children | 0 (0.0%) | 0 (0.0%) |
| 1 or 2 Children | 0 (0.0%) | 2 (22.2%) |
| 3 or 4 Children | 0 (0.0%) | 0 (0.0%) |
| 5 or more Children | 0 (0.0%) | 0 (0.0%) |
| Total | 0 (0.0%) | 2 (18.2%) |
Race in Roslyn
The most populous races in Roslyn are White / Caucasian (164 | 89.6%), Native / Alaskan (16 | 8.7%), and Two or more Races (3 | 1.6%).
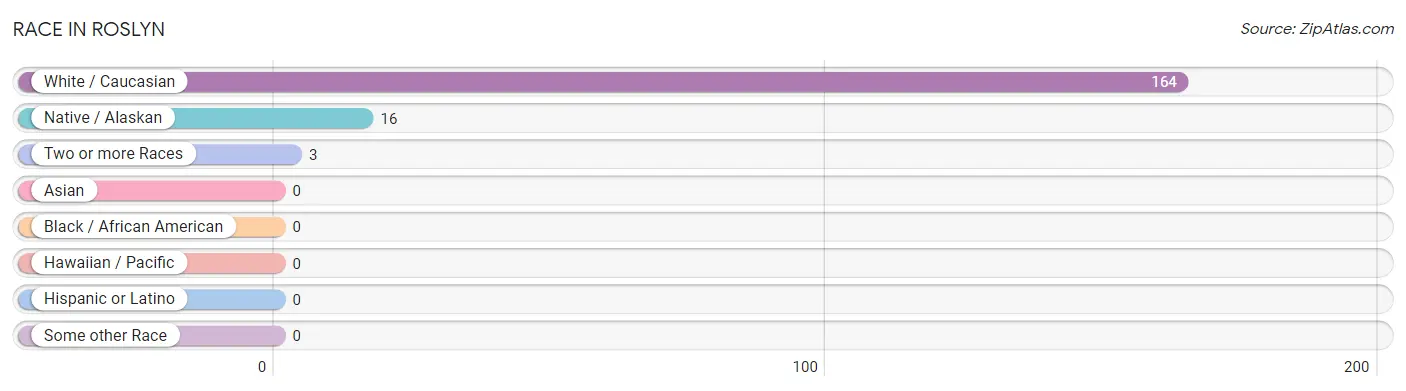
| Race | # Population | % Population |
| Asian | 0 | 0.0% |
| Black / African American | 0 | 0.0% |
| Hawaiian / Pacific | 0 | 0.0% |
| Hispanic or Latino | 0 | 0.0% |
| Native / Alaskan | 16 | 8.7% |
| White / Caucasian | 164 | 89.6% |
| Two or more Races | 3 | 1.6% |
| Some other Race | 0 | 0.0% |
| Total | 183 | 100.0% |
Ancestry in Roslyn
The most populous ancestries reported in Roslyn are German (73 | 39.9%), Norwegian (56 | 30.6%), Polish (28 | 15.3%), Scandinavian (19 | 10.4%), and Sioux (16 | 8.7%), together accounting for 104.9% of all Roslyn residents.
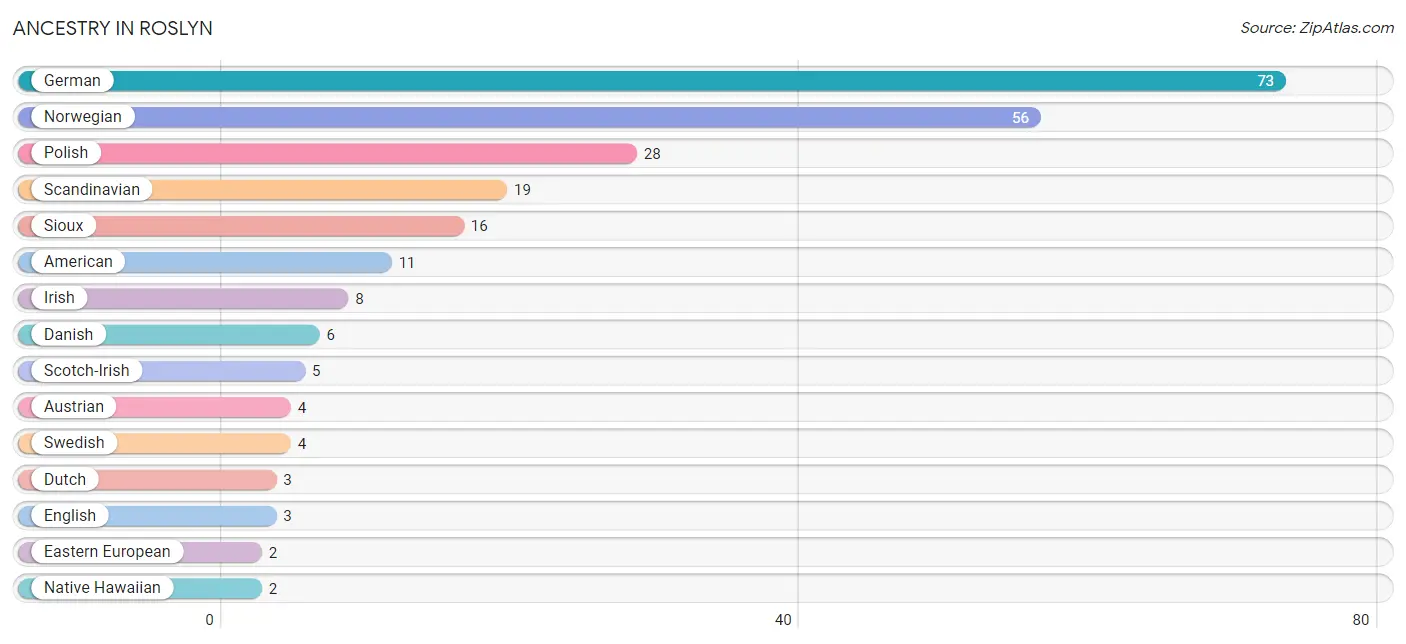
| Ancestry | # Population | % Population |
| American | 11 | 6.0% |
| Austrian | 4 | 2.2% |
| Chippewa | 1 | 0.5% |
| Croatian | 1 | 0.5% |
| Danish | 6 | 3.3% |
| Dutch | 3 | 1.6% |
| Eastern European | 2 | 1.1% |
| English | 3 | 1.6% |
| French | 1 | 0.5% |
| German | 73 | 39.9% |
| Irish | 8 | 4.4% |
| Native Hawaiian | 2 | 1.1% |
| Norwegian | 56 | 30.6% |
| Polish | 28 | 15.3% |
| Scandinavian | 19 | 10.4% |
| Scotch-Irish | 5 | 2.7% |
| Sioux | 16 | 8.7% |
| Swedish | 4 | 2.2% |
| Welsh | 1 | 0.5% | View All 19 Rows |
Immigrants in Roslyn

| Immigration Origin | # Population | % Population | View All 0 Rows |
Sex and Age in Roslyn
Sex and Age in Roslyn
The most populous age groups in Roslyn are 55 to 59 Years (14 | 16.3%) for men and 80 to 84 Years (19 | 19.6%) for women.
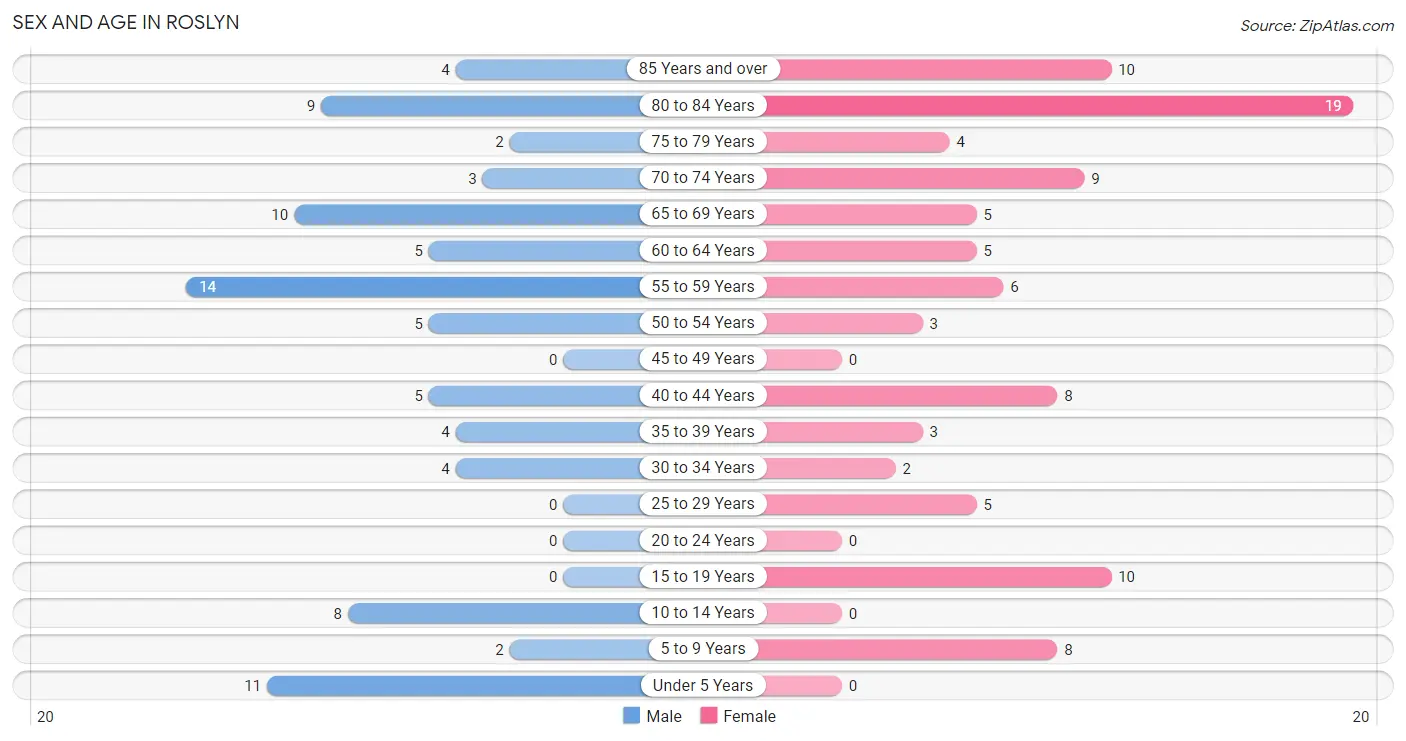
| Age Bracket | Male | Female |
| Under 5 Years | 11 (12.8%) | 0 (0.0%) |
| 5 to 9 Years | 2 (2.3%) | 8 (8.3%) |
| 10 to 14 Years | 8 (9.3%) | 0 (0.0%) |
| 15 to 19 Years | 0 (0.0%) | 10 (10.3%) |
| 20 to 24 Years | 0 (0.0%) | 0 (0.0%) |
| 25 to 29 Years | 0 (0.0%) | 5 (5.1%) |
| 30 to 34 Years | 4 (4.6%) | 2 (2.1%) |
| 35 to 39 Years | 4 (4.6%) | 3 (3.1%) |
| 40 to 44 Years | 5 (5.8%) | 8 (8.3%) |
| 45 to 49 Years | 0 (0.0%) | 0 (0.0%) |
| 50 to 54 Years | 5 (5.8%) | 3 (3.1%) |
| 55 to 59 Years | 14 (16.3%) | 6 (6.2%) |
| 60 to 64 Years | 5 (5.8%) | 5 (5.1%) |
| 65 to 69 Years | 10 (11.6%) | 5 (5.1%) |
| 70 to 74 Years | 3 (3.5%) | 9 (9.3%) |
| 75 to 79 Years | 2 (2.3%) | 4 (4.1%) |
| 80 to 84 Years | 9 (10.5%) | 19 (19.6%) |
| 85 Years and over | 4 (4.6%) | 10 (10.3%) |
| Total | 86 (100.0%) | 97 (100.0%) |
Families and Households in Roslyn
Median Family Size in Roslyn
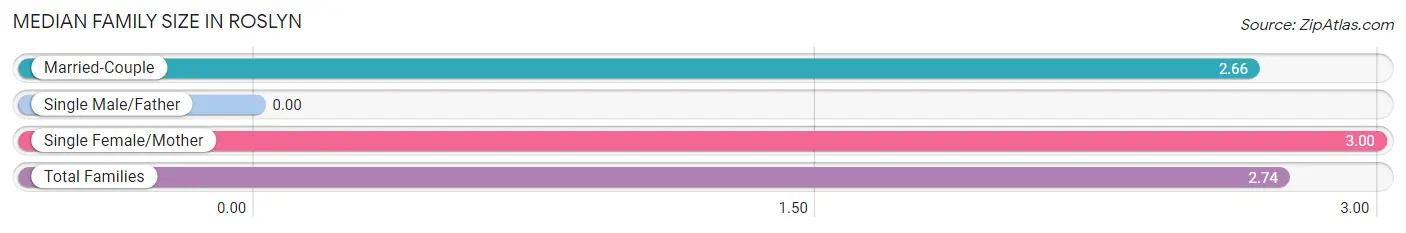
| Family Type | # Families | Family Size |
| Married-Couple | 32 (74.4%) | 2.66 |
| Single Male/Father | 0 (0.0%) | - |
| Single Female/Mother | 11 (25.6%) | 3.00 |
| Total Families | 43 (100.0%) | 2.74 |
Median Household Size in Roslyn
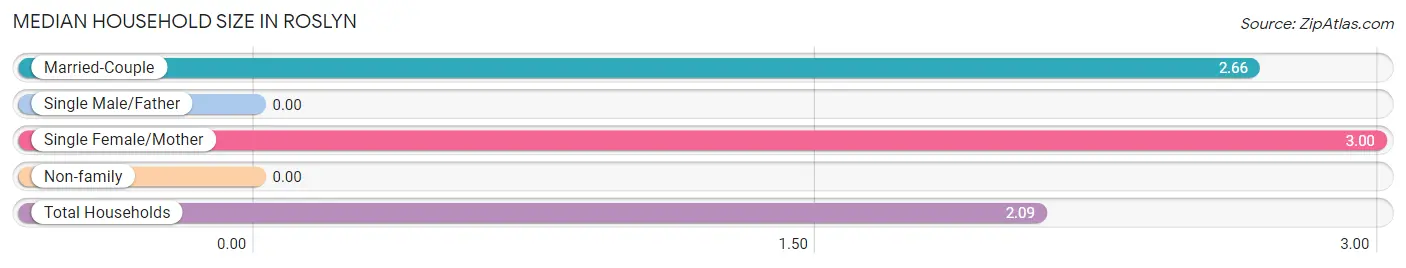
| Household Type | # Households | Household Size |
| Married-Couple | 32 (46.4%) | 2.66 |
| Single Male/Father | 0 (0.0%) | - |
| Single Female/Mother | 11 (15.9%) | 3.00 |
| Non-family | 26 (37.7%) | - |
| Total Households | 69 (100.0%) | 2.09 |
Household Size by Marriage Status in Roslyn
Out of a total of 69 households in Roslyn, 43 (62.3%) are family households, while 26 (37.7%) are nonfamily households. The most numerous type of family households are 2-person households, comprising 27, and the most common type of nonfamily households are 1-person households, comprising 26.
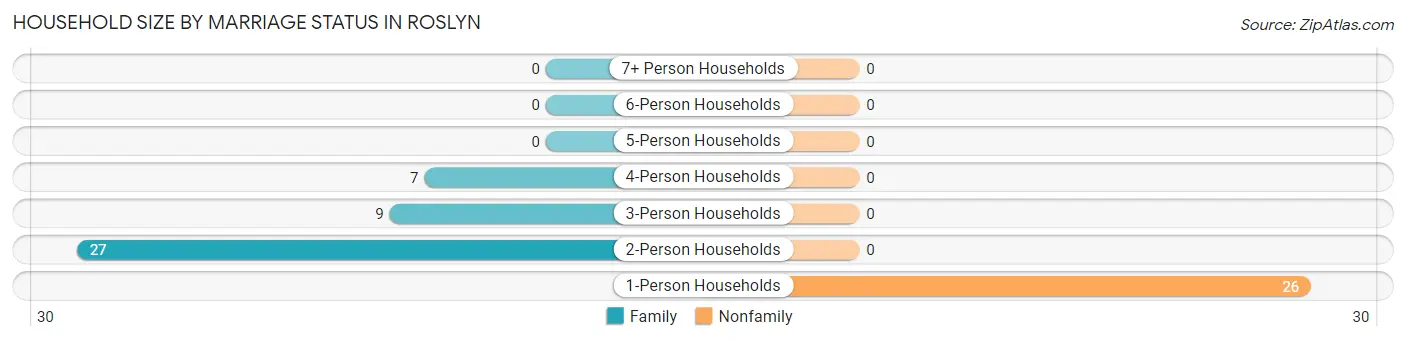
| Household Size | Family Households | Nonfamily Households |
| 1-Person Households | - | 26 (37.7%) |
| 2-Person Households | 27 (39.1%) | 0 (0.0%) |
| 3-Person Households | 9 (13.0%) | 0 (0.0%) |
| 4-Person Households | 7 (10.1%) | 0 (0.0%) |
| 5-Person Households | 0 (0.0%) | 0 (0.0%) |
| 6-Person Households | 0 (0.0%) | 0 (0.0%) |
| 7+ Person Households | 0 (0.0%) | 0 (0.0%) |
| Total | 43 (62.3%) | 26 (37.7%) |
Female Fertility in Roslyn
Fertility by Age in Roslyn
Average fertility rate in Roslyn is 71.0 births per 1,000 women. Women in the age bracket of 20 to 34 years have the highest fertility rate with 286.0 births per 1,000 women. Women in the age bracket of 20 to 34 years acount for 100.0% of all women with births.
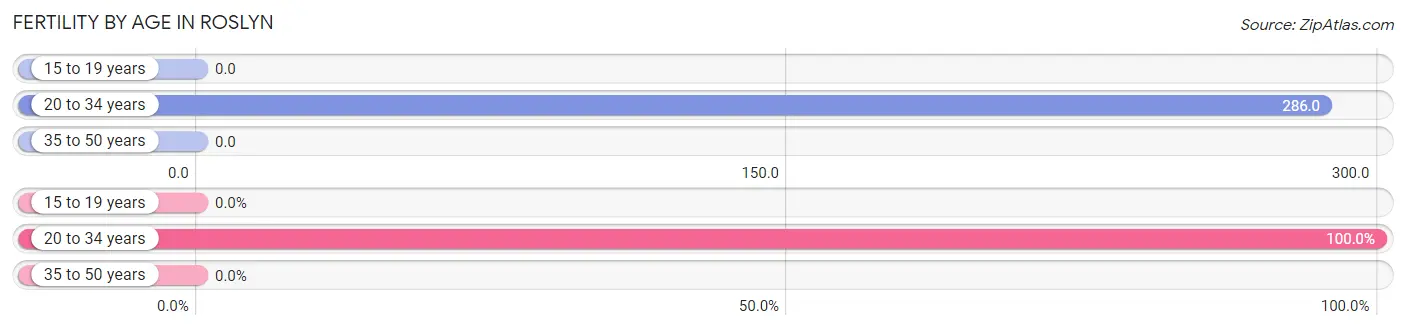
| Age Bracket | Women with Births | Births / 1,000 Women |
| 15 to 19 years | 0 (0.0%) | 0.0 |
| 20 to 34 years | 2 (100.0%) | 286.0 |
| 35 to 50 years | 0 (0.0%) | 0.0 |
| Total | 2 (100.0%) | 71.0 |
Fertility by Age by Marriage Status in Roslyn
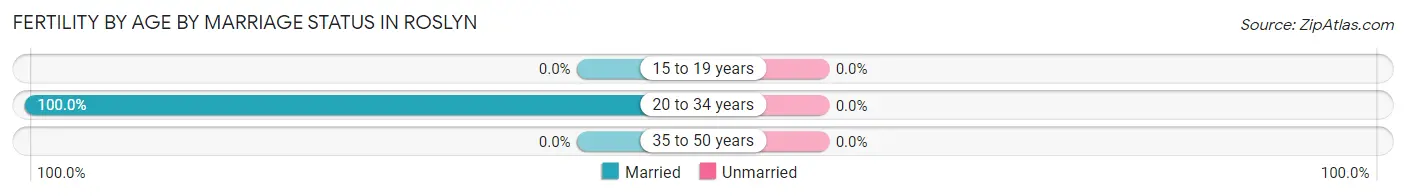
| Age Bracket | Married | Unmarried |
| 15 to 19 years | 0 (0.0%) | 0 (0.0%) |
| 20 to 34 years | 2 (100.0%) | 0 (0.0%) |
| 35 to 50 years | 0 (0.0%) | 0 (0.0%) |
| Total | 2 (100.0%) | 0 (0.0%) |
Fertility by Education in Roslyn
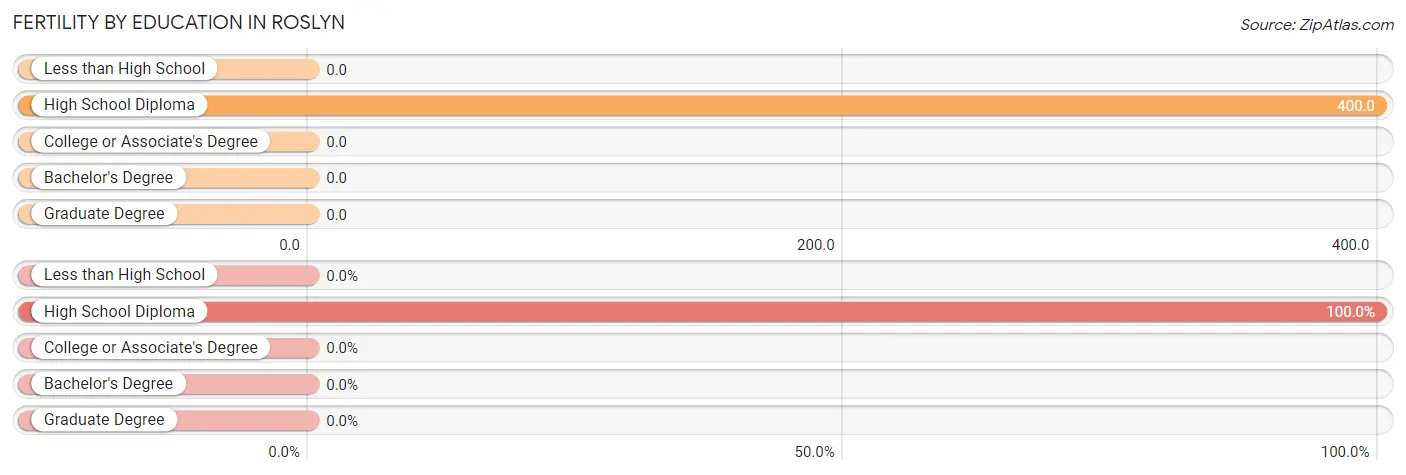
| Educational Attainment | Women with Births | Births / 1,000 Women |
| Less than High School | 0 (0.0%) | 0.0 |
| High School Diploma | 2 (100.0%) | 400.0 |
| College or Associate's Degree | 0 (0.0%) | 0.0 |
| Bachelor's Degree | 0 (0.0%) | 0.0 |
| Graduate Degree | 0 (0.0%) | 0.0 |
| Total | 2 (100.0%) | 71.0 |
Fertility by Education by Marriage Status in Roslyn
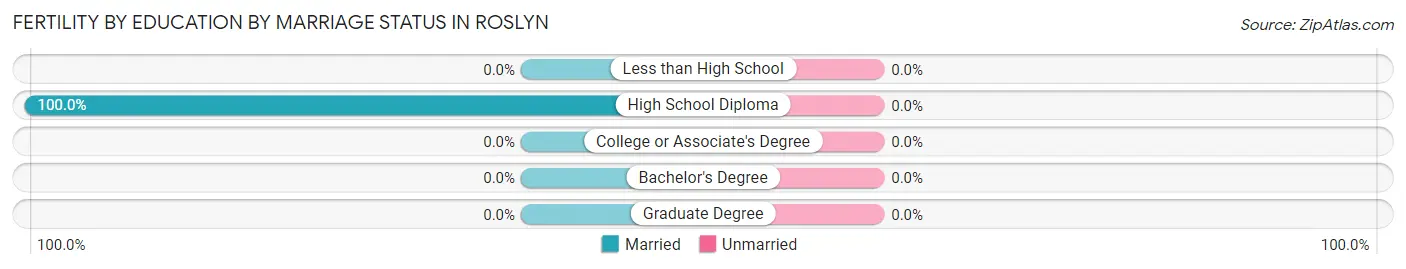
| Educational Attainment | Married | Unmarried |
| Less than High School | 0 (0.0%) | 0 (0.0%) |
| High School Diploma | 2 (100.0%) | 0 (0.0%) |
| College or Associate's Degree | 0 (0.0%) | 0 (0.0%) |
| Bachelor's Degree | 0 (0.0%) | 0 (0.0%) |
| Graduate Degree | 0 (0.0%) | 0 (0.0%) |
| Total | 2 (100.0%) | 0 (0.0%) |
Employment Characteristics in Roslyn
Employment by Class of Employer in Roslyn
Among the 72 employed individuals in Roslyn, private company employees (46 | 63.9%), self-employed (not incorporated) (12 | 16.7%), and not-for-profit organizations (5 | 6.9%) make up the most common classes of employment.
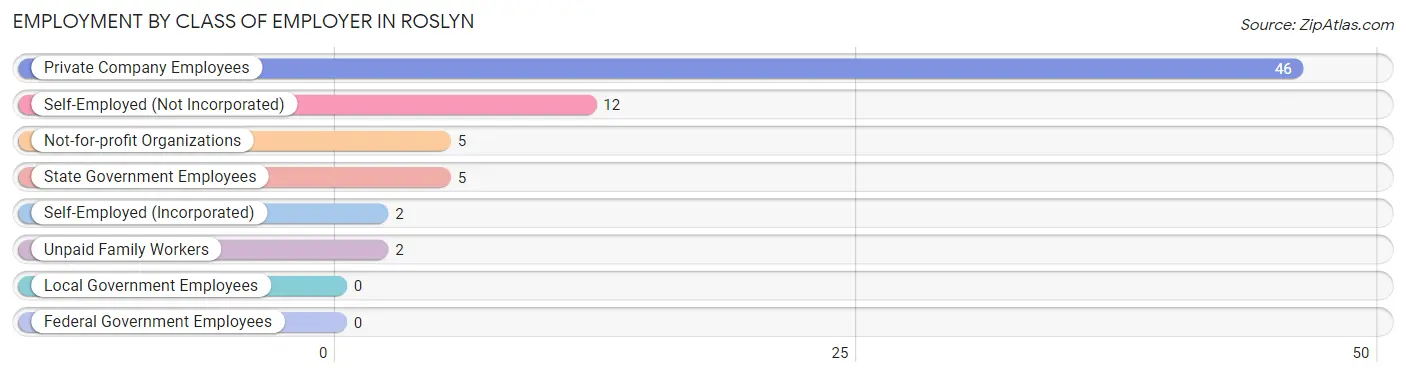
| Employer Class | # Employees | % Employees |
| Private Company Employees | 46 | 63.9% |
| Self-Employed (Incorporated) | 2 | 2.8% |
| Self-Employed (Not Incorporated) | 12 | 16.7% |
| Not-for-profit Organizations | 5 | 6.9% |
| Local Government Employees | 0 | 0.0% |
| State Government Employees | 5 | 6.9% |
| Federal Government Employees | 0 | 0.0% |
| Unpaid Family Workers | 2 | 2.8% |
| Total | 72 | 100.0% |
Employment Status by Age in Roslyn
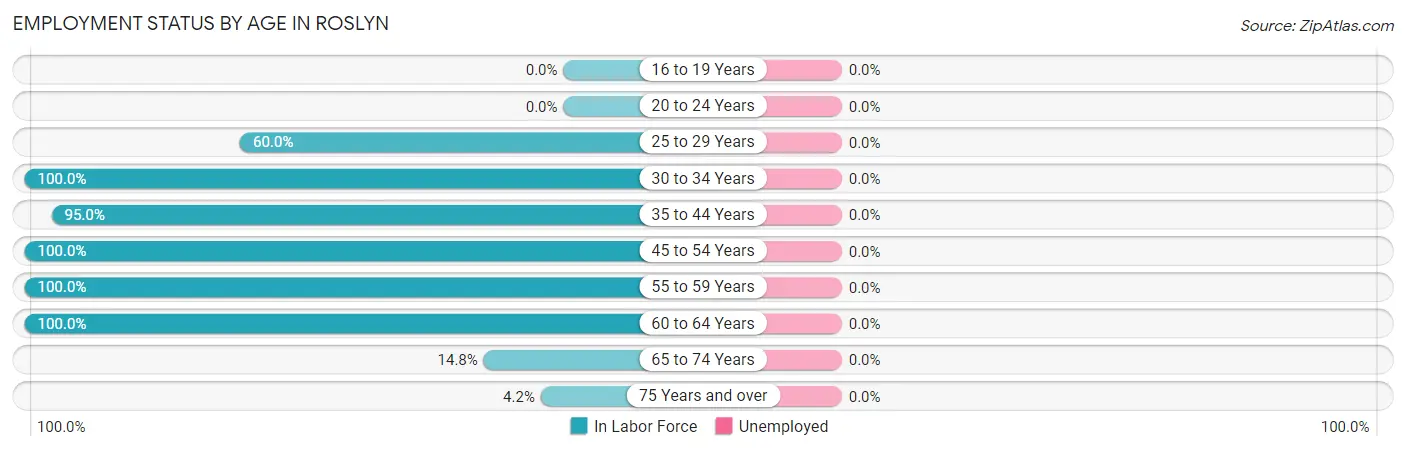
| Age Bracket | In Labor Force | Unemployed |
| 16 to 19 Years | 0 (0.0%) | 0 (0.0%) |
| 20 to 24 Years | 0 (0.0%) | 0 (0.0%) |
| 25 to 29 Years | 3 (60.0%) | 0 (0.0%) |
| 30 to 34 Years | 6 (100.0%) | 0 (0.0%) |
| 35 to 44 Years | 19 (95.0%) | 0 (0.0%) |
| 45 to 54 Years | 8 (100.0%) | 0 (0.0%) |
| 55 to 59 Years | 20 (100.0%) | 0 (0.0%) |
| 60 to 64 Years | 10 (100.0%) | 0 (0.0%) |
| 65 to 74 Years | 4 (14.8%) | 0 (0.0%) |
| 75 Years and over | 2 (4.2%) | 0 (0.0%) |
| Total | 72 (48.3%) | 0 (0.0%) |
Employment Status by Educational Attainment in Roslyn
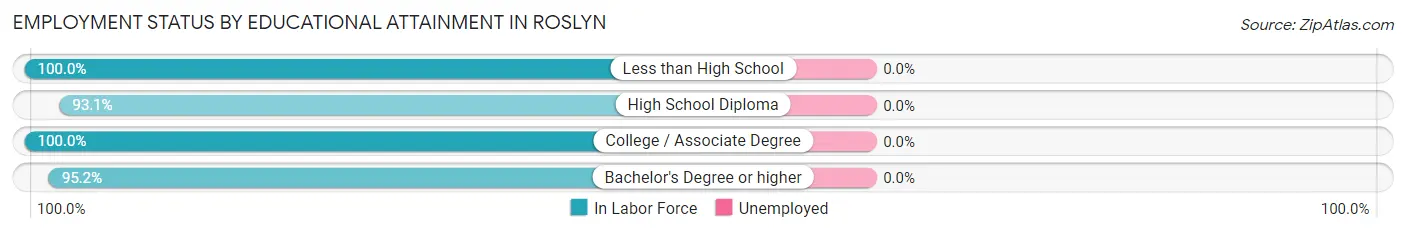
| Educational Attainment | In Labor Force | Unemployed |
| Less than High School | 3 (100.0%) | 0 (0.0%) |
| High School Diploma | 27 (93.1%) | 0 (0.0%) |
| College / Associate Degree | 16 (100.0%) | 0 (0.0%) |
| Bachelor's Degree or higher | 20 (95.2%) | 0 (0.0%) |
| Total | 66 (95.7%) | 0 (0.0%) |
Employment Occupations by Sex in Roslyn
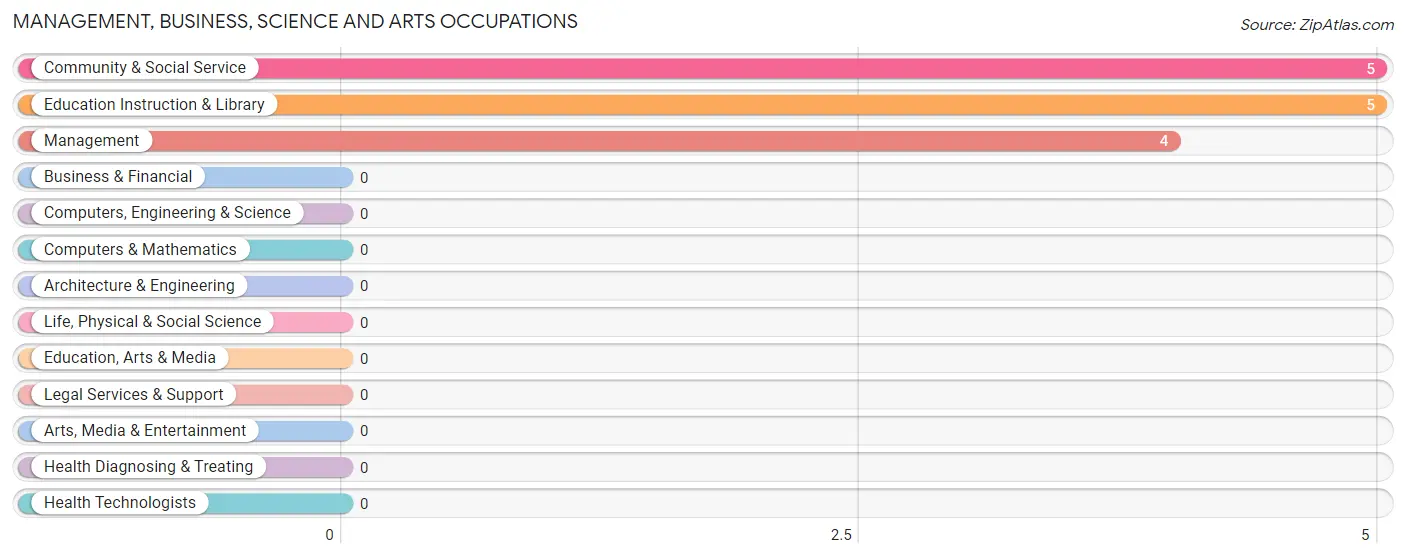
Management, Business, Science and Arts Occupations
The most common Management, Business, Science and Arts occupations in Roslyn are Community & Social Service (5 | 6.9%), Education Instruction & Library (5 | 6.9%), and Management (4 | 5.6%).
Management, Business, Science and Arts Occupations by Sex
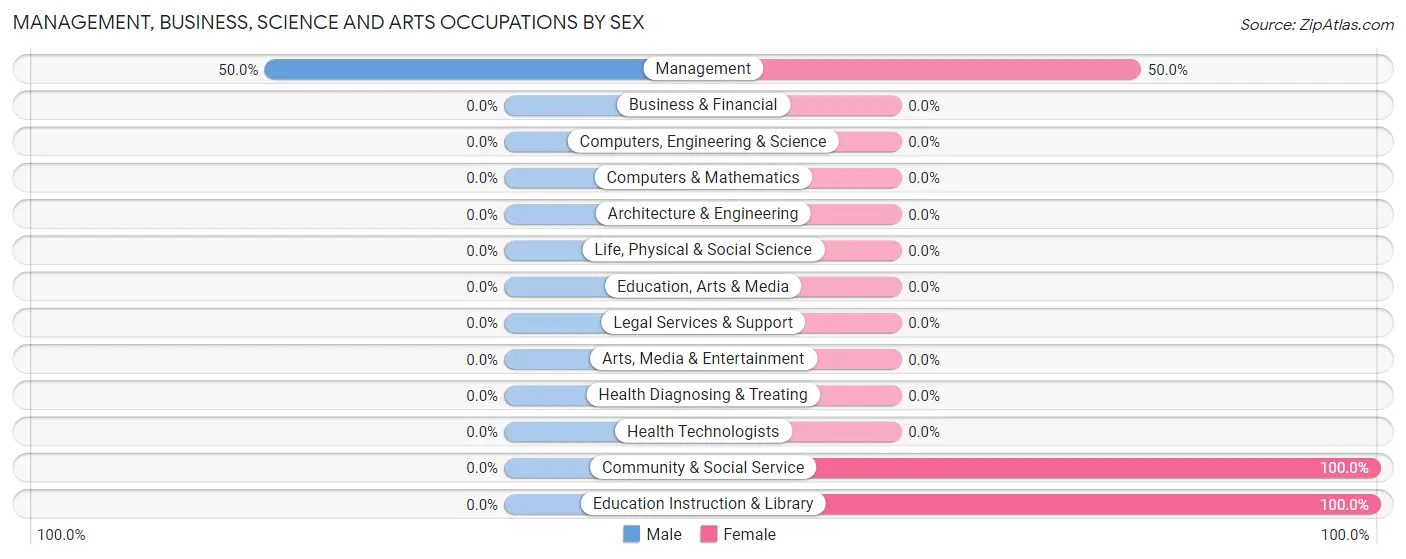
| Occupation | Male | Female |
| Management | 2 (50.0%) | 2 (50.0%) |
| Business & Financial | 0 (0.0%) | 0 (0.0%) |
| Computers, Engineering & Science | 0 (0.0%) | 0 (0.0%) |
| Computers & Mathematics | 0 (0.0%) | 0 (0.0%) |
| Architecture & Engineering | 0 (0.0%) | 0 (0.0%) |
| Life, Physical & Social Science | 0 (0.0%) | 0 (0.0%) |
| Community & Social Service | 0 (0.0%) | 5 (100.0%) |
| Education, Arts & Media | 0 (0.0%) | 0 (0.0%) |
| Legal Services & Support | 0 (0.0%) | 0 (0.0%) |
| Education Instruction & Library | 0 (0.0%) | 5 (100.0%) |
| Arts, Media & Entertainment | 0 (0.0%) | 0 (0.0%) |
| Health Diagnosing & Treating | 0 (0.0%) | 0 (0.0%) |
| Health Technologists | 0 (0.0%) | 0 (0.0%) |
| Total (Category) | 2 (22.2%) | 7 (77.8%) |
| Total (Overall) | 42 (58.3%) | 30 (41.7%) |
Services Occupations
The most common Services occupations in Roslyn are Healthcare Support (5 | 6.9%), and Personal Care & Service (2 | 2.8%).
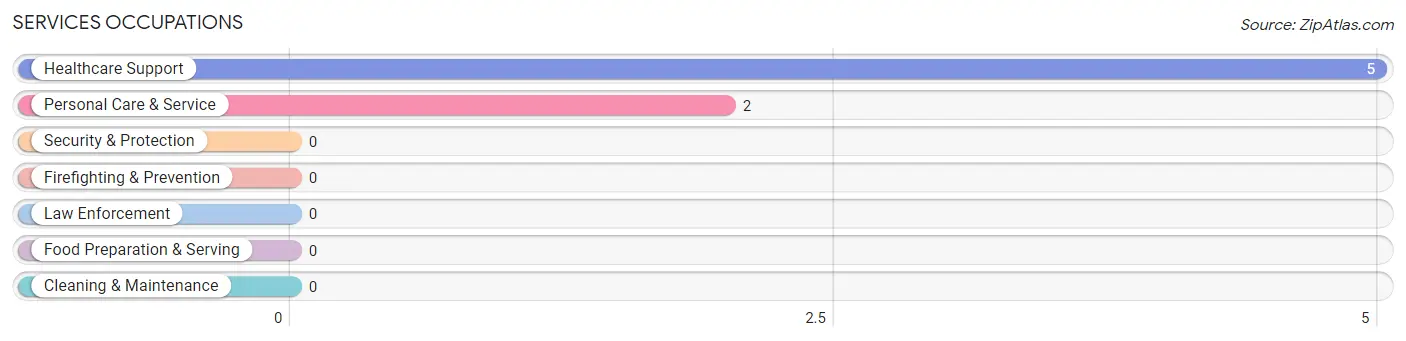
Services Occupations by Sex
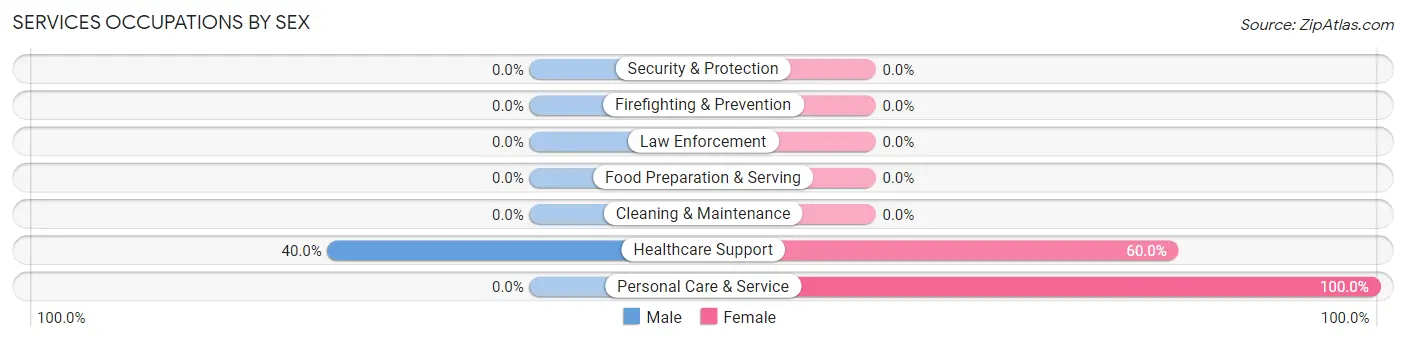
| Occupation | Male | Female |
| Healthcare Support | 2 (40.0%) | 3 (60.0%) |
| Security & Protection | 0 (0.0%) | 0 (0.0%) |
| Firefighting & Prevention | 0 (0.0%) | 0 (0.0%) |
| Law Enforcement | 0 (0.0%) | 0 (0.0%) |
| Food Preparation & Serving | 0 (0.0%) | 0 (0.0%) |
| Cleaning & Maintenance | 0 (0.0%) | 0 (0.0%) |
| Personal Care & Service | 0 (0.0%) | 2 (100.0%) |
| Total (Category) | 2 (28.6%) | 5 (71.4%) |
| Total (Overall) | 42 (58.3%) | 30 (41.7%) |
Sales and Office Occupations
The most common Sales and Office occupations in Roslyn are Sales & Related (8 | 11.1%), and Office & Administration (7 | 9.7%).
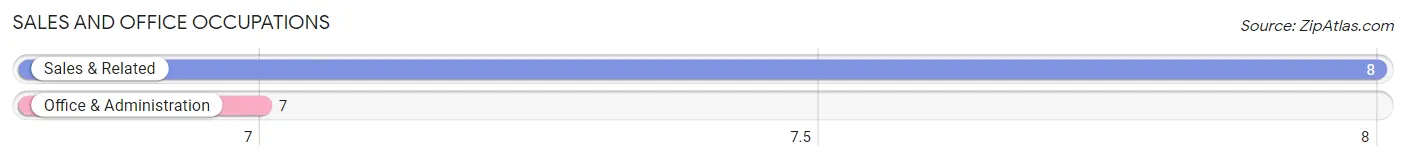
Sales and Office Occupations by Sex
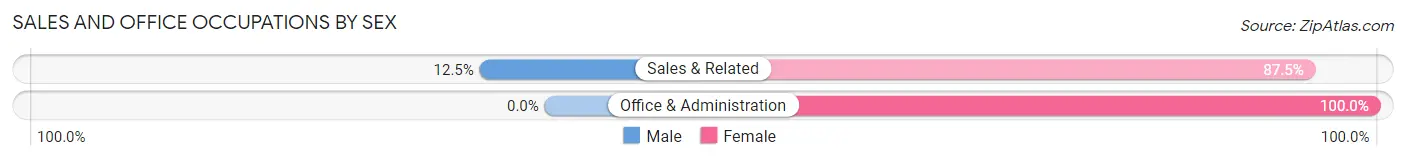
| Occupation | Male | Female |
| Sales & Related | 1 (12.5%) | 7 (87.5%) |
| Office & Administration | 0 (0.0%) | 7 (100.0%) |
| Total (Category) | 1 (6.7%) | 14 (93.3%) |
| Total (Overall) | 42 (58.3%) | 30 (41.7%) |
Natural Resources, Construction and Maintenance Occupations
The most common Natural Resources, Construction and Maintenance occupations in Roslyn are , and Installation, Maintenance & Repair (4 | 5.6%).
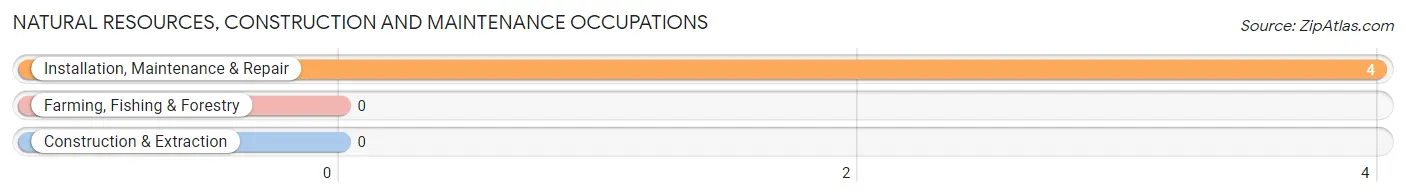
Natural Resources, Construction and Maintenance Occupations by Sex
| Occupation | Male | Female |
| Farming, Fishing & Forestry | 0 (0.0%) | 0 (0.0%) |
| Construction & Extraction | 0 (0.0%) | 0 (0.0%) |
| Installation, Maintenance & Repair | 4 (100.0%) | 0 (0.0%) |
| Total (Category) | 4 (100.0%) | 0 (0.0%) |
| Total (Overall) | 42 (58.3%) | 30 (41.7%) |
Production, Transportation and Moving Occupations
The most common Production, Transportation and Moving occupations in Roslyn are Production (22 | 30.6%), and Transportation (15 | 20.8%).
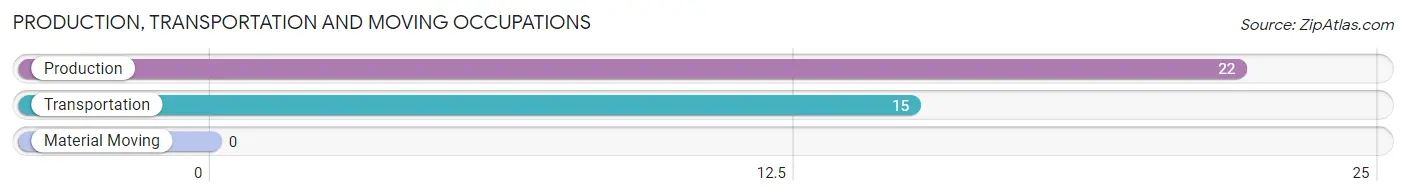
Production, Transportation and Moving Occupations by Sex
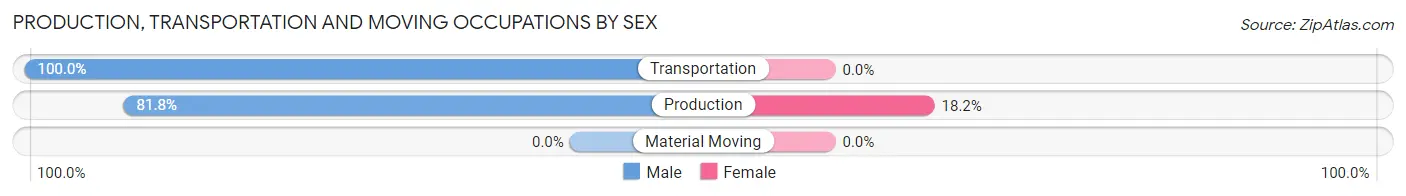
| Occupation | Male | Female |
| Production | 18 (81.8%) | 4 (18.2%) |
| Transportation | 15 (100.0%) | 0 (0.0%) |
| Material Moving | 0 (0.0%) | 0 (0.0%) |
| Total (Category) | 33 (89.2%) | 4 (10.8%) |
| Total (Overall) | 42 (58.3%) | 30 (41.7%) |
Employment Industries by Sex in Roslyn
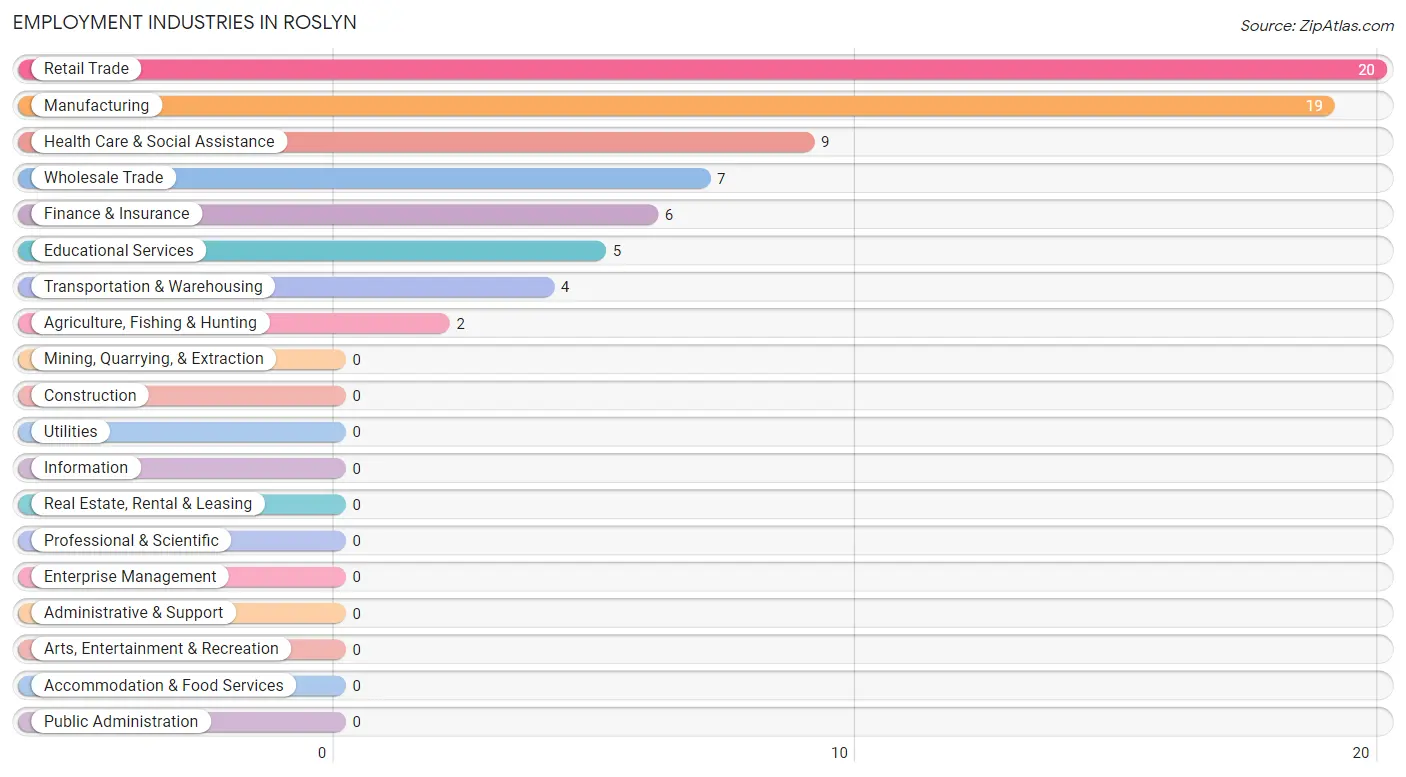
Employment Industries in Roslyn
The major employment industries in Roslyn include Retail Trade (20 | 27.8%), Manufacturing (19 | 26.4%), Health Care & Social Assistance (9 | 12.5%), Wholesale Trade (7 | 9.7%), and Finance & Insurance (6 | 8.3%).
Employment Industries by Sex in Roslyn
The Roslyn industries that see more men than women are Agriculture, Fishing & Hunting (100.0%), Transportation & Warehousing (100.0%), and Wholesale Trade (85.7%), whereas the industries that tend to have a higher number of women are Finance & Insurance (100.0%), Educational Services (100.0%), and Health Care & Social Assistance (77.8%).
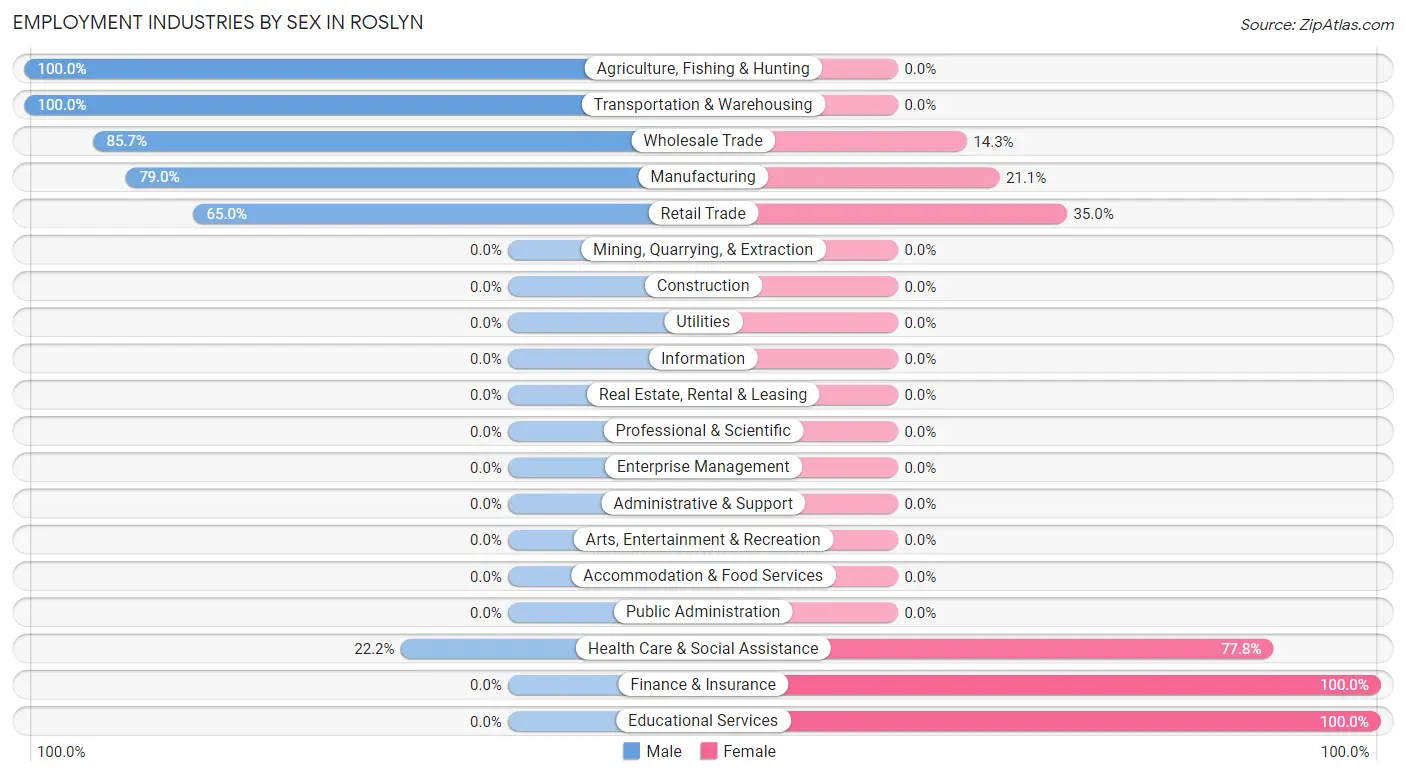
| Industry | Male | Female |
| Agriculture, Fishing & Hunting | 2 (100.0%) | 0 (0.0%) |
| Mining, Quarrying, & Extraction | 0 (0.0%) | 0 (0.0%) |
| Construction | 0 (0.0%) | 0 (0.0%) |
| Manufacturing | 15 (78.9%) | 4 (21.0%) |
| Wholesale Trade | 6 (85.7%) | 1 (14.3%) |
| Retail Trade | 13 (65.0%) | 7 (35.0%) |
| Transportation & Warehousing | 4 (100.0%) | 0 (0.0%) |
| Utilities | 0 (0.0%) | 0 (0.0%) |
| Information | 0 (0.0%) | 0 (0.0%) |
| Finance & Insurance | 0 (0.0%) | 6 (100.0%) |
| Real Estate, Rental & Leasing | 0 (0.0%) | 0 (0.0%) |
| Professional & Scientific | 0 (0.0%) | 0 (0.0%) |
| Enterprise Management | 0 (0.0%) | 0 (0.0%) |
| Administrative & Support | 0 (0.0%) | 0 (0.0%) |
| Educational Services | 0 (0.0%) | 5 (100.0%) |
| Health Care & Social Assistance | 2 (22.2%) | 7 (77.8%) |
| Arts, Entertainment & Recreation | 0 (0.0%) | 0 (0.0%) |
| Accommodation & Food Services | 0 (0.0%) | 0 (0.0%) |
| Public Administration | 0 (0.0%) | 0 (0.0%) |
| Total | 42 (58.3%) | 30 (41.7%) |
Education in Roslyn
School Enrollment in Roslyn
The most common levels of schooling among the 31 students in Roslyn are elementary school (12 | 38.7%), high school (10 | 32.3%), and middle school (4 | 12.9%).
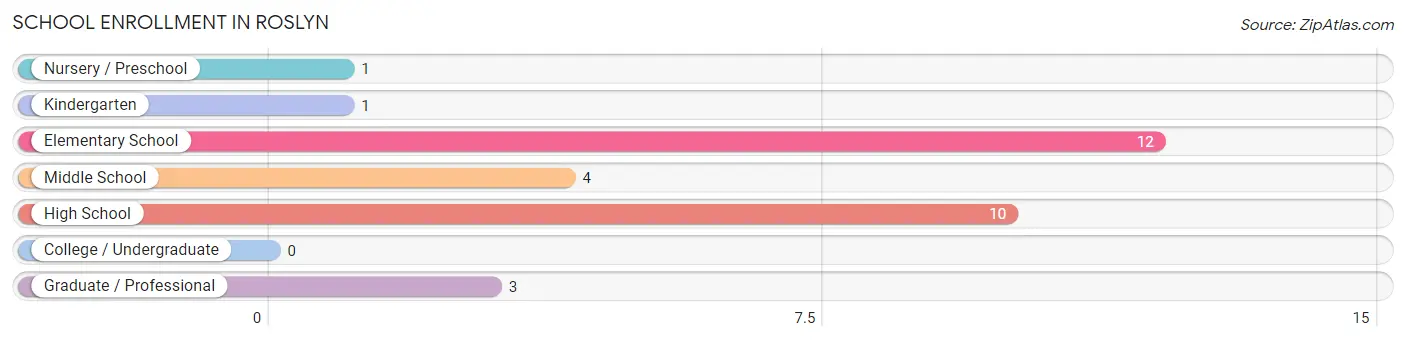
| School Level | # Students | % Students |
| Nursery / Preschool | 1 | 3.2% |
| Kindergarten | 1 | 3.2% |
| Elementary School | 12 | 38.7% |
| Middle School | 4 | 12.9% |
| High School | 10 | 32.3% |
| College / Undergraduate | 0 | 0.0% |
| Graduate / Professional | 3 | 9.7% |
| Total | 31 | 100.0% |
School Enrollment by Age by Funding Source in Roslyn
Out of a total of 31 students who are enrolled in schools in Roslyn, 5 (16.1%) attend a private institution, while the remaining 26 (83.9%) are enrolled in public schools. The age group of 18 to 19 year olds has the highest likelihood of being enrolled in private schools, with 5 (100.0% in the age bracket) enrolled. Conversely, the age group of 5 to 9 year old has the lowest likelihood of being enrolled in a private school, with 10 (100.0% in the age bracket) attending a public institution.
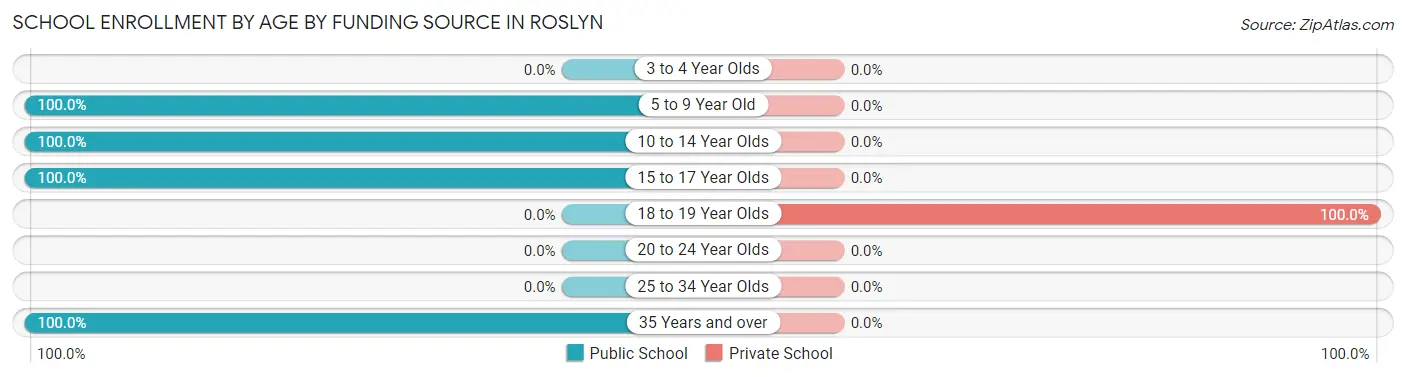
| Age Bracket | Public School | Private School |
| 3 to 4 Year Olds | 0 (0.0%) | 0 (0.0%) |
| 5 to 9 Year Old | 10 (100.0%) | 0 (0.0%) |
| 10 to 14 Year Olds | 8 (100.0%) | 0 (0.0%) |
| 15 to 17 Year Olds | 5 (100.0%) | 0 (0.0%) |
| 18 to 19 Year Olds | 0 (0.0%) | 5 (100.0%) |
| 20 to 24 Year Olds | 0 (0.0%) | 0 (0.0%) |
| 25 to 34 Year Olds | 0 (0.0%) | 0 (0.0%) |
| 35 Years and over | 3 (100.0%) | 0 (0.0%) |
| Total | 26 (83.9%) | 5 (16.1%) |
Educational Attainment by Field of Study in Roslyn
Education (8 | 28.6%), bio, nature & agricultural (7 | 25.0%), physical & health sciences (5 | 17.9%), science & technology (2 | 7.1%), and arts & humanities (2 | 7.1%) are the most common fields of study among 28 individuals in Roslyn who have obtained a bachelor's degree or higher.
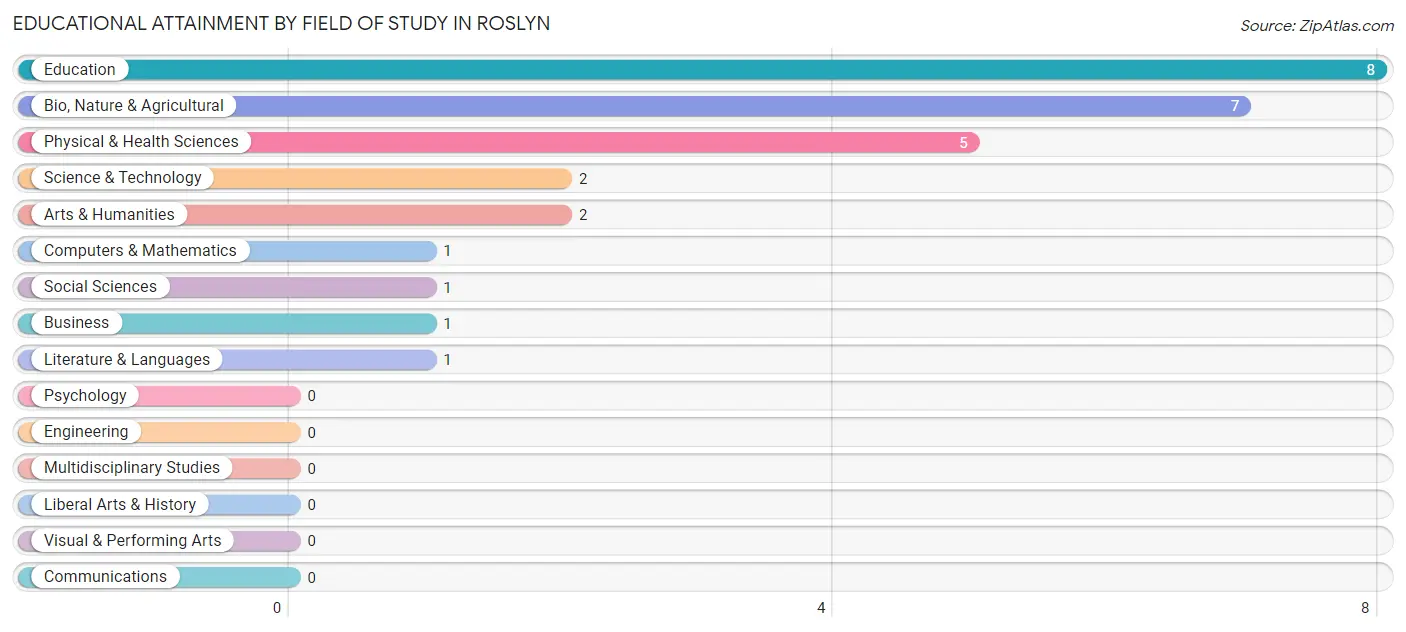
| Field of Study | # Graduates | % Graduates |
| Computers & Mathematics | 1 | 3.6% |
| Bio, Nature & Agricultural | 7 | 25.0% |
| Physical & Health Sciences | 5 | 17.9% |
| Psychology | 0 | 0.0% |
| Social Sciences | 1 | 3.6% |
| Engineering | 0 | 0.0% |
| Multidisciplinary Studies | 0 | 0.0% |
| Science & Technology | 2 | 7.1% |
| Business | 1 | 3.6% |
| Education | 8 | 28.6% |
| Literature & Languages | 1 | 3.6% |
| Liberal Arts & History | 0 | 0.0% |
| Visual & Performing Arts | 0 | 0.0% |
| Communications | 0 | 0.0% |
| Arts & Humanities | 2 | 7.1% |
| Total | 28 | 100.0% |
Transportation & Commute in Roslyn
Vehicle Availability by Sex in Roslyn
The most prevalent vehicle ownership categories in Roslyn are males with 2 vehicles (18, accounting for 42.9%) and females with 2 vehicles (8, making up 60.0%).
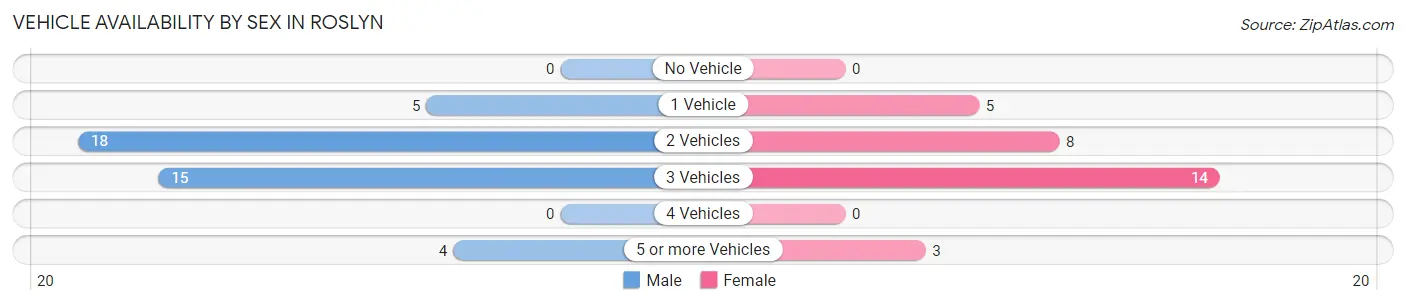
| Vehicles Available | Male | Female |
| No Vehicle | 0 (0.0%) | 0 (0.0%) |
| 1 Vehicle | 5 (11.9%) | 5 (16.7%) |
| 2 Vehicles | 18 (42.9%) | 8 (26.7%) |
| 3 Vehicles | 15 (35.7%) | 14 (46.7%) |
| 4 Vehicles | 0 (0.0%) | 0 (0.0%) |
| 5 or more Vehicles | 4 (9.5%) | 3 (10.0%) |
| Total | 42 (100.0%) | 30 (100.0%) |
Commute Time in Roslyn
The most frequently occuring commute durations in Roslyn are less than 5 minutes (16 commuters, 25.8%), 60 to 89 minutes (12 commuters, 19.4%), and 15 to 19 minutes (11 commuters, 17.7%).
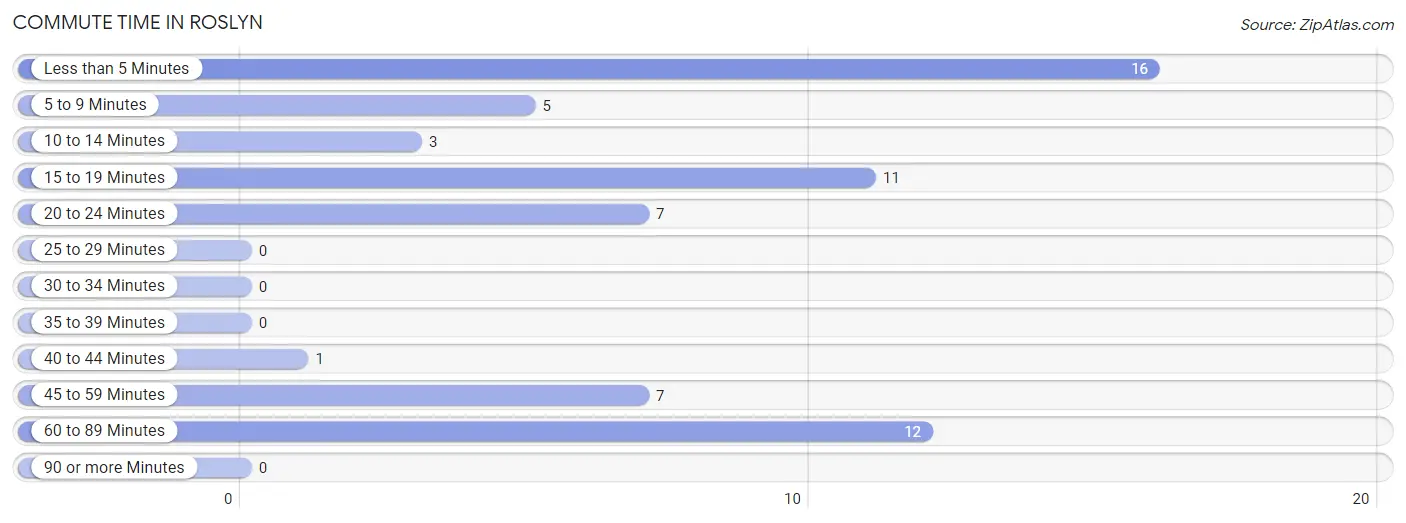
| Commute Time | # Commuters | % Commuters |
| Less than 5 Minutes | 16 | 25.8% |
| 5 to 9 Minutes | 5 | 8.1% |
| 10 to 14 Minutes | 3 | 4.8% |
| 15 to 19 Minutes | 11 | 17.7% |
| 20 to 24 Minutes | 7 | 11.3% |
| 25 to 29 Minutes | 0 | 0.0% |
| 30 to 34 Minutes | 0 | 0.0% |
| 35 to 39 Minutes | 0 | 0.0% |
| 40 to 44 Minutes | 1 | 1.6% |
| 45 to 59 Minutes | 7 | 11.3% |
| 60 to 89 Minutes | 12 | 19.4% |
| 90 or more Minutes | 0 | 0.0% |
Commute Time by Sex in Roslyn
The most common commute times in Roslyn are less than 5 minutes (10 commuters, 30.3%) for males and 20 to 24 minutes (7 commuters, 24.1%) for females.
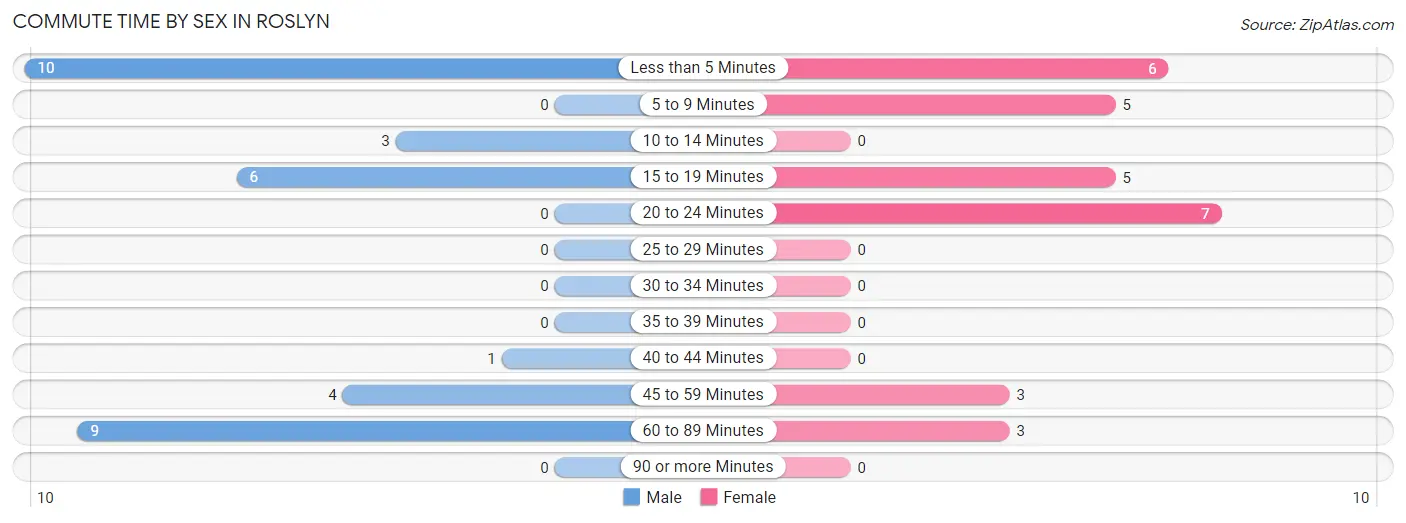
| Commute Time | Male | Female |
| Less than 5 Minutes | 10 (30.3%) | 6 (20.7%) |
| 5 to 9 Minutes | 0 (0.0%) | 5 (17.2%) |
| 10 to 14 Minutes | 3 (9.1%) | 0 (0.0%) |
| 15 to 19 Minutes | 6 (18.2%) | 5 (17.2%) |
| 20 to 24 Minutes | 0 (0.0%) | 7 (24.1%) |
| 25 to 29 Minutes | 0 (0.0%) | 0 (0.0%) |
| 30 to 34 Minutes | 0 (0.0%) | 0 (0.0%) |
| 35 to 39 Minutes | 0 (0.0%) | 0 (0.0%) |
| 40 to 44 Minutes | 1 (3.0%) | 0 (0.0%) |
| 45 to 59 Minutes | 4 (12.1%) | 3 (10.3%) |
| 60 to 89 Minutes | 9 (27.3%) | 3 (10.3%) |
| 90 or more Minutes | 0 (0.0%) | 0 (0.0%) |
Time of Departure to Work by Sex in Roslyn
The most frequent times of departure to work in Roslyn are 12:00 AM to 4:59 AM (10, 30.3%) for males and 8:00 AM to 8:29 AM (9, 31.0%) for females.
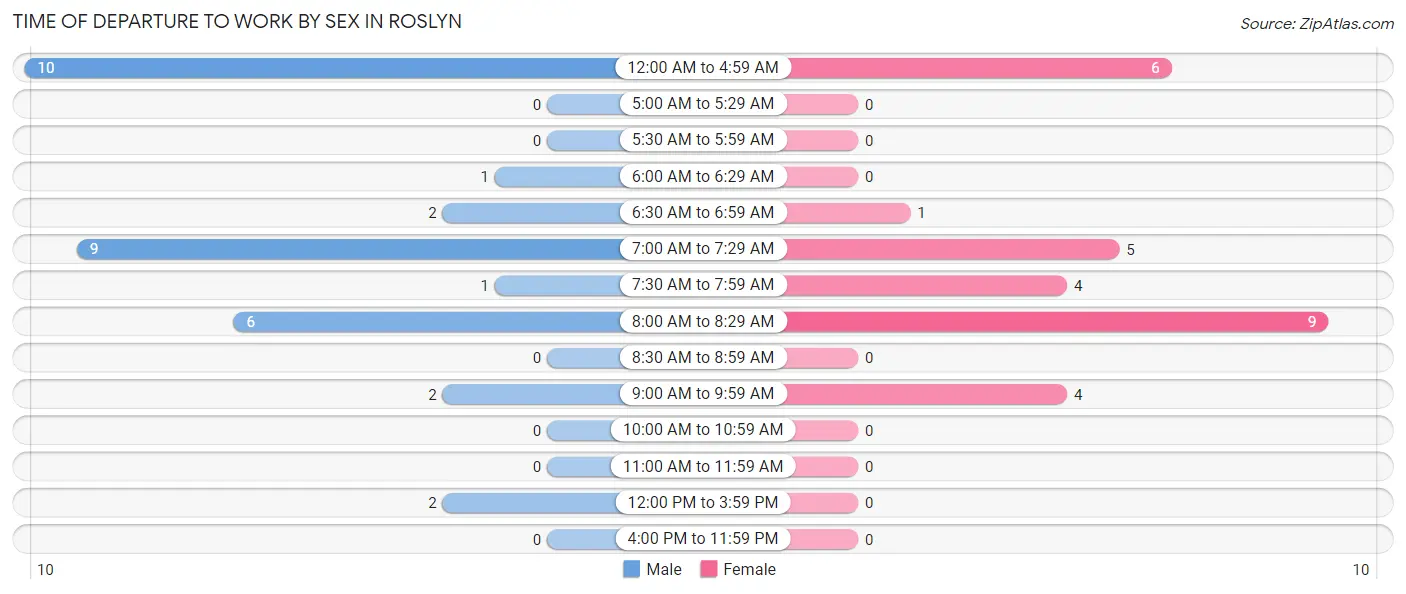
| Time of Departure | Male | Female |
| 12:00 AM to 4:59 AM | 10 (30.3%) | 6 (20.7%) |
| 5:00 AM to 5:29 AM | 0 (0.0%) | 0 (0.0%) |
| 5:30 AM to 5:59 AM | 0 (0.0%) | 0 (0.0%) |
| 6:00 AM to 6:29 AM | 1 (3.0%) | 0 (0.0%) |
| 6:30 AM to 6:59 AM | 2 (6.1%) | 1 (3.5%) |
| 7:00 AM to 7:29 AM | 9 (27.3%) | 5 (17.2%) |
| 7:30 AM to 7:59 AM | 1 (3.0%) | 4 (13.8%) |
| 8:00 AM to 8:29 AM | 6 (18.2%) | 9 (31.0%) |
| 8:30 AM to 8:59 AM | 0 (0.0%) | 0 (0.0%) |
| 9:00 AM to 9:59 AM | 2 (6.1%) | 4 (13.8%) |
| 10:00 AM to 10:59 AM | 0 (0.0%) | 0 (0.0%) |
| 11:00 AM to 11:59 AM | 0 (0.0%) | 0 (0.0%) |
| 12:00 PM to 3:59 PM | 2 (6.1%) | 0 (0.0%) |
| 4:00 PM to 11:59 PM | 0 (0.0%) | 0 (0.0%) |
| Total | 33 (100.0%) | 29 (100.0%) |
Housing Occupancy in Roslyn
Occupancy by Ownership in Roslyn
Of the total 69 dwellings in Roslyn, owner-occupied units account for 57 (82.6%), while renter-occupied units make up 12 (17.4%).
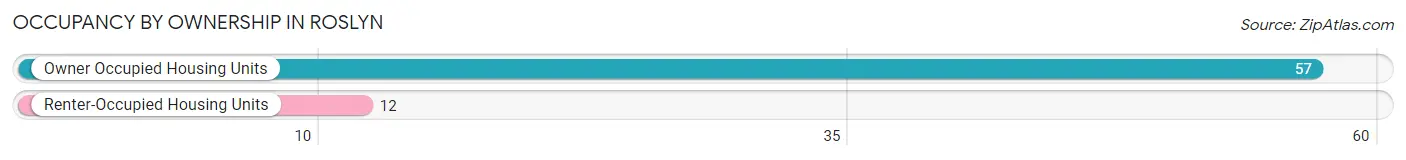
| Occupancy | # Housing Units | % Housing Units |
| Owner Occupied Housing Units | 57 | 82.6% |
| Renter-Occupied Housing Units | 12 | 17.4% |
| Total Occupied Housing Units | 69 | 100.0% |
Occupancy by Household Size in Roslyn
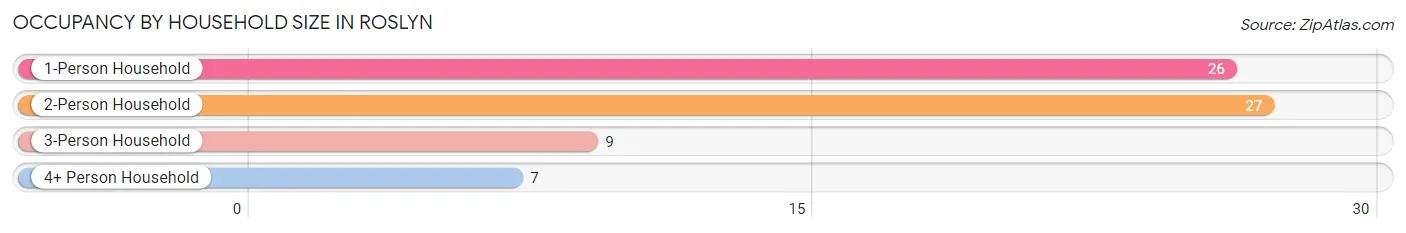
| Household Size | # Housing Units | % Housing Units |
| 1-Person Household | 26 | 37.7% |
| 2-Person Household | 27 | 39.1% |
| 3-Person Household | 9 | 13.0% |
| 4+ Person Household | 7 | 10.1% |
| Total Housing Units | 69 | 100.0% |
Occupancy by Ownership by Household Size in Roslyn
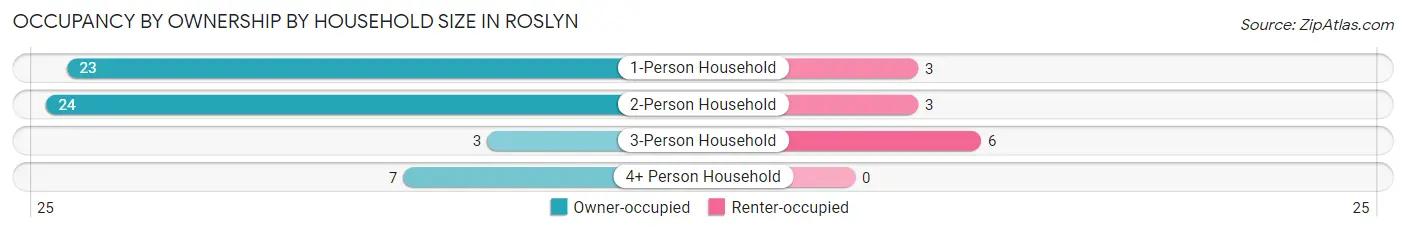
| Household Size | Owner-occupied | Renter-occupied |
| 1-Person Household | 23 (88.5%) | 3 (11.5%) |
| 2-Person Household | 24 (88.9%) | 3 (11.1%) |
| 3-Person Household | 3 (33.3%) | 6 (66.7%) |
| 4+ Person Household | 7 (100.0%) | 0 (0.0%) |
| Total Housing Units | 57 (82.6%) | 12 (17.4%) |
Occupancy by Educational Attainment in Roslyn
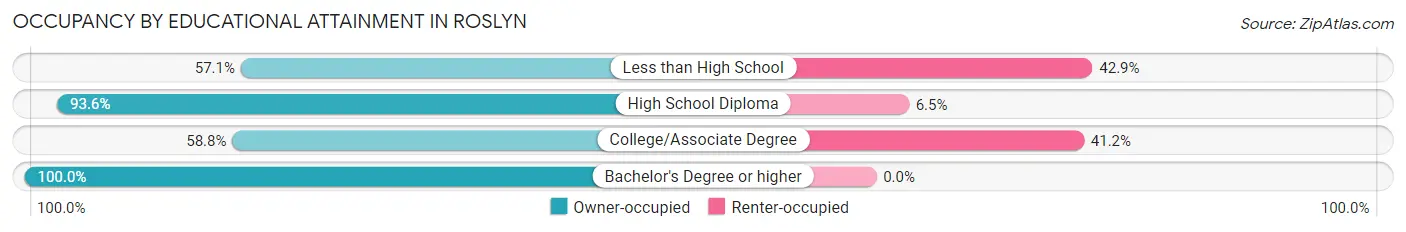
| Household Size | Owner-occupied | Renter-occupied |
| Less than High School | 4 (57.1%) | 3 (42.9%) |
| High School Diploma | 29 (93.5%) | 2 (6.5%) |
| College/Associate Degree | 10 (58.8%) | 7 (41.2%) |
| Bachelor's Degree or higher | 14 (100.0%) | 0 (0.0%) |
Occupancy by Age of Householder in Roslyn
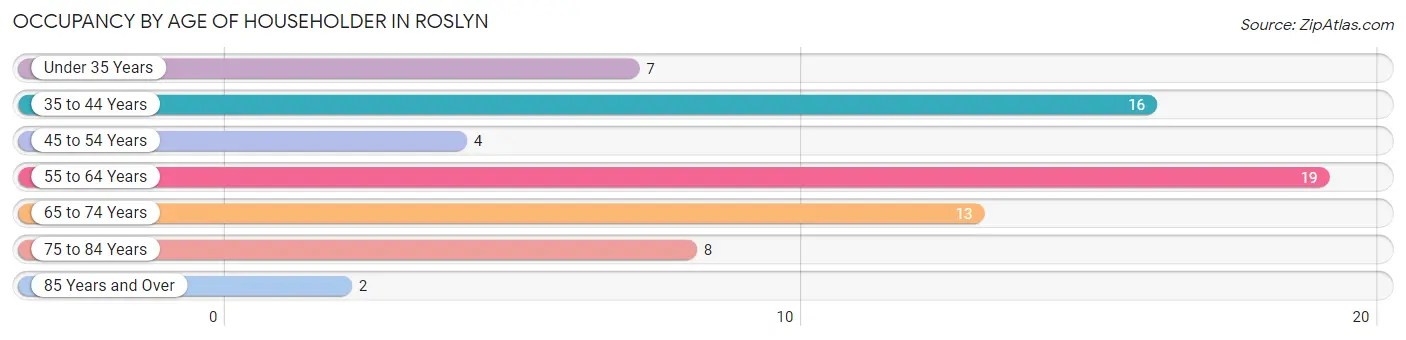
| Age Bracket | # Households | % Households |
| Under 35 Years | 7 | 10.1% |
| 35 to 44 Years | 16 | 23.2% |
| 45 to 54 Years | 4 | 5.8% |
| 55 to 64 Years | 19 | 27.5% |
| 65 to 74 Years | 13 | 18.8% |
| 75 to 84 Years | 8 | 11.6% |
| 85 Years and Over | 2 | 2.9% |
| Total | 69 | 100.0% |
Housing Finances in Roslyn
Median Income by Occupancy in Roslyn
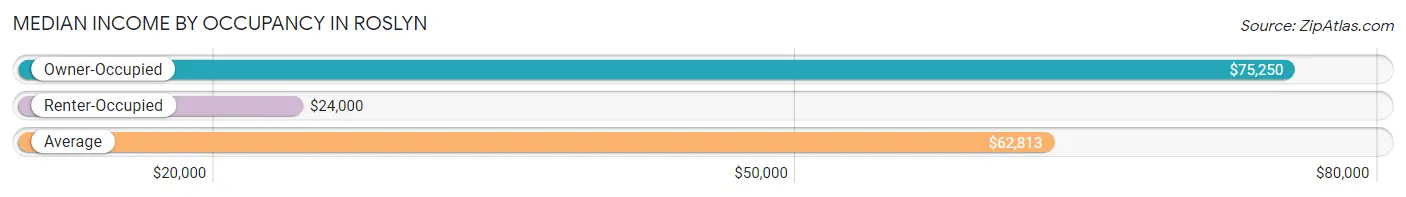
| Occupancy Type | # Households | Median Income |
| Owner-Occupied | 57 (82.6%) | $75,250 |
| Renter-Occupied | 12 (17.4%) | $24,000 |
| Average | 69 (100.0%) | $62,813 |
Occupancy by Householder Income Bracket in Roslyn
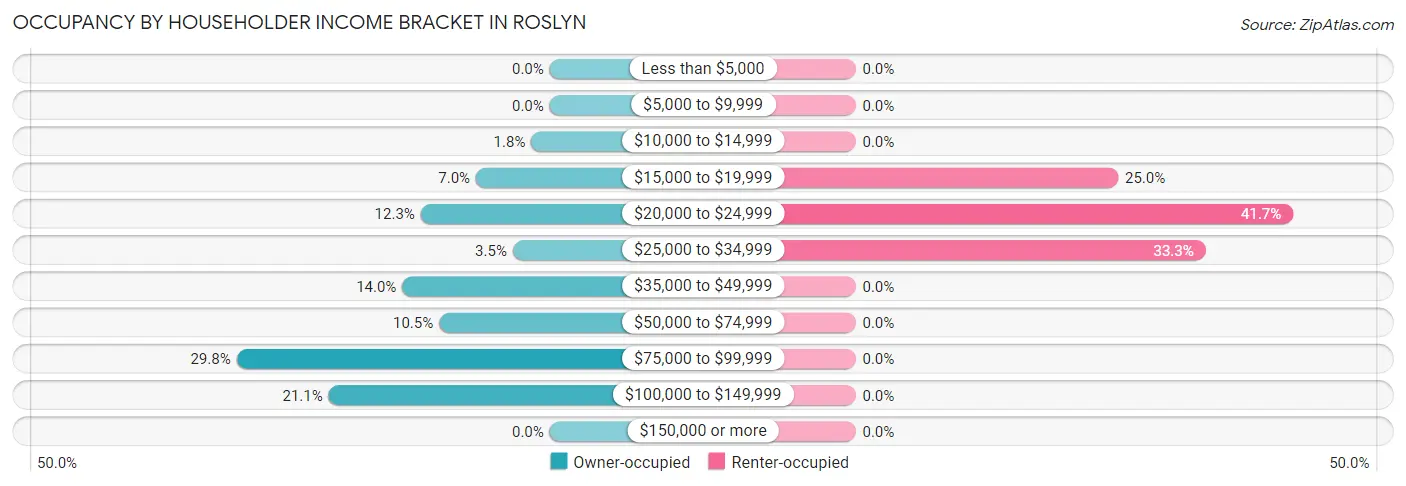
| Income Bracket | Owner-occupied | Renter-occupied |
| Less than $5,000 | 0 (0.0%) | 0 (0.0%) |
| $5,000 to $9,999 | 0 (0.0%) | 0 (0.0%) |
| $10,000 to $14,999 | 1 (1.8%) | 0 (0.0%) |
| $15,000 to $19,999 | 4 (7.0%) | 3 (25.0%) |
| $20,000 to $24,999 | 7 (12.3%) | 5 (41.7%) |
| $25,000 to $34,999 | 2 (3.5%) | 4 (33.3%) |
| $35,000 to $49,999 | 8 (14.0%) | 0 (0.0%) |
| $50,000 to $74,999 | 6 (10.5%) | 0 (0.0%) |
| $75,000 to $99,999 | 17 (29.8%) | 0 (0.0%) |
| $100,000 to $149,999 | 12 (21.0%) | 0 (0.0%) |
| $150,000 or more | 0 (0.0%) | 0 (0.0%) |
| Total | 57 (100.0%) | 12 (100.0%) |
Monthly Housing Cost Tiers in Roslyn
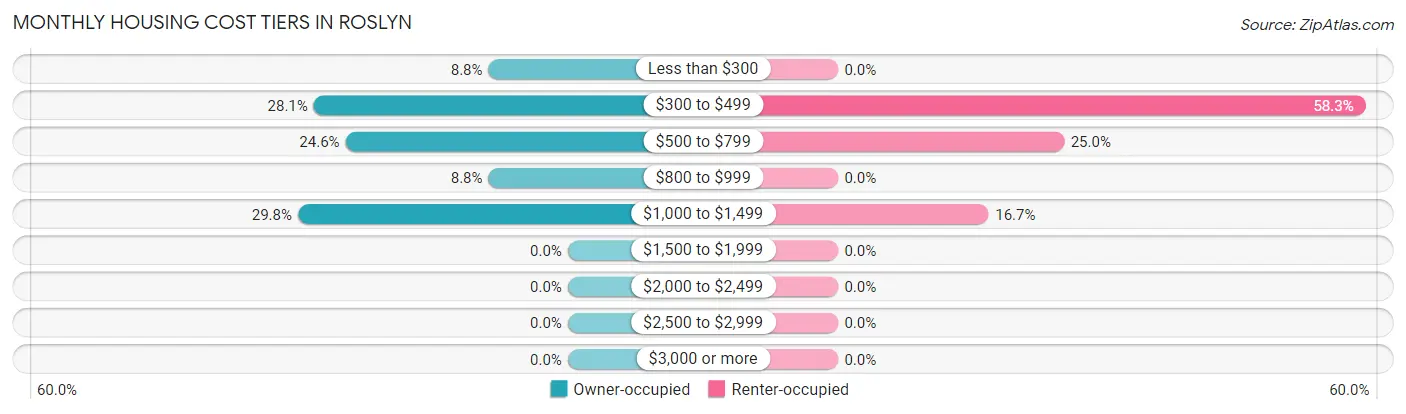
| Monthly Cost | Owner-occupied | Renter-occupied |
| Less than $300 | 5 (8.8%) | 0 (0.0%) |
| $300 to $499 | 16 (28.1%) | 7 (58.3%) |
| $500 to $799 | 14 (24.6%) | 3 (25.0%) |
| $800 to $999 | 5 (8.8%) | 0 (0.0%) |
| $1,000 to $1,499 | 17 (29.8%) | 2 (16.7%) |
| $1,500 to $1,999 | 0 (0.0%) | 0 (0.0%) |
| $2,000 to $2,499 | 0 (0.0%) | 0 (0.0%) |
| $2,500 to $2,999 | 0 (0.0%) | 0 (0.0%) |
| $3,000 or more | 0 (0.0%) | 0 (0.0%) |
| Total | 57 (100.0%) | 12 (100.0%) |
Physical Housing Characteristics in Roslyn
Housing Structures in Roslyn
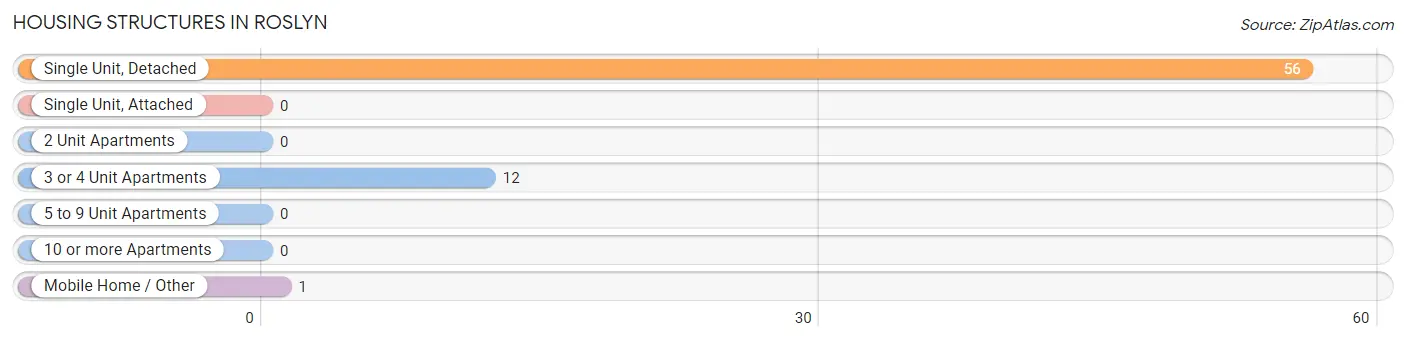
| Structure Type | # Housing Units | % Housing Units |
| Single Unit, Detached | 56 | 81.2% |
| Single Unit, Attached | 0 | 0.0% |
| 2 Unit Apartments | 0 | 0.0% |
| 3 or 4 Unit Apartments | 12 | 17.4% |
| 5 to 9 Unit Apartments | 0 | 0.0% |
| 10 or more Apartments | 0 | 0.0% |
| Mobile Home / Other | 1 | 1.5% |
| Total | 69 | 100.0% |
Housing Structures by Occupancy in Roslyn
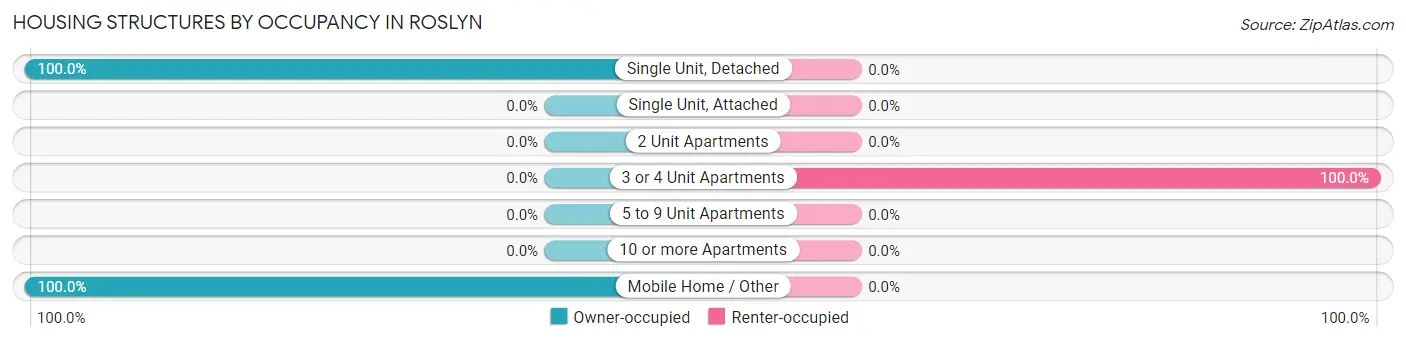
| Structure Type | Owner-occupied | Renter-occupied |
| Single Unit, Detached | 56 (100.0%) | 0 (0.0%) |
| Single Unit, Attached | 0 (0.0%) | 0 (0.0%) |
| 2 Unit Apartments | 0 (0.0%) | 0 (0.0%) |
| 3 or 4 Unit Apartments | 0 (0.0%) | 12 (100.0%) |
| 5 to 9 Unit Apartments | 0 (0.0%) | 0 (0.0%) |
| 10 or more Apartments | 0 (0.0%) | 0 (0.0%) |
| Mobile Home / Other | 1 (100.0%) | 0 (0.0%) |
| Total | 57 (82.6%) | 12 (17.4%) |
Housing Structures by Number of Rooms in Roslyn
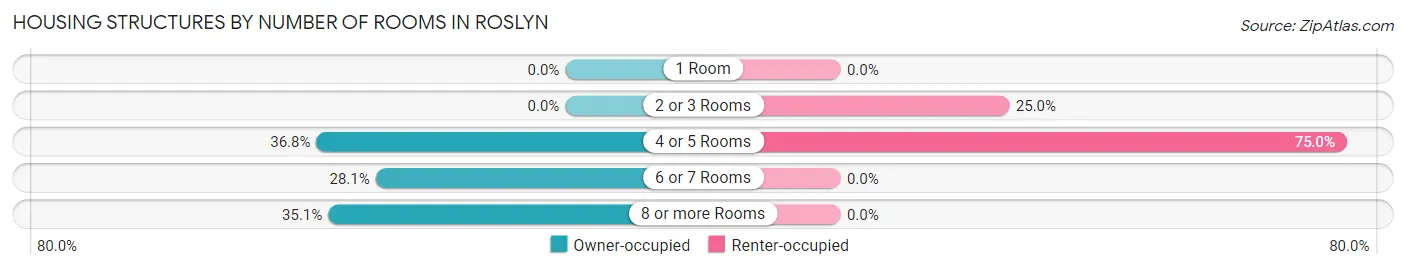
| Number of Rooms | Owner-occupied | Renter-occupied |
| 1 Room | 0 (0.0%) | 0 (0.0%) |
| 2 or 3 Rooms | 0 (0.0%) | 3 (25.0%) |
| 4 or 5 Rooms | 21 (36.8%) | 9 (75.0%) |
| 6 or 7 Rooms | 16 (28.1%) | 0 (0.0%) |
| 8 or more Rooms | 20 (35.1%) | 0 (0.0%) |
| Total | 57 (100.0%) | 12 (100.0%) |
Housing Structure by Heating Type in Roslyn
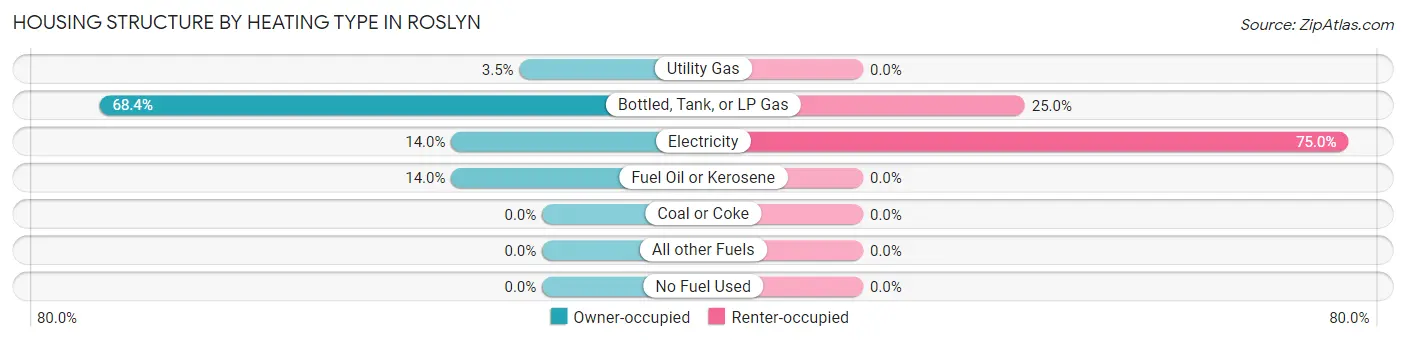
| Heating Type | Owner-occupied | Renter-occupied |
| Utility Gas | 2 (3.5%) | 0 (0.0%) |
| Bottled, Tank, or LP Gas | 39 (68.4%) | 3 (25.0%) |
| Electricity | 8 (14.0%) | 9 (75.0%) |
| Fuel Oil or Kerosene | 8 (14.0%) | 0 (0.0%) |
| Coal or Coke | 0 (0.0%) | 0 (0.0%) |
| All other Fuels | 0 (0.0%) | 0 (0.0%) |
| No Fuel Used | 0 (0.0%) | 0 (0.0%) |
| Total | 57 (100.0%) | 12 (100.0%) |
Household Vehicle Usage in Roslyn
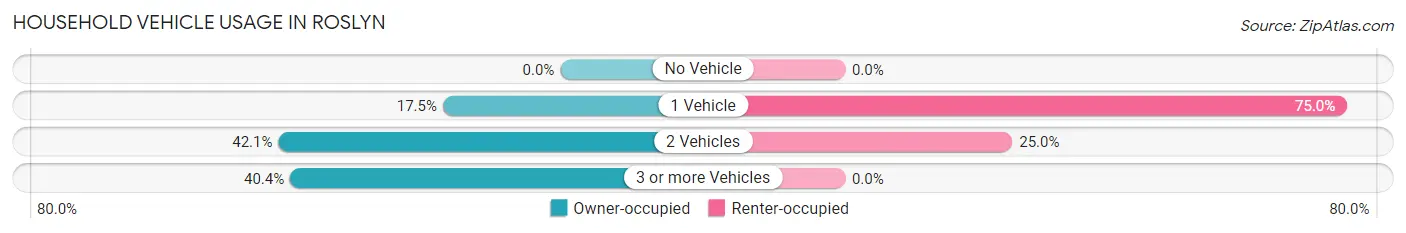
| Vehicles per Household | Owner-occupied | Renter-occupied |
| No Vehicle | 0 (0.0%) | 0 (0.0%) |
| 1 Vehicle | 10 (17.5%) | 9 (75.0%) |
| 2 Vehicles | 24 (42.1%) | 3 (25.0%) |
| 3 or more Vehicles | 23 (40.4%) | 0 (0.0%) |
| Total | 57 (100.0%) | 12 (100.0%) |
Real Estate & Mortgages in Roslyn
Real Estate and Mortgage Overview in Roslyn
| Characteristic | Without Mortgage | With Mortgage |
| Housing Units | 30 | 27 |
| Median Property Value | $55,700 | $95,000 |
| Median Household Income | - | - |
| Monthly Housing Costs | $471 | $0 |
| Real Estate Taxes | $900 | $0 |
Property Value by Mortgage Status in Roslyn
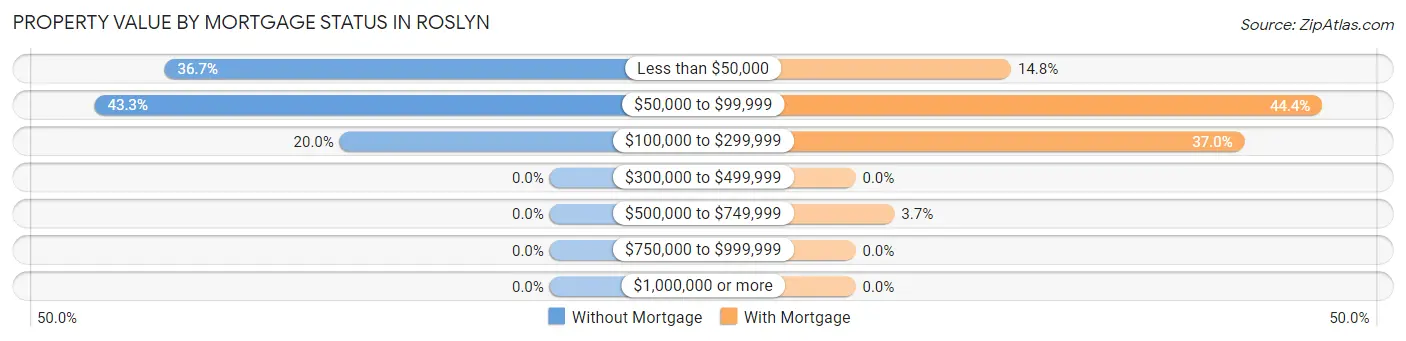
| Property Value | Without Mortgage | With Mortgage |
| Less than $50,000 | 11 (36.7%) | 4 (14.8%) |
| $50,000 to $99,999 | 13 (43.3%) | 12 (44.4%) |
| $100,000 to $299,999 | 6 (20.0%) | 10 (37.0%) |
| $300,000 to $499,999 | 0 (0.0%) | 0 (0.0%) |
| $500,000 to $749,999 | 0 (0.0%) | 1 (3.7%) |
| $750,000 to $999,999 | 0 (0.0%) | 0 (0.0%) |
| $1,000,000 or more | 0 (0.0%) | 0 (0.0%) |
| Total | 30 (100.0%) | 27 (100.0%) |
Household Income by Mortgage Status in Roslyn
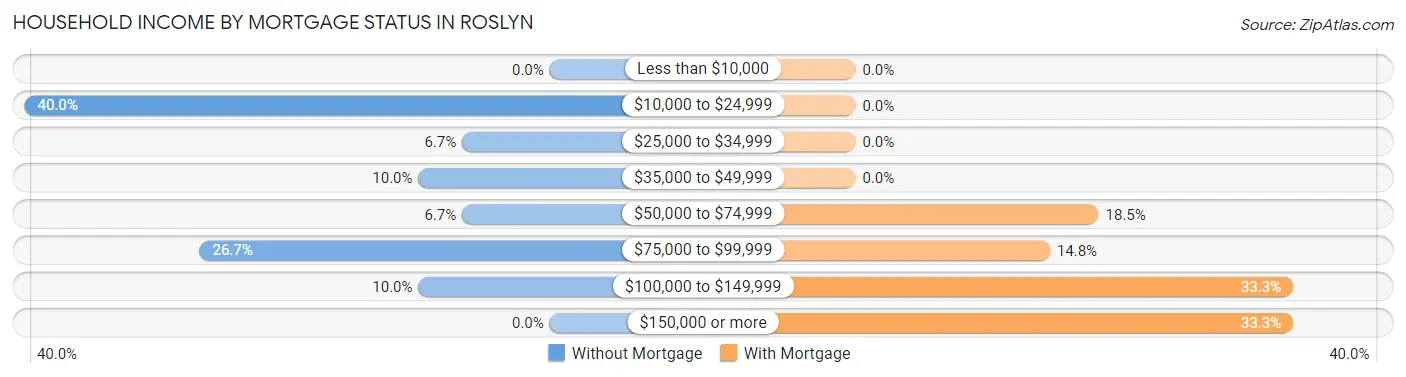
| Household Income | Without Mortgage | With Mortgage |
| Less than $10,000 | 0 (0.0%) | 0 (0.0%) |
| $10,000 to $24,999 | 12 (40.0%) | 0 (0.0%) |
| $25,000 to $34,999 | 2 (6.7%) | 0 (0.0%) |
| $35,000 to $49,999 | 3 (10.0%) | 0 (0.0%) |
| $50,000 to $74,999 | 2 (6.7%) | 5 (18.5%) |
| $75,000 to $99,999 | 8 (26.7%) | 4 (14.8%) |
| $100,000 to $149,999 | 3 (10.0%) | 9 (33.3%) |
| $150,000 or more | 0 (0.0%) | 9 (33.3%) |
| Total | 30 (100.0%) | 27 (100.0%) |
Property Value to Household Income Ratio in Roslyn
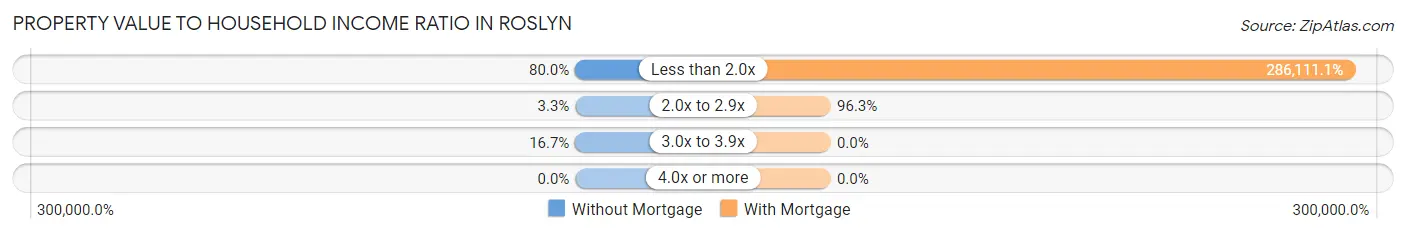
| Value-to-Income Ratio | Without Mortgage | With Mortgage |
| Less than 2.0x | 24 (80.0%) | 77,250 (286,111.1%) |
| 2.0x to 2.9x | 1 (3.3%) | 26 (96.3%) |
| 3.0x to 3.9x | 5 (16.7%) | 0 (0.0%) |
| 4.0x or more | 0 (0.0%) | 0 (0.0%) |
| Total | 30 (100.0%) | 27 (100.0%) |
Real Estate Taxes by Mortgage Status in Roslyn
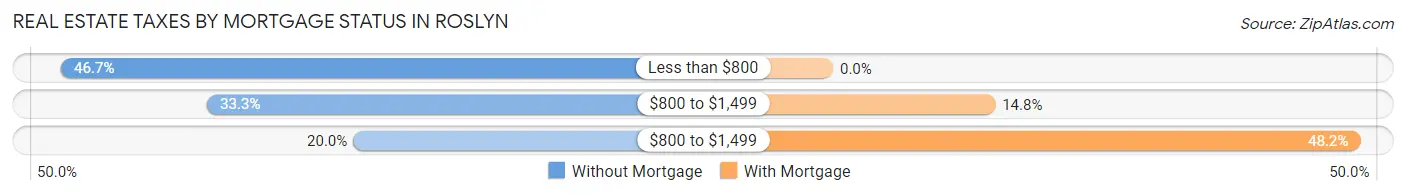
| Property Taxes | Without Mortgage | With Mortgage |
| Less than $800 | 14 (46.7%) | 0 (0.0%) |
| $800 to $1,499 | 10 (33.3%) | 4 (14.8%) |
| $800 to $1,499 | 6 (20.0%) | 13 (48.1%) |
| Total | 30 (100.0%) | 27 (100.0%) |
Health & Disability in Roslyn
Health Insurance Coverage by Age in Roslyn
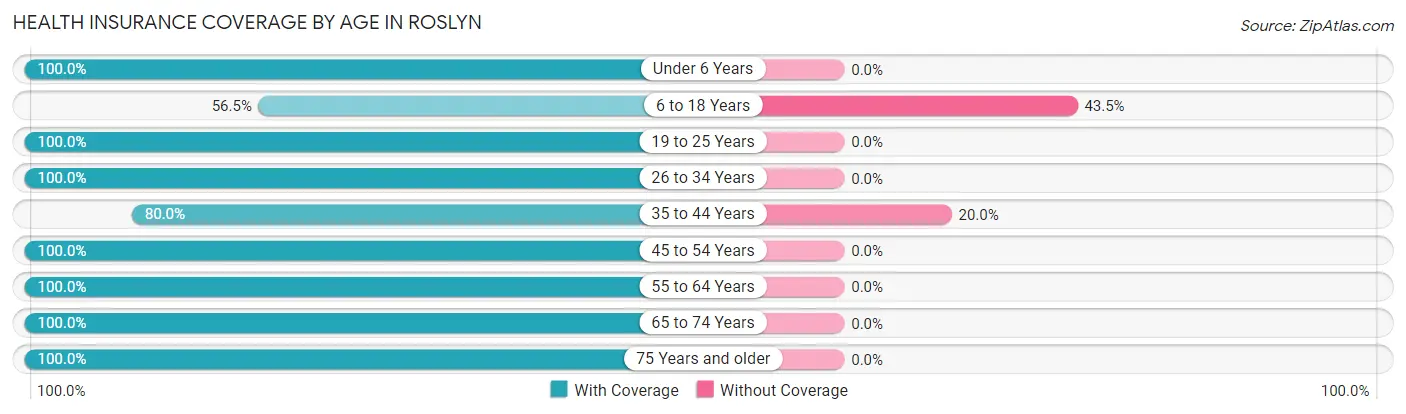
| Age Bracket | With Coverage | Without Coverage |
| Under 6 Years | 11 (100.0%) | 0 (0.0%) |
| 6 to 18 Years | 13 (56.5%) | 10 (43.5%) |
| 19 to 25 Years | 5 (100.0%) | 0 (0.0%) |
| 26 to 34 Years | 11 (100.0%) | 0 (0.0%) |
| 35 to 44 Years | 16 (80.0%) | 4 (20.0%) |
| 45 to 54 Years | 8 (100.0%) | 0 (0.0%) |
| 55 to 64 Years | 30 (100.0%) | 0 (0.0%) |
| 65 to 74 Years | 19 (100.0%) | 0 (0.0%) |
| 75 Years and older | 17 (100.0%) | 0 (0.0%) |
| Total | 130 (90.3%) | 14 (9.7%) |
Health Insurance Coverage by Citizenship Status in Roslyn
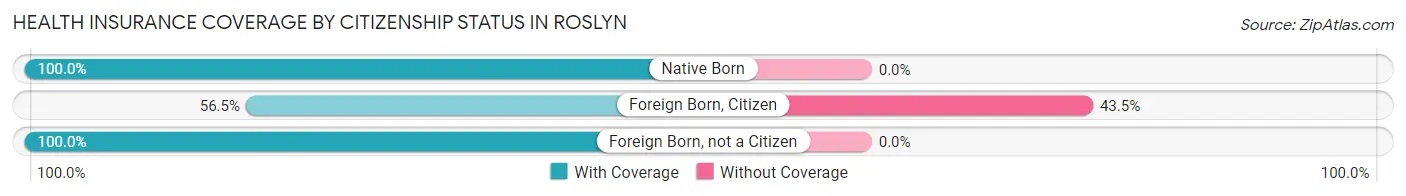
| Citizenship Status | With Coverage | Without Coverage |
| Native Born | 11 (100.0%) | 0 (0.0%) |
| Foreign Born, Citizen | 13 (56.5%) | 10 (43.5%) |
| Foreign Born, not a Citizen | 5 (100.0%) | 0 (0.0%) |
Health Insurance Coverage by Household Income in Roslyn
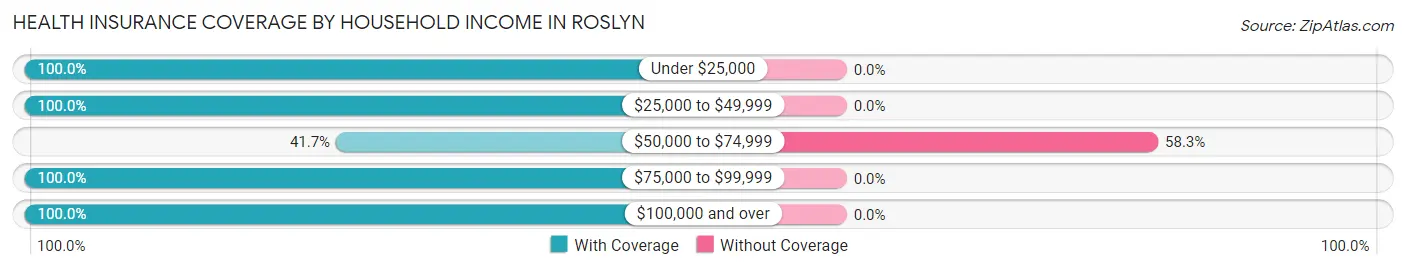
| Household Income | With Coverage | Without Coverage |
| Under $25,000 | 33 (100.0%) | 0 (0.0%) |
| $25,000 to $49,999 | 26 (100.0%) | 0 (0.0%) |
| $50,000 to $74,999 | 10 (41.7%) | 14 (58.3%) |
| $75,000 to $99,999 | 32 (100.0%) | 0 (0.0%) |
| $100,000 and over | 29 (100.0%) | 0 (0.0%) |
Public vs Private Health Insurance Coverage by Age in Roslyn
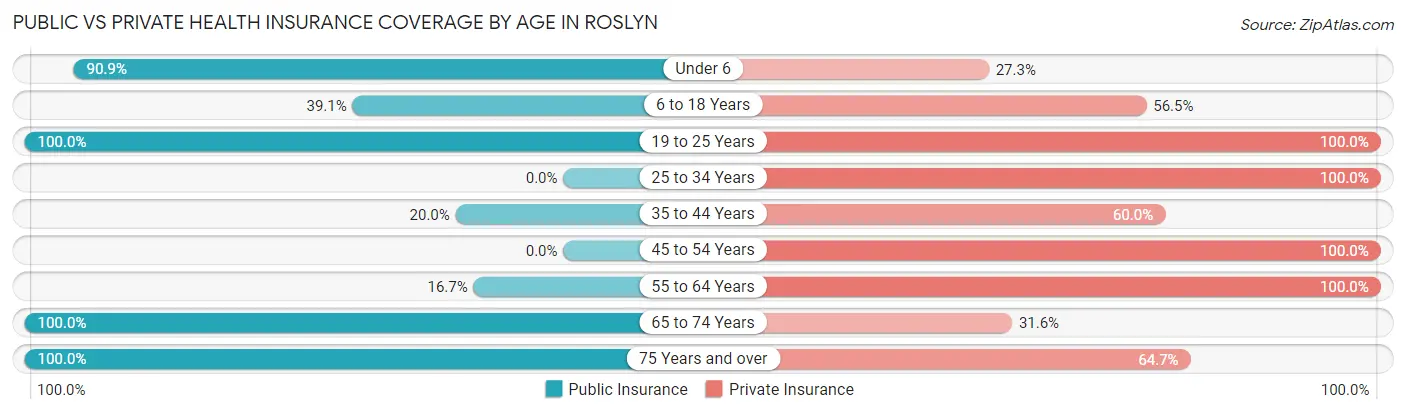
| Age Bracket | Public Insurance | Private Insurance |
| Under 6 | 10 (90.9%) | 3 (27.3%) |
| 6 to 18 Years | 9 (39.1%) | 13 (56.5%) |
| 19 to 25 Years | 5 (100.0%) | 5 (100.0%) |
| 25 to 34 Years | 0 (0.0%) | 11 (100.0%) |
| 35 to 44 Years | 4 (20.0%) | 12 (60.0%) |
| 45 to 54 Years | 0 (0.0%) | 8 (100.0%) |
| 55 to 64 Years | 5 (16.7%) | 30 (100.0%) |
| 65 to 74 Years | 19 (100.0%) | 6 (31.6%) |
| 75 Years and over | 17 (100.0%) | 11 (64.7%) |
| Total | 69 (47.9%) | 99 (68.8%) |
Disability Status by Sex by Age in Roslyn
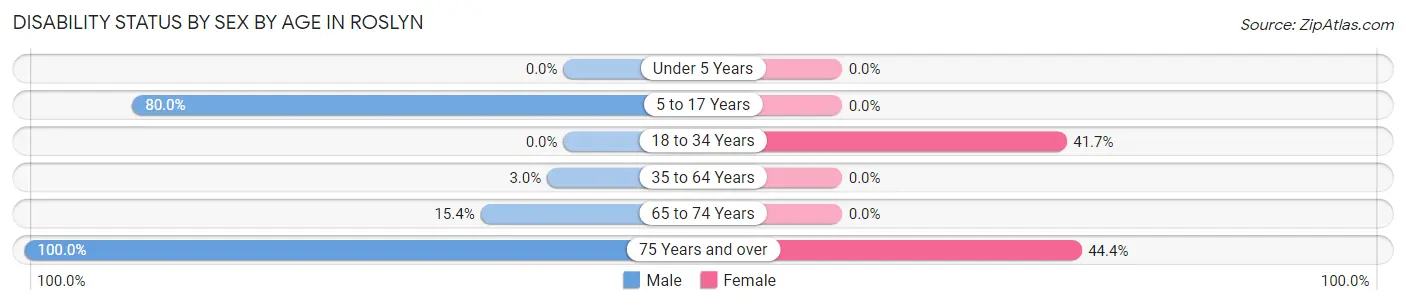
| Age Bracket | Male | Female |
| Under 5 Years | 0 (0.0%) | 0 (0.0%) |
| 5 to 17 Years | 8 (80.0%) | 0 (0.0%) |
| 18 to 34 Years | 0 (0.0%) | 5 (41.7%) |
| 35 to 64 Years | 1 (3.0%) | 0 (0.0%) |
| 65 to 74 Years | 2 (15.4%) | 0 (0.0%) |
| 75 Years and over | 8 (100.0%) | 4 (44.4%) |
Disability Class by Sex by Age in Roslyn
Disability Class: Hearing Difficulty
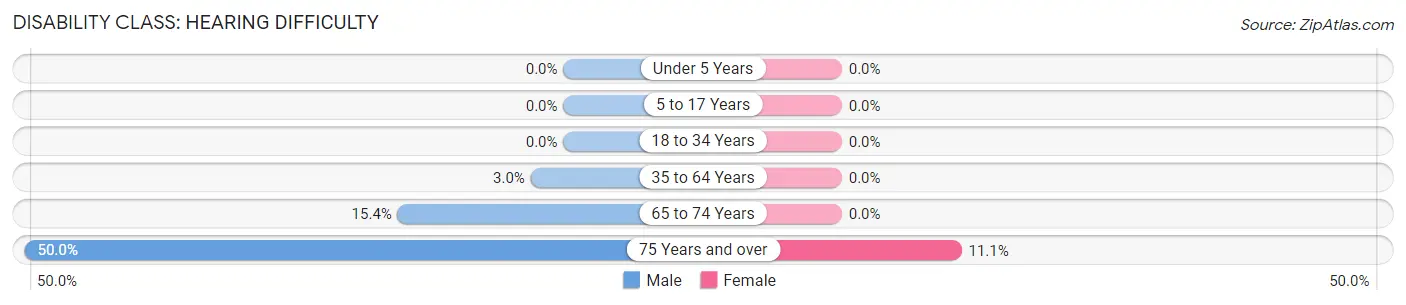
| Age Bracket | Male | Female |
| Under 5 Years | 0 (0.0%) | 0 (0.0%) |
| 5 to 17 Years | 0 (0.0%) | 0 (0.0%) |
| 18 to 34 Years | 0 (0.0%) | 0 (0.0%) |
| 35 to 64 Years | 1 (3.0%) | 0 (0.0%) |
| 65 to 74 Years | 2 (15.4%) | 0 (0.0%) |
| 75 Years and over | 4 (50.0%) | 1 (11.1%) |
Disability Class: Vision Difficulty
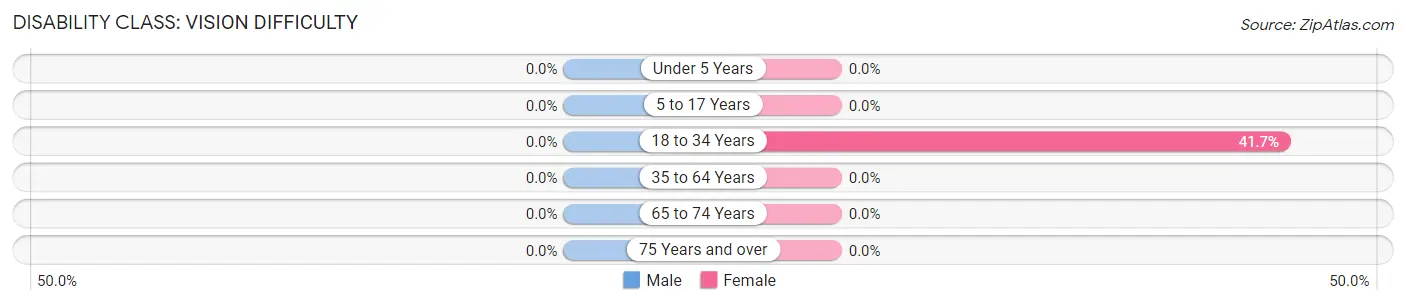
| Age Bracket | Male | Female |
| Under 5 Years | 0 (0.0%) | 0 (0.0%) |
| 5 to 17 Years | 0 (0.0%) | 0 (0.0%) |
| 18 to 34 Years | 0 (0.0%) | 5 (41.7%) |
| 35 to 64 Years | 0 (0.0%) | 0 (0.0%) |
| 65 to 74 Years | 0 (0.0%) | 0 (0.0%) |
| 75 Years and over | 0 (0.0%) | 0 (0.0%) |
Disability Class: Cognitive Difficulty
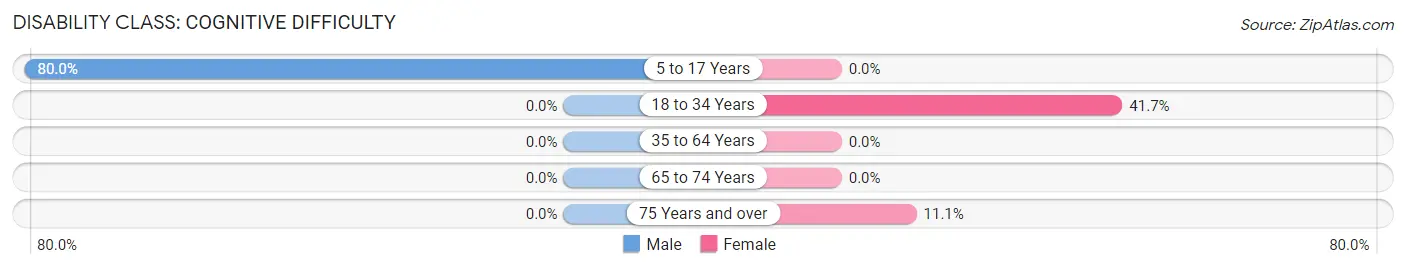
| Age Bracket | Male | Female |
| 5 to 17 Years | 8 (80.0%) | 0 (0.0%) |
| 18 to 34 Years | 0 (0.0%) | 5 (41.7%) |
| 35 to 64 Years | 0 (0.0%) | 0 (0.0%) |
| 65 to 74 Years | 0 (0.0%) | 0 (0.0%) |
| 75 Years and over | 0 (0.0%) | 1 (11.1%) |
Disability Class: Ambulatory Difficulty
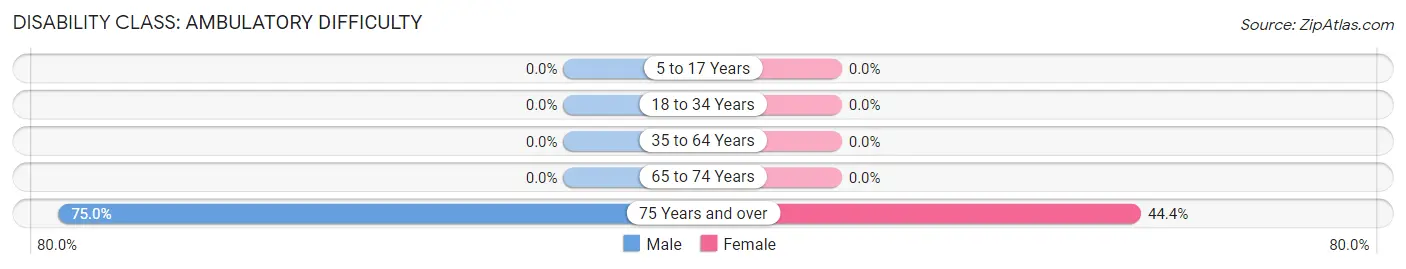
| Age Bracket | Male | Female |
| 5 to 17 Years | 0 (0.0%) | 0 (0.0%) |
| 18 to 34 Years | 0 (0.0%) | 0 (0.0%) |
| 35 to 64 Years | 0 (0.0%) | 0 (0.0%) |
| 65 to 74 Years | 0 (0.0%) | 0 (0.0%) |
| 75 Years and over | 6 (75.0%) | 4 (44.4%) |
Disability Class: Self-Care Difficulty
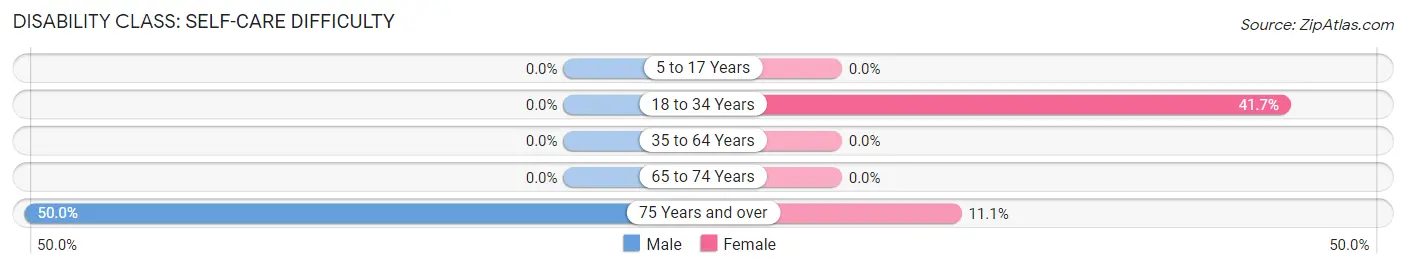
| Age Bracket | Male | Female |
| 5 to 17 Years | 0 (0.0%) | 0 (0.0%) |
| 18 to 34 Years | 0 (0.0%) | 5 (41.7%) |
| 35 to 64 Years | 0 (0.0%) | 0 (0.0%) |
| 65 to 74 Years | 0 (0.0%) | 0 (0.0%) |
| 75 Years and over | 4 (50.0%) | 1 (11.1%) |
Technology Access in Roslyn
Computing Device Access in Roslyn
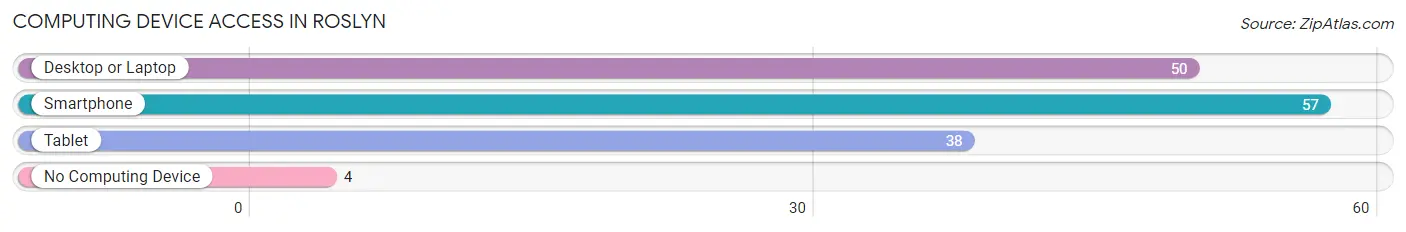
| Device Type | # Households | % Households |
| Desktop or Laptop | 50 | 72.5% |
| Smartphone | 57 | 82.6% |
| Tablet | 38 | 55.1% |
| No Computing Device | 4 | 5.8% |
| Total | 69 | 100.0% |
Internet Access in Roslyn
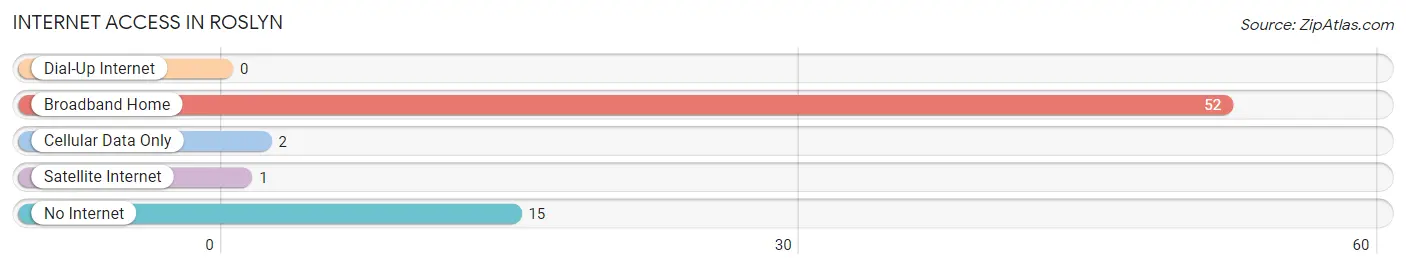
| Internet Type | # Households | % Households |
| Dial-Up Internet | 0 | 0.0% |
| Broadband Home | 52 | 75.4% |
| Cellular Data Only | 2 | 2.9% |
| Satellite Internet | 1 | 1.5% |
| No Internet | 15 | 21.7% |
| Total | 69 | 100.0% |
Roslyn Summary
Roslyn, South Dakota is a small town located in the southeastern corner of the state. It is situated in the rolling hills of the Missouri Coteau, a region of the Great Plains. The town is located in the county of Day, and is the county seat. The population of Roslyn was estimated to be 545 in 2019.
History
The town of Roslyn was founded in 1883 by a group of settlers from Wisconsin. The town was named after Roslyn, Wisconsin, the hometown of the settlers. The town was originally located in the county of Grant, but was moved to its current location in Day County in 1884.
The town was originally a farming community, but in the early 1900s, the railroad came to town, bringing with it new opportunities for economic growth. The railroad allowed the town to become a shipping center for the surrounding area, and it also allowed for the development of a local coal mining industry.
The town of Roslyn was incorporated in 1909, and the first mayor was elected in 1910. The town continued to grow and prosper throughout the 20th century, and today it is a thriving community.
Geography
Roslyn is located in the southeastern corner of South Dakota, in the county of Day. The town is situated in the rolling hills of the Missouri Coteau, a region of the Great Plains. The town is located at an elevation of 1,845 feet above sea level.
The town is located near the Big Sioux River, which flows through the area. The town is also located near the Big Stone National Wildlife Refuge, which is a popular destination for birdwatchers and nature lovers.
The climate in Roslyn is classified as humid continental, with hot summers and cold winters. The average annual temperature is 48 degrees Fahrenheit, and the average annual precipitation is 22 inches.
Economy
The economy of Roslyn is largely based on agriculture and tourism. The town is home to several farms, which produce a variety of crops, including corn, soybeans, wheat, and hay. The town is also home to several small businesses, including restaurants, retail stores, and service providers.
The town is also a popular tourist destination, due to its proximity to the Big Stone National Wildlife Refuge. The refuge is a popular destination for birdwatchers and nature lovers, and it is also home to a variety of wildlife, including deer, elk, and bison.
Demographics
The population of Roslyn was estimated to be 545 in 2019. The town is predominantly white, with a small minority population. The median household income in the town is $45,000, and the median home value is $125,000. The town has a low unemployment rate, and the majority of the population is employed in the agricultural and tourism industries.
Common Questions
What is Per Capita Income in Roslyn?
Per Capita income in Roslyn is $26,603.
What is the Median Family Income in Roslyn?
Median Family Income in Roslyn is $85,938.
What is the Median Household income in Roslyn?
Median Household Income in Roslyn is $62,813.
What is Income or Wage Gap in Roslyn?
Income or Wage Gap in Roslyn is 38.2%.
Women in Roslyn earn 61.8 cents for every dollar earned by a man.
What is Inequality or Gini Index in Roslyn?
Inequality or Gini Index in Roslyn is 0.33.
What is the Total Population of Roslyn?
Total Population of Roslyn is 183.
What is the Total Male Population of Roslyn?
Total Male Population of Roslyn is 86.
What is the Total Female Population of Roslyn?
Total Female Population of Roslyn is 97.
What is the Ratio of Males per 100 Females in Roslyn?
There are 88.66 Males per 100 Females in Roslyn.
What is the Ratio of Females per 100 Males in Roslyn?
There are 112.79 Females per 100 Males in Roslyn.
What is the Median Population Age in Roslyn?
Median Population Age in Roslyn is 58.8 Years.
What is the Average Family Size in Roslyn
Average Family Size in Roslyn is 2.7 People.
What is the Average Household Size in Roslyn
Average Household Size in Roslyn is 2.1 People.
How Large is the Labor Force in Roslyn?
There are 72 People in the Labor Forcein in Roslyn.
What is the Percentage of People in the Labor Force in Roslyn?
48.3% of People are in the Labor Force in Roslyn.