Willow Lake, SD Map & Demographics
Willow Lake Map
Willow Lake Overview
$17,486
PER CAPITA INCOME
$65,000
AVG FAMILY INCOME
$57,292
AVG HOUSEHOLD INCOME
37.4%
WAGE / INCOME GAP [ % ]
62.6¢/ $1
WAGE / INCOME GAP [ $ ]
0.27
INEQUALITY / GINI INDEX
360
TOTAL POPULATION
167
MALE POPULATION
193
FEMALE POPULATION
86.53
MALES / 100 FEMALES
115.57
FEMALES / 100 MALES
17.1
MEDIAN AGE
5.2
AVG FAMILY SIZE
3.6
AVG HOUSEHOLD SIZE
114
LABOR FORCE [ PEOPLE ]
57.6%
PERCENT IN LABOR FORCE
Willow Lake Zip Codes
Willow Lake Area Codes
Income in Willow Lake
Income Overview in Willow Lake
Per Capita Income in Willow Lake is $17,486, while median incomes of families and households are $65,000 and $57,292 respectively.
| Characteristic | Number | Measure |
| Per Capita Income | 360 | $17,486 |
| Median Family Income | 62 | $65,000 |
| Mean Family Income | 62 | $70,876 |
| Median Household Income | 99 | $57,292 |
| Mean Household Income | 99 | $61,701 |
| Income Deficit | 62 | $0 |
| Wage / Income Gap (%) | 360 | 37.38% |
| Wage / Income Gap ($) | 360 | 62.62¢ per $1 |
| Gini / Inequality Index | 360 | 0.27 |
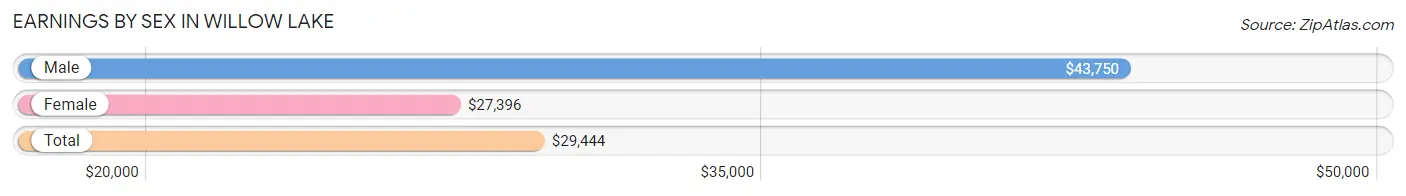
Earnings by Sex in Willow Lake
Average Earnings in Willow Lake are $29,444, $43,750 for men and $27,396 for women, a difference of 37.4%.
| Sex | Number | Average Earnings |
| Male | 73 (57.0%) | $43,750 |
| Female | 55 (43.0%) | $27,396 |
| Total | 128 (100.0%) | $29,444 |
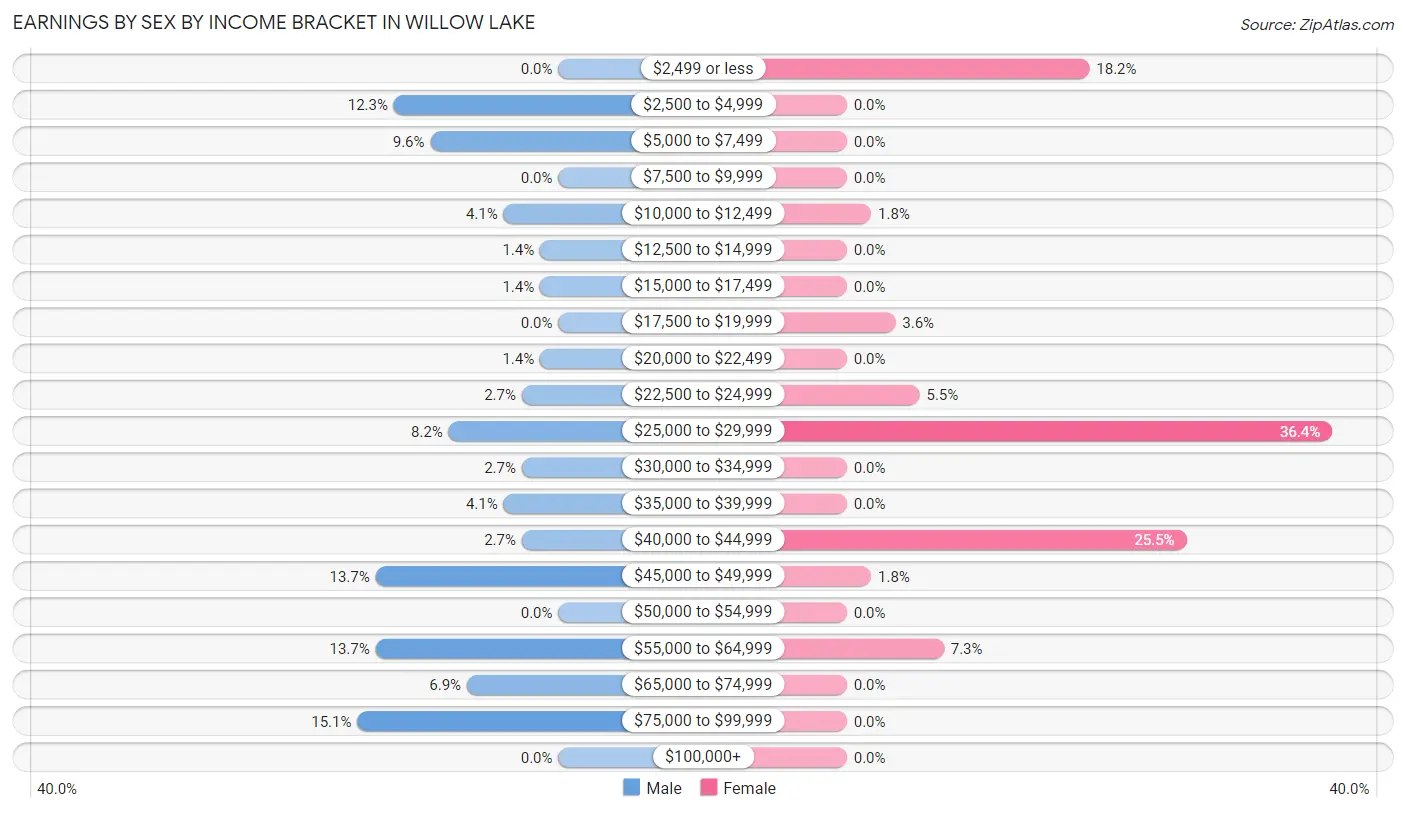
Earnings by Sex by Income Bracket in Willow Lake
The most common earnings brackets in Willow Lake are $75,000 to $99,999 for men (11 | 15.1%) and $25,000 to $29,999 for women (20 | 36.4%).
| Income | Male | Female |
| $2,499 or less | 0 (0.0%) | 10 (18.2%) |
| $2,500 to $4,999 | 9 (12.3%) | 0 (0.0%) |
| $5,000 to $7,499 | 7 (9.6%) | 0 (0.0%) |
| $7,500 to $9,999 | 0 (0.0%) | 0 (0.0%) |
| $10,000 to $12,499 | 3 (4.1%) | 1 (1.8%) |
| $12,500 to $14,999 | 1 (1.4%) | 0 (0.0%) |
| $15,000 to $17,499 | 1 (1.4%) | 0 (0.0%) |
| $17,500 to $19,999 | 0 (0.0%) | 2 (3.6%) |
| $20,000 to $22,499 | 1 (1.4%) | 0 (0.0%) |
| $22,500 to $24,999 | 2 (2.7%) | 3 (5.4%) |
| $25,000 to $29,999 | 6 (8.2%) | 20 (36.4%) |
| $30,000 to $34,999 | 2 (2.7%) | 0 (0.0%) |
| $35,000 to $39,999 | 3 (4.1%) | 0 (0.0%) |
| $40,000 to $44,999 | 2 (2.7%) | 14 (25.5%) |
| $45,000 to $49,999 | 10 (13.7%) | 1 (1.8%) |
| $50,000 to $54,999 | 0 (0.0%) | 0 (0.0%) |
| $55,000 to $64,999 | 10 (13.7%) | 4 (7.3%) |
| $65,000 to $74,999 | 5 (6.9%) | 0 (0.0%) |
| $75,000 to $99,999 | 11 (15.1%) | 0 (0.0%) |
| $100,000+ | 0 (0.0%) | 0 (0.0%) |
| Total | 73 (100.0%) | 55 (100.0%) |
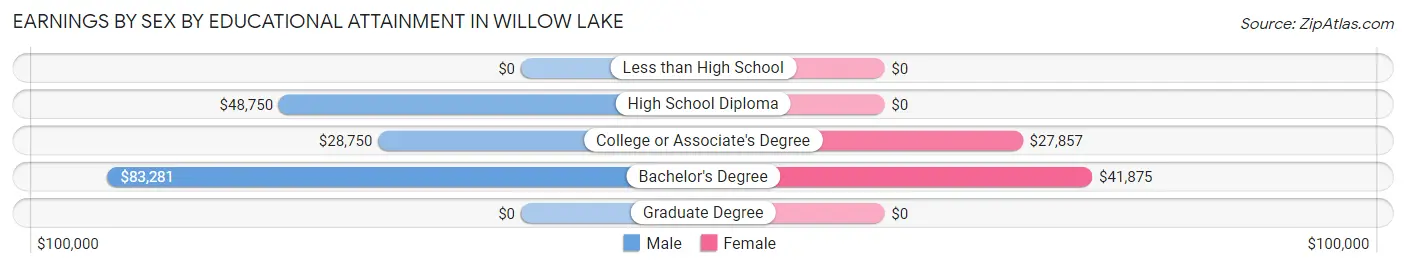
Earnings by Sex by Educational Attainment in Willow Lake
Average earnings in Willow Lake are $49,063 for men and $28,594 for women, a difference of 41.7%. Men with an educational attainment of bachelor's degree enjoy the highest average annual earnings of $83,281, while those with college or associate's degree education earn the least with $28,750. Women with an educational attainment of bachelor's degree earn the most with the average annual earnings of $41,875, while those with college or associate's degree education have the smallest earnings of $27,857.
| Educational Attainment | Male Income | Female Income |
| Less than High School | - | - |
| High School Diploma | $48,750 | $0 |
| College or Associate's Degree | $28,750 | $27,857 |
| Bachelor's Degree | $83,281 | $41,875 |
| Graduate Degree | - | - |
| Total | $49,063 | $28,594 |
Family Income in Willow Lake
Family Income Brackets in Willow Lake
According to the Willow Lake family income data, there are 22 families falling into the $50,000 to $74,999 income range, which is the most common income bracket and makes up 35.5% of all families.
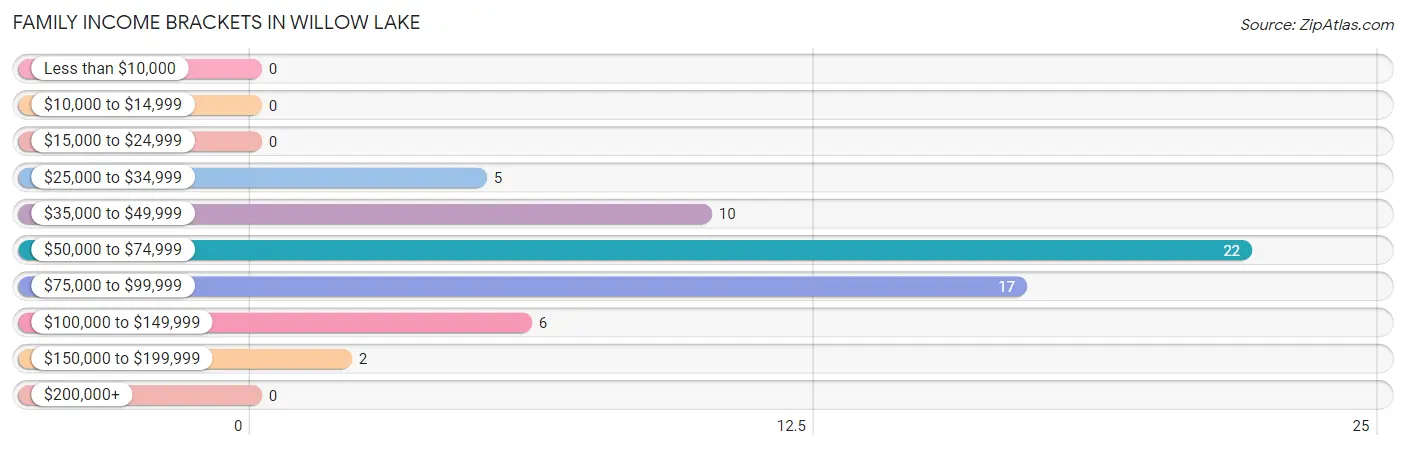
| Income Bracket | # Families | % Families |
| Less than $10,000 | 0 | 0.0% |
| $10,000 to $14,999 | 0 | 0.0% |
| $15,000 to $24,999 | 0 | 0.0% |
| $25,000 to $34,999 | 5 | 8.1% |
| $35,000 to $49,999 | 10 | 16.1% |
| $50,000 to $74,999 | 22 | 35.5% |
| $75,000 to $99,999 | 17 | 27.4% |
| $100,000 to $149,999 | 6 | 9.7% |
| $150,000 to $199,999 | 2 | 3.2% |
| $200,000+ | 0 | 0.0% |
Family Income by Famaliy Size in Willow Lake
4-person families (13 | 21.0%) account for the highest median family income in Willow Lake with $71,250 per family, while 2-person families (23 | 37.1%) have the highest median income of $25,782 per family member.
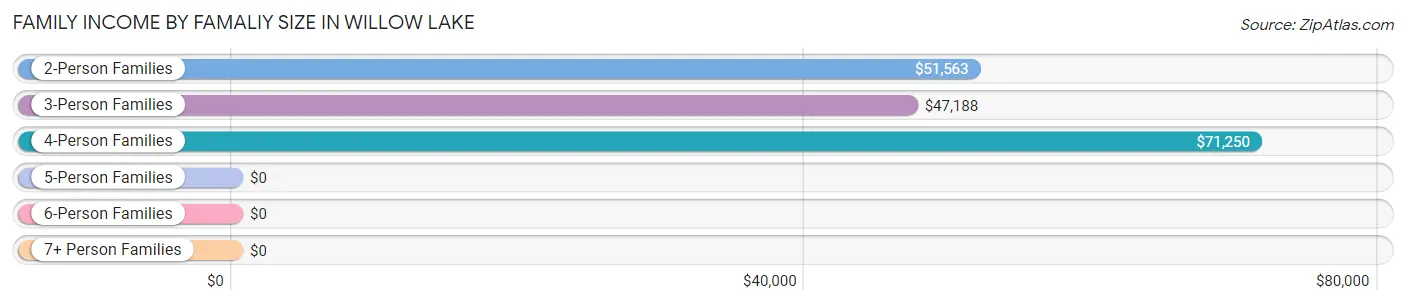
| Income Bracket | # Families | Median Income |
| 2-Person Families | 23 (37.1%) | $51,563 |
| 3-Person Families | 7 (11.3%) | $47,188 |
| 4-Person Families | 13 (21.0%) | $71,250 |
| 5-Person Families | 3 (4.8%) | $0 |
| 6-Person Families | 5 (8.1%) | $0 |
| 7+ Person Families | 11 (17.7%) | $0 |
| Total | 62 (100.0%) | $65,000 |
Family Income by Number of Earners in Willow Lake
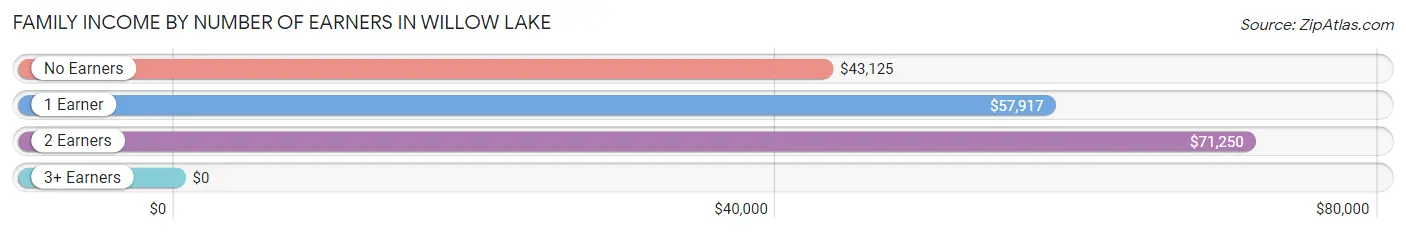
| Number of Earners | # Families | Median Income |
| No Earners | 11 (17.7%) | $43,125 |
| 1 Earner | 13 (21.0%) | $57,917 |
| 2 Earners | 35 (56.5%) | $71,250 |
| 3+ Earners | 3 (4.8%) | $0 |
| Total | 62 (100.0%) | $65,000 |
Household Income in Willow Lake
Household Income Brackets in Willow Lake
With 39 households falling in the category, the $50,000 to $74,999 income range is the most frequent in Willow Lake, accounting for 39.4% of all households.
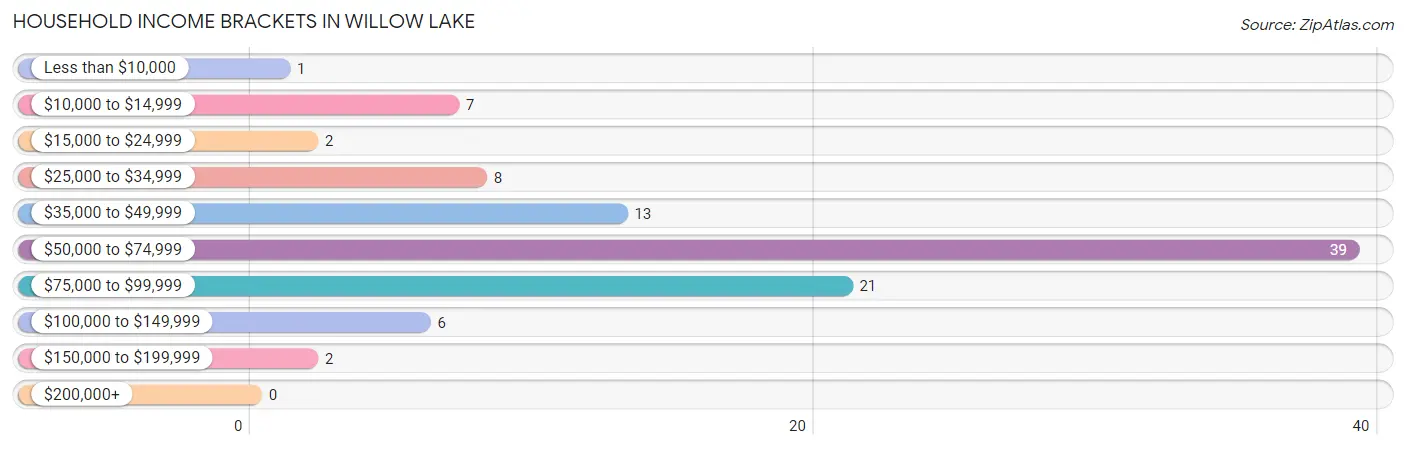
| Income Bracket | # Households | % Households |
| Less than $10,000 | 1 | 1.0% |
| $10,000 to $14,999 | 7 | 7.1% |
| $15,000 to $24,999 | 2 | 2.0% |
| $25,000 to $34,999 | 8 | 8.1% |
| $35,000 to $49,999 | 13 | 13.1% |
| $50,000 to $74,999 | 39 | 39.4% |
| $75,000 to $99,999 | 21 | 21.2% |
| $100,000 to $149,999 | 6 | 6.1% |
| $150,000 to $199,999 | 2 | 2.0% |
| $200,000+ | 0 | 0.0% |
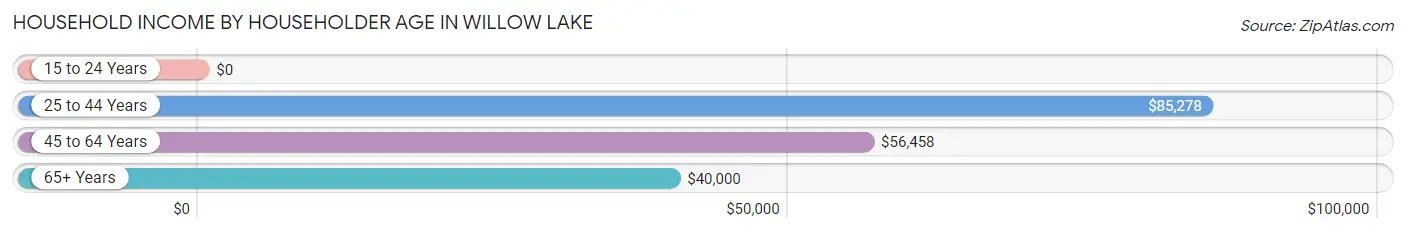
Household Income by Householder Age in Willow Lake
The median household income in Willow Lake is $57,292, with the highest median household income of $85,278 found in the 25 to 44 years age bracket for the primary householder. A total of 36 households (36.4%) fall into this category. Meanwhile, the 15 to 24 years age bracket for the primary householder has the lowest median household income of $0, with 5 households (5.1%) in this group.
| Income Bracket | # Households | Median Income |
| 15 to 24 Years | 5 (5.1%) | $0 |
| 25 to 44 Years | 36 (36.4%) | $85,278 |
| 45 to 64 Years | 24 (24.2%) | $56,458 |
| 65+ Years | 34 (34.3%) | $40,000 |
| Total | 99 (100.0%) | $57,292 |
Poverty in Willow Lake
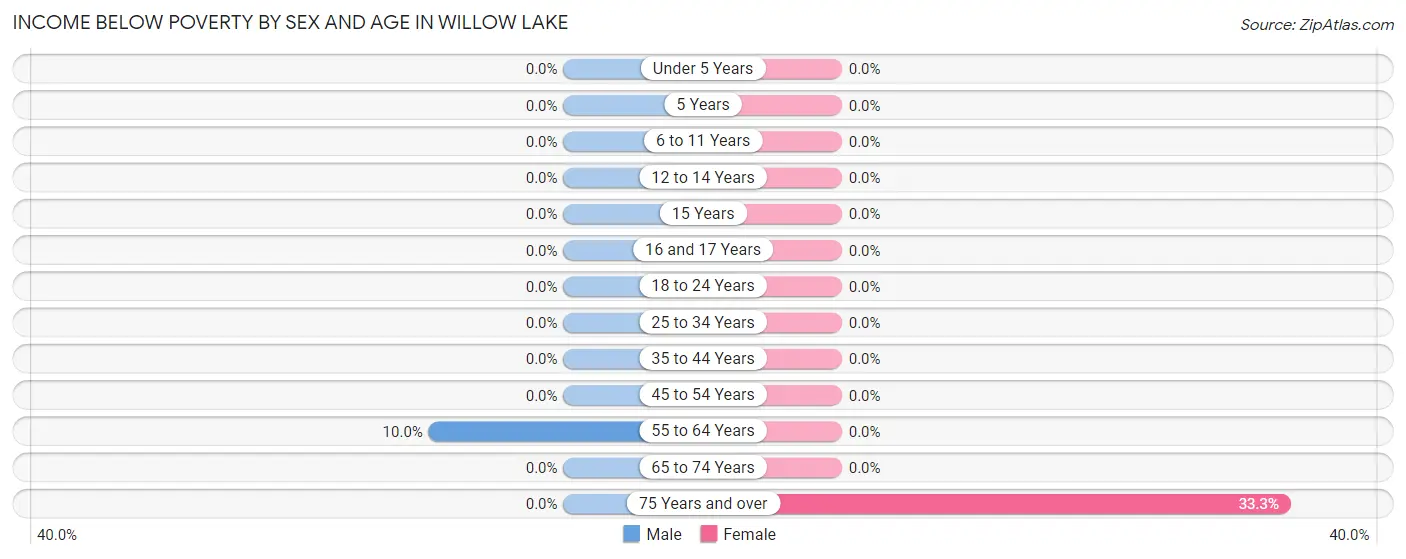
Income Below Poverty by Sex and Age in Willow Lake
With 0.6% poverty level for males and 3.6% for females among the residents of Willow Lake, 55 to 64 year old males and 75 year old and over females are the most vulnerable to poverty, with 1 males (10.0%) and 7 females (33.3%) in their respective age groups living below the poverty level.
| Age Bracket | Male | Female |
| Under 5 Years | 0 (0.0%) | 0 (0.0%) |
| 5 Years | 0 (0.0%) | 0 (0.0%) |
| 6 to 11 Years | 0 (0.0%) | 0 (0.0%) |
| 12 to 14 Years | 0 (0.0%) | 0 (0.0%) |
| 15 Years | 0 (0.0%) | 0 (0.0%) |
| 16 and 17 Years | 0 (0.0%) | 0 (0.0%) |
| 18 to 24 Years | 0 (0.0%) | 0 (0.0%) |
| 25 to 34 Years | 0 (0.0%) | 0 (0.0%) |
| 35 to 44 Years | 0 (0.0%) | 0 (0.0%) |
| 45 to 54 Years | 0 (0.0%) | 0 (0.0%) |
| 55 to 64 Years | 1 (10.0%) | 0 (0.0%) |
| 65 to 74 Years | 0 (0.0%) | 0 (0.0%) |
| 75 Years and over | 0 (0.0%) | 7 (33.3%) |
| Total | 1 (0.6%) | 7 (3.6%) |
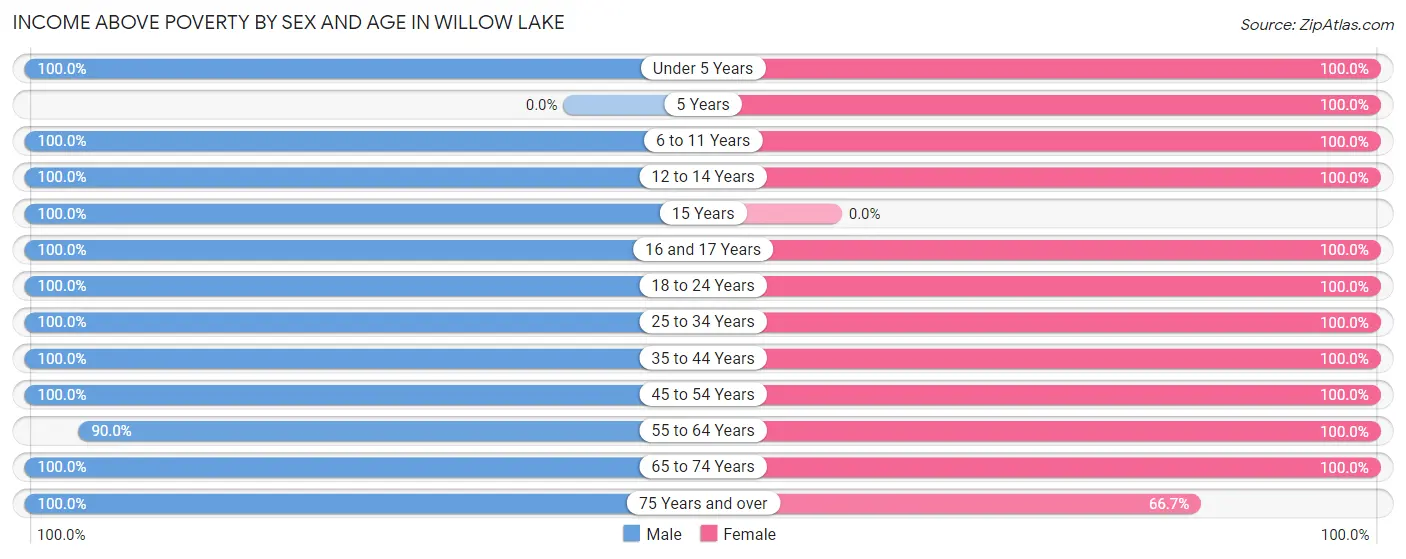
Income Above Poverty by Sex and Age in Willow Lake
According to the poverty statistics in Willow Lake, males aged under 5 years and females aged under 5 years are the age groups that are most secure financially, with 100.0% of males and 100.0% of females in these age groups living above the poverty line.
| Age Bracket | Male | Female |
| Under 5 Years | 38 (100.0%) | 40 (100.0%) |
| 5 Years | 0 (0.0%) | 3 (100.0%) |
| 6 to 11 Years | 15 (100.0%) | 30 (100.0%) |
| 12 to 14 Years | 18 (100.0%) | 16 (100.0%) |
| 15 Years | 2 (100.0%) | 0 (0.0%) |
| 16 and 17 Years | 17 (100.0%) | 8 (100.0%) |
| 18 to 24 Years | 11 (100.0%) | 4 (100.0%) |
| 25 to 34 Years | 21 (100.0%) | 33 (100.0%) |
| 35 to 44 Years | 14 (100.0%) | 6 (100.0%) |
| 45 to 54 Years | 3 (100.0%) | 4 (100.0%) |
| 55 to 64 Years | 9 (90.0%) | 20 (100.0%) |
| 65 to 74 Years | 12 (100.0%) | 8 (100.0%) |
| 75 Years and over | 6 (100.0%) | 14 (66.7%) |
| Total | 166 (99.4%) | 186 (96.4%) |
Income Below Poverty Among Married-Couple Families in Willow Lake
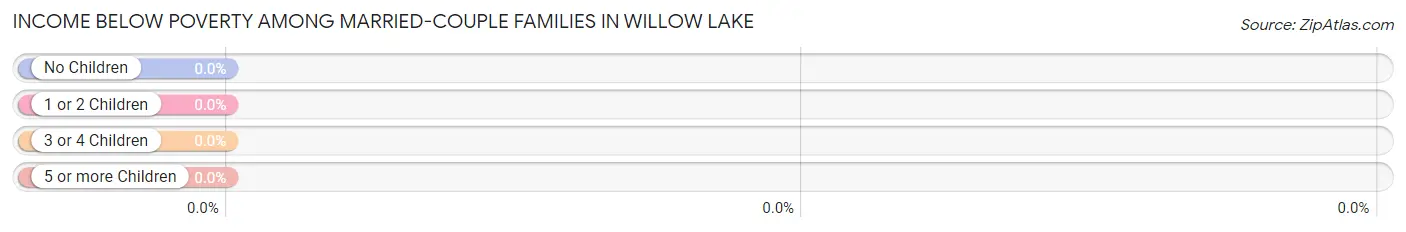
| Children | Above Poverty | Below Poverty |
| No Children | 18 (100.0%) | 0 (0.0%) |
| 1 or 2 Children | 21 (100.0%) | 0 (0.0%) |
| 3 or 4 Children | 6 (100.0%) | 0 (0.0%) |
| 5 or more Children | 11 (100.0%) | 0 (0.0%) |
| Total | 56 (100.0%) | 0 (0.0%) |
Income Below Poverty Among Single-Parent Households in Willow Lake
| Children | Single Father | Single Mother |
| No Children | 0 (0.0%) | 0 (0.0%) |
| 1 or 2 Children | 0 (0.0%) | 0 (0.0%) |
| 3 or 4 Children | 0 (0.0%) | 0 (0.0%) |
| 5 or more Children | 0 (0.0%) | 0 (0.0%) |
| Total | 0 (0.0%) | 0 (0.0%) |
Income Below Poverty Among Married-Couple vs Single-Parent Households in Willow Lake
| Children | Married-Couple Families | Single-Parent Households |
| No Children | 0 (0.0%) | 0 (0.0%) |
| 1 or 2 Children | 0 (0.0%) | 0 (0.0%) |
| 3 or 4 Children | 0 (0.0%) | 0 (0.0%) |
| 5 or more Children | 0 (0.0%) | 0 (0.0%) |
| Total | 0 (0.0%) | 0 (0.0%) |
Race in Willow Lake
The most populous races in Willow Lake are White / Caucasian (295 | 81.9%), Hispanic or Latino (54 | 15.0%), and Some other Race (46 | 12.8%).
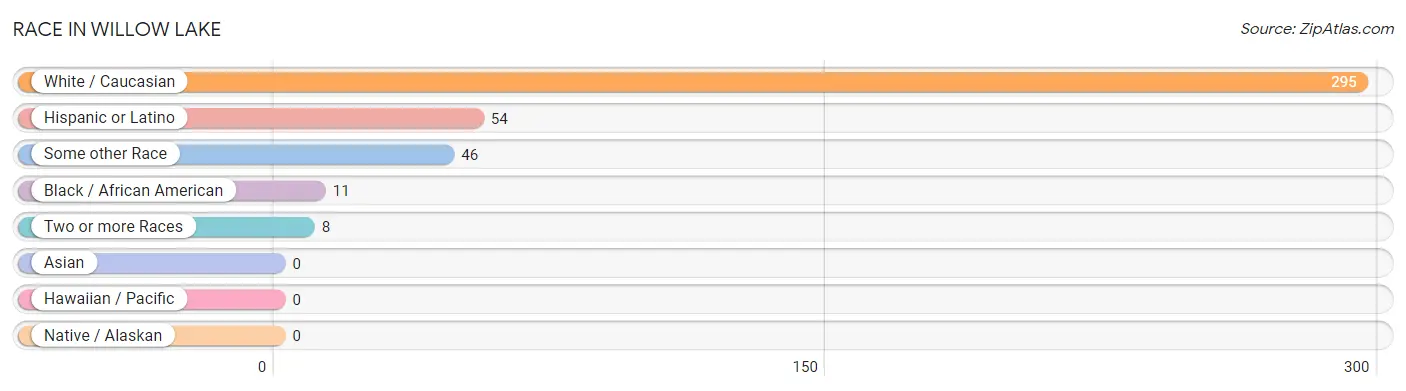
| Race | # Population | % Population |
| Asian | 0 | 0.0% |
| Black / African American | 11 | 3.1% |
| Hawaiian / Pacific | 0 | 0.0% |
| Hispanic or Latino | 54 | 15.0% |
| Native / Alaskan | 0 | 0.0% |
| White / Caucasian | 295 | 81.9% |
| Two or more Races | 8 | 2.2% |
| Some other Race | 46 | 12.8% |
| Total | 360 | 100.0% |
Ancestry in Willow Lake
The most populous ancestries reported in Willow Lake are Norwegian (50 | 13.9%), Irish (48 | 13.3%), Mexican (46 | 12.8%), German (40 | 11.1%), and English (22 | 6.1%), together accounting for 57.2% of all Willow Lake residents.
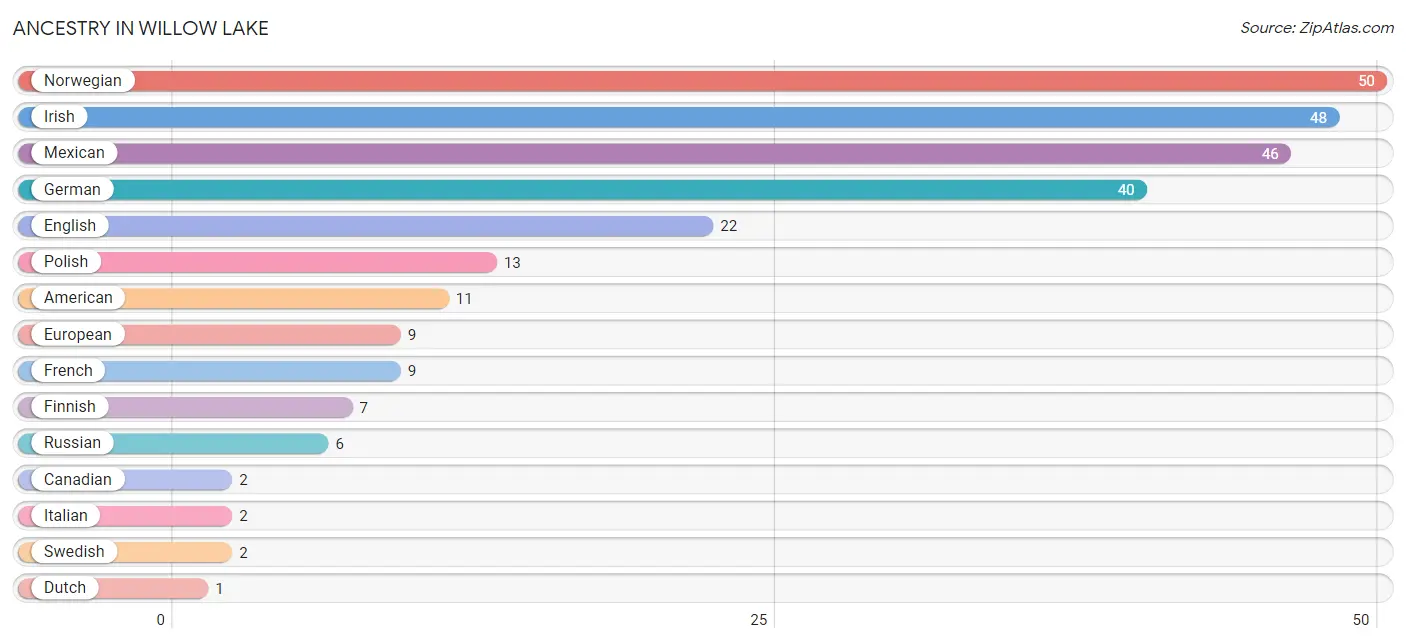
| Ancestry | # Population | % Population |
| American | 11 | 3.1% |
| Canadian | 2 | 0.6% |
| Dutch | 1 | 0.3% |
| English | 22 | 6.1% |
| European | 9 | 2.5% |
| Finnish | 7 | 1.9% |
| French | 9 | 2.5% |
| German | 40 | 11.1% |
| Irish | 48 | 13.3% |
| Italian | 2 | 0.6% |
| Mexican | 46 | 12.8% |
| Norwegian | 50 | 13.9% |
| Polish | 13 | 3.6% |
| Russian | 6 | 1.7% |
| Swedish | 2 | 0.6% | View All 15 Rows |
Immigrants in Willow Lake
The most numerous immigrant groups reported in Willow Lake came from Central America (18 | 5.0%), Latin America (18 | 5.0%), Mexico (18 | 5.0%), Canada (2 | 0.6%), and Eastern Europe (2 | 0.6%), together accounting for 16.1% of all Willow Lake residents.
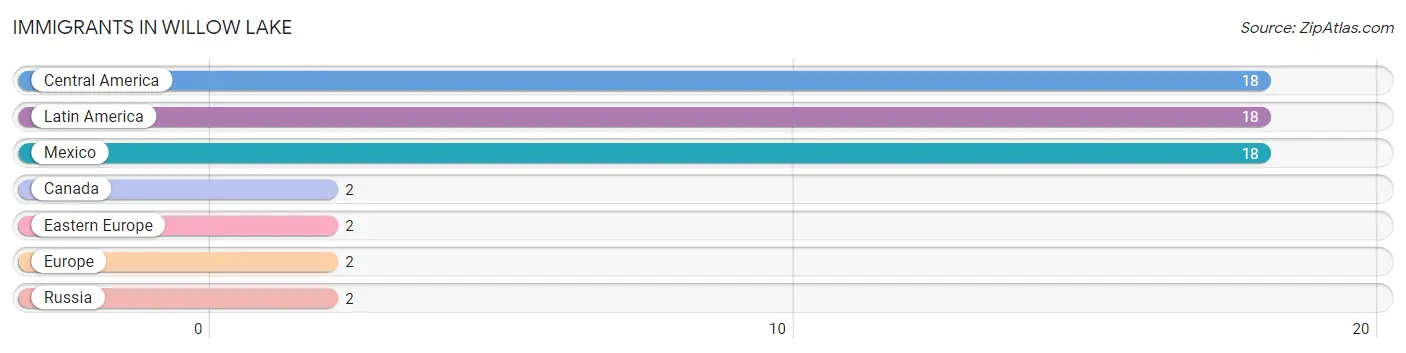
| Immigration Origin | # Population | % Population |
| Canada | 2 | 0.6% |
| Central America | 18 | 5.0% |
| Eastern Europe | 2 | 0.6% |
| Europe | 2 | 0.6% |
| Latin America | 18 | 5.0% |
| Mexico | 18 | 5.0% |
| Russia | 2 | 0.6% | View All 7 Rows |
Sex and Age in Willow Lake
Sex and Age in Willow Lake
The most populous age groups in Willow Lake are Under 5 Years (38 | 22.8%) for men and Under 5 Years (40 | 20.7%) for women.
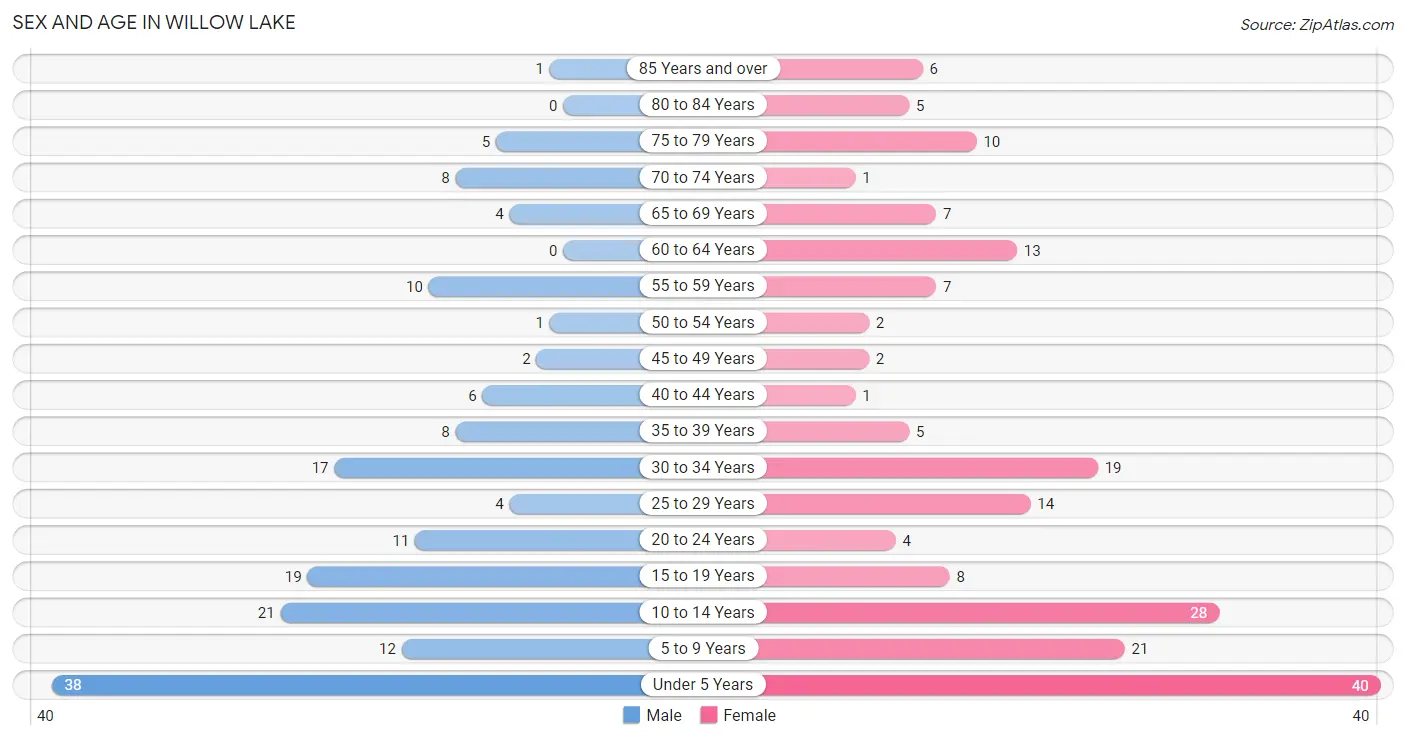
| Age Bracket | Male | Female |
| Under 5 Years | 38 (22.8%) | 40 (20.7%) |
| 5 to 9 Years | 12 (7.2%) | 21 (10.9%) |
| 10 to 14 Years | 21 (12.6%) | 28 (14.5%) |
| 15 to 19 Years | 19 (11.4%) | 8 (4.2%) |
| 20 to 24 Years | 11 (6.6%) | 4 (2.1%) |
| 25 to 29 Years | 4 (2.4%) | 14 (7.2%) |
| 30 to 34 Years | 17 (10.2%) | 19 (9.8%) |
| 35 to 39 Years | 8 (4.8%) | 5 (2.6%) |
| 40 to 44 Years | 6 (3.6%) | 1 (0.5%) |
| 45 to 49 Years | 2 (1.2%) | 2 (1.0%) |
| 50 to 54 Years | 1 (0.6%) | 2 (1.0%) |
| 55 to 59 Years | 10 (6.0%) | 7 (3.6%) |
| 60 to 64 Years | 0 (0.0%) | 13 (6.7%) |
| 65 to 69 Years | 4 (2.4%) | 7 (3.6%) |
| 70 to 74 Years | 8 (4.8%) | 1 (0.5%) |
| 75 to 79 Years | 5 (3.0%) | 10 (5.2%) |
| 80 to 84 Years | 0 (0.0%) | 5 (2.6%) |
| 85 Years and over | 1 (0.6%) | 6 (3.1%) |
| Total | 167 (100.0%) | 193 (100.0%) |
Families and Households in Willow Lake
Median Family Size in Willow Lake
The median family size in Willow Lake is 5.15 persons per family, with married-couple families (56 | 90.3%) accounting for the largest median family size of 5.48 persons per family. On the other hand, single male/father families (2 | 3.2%) represent the smallest median family size with 2.00 persons per family.
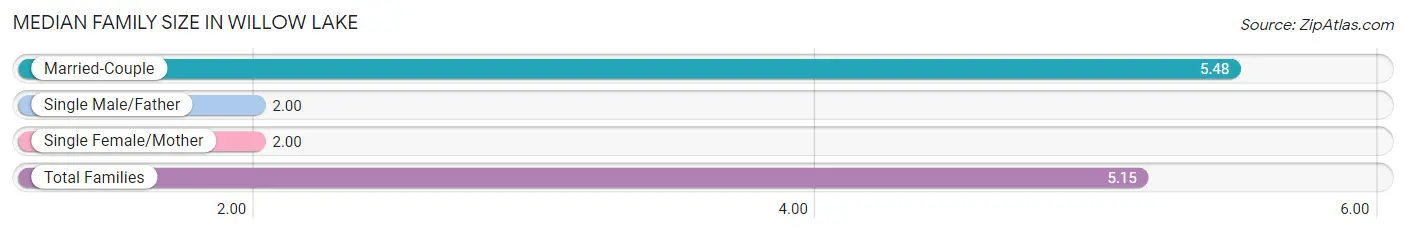
| Family Type | # Families | Family Size |
| Married-Couple | 56 (90.3%) | 5.48 |
| Single Male/Father | 2 (3.2%) | 2.00 |
| Single Female/Mother | 4 (6.5%) | 2.00 |
| Total Families | 62 (100.0%) | 5.15 |
Median Household Size in Willow Lake
The median household size in Willow Lake is 3.64 persons per household, with married-couple households (56 | 56.6%) accounting for the largest median household size of 5.48 persons per household. non-family households (37 | 37.4%) represent the smallest median household size with 1.05 persons per household.
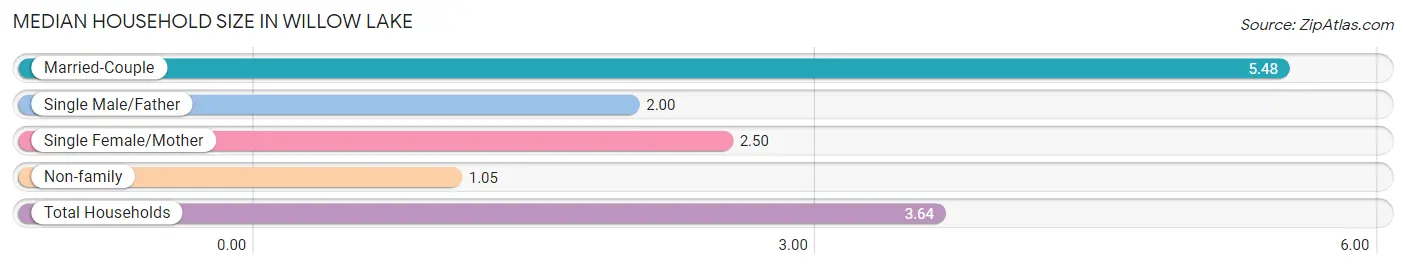
| Household Type | # Households | Household Size |
| Married-Couple | 56 (56.6%) | 5.48 |
| Single Male/Father | 2 (2.0%) | 2.00 |
| Single Female/Mother | 4 (4.0%) | 2.50 |
| Non-family | 37 (37.4%) | 1.05 |
| Total Households | 99 (100.0%) | 3.64 |
Household Size by Marriage Status in Willow Lake
Out of a total of 99 households in Willow Lake, 62 (62.6%) are family households, while 37 (37.4%) are nonfamily households. The most numerous type of family households are 2-person households, comprising 19, and the most common type of nonfamily households are 1-person households, comprising 36.
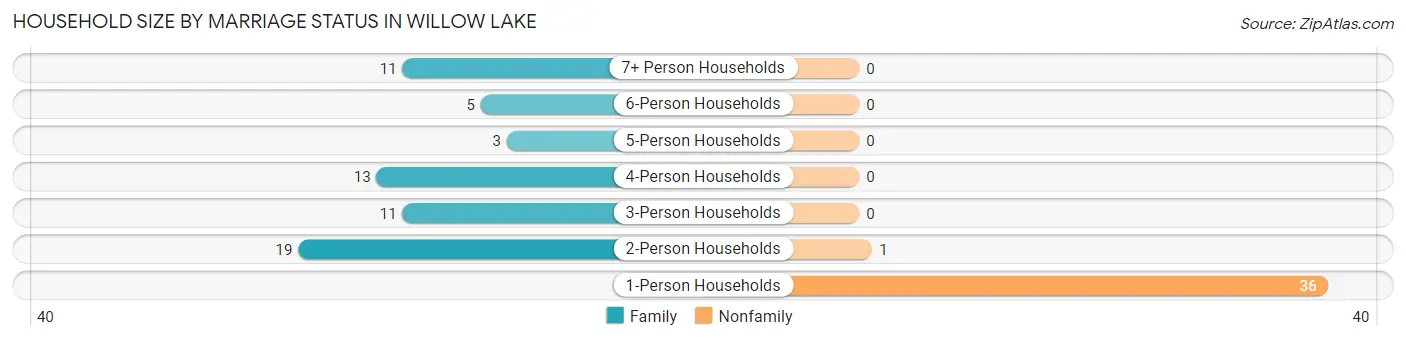
| Household Size | Family Households | Nonfamily Households |
| 1-Person Households | - | 36 (36.4%) |
| 2-Person Households | 19 (19.2%) | 1 (1.0%) |
| 3-Person Households | 11 (11.1%) | 0 (0.0%) |
| 4-Person Households | 13 (13.1%) | 0 (0.0%) |
| 5-Person Households | 3 (3.0%) | 0 (0.0%) |
| 6-Person Households | 5 (5.1%) | 0 (0.0%) |
| 7+ Person Households | 11 (11.1%) | 0 (0.0%) |
| Total | 62 (62.6%) | 37 (37.4%) |
Female Fertility in Willow Lake
Fertility by Age in Willow Lake
Average fertility rate in Willow Lake is 109.0 births per 1,000 women. Women in the age bracket of 20 to 34 years have the highest fertility rate with 162.0 births per 1,000 women. Women in the age bracket of 20 to 34 years acount for 100.0% of all women with births.
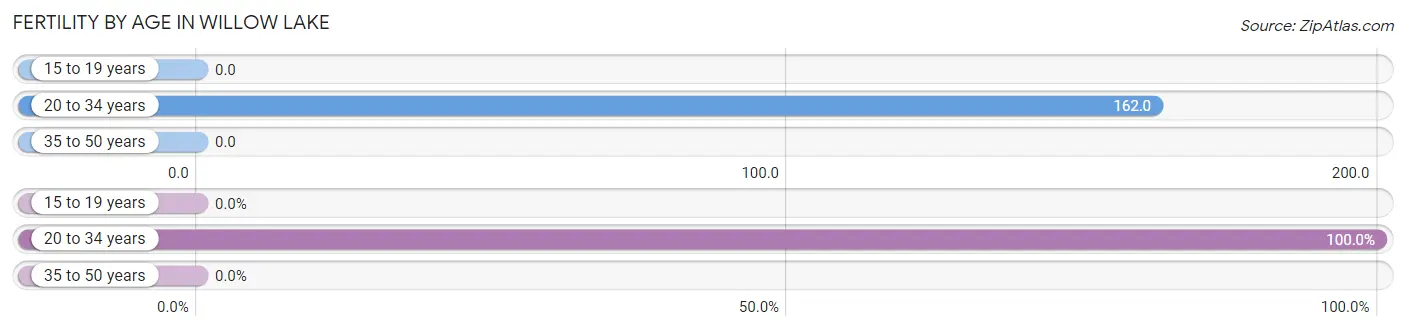
| Age Bracket | Women with Births | Births / 1,000 Women |
| 15 to 19 years | 0 (0.0%) | 0.0 |
| 20 to 34 years | 6 (100.0%) | 162.0 |
| 35 to 50 years | 0 (0.0%) | 0.0 |
| Total | 6 (100.0%) | 109.0 |
Fertility by Age by Marriage Status in Willow Lake
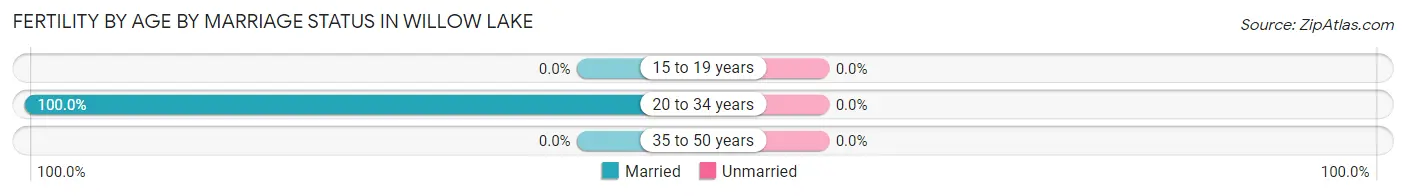
| Age Bracket | Married | Unmarried |
| 15 to 19 years | 0 (0.0%) | 0 (0.0%) |
| 20 to 34 years | 6 (100.0%) | 0 (0.0%) |
| 35 to 50 years | 0 (0.0%) | 0 (0.0%) |
| Total | 6 (100.0%) | 0 (0.0%) |
Fertility by Education in Willow Lake
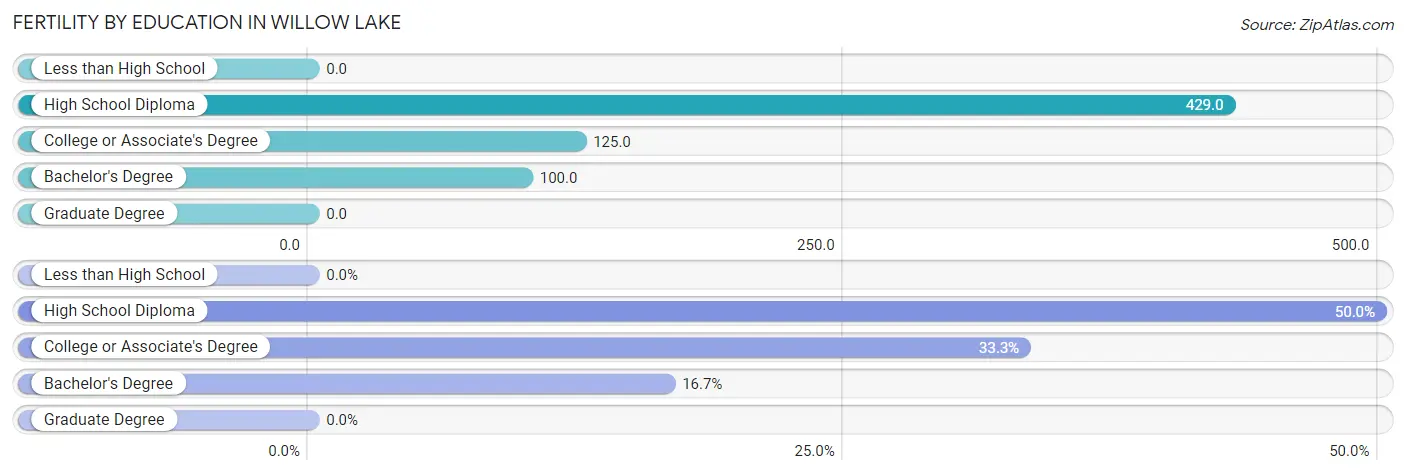
| Educational Attainment | Women with Births | Births / 1,000 Women |
| Less than High School | 0 (0.0%) | 0.0 |
| High School Diploma | 3 (50.0%) | 429.0 |
| College or Associate's Degree | 2 (33.3%) | 125.0 |
| Bachelor's Degree | 1 (16.7%) | 100.0 |
| Graduate Degree | 0 (0.0%) | 0.0 |
| Total | 6 (100.0%) | 109.0 |
Fertility by Education by Marriage Status in Willow Lake
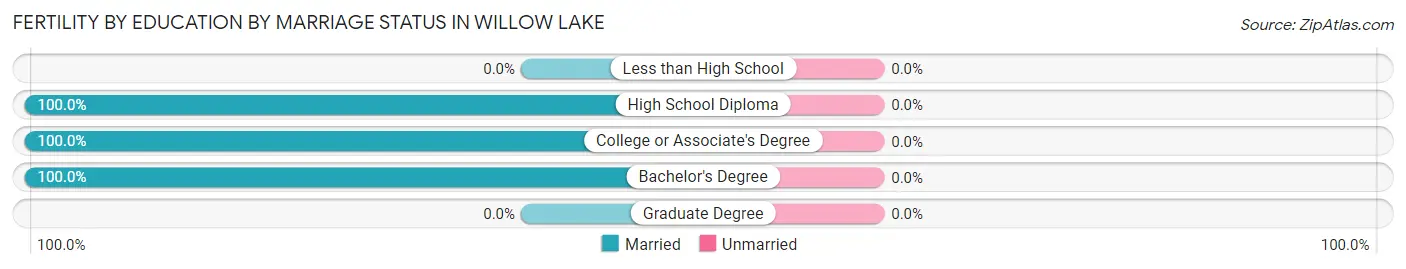
| Educational Attainment | Married | Unmarried |
| Less than High School | 0 (0.0%) | 0 (0.0%) |
| High School Diploma | 3 (100.0%) | 0 (0.0%) |
| College or Associate's Degree | 2 (100.0%) | 0 (0.0%) |
| Bachelor's Degree | 1 (100.0%) | 0 (0.0%) |
| Graduate Degree | 0 (0.0%) | 0 (0.0%) |
| Total | 6 (100.0%) | 0 (0.0%) |
Employment Characteristics in Willow Lake
Employment by Class of Employer in Willow Lake
Among the 109 employed individuals in Willow Lake, private company employees (65 | 59.6%), not-for-profit organizations (18 | 16.5%), and local government employees (12 | 11.0%) make up the most common classes of employment.
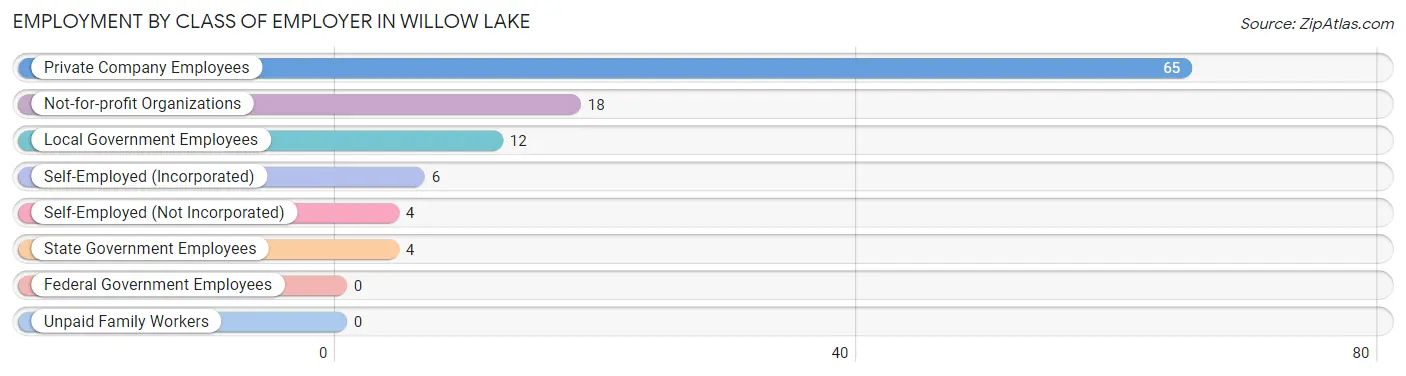
| Employer Class | # Employees | % Employees |
| Private Company Employees | 65 | 59.6% |
| Self-Employed (Incorporated) | 6 | 5.5% |
| Self-Employed (Not Incorporated) | 4 | 3.7% |
| Not-for-profit Organizations | 18 | 16.5% |
| Local Government Employees | 12 | 11.0% |
| State Government Employees | 4 | 3.7% |
| Federal Government Employees | 0 | 0.0% |
| Unpaid Family Workers | 0 | 0.0% |
| Total | 109 | 100.0% |
Employment Status by Age in Willow Lake
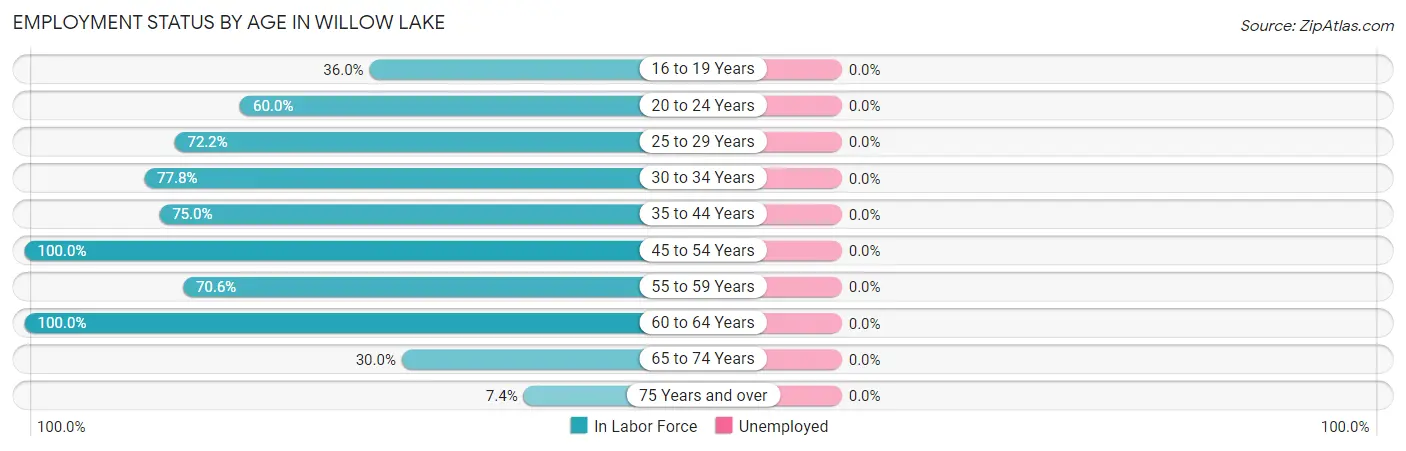
| Age Bracket | In Labor Force | Unemployed |
| 16 to 19 Years | 9 (36.0%) | 0 (0.0%) |
| 20 to 24 Years | 9 (60.0%) | 0 (0.0%) |
| 25 to 29 Years | 13 (72.2%) | 0 (0.0%) |
| 30 to 34 Years | 28 (77.8%) | 0 (0.0%) |
| 35 to 44 Years | 15 (75.0%) | 0 (0.0%) |
| 45 to 54 Years | 7 (100.0%) | 0 (0.0%) |
| 55 to 59 Years | 12 (70.6%) | 0 (0.0%) |
| 60 to 64 Years | 13 (100.0%) | 0 (0.0%) |
| 65 to 74 Years | 6 (30.0%) | 0 (0.0%) |
| 75 Years and over | 2 (7.4%) | 0 (0.0%) |
| Total | 114 (57.6%) | 0 (0.0%) |
Employment Status by Educational Attainment in Willow Lake
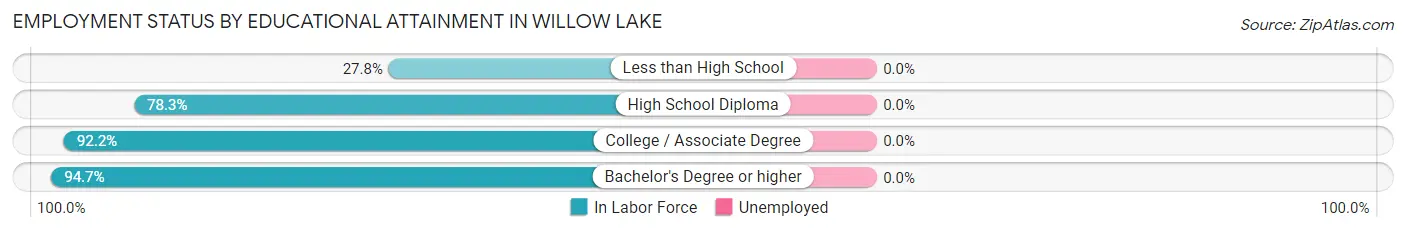
| Educational Attainment | In Labor Force | Unemployed |
| Less than High School | 5 (27.8%) | 0 (0.0%) |
| High School Diploma | 18 (78.3%) | 0 (0.0%) |
| College / Associate Degree | 47 (92.2%) | 0 (0.0%) |
| Bachelor's Degree or higher | 18 (94.7%) | 0 (0.0%) |
| Total | 88 (79.3%) | 0 (0.0%) |
Employment Occupations by Sex in Willow Lake
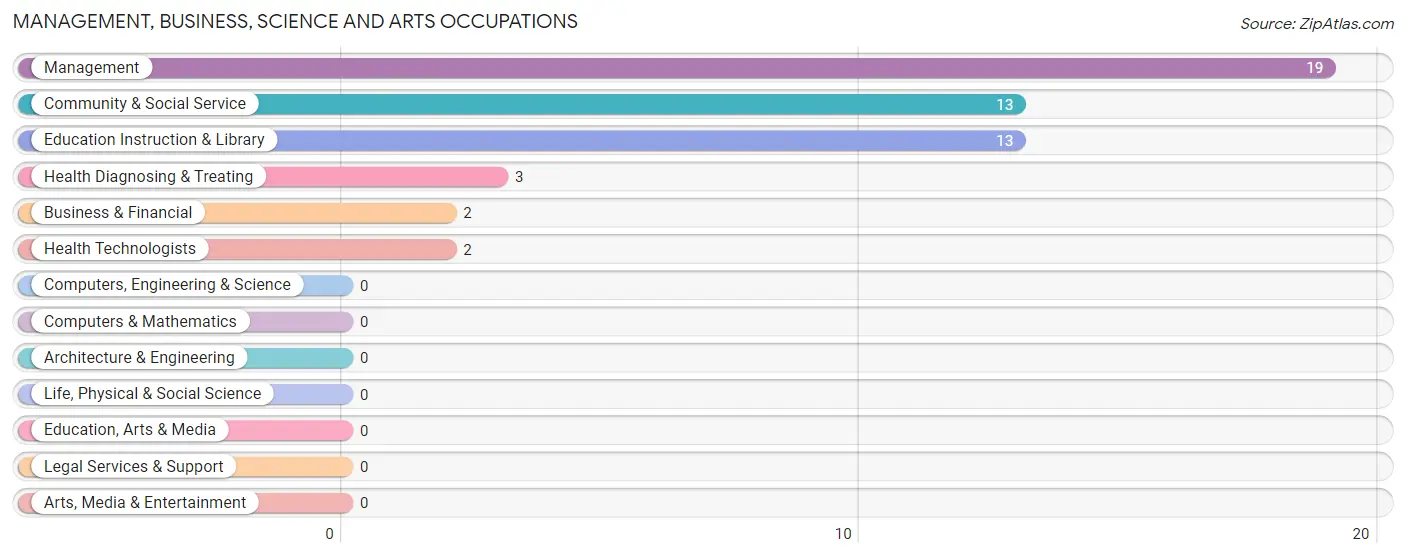
Management, Business, Science and Arts Occupations
The most common Management, Business, Science and Arts occupations in Willow Lake are Management (19 | 16.7%), Community & Social Service (13 | 11.4%), Education Instruction & Library (13 | 11.4%), Health Diagnosing & Treating (3 | 2.6%), and Business & Financial (2 | 1.8%).
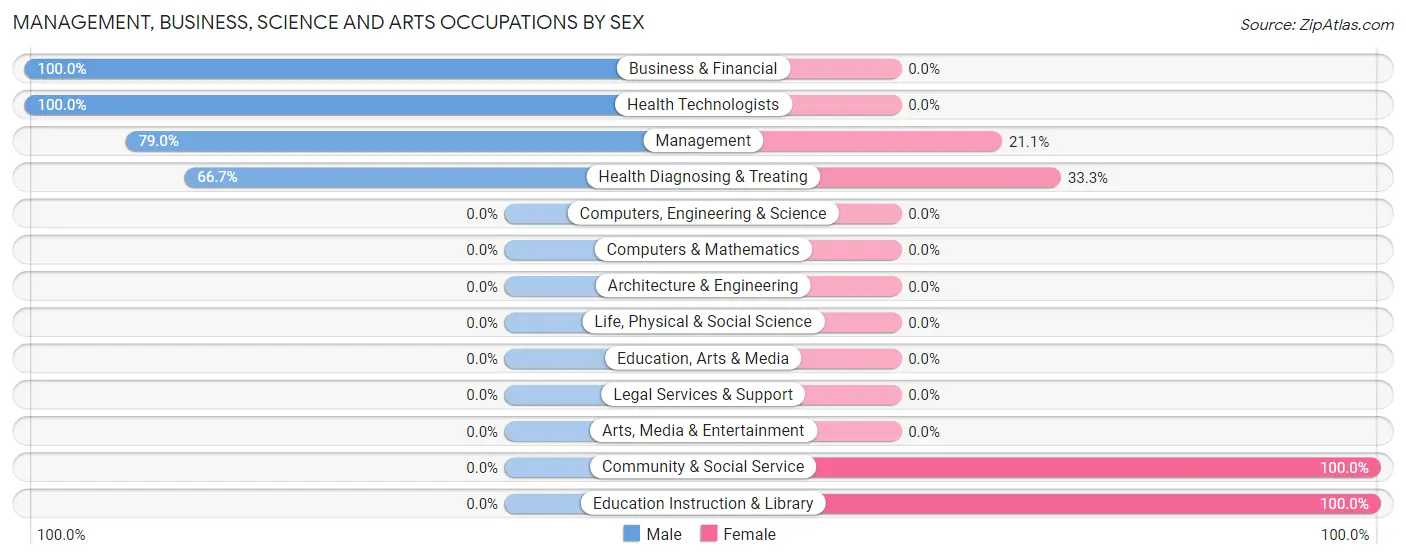
Management, Business, Science and Arts Occupations by Sex
Within the Management, Business, Science and Arts occupations in Willow Lake, the most male-oriented occupations are Business & Financial (100.0%), Health Technologists (100.0%), and Management (78.9%), while the most female-oriented occupations are Community & Social Service (100.0%), Education Instruction & Library (100.0%), and Health Diagnosing & Treating (33.3%).
| Occupation | Male | Female |
| Management | 15 (78.9%) | 4 (21.0%) |
| Business & Financial | 2 (100.0%) | 0 (0.0%) |
| Computers, Engineering & Science | 0 (0.0%) | 0 (0.0%) |
| Computers & Mathematics | 0 (0.0%) | 0 (0.0%) |
| Architecture & Engineering | 0 (0.0%) | 0 (0.0%) |
| Life, Physical & Social Science | 0 (0.0%) | 0 (0.0%) |
| Community & Social Service | 0 (0.0%) | 13 (100.0%) |
| Education, Arts & Media | 0 (0.0%) | 0 (0.0%) |
| Legal Services & Support | 0 (0.0%) | 0 (0.0%) |
| Education Instruction & Library | 0 (0.0%) | 13 (100.0%) |
| Arts, Media & Entertainment | 0 (0.0%) | 0 (0.0%) |
| Health Diagnosing & Treating | 2 (66.7%) | 1 (33.3%) |
| Health Technologists | 2 (100.0%) | 0 (0.0%) |
| Total (Category) | 19 (51.3%) | 18 (48.6%) |
| Total (Overall) | 70 (61.4%) | 44 (38.6%) |
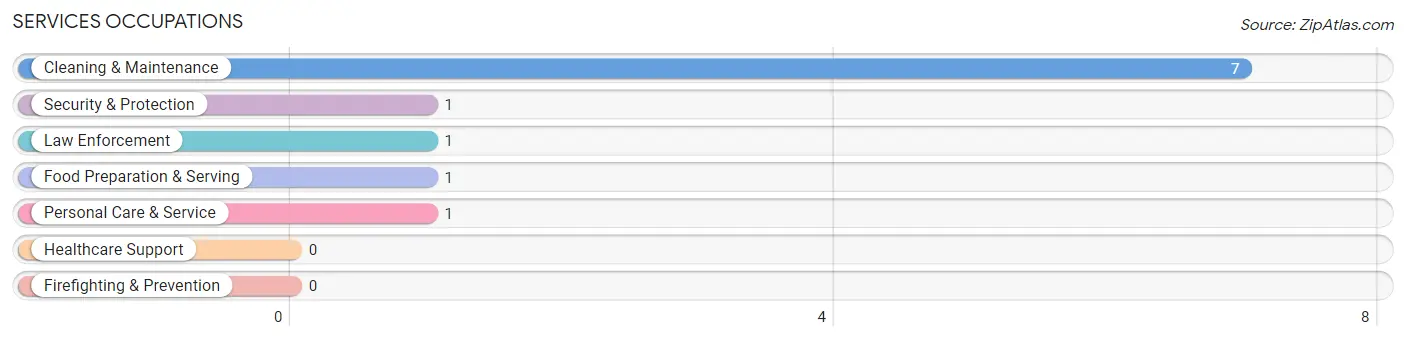
Services Occupations
The most common Services occupations in Willow Lake are Cleaning & Maintenance (7 | 6.1%), Security & Protection (1 | 0.9%), Law Enforcement (1 | 0.9%), Food Preparation & Serving (1 | 0.9%), and Personal Care & Service (1 | 0.9%).
Services Occupations by Sex
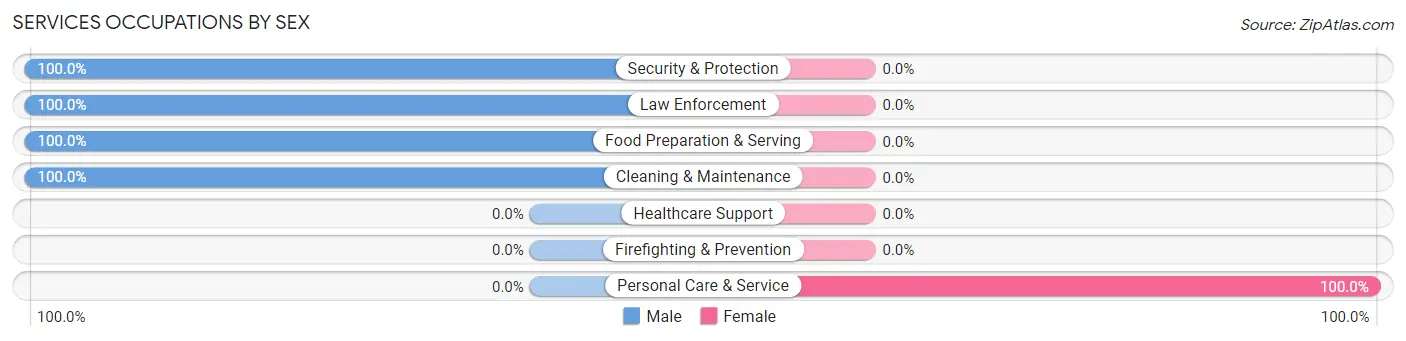
| Occupation | Male | Female |
| Healthcare Support | 0 (0.0%) | 0 (0.0%) |
| Security & Protection | 1 (100.0%) | 0 (0.0%) |
| Firefighting & Prevention | 0 (0.0%) | 0 (0.0%) |
| Law Enforcement | 1 (100.0%) | 0 (0.0%) |
| Food Preparation & Serving | 1 (100.0%) | 0 (0.0%) |
| Cleaning & Maintenance | 7 (100.0%) | 0 (0.0%) |
| Personal Care & Service | 0 (0.0%) | 1 (100.0%) |
| Total (Category) | 9 (90.0%) | 1 (10.0%) |
| Total (Overall) | 70 (61.4%) | 44 (38.6%) |
Sales and Office Occupations
The most common Sales and Office occupations in Willow Lake are Sales & Related (15 | 13.2%), and Office & Administration (15 | 13.2%).
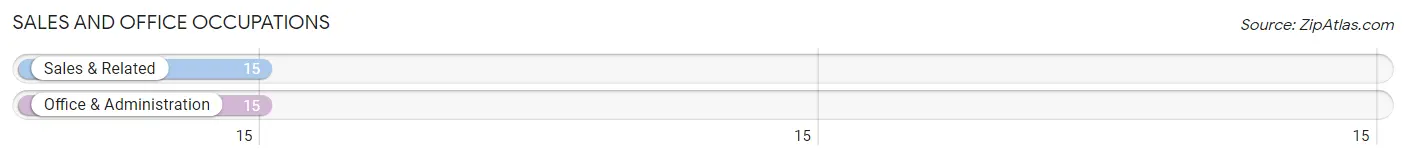
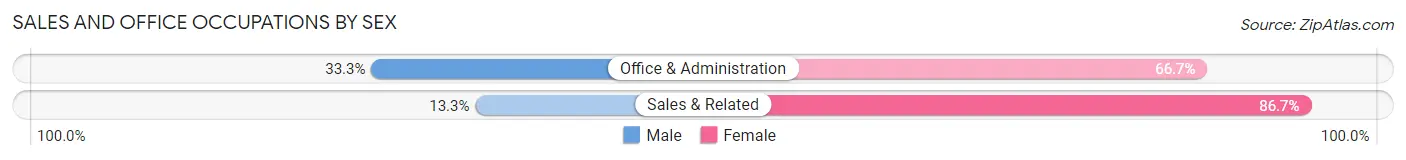
Sales and Office Occupations by Sex
| Occupation | Male | Female |
| Sales & Related | 2 (13.3%) | 13 (86.7%) |
| Office & Administration | 5 (33.3%) | 10 (66.7%) |
| Total (Category) | 7 (23.3%) | 23 (76.7%) |
| Total (Overall) | 70 (61.4%) | 44 (38.6%) |
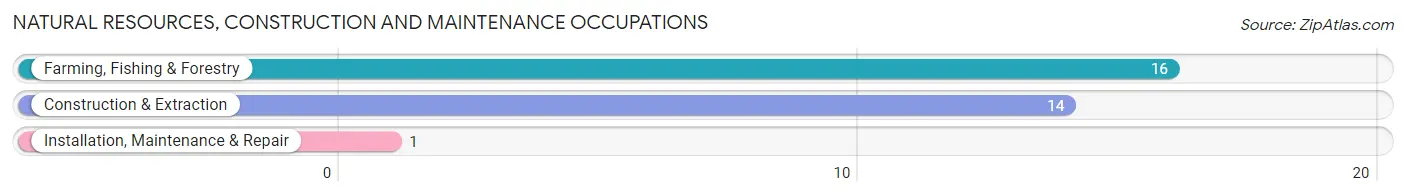
Natural Resources, Construction and Maintenance Occupations
The most common Natural Resources, Construction and Maintenance occupations in Willow Lake are Farming, Fishing & Forestry (16 | 14.0%), Construction & Extraction (14 | 12.3%), and Installation, Maintenance & Repair (1 | 0.9%).
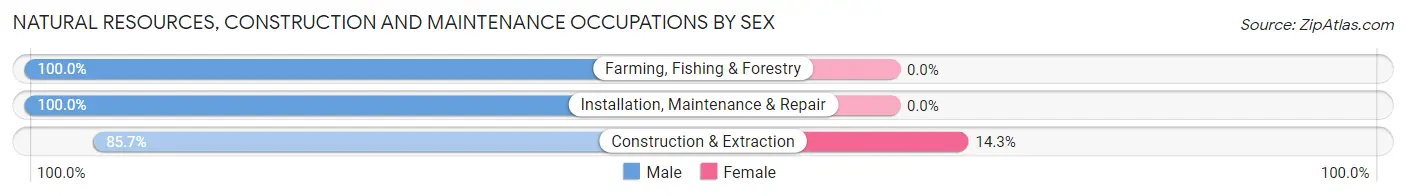
Natural Resources, Construction and Maintenance Occupations by Sex
| Occupation | Male | Female |
| Farming, Fishing & Forestry | 16 (100.0%) | 0 (0.0%) |
| Construction & Extraction | 12 (85.7%) | 2 (14.3%) |
| Installation, Maintenance & Repair | 1 (100.0%) | 0 (0.0%) |
| Total (Category) | 29 (93.5%) | 2 (6.5%) |
| Total (Overall) | 70 (61.4%) | 44 (38.6%) |
Production, Transportation and Moving Occupations
The most common Production, Transportation and Moving occupations in Willow Lake are Production (3 | 2.6%), Material Moving (2 | 1.8%), and Transportation (1 | 0.9%).
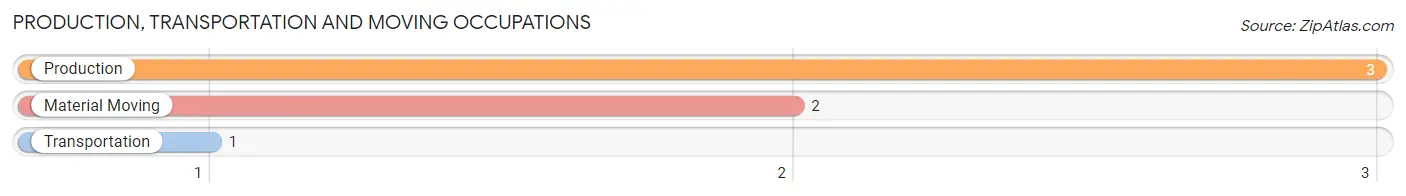
Production, Transportation and Moving Occupations by Sex
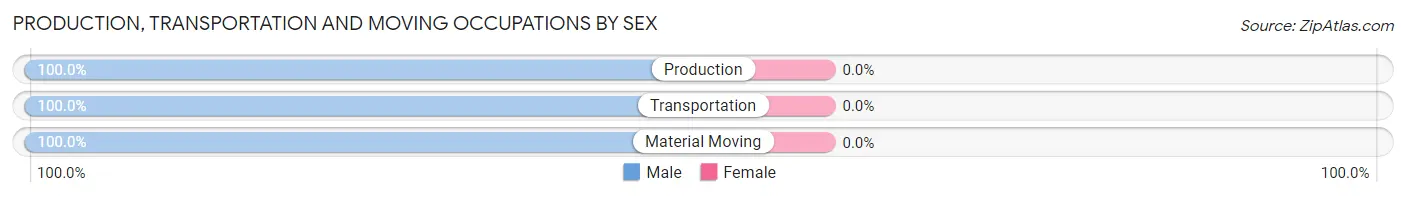
| Occupation | Male | Female |
| Production | 3 (100.0%) | 0 (0.0%) |
| Transportation | 1 (100.0%) | 0 (0.0%) |
| Material Moving | 2 (100.0%) | 0 (0.0%) |
| Total (Category) | 6 (100.0%) | 0 (0.0%) |
| Total (Overall) | 70 (61.4%) | 44 (38.6%) |
Employment Industries by Sex in Willow Lake
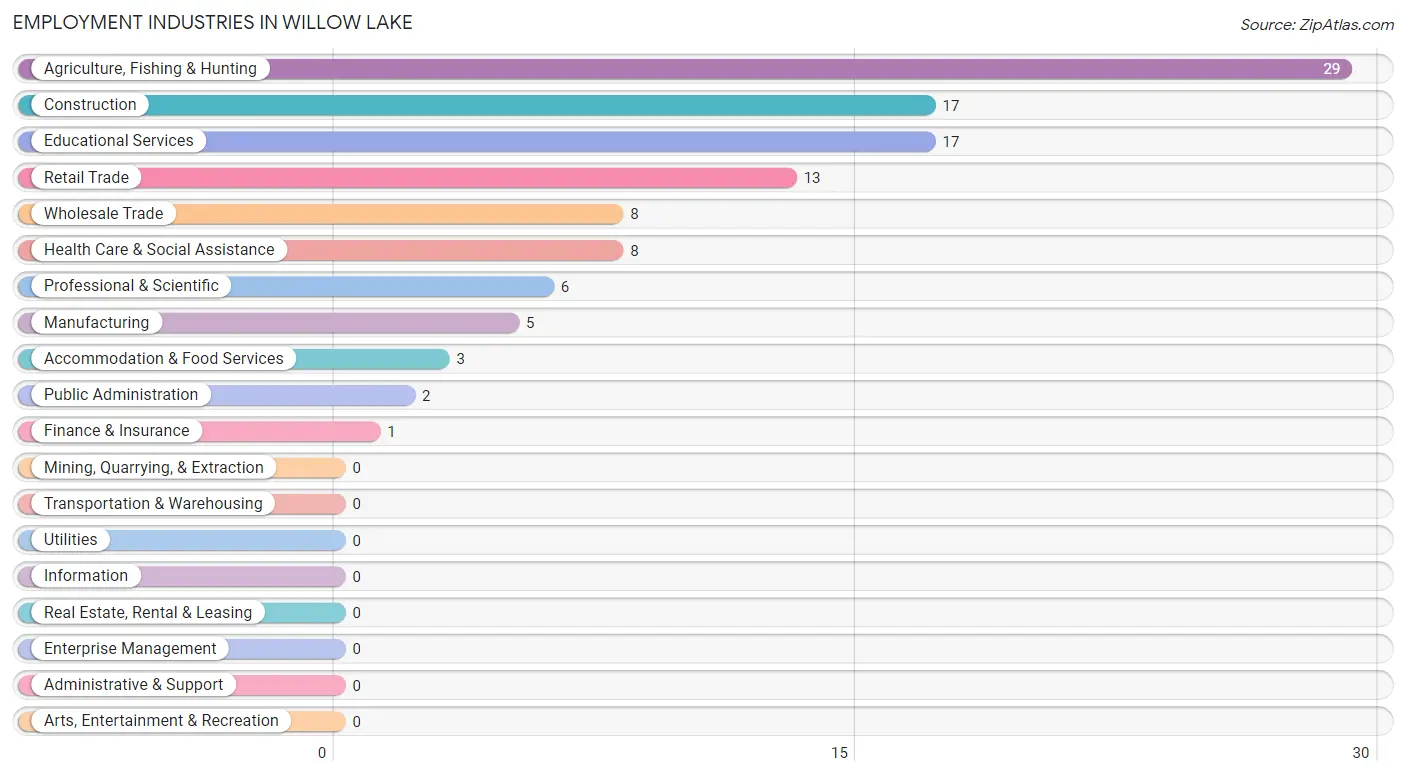
Employment Industries in Willow Lake
The major employment industries in Willow Lake include Agriculture, Fishing & Hunting (29 | 25.4%), Construction (17 | 14.9%), Educational Services (17 | 14.9%), Retail Trade (13 | 11.4%), and Wholesale Trade (8 | 7.0%).
Employment Industries by Sex in Willow Lake
The Willow Lake industries that see more men than women are Agriculture, Fishing & Hunting (100.0%), Manufacturing (100.0%), and Wholesale Trade (100.0%), whereas the industries that tend to have a higher number of women are Retail Trade (100.0%), Finance & Insurance (100.0%), and Professional & Scientific (100.0%).
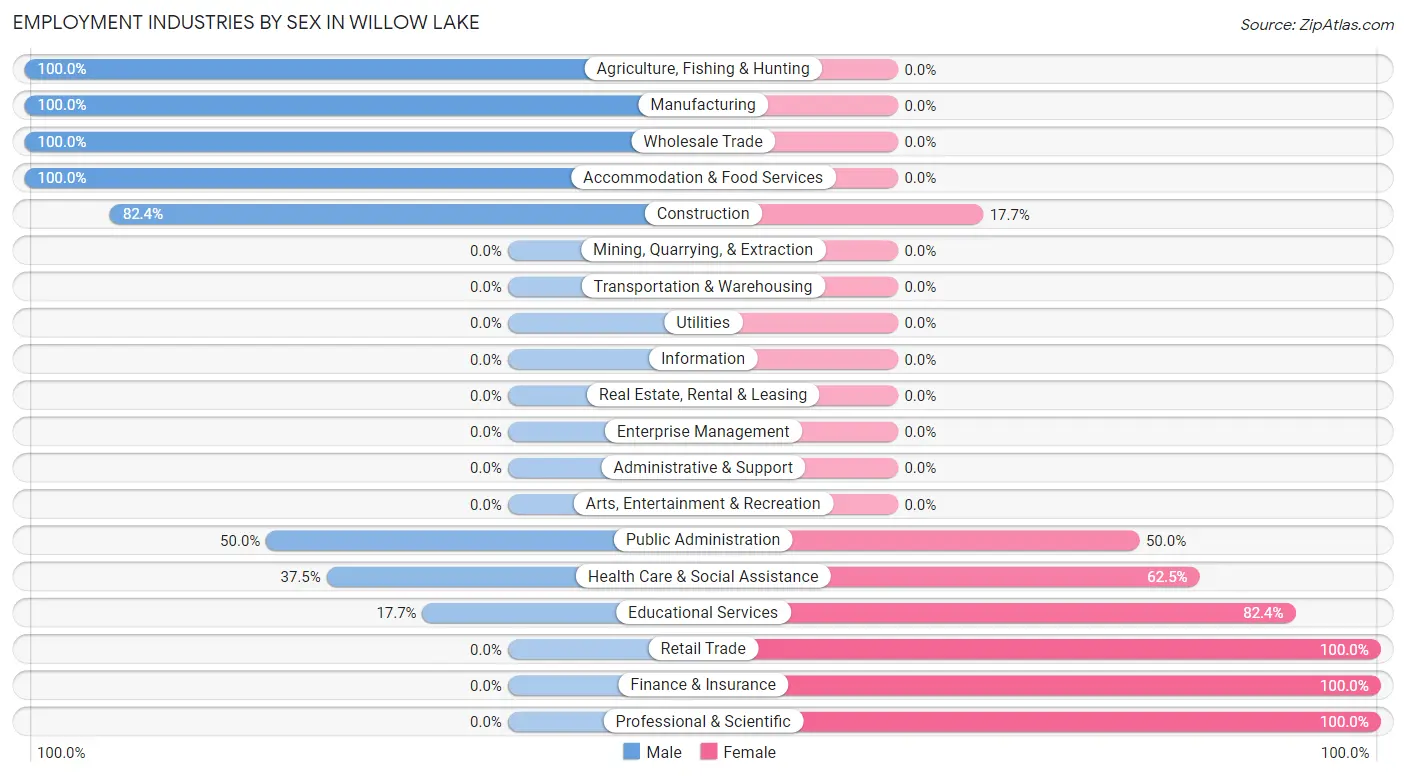
| Industry | Male | Female |
| Agriculture, Fishing & Hunting | 29 (100.0%) | 0 (0.0%) |
| Mining, Quarrying, & Extraction | 0 (0.0%) | 0 (0.0%) |
| Construction | 14 (82.4%) | 3 (17.6%) |
| Manufacturing | 5 (100.0%) | 0 (0.0%) |
| Wholesale Trade | 8 (100.0%) | 0 (0.0%) |
| Retail Trade | 0 (0.0%) | 13 (100.0%) |
| Transportation & Warehousing | 0 (0.0%) | 0 (0.0%) |
| Utilities | 0 (0.0%) | 0 (0.0%) |
| Information | 0 (0.0%) | 0 (0.0%) |
| Finance & Insurance | 0 (0.0%) | 1 (100.0%) |
| Real Estate, Rental & Leasing | 0 (0.0%) | 0 (0.0%) |
| Professional & Scientific | 0 (0.0%) | 6 (100.0%) |
| Enterprise Management | 0 (0.0%) | 0 (0.0%) |
| Administrative & Support | 0 (0.0%) | 0 (0.0%) |
| Educational Services | 3 (17.6%) | 14 (82.4%) |
| Health Care & Social Assistance | 3 (37.5%) | 5 (62.5%) |
| Arts, Entertainment & Recreation | 0 (0.0%) | 0 (0.0%) |
| Accommodation & Food Services | 3 (100.0%) | 0 (0.0%) |
| Public Administration | 1 (50.0%) | 1 (50.0%) |
| Total | 70 (61.4%) | 44 (38.6%) |
Education in Willow Lake
School Enrollment in Willow Lake
The most common levels of schooling among the 123 students in Willow Lake are high school (45 | 36.6%), elementary school (31 | 25.2%), and middle school (19 | 15.4%).
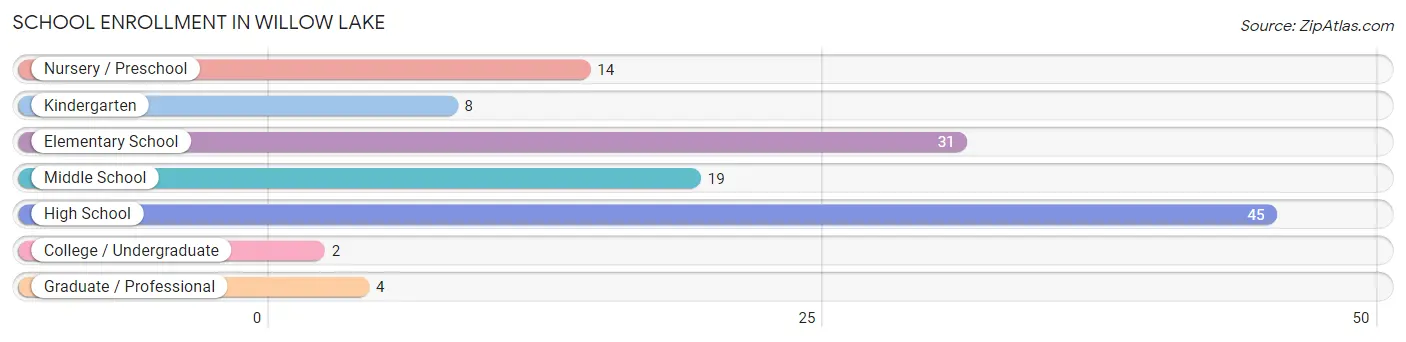
| School Level | # Students | % Students |
| Nursery / Preschool | 14 | 11.4% |
| Kindergarten | 8 | 6.5% |
| Elementary School | 31 | 25.2% |
| Middle School | 19 | 15.4% |
| High School | 45 | 36.6% |
| College / Undergraduate | 2 | 1.6% |
| Graduate / Professional | 4 | 3.3% |
| Total | 123 | 100.0% |
School Enrollment by Age by Funding Source in Willow Lake
Out of a total of 123 students who are enrolled in schools in Willow Lake, 2 (1.6%) attend a private institution, while the remaining 121 (98.4%) are enrolled in public schools. The age group of 20 to 24 year olds has the highest likelihood of being enrolled in private schools, with 2 (100.0% in the age bracket) enrolled. Conversely, the age group of 3 to 4 year olds has the lowest likelihood of being enrolled in a private school, with 14 (100.0% in the age bracket) attending a public institution.
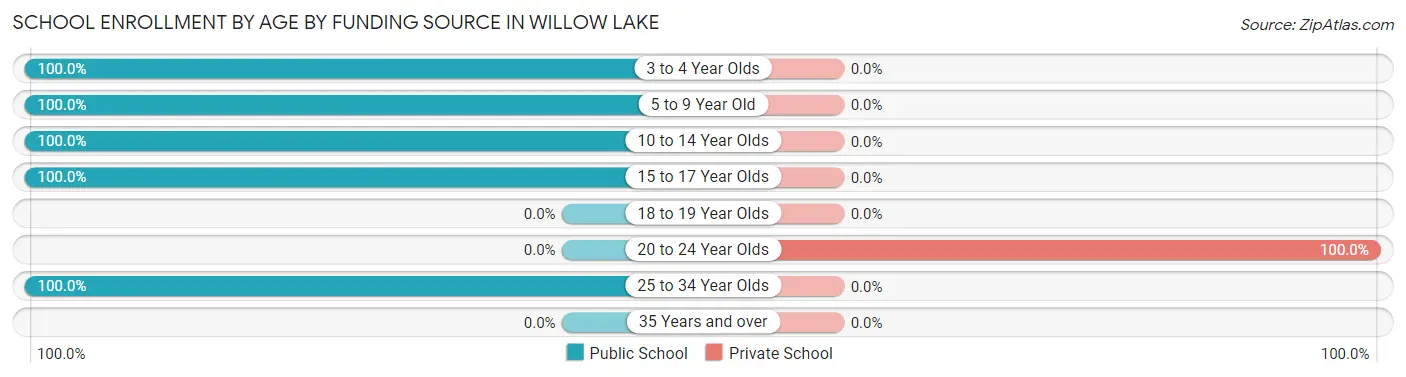
| Age Bracket | Public School | Private School |
| 3 to 4 Year Olds | 14 (100.0%) | 0 (0.0%) |
| 5 to 9 Year Old | 30 (100.0%) | 0 (0.0%) |
| 10 to 14 Year Olds | 46 (100.0%) | 0 (0.0%) |
| 15 to 17 Year Olds | 27 (100.0%) | 0 (0.0%) |
| 18 to 19 Year Olds | 0 (0.0%) | 0 (0.0%) |
| 20 to 24 Year Olds | 0 (0.0%) | 2 (100.0%) |
| 25 to 34 Year Olds | 4 (100.0%) | 0 (0.0%) |
| 35 Years and over | 0 (0.0%) | 0 (0.0%) |
| Total | 121 (98.4%) | 2 (1.6%) |
Educational Attainment by Field of Study in Willow Lake
Computers & mathematics (14 | 48.3%), education (6 | 20.7%), multidisciplinary studies (2 | 6.9%), science & technology (2 | 6.9%), and literature & languages (2 | 6.9%) are the most common fields of study among 29 individuals in Willow Lake who have obtained a bachelor's degree or higher.
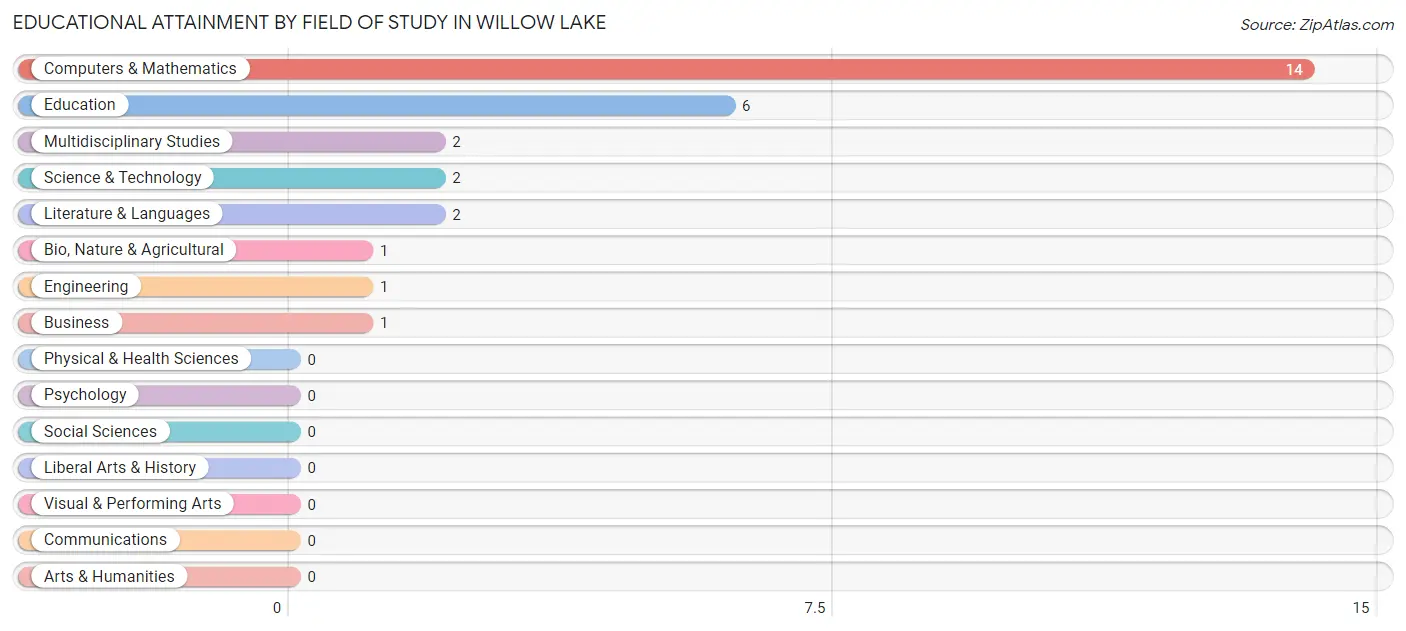
| Field of Study | # Graduates | % Graduates |
| Computers & Mathematics | 14 | 48.3% |
| Bio, Nature & Agricultural | 1 | 3.5% |
| Physical & Health Sciences | 0 | 0.0% |
| Psychology | 0 | 0.0% |
| Social Sciences | 0 | 0.0% |
| Engineering | 1 | 3.5% |
| Multidisciplinary Studies | 2 | 6.9% |
| Science & Technology | 2 | 6.9% |
| Business | 1 | 3.5% |
| Education | 6 | 20.7% |
| Literature & Languages | 2 | 6.9% |
| Liberal Arts & History | 0 | 0.0% |
| Visual & Performing Arts | 0 | 0.0% |
| Communications | 0 | 0.0% |
| Arts & Humanities | 0 | 0.0% |
| Total | 29 | 100.0% |
Transportation & Commute in Willow Lake
Vehicle Availability by Sex in Willow Lake
The most prevalent vehicle ownership categories in Willow Lake are males with 2 vehicles (36, accounting for 55.4%) and females with 2 vehicles (24, making up 81.8%).
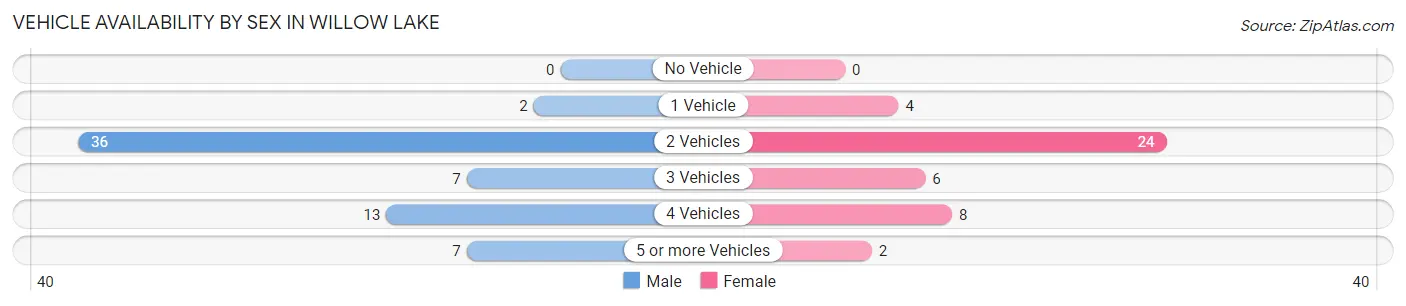
| Vehicles Available | Male | Female |
| No Vehicle | 0 (0.0%) | 0 (0.0%) |
| 1 Vehicle | 2 (3.1%) | 4 (9.1%) |
| 2 Vehicles | 36 (55.4%) | 24 (54.5%) |
| 3 Vehicles | 7 (10.8%) | 6 (13.6%) |
| 4 Vehicles | 13 (20.0%) | 8 (18.2%) |
| 5 or more Vehicles | 7 (10.8%) | 2 (4.5%) |
| Total | 65 (100.0%) | 44 (100.0%) |
Commute Time in Willow Lake
The most frequently occuring commute durations in Willow Lake are 10 to 14 minutes (25 commuters, 22.9%), less than 5 minutes (19 commuters, 17.4%), and 5 to 9 minutes (18 commuters, 16.5%).
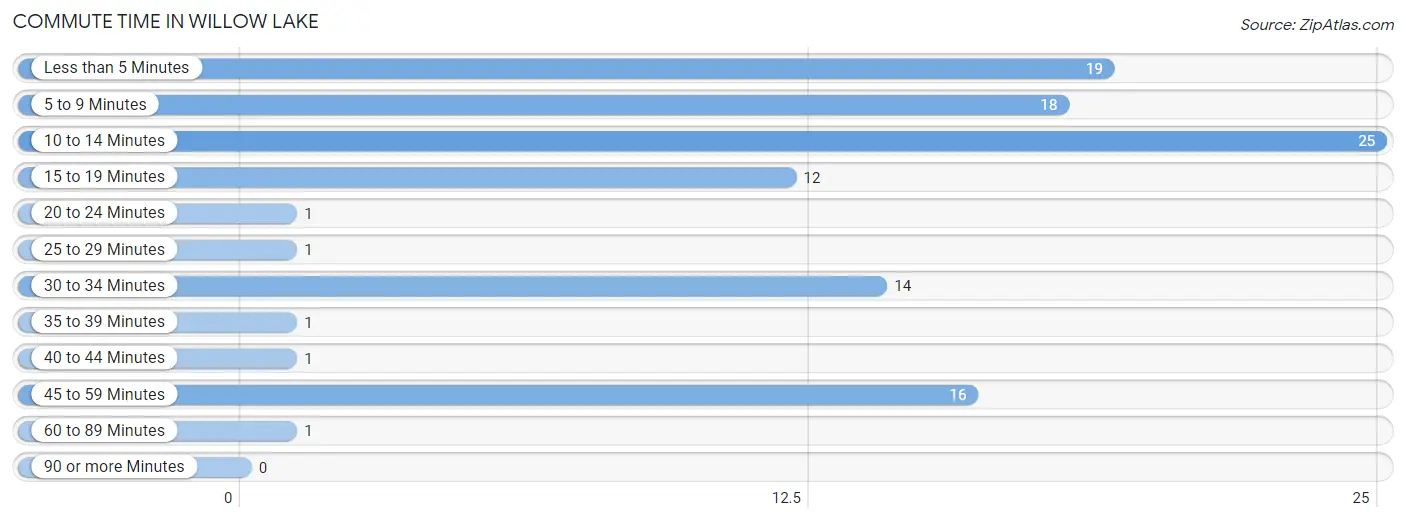
| Commute Time | # Commuters | % Commuters |
| Less than 5 Minutes | 19 | 17.4% |
| 5 to 9 Minutes | 18 | 16.5% |
| 10 to 14 Minutes | 25 | 22.9% |
| 15 to 19 Minutes | 12 | 11.0% |
| 20 to 24 Minutes | 1 | 0.9% |
| 25 to 29 Minutes | 1 | 0.9% |
| 30 to 34 Minutes | 14 | 12.8% |
| 35 to 39 Minutes | 1 | 0.9% |
| 40 to 44 Minutes | 1 | 0.9% |
| 45 to 59 Minutes | 16 | 14.7% |
| 60 to 89 Minutes | 1 | 0.9% |
| 90 or more Minutes | 0 | 0.0% |
Commute Time by Sex in Willow Lake
The most common commute times in Willow Lake are less than 5 minutes (17 commuters, 26.2%) for males and 10 to 14 minutes (14 commuters, 31.8%) for females.
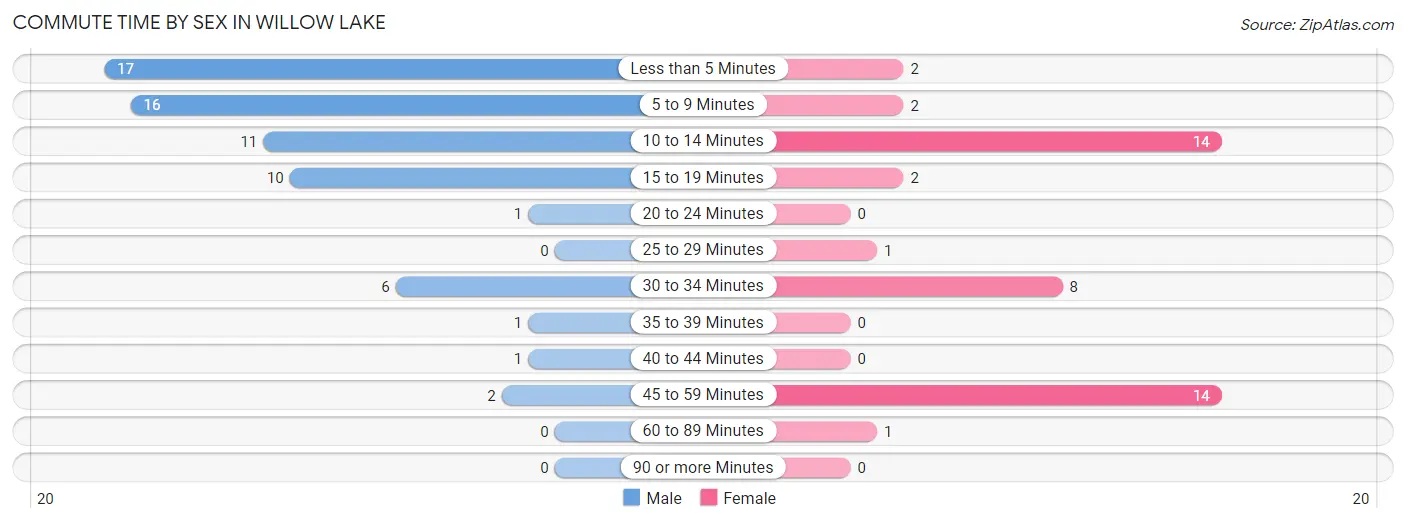
| Commute Time | Male | Female |
| Less than 5 Minutes | 17 (26.2%) | 2 (4.5%) |
| 5 to 9 Minutes | 16 (24.6%) | 2 (4.5%) |
| 10 to 14 Minutes | 11 (16.9%) | 14 (31.8%) |
| 15 to 19 Minutes | 10 (15.4%) | 2 (4.5%) |
| 20 to 24 Minutes | 1 (1.5%) | 0 (0.0%) |
| 25 to 29 Minutes | 0 (0.0%) | 1 (2.3%) |
| 30 to 34 Minutes | 6 (9.2%) | 8 (18.2%) |
| 35 to 39 Minutes | 1 (1.5%) | 0 (0.0%) |
| 40 to 44 Minutes | 1 (1.5%) | 0 (0.0%) |
| 45 to 59 Minutes | 2 (3.1%) | 14 (31.8%) |
| 60 to 89 Minutes | 0 (0.0%) | 1 (2.3%) |
| 90 or more Minutes | 0 (0.0%) | 0 (0.0%) |
Time of Departure to Work by Sex in Willow Lake
The most frequent times of departure to work in Willow Lake are 7:30 AM to 7:59 AM (14, 21.5%) for males and 7:30 AM to 7:59 AM (17, 38.6%) for females.
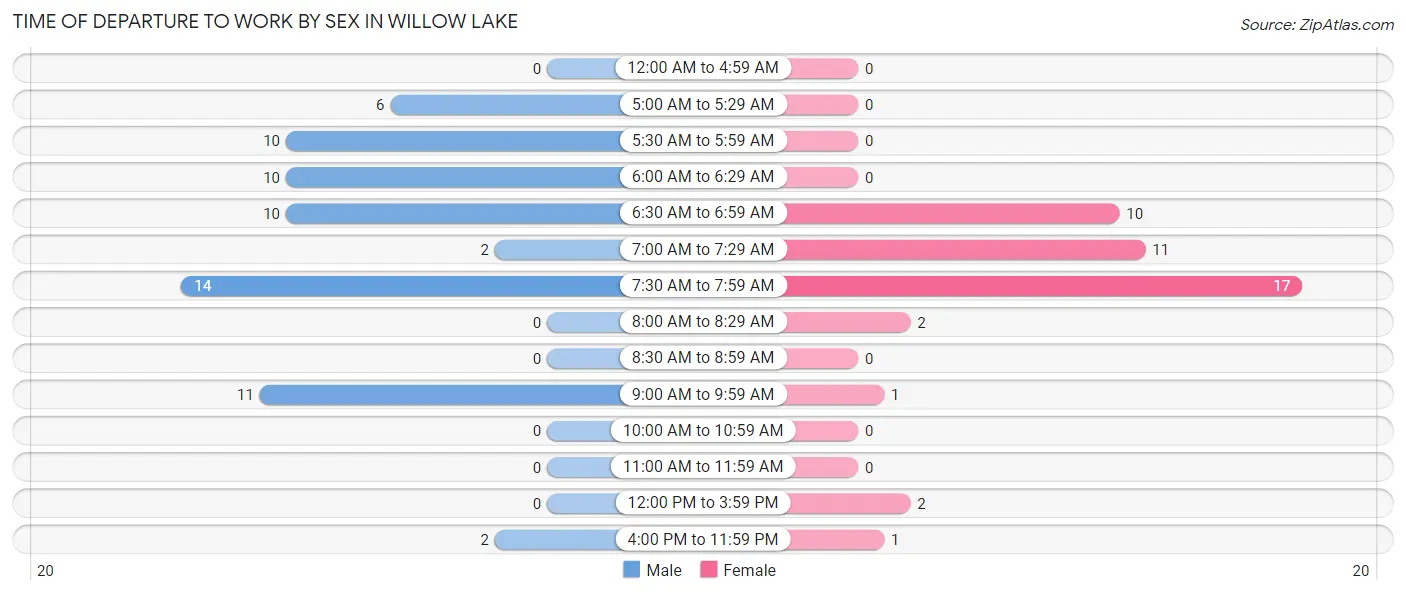
| Time of Departure | Male | Female |
| 12:00 AM to 4:59 AM | 0 (0.0%) | 0 (0.0%) |
| 5:00 AM to 5:29 AM | 6 (9.2%) | 0 (0.0%) |
| 5:30 AM to 5:59 AM | 10 (15.4%) | 0 (0.0%) |
| 6:00 AM to 6:29 AM | 10 (15.4%) | 0 (0.0%) |
| 6:30 AM to 6:59 AM | 10 (15.4%) | 10 (22.7%) |
| 7:00 AM to 7:29 AM | 2 (3.1%) | 11 (25.0%) |
| 7:30 AM to 7:59 AM | 14 (21.5%) | 17 (38.6%) |
| 8:00 AM to 8:29 AM | 0 (0.0%) | 2 (4.5%) |
| 8:30 AM to 8:59 AM | 0 (0.0%) | 0 (0.0%) |
| 9:00 AM to 9:59 AM | 11 (16.9%) | 1 (2.3%) |
| 10:00 AM to 10:59 AM | 0 (0.0%) | 0 (0.0%) |
| 11:00 AM to 11:59 AM | 0 (0.0%) | 0 (0.0%) |
| 12:00 PM to 3:59 PM | 0 (0.0%) | 2 (4.5%) |
| 4:00 PM to 11:59 PM | 2 (3.1%) | 1 (2.3%) |
| Total | 65 (100.0%) | 44 (100.0%) |
Housing Occupancy in Willow Lake
Occupancy by Ownership in Willow Lake
Of the total 99 dwellings in Willow Lake, owner-occupied units account for 58 (58.6%), while renter-occupied units make up 41 (41.4%).
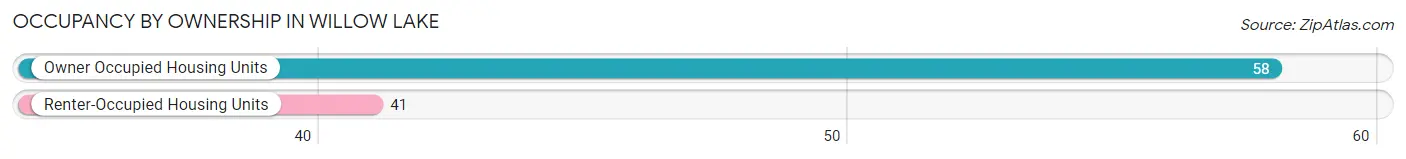
| Occupancy | # Housing Units | % Housing Units |
| Owner Occupied Housing Units | 58 | 58.6% |
| Renter-Occupied Housing Units | 41 | 41.4% |
| Total Occupied Housing Units | 99 | 100.0% |
Occupancy by Household Size in Willow Lake
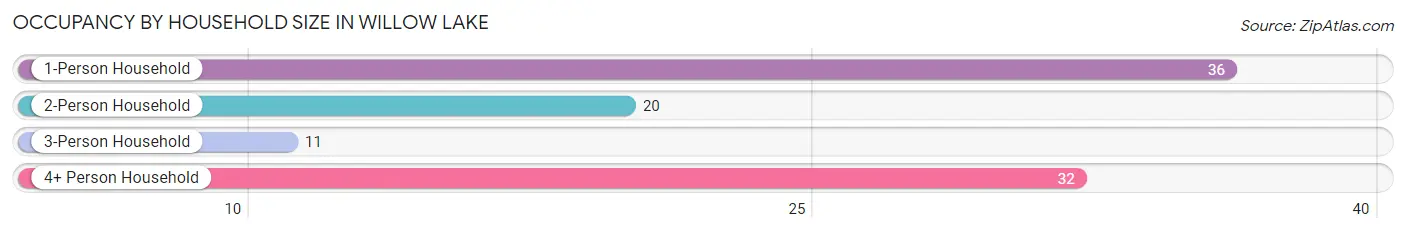
| Household Size | # Housing Units | % Housing Units |
| 1-Person Household | 36 | 36.4% |
| 2-Person Household | 20 | 20.2% |
| 3-Person Household | 11 | 11.1% |
| 4+ Person Household | 32 | 32.3% |
| Total Housing Units | 99 | 100.0% |
Occupancy by Ownership by Household Size in Willow Lake
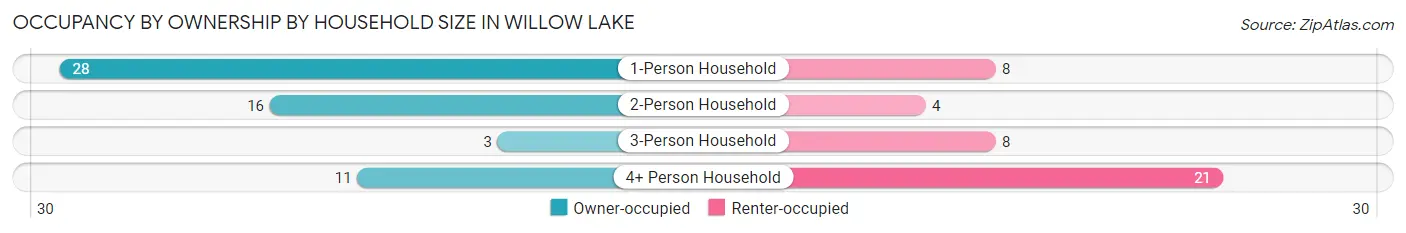
| Household Size | Owner-occupied | Renter-occupied |
| 1-Person Household | 28 (77.8%) | 8 (22.2%) |
| 2-Person Household | 16 (80.0%) | 4 (20.0%) |
| 3-Person Household | 3 (27.3%) | 8 (72.7%) |
| 4+ Person Household | 11 (34.4%) | 21 (65.6%) |
| Total Housing Units | 58 (58.6%) | 41 (41.4%) |
Occupancy by Educational Attainment in Willow Lake
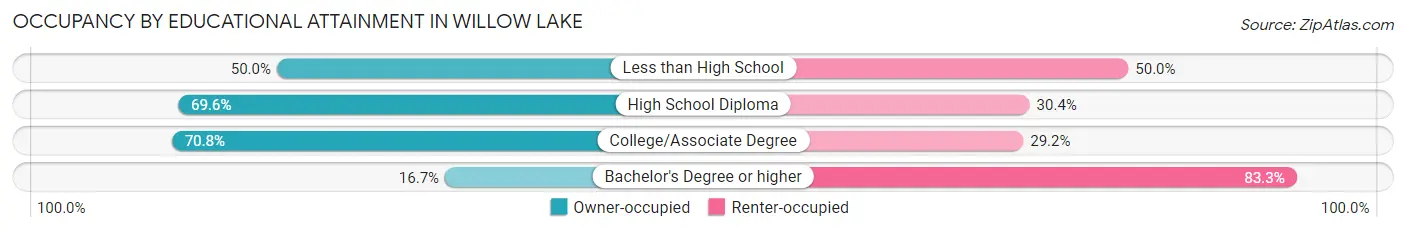
| Household Size | Owner-occupied | Renter-occupied |
| Less than High School | 5 (50.0%) | 5 (50.0%) |
| High School Diploma | 16 (69.6%) | 7 (30.4%) |
| College/Associate Degree | 34 (70.8%) | 14 (29.2%) |
| Bachelor's Degree or higher | 3 (16.7%) | 15 (83.3%) |
Occupancy by Age of Householder in Willow Lake
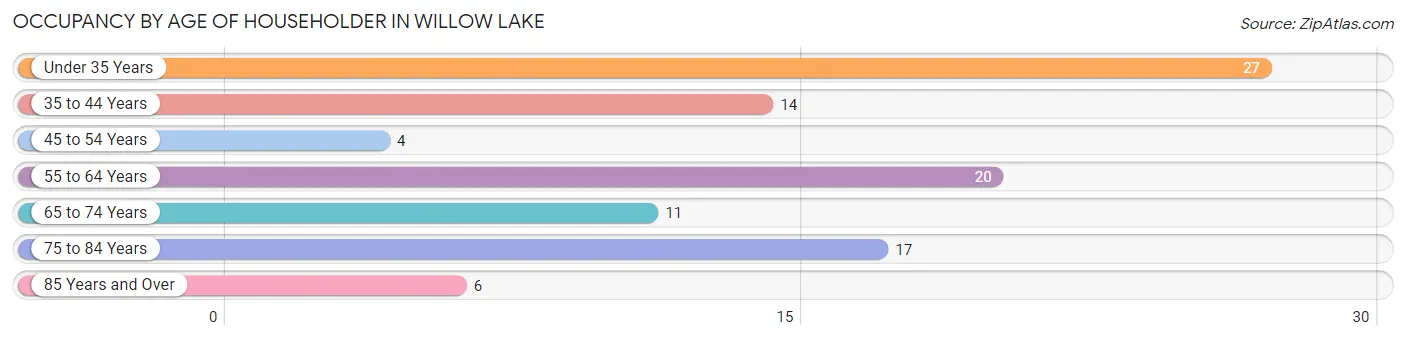
| Age Bracket | # Households | % Households |
| Under 35 Years | 27 | 27.3% |
| 35 to 44 Years | 14 | 14.1% |
| 45 to 54 Years | 4 | 4.0% |
| 55 to 64 Years | 20 | 20.2% |
| 65 to 74 Years | 11 | 11.1% |
| 75 to 84 Years | 17 | 17.2% |
| 85 Years and Over | 6 | 6.1% |
| Total | 99 | 100.0% |
Housing Finances in Willow Lake
Median Income by Occupancy in Willow Lake
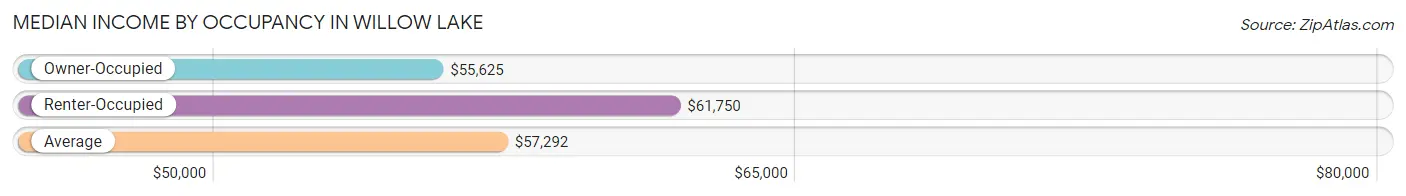
| Occupancy Type | # Households | Median Income |
| Owner-Occupied | 58 (58.6%) | $55,625 |
| Renter-Occupied | 41 (41.4%) | $61,750 |
| Average | 99 (100.0%) | $57,292 |
Occupancy by Householder Income Bracket in Willow Lake
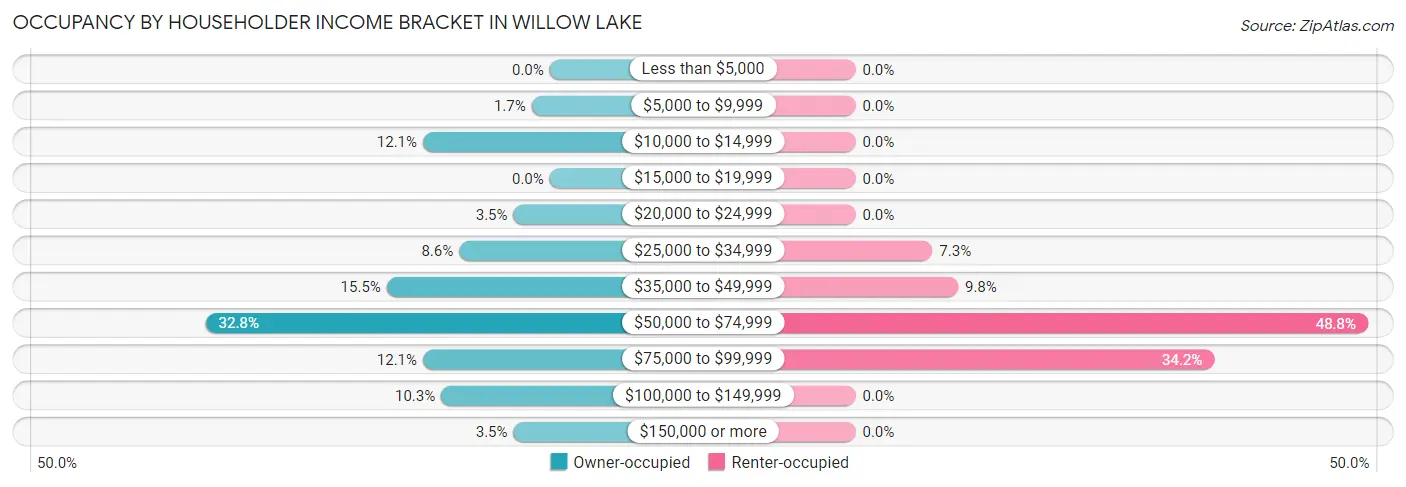
| Income Bracket | Owner-occupied | Renter-occupied |
| Less than $5,000 | 0 (0.0%) | 0 (0.0%) |
| $5,000 to $9,999 | 1 (1.7%) | 0 (0.0%) |
| $10,000 to $14,999 | 7 (12.1%) | 0 (0.0%) |
| $15,000 to $19,999 | 0 (0.0%) | 0 (0.0%) |
| $20,000 to $24,999 | 2 (3.5%) | 0 (0.0%) |
| $25,000 to $34,999 | 5 (8.6%) | 3 (7.3%) |
| $35,000 to $49,999 | 9 (15.5%) | 4 (9.8%) |
| $50,000 to $74,999 | 19 (32.8%) | 20 (48.8%) |
| $75,000 to $99,999 | 7 (12.1%) | 14 (34.2%) |
| $100,000 to $149,999 | 6 (10.3%) | 0 (0.0%) |
| $150,000 or more | 2 (3.5%) | 0 (0.0%) |
| Total | 58 (100.0%) | 41 (100.0%) |
Monthly Housing Cost Tiers in Willow Lake
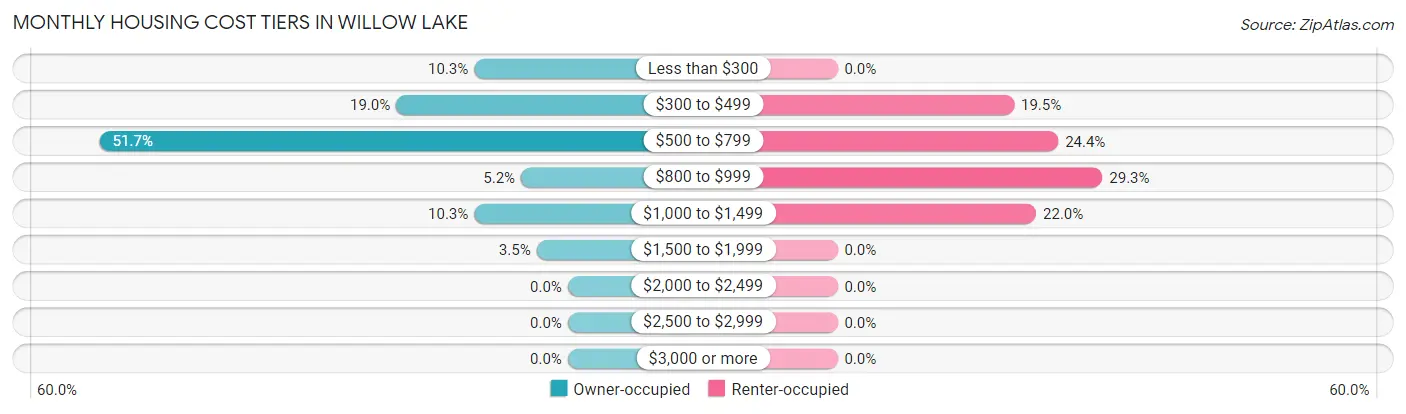
| Monthly Cost | Owner-occupied | Renter-occupied |
| Less than $300 | 6 (10.3%) | 0 (0.0%) |
| $300 to $499 | 11 (19.0%) | 8 (19.5%) |
| $500 to $799 | 30 (51.7%) | 10 (24.4%) |
| $800 to $999 | 3 (5.2%) | 12 (29.3%) |
| $1,000 to $1,499 | 6 (10.3%) | 9 (22.0%) |
| $1,500 to $1,999 | 2 (3.5%) | 0 (0.0%) |
| $2,000 to $2,499 | 0 (0.0%) | 0 (0.0%) |
| $2,500 to $2,999 | 0 (0.0%) | 0 (0.0%) |
| $3,000 or more | 0 (0.0%) | 0 (0.0%) |
| Total | 58 (100.0%) | 41 (100.0%) |
Physical Housing Characteristics in Willow Lake
Housing Structures in Willow Lake
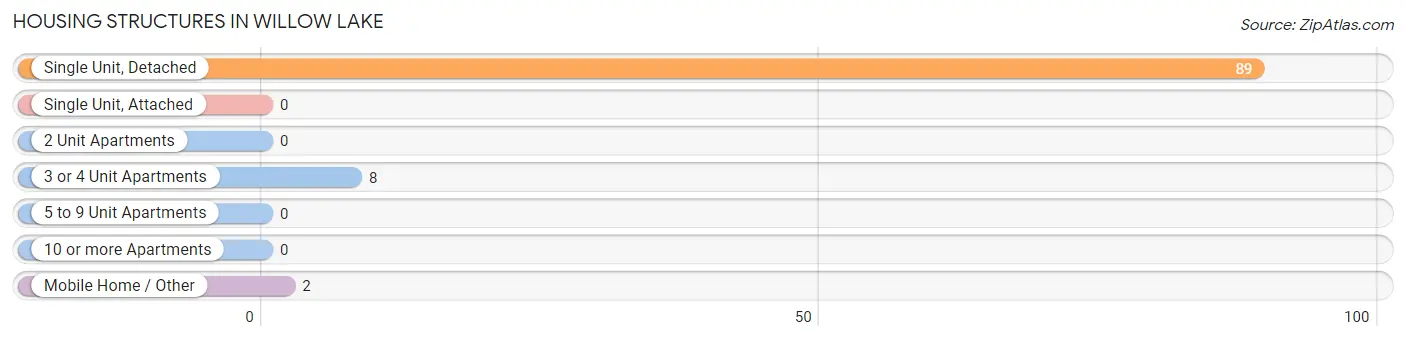
| Structure Type | # Housing Units | % Housing Units |
| Single Unit, Detached | 89 | 89.9% |
| Single Unit, Attached | 0 | 0.0% |
| 2 Unit Apartments | 0 | 0.0% |
| 3 or 4 Unit Apartments | 8 | 8.1% |
| 5 to 9 Unit Apartments | 0 | 0.0% |
| 10 or more Apartments | 0 | 0.0% |
| Mobile Home / Other | 2 | 2.0% |
| Total | 99 | 100.0% |
Housing Structures by Occupancy in Willow Lake
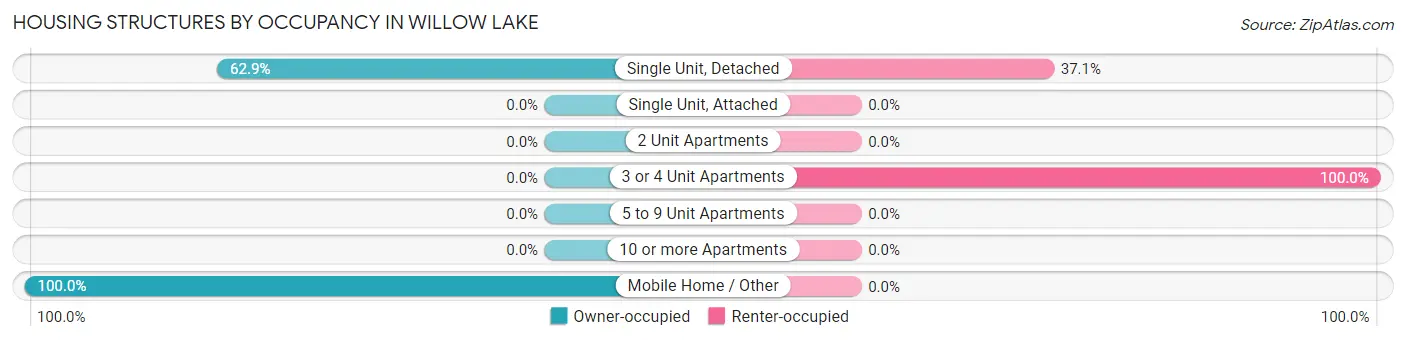
| Structure Type | Owner-occupied | Renter-occupied |
| Single Unit, Detached | 56 (62.9%) | 33 (37.1%) |
| Single Unit, Attached | 0 (0.0%) | 0 (0.0%) |
| 2 Unit Apartments | 0 (0.0%) | 0 (0.0%) |
| 3 or 4 Unit Apartments | 0 (0.0%) | 8 (100.0%) |
| 5 to 9 Unit Apartments | 0 (0.0%) | 0 (0.0%) |
| 10 or more Apartments | 0 (0.0%) | 0 (0.0%) |
| Mobile Home / Other | 2 (100.0%) | 0 (0.0%) |
| Total | 58 (58.6%) | 41 (41.4%) |
Housing Structures by Number of Rooms in Willow Lake
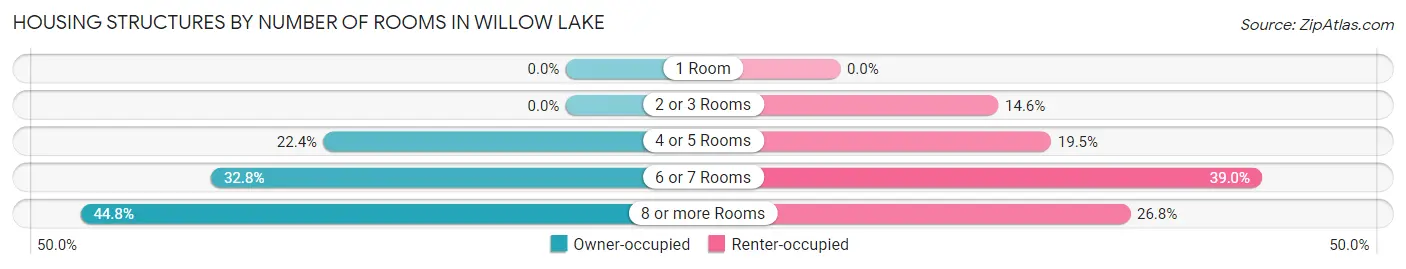
| Number of Rooms | Owner-occupied | Renter-occupied |
| 1 Room | 0 (0.0%) | 0 (0.0%) |
| 2 or 3 Rooms | 0 (0.0%) | 6 (14.6%) |
| 4 or 5 Rooms | 13 (22.4%) | 8 (19.5%) |
| 6 or 7 Rooms | 19 (32.8%) | 16 (39.0%) |
| 8 or more Rooms | 26 (44.8%) | 11 (26.8%) |
| Total | 58 (100.0%) | 41 (100.0%) |
Housing Structure by Heating Type in Willow Lake
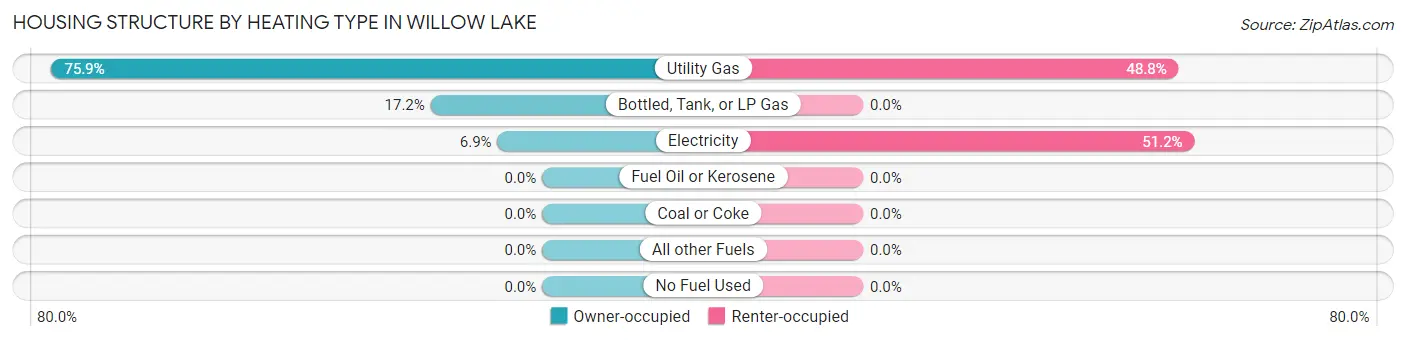
| Heating Type | Owner-occupied | Renter-occupied |
| Utility Gas | 44 (75.9%) | 20 (48.8%) |
| Bottled, Tank, or LP Gas | 10 (17.2%) | 0 (0.0%) |
| Electricity | 4 (6.9%) | 21 (51.2%) |
| Fuel Oil or Kerosene | 0 (0.0%) | 0 (0.0%) |
| Coal or Coke | 0 (0.0%) | 0 (0.0%) |
| All other Fuels | 0 (0.0%) | 0 (0.0%) |
| No Fuel Used | 0 (0.0%) | 0 (0.0%) |
| Total | 58 (100.0%) | 41 (100.0%) |
Household Vehicle Usage in Willow Lake
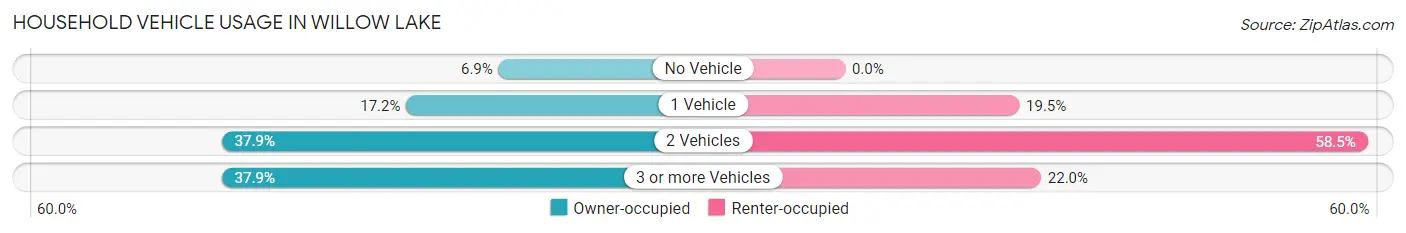
| Vehicles per Household | Owner-occupied | Renter-occupied |
| No Vehicle | 4 (6.9%) | 0 (0.0%) |
| 1 Vehicle | 10 (17.2%) | 8 (19.5%) |
| 2 Vehicles | 22 (37.9%) | 24 (58.5%) |
| 3 or more Vehicles | 22 (37.9%) | 9 (22.0%) |
| Total | 58 (100.0%) | 41 (100.0%) |
Real Estate & Mortgages in Willow Lake
Real Estate and Mortgage Overview in Willow Lake
| Characteristic | Without Mortgage | With Mortgage |
| Housing Units | 43 | 15 |
| Median Property Value | $83,800 | $115,600 |
| Median Household Income | $46,875 | $2 |
| Monthly Housing Costs | $521 | $0 |
| Real Estate Taxes | - | - |
Property Value by Mortgage Status in Willow Lake
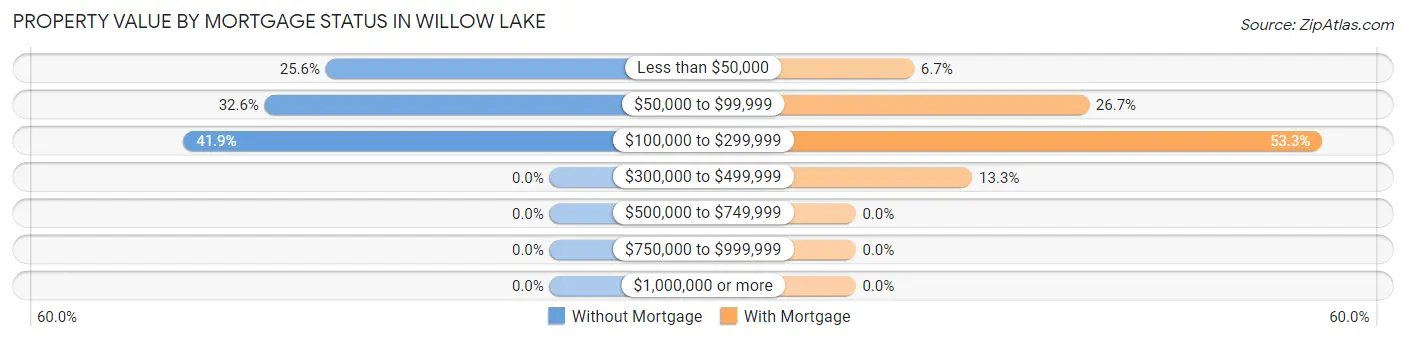
| Property Value | Without Mortgage | With Mortgage |
| Less than $50,000 | 11 (25.6%) | 1 (6.7%) |
| $50,000 to $99,999 | 14 (32.6%) | 4 (26.7%) |
| $100,000 to $299,999 | 18 (41.9%) | 8 (53.3%) |
| $300,000 to $499,999 | 0 (0.0%) | 2 (13.3%) |
| $500,000 to $749,999 | 0 (0.0%) | 0 (0.0%) |
| $750,000 to $999,999 | 0 (0.0%) | 0 (0.0%) |
| $1,000,000 or more | 0 (0.0%) | 0 (0.0%) |
| Total | 43 (100.0%) | 15 (100.0%) |
Household Income by Mortgage Status in Willow Lake
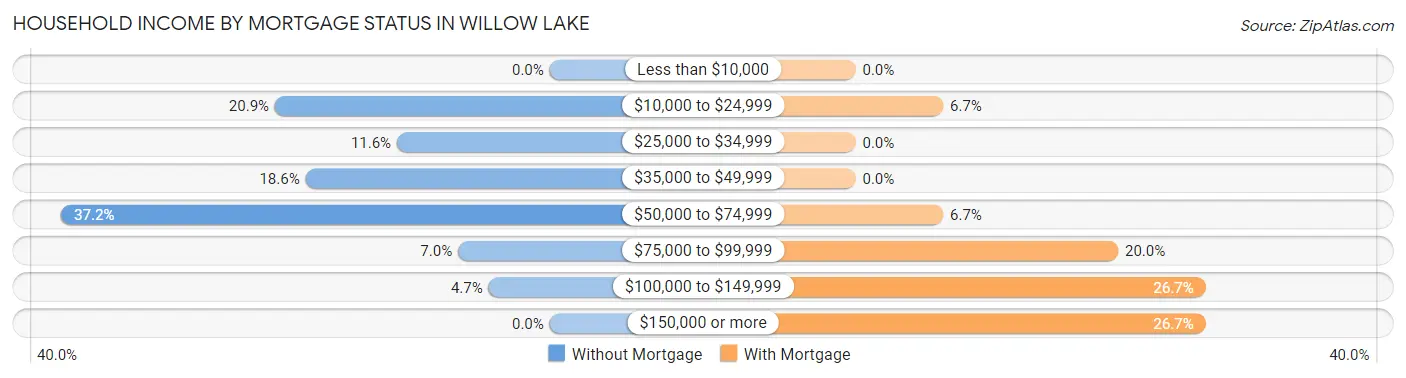
| Household Income | Without Mortgage | With Mortgage |
| Less than $10,000 | 0 (0.0%) | 0 (0.0%) |
| $10,000 to $24,999 | 9 (20.9%) | 1 (6.7%) |
| $25,000 to $34,999 | 5 (11.6%) | 0 (0.0%) |
| $35,000 to $49,999 | 8 (18.6%) | 0 (0.0%) |
| $50,000 to $74,999 | 16 (37.2%) | 1 (6.7%) |
| $75,000 to $99,999 | 3 (7.0%) | 3 (20.0%) |
| $100,000 to $149,999 | 2 (4.6%) | 4 (26.7%) |
| $150,000 or more | 0 (0.0%) | 4 (26.7%) |
| Total | 43 (100.0%) | 15 (100.0%) |
Property Value to Household Income Ratio in Willow Lake
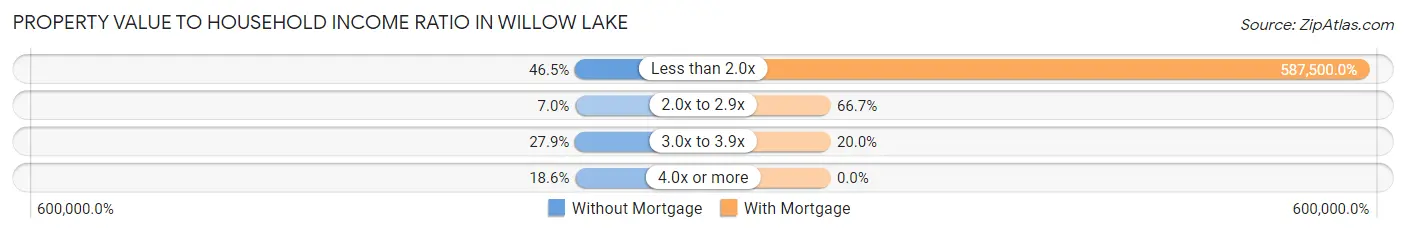
| Value-to-Income Ratio | Without Mortgage | With Mortgage |
| Less than 2.0x | 20 (46.5%) | 88,125 (587,500.0%) |
| 2.0x to 2.9x | 3 (7.0%) | 10 (66.7%) |
| 3.0x to 3.9x | 12 (27.9%) | 3 (20.0%) |
| 4.0x or more | 8 (18.6%) | 0 (0.0%) |
| Total | 43 (100.0%) | 15 (100.0%) |
Real Estate Taxes by Mortgage Status in Willow Lake
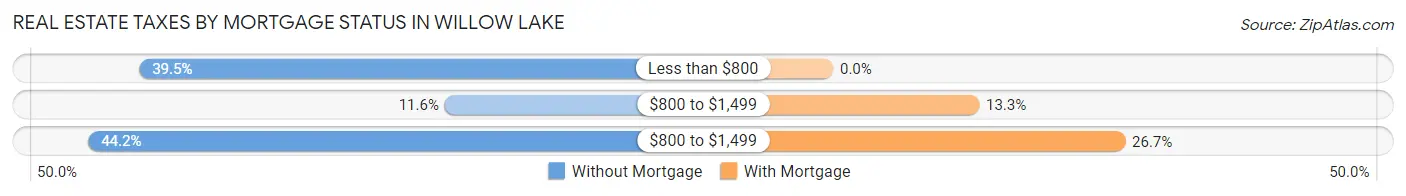
| Property Taxes | Without Mortgage | With Mortgage |
| Less than $800 | 17 (39.5%) | 0 (0.0%) |
| $800 to $1,499 | 5 (11.6%) | 2 (13.3%) |
| $800 to $1,499 | 19 (44.2%) | 4 (26.7%) |
| Total | 43 (100.0%) | 15 (100.0%) |
Health & Disability in Willow Lake
Health Insurance Coverage by Age in Willow Lake
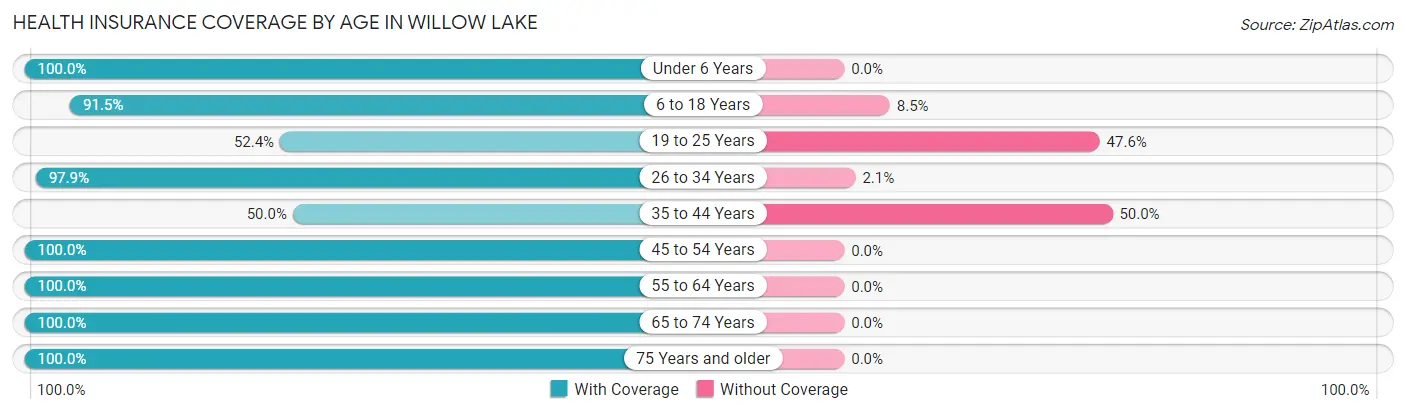
| Age Bracket | With Coverage | Without Coverage |
| Under 6 Years | 81 (100.0%) | 0 (0.0%) |
| 6 to 18 Years | 97 (91.5%) | 9 (8.5%) |
| 19 to 25 Years | 11 (52.4%) | 10 (47.6%) |
| 26 to 34 Years | 47 (97.9%) | 1 (2.1%) |
| 35 to 44 Years | 10 (50.0%) | 10 (50.0%) |
| 45 to 54 Years | 7 (100.0%) | 0 (0.0%) |
| 55 to 64 Years | 30 (100.0%) | 0 (0.0%) |
| 65 to 74 Years | 20 (100.0%) | 0 (0.0%) |
| 75 Years and older | 27 (100.0%) | 0 (0.0%) |
| Total | 330 (91.7%) | 30 (8.3%) |
Health Insurance Coverage by Citizenship Status in Willow Lake
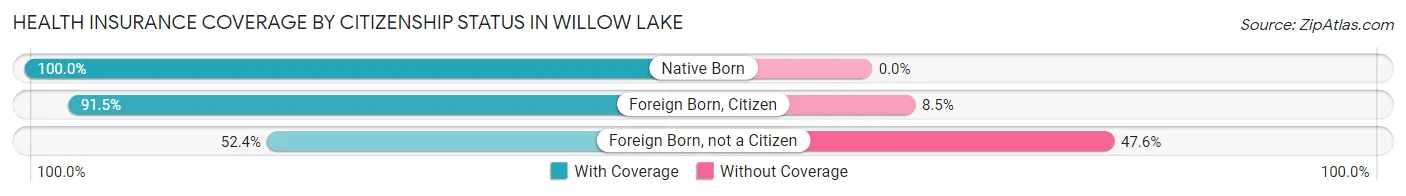
| Citizenship Status | With Coverage | Without Coverage |
| Native Born | 81 (100.0%) | 0 (0.0%) |
| Foreign Born, Citizen | 97 (91.5%) | 9 (8.5%) |
| Foreign Born, not a Citizen | 11 (52.4%) | 10 (47.6%) |
Health Insurance Coverage by Household Income in Willow Lake
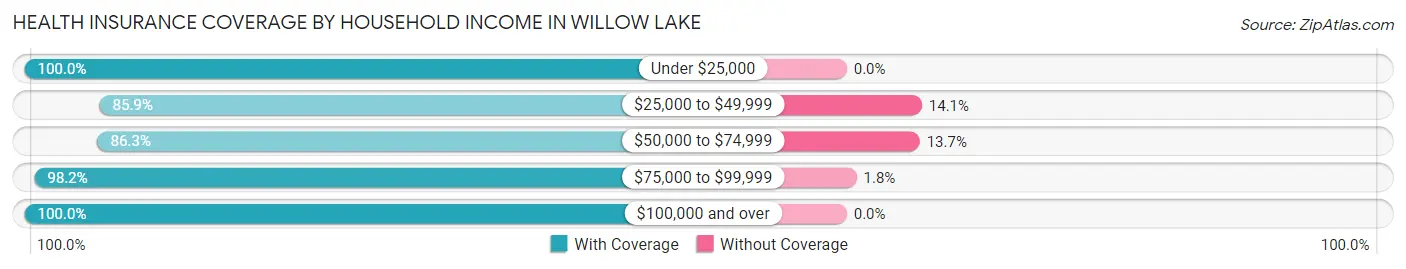
| Household Income | With Coverage | Without Coverage |
| Under $25,000 | 10 (100.0%) | 0 (0.0%) |
| $25,000 to $49,999 | 55 (85.9%) | 9 (14.1%) |
| $50,000 to $74,999 | 120 (86.3%) | 19 (13.7%) |
| $75,000 to $99,999 | 107 (98.2%) | 2 (1.8%) |
| $100,000 and over | 38 (100.0%) | 0 (0.0%) |
Public vs Private Health Insurance Coverage by Age in Willow Lake
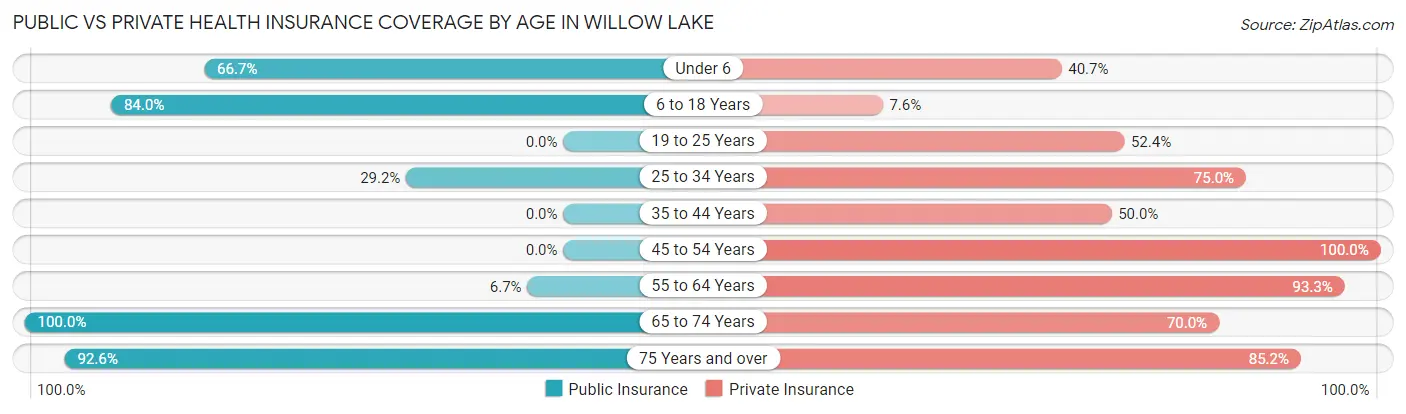
| Age Bracket | Public Insurance | Private Insurance |
| Under 6 | 54 (66.7%) | 33 (40.7%) |
| 6 to 18 Years | 89 (84.0%) | 8 (7.5%) |
| 19 to 25 Years | 0 (0.0%) | 11 (52.4%) |
| 25 to 34 Years | 14 (29.2%) | 36 (75.0%) |
| 35 to 44 Years | 0 (0.0%) | 10 (50.0%) |
| 45 to 54 Years | 0 (0.0%) | 7 (100.0%) |
| 55 to 64 Years | 2 (6.7%) | 28 (93.3%) |
| 65 to 74 Years | 20 (100.0%) | 14 (70.0%) |
| 75 Years and over | 25 (92.6%) | 23 (85.2%) |
| Total | 204 (56.7%) | 170 (47.2%) |
Disability Status by Sex by Age in Willow Lake
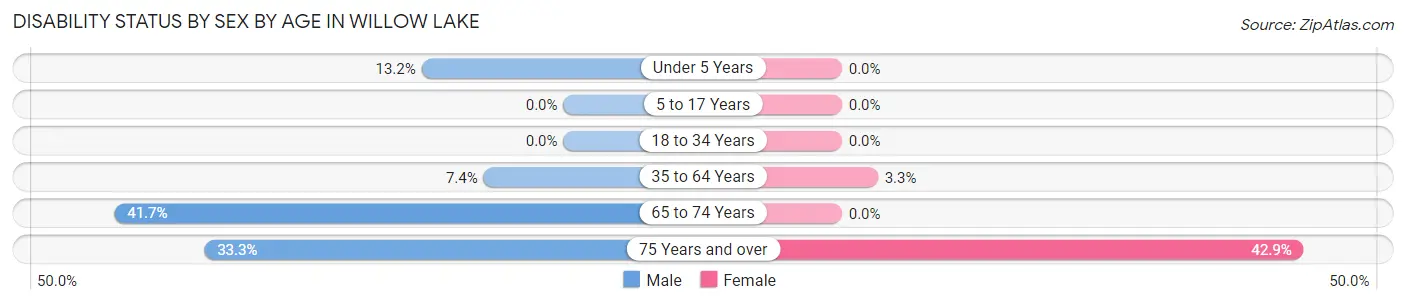
| Age Bracket | Male | Female |
| Under 5 Years | 5 (13.2%) | 0 (0.0%) |
| 5 to 17 Years | 0 (0.0%) | 0 (0.0%) |
| 18 to 34 Years | 0 (0.0%) | 0 (0.0%) |
| 35 to 64 Years | 2 (7.4%) | 1 (3.3%) |
| 65 to 74 Years | 5 (41.7%) | 0 (0.0%) |
| 75 Years and over | 2 (33.3%) | 9 (42.9%) |
Disability Class by Sex by Age in Willow Lake
Disability Class: Hearing Difficulty
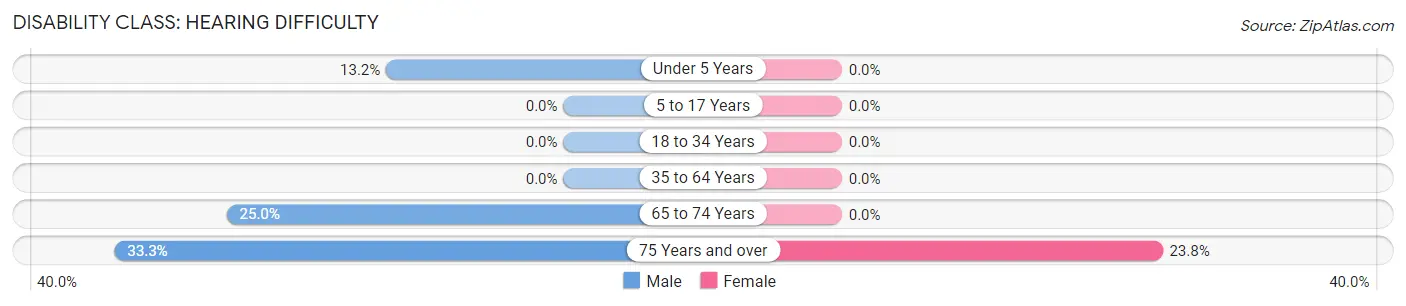
| Age Bracket | Male | Female |
| Under 5 Years | 5 (13.2%) | 0 (0.0%) |
| 5 to 17 Years | 0 (0.0%) | 0 (0.0%) |
| 18 to 34 Years | 0 (0.0%) | 0 (0.0%) |
| 35 to 64 Years | 0 (0.0%) | 0 (0.0%) |
| 65 to 74 Years | 3 (25.0%) | 0 (0.0%) |
| 75 Years and over | 2 (33.3%) | 5 (23.8%) |
Disability Class: Vision Difficulty
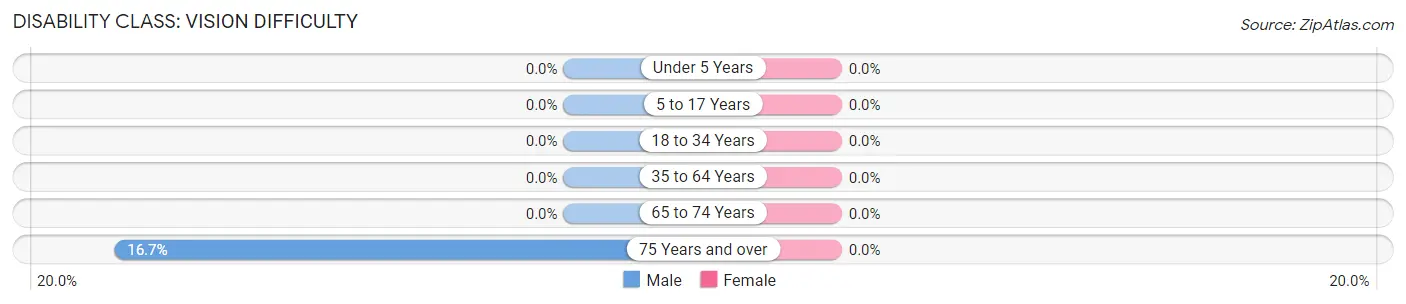
| Age Bracket | Male | Female |
| Under 5 Years | 0 (0.0%) | 0 (0.0%) |
| 5 to 17 Years | 0 (0.0%) | 0 (0.0%) |
| 18 to 34 Years | 0 (0.0%) | 0 (0.0%) |
| 35 to 64 Years | 0 (0.0%) | 0 (0.0%) |
| 65 to 74 Years | 0 (0.0%) | 0 (0.0%) |
| 75 Years and over | 1 (16.7%) | 0 (0.0%) |
Disability Class: Cognitive Difficulty
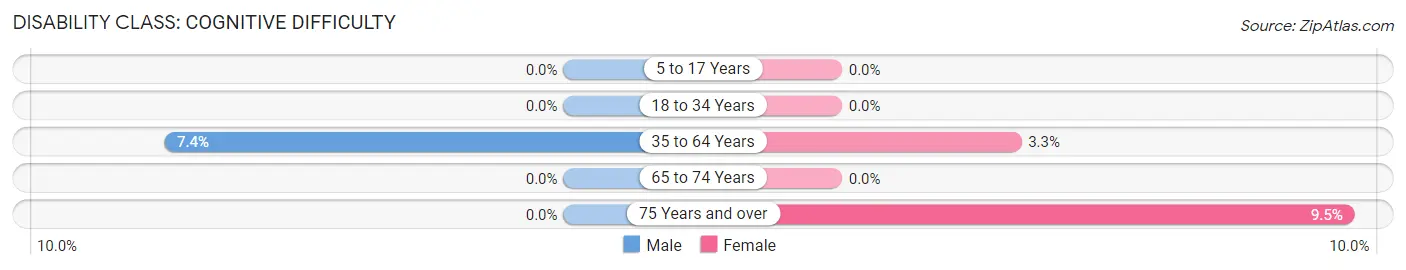
| Age Bracket | Male | Female |
| 5 to 17 Years | 0 (0.0%) | 0 (0.0%) |
| 18 to 34 Years | 0 (0.0%) | 0 (0.0%) |
| 35 to 64 Years | 2 (7.4%) | 1 (3.3%) |
| 65 to 74 Years | 0 (0.0%) | 0 (0.0%) |
| 75 Years and over | 0 (0.0%) | 2 (9.5%) |
Disability Class: Ambulatory Difficulty
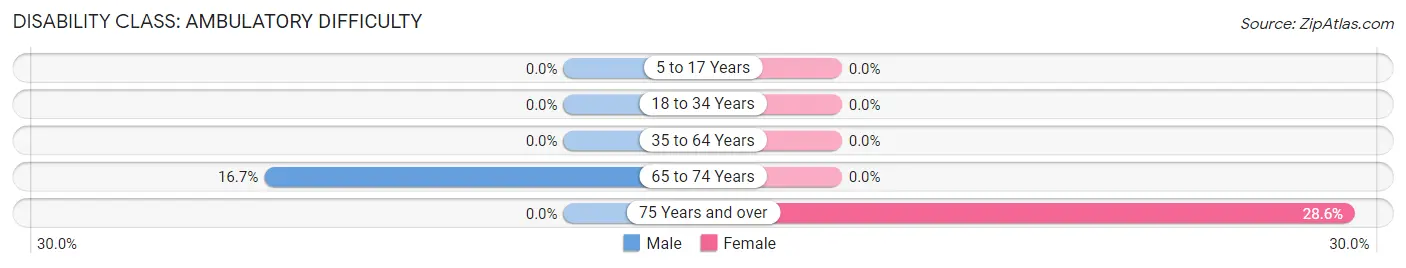
| Age Bracket | Male | Female |
| 5 to 17 Years | 0 (0.0%) | 0 (0.0%) |
| 18 to 34 Years | 0 (0.0%) | 0 (0.0%) |
| 35 to 64 Years | 0 (0.0%) | 0 (0.0%) |
| 65 to 74 Years | 2 (16.7%) | 0 (0.0%) |
| 75 Years and over | 0 (0.0%) | 6 (28.6%) |
Disability Class: Self-Care Difficulty
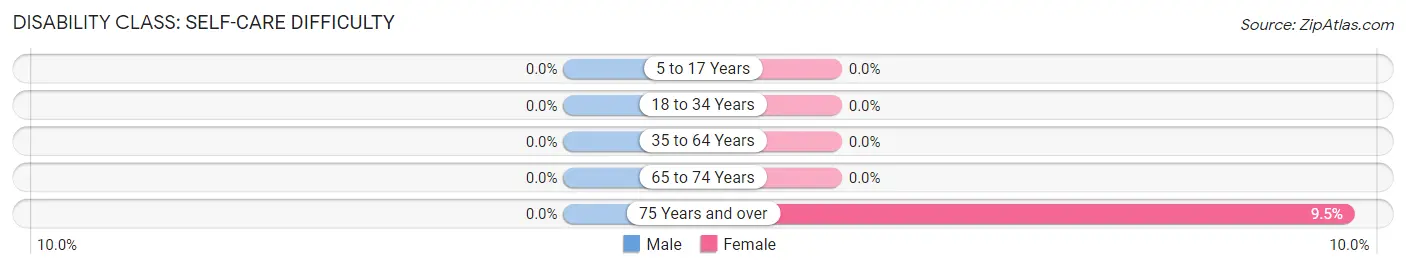
| Age Bracket | Male | Female |
| 5 to 17 Years | 0 (0.0%) | 0 (0.0%) |
| 18 to 34 Years | 0 (0.0%) | 0 (0.0%) |
| 35 to 64 Years | 0 (0.0%) | 0 (0.0%) |
| 65 to 74 Years | 0 (0.0%) | 0 (0.0%) |
| 75 Years and over | 0 (0.0%) | 2 (9.5%) |
Technology Access in Willow Lake
Computing Device Access in Willow Lake
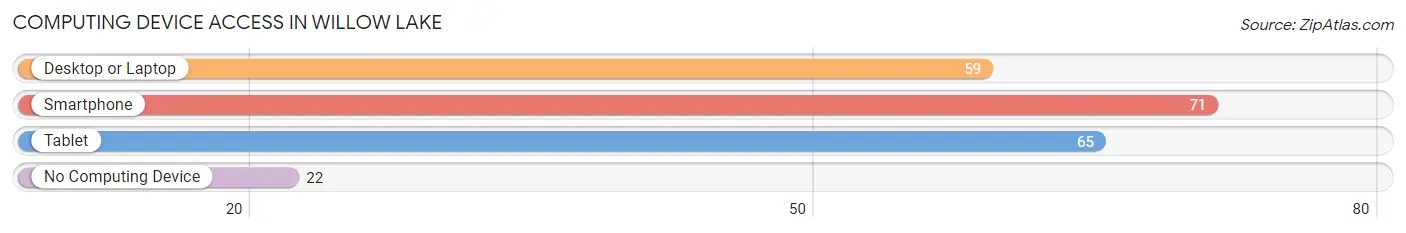
| Device Type | # Households | % Households |
| Desktop or Laptop | 59 | 59.6% |
| Smartphone | 71 | 71.7% |
| Tablet | 65 | 65.7% |
| No Computing Device | 22 | 22.2% |
| Total | 99 | 100.0% |
Internet Access in Willow Lake
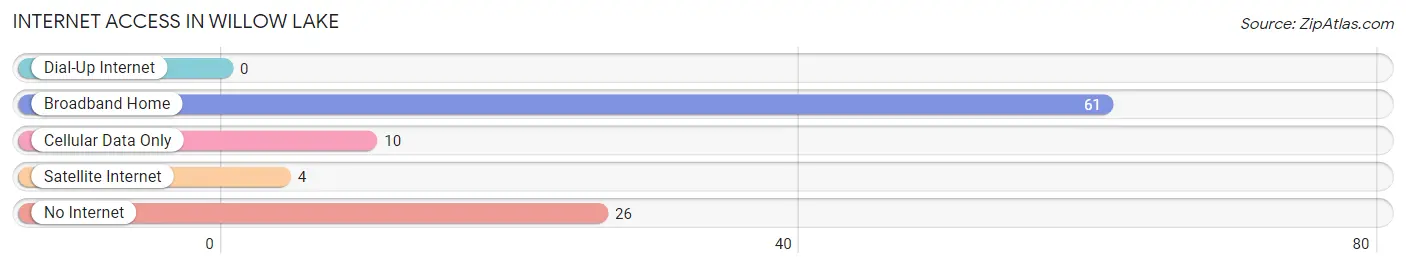
| Internet Type | # Households | % Households |
| Dial-Up Internet | 0 | 0.0% |
| Broadband Home | 61 | 61.6% |
| Cellular Data Only | 10 | 10.1% |
| Satellite Internet | 4 | 4.0% |
| No Internet | 26 | 26.3% |
| Total | 99 | 100.0% |
Willow Lake Summary
Willow Lake is a small town located in the southeastern corner of South Dakota, in the United States. It is situated in the heart of the Great Plains, and is surrounded by rolling hills and prairies. The town is located in the county of Lake, and is part of the Sioux Falls Metropolitan Statistical Area.
History
Willow Lake was founded in 1881 by a group of settlers from Wisconsin. The town was named after the nearby Willow Lake, which was named for the abundance of willow trees that grew along its banks. The settlers were attracted to the area by the abundance of natural resources, including timber, water, and fertile soil.
The town quickly grew, and by the early 1900s, it had become a thriving agricultural community. The town was home to a variety of businesses, including a general store, a blacksmith, a hotel, and a bank. In the 1920s, the town was connected to the rest of the state by the Sioux Falls and Rapid City Railroad.
In the 1950s, the town began to decline as the railroad was abandoned and the population began to move away. However, in the late 1970s, the town began to experience a resurgence as people began to move back to the area. Today, Willow Lake is a small but vibrant community with a population of around 500 people.
Geography
Willow Lake is located in the southeastern corner of South Dakota, in the United States. It is situated in the heart of the Great Plains, and is surrounded by rolling hills and prairies. The town is located in the county of Lake, and is part of the Sioux Falls Metropolitan Statistical Area.
The town is located at an elevation of 1,845 feet (562 meters) above sea level. The climate in the area is characterized by hot summers and cold winters. The average annual temperature is around 50°F (10°C). The average annual precipitation is around 20 inches (51 cm).
Economy
The economy of Willow Lake is largely based on agriculture. The town is home to several farms, which produce a variety of crops, including corn, soybeans, wheat, and hay. The town is also home to several small businesses, including a general store, a hardware store, and a restaurant.
The town is also home to a number of manufacturing companies, which produce a variety of products, including furniture, clothing, and automotive parts. The town is also home to a number of service-based businesses, including a bank, a post office, and a library.
Demographics
As of the 2010 census, the population of Willow Lake was 498. The racial makeup of the town was 97.2% White, 0.2% African American, 0.4% Native American, 0.2% Asian, 0.2% from other races, and 1.9% from two or more races. Hispanic or Latino of any race were 0.8% of the population.
The median income for a household in the town was $41,250, and the median income for a family was $45,000. The per capita income for the town was $18,945. About 8.2% of families and 10.2% of the population were below the poverty line, including 11.2% of those under age 18 and 8.3% of those age 65 or over.
Common Questions
What is Per Capita Income in Willow Lake?
Per Capita income in Willow Lake is $17,486.
What is the Median Family Income in Willow Lake?
Median Family Income in Willow Lake is $65,000.
What is the Median Household income in Willow Lake?
Median Household Income in Willow Lake is $57,292.
What is Income or Wage Gap in Willow Lake?
Income or Wage Gap in Willow Lake is 37.4%.
Women in Willow Lake earn 62.6 cents for every dollar earned by a man.
What is Inequality or Gini Index in Willow Lake?
Inequality or Gini Index in Willow Lake is 0.27.
What is the Total Population of Willow Lake?
Total Population of Willow Lake is 360.
What is the Total Male Population of Willow Lake?
Total Male Population of Willow Lake is 167.
What is the Total Female Population of Willow Lake?
Total Female Population of Willow Lake is 193.
What is the Ratio of Males per 100 Females in Willow Lake?
There are 86.53 Males per 100 Females in Willow Lake.
What is the Ratio of Females per 100 Males in Willow Lake?
There are 115.57 Females per 100 Males in Willow Lake.
What is the Median Population Age in Willow Lake?
Median Population Age in Willow Lake is 17.1 Years.
What is the Average Family Size in Willow Lake
Average Family Size in Willow Lake is 5.2 People.
What is the Average Household Size in Willow Lake
Average Household Size in Willow Lake is 3.6 People.
How Large is the Labor Force in Willow Lake?
There are 114 People in the Labor Forcein in Willow Lake.
What is the Percentage of People in the Labor Force in Willow Lake?
57.6% of People are in the Labor Force in Willow Lake.