Zip Codes with the Highest Percentage of Population Employed in Firefighting & Prevention in South Dakota
RELATED REPORTS & OPTIONS
Firefighting & Prevention
South Dakota
Compare Zip Codes
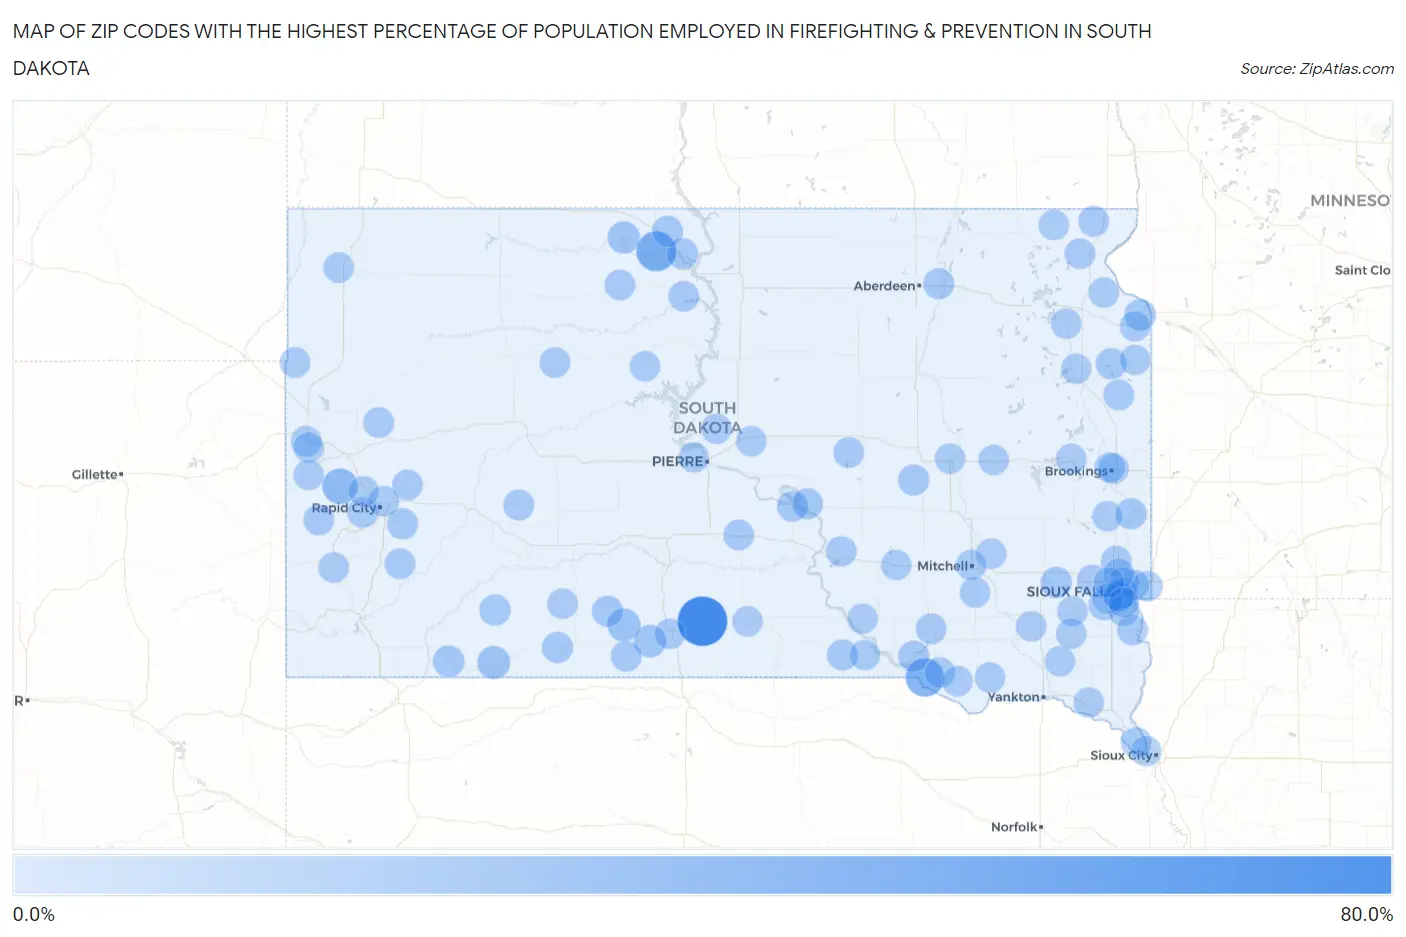
Map of Zip Codes with the Highest Percentage of Population Employed in Firefighting & Prevention in South Dakota
0.0%
80.0%
Zip Codes with the Highest Percentage of Population Employed in Firefighting & Prevention in South Dakota
| Zip Code | % Employed | vs State | vs National | |
| 1. | 57563 | 73.3% | 0.79%(+72.5)#1 | 1.2%(+72.1)#13 |
| 2. | 57639 | 35.7% | 0.79%(+34.9)#2 | 1.2%(+34.5)#35 |
| 3. | 57361 | 31.0% | 0.79%(+30.2)#3 | 1.2%(+29.8)#42 |
| 4. | 57759 | 19.1% | 0.79%(+18.3)#4 | 1.2%(+17.9)#106 |
| 5. | 57566 | 10.0% | 0.79%(+9.21)#5 | 1.2%(+8.81)#301 |
| 6. | 57716 | 9.9% | 0.79%(+9.07)#6 | 1.2%(+8.67)#308 |
| 7. | 57570 | 7.8% | 0.79%(+7.05)#7 | 1.2%(+6.65)#428 |
| 8. | 57621 | 7.0% | 0.79%(+6.19)#8 | 1.2%(+5.79)#516 |
| 9. | 57770 | 5.0% | 0.79%(+4.21)#9 | 1.2%(+3.81)#913 |
| 10. | 57216 | 4.8% | 0.79%(+4.05)#10 | 1.2%(+3.65)#972 |
| 11. | 57012 | 4.1% | 0.79%(+3.35)#11 | 1.2%(+2.95)#1,285 |
| 12. | 57560 | 3.7% | 0.79%(+2.92)#12 | 1.2%(+2.52)#1,555 |
| 13. | 57752 | 3.6% | 0.79%(+2.77)#13 | 1.2%(+2.37)#1,677 |
| 14. | 57356 | 3.5% | 0.79%(+2.71)#14 | 1.2%(+2.31)#1,721 |
| 15. | 57658 | 3.4% | 0.79%(+2.60)#15 | 1.2%(+2.20)#1,817 |
| 16. | 57551 | 3.4% | 0.79%(+2.60)#16 | 1.2%(+2.20)#1,820 |
| 17. | 57703 | 3.2% | 0.79%(+2.43)#17 | 1.2%(+2.03)#2,004 |
| 18. | 57379 | 3.1% | 0.79%(+2.34)#18 | 1.2%(+1.94)#2,116 |
| 19. | 57548 | 3.1% | 0.79%(+2.27)#19 | 1.2%(+1.87)#2,179 |
| 20. | 57642 | 3.0% | 0.79%(+2.26)#20 | 1.2%(+1.86)#2,182 |
| 21. | 57538 | 2.9% | 0.79%(+2.13)#21 | 1.2%(+1.73)#2,349 |
| 22. | 57197 | 2.9% | 0.79%(+2.09)#22 | 1.2%(+1.69)#2,420 |
| 23. | 57265 | 2.8% | 0.79%(+1.99)#23 | 1.2%(+1.59)#2,608 |
| 24. | 57028 | 2.7% | 0.79%(+1.95)#24 | 1.2%(+1.55)#2,661 |
| 25. | 57427 | 2.7% | 0.79%(+1.92)#25 | 1.2%(+1.53)#2,711 |
| 26. | 57339 | 2.6% | 0.79%(+1.80)#26 | 1.2%(+1.40)#2,917 |
| 27. | 57775 | 2.0% | 0.79%(+1.21)#27 | 1.2%(+0.814)#4,508 |
| 28. | 57601 | 2.0% | 0.79%(+1.17)#28 | 1.2%(+0.771)#4,674 |
| 29. | 57744 | 1.9% | 0.79%(+1.14)#29 | 1.2%(+0.741)#4,800 |
| 30. | 57745 | 1.9% | 0.79%(+1.13)#30 | 1.2%(+0.731)#4,848 |
| 31. | 57788 | 1.9% | 0.79%(+1.12)#31 | 1.2%(+0.715)#4,917 |
| 32. | 57572 | 1.9% | 0.79%(+1.08)#32 | 1.2%(+0.683)#5,048 |
| 33. | 57033 | 1.8% | 0.79%(+1.03)#33 | 1.2%(+0.632)#5,271 |
| 34. | 57255 | 1.7% | 0.79%(+0.946)#34 | 1.2%(+0.546)#5,679 |
| 35. | 57362 | 1.7% | 0.79%(+0.927)#35 | 1.2%(+0.527)#5,774 |
| 36. | 57656 | 1.6% | 0.79%(+0.827)#36 | 1.2%(+0.427)#6,312 |
| 37. | 57370 | 1.6% | 0.79%(+0.793)#37 | 1.2%(+0.393)#6,494 |
| 38. | 57003 | 1.6% | 0.79%(+0.790)#38 | 1.2%(+0.390)#6,510 |
| 39. | 57313 | 1.6% | 0.79%(+0.782)#39 | 1.2%(+0.382)#6,556 |
| 40. | 57064 | 1.4% | 0.79%(+0.658)#40 | 1.2%(+0.258)#7,352 |
| 41. | 57568 | 1.4% | 0.79%(+0.656)#41 | 1.2%(+0.257)#7,365 |
| 42. | 57226 | 1.4% | 0.79%(+0.639)#42 | 1.2%(+0.239)#7,469 |
| 43. | 57623 | 1.4% | 0.79%(+0.603)#43 | 1.2%(+0.203)#7,718 |
| 44. | 57730 | 1.3% | 0.79%(+0.559)#44 | 1.2%(+0.160)#8,019 |
| 45. | 57013 | 1.3% | 0.79%(+0.536)#45 | 1.2%(+0.137)#8,184 |
| 46. | 57262 | 1.3% | 0.79%(+0.530)#46 | 1.2%(+0.131)#8,227 |
| 47. | 57702 | 1.3% | 0.79%(+0.513)#47 | 1.2%(+0.114)#8,354 |
| 48. | 57799 | 1.3% | 0.79%(+0.508)#48 | 1.2%(+0.109)#8,381 |
| 49. | 57719 | 1.3% | 0.79%(+0.494)#49 | 1.2%(+0.095)#8,500 |
| 50. | 57279 | 1.2% | 0.79%(+0.422)#50 | 1.2%(+0.022)#9,085 |
| 51. | 57555 | 1.2% | 0.79%(+0.412)#51 | 1.2%(+0.012)#9,159 |
| 52. | 57720 | 1.2% | 0.79%(+0.410)#52 | 1.2%(+0.010)#9,179 |
| 53. | 57334 | 1.2% | 0.79%(+0.393)#53 | 1.2%(-0.007)#9,327 |
| 54. | 57038 | 1.2% | 0.79%(+0.378)#54 | 1.2%(-0.021)#9,460 |
| 55. | 57701 | 1.2% | 0.79%(+0.366)#55 | 1.2%(-0.034)#9,599 |
| 56. | 57522 | 1.1% | 0.79%(+0.347)#56 | 1.2%(-0.053)#9,793 |
| 57. | 57717 | 1.1% | 0.79%(+0.333)#57 | 1.2%(-0.067)#9,931 |
| 58. | 57625 | 1.1% | 0.79%(+0.306)#58 | 1.2%(-0.094)#10,176 |
| 59. | 57256 | 1.1% | 0.79%(+0.289)#59 | 1.2%(-0.111)#10,332 |
| 60. | 57577 | 1.1% | 0.79%(+0.285)#60 | 1.2%(-0.114)#10,371 |
| 61. | 57029 | 1.1% | 0.79%(+0.265)#61 | 1.2%(-0.135)#10,597 |
| 62. | 57501 | 1.0% | 0.79%(+0.220)#62 | 1.2%(-0.180)#11,035 |
| 63. | 57380 | 1.00% | 0.79%(+0.212)#63 | 1.2%(-0.188)#11,112 |
| 64. | 57068 | 0.99% | 0.79%(+0.207)#64 | 1.2%(-0.193)#11,160 |
| 65. | 57329 | 0.99% | 0.79%(+0.204)#65 | 1.2%(-0.196)#11,198 |
| 66. | 57104 | 0.98% | 0.79%(+0.199)#66 | 1.2%(-0.201)#11,249 |
| 67. | 57037 | 0.98% | 0.79%(+0.192)#67 | 1.2%(-0.207)#11,318 |
| 68. | 57353 | 0.96% | 0.79%(+0.175)#68 | 1.2%(-0.224)#11,517 |
| 69. | 57350 | 0.96% | 0.79%(+0.173)#69 | 1.2%(-0.227)#11,551 |
| 70. | 57580 | 0.91% | 0.79%(+0.128)#70 | 1.2%(-0.272)#12,006 |
| 71. | 57103 | 0.91% | 0.79%(+0.125)#71 | 1.2%(-0.274)#12,034 |
| 72. | 57069 | 0.90% | 0.79%(+0.113)#72 | 1.2%(-0.287)#12,178 |
| 73. | 57201 | 0.86% | 0.79%(+0.071)#73 | 1.2%(-0.329)#12,600 |
| 74. | 57066 | 0.85% | 0.79%(+0.063)#74 | 1.2%(-0.337)#12,681 |
| 75. | 57032 | 0.84% | 0.79%(+0.057)#75 | 1.2%(-0.343)#12,742 |
| 76. | 57005 | 0.82% | 0.79%(+0.034)#76 | 1.2%(-0.365)#12,963 |
| 77. | 57340 | 0.79% | 0.79%(+0.008)#77 | 1.2%(-0.392)#13,298 |
| 78. | 57369 | 0.78% | 0.79%(-0.004)#78 | 1.2%(-0.404)#13,416 |
| 79. | 57055 | 0.78% | 0.79%(-0.006)#79 | 1.2%(-0.406)#13,436 |
| 80. | 57106 | 0.78% | 0.79%(-0.009)#80 | 1.2%(-0.408)#13,464 |
| 81. | 57301 | 0.75% | 0.79%(-0.039)#81 | 1.2%(-0.439)#13,804 |
| 82. | 57105 | 0.73% | 0.79%(-0.053)#82 | 1.2%(-0.453)#13,951 |
| 83. | 57317 | 0.73% | 0.79%(-0.056)#83 | 1.2%(-0.456)#13,991 |
| 84. | 57017 | 0.72% | 0.79%(-0.070)#84 | 1.2%(-0.469)#14,144 |
| 85. | 57270 | 0.70% | 0.79%(-0.084)#85 | 1.2%(-0.484)#14,311 |
| 86. | 57036 | 0.63% | 0.79%(-0.159)#86 | 1.2%(-0.559)#15,134 |
| 87. | 57007 | 0.62% | 0.79%(-0.166)#87 | 1.2%(-0.566)#15,204 |
| 88. | 57718 | 0.60% | 0.79%(-0.182)#88 | 1.2%(-0.581)#15,374 |
| 89. | 57783 | 0.60% | 0.79%(-0.187)#89 | 1.2%(-0.586)#15,428 |
| 90. | 57212 | 0.58% | 0.79%(-0.205)#90 | 1.2%(-0.605)#15,625 |
| 91. | 57006 | 0.56% | 0.79%(-0.225)#91 | 1.2%(-0.625)#15,823 |
| 92. | 57107 | 0.56% | 0.79%(-0.226)#92 | 1.2%(-0.626)#15,842 |
| 93. | 57049 | 0.54% | 0.79%(-0.244)#93 | 1.2%(-0.644)#16,046 |
| 94. | 57383 | 0.48% | 0.79%(-0.305)#94 | 1.2%(-0.705)#16,770 |
| 95. | 57252 | 0.47% | 0.79%(-0.317)#95 | 1.2%(-0.717)#16,893 |
| 96. | 57754 | 0.47% | 0.79%(-0.318)#96 | 1.2%(-0.718)#16,904 |
| 97. | 57053 | 0.46% | 0.79%(-0.322)#97 | 1.2%(-0.722)#16,948 |
| 98. | 57259 | 0.43% | 0.79%(-0.355)#98 | 1.2%(-0.755)#17,319 |
| 99. | 57532 | 0.42% | 0.79%(-0.367)#99 | 1.2%(-0.766)#17,428 |
| 100. | 57108 | 0.40% | 0.79%(-0.386)#100 | 1.2%(-0.786)#17,653 |
Common Questions
What are the Top 10 Zip Codes with the Highest Percentage of Population Employed in Firefighting & Prevention in South Dakota?
Top 10 Zip Codes with the Highest Percentage of Population Employed in Firefighting & Prevention in South Dakota are:
What zip code has the Highest Percentage of Population Employed in Firefighting & Prevention in South Dakota?
57563 has the Highest Percentage of Population Employed in Firefighting & Prevention in South Dakota with 73.3%.
What is the Percentage of Population Employed in Firefighting & Prevention in the State of South Dakota?
Percentage of Population Employed in Firefighting & Prevention in South Dakota is 0.79%.
What is the Percentage of Population Employed in Firefighting & Prevention in the United States?
Percentage of Population Employed in Firefighting & Prevention in the United States is 1.2%.