Zip Codes with the Lowest Poverty Level Among Children Under the Age of 5 in South Dakota
RELATED REPORTS & OPTIONS
Lowest Poverty | Child 0-5
South Dakota
Compare Zip Codes
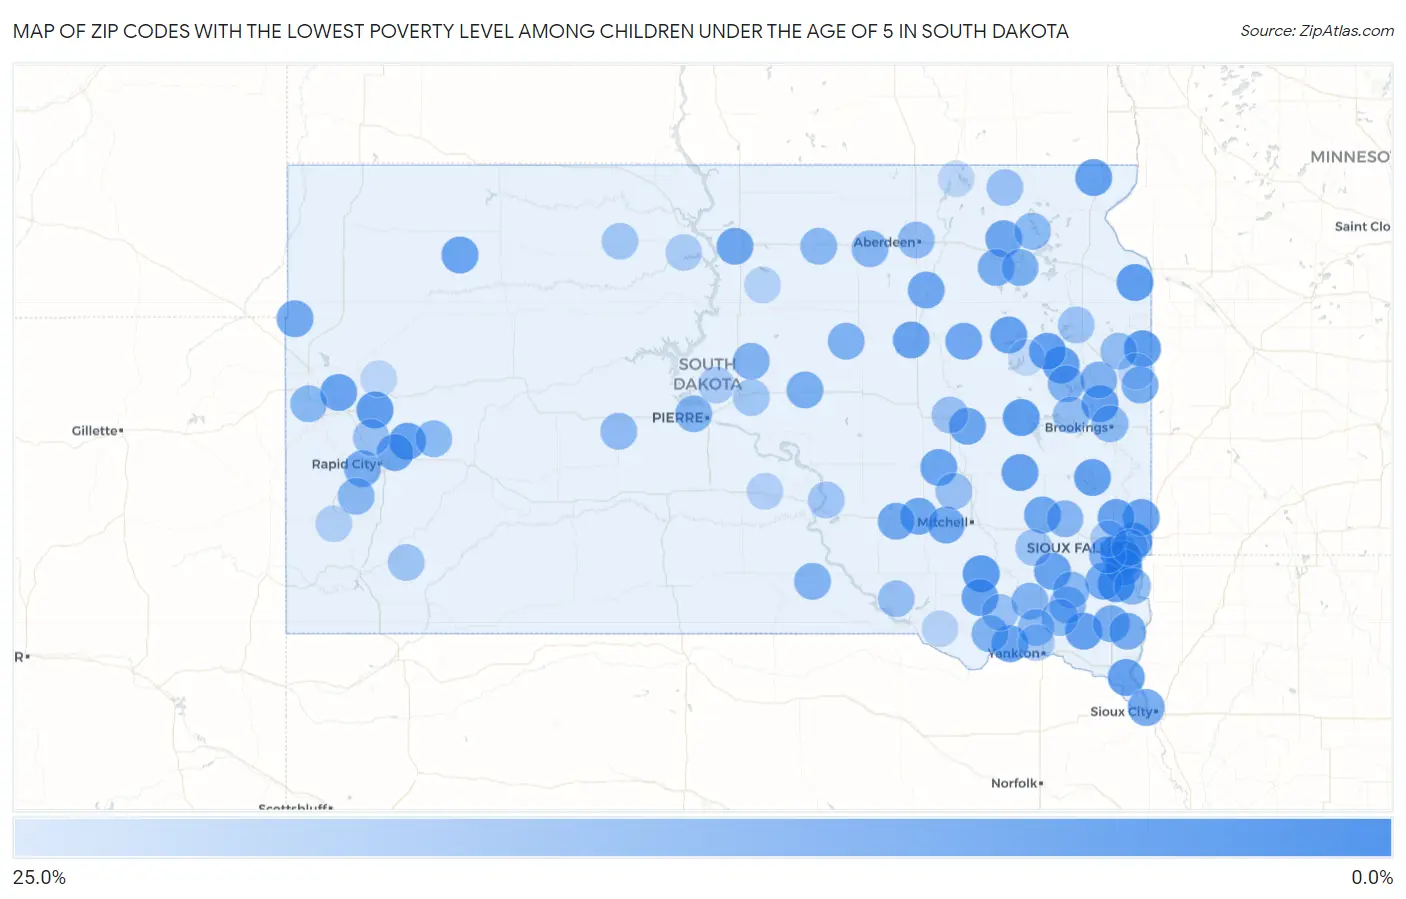
Map of Zip Codes with the Lowest Poverty Level Among Children Under the Age of 5 in South Dakota
25.0%
0.0%
Zip Codes with the Lowest Poverty Level Among Children Under the Age of 5 in South Dakota
| Zip Code | Child Poverty | vs State | vs National | |
| 1. | 57105 | 0.70% | 17.4%(-16.7)#1 | 18.1%(-17.4)#128 |
| 2. | 57005 | 0.80% | 17.4%(-16.6)#2 | 18.1%(-17.3)#174 |
| 3. | 57077 | 1.0% | 17.4%(-16.4)#3 | 18.1%(-17.0)#283 |
| 4. | 57366 | 1.6% | 17.4%(-15.8)#4 | 18.1%(-16.4)#608 |
| 5. | 57231 | 1.9% | 17.4%(-15.6)#5 | 18.1%(-16.2)#749 |
| 6. | 57252 | 2.1% | 17.4%(-15.3)#6 | 18.1%(-15.9)#915 |
| 7. | 57237 | 2.3% | 17.4%(-15.1)#7 | 18.1%(-15.7)#1,046 |
| 8. | 57785 | 2.3% | 17.4%(-15.1)#8 | 18.1%(-15.7)#1,052 |
| 9. | 57241 | 2.9% | 17.4%(-14.5)#9 | 18.1%(-15.1)#1,467 |
| 10. | 57242 | 3.0% | 17.4%(-14.4)#10 | 18.1%(-15.0)#1,529 |
| 11. | 57073 | 3.1% | 17.4%(-14.3)#11 | 18.1%(-14.9)#1,590 |
| 12. | 57108 | 3.1% | 17.4%(-14.3)#12 | 18.1%(-14.9)#1,593 |
| 13. | 57025 | 3.2% | 17.4%(-14.3)#13 | 18.1%(-14.9)#1,612 |
| 14. | 57220 | 3.2% | 17.4%(-14.2)#14 | 18.1%(-14.8)#1,660 |
| 15. | 57255 | 3.3% | 17.4%(-14.1)#15 | 18.1%(-14.7)#1,728 |
| 16. | 57349 | 3.4% | 17.4%(-14.1)#16 | 18.1%(-14.7)#1,754 |
| 17. | 57075 | 3.4% | 17.4%(-14.0)#17 | 18.1%(-14.6)#1,797 |
| 18. | 57719 | 3.5% | 17.4%(-13.9)#18 | 18.1%(-14.5)#1,832 |
| 19. | 57225 | 3.5% | 17.4%(-13.9)#19 | 18.1%(-14.5)#1,847 |
| 20. | 57469 | 3.7% | 17.4%(-13.7)#20 | 18.1%(-14.3)#1,990 |
| 21. | 57030 | 3.8% | 17.4%(-13.6)#21 | 18.1%(-14.2)#2,039 |
| 22. | 57063 | 3.8% | 17.4%(-13.6)#22 | 18.1%(-14.2)#2,065 |
| 23. | 57376 | 3.8% | 17.4%(-13.6)#23 | 18.1%(-14.2)#2,066 |
| 24. | 57003 | 3.9% | 17.4%(-13.5)#24 | 18.1%(-14.1)#2,116 |
| 25. | 57043 | 4.1% | 17.4%(-13.4)#25 | 18.1%(-14.0)#2,211 |
| 26. | 57793 | 4.1% | 17.4%(-13.3)#26 | 18.1%(-14.0)#2,247 |
| 27. | 57620 | 4.1% | 17.4%(-13.3)#27 | 18.1%(-14.0)#2,263 |
| 28. | 57385 | 4.7% | 17.4%(-12.8)#28 | 18.1%(-13.4)#2,669 |
| 29. | 57058 | 4.9% | 17.4%(-12.6)#29 | 18.1%(-13.2)#2,803 |
| 30. | 57032 | 5.0% | 17.4%(-12.5)#30 | 18.1%(-13.1)#2,884 |
| 31. | 57324 | 5.0% | 17.4%(-12.4)#31 | 18.1%(-13.1)#2,912 |
| 32. | 57468 | 5.0% | 17.4%(-12.4)#32 | 18.1%(-13.1)#2,914 |
| 33. | 57368 | 5.1% | 17.4%(-12.4)#33 | 18.1%(-13.0)#2,955 |
| 34. | 57472 | 5.1% | 17.4%(-12.3)#34 | 18.1%(-12.9)#2,991 |
| 35. | 57706 | 5.2% | 17.4%(-12.3)#35 | 18.1%(-12.9)#3,023 |
| 36. | 57461 | 5.3% | 17.4%(-12.2)#36 | 18.1%(-12.8)#3,084 |
| 37. | 57363 | 5.6% | 17.4%(-11.9)#37 | 18.1%(-12.5)#3,290 |
| 38. | 57436 | 5.6% | 17.4%(-11.9)#38 | 18.1%(-12.5)#3,297 |
| 39. | 57049 | 5.8% | 17.4%(-11.7)#39 | 18.1%(-12.3)#3,427 |
| 40. | 57383 | 6.0% | 17.4%(-11.4)#40 | 18.1%(-12.1)#3,593 |
| 41. | 57717 | 6.0% | 17.4%(-11.4)#41 | 18.1%(-12.1)#3,597 |
| 42. | 57039 | 6.2% | 17.4%(-11.3)#42 | 18.1%(-11.9)#3,719 |
| 43. | 57004 | 6.4% | 17.4%(-11.0)#43 | 18.1%(-11.6)#3,893 |
| 44. | 57213 | 6.9% | 17.4%(-10.5)#44 | 18.1%(-11.2)#4,214 |
| 45. | 57702 | 7.0% | 17.4%(-10.5)#45 | 18.1%(-11.1)#4,256 |
| 46. | 57001 | 7.1% | 17.4%(-10.3)#46 | 18.1%(-10.9)#4,371 |
| 47. | 57219 | 7.1% | 17.4%(-10.3)#47 | 18.1%(-10.9)#4,388 |
| 48. | 57345 | 7.4% | 17.4%(-10.0)#48 | 18.1%(-10.7)#4,551 |
| 49. | 57274 | 7.8% | 17.4%(-9.64)#49 | 18.1%(-10.3)#4,794 |
| 50. | 57106 | 8.2% | 17.4%(-9.28)#50 | 18.1%(-9.90)#5,009 |
| 51. | 57467 | 8.2% | 17.4%(-9.24)#51 | 18.1%(-9.87)#5,032 |
| 52. | 57564 | 8.5% | 17.4%(-8.93)#52 | 18.1%(-9.55)#5,267 |
| 53. | 57248 | 8.7% | 17.4%(-8.72)#53 | 18.1%(-9.34)#5,421 |
| 54. | 57234 | 8.8% | 17.4%(-8.67)#54 | 18.1%(-9.29)#5,446 |
| 55. | 57066 | 8.8% | 17.4%(-8.67)#55 | 18.1%(-9.29)#5,447 |
| 56. | 57532 | 8.8% | 17.4%(-8.59)#56 | 18.1%(-9.21)#5,515 |
| 57. | 57533 | 8.9% | 17.4%(-8.55)#57 | 18.1%(-9.17)#5,532 |
| 58. | 57045 | 9.0% | 17.4%(-8.43)#58 | 18.1%(-9.05)#5,623 |
| 59. | 57070 | 9.2% | 17.4%(-8.21)#59 | 18.1%(-8.83)#5,770 |
| 60. | 57048 | 9.7% | 17.4%(-7.76)#60 | 18.1%(-8.39)#6,068 |
| 61. | 57451 | 9.9% | 17.4%(-7.50)#61 | 18.1%(-8.12)#6,212 |
| 62. | 57751 | 10.0% | 17.4%(-7.44)#62 | 18.1%(-8.06)#6,260 |
| 63. | 57471 | 10.0% | 17.4%(-7.44)#63 | 18.1%(-8.06)#6,273 |
| 64. | 57036 | 10.3% | 17.4%(-7.18)#64 | 18.1%(-7.81)#6,415 |
| 65. | 57783 | 10.3% | 17.4%(-7.17)#65 | 18.1%(-7.79)#6,421 |
| 66. | 57013 | 10.3% | 17.4%(-7.13)#66 | 18.1%(-7.75)#6,454 |
| 67. | 57037 | 10.5% | 17.4%(-6.92)#67 | 18.1%(-7.54)#6,572 |
| 68. | 57261 | 10.5% | 17.4%(-6.92)#68 | 18.1%(-7.54)#6,578 |
| 69. | 57006 | 10.7% | 17.4%(-6.78)#69 | 18.1%(-7.40)#6,653 |
| 70. | 57761 | 10.7% | 17.4%(-6.77)#70 | 18.1%(-7.40)#6,660 |
| 71. | 57067 | 11.1% | 17.4%(-6.33)#71 | 18.1%(-6.95)#6,928 |
| 72. | 57401 | 11.2% | 17.4%(-6.29)#72 | 18.1%(-6.91)#6,948 |
| 73. | 57552 | 11.4% | 17.4%(-6.01)#73 | 18.1%(-6.63)#7,108 |
| 74. | 57226 | 11.9% | 17.4%(-5.58)#74 | 18.1%(-6.20)#7,379 |
| 75. | 57212 | 12.0% | 17.4%(-5.48)#75 | 18.1%(-6.11)#7,430 |
| 76. | 57342 | 12.5% | 17.4%(-4.94)#76 | 18.1%(-5.56)#7,785 |
| 77. | 57769 | 12.8% | 17.4%(-4.65)#77 | 18.1%(-5.27)#7,920 |
| 78. | 57359 | 12.9% | 17.4%(-4.54)#78 | 18.1%(-5.16)#7,991 |
| 79. | 57350 | 13.0% | 17.4%(-4.46)#79 | 18.1%(-5.08)#8,032 |
| 80. | 57430 | 13.2% | 17.4%(-4.25)#80 | 18.1%(-4.88)#8,145 |
| 81. | 57059 | 13.4% | 17.4%(-4.04)#81 | 18.1%(-4.66)#8,291 |
| 82. | 57201 | 13.6% | 17.4%(-3.84)#82 | 18.1%(-4.47)#8,397 |
| 83. | 57319 | 13.7% | 17.4%(-3.74)#83 | 18.1%(-4.36)#8,461 |
| 84. | 57722 | 14.3% | 17.4%(-3.16)#84 | 18.1%(-3.78)#8,849 |
| 85. | 57325 | 14.6% | 17.4%(-2.83)#85 | 18.1%(-3.46)#8,994 |
| 86. | 57522 | 15.0% | 17.4%(-2.44)#86 | 18.1%(-3.06)#9,214 |
| 87. | 57656 | 15.1% | 17.4%(-2.33)#87 | 18.1%(-2.95)#9,280 |
| 88. | 57078 | 15.4% | 17.4%(-2.09)#88 | 18.1%(-2.71)#9,404 |
| 89. | 57107 | 15.6% | 17.4%(-1.80)#89 | 18.1%(-2.43)#9,566 |
| 90. | 57501 | 16.3% | 17.4%(-1.16)#90 | 18.1%(-1.78)#9,908 |
| 91. | 57601 | 16.5% | 17.4%(-0.936)#91 | 18.1%(-1.56)#10,031 |
| 92. | 57730 | 17.4% | 17.4%(-0.090)#92 | 18.1%(-0.711)#10,414 |
| 93. | 57110 | 17.5% | 17.4%(+0.062)#93 | 18.1%(-0.560)#10,476 |
| 94. | 57544 | 17.9% | 17.4%(+0.416)#94 | 18.1%(-0.206)#10,650 |
| 95. | 57450 | 18.2% | 17.4%(+0.740)#95 | 18.1%(+0.119)#10,810 |
| 96. | 57380 | 18.4% | 17.4%(+0.920)#96 | 18.1%(+0.299)#10,886 |
| 97. | 57446 | 19.8% | 17.4%(+2.31)#97 | 18.1%(+1.69)#11,515 |
| 98. | 57788 | 20.0% | 17.4%(+2.56)#98 | 18.1%(+1.94)#11,641 |
| 99. | 57218 | 20.0% | 17.4%(+2.56)#99 | 18.1%(+1.94)#11,657 |
| 100. | 57271 | 20.5% | 17.4%(+3.01)#100 | 18.1%(+2.39)#11,852 |
Common Questions
What are the Top 10 Zip Codes with the Lowest Poverty Level Among Children Under the Age of 5 in South Dakota?
Top 10 Zip Codes with the Lowest Poverty Level Among Children Under the Age of 5 in South Dakota are:
What zip code has the Lowest Poverty Level Among Children Under the Age of 5 in South Dakota?
57105 has the Lowest Poverty Level Among Children Under the Age of 5 in South Dakota with 0.70%.
What is the Poverty Level Among Children Under the Age of 5 in the State of South Dakota?
Poverty Level Among Children Under the Age of 5 in South Dakota is 17.4%.
What is the Poverty Level Among Children Under the Age of 5 in the United States?
Poverty Level Among Children Under the Age of 5 in the United States is 18.1%.