Roscoe, SD Map & Demographics
Roscoe Map
Roscoe Overview
$37,719
PER CAPITA INCOME
$78,125
AVG FAMILY INCOME
$46,667
AVG HOUSEHOLD INCOME
19.4%
WAGE / INCOME GAP [ % ]
80.6¢/ $1
WAGE / INCOME GAP [ $ ]
0.55
INEQUALITY / GINI INDEX
329
TOTAL POPULATION
185
MALE POPULATION
144
FEMALE POPULATION
128.47
MALES / 100 FEMALES
77.84
FEMALES / 100 MALES
45.8
MEDIAN AGE
3.3
AVG FAMILY SIZE
2.1
AVG HOUSEHOLD SIZE
206
LABOR FORCE [ PEOPLE ]
71.8%
PERCENT IN LABOR FORCE
Roscoe Zip Codes
Roscoe Area Codes
Income in Roscoe
Income Overview in Roscoe
Per Capita Income in Roscoe is $37,719, while median incomes of families and households are $78,125 and $46,667 respectively.
| Characteristic | Number | Measure |
| Per Capita Income | 329 | $37,719 |
| Median Family Income | 59 | $78,125 |
| Mean Family Income | 59 | $122,222 |
| Median Household Income | 158 | $46,667 |
| Mean Household Income | 158 | $73,007 |
| Income Deficit | 59 | $0 |
| Wage / Income Gap (%) | 329 | 19.43% |
| Wage / Income Gap ($) | 329 | 80.57¢ per $1 |
| Gini / Inequality Index | 329 | 0.55 |
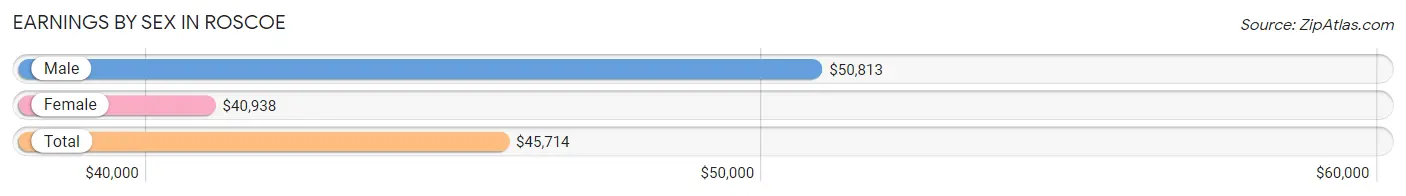
Earnings by Sex in Roscoe
Average Earnings in Roscoe are $45,714, $50,813 for men and $40,938 for women, a difference of 19.4%.
| Sex | Number | Average Earnings |
| Male | 145 (67.8%) | $50,813 |
| Female | 69 (32.2%) | $40,938 |
| Total | 214 (100.0%) | $45,714 |
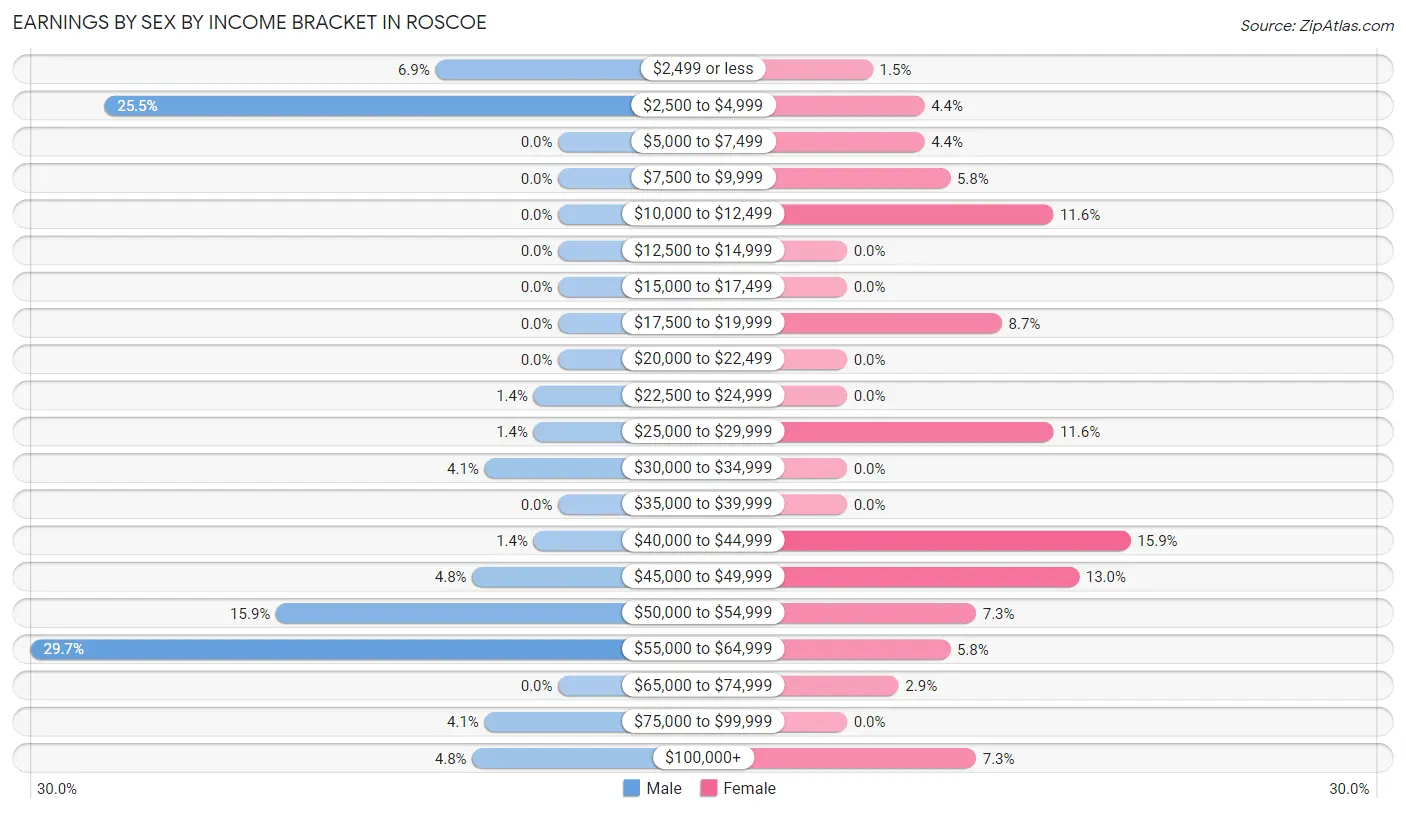
Earnings by Sex by Income Bracket in Roscoe
The most common earnings brackets in Roscoe are $55,000 to $64,999 for men (43 | 29.7%) and $40,000 to $44,999 for women (11 | 15.9%).
| Income | Male | Female |
| $2,499 or less | 10 (6.9%) | 1 (1.5%) |
| $2,500 to $4,999 | 37 (25.5%) | 3 (4.3%) |
| $5,000 to $7,499 | 0 (0.0%) | 3 (4.3%) |
| $7,500 to $9,999 | 0 (0.0%) | 4 (5.8%) |
| $10,000 to $12,499 | 0 (0.0%) | 8 (11.6%) |
| $12,500 to $14,999 | 0 (0.0%) | 0 (0.0%) |
| $15,000 to $17,499 | 0 (0.0%) | 0 (0.0%) |
| $17,500 to $19,999 | 0 (0.0%) | 6 (8.7%) |
| $20,000 to $22,499 | 0 (0.0%) | 0 (0.0%) |
| $22,500 to $24,999 | 2 (1.4%) | 0 (0.0%) |
| $25,000 to $29,999 | 2 (1.4%) | 8 (11.6%) |
| $30,000 to $34,999 | 6 (4.1%) | 0 (0.0%) |
| $35,000 to $39,999 | 0 (0.0%) | 0 (0.0%) |
| $40,000 to $44,999 | 2 (1.4%) | 11 (15.9%) |
| $45,000 to $49,999 | 7 (4.8%) | 9 (13.0%) |
| $50,000 to $54,999 | 23 (15.9%) | 5 (7.2%) |
| $55,000 to $64,999 | 43 (29.7%) | 4 (5.8%) |
| $65,000 to $74,999 | 0 (0.0%) | 2 (2.9%) |
| $75,000 to $99,999 | 6 (4.1%) | 0 (0.0%) |
| $100,000+ | 7 (4.8%) | 5 (7.2%) |
| Total | 145 (100.0%) | 69 (100.0%) |
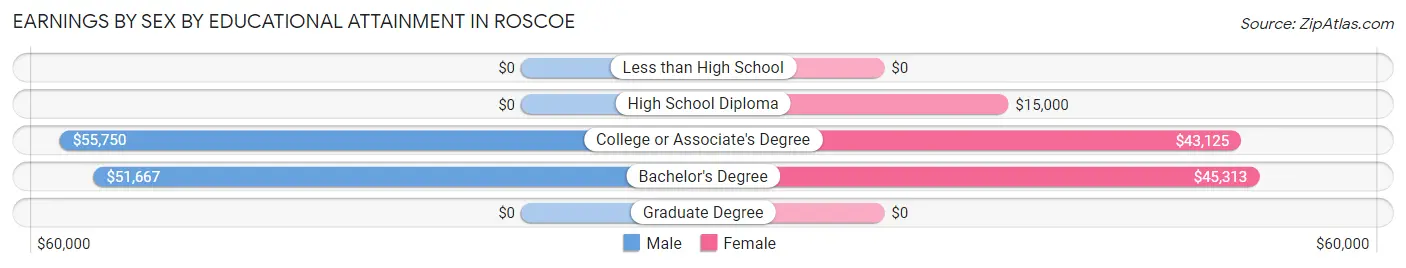
Earnings by Sex by Educational Attainment in Roscoe
Average earnings in Roscoe are $51,438 for men and $41,875 for women, a difference of 18.6%. Men with an educational attainment of college or associate's degree enjoy the highest average annual earnings of $55,750, while those with bachelor's degree education earn the least with $51,667. Women with an educational attainment of bachelor's degree earn the most with the average annual earnings of $45,313, while those with high school diploma education have the smallest earnings of $15,000.
| Educational Attainment | Male Income | Female Income |
| Less than High School | - | - |
| High School Diploma | - | - |
| College or Associate's Degree | $55,750 | $43,125 |
| Bachelor's Degree | $51,667 | $45,313 |
| Graduate Degree | - | - |
| Total | $51,438 | $41,875 |
Family Income in Roscoe
Family Income Brackets in Roscoe
According to the Roscoe family income data, there are 15 families falling into the $50,000 to $74,999 income range, which is the most common income bracket and makes up 25.4% of all families.
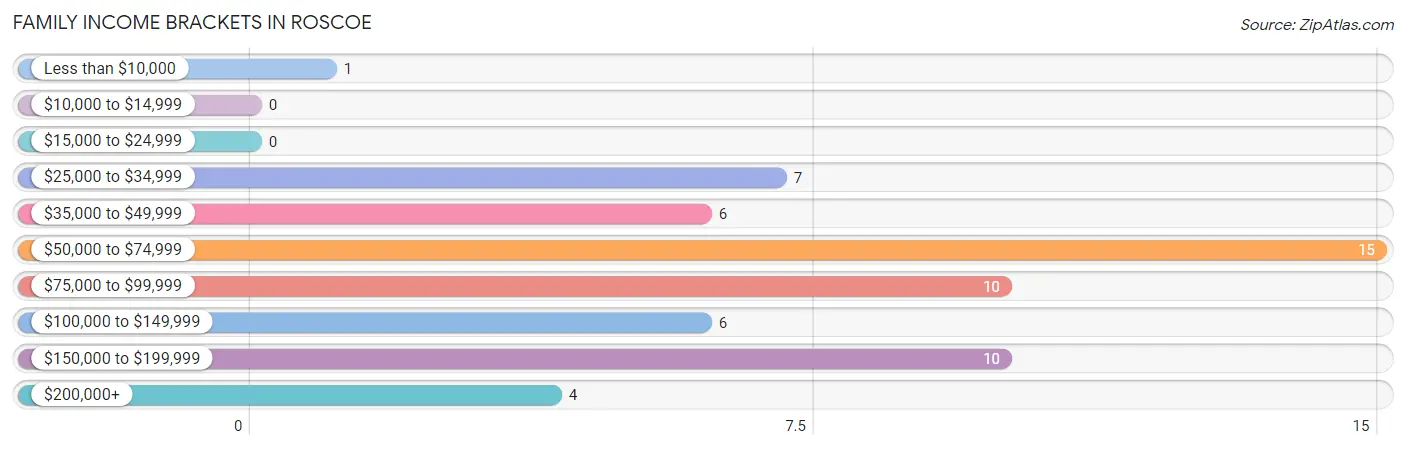
| Income Bracket | # Families | % Families |
| Less than $10,000 | 1 | 1.7% |
| $10,000 to $14,999 | 0 | 0.0% |
| $15,000 to $24,999 | 0 | 0.0% |
| $25,000 to $34,999 | 7 | 11.9% |
| $35,000 to $49,999 | 6 | 10.2% |
| $50,000 to $74,999 | 15 | 25.4% |
| $75,000 to $99,999 | 10 | 16.9% |
| $100,000 to $149,999 | 6 | 10.2% |
| $150,000 to $199,999 | 10 | 16.9% |
| $200,000+ | 4 | 6.8% |
Family Income by Famaliy Size in Roscoe
2-person families (34 | 57.6%) account for the highest median family income in Roscoe with $82,500 per family, while 2-person families (34 | 57.6%) have the highest median income of $41,250 per family member.
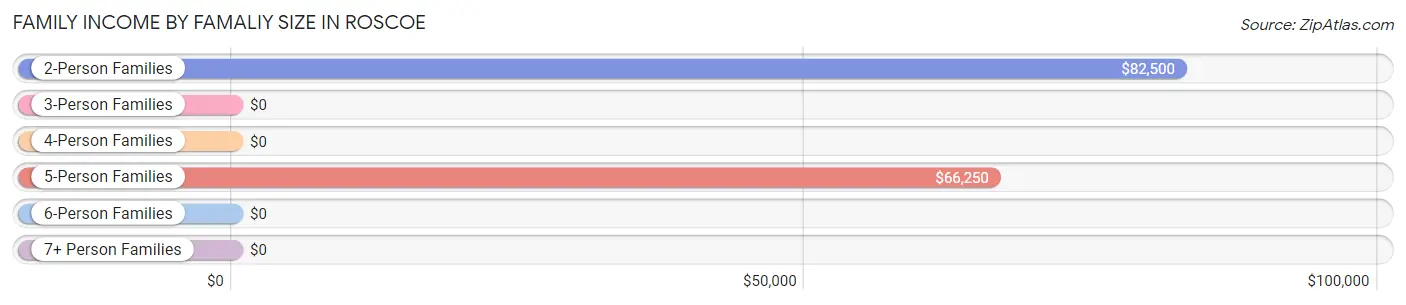
| Income Bracket | # Families | Median Income |
| 2-Person Families | 34 (57.6%) | $82,500 |
| 3-Person Families | 11 (18.6%) | $0 |
| 4-Person Families | 4 (6.8%) | $0 |
| 5-Person Families | 10 (17.0%) | $66,250 |
| 6-Person Families | 0 (0.0%) | $0 |
| 7+ Person Families | 0 (0.0%) | $0 |
| Total | 59 (100.0%) | $78,125 |
Family Income by Number of Earners in Roscoe
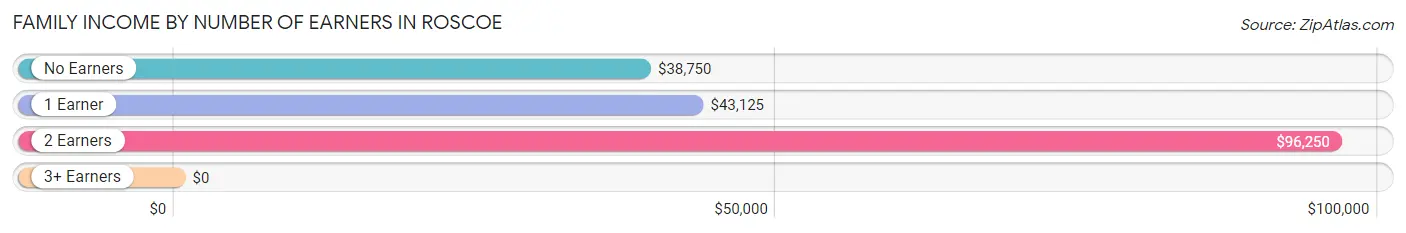
| Number of Earners | # Families | Median Income |
| No Earners | 4 (6.8%) | $38,750 |
| 1 Earner | 17 (28.8%) | $43,125 |
| 2 Earners | 30 (50.8%) | $96,250 |
| 3+ Earners | 8 (13.6%) | $0 |
| Total | 59 (100.0%) | $78,125 |
Household Income in Roscoe
Household Income Brackets in Roscoe
With 50 households falling in the category, the $10,000 to $14,999 income range is the most frequent in Roscoe, accounting for 31.7% of all households. In contrast, only 1 households (0.6%) fall into the less than $10,000 income bracket, making it the least populous group.
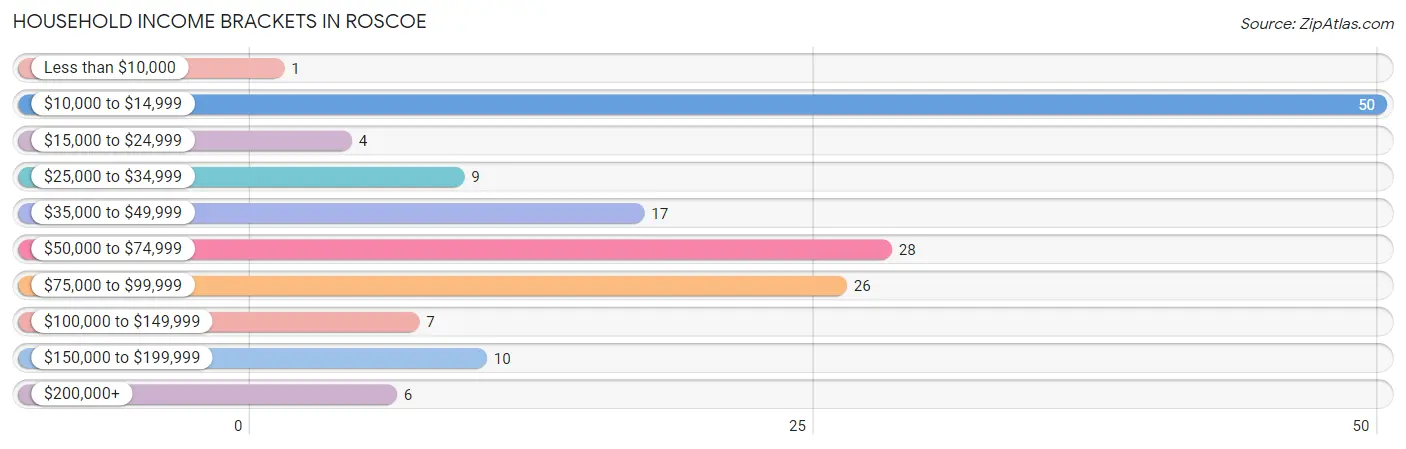
| Income Bracket | # Households | % Households |
| Less than $10,000 | 1 | 0.6% |
| $10,000 to $14,999 | 50 | 31.6% |
| $15,000 to $24,999 | 4 | 2.5% |
| $25,000 to $34,999 | 9 | 5.7% |
| $35,000 to $49,999 | 17 | 10.8% |
| $50,000 to $74,999 | 28 | 17.7% |
| $75,000 to $99,999 | 26 | 16.5% |
| $100,000 to $149,999 | 7 | 4.4% |
| $150,000 to $199,999 | 10 | 6.3% |
| $200,000+ | 6 | 3.8% |
Household Income by Householder Age in Roscoe
The median household income in Roscoe is $46,667, with the highest median household income of $67,292 found in the 25 to 44 years age bracket for the primary householder. A total of 37 households (23.4%) fall into this category. Meanwhile, the 15 to 24 years age bracket for the primary householder has the lowest median household income of $0, with 3 households (1.9%) in this group.
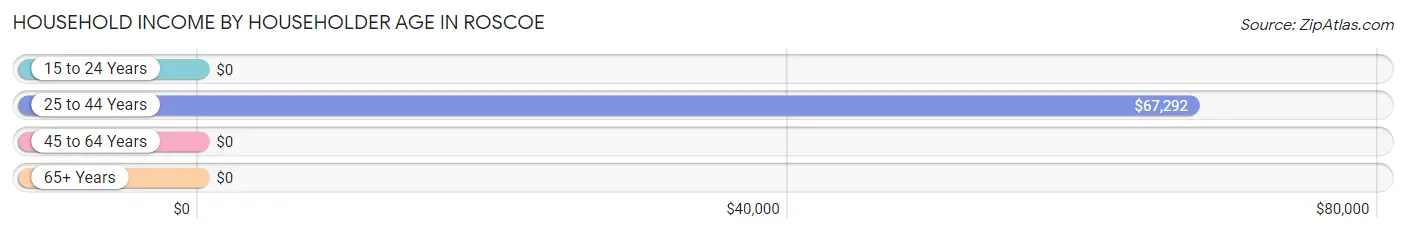
| Income Bracket | # Households | Median Income |
| 15 to 24 Years | 3 (1.9%) | $0 |
| 25 to 44 Years | 37 (23.4%) | $67,292 |
| 45 to 64 Years | 83 (52.5%) | $0 |
| 65+ Years | 35 (22.2%) | $0 |
| Total | 158 (100.0%) | $46,667 |
Poverty in Roscoe
Income Below Poverty by Sex and Age in Roscoe
With 22.7% poverty level for males and 22.2% for females among the residents of Roscoe, 55 to 64 year old males and 65 to 74 year old females are the most vulnerable to poverty, with 37 males (69.8%) and 13 females (56.5%) in their respective age groups living below the poverty level.
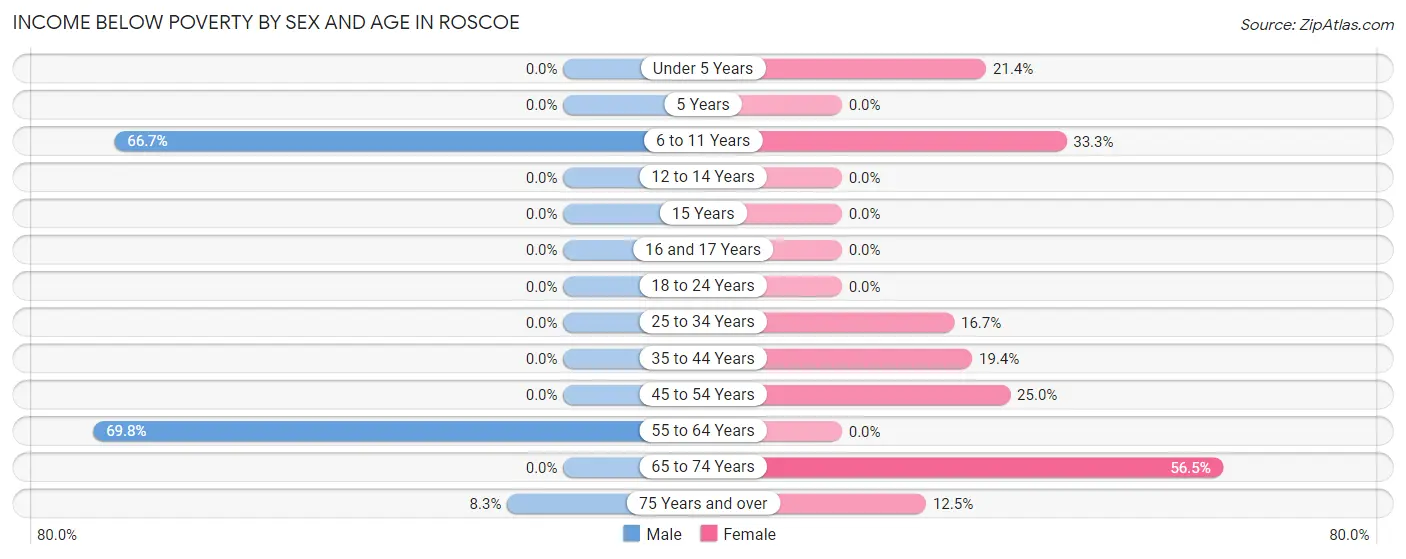
| Age Bracket | Male | Female |
| Under 5 Years | 0 (0.0%) | 3 (21.4%) |
| 5 Years | 0 (0.0%) | 0 (0.0%) |
| 6 to 11 Years | 4 (66.7%) | 3 (33.3%) |
| 12 to 14 Years | 0 (0.0%) | 0 (0.0%) |
| 15 Years | 0 (0.0%) | 0 (0.0%) |
| 16 and 17 Years | 0 (0.0%) | 0 (0.0%) |
| 18 to 24 Years | 0 (0.0%) | 0 (0.0%) |
| 25 to 34 Years | 0 (0.0%) | 2 (16.7%) |
| 35 to 44 Years | 0 (0.0%) | 6 (19.4%) |
| 45 to 54 Years | 0 (0.0%) | 4 (25.0%) |
| 55 to 64 Years | 37 (69.8%) | 0 (0.0%) |
| 65 to 74 Years | 0 (0.0%) | 13 (56.5%) |
| 75 Years and over | 1 (8.3%) | 1 (12.5%) |
| Total | 42 (22.7%) | 32 (22.2%) |
Income Above Poverty by Sex and Age in Roscoe
According to the poverty statistics in Roscoe, males aged under 5 years and females aged 12 to 14 years are the age groups that are most secure financially, with 100.0% of males and 100.0% of females in these age groups living above the poverty line.
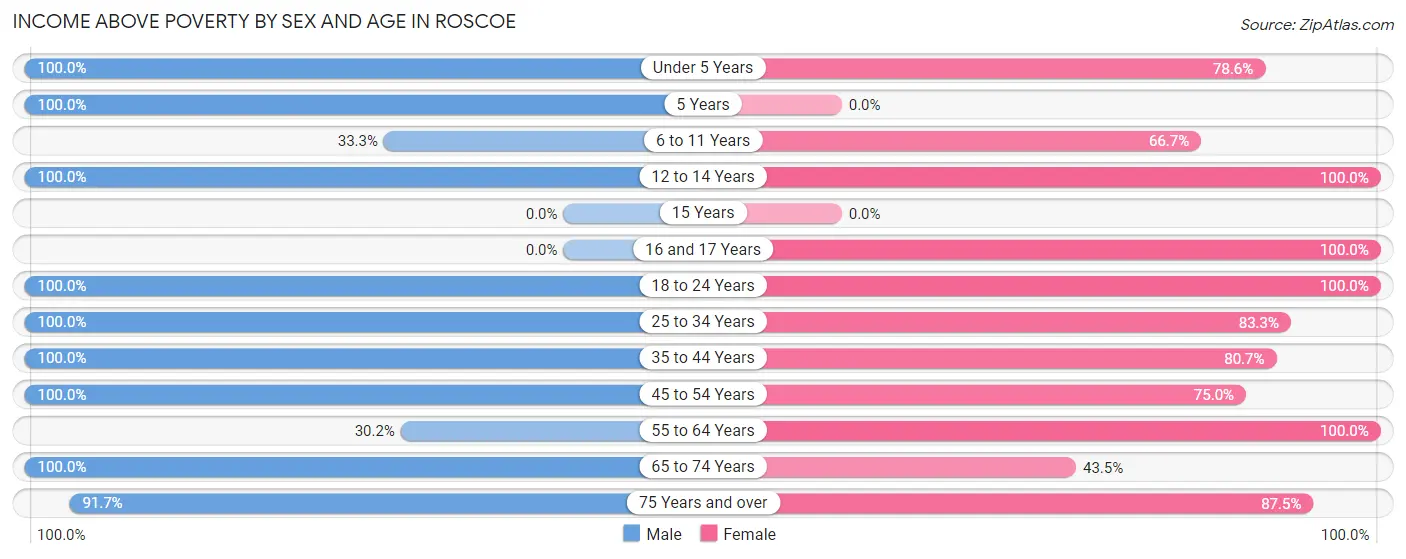
| Age Bracket | Male | Female |
| Under 5 Years | 2 (100.0%) | 11 (78.6%) |
| 5 Years | 7 (100.0%) | 0 (0.0%) |
| 6 to 11 Years | 2 (33.3%) | 6 (66.7%) |
| 12 to 14 Years | 2 (100.0%) | 2 (100.0%) |
| 15 Years | 0 (0.0%) | 0 (0.0%) |
| 16 and 17 Years | 0 (0.0%) | 13 (100.0%) |
| 18 to 24 Years | 10 (100.0%) | 3 (100.0%) |
| 25 to 34 Years | 17 (100.0%) | 10 (83.3%) |
| 35 to 44 Years | 30 (100.0%) | 25 (80.6%) |
| 45 to 54 Years | 30 (100.0%) | 12 (75.0%) |
| 55 to 64 Years | 16 (30.2%) | 13 (100.0%) |
| 65 to 74 Years | 16 (100.0%) | 10 (43.5%) |
| 75 Years and over | 11 (91.7%) | 7 (87.5%) |
| Total | 143 (77.3%) | 112 (77.8%) |
Income Below Poverty Among Married-Couple Families in Roscoe
The poverty statistics for married-couple families in Roscoe show that 1.8% or 1 of the total 56 families live below the poverty line. Families with no children have the highest poverty rate of 2.6%, comprising of 1 families. On the other hand, families with 1 or 2 children have the lowest poverty rate of 0.0%, which includes 0 families.
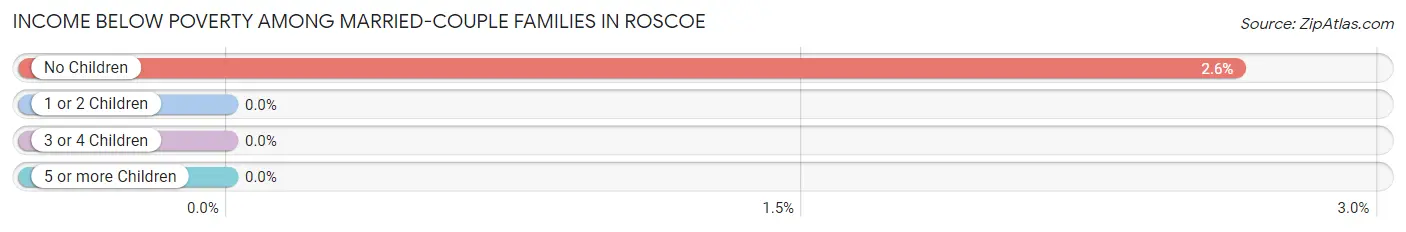
| Children | Above Poverty | Below Poverty |
| No Children | 37 (97.4%) | 1 (2.6%) |
| 1 or 2 Children | 18 (100.0%) | 0 (0.0%) |
| 3 or 4 Children | 0 (0.0%) | 0 (0.0%) |
| 5 or more Children | 0 (0.0%) | 0 (0.0%) |
| Total | 55 (98.2%) | 1 (1.8%) |
Income Below Poverty Among Single-Parent Households in Roscoe
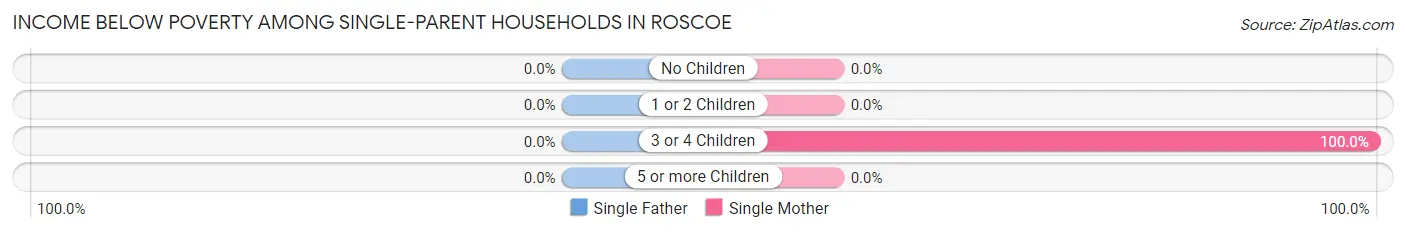
| Children | Single Father | Single Mother |
| No Children | 0 (0.0%) | 0 (0.0%) |
| 1 or 2 Children | 0 (0.0%) | 0 (0.0%) |
| 3 or 4 Children | 0 (0.0%) | 2 (100.0%) |
| 5 or more Children | 0 (0.0%) | 0 (0.0%) |
| Total | 0 (0.0%) | 2 (66.7%) |
Income Below Poverty Among Married-Couple vs Single-Parent Households in Roscoe
The poverty data for Roscoe shows that 1 of the married-couple family households (1.8%) and 2 of the single-parent households (66.7%) are living below the poverty level. Within the married-couple family households, those with no children have the highest poverty rate, with 1 households (2.6%) falling below the poverty line. Among the single-parent households, those with 3 or 4 children have the highest poverty rate, with 2 household (100.0%) living below poverty.
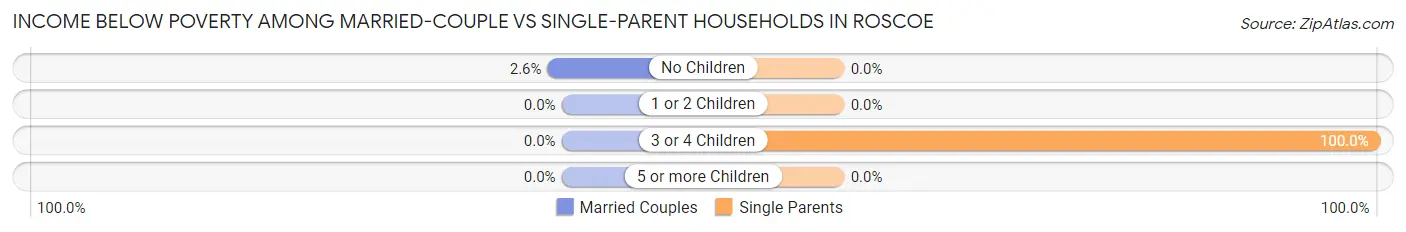
| Children | Married-Couple Families | Single-Parent Households |
| No Children | 1 (2.6%) | 0 (0.0%) |
| 1 or 2 Children | 0 (0.0%) | 0 (0.0%) |
| 3 or 4 Children | 0 (0.0%) | 2 (100.0%) |
| 5 or more Children | 0 (0.0%) | 0 (0.0%) |
| Total | 1 (1.8%) | 2 (66.7%) |
Race in Roscoe
The most populous races in Roscoe are White / Caucasian (296 | 90.0%), Hispanic or Latino (20 | 6.1%), and Some other Race (20 | 6.1%).
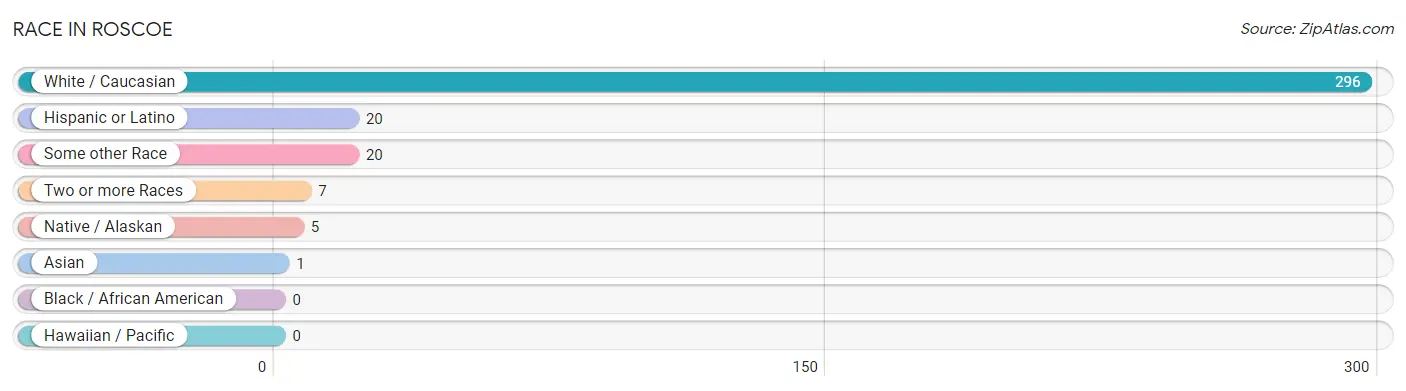
| Race | # Population | % Population |
| Asian | 1 | 0.3% |
| Black / African American | 0 | 0.0% |
| Hawaiian / Pacific | 0 | 0.0% |
| Hispanic or Latino | 20 | 6.1% |
| Native / Alaskan | 5 | 1.5% |
| White / Caucasian | 296 | 90.0% |
| Two or more Races | 7 | 2.1% |
| Some other Race | 20 | 6.1% |
| Total | 329 | 100.0% |
Ancestry in Roscoe
The most populous ancestries reported in Roscoe are German (203 | 61.7%), Russian (56 | 17.0%), Norwegian (39 | 11.8%), Scandinavian (31 | 9.4%), and Mexican (20 | 6.1%), together accounting for 106.1% of all Roscoe residents.
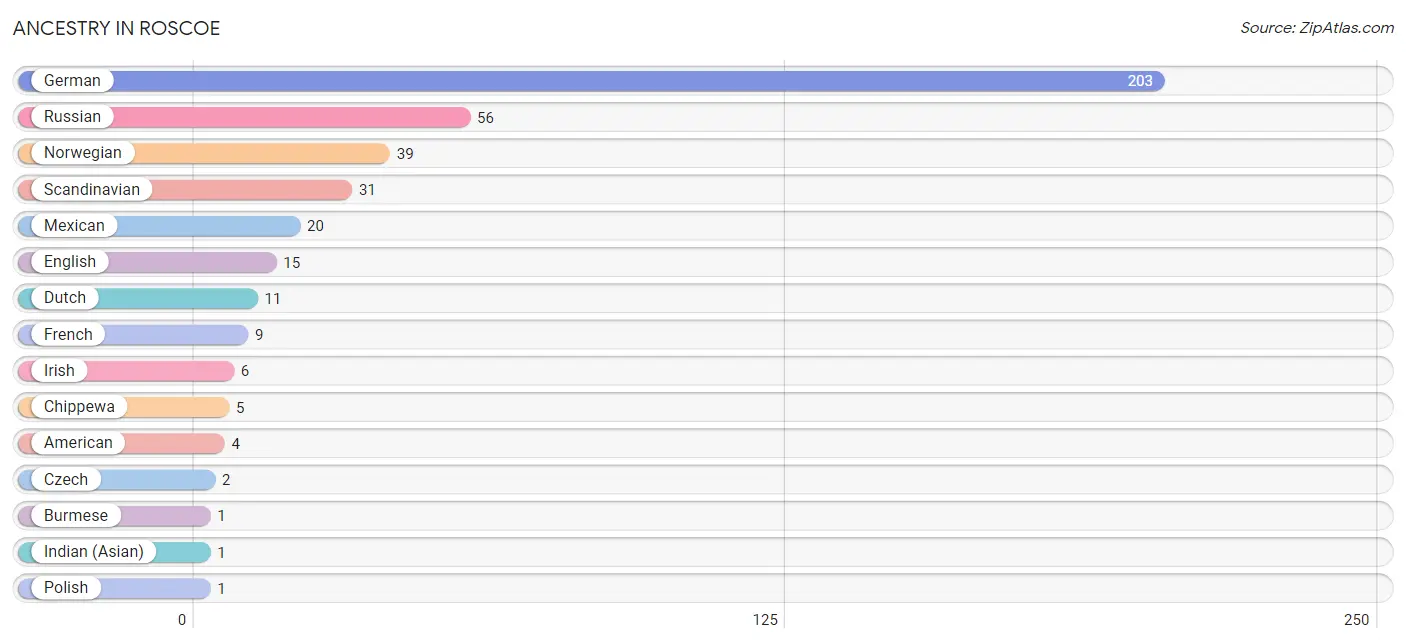
| Ancestry | # Population | % Population |
| American | 4 | 1.2% |
| Burmese | 1 | 0.3% |
| Chippewa | 5 | 1.5% |
| Czech | 2 | 0.6% |
| Dutch | 11 | 3.3% |
| English | 15 | 4.6% |
| French | 9 | 2.7% |
| German | 203 | 61.7% |
| Indian (Asian) | 1 | 0.3% |
| Irish | 6 | 1.8% |
| Mexican | 20 | 6.1% |
| Norwegian | 39 | 11.8% |
| Polish | 1 | 0.3% |
| Russian | 56 | 17.0% |
| Scandinavian | 31 | 9.4% | View All 15 Rows |
Immigrants in Roscoe
The most numerous immigrant groups reported in Roscoe came from Central America (4 | 1.2%), Latin America (4 | 1.2%), Mexico (4 | 1.2%), Asia (1 | 0.3%), and China (1 | 0.3%), together accounting for 4.3% of all Roscoe residents.
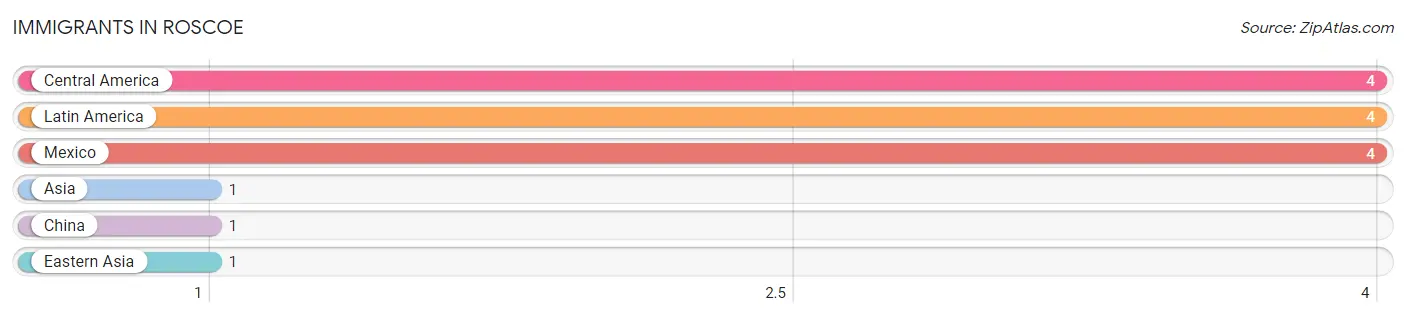
| Immigration Origin | # Population | % Population |
| Asia | 1 | 0.3% |
| Central America | 4 | 1.2% |
| China | 1 | 0.3% |
| Eastern Asia | 1 | 0.3% |
| Latin America | 4 | 1.2% |
| Mexico | 4 | 1.2% | View All 6 Rows |
Sex and Age in Roscoe
Sex and Age in Roscoe
The most populous age groups in Roscoe are 55 to 59 Years (41 | 22.2%) for men and 35 to 39 Years (25 | 17.4%) for women.
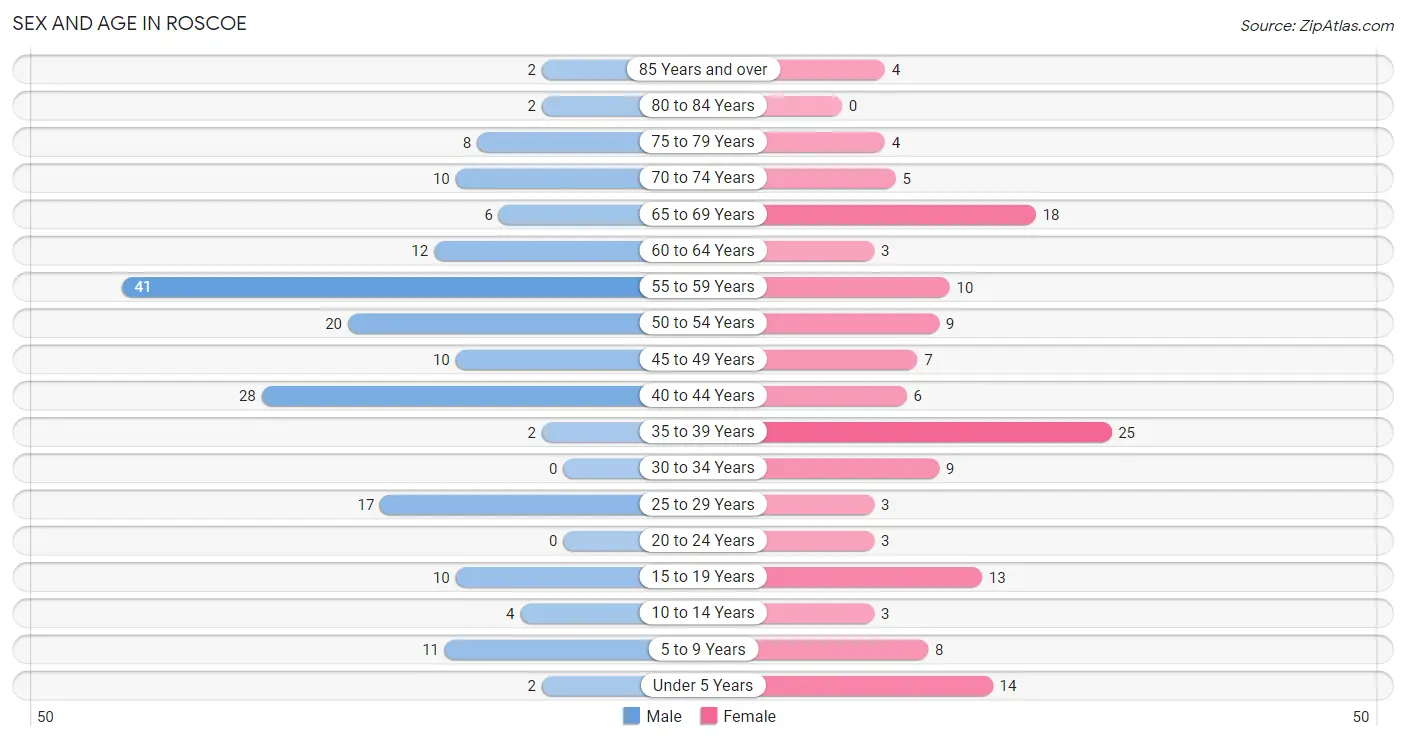
| Age Bracket | Male | Female |
| Under 5 Years | 2 (1.1%) | 14 (9.7%) |
| 5 to 9 Years | 11 (5.9%) | 8 (5.6%) |
| 10 to 14 Years | 4 (2.2%) | 3 (2.1%) |
| 15 to 19 Years | 10 (5.4%) | 13 (9.0%) |
| 20 to 24 Years | 0 (0.0%) | 3 (2.1%) |
| 25 to 29 Years | 17 (9.2%) | 3 (2.1%) |
| 30 to 34 Years | 0 (0.0%) | 9 (6.2%) |
| 35 to 39 Years | 2 (1.1%) | 25 (17.4%) |
| 40 to 44 Years | 28 (15.1%) | 6 (4.2%) |
| 45 to 49 Years | 10 (5.4%) | 7 (4.9%) |
| 50 to 54 Years | 20 (10.8%) | 9 (6.2%) |
| 55 to 59 Years | 41 (22.2%) | 10 (6.9%) |
| 60 to 64 Years | 12 (6.5%) | 3 (2.1%) |
| 65 to 69 Years | 6 (3.2%) | 18 (12.5%) |
| 70 to 74 Years | 10 (5.4%) | 5 (3.5%) |
| 75 to 79 Years | 8 (4.3%) | 4 (2.8%) |
| 80 to 84 Years | 2 (1.1%) | 0 (0.0%) |
| 85 Years and over | 2 (1.1%) | 4 (2.8%) |
| Total | 185 (100.0%) | 144 (100.0%) |
Families and Households in Roscoe
Median Family Size in Roscoe
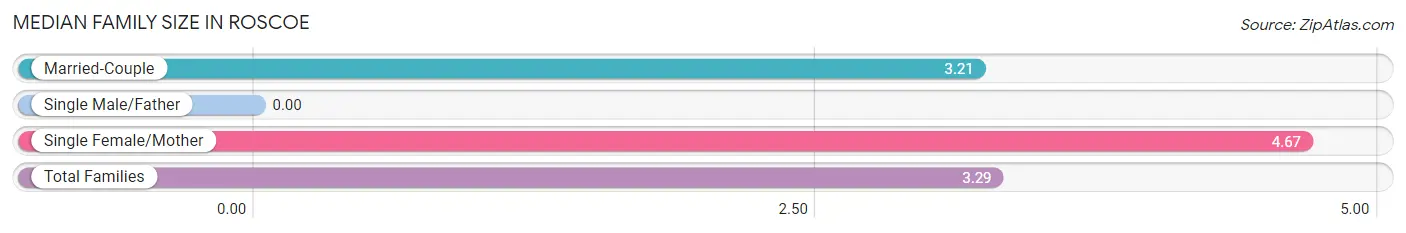
| Family Type | # Families | Family Size |
| Married-Couple | 56 (94.9%) | 3.21 |
| Single Male/Father | 0 (0.0%) | - |
| Single Female/Mother | 3 (5.1%) | 4.67 |
| Total Families | 59 (100.0%) | 3.29 |
Median Household Size in Roscoe
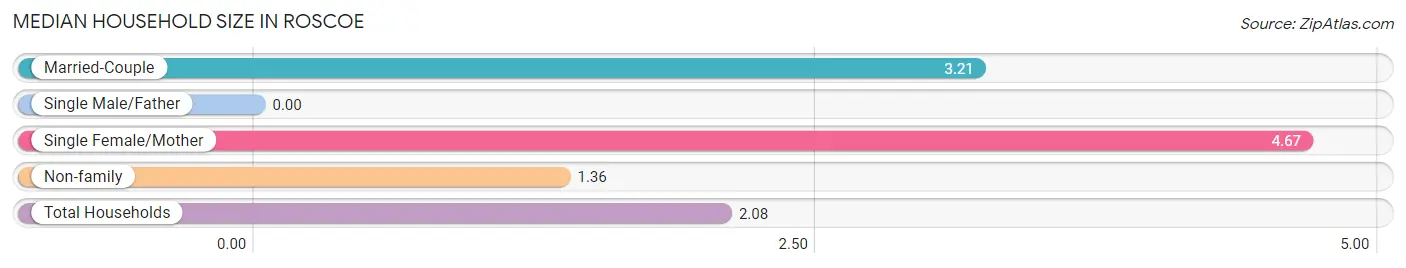
| Household Type | # Households | Household Size |
| Married-Couple | 56 (35.4%) | 3.21 |
| Single Male/Father | 0 (0.0%) | - |
| Single Female/Mother | 3 (1.9%) | 4.67 |
| Non-family | 99 (62.7%) | 1.36 |
| Total Households | 158 (100.0%) | 2.08 |
Household Size by Marriage Status in Roscoe
Out of a total of 158 households in Roscoe, 59 (37.3%) are family households, while 99 (62.7%) are nonfamily households. The most numerous type of family households are 2-person households, comprising 34, and the most common type of nonfamily households are 1-person households, comprising 73.
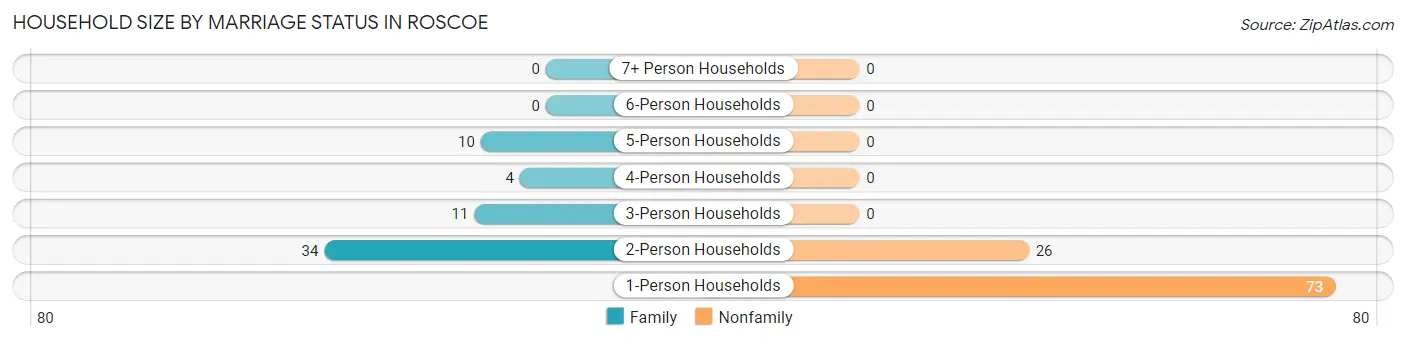
| Household Size | Family Households | Nonfamily Households |
| 1-Person Households | - | 73 (46.2%) |
| 2-Person Households | 34 (21.5%) | 26 (16.5%) |
| 3-Person Households | 11 (7.0%) | 0 (0.0%) |
| 4-Person Households | 4 (2.5%) | 0 (0.0%) |
| 5-Person Households | 10 (6.3%) | 0 (0.0%) |
| 6-Person Households | 0 (0.0%) | 0 (0.0%) |
| 7+ Person Households | 0 (0.0%) | 0 (0.0%) |
| Total | 59 (37.3%) | 99 (62.7%) |
Female Fertility in Roscoe
Fertility by Age in Roscoe
Average fertility rate in Roscoe is 45.0 births per 1,000 women. Women in the age bracket of 20 to 34 years have the highest fertility rate with 200.0 births per 1,000 women. Women in the age bracket of 20 to 34 years acount for 100.0% of all women with births.
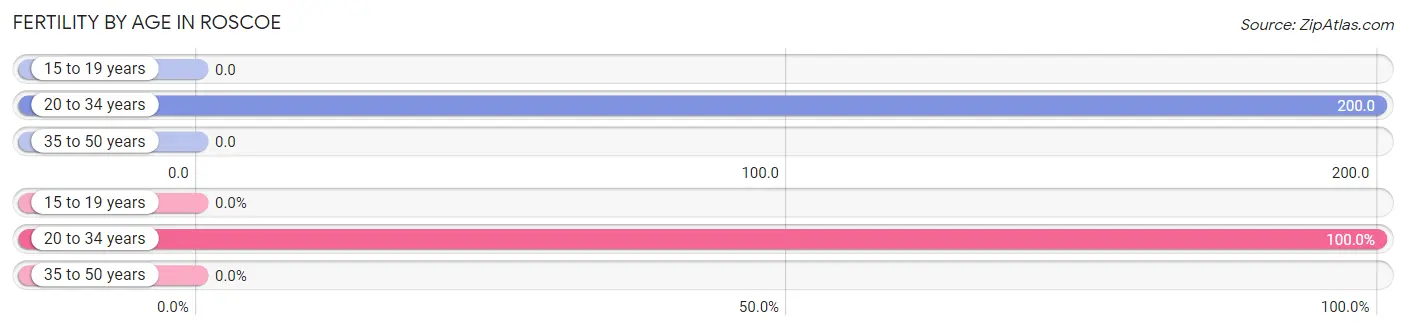
| Age Bracket | Women with Births | Births / 1,000 Women |
| 15 to 19 years | 0 (0.0%) | 0.0 |
| 20 to 34 years | 3 (100.0%) | 200.0 |
| 35 to 50 years | 0 (0.0%) | 0.0 |
| Total | 3 (100.0%) | 45.0 |
Fertility by Age by Marriage Status in Roscoe
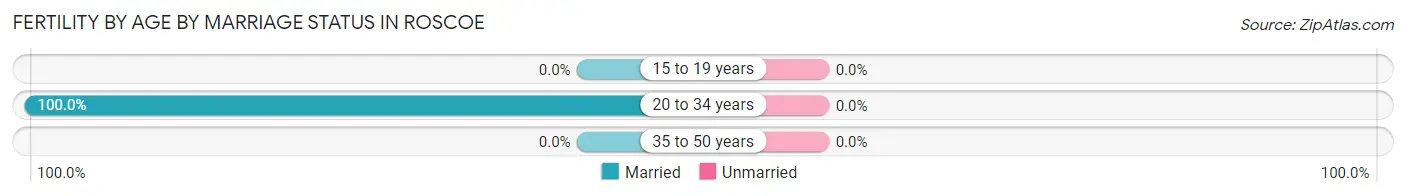
| Age Bracket | Married | Unmarried |
| 15 to 19 years | 0 (0.0%) | 0 (0.0%) |
| 20 to 34 years | 3 (100.0%) | 0 (0.0%) |
| 35 to 50 years | 0 (0.0%) | 0 (0.0%) |
| Total | 3 (100.0%) | 0 (0.0%) |
Fertility by Education in Roscoe
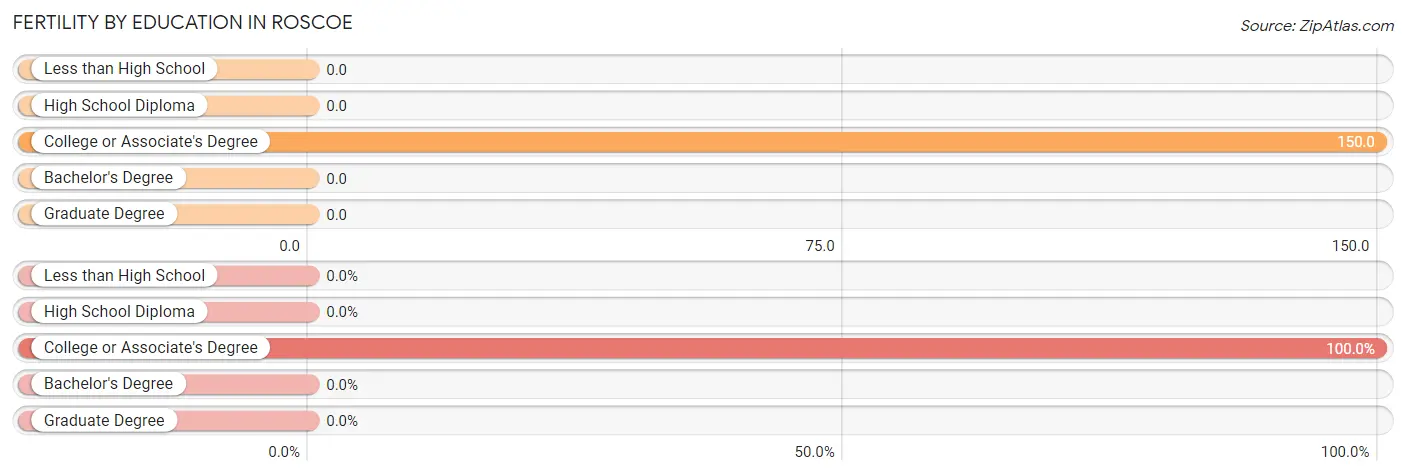
| Educational Attainment | Women with Births | Births / 1,000 Women |
| Less than High School | 0 (0.0%) | 0.0 |
| High School Diploma | 0 (0.0%) | 0.0 |
| College or Associate's Degree | 3 (100.0%) | 150.0 |
| Bachelor's Degree | 0 (0.0%) | 0.0 |
| Graduate Degree | 0 (0.0%) | 0.0 |
| Total | 3 (100.0%) | 45.0 |
Fertility by Education by Marriage Status in Roscoe
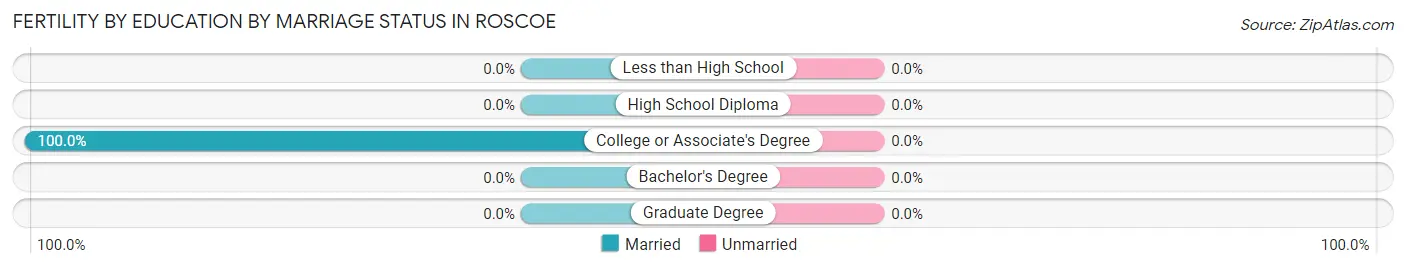
| Educational Attainment | Married | Unmarried |
| Less than High School | 0 (0.0%) | 0 (0.0%) |
| High School Diploma | 0 (0.0%) | 0 (0.0%) |
| College or Associate's Degree | 3 (100.0%) | 0 (0.0%) |
| Bachelor's Degree | 0 (0.0%) | 0 (0.0%) |
| Graduate Degree | 0 (0.0%) | 0 (0.0%) |
| Total | 3 (100.0%) | 0 (0.0%) |
Employment Characteristics in Roscoe
Employment by Class of Employer in Roscoe
Among the 168 employed individuals in Roscoe, private company employees (115 | 68.4%), local government employees (32 | 19.1%), and self-employed (not incorporated) (12 | 7.1%) make up the most common classes of employment.
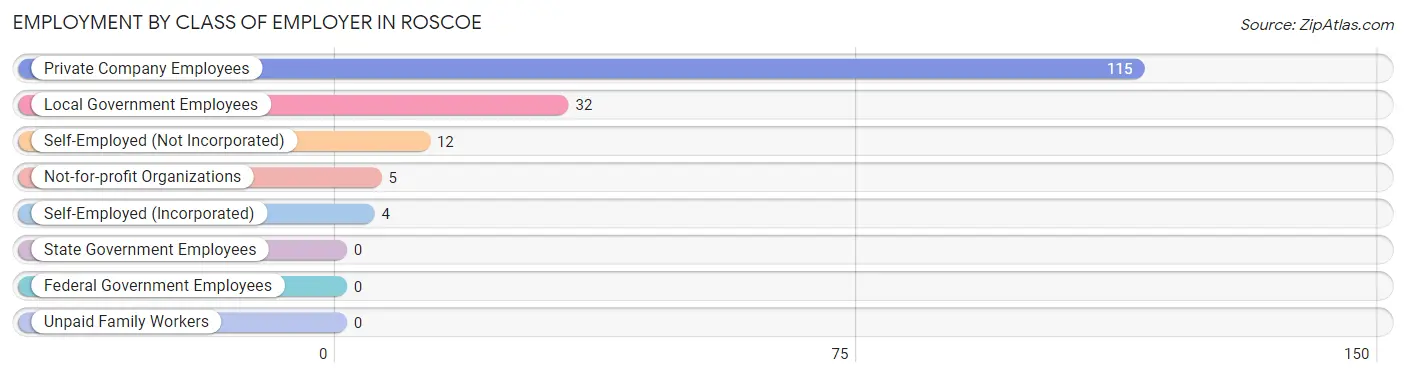
| Employer Class | # Employees | % Employees |
| Private Company Employees | 115 | 68.4% |
| Self-Employed (Incorporated) | 4 | 2.4% |
| Self-Employed (Not Incorporated) | 12 | 7.1% |
| Not-for-profit Organizations | 5 | 3.0% |
| Local Government Employees | 32 | 19.1% |
| State Government Employees | 0 | 0.0% |
| Federal Government Employees | 0 | 0.0% |
| Unpaid Family Workers | 0 | 0.0% |
| Total | 168 | 100.0% |
Employment Status by Age in Roscoe
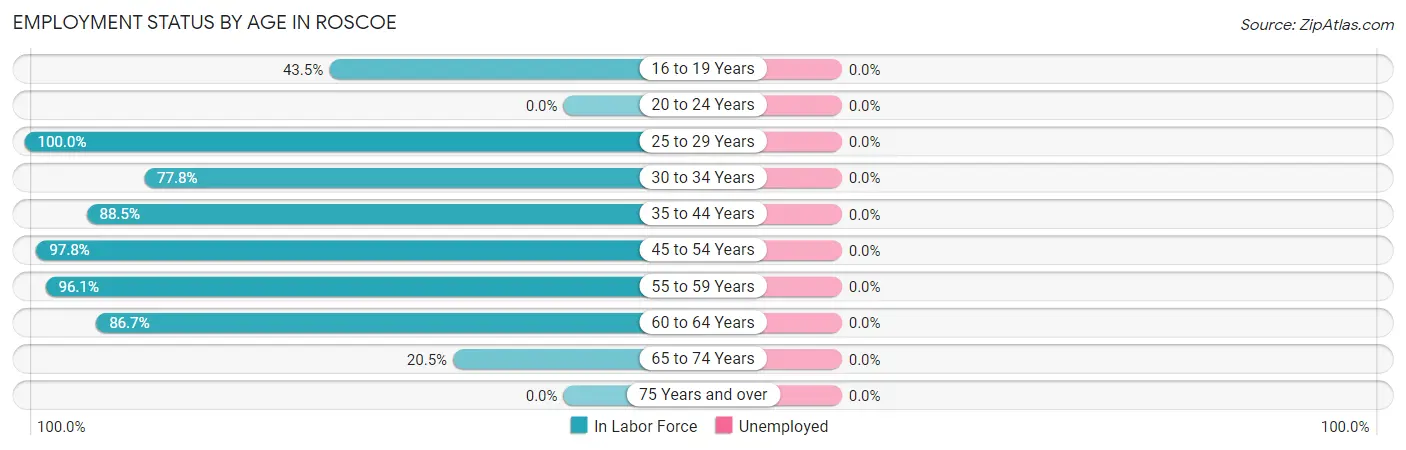
| Age Bracket | In Labor Force | Unemployed |
| 16 to 19 Years | 10 (43.5%) | 0 (0.0%) |
| 20 to 24 Years | 0 (0.0%) | 0 (0.0%) |
| 25 to 29 Years | 20 (100.0%) | 0 (0.0%) |
| 30 to 34 Years | 7 (77.8%) | 0 (0.0%) |
| 35 to 44 Years | 54 (88.5%) | 0 (0.0%) |
| 45 to 54 Years | 45 (97.8%) | 0 (0.0%) |
| 55 to 59 Years | 49 (96.1%) | 0 (0.0%) |
| 60 to 64 Years | 13 (86.7%) | 0 (0.0%) |
| 65 to 74 Years | 8 (20.5%) | 0 (0.0%) |
| 75 Years and over | 0 (0.0%) | 0 (0.0%) |
| Total | 206 (71.8%) | 0 (0.0%) |
Employment Status by Educational Attainment in Roscoe
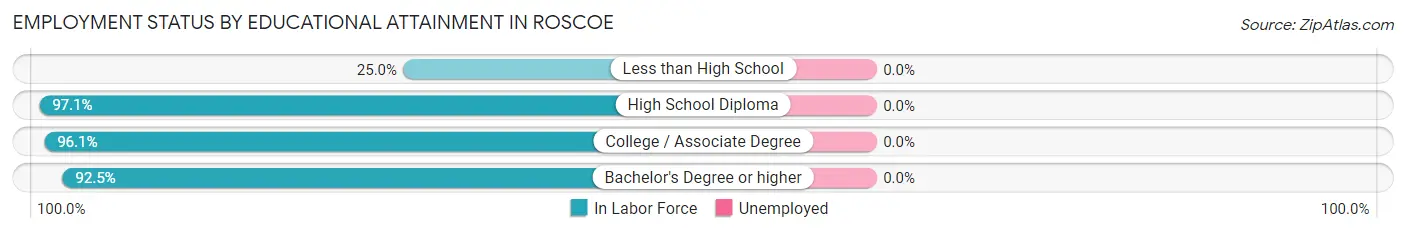
| Educational Attainment | In Labor Force | Unemployed |
| Less than High School | 2 (25.0%) | 0 (0.0%) |
| High School Diploma | 100 (97.1%) | 0 (0.0%) |
| College / Associate Degree | 49 (96.1%) | 0 (0.0%) |
| Bachelor's Degree or higher | 37 (92.5%) | 0 (0.0%) |
| Total | 188 (93.1%) | 0 (0.0%) |
Employment Occupations by Sex in Roscoe
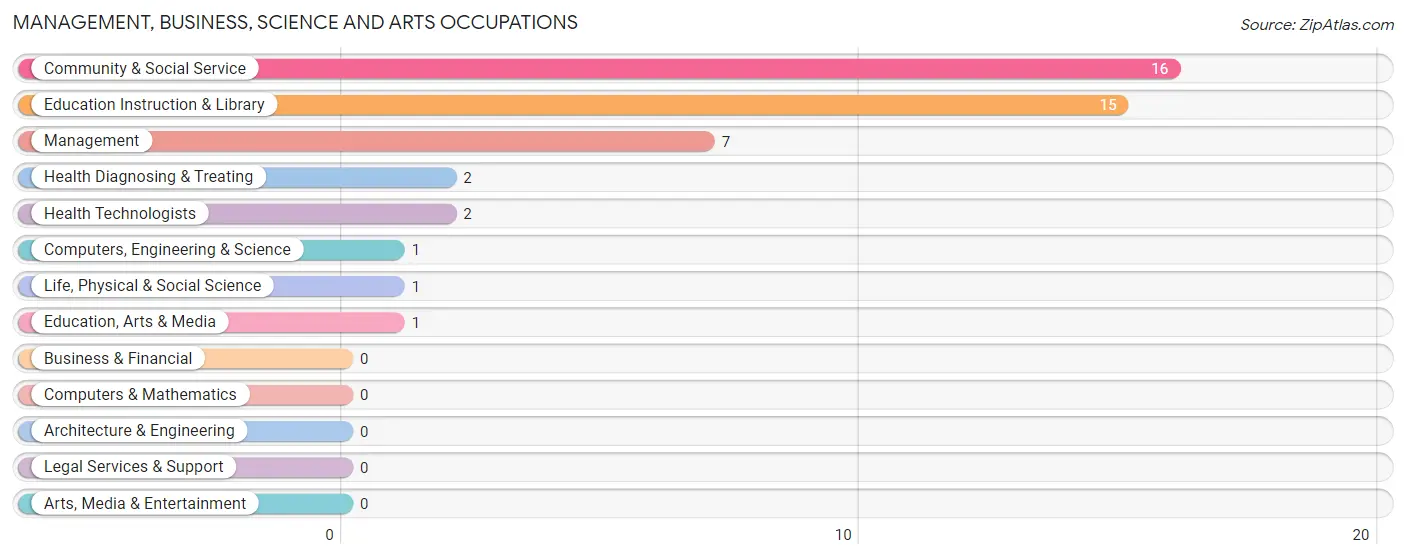
Management, Business, Science and Arts Occupations
The most common Management, Business, Science and Arts occupations in Roscoe are Community & Social Service (16 | 7.8%), Education Instruction & Library (15 | 7.3%), Management (7 | 3.4%), Health Diagnosing & Treating (2 | 1.0%), and Health Technologists (2 | 1.0%).
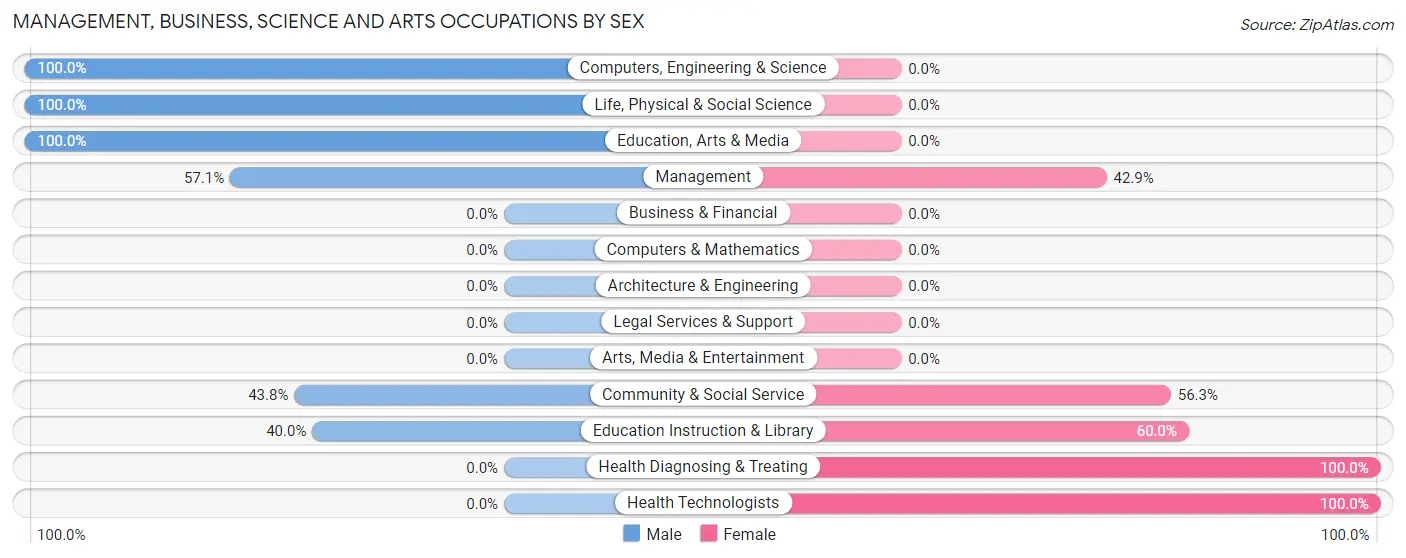
Management, Business, Science and Arts Occupations by Sex
Within the Management, Business, Science and Arts occupations in Roscoe, the most male-oriented occupations are Computers, Engineering & Science (100.0%), Life, Physical & Social Science (100.0%), and Education, Arts & Media (100.0%), while the most female-oriented occupations are Health Diagnosing & Treating (100.0%), Health Technologists (100.0%), and Education Instruction & Library (60.0%).
| Occupation | Male | Female |
| Management | 4 (57.1%) | 3 (42.9%) |
| Business & Financial | 0 (0.0%) | 0 (0.0%) |
| Computers, Engineering & Science | 1 (100.0%) | 0 (0.0%) |
| Computers & Mathematics | 0 (0.0%) | 0 (0.0%) |
| Architecture & Engineering | 0 (0.0%) | 0 (0.0%) |
| Life, Physical & Social Science | 1 (100.0%) | 0 (0.0%) |
| Community & Social Service | 7 (43.8%) | 9 (56.2%) |
| Education, Arts & Media | 1 (100.0%) | 0 (0.0%) |
| Legal Services & Support | 0 (0.0%) | 0 (0.0%) |
| Education Instruction & Library | 6 (40.0%) | 9 (60.0%) |
| Arts, Media & Entertainment | 0 (0.0%) | 0 (0.0%) |
| Health Diagnosing & Treating | 0 (0.0%) | 2 (100.0%) |
| Health Technologists | 0 (0.0%) | 2 (100.0%) |
| Total (Category) | 12 (46.2%) | 14 (53.8%) |
| Total (Overall) | 145 (70.4%) | 61 (29.6%) |
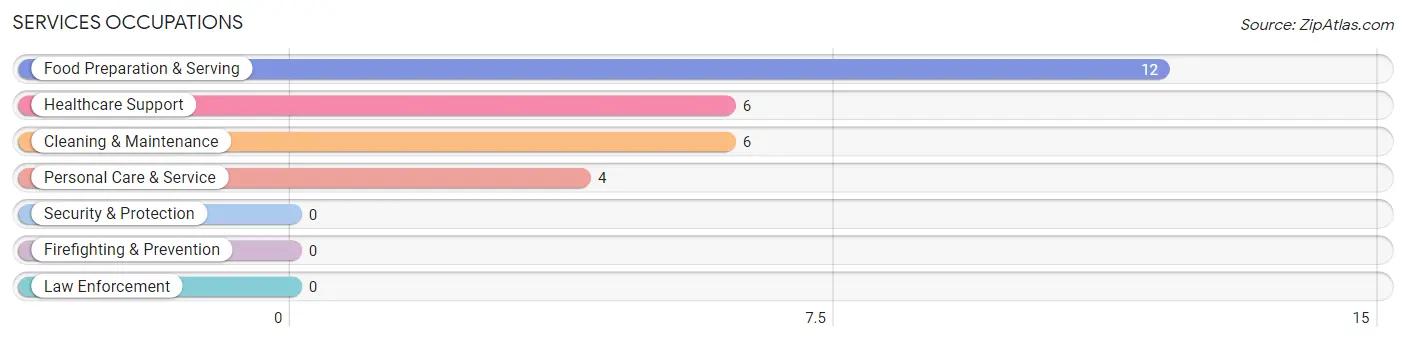
Services Occupations
The most common Services occupations in Roscoe are Food Preparation & Serving (12 | 5.8%), Healthcare Support (6 | 2.9%), Cleaning & Maintenance (6 | 2.9%), and Personal Care & Service (4 | 1.9%).
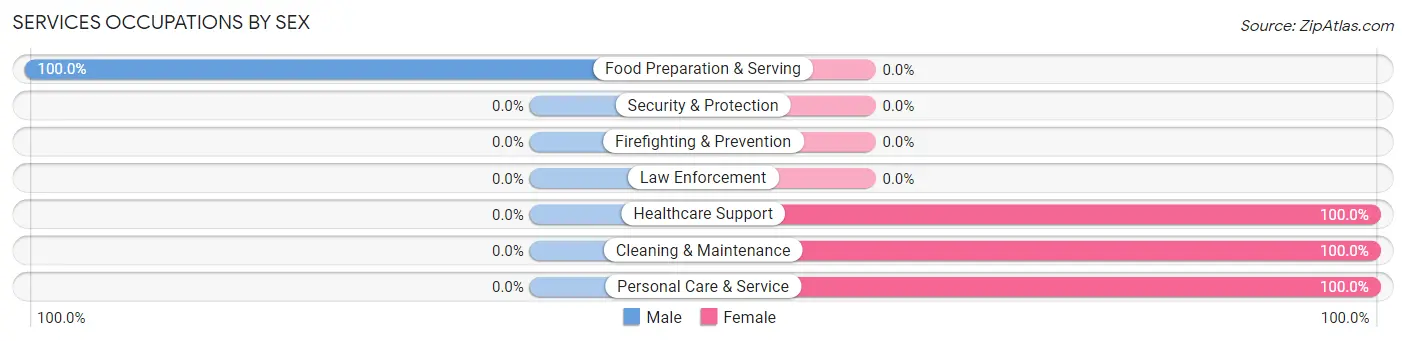
Services Occupations by Sex
| Occupation | Male | Female |
| Healthcare Support | 0 (0.0%) | 6 (100.0%) |
| Security & Protection | 0 (0.0%) | 0 (0.0%) |
| Firefighting & Prevention | 0 (0.0%) | 0 (0.0%) |
| Law Enforcement | 0 (0.0%) | 0 (0.0%) |
| Food Preparation & Serving | 12 (100.0%) | 0 (0.0%) |
| Cleaning & Maintenance | 0 (0.0%) | 6 (100.0%) |
| Personal Care & Service | 0 (0.0%) | 4 (100.0%) |
| Total (Category) | 12 (42.9%) | 16 (57.1%) |
| Total (Overall) | 145 (70.4%) | 61 (29.6%) |
Sales and Office Occupations
The most common Sales and Office occupations in Roscoe are Sales & Related (27 | 13.1%), and Office & Administration (24 | 11.7%).
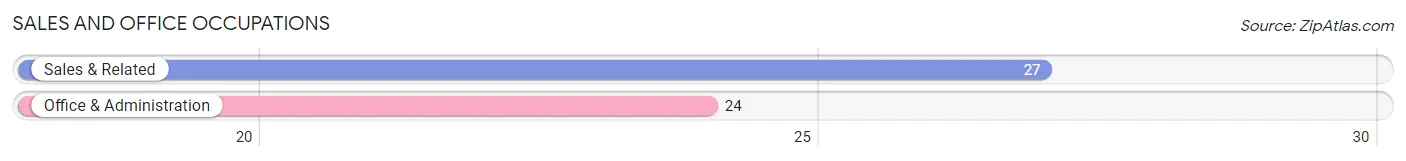
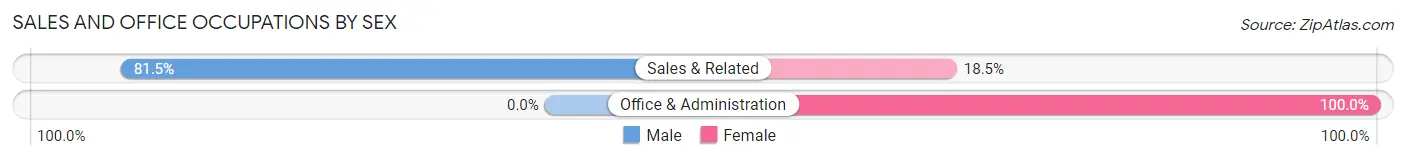
Sales and Office Occupations by Sex
| Occupation | Male | Female |
| Sales & Related | 22 (81.5%) | 5 (18.5%) |
| Office & Administration | 0 (0.0%) | 24 (100.0%) |
| Total (Category) | 22 (43.1%) | 29 (56.9%) |
| Total (Overall) | 145 (70.4%) | 61 (29.6%) |
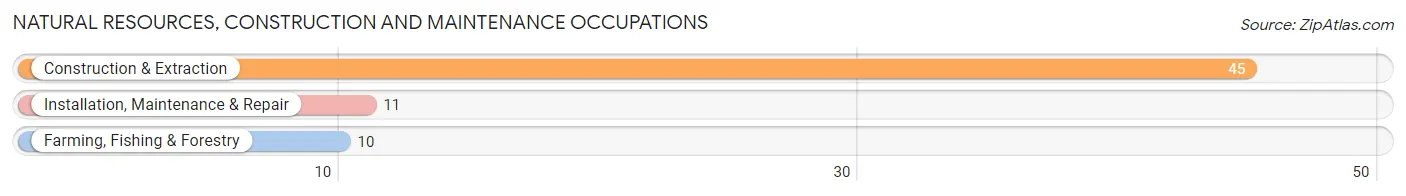
Natural Resources, Construction and Maintenance Occupations
The most common Natural Resources, Construction and Maintenance occupations in Roscoe are Construction & Extraction (45 | 21.8%), Installation, Maintenance & Repair (11 | 5.3%), and Farming, Fishing & Forestry (10 | 4.9%).
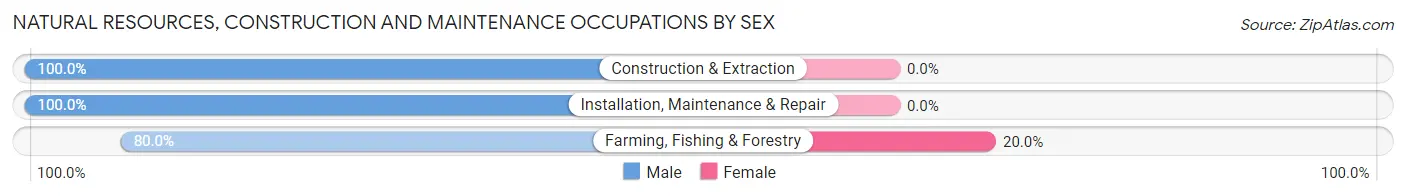
Natural Resources, Construction and Maintenance Occupations by Sex
| Occupation | Male | Female |
| Farming, Fishing & Forestry | 8 (80.0%) | 2 (20.0%) |
| Construction & Extraction | 45 (100.0%) | 0 (0.0%) |
| Installation, Maintenance & Repair | 11 (100.0%) | 0 (0.0%) |
| Total (Category) | 64 (97.0%) | 2 (3.0%) |
| Total (Overall) | 145 (70.4%) | 61 (29.6%) |
Production, Transportation and Moving Occupations
The most common Production, Transportation and Moving occupations in Roscoe are Material Moving (32 | 15.5%), and Transportation (3 | 1.5%).
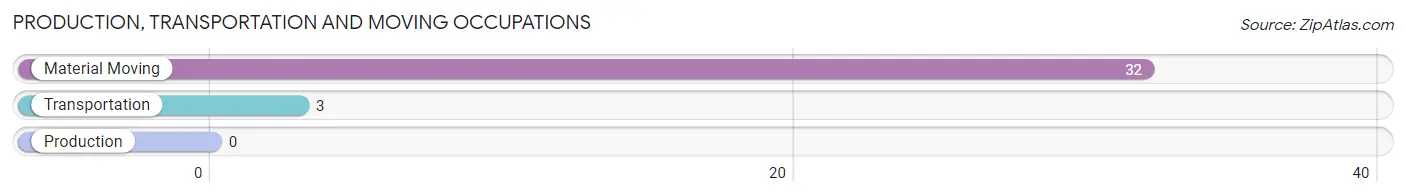
Production, Transportation and Moving Occupations by Sex
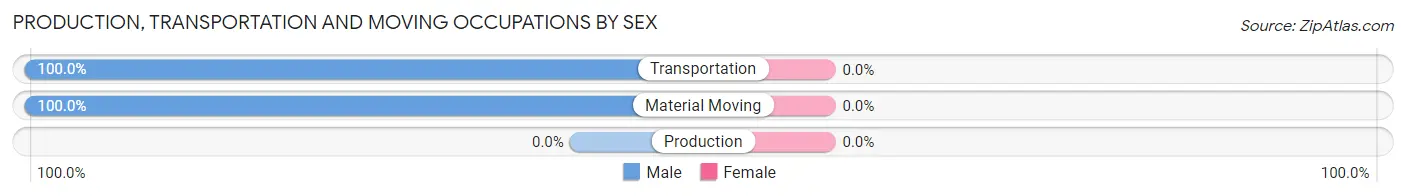
| Occupation | Male | Female |
| Production | 0 (0.0%) | 0 (0.0%) |
| Transportation | 3 (100.0%) | 0 (0.0%) |
| Material Moving | 32 (100.0%) | 0 (0.0%) |
| Total (Category) | 35 (100.0%) | 0 (0.0%) |
| Total (Overall) | 145 (70.4%) | 61 (29.6%) |
Employment Industries by Sex in Roscoe
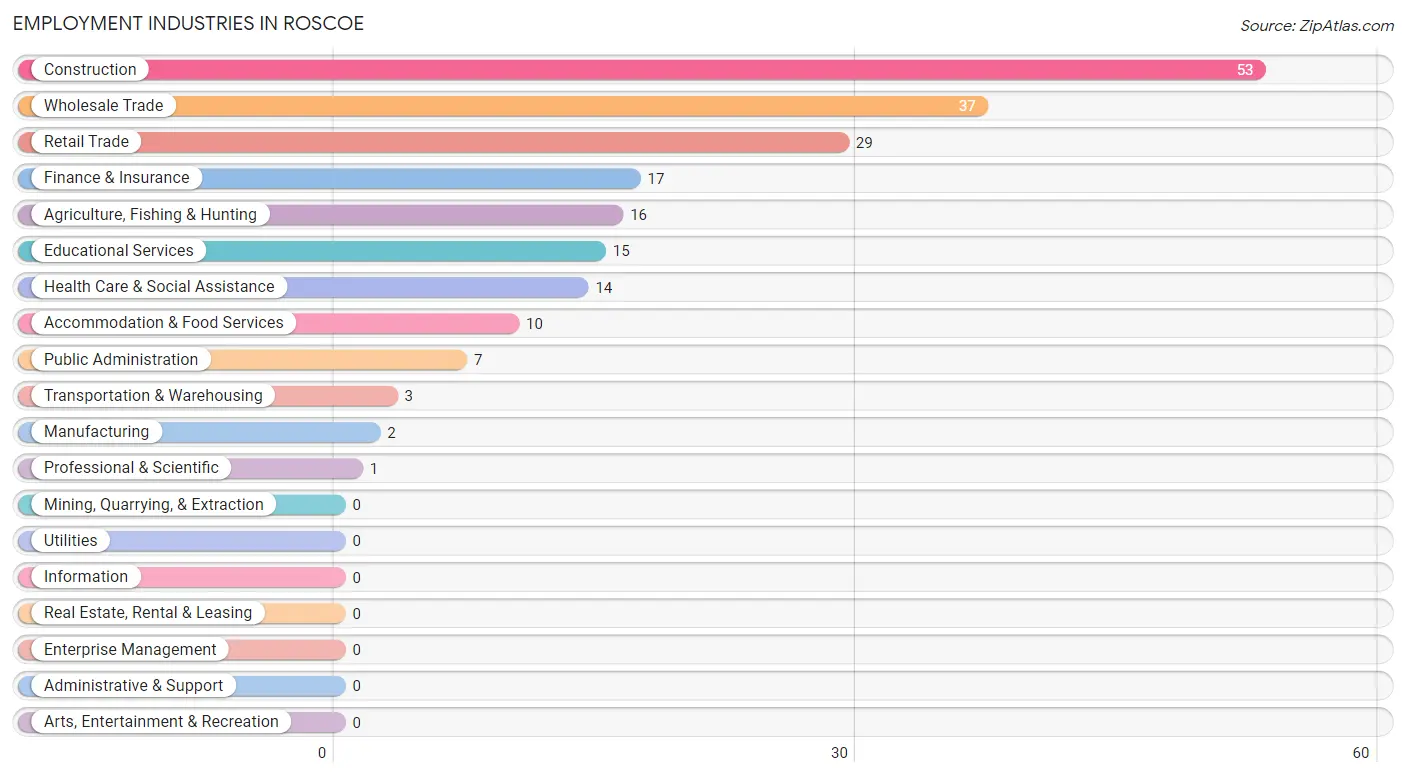
Employment Industries in Roscoe
The major employment industries in Roscoe include Construction (53 | 25.7%), Wholesale Trade (37 | 18.0%), Retail Trade (29 | 14.1%), Finance & Insurance (17 | 8.3%), and Agriculture, Fishing & Hunting (16 | 7.8%).
Employment Industries by Sex in Roscoe
The Roscoe industries that see more men than women are Retail Trade (100.0%), Transportation & Warehousing (100.0%), and Professional & Scientific (100.0%), whereas the industries that tend to have a higher number of women are Manufacturing (100.0%), Public Administration (100.0%), and Finance & Insurance (88.2%).
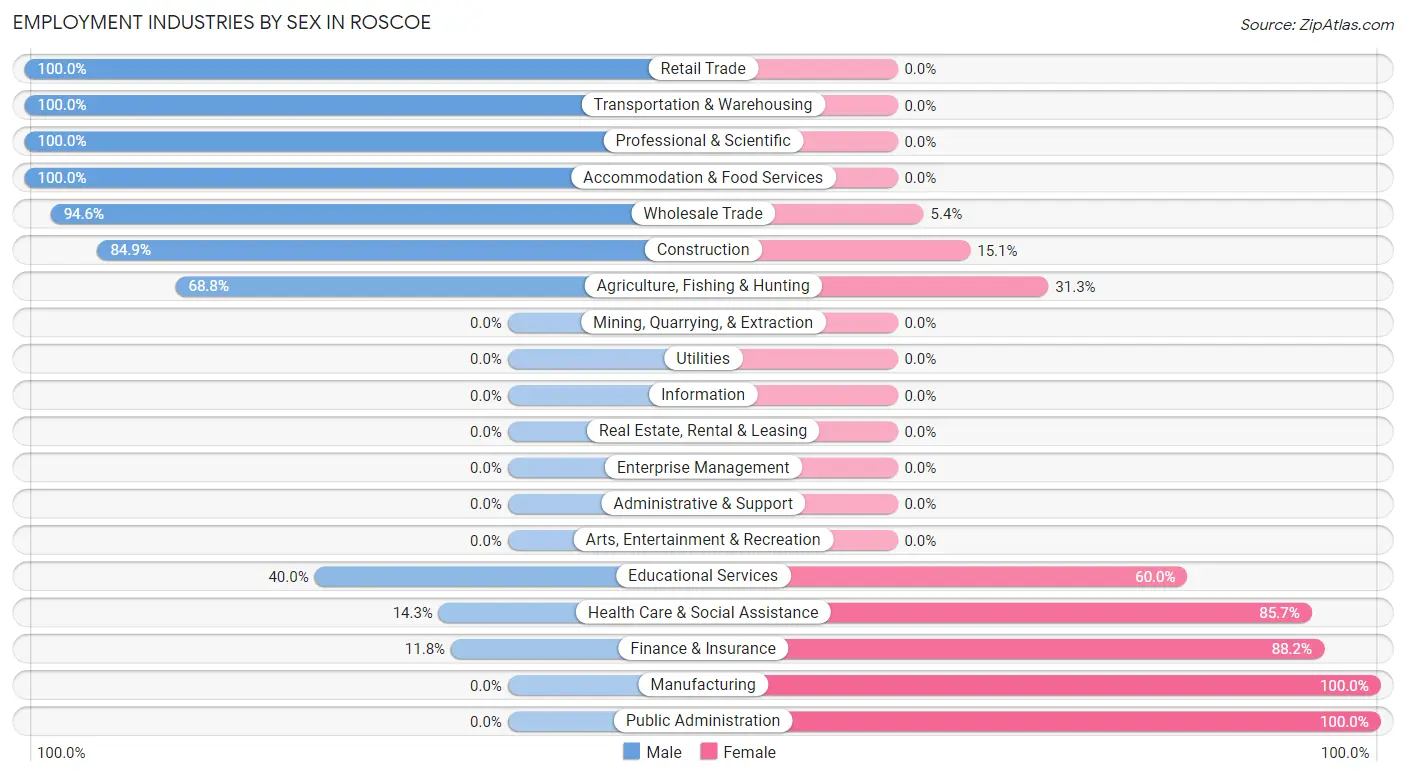
| Industry | Male | Female |
| Agriculture, Fishing & Hunting | 11 (68.8%) | 5 (31.2%) |
| Mining, Quarrying, & Extraction | 0 (0.0%) | 0 (0.0%) |
| Construction | 45 (84.9%) | 8 (15.1%) |
| Manufacturing | 0 (0.0%) | 2 (100.0%) |
| Wholesale Trade | 35 (94.6%) | 2 (5.4%) |
| Retail Trade | 29 (100.0%) | 0 (0.0%) |
| Transportation & Warehousing | 3 (100.0%) | 0 (0.0%) |
| Utilities | 0 (0.0%) | 0 (0.0%) |
| Information | 0 (0.0%) | 0 (0.0%) |
| Finance & Insurance | 2 (11.8%) | 15 (88.2%) |
| Real Estate, Rental & Leasing | 0 (0.0%) | 0 (0.0%) |
| Professional & Scientific | 1 (100.0%) | 0 (0.0%) |
| Enterprise Management | 0 (0.0%) | 0 (0.0%) |
| Administrative & Support | 0 (0.0%) | 0 (0.0%) |
| Educational Services | 6 (40.0%) | 9 (60.0%) |
| Health Care & Social Assistance | 2 (14.3%) | 12 (85.7%) |
| Arts, Entertainment & Recreation | 0 (0.0%) | 0 (0.0%) |
| Accommodation & Food Services | 10 (100.0%) | 0 (0.0%) |
| Public Administration | 0 (0.0%) | 7 (100.0%) |
| Total | 145 (70.4%) | 61 (29.6%) |
Education in Roscoe
School Enrollment in Roscoe
The most common levels of schooling among the 49 students in Roscoe are high school (23 | 46.9%), elementary school (11 | 22.5%), and nursery / preschool (7 | 14.3%).
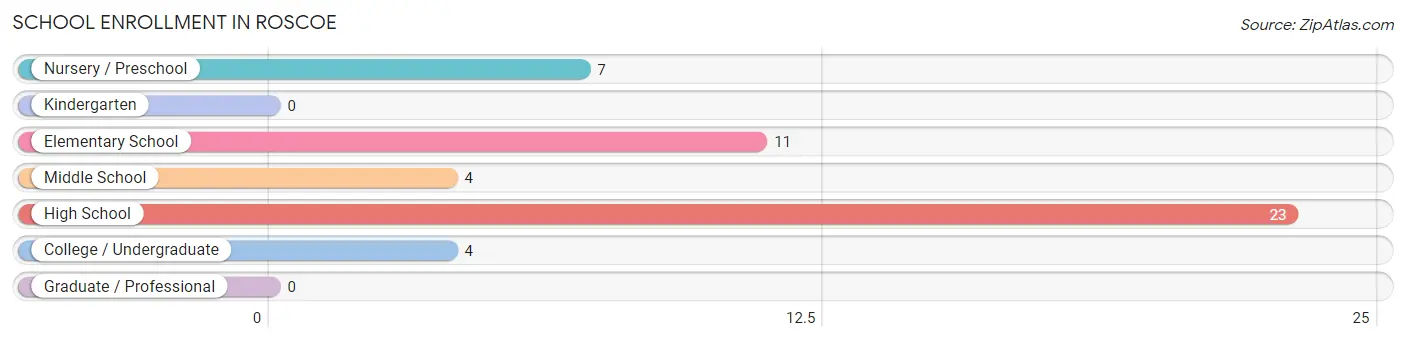
| School Level | # Students | % Students |
| Nursery / Preschool | 7 | 14.3% |
| Kindergarten | 0 | 0.0% |
| Elementary School | 11 | 22.5% |
| Middle School | 4 | 8.2% |
| High School | 23 | 46.9% |
| College / Undergraduate | 4 | 8.2% |
| Graduate / Professional | 0 | 0.0% |
| Total | 49 | 100.0% |
School Enrollment by Age by Funding Source in Roscoe
Out of a total of 49 students who are enrolled in schools in Roscoe, 2 (4.1%) attend a private institution, while the remaining 47 (95.9%) are enrolled in public schools. The age group of 25 to 34 year olds has the highest likelihood of being enrolled in private schools, with 2 (50.0% in the age bracket) enrolled. Conversely, the age group of 5 to 9 year old has the lowest likelihood of being enrolled in a private school, with 17 (100.0% in the age bracket) attending a public institution.
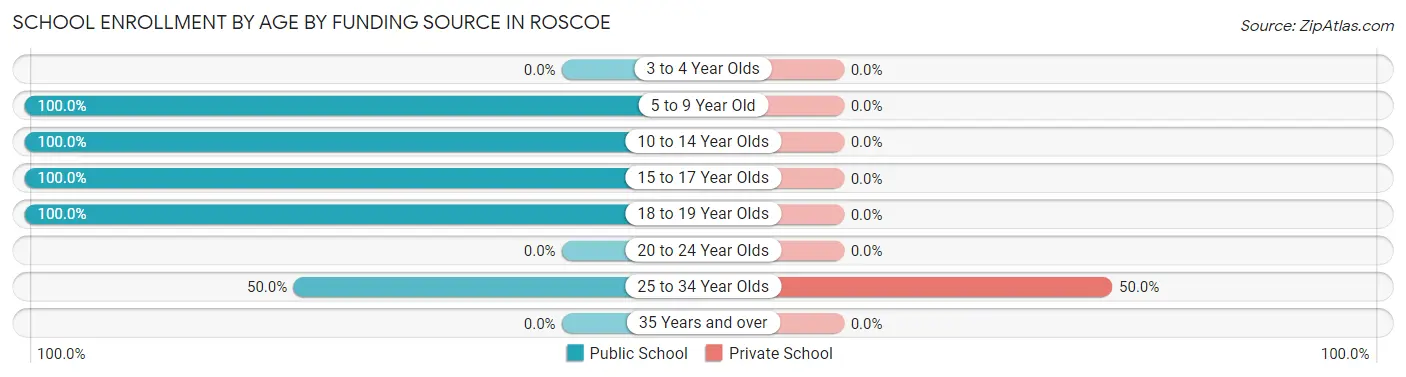
| Age Bracket | Public School | Private School |
| 3 to 4 Year Olds | 0 (0.0%) | 0 (0.0%) |
| 5 to 9 Year Old | 17 (100.0%) | 0 (0.0%) |
| 10 to 14 Year Olds | 5 (100.0%) | 0 (0.0%) |
| 15 to 17 Year Olds | 13 (100.0%) | 0 (0.0%) |
| 18 to 19 Year Olds | 10 (100.0%) | 0 (0.0%) |
| 20 to 24 Year Olds | 0 (0.0%) | 0 (0.0%) |
| 25 to 34 Year Olds | 2 (50.0%) | 2 (50.0%) |
| 35 Years and over | 0 (0.0%) | 0 (0.0%) |
| Total | 47 (95.9%) | 2 (4.1%) |
Educational Attainment by Field of Study in Roscoe
Education (19 | 30.6%), bio, nature & agricultural (18 | 29.0%), business (12 | 19.4%), science & technology (4 | 6.5%), and psychology (3 | 4.8%) are the most common fields of study among 62 individuals in Roscoe who have obtained a bachelor's degree or higher.
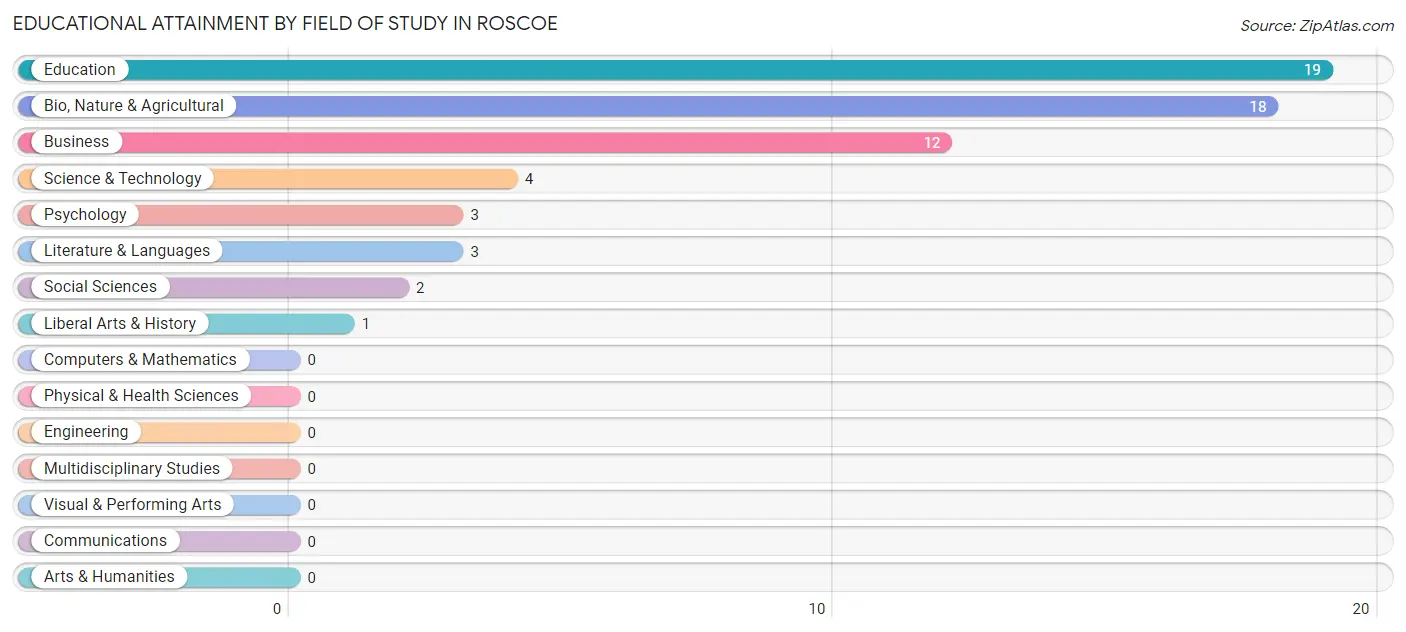
| Field of Study | # Graduates | % Graduates |
| Computers & Mathematics | 0 | 0.0% |
| Bio, Nature & Agricultural | 18 | 29.0% |
| Physical & Health Sciences | 0 | 0.0% |
| Psychology | 3 | 4.8% |
| Social Sciences | 2 | 3.2% |
| Engineering | 0 | 0.0% |
| Multidisciplinary Studies | 0 | 0.0% |
| Science & Technology | 4 | 6.5% |
| Business | 12 | 19.4% |
| Education | 19 | 30.6% |
| Literature & Languages | 3 | 4.8% |
| Liberal Arts & History | 1 | 1.6% |
| Visual & Performing Arts | 0 | 0.0% |
| Communications | 0 | 0.0% |
| Arts & Humanities | 0 | 0.0% |
| Total | 62 | 100.0% |
Transportation & Commute in Roscoe
Vehicle Availability by Sex in Roscoe
The most prevalent vehicle ownership categories in Roscoe are males with 2 vehicles (54, accounting for 50.5%) and females with 2 vehicles (25, making up 88.5%).
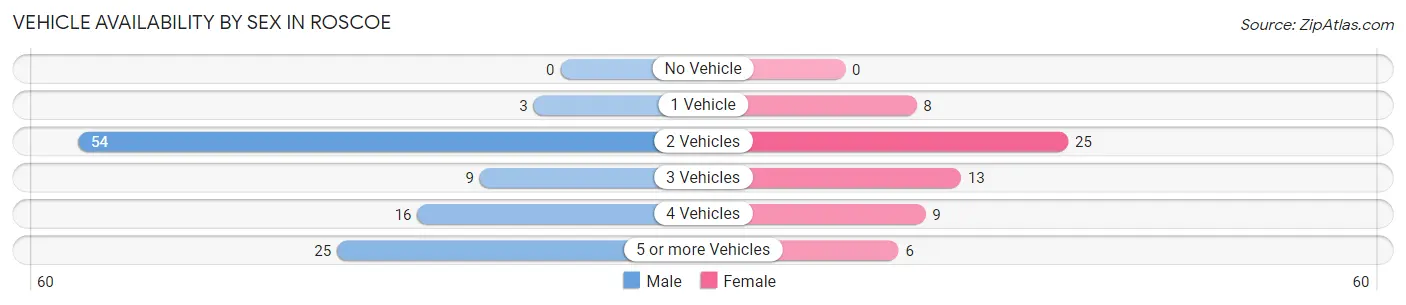
| Vehicles Available | Male | Female |
| No Vehicle | 0 (0.0%) | 0 (0.0%) |
| 1 Vehicle | 3 (2.8%) | 8 (13.1%) |
| 2 Vehicles | 54 (50.5%) | 25 (41.0%) |
| 3 Vehicles | 9 (8.4%) | 13 (21.3%) |
| 4 Vehicles | 16 (14.9%) | 9 (14.7%) |
| 5 or more Vehicles | 25 (23.4%) | 6 (9.8%) |
| Total | 107 (100.0%) | 61 (100.0%) |
Commute Time in Roscoe
The most frequently occuring commute durations in Roscoe are 45 to 59 minutes (42 commuters, 26.9%), 5 to 9 minutes (38 commuters, 24.4%), and less than 5 minutes (30 commuters, 19.2%).
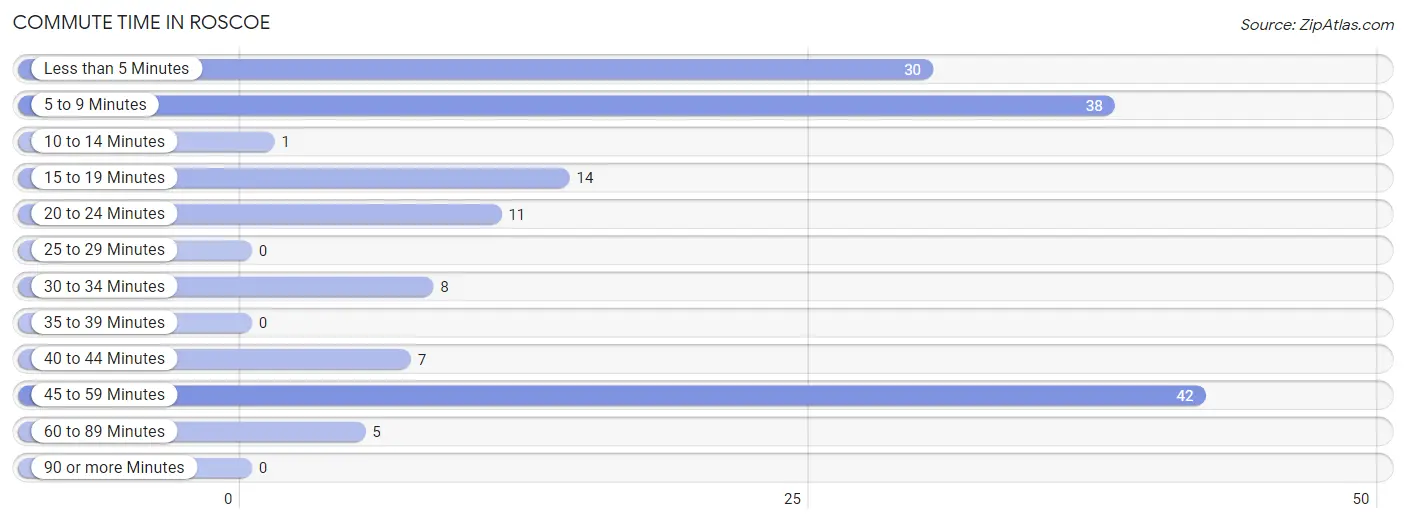
| Commute Time | # Commuters | % Commuters |
| Less than 5 Minutes | 30 | 19.2% |
| 5 to 9 Minutes | 38 | 24.4% |
| 10 to 14 Minutes | 1 | 0.6% |
| 15 to 19 Minutes | 14 | 9.0% |
| 20 to 24 Minutes | 11 | 7.0% |
| 25 to 29 Minutes | 0 | 0.0% |
| 30 to 34 Minutes | 8 | 5.1% |
| 35 to 39 Minutes | 0 | 0.0% |
| 40 to 44 Minutes | 7 | 4.5% |
| 45 to 59 Minutes | 42 | 26.9% |
| 60 to 89 Minutes | 5 | 3.2% |
| 90 or more Minutes | 0 | 0.0% |
Commute Time by Sex in Roscoe
The most common commute times in Roscoe are 45 to 59 minutes (35 commuters, 34.6%) for males and 20 to 24 minutes (11 commuters, 20.0%) for females.
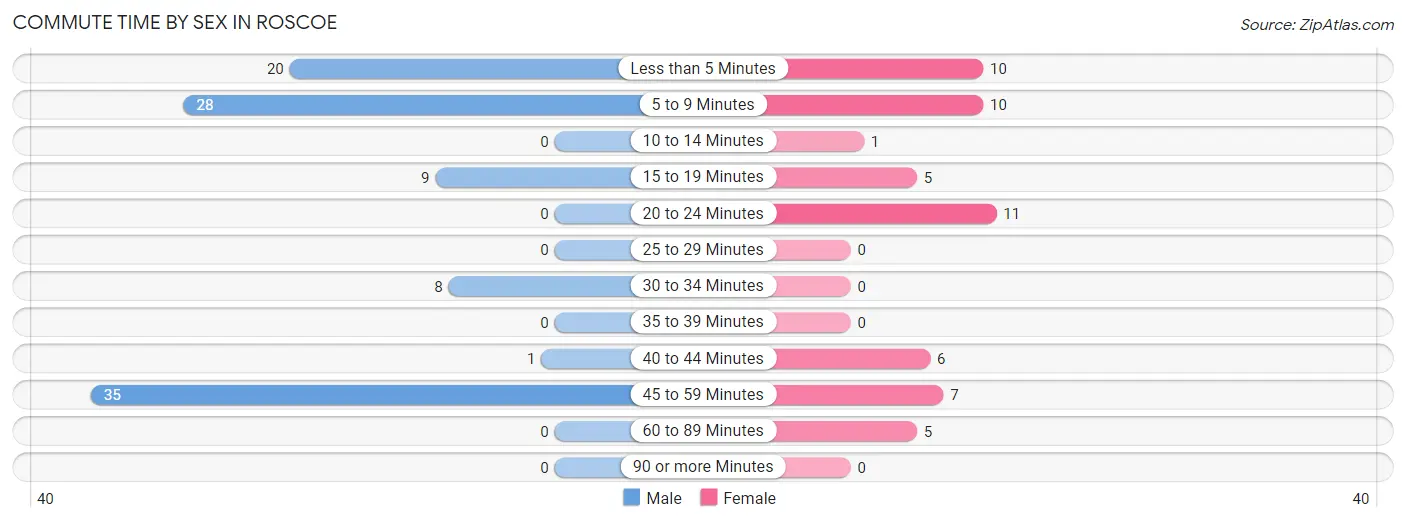
| Commute Time | Male | Female |
| Less than 5 Minutes | 20 (19.8%) | 10 (18.2%) |
| 5 to 9 Minutes | 28 (27.7%) | 10 (18.2%) |
| 10 to 14 Minutes | 0 (0.0%) | 1 (1.8%) |
| 15 to 19 Minutes | 9 (8.9%) | 5 (9.1%) |
| 20 to 24 Minutes | 0 (0.0%) | 11 (20.0%) |
| 25 to 29 Minutes | 0 (0.0%) | 0 (0.0%) |
| 30 to 34 Minutes | 8 (7.9%) | 0 (0.0%) |
| 35 to 39 Minutes | 0 (0.0%) | 0 (0.0%) |
| 40 to 44 Minutes | 1 (1.0%) | 6 (10.9%) |
| 45 to 59 Minutes | 35 (34.6%) | 7 (12.7%) |
| 60 to 89 Minutes | 0 (0.0%) | 5 (9.1%) |
| 90 or more Minutes | 0 (0.0%) | 0 (0.0%) |
Time of Departure to Work by Sex in Roscoe
The most frequent times of departure to work in Roscoe are 7:30 AM to 7:59 AM (28, 27.7%) for males and 7:30 AM to 7:59 AM (24, 43.6%) for females.
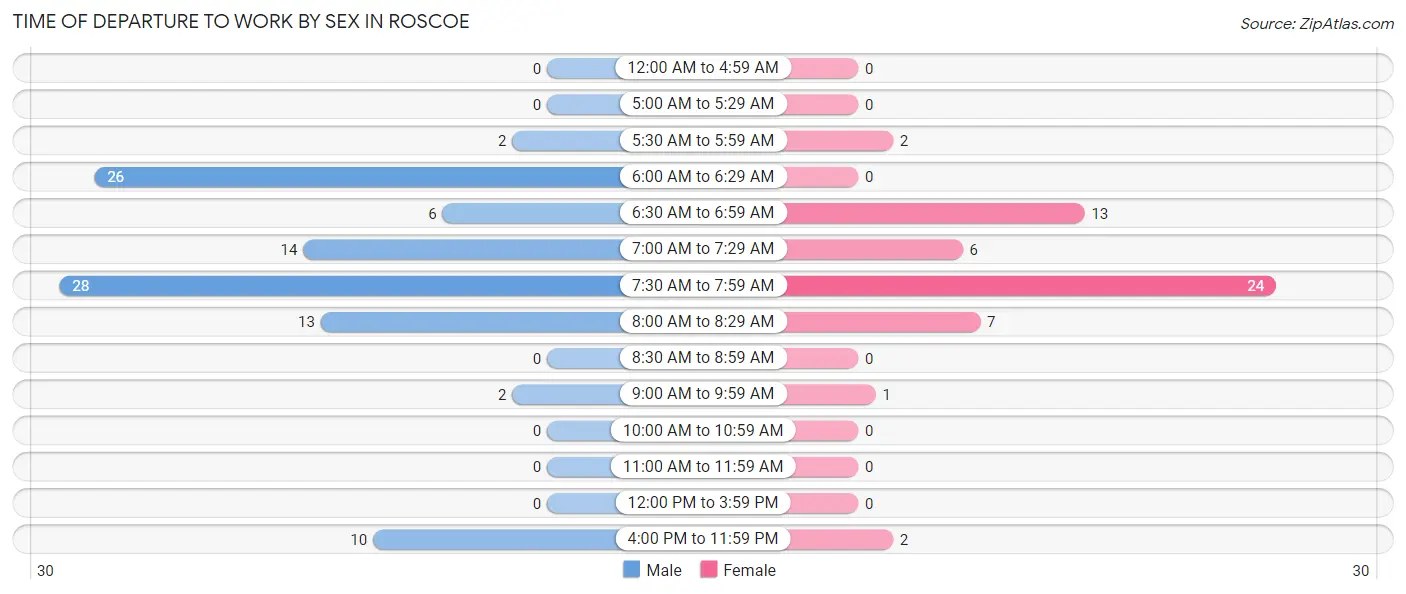
| Time of Departure | Male | Female |
| 12:00 AM to 4:59 AM | 0 (0.0%) | 0 (0.0%) |
| 5:00 AM to 5:29 AM | 0 (0.0%) | 0 (0.0%) |
| 5:30 AM to 5:59 AM | 2 (2.0%) | 2 (3.6%) |
| 6:00 AM to 6:29 AM | 26 (25.7%) | 0 (0.0%) |
| 6:30 AM to 6:59 AM | 6 (5.9%) | 13 (23.6%) |
| 7:00 AM to 7:29 AM | 14 (13.9%) | 6 (10.9%) |
| 7:30 AM to 7:59 AM | 28 (27.7%) | 24 (43.6%) |
| 8:00 AM to 8:29 AM | 13 (12.9%) | 7 (12.7%) |
| 8:30 AM to 8:59 AM | 0 (0.0%) | 0 (0.0%) |
| 9:00 AM to 9:59 AM | 2 (2.0%) | 1 (1.8%) |
| 10:00 AM to 10:59 AM | 0 (0.0%) | 0 (0.0%) |
| 11:00 AM to 11:59 AM | 0 (0.0%) | 0 (0.0%) |
| 12:00 PM to 3:59 PM | 0 (0.0%) | 0 (0.0%) |
| 4:00 PM to 11:59 PM | 10 (9.9%) | 2 (3.6%) |
| Total | 101 (100.0%) | 55 (100.0%) |
Housing Occupancy in Roscoe
Occupancy by Ownership in Roscoe
Of the total 158 dwellings in Roscoe, owner-occupied units account for 149 (94.3%), while renter-occupied units make up 9 (5.7%).
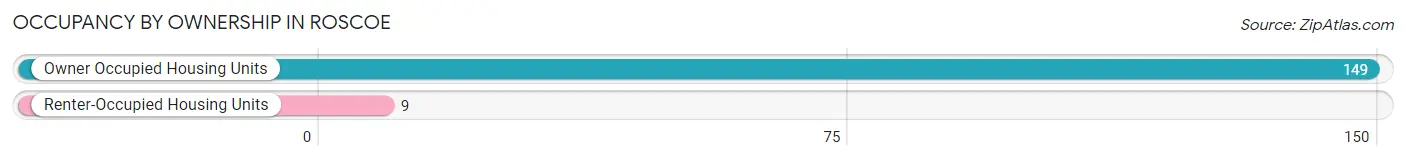
| Occupancy | # Housing Units | % Housing Units |
| Owner Occupied Housing Units | 149 | 94.3% |
| Renter-Occupied Housing Units | 9 | 5.7% |
| Total Occupied Housing Units | 158 | 100.0% |
Occupancy by Household Size in Roscoe
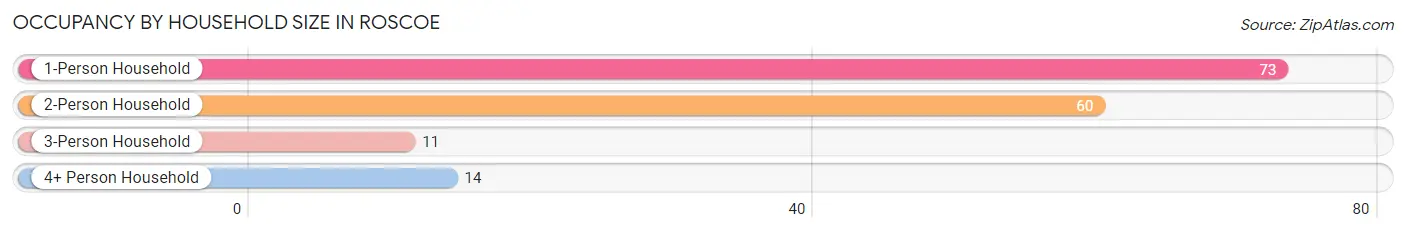
| Household Size | # Housing Units | % Housing Units |
| 1-Person Household | 73 | 46.2% |
| 2-Person Household | 60 | 38.0% |
| 3-Person Household | 11 | 7.0% |
| 4+ Person Household | 14 | 8.9% |
| Total Housing Units | 158 | 100.0% |
Occupancy by Ownership by Household Size in Roscoe
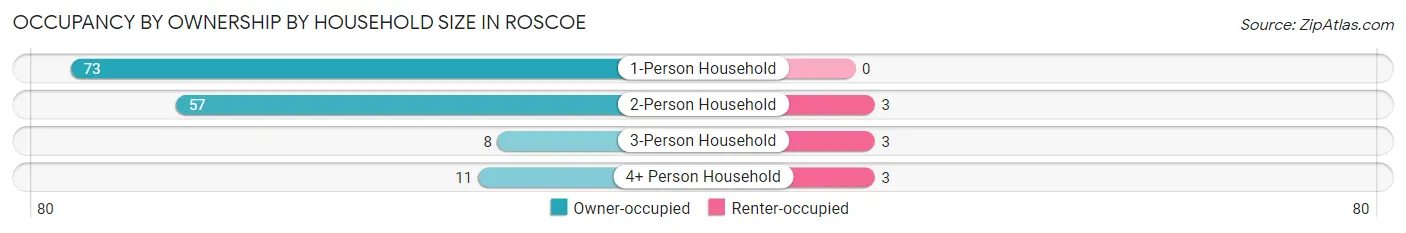
| Household Size | Owner-occupied | Renter-occupied |
| 1-Person Household | 73 (100.0%) | 0 (0.0%) |
| 2-Person Household | 57 (95.0%) | 3 (5.0%) |
| 3-Person Household | 8 (72.7%) | 3 (27.3%) |
| 4+ Person Household | 11 (78.6%) | 3 (21.4%) |
| Total Housing Units | 149 (94.3%) | 9 (5.7%) |
Occupancy by Educational Attainment in Roscoe
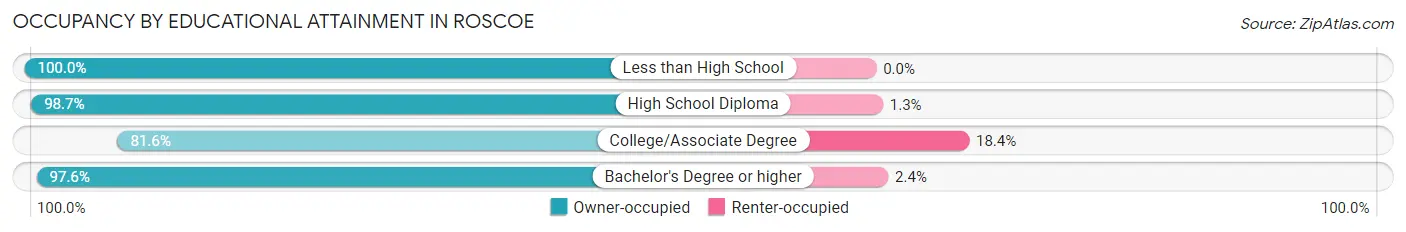
| Household Size | Owner-occupied | Renter-occupied |
| Less than High School | 2 (100.0%) | 0 (0.0%) |
| High School Diploma | 75 (98.7%) | 1 (1.3%) |
| College/Associate Degree | 31 (81.6%) | 7 (18.4%) |
| Bachelor's Degree or higher | 41 (97.6%) | 1 (2.4%) |
Occupancy by Age of Householder in Roscoe
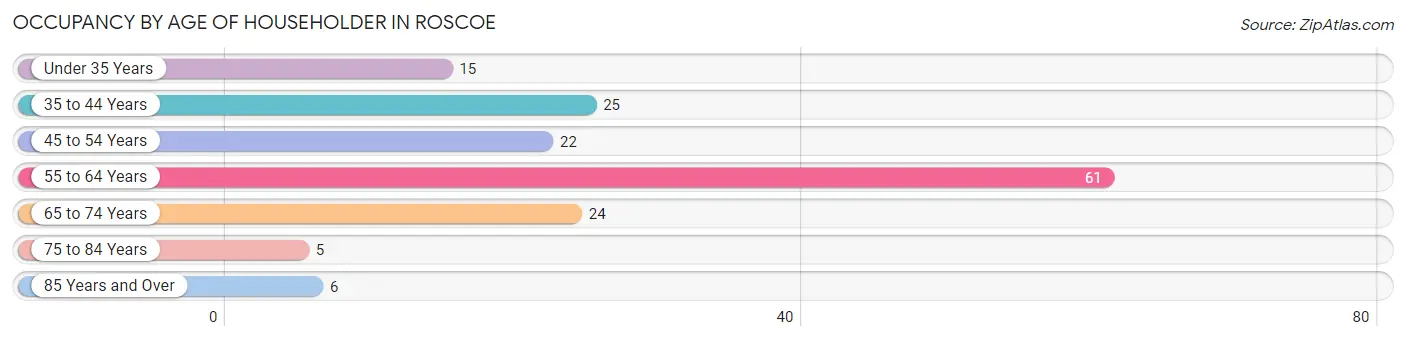
| Age Bracket | # Households | % Households |
| Under 35 Years | 15 | 9.5% |
| 35 to 44 Years | 25 | 15.8% |
| 45 to 54 Years | 22 | 13.9% |
| 55 to 64 Years | 61 | 38.6% |
| 65 to 74 Years | 24 | 15.2% |
| 75 to 84 Years | 5 | 3.2% |
| 85 Years and Over | 6 | 3.8% |
| Total | 158 | 100.0% |
Housing Finances in Roscoe
Median Income by Occupancy in Roscoe
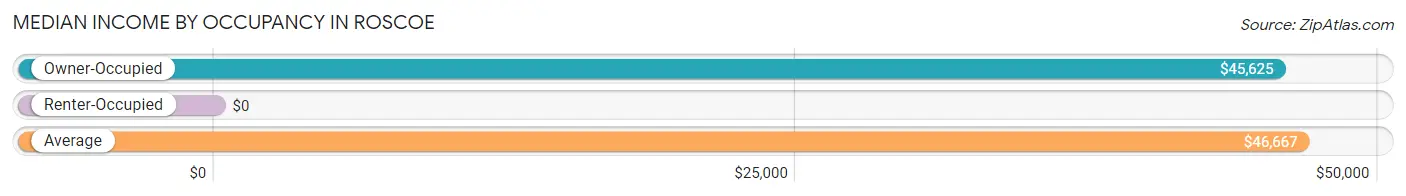
| Occupancy Type | # Households | Median Income |
| Owner-Occupied | 149 (94.3%) | $45,625 |
| Renter-Occupied | 9 (5.7%) | $0 |
| Average | 158 (100.0%) | $46,667 |
Occupancy by Householder Income Bracket in Roscoe
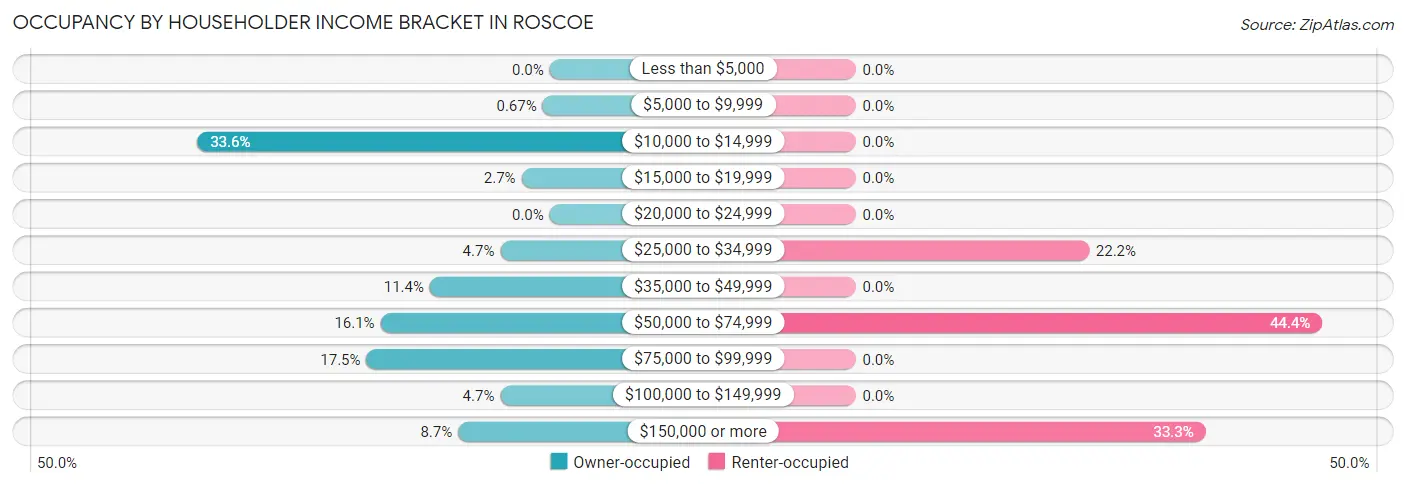
| Income Bracket | Owner-occupied | Renter-occupied |
| Less than $5,000 | 0 (0.0%) | 0 (0.0%) |
| $5,000 to $9,999 | 1 (0.7%) | 0 (0.0%) |
| $10,000 to $14,999 | 50 (33.6%) | 0 (0.0%) |
| $15,000 to $19,999 | 4 (2.7%) | 0 (0.0%) |
| $20,000 to $24,999 | 0 (0.0%) | 0 (0.0%) |
| $25,000 to $34,999 | 7 (4.7%) | 2 (22.2%) |
| $35,000 to $49,999 | 17 (11.4%) | 0 (0.0%) |
| $50,000 to $74,999 | 24 (16.1%) | 4 (44.4%) |
| $75,000 to $99,999 | 26 (17.4%) | 0 (0.0%) |
| $100,000 to $149,999 | 7 (4.7%) | 0 (0.0%) |
| $150,000 or more | 13 (8.7%) | 3 (33.3%) |
| Total | 149 (100.0%) | 9 (100.0%) |
Monthly Housing Cost Tiers in Roscoe
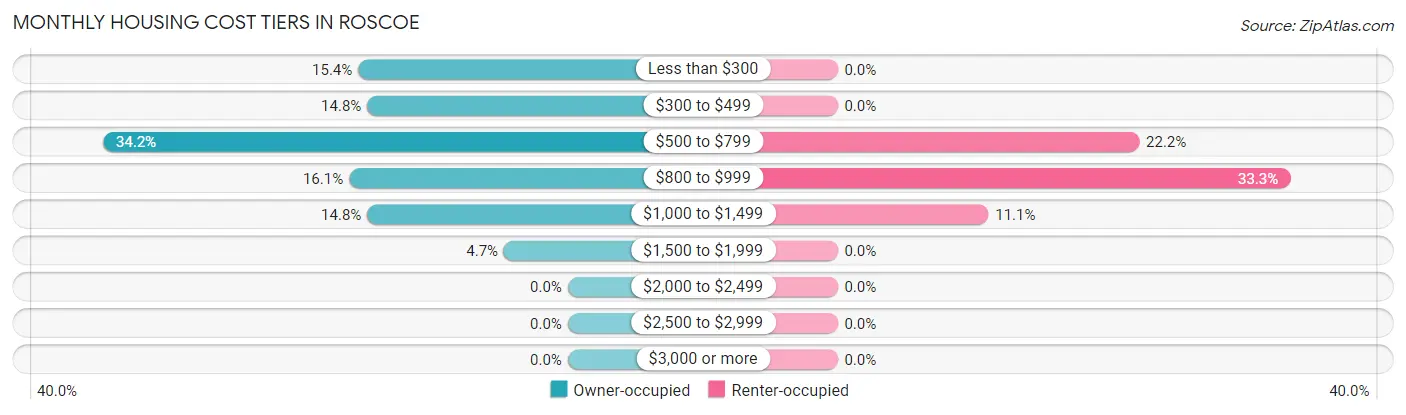
| Monthly Cost | Owner-occupied | Renter-occupied |
| Less than $300 | 23 (15.4%) | 0 (0.0%) |
| $300 to $499 | 22 (14.8%) | 0 (0.0%) |
| $500 to $799 | 51 (34.2%) | 2 (22.2%) |
| $800 to $999 | 24 (16.1%) | 3 (33.3%) |
| $1,000 to $1,499 | 22 (14.8%) | 1 (11.1%) |
| $1,500 to $1,999 | 7 (4.7%) | 0 (0.0%) |
| $2,000 to $2,499 | 0 (0.0%) | 0 (0.0%) |
| $2,500 to $2,999 | 0 (0.0%) | 0 (0.0%) |
| $3,000 or more | 0 (0.0%) | 0 (0.0%) |
| Total | 149 (100.0%) | 9 (100.0%) |
Physical Housing Characteristics in Roscoe
Housing Structures in Roscoe
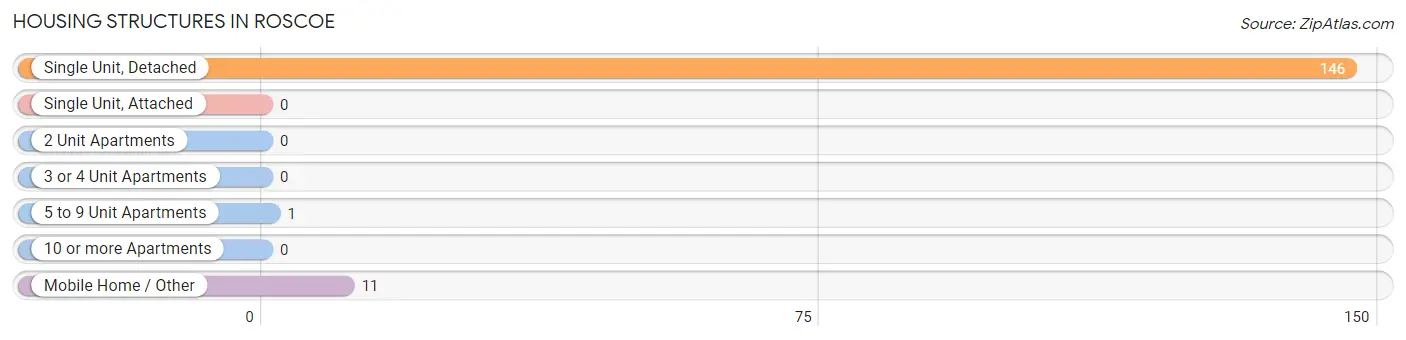
| Structure Type | # Housing Units | % Housing Units |
| Single Unit, Detached | 146 | 92.4% |
| Single Unit, Attached | 0 | 0.0% |
| 2 Unit Apartments | 0 | 0.0% |
| 3 or 4 Unit Apartments | 0 | 0.0% |
| 5 to 9 Unit Apartments | 1 | 0.6% |
| 10 or more Apartments | 0 | 0.0% |
| Mobile Home / Other | 11 | 7.0% |
| Total | 158 | 100.0% |
Housing Structures by Occupancy in Roscoe
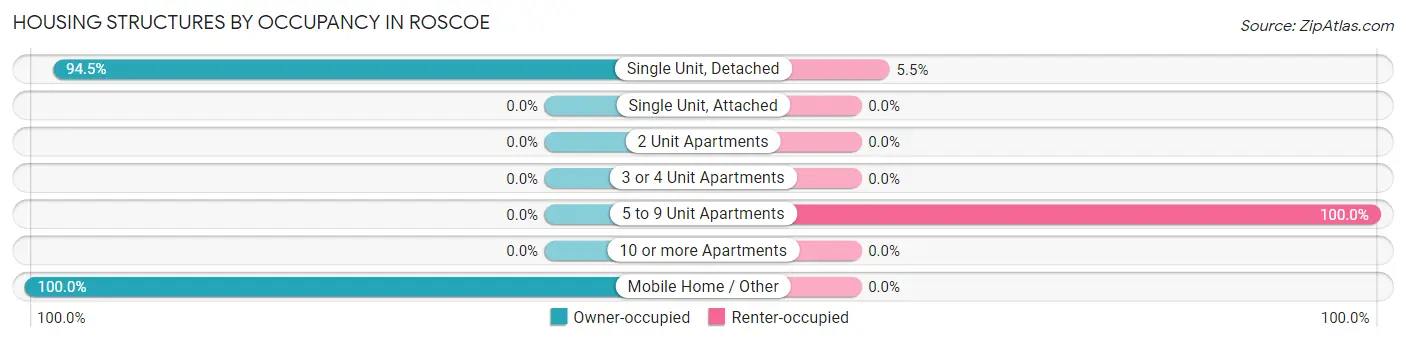
| Structure Type | Owner-occupied | Renter-occupied |
| Single Unit, Detached | 138 (94.5%) | 8 (5.5%) |
| Single Unit, Attached | 0 (0.0%) | 0 (0.0%) |
| 2 Unit Apartments | 0 (0.0%) | 0 (0.0%) |
| 3 or 4 Unit Apartments | 0 (0.0%) | 0 (0.0%) |
| 5 to 9 Unit Apartments | 0 (0.0%) | 1 (100.0%) |
| 10 or more Apartments | 0 (0.0%) | 0 (0.0%) |
| Mobile Home / Other | 11 (100.0%) | 0 (0.0%) |
| Total | 149 (94.3%) | 9 (5.7%) |
Housing Structures by Number of Rooms in Roscoe
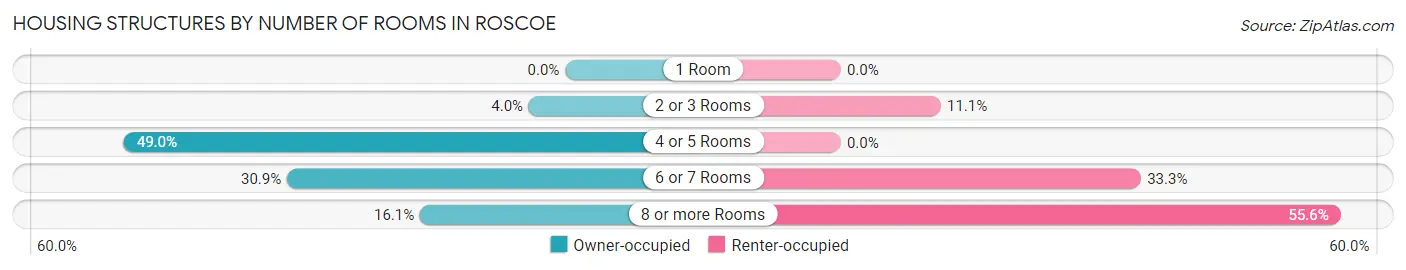
| Number of Rooms | Owner-occupied | Renter-occupied |
| 1 Room | 0 (0.0%) | 0 (0.0%) |
| 2 or 3 Rooms | 6 (4.0%) | 1 (11.1%) |
| 4 or 5 Rooms | 73 (49.0%) | 0 (0.0%) |
| 6 or 7 Rooms | 46 (30.9%) | 3 (33.3%) |
| 8 or more Rooms | 24 (16.1%) | 5 (55.6%) |
| Total | 149 (100.0%) | 9 (100.0%) |
Housing Structure by Heating Type in Roscoe
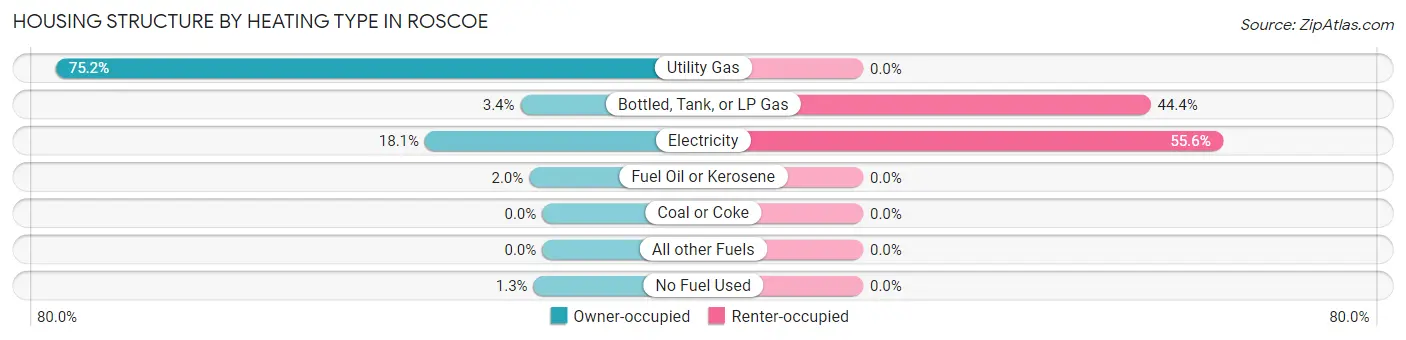
| Heating Type | Owner-occupied | Renter-occupied |
| Utility Gas | 112 (75.2%) | 0 (0.0%) |
| Bottled, Tank, or LP Gas | 5 (3.4%) | 4 (44.4%) |
| Electricity | 27 (18.1%) | 5 (55.6%) |
| Fuel Oil or Kerosene | 3 (2.0%) | 0 (0.0%) |
| Coal or Coke | 0 (0.0%) | 0 (0.0%) |
| All other Fuels | 0 (0.0%) | 0 (0.0%) |
| No Fuel Used | 2 (1.3%) | 0 (0.0%) |
| Total | 149 (100.0%) | 9 (100.0%) |
Household Vehicle Usage in Roscoe
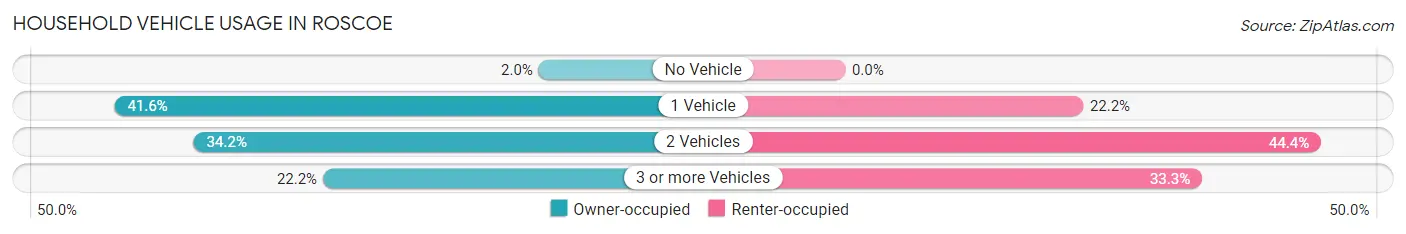
| Vehicles per Household | Owner-occupied | Renter-occupied |
| No Vehicle | 3 (2.0%) | 0 (0.0%) |
| 1 Vehicle | 62 (41.6%) | 2 (22.2%) |
| 2 Vehicles | 51 (34.2%) | 4 (44.4%) |
| 3 or more Vehicles | 33 (22.2%) | 3 (33.3%) |
| Total | 149 (100.0%) | 9 (100.0%) |
Real Estate & Mortgages in Roscoe
Real Estate and Mortgage Overview in Roscoe
| Characteristic | Without Mortgage | With Mortgage |
| Housing Units | 61 | 88 |
| Median Property Value | $47,500 | $66,700 |
| Median Household Income | $57,917 | $9 |
| Monthly Housing Costs | $358 | $0 |
| Real Estate Taxes | $564 | $1 |
Property Value by Mortgage Status in Roscoe
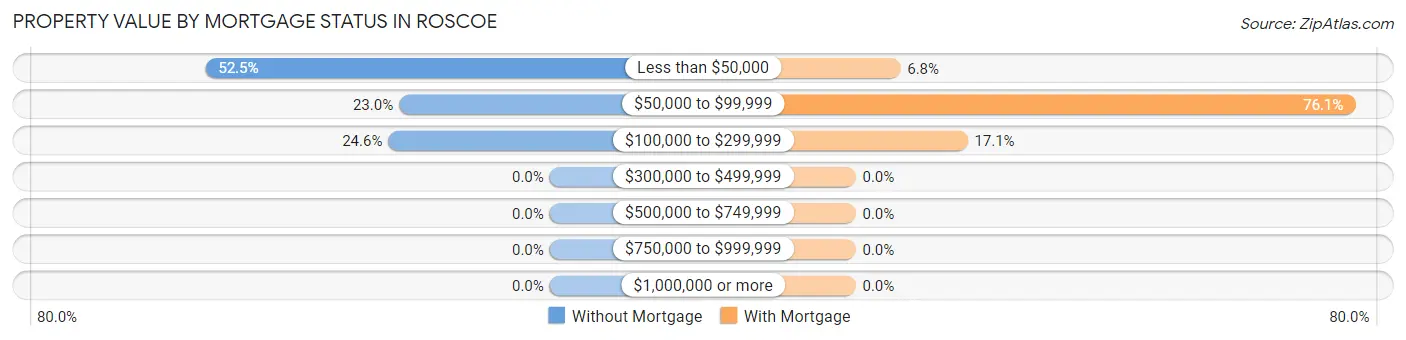
| Property Value | Without Mortgage | With Mortgage |
| Less than $50,000 | 32 (52.5%) | 6 (6.8%) |
| $50,000 to $99,999 | 14 (23.0%) | 67 (76.1%) |
| $100,000 to $299,999 | 15 (24.6%) | 15 (17.1%) |
| $300,000 to $499,999 | 0 (0.0%) | 0 (0.0%) |
| $500,000 to $749,999 | 0 (0.0%) | 0 (0.0%) |
| $750,000 to $999,999 | 0 (0.0%) | 0 (0.0%) |
| $1,000,000 or more | 0 (0.0%) | 0 (0.0%) |
| Total | 61 (100.0%) | 88 (100.0%) |
Household Income by Mortgage Status in Roscoe
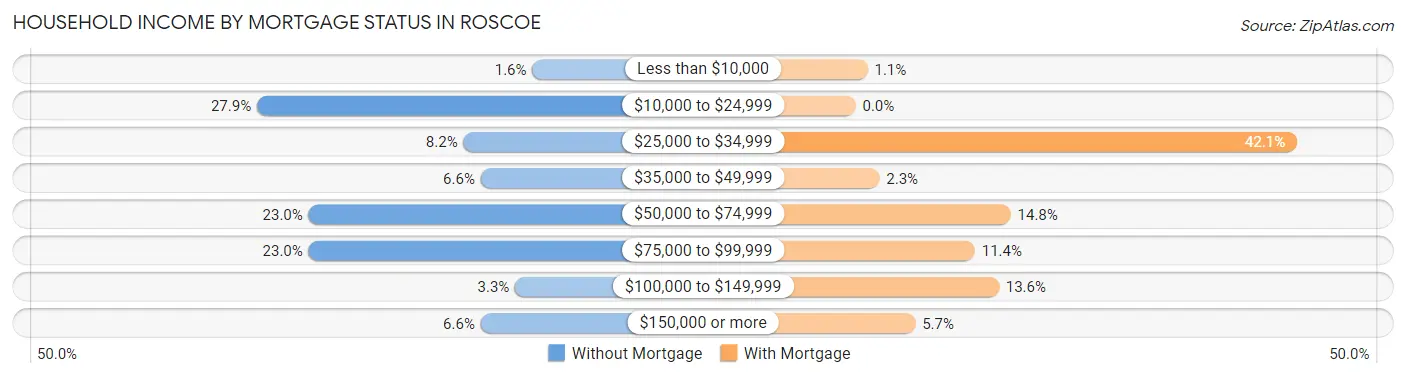
| Household Income | Without Mortgage | With Mortgage |
| Less than $10,000 | 1 (1.6%) | 1 (1.1%) |
| $10,000 to $24,999 | 17 (27.9%) | 0 (0.0%) |
| $25,000 to $34,999 | 5 (8.2%) | 37 (42.0%) |
| $35,000 to $49,999 | 4 (6.6%) | 2 (2.3%) |
| $50,000 to $74,999 | 14 (23.0%) | 13 (14.8%) |
| $75,000 to $99,999 | 14 (23.0%) | 10 (11.4%) |
| $100,000 to $149,999 | 2 (3.3%) | 12 (13.6%) |
| $150,000 or more | 4 (6.6%) | 5 (5.7%) |
| Total | 61 (100.0%) | 88 (100.0%) |
Property Value to Household Income Ratio in Roscoe
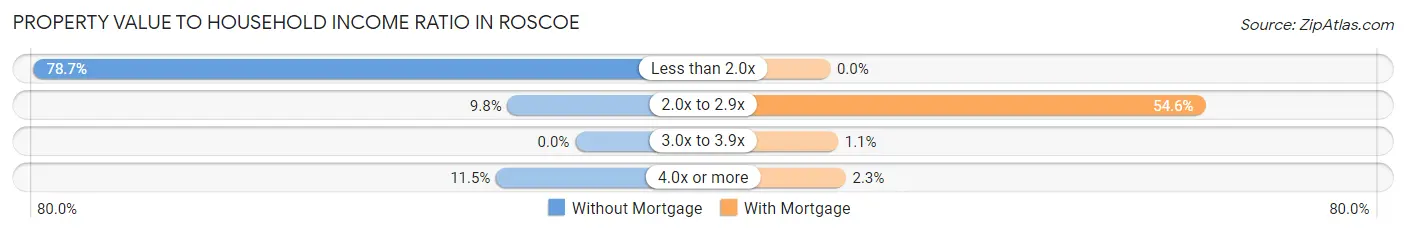
| Value-to-Income Ratio | Without Mortgage | With Mortgage |
| Less than 2.0x | 48 (78.7%) | 0 (0.0%) |
| 2.0x to 2.9x | 6 (9.8%) | 48 (54.5%) |
| 3.0x to 3.9x | 0 (0.0%) | 1 (1.1%) |
| 4.0x or more | 7 (11.5%) | 2 (2.3%) |
| Total | 61 (100.0%) | 88 (100.0%) |
Real Estate Taxes by Mortgage Status in Roscoe
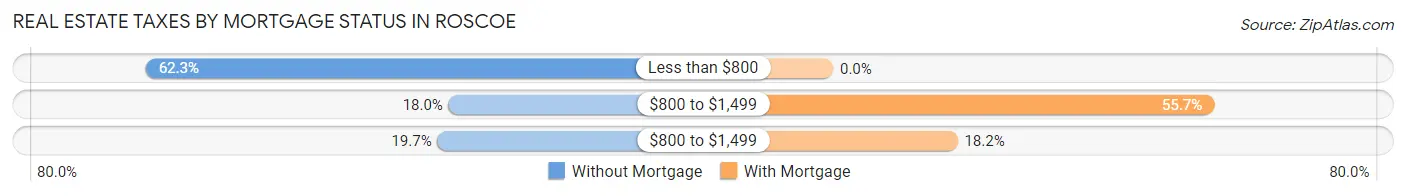
| Property Taxes | Without Mortgage | With Mortgage |
| Less than $800 | 38 (62.3%) | 0 (0.0%) |
| $800 to $1,499 | 11 (18.0%) | 49 (55.7%) |
| $800 to $1,499 | 12 (19.7%) | 16 (18.2%) |
| Total | 61 (100.0%) | 88 (100.0%) |
Health & Disability in Roscoe
Health Insurance Coverage by Age in Roscoe
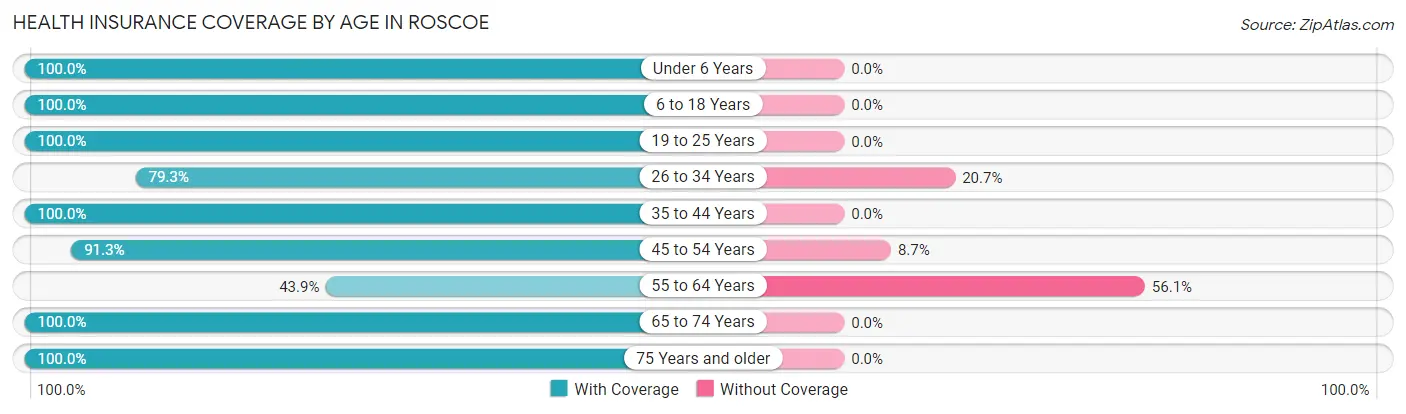
| Age Bracket | With Coverage | Without Coverage |
| Under 6 Years | 23 (100.0%) | 0 (0.0%) |
| 6 to 18 Years | 42 (100.0%) | 0 (0.0%) |
| 19 to 25 Years | 3 (100.0%) | 0 (0.0%) |
| 26 to 34 Years | 23 (79.3%) | 6 (20.7%) |
| 35 to 44 Years | 61 (100.0%) | 0 (0.0%) |
| 45 to 54 Years | 42 (91.3%) | 4 (8.7%) |
| 55 to 64 Years | 29 (43.9%) | 37 (56.1%) |
| 65 to 74 Years | 39 (100.0%) | 0 (0.0%) |
| 75 Years and older | 20 (100.0%) | 0 (0.0%) |
| Total | 282 (85.7%) | 47 (14.3%) |
Health Insurance Coverage by Citizenship Status in Roscoe
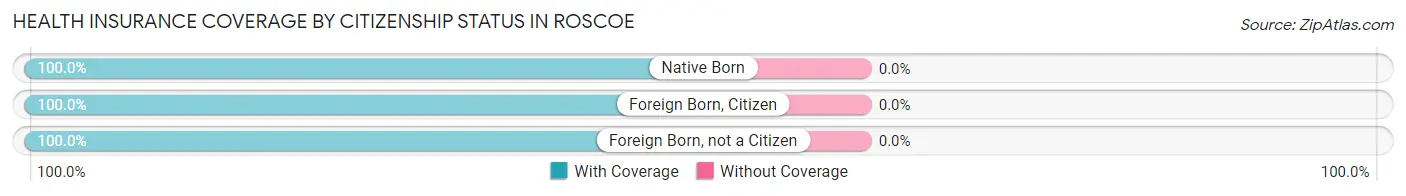
| Citizenship Status | With Coverage | Without Coverage |
| Native Born | 23 (100.0%) | 0 (0.0%) |
| Foreign Born, Citizen | 42 (100.0%) | 0 (0.0%) |
| Foreign Born, not a Citizen | 3 (100.0%) | 0 (0.0%) |
Health Insurance Coverage by Household Income in Roscoe
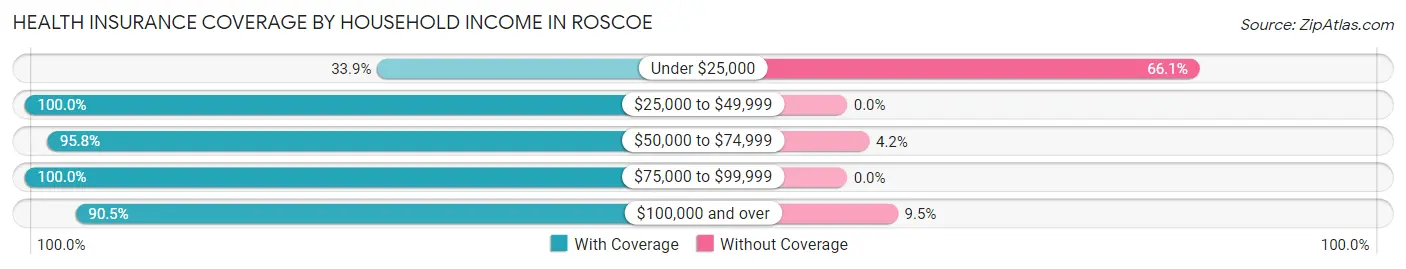
| Household Income | With Coverage | Without Coverage |
| Under $25,000 | 19 (33.9%) | 37 (66.1%) |
| $25,000 to $49,999 | 47 (100.0%) | 0 (0.0%) |
| $50,000 to $74,999 | 92 (95.8%) | 4 (4.2%) |
| $75,000 to $99,999 | 67 (100.0%) | 0 (0.0%) |
| $100,000 and over | 57 (90.5%) | 6 (9.5%) |
Public vs Private Health Insurance Coverage by Age in Roscoe
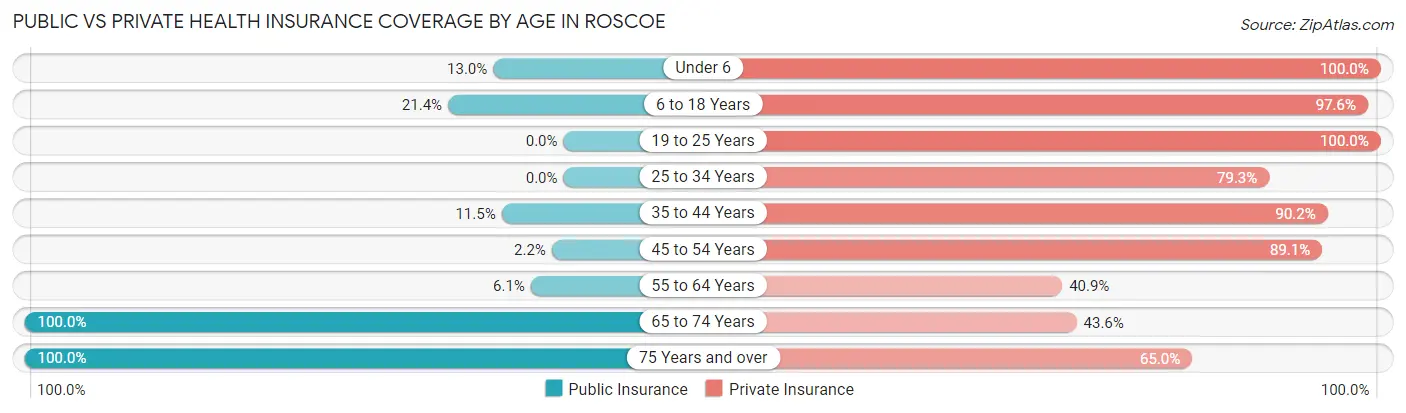
| Age Bracket | Public Insurance | Private Insurance |
| Under 6 | 3 (13.0%) | 23 (100.0%) |
| 6 to 18 Years | 9 (21.4%) | 41 (97.6%) |
| 19 to 25 Years | 0 (0.0%) | 3 (100.0%) |
| 25 to 34 Years | 0 (0.0%) | 23 (79.3%) |
| 35 to 44 Years | 7 (11.5%) | 55 (90.2%) |
| 45 to 54 Years | 1 (2.2%) | 41 (89.1%) |
| 55 to 64 Years | 4 (6.1%) | 27 (40.9%) |
| 65 to 74 Years | 39 (100.0%) | 17 (43.6%) |
| 75 Years and over | 20 (100.0%) | 13 (65.0%) |
| Total | 83 (25.2%) | 243 (73.9%) |
Disability Status by Sex by Age in Roscoe
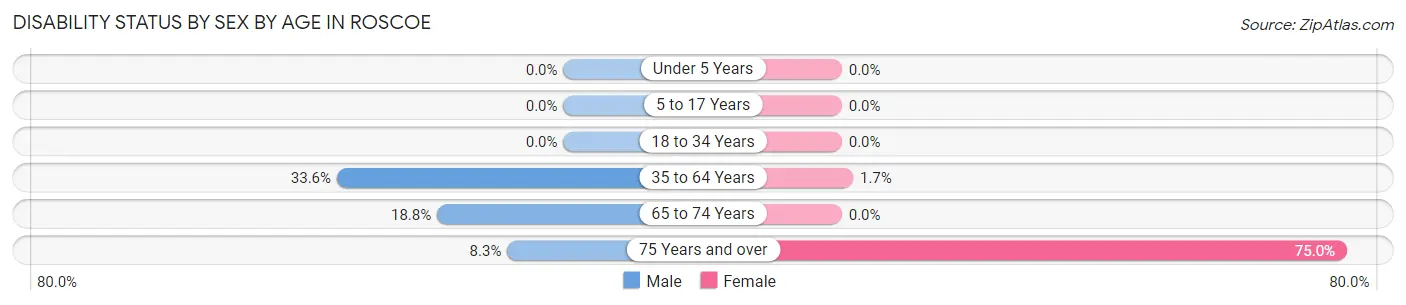
| Age Bracket | Male | Female |
| Under 5 Years | 0 (0.0%) | 0 (0.0%) |
| 5 to 17 Years | 0 (0.0%) | 0 (0.0%) |
| 18 to 34 Years | 0 (0.0%) | 0 (0.0%) |
| 35 to 64 Years | 38 (33.6%) | 1 (1.7%) |
| 65 to 74 Years | 3 (18.8%) | 0 (0.0%) |
| 75 Years and over | 1 (8.3%) | 6 (75.0%) |
Disability Class by Sex by Age in Roscoe
Disability Class: Hearing Difficulty
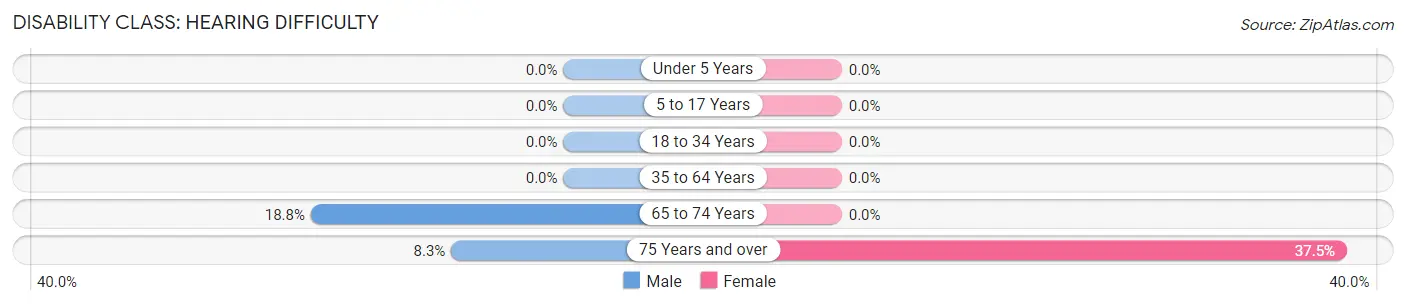
| Age Bracket | Male | Female |
| Under 5 Years | 0 (0.0%) | 0 (0.0%) |
| 5 to 17 Years | 0 (0.0%) | 0 (0.0%) |
| 18 to 34 Years | 0 (0.0%) | 0 (0.0%) |
| 35 to 64 Years | 0 (0.0%) | 0 (0.0%) |
| 65 to 74 Years | 3 (18.8%) | 0 (0.0%) |
| 75 Years and over | 1 (8.3%) | 3 (37.5%) |
Disability Class: Vision Difficulty
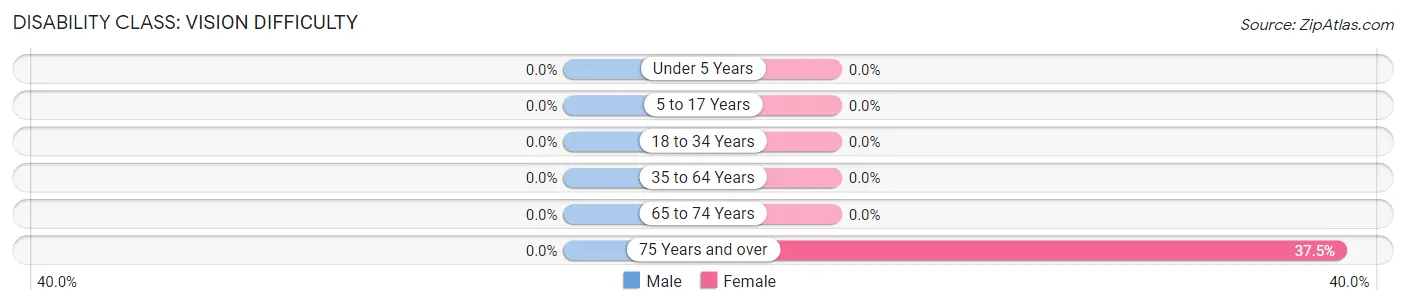
| Age Bracket | Male | Female |
| Under 5 Years | 0 (0.0%) | 0 (0.0%) |
| 5 to 17 Years | 0 (0.0%) | 0 (0.0%) |
| 18 to 34 Years | 0 (0.0%) | 0 (0.0%) |
| 35 to 64 Years | 0 (0.0%) | 0 (0.0%) |
| 65 to 74 Years | 0 (0.0%) | 0 (0.0%) |
| 75 Years and over | 0 (0.0%) | 3 (37.5%) |
Disability Class: Cognitive Difficulty
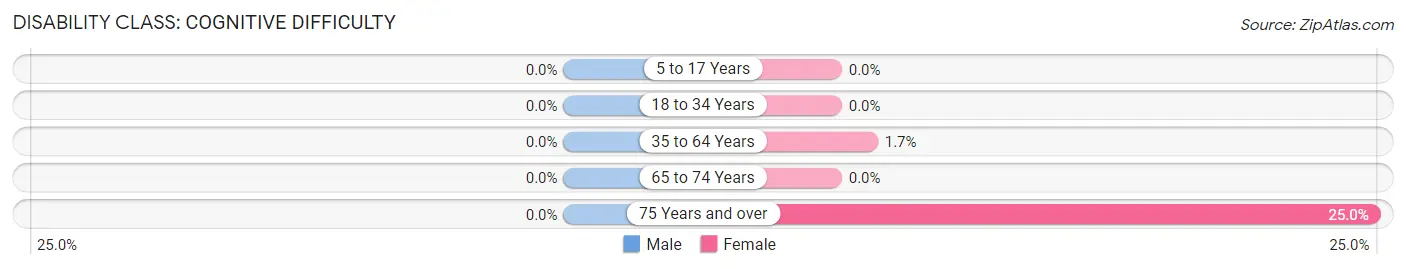
| Age Bracket | Male | Female |
| 5 to 17 Years | 0 (0.0%) | 0 (0.0%) |
| 18 to 34 Years | 0 (0.0%) | 0 (0.0%) |
| 35 to 64 Years | 0 (0.0%) | 1 (1.7%) |
| 65 to 74 Years | 0 (0.0%) | 0 (0.0%) |
| 75 Years and over | 0 (0.0%) | 2 (25.0%) |
Disability Class: Ambulatory Difficulty
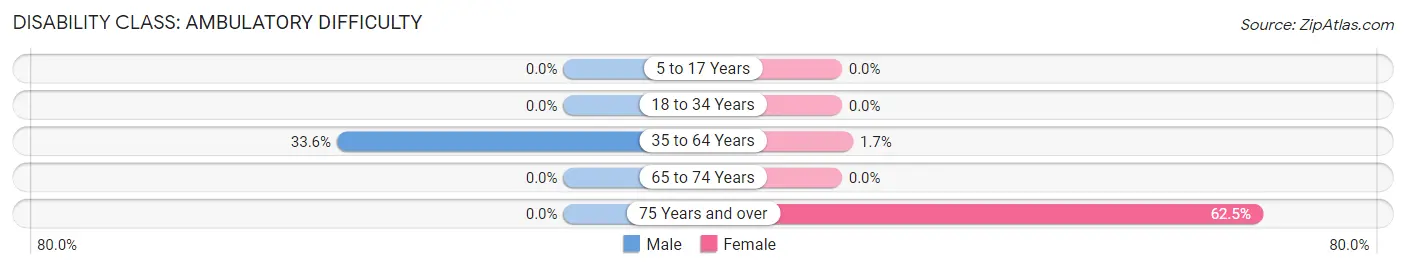
| Age Bracket | Male | Female |
| 5 to 17 Years | 0 (0.0%) | 0 (0.0%) |
| 18 to 34 Years | 0 (0.0%) | 0 (0.0%) |
| 35 to 64 Years | 38 (33.6%) | 1 (1.7%) |
| 65 to 74 Years | 0 (0.0%) | 0 (0.0%) |
| 75 Years and over | 0 (0.0%) | 5 (62.5%) |
Disability Class: Self-Care Difficulty
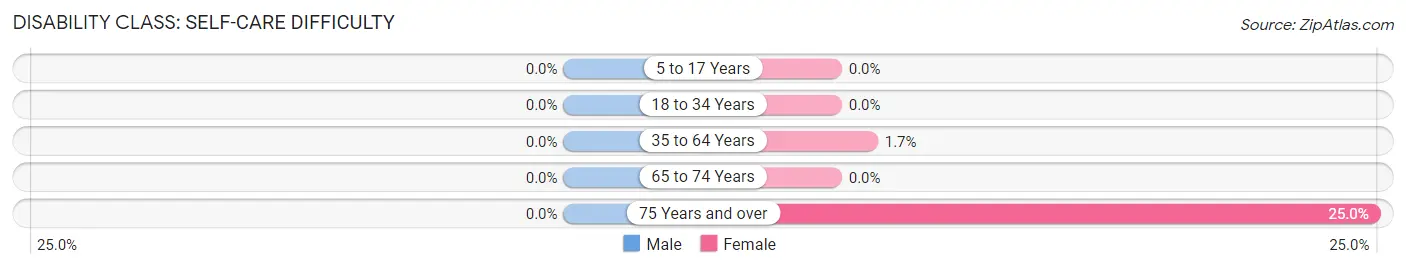
| Age Bracket | Male | Female |
| 5 to 17 Years | 0 (0.0%) | 0 (0.0%) |
| 18 to 34 Years | 0 (0.0%) | 0 (0.0%) |
| 35 to 64 Years | 0 (0.0%) | 1 (1.7%) |
| 65 to 74 Years | 0 (0.0%) | 0 (0.0%) |
| 75 Years and over | 0 (0.0%) | 2 (25.0%) |
Technology Access in Roscoe
Computing Device Access in Roscoe
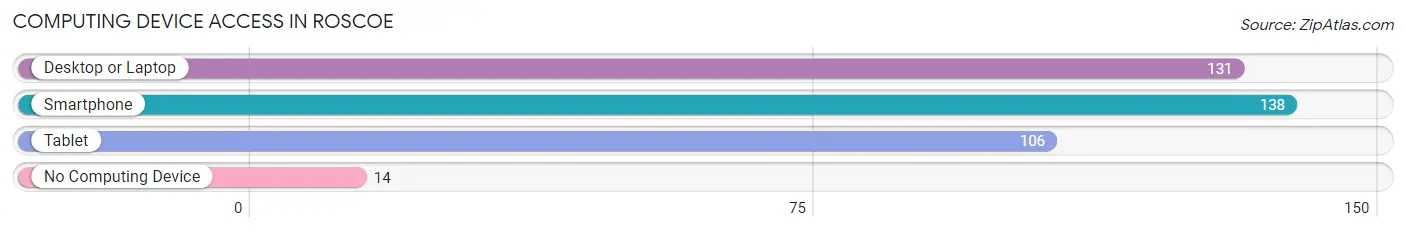
| Device Type | # Households | % Households |
| Desktop or Laptop | 131 | 82.9% |
| Smartphone | 138 | 87.3% |
| Tablet | 106 | 67.1% |
| No Computing Device | 14 | 8.9% |
| Total | 158 | 100.0% |
Internet Access in Roscoe
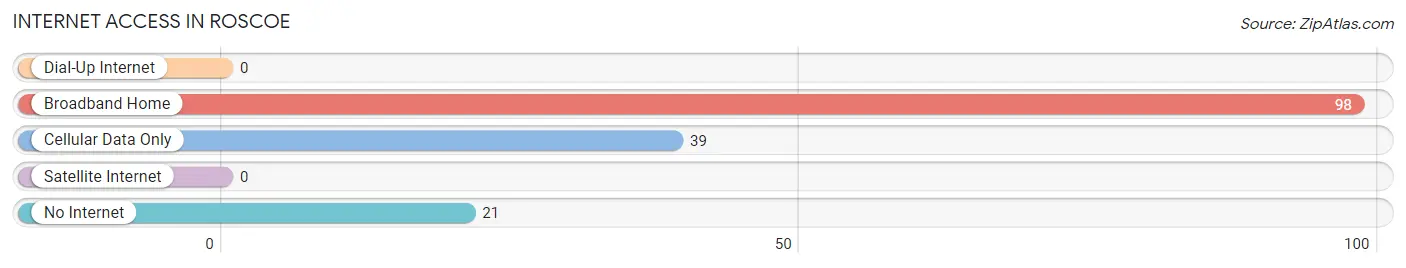
| Internet Type | # Households | % Households |
| Dial-Up Internet | 0 | 0.0% |
| Broadband Home | 98 | 62.0% |
| Cellular Data Only | 39 | 24.7% |
| Satellite Internet | 0 | 0.0% |
| No Internet | 21 | 13.3% |
| Total | 158 | 100.0% |
Roscoe Summary
Roscoe, South Dakota is a small town located in the southeastern corner of the state. It is situated in the rolling hills of the Missouri River Valley, and is surrounded by the scenic beauty of the Black Hills. The town was founded in 1883 and has a population of just over 500 people.
History
Roscoe was founded in 1883 by a group of settlers from Wisconsin. The town was named after Roscoe Conkling, a prominent politician from New York. The settlers were attracted to the area by the fertile soil and the abundance of natural resources. The town quickly grew and by the early 1900s, it had become a thriving agricultural community.
The town was also home to a number of businesses, including a general store, a blacksmith shop, a hotel, and a bank. In the early 1900s, the town was also home to a number of churches, including the Methodist Episcopal Church, the Congregational Church, and the Catholic Church.
In the 1920s, the town experienced a period of growth and prosperity. The population increased from 500 to over 1,000 people. The town also saw the construction of a number of new buildings, including a school, a library, and a hospital.
Geography
Roscoe is located in the southeastern corner of South Dakota, in the rolling hills of the Missouri River Valley. The town is surrounded by the scenic beauty of the Black Hills. The town is located at an elevation of 2,400 feet above sea level.
The town is located in the Central Time Zone and has a humid continental climate. The average temperature in the summer is around 75 degrees Fahrenheit, and the average temperature in the winter is around 25 degrees Fahrenheit.
Economy
The economy of Roscoe is largely based on agriculture. The town is home to a number of farms, which produce a variety of crops, including corn, wheat, soybeans, and hay. The town is also home to a number of businesses, including a general store, a blacksmith shop, a hotel, and a bank.
Demographics
As of the 2010 census, the population of Roscoe was 514 people. The racial makeup of the town was 97.3% White, 0.4% African American, 0.2% Native American, 0.2% Asian, 0.2% from other races, and 1.9% from two or more races. The median household income was $37,500, and the median family income was $45,000.
Conclusion
Roscoe, South Dakota is a small town located in the southeastern corner of the state. It is situated in the rolling hills of the Missouri River Valley, and is surrounded by the scenic beauty of the Black Hills. The town was founded in 1883 and has a population of just over 500 people. The economy of Roscoe is largely based on agriculture, and the town is home to a number of businesses. The racial makeup of the town is predominantly White, with a small percentage of African American, Native American, and Asian residents.
Common Questions
What is Per Capita Income in Roscoe?
Per Capita income in Roscoe is $37,719.
What is the Median Family Income in Roscoe?
Median Family Income in Roscoe is $78,125.
What is the Median Household income in Roscoe?
Median Household Income in Roscoe is $46,667.
What is Income or Wage Gap in Roscoe?
Income or Wage Gap in Roscoe is 19.4%.
Women in Roscoe earn 80.6 cents for every dollar earned by a man.
What is Inequality or Gini Index in Roscoe?
Inequality or Gini Index in Roscoe is 0.55.
What is the Total Population of Roscoe?
Total Population of Roscoe is 329.
What is the Total Male Population of Roscoe?
Total Male Population of Roscoe is 185.
What is the Total Female Population of Roscoe?
Total Female Population of Roscoe is 144.
What is the Ratio of Males per 100 Females in Roscoe?
There are 128.47 Males per 100 Females in Roscoe.
What is the Ratio of Females per 100 Males in Roscoe?
There are 77.84 Females per 100 Males in Roscoe.
What is the Median Population Age in Roscoe?
Median Population Age in Roscoe is 45.8 Years.
What is the Average Family Size in Roscoe
Average Family Size in Roscoe is 3.3 People.
What is the Average Household Size in Roscoe
Average Household Size in Roscoe is 2.1 People.
How Large is the Labor Force in Roscoe?
There are 206 People in the Labor Forcein in Roscoe.
What is the Percentage of People in the Labor Force in Roscoe?
71.8% of People are in the Labor Force in Roscoe.