Zip Codes with the Highest Percentage of Population Employed in Farming, Fishing & Forestry in Gresham, OR
RELATED REPORTS & OPTIONS
Farming, Fishing & Forestry
Gresham
Compare Zip Codes
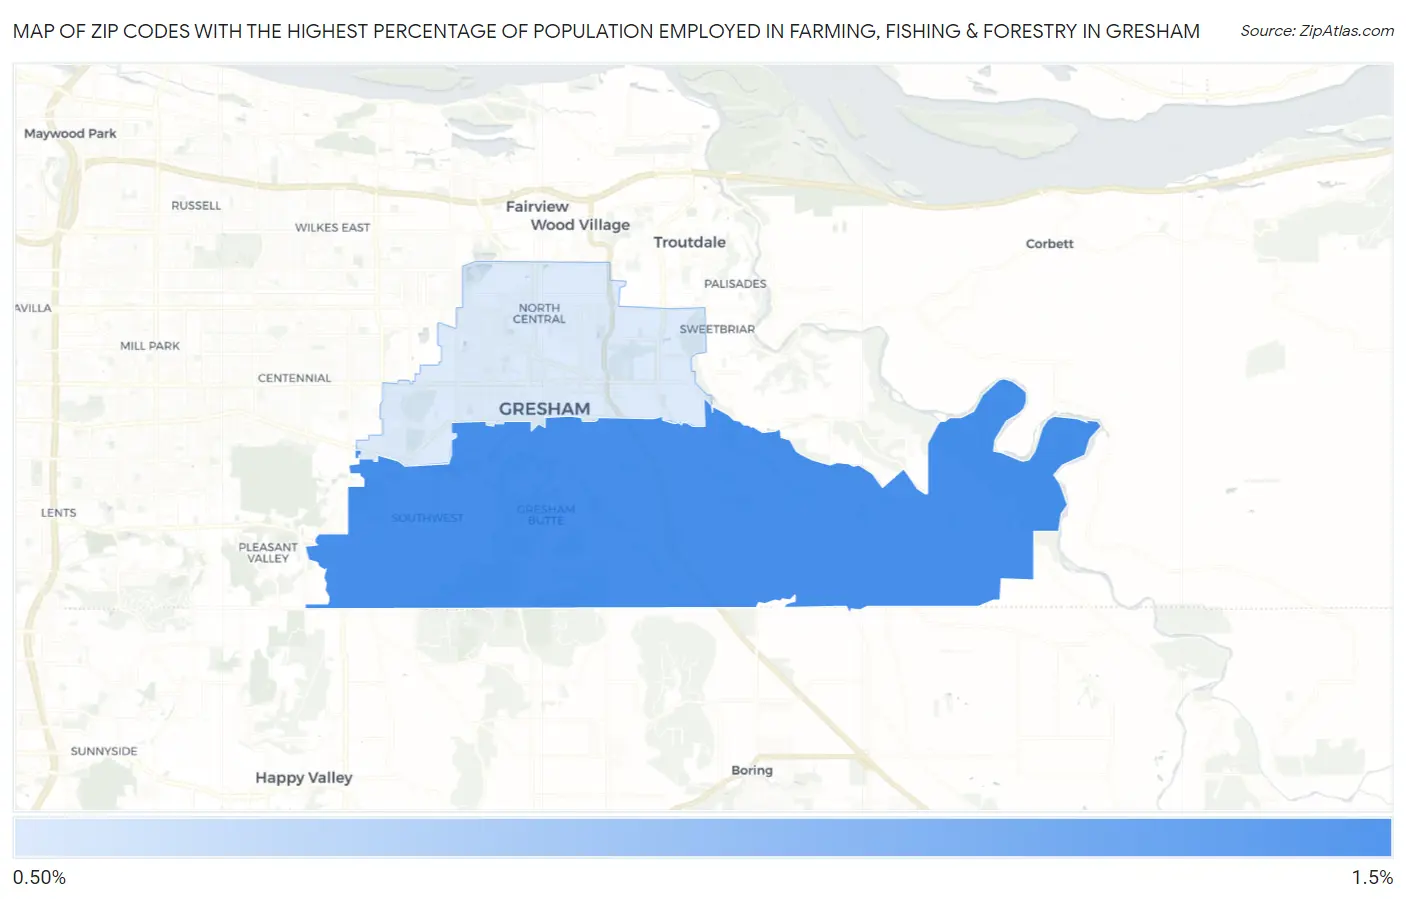
Map of Zip Codes with the Highest Percentage of Population Employed in Farming, Fishing & Forestry in Gresham
0.90%
1.3%
Zip Codes with the Highest Percentage of Population Employed in Farming, Fishing & Forestry in Gresham, OR
| Zip Code | % Employed | vs State | vs National | |
| 1. | 97080 | 1.3% | 1.4%(-0.117)#206 | 0.61%(+0.684)#8,605 |
| 2. | 97030 | 0.90% | 1.4%(-0.506)#230 | 0.61%(+0.296)#10,225 |
1
Common Questions
What are the Top Zip Codes with the Highest Percentage of Population Employed in Farming, Fishing & Forestry in Gresham, OR?
Top Zip Codes with the Highest Percentage of Population Employed in Farming, Fishing & Forestry in Gresham, OR are:
What zip code has the Highest Percentage of Population Employed in Farming, Fishing & Forestry in Gresham, OR?
97080 has the Highest Percentage of Population Employed in Farming, Fishing & Forestry in Gresham, OR with 1.3%.
What is the Percentage of Population Employed in Farming, Fishing & Forestry in Gresham, OR?
Percentage of Population Employed in Farming, Fishing & Forestry in Gresham is 1.2%.
What is the Percentage of Population Employed in Farming, Fishing & Forestry in Oregon?
Percentage of Population Employed in Farming, Fishing & Forestry in Oregon is 1.4%.
What is the Percentage of Population Employed in Farming, Fishing & Forestry in the United States?
Percentage of Population Employed in Farming, Fishing & Forestry in the United States is 0.61%.