Zip Codes with the Highest Percentage of Population Employed in Farming, Fishing & Forestry in Oregon
RELATED REPORTS & OPTIONS
Farming, Fishing & Forestry
Oregon
Compare Zip Codes
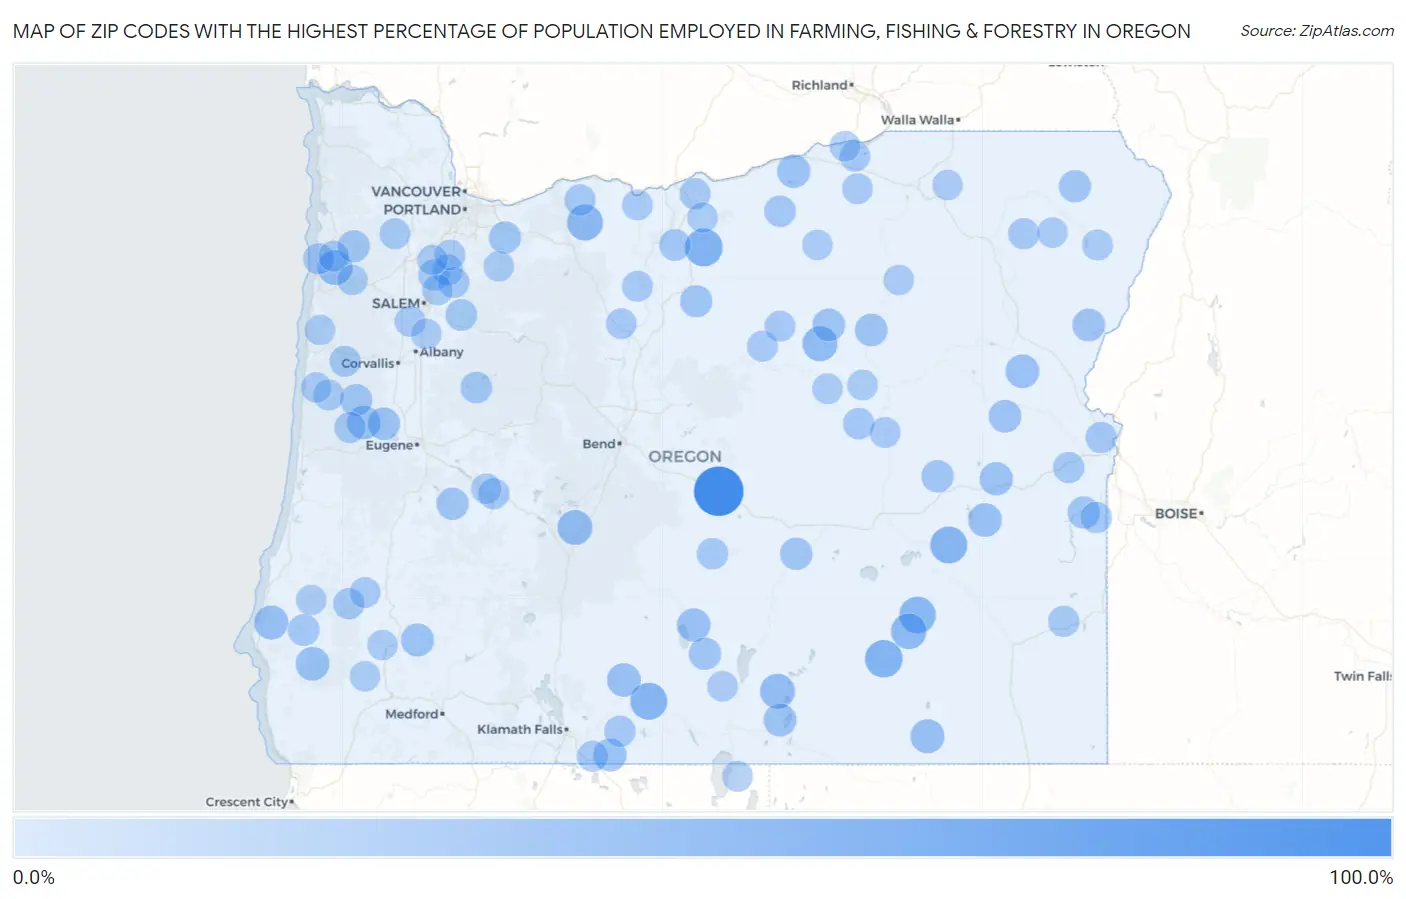
Map of Zip Codes with the Highest Percentage of Population Employed in Farming, Fishing & Forestry in Oregon
0.0%
100.0%
Zip Codes with the Highest Percentage of Population Employed in Farming, Fishing & Forestry in Oregon
| Zip Code | % Employed | vs State | vs National | |
| 1. | 97712 | 100.0% | 1.4%(+98.6)#1 | 0.61%(+99.4)#5 |
| 2. | 97033 | 40.4% | 1.4%(+39.0)#2 | 0.61%(+39.8)#98 |
| 3. | 97736 | 39.4% | 1.4%(+38.0)#3 | 0.61%(+38.8)#105 |
| 4. | 97622 | 36.7% | 1.4%(+35.3)#4 | 0.61%(+36.1)#123 |
| 5. | 97732 | 36.2% | 1.4%(+34.8)#5 | 0.61%(+35.6)#128 |
| 6. | 97722 | 34.5% | 1.4%(+33.1)#6 | 0.61%(+33.9)#151 |
| 7. | 97041 | 31.6% | 1.4%(+30.2)#7 | 0.61%(+31.0)#170 |
| 8. | 97721 | 29.2% | 1.4%(+27.8)#8 | 0.61%(+28.6)#209 |
| 9. | 97122 | 26.5% | 1.4%(+25.1)#9 | 0.61%(+25.9)#251 |
| 10. | 97848 | 26.5% | 1.4%(+25.1)#10 | 0.61%(+25.9)#254 |
| 11. | 97637 | 26.1% | 1.4%(+24.7)#11 | 0.61%(+25.5)#266 |
| 12. | 97737 | 25.7% | 1.4%(+24.3)#12 | 0.61%(+25.1)#275 |
| 13. | 97450 | 22.3% | 1.4%(+20.9)#13 | 0.61%(+21.7)#335 |
| 14. | 97710 | 21.4% | 1.4%(+20.0)#14 | 0.61%(+20.8)#360 |
| 15. | 97406 | 20.3% | 1.4%(+18.9)#15 | 0.61%(+19.7)#389 |
| 16. | 97917 | 20.0% | 1.4%(+18.6)#16 | 0.61%(+19.4)#407 |
| 17. | 97819 | 20.0% | 1.4%(+18.6)#17 | 0.61%(+19.4)#410 |
| 18. | 97412 | 19.5% | 1.4%(+18.1)#18 | 0.61%(+18.9)#427 |
| 19. | 97621 | 19.3% | 1.4%(+17.9)#19 | 0.61%(+18.7)#432 |
| 20. | 97640 | 18.9% | 1.4%(+17.5)#20 | 0.61%(+18.3)#449 |
| 21. | 97818 | 18.5% | 1.4%(+17.1)#21 | 0.61%(+17.9)#458 |
| 22. | 97911 | 17.9% | 1.4%(+16.4)#22 | 0.61%(+17.3)#485 |
| 23. | 97410 | 17.0% | 1.4%(+15.6)#23 | 0.61%(+16.4)#531 |
| 24. | 97632 | 16.9% | 1.4%(+15.5)#24 | 0.61%(+16.3)#536 |
| 25. | 97620 | 16.7% | 1.4%(+15.3)#25 | 0.61%(+16.1)#557 |
| 26. | 97864 | 15.8% | 1.4%(+14.4)#26 | 0.61%(+15.2)#601 |
| 27. | 97870 | 15.8% | 1.4%(+14.4)#27 | 0.61%(+15.2)#604 |
| 28. | 97908 | 15.4% | 1.4%(+14.0)#28 | 0.61%(+14.8)#624 |
| 29. | 97856 | 15.3% | 1.4%(+13.9)#29 | 0.61%(+14.7)#625 |
| 30. | 97419 | 15.1% | 1.4%(+13.7)#30 | 0.61%(+14.5)#642 |
| 31. | 97758 | 14.3% | 1.4%(+12.9)#31 | 0.61%(+13.7)#697 |
| 32. | 97904 | 13.9% | 1.4%(+12.5)#32 | 0.61%(+13.3)#733 |
| 33. | 97434 | 13.8% | 1.4%(+12.4)#33 | 0.61%(+13.2)#736 |
| 34. | 97636 | 13.8% | 1.4%(+12.3)#34 | 0.61%(+13.1)#741 |
| 35. | 97022 | 13.4% | 1.4%(+12.0)#35 | 0.61%(+12.8)#782 |
| 36. | 97001 | 13.1% | 1.4%(+11.7)#36 | 0.61%(+12.5)#801 |
| 37. | 97828 | 13.0% | 1.4%(+11.6)#37 | 0.61%(+12.4)#808 |
| 38. | 97913 | 13.0% | 1.4%(+11.6)#38 | 0.61%(+12.4)#813 |
| 39. | 97108 | 12.6% | 1.4%(+11.2)#39 | 0.61%(+12.0)#848 |
| 40. | 97324 | 12.3% | 1.4%(+10.9)#40 | 0.61%(+11.7)#901 |
| 41. | 97385 | 11.0% | 1.4%(+9.57)#41 | 0.61%(+10.4)#1,051 |
| 42. | 97466 | 10.9% | 1.4%(+9.52)#42 | 0.61%(+10.3)#1,057 |
| 43. | 97345 | 10.4% | 1.4%(+8.97)#43 | 0.61%(+9.77)#1,148 |
| 44. | 97843 | 10.4% | 1.4%(+8.96)#44 | 0.61%(+9.76)#1,151 |
| 45. | 97029 | 10.3% | 1.4%(+8.94)#45 | 0.61%(+9.74)#1,156 |
| 46. | 97820 | 9.9% | 1.4%(+8.45)#46 | 0.61%(+9.25)#1,231 |
| 47. | 97914 | 9.5% | 1.4%(+8.08)#47 | 0.61%(+8.88)#1,299 |
| 48. | 97623 | 9.2% | 1.4%(+7.75)#48 | 0.61%(+8.56)#1,369 |
| 49. | 97641 | 9.1% | 1.4%(+7.66)#49 | 0.61%(+8.46)#1,390 |
| 50. | 97901 | 9.0% | 1.4%(+7.62)#50 | 0.61%(+8.42)#1,397 |
| 51. | 97031 | 8.6% | 1.4%(+7.18)#51 | 0.61%(+7.98)#1,506 |
| 52. | 97430 | 8.5% | 1.4%(+7.09)#52 | 0.61%(+7.89)#1,528 |
| 53. | 97918 | 8.4% | 1.4%(+6.95)#53 | 0.61%(+7.75)#1,549 |
| 54. | 97910 | 8.3% | 1.4%(+6.89)#54 | 0.61%(+7.69)#1,574 |
| 55. | 97026 | 8.3% | 1.4%(+6.85)#55 | 0.61%(+7.65)#1,589 |
| 56. | 97416 | 8.2% | 1.4%(+6.76)#56 | 0.61%(+7.56)#1,617 |
| 57. | 97135 | 8.1% | 1.4%(+6.71)#57 | 0.61%(+7.51)#1,630 |
| 58. | 97824 | 8.1% | 1.4%(+6.65)#58 | 0.61%(+7.46)#1,643 |
| 59. | 97463 | 8.0% | 1.4%(+6.54)#59 | 0.61%(+7.35)#1,682 |
| 60. | 97071 | 7.8% | 1.4%(+6.40)#60 | 0.61%(+7.20)#1,715 |
| 61. | 97362 | 7.8% | 1.4%(+6.39)#61 | 0.61%(+7.19)#1,719 |
| 62. | 97633 | 7.7% | 1.4%(+6.31)#62 | 0.61%(+7.11)#1,750 |
| 63. | 97343 | 7.5% | 1.4%(+6.08)#63 | 0.61%(+6.88)#1,824 |
| 64. | 97065 | 7.4% | 1.4%(+5.99)#64 | 0.61%(+6.79)#1,858 |
| 65. | 97750 | 7.1% | 1.4%(+5.64)#65 | 0.61%(+6.45)#1,960 |
| 66. | 97148 | 7.0% | 1.4%(+5.61)#66 | 0.61%(+6.42)#1,969 |
| 67. | 97874 | 7.0% | 1.4%(+5.55)#67 | 0.61%(+6.35)#1,996 |
| 68. | 97873 | 6.9% | 1.4%(+5.49)#68 | 0.61%(+6.29)#2,026 |
| 69. | 97351 | 6.9% | 1.4%(+5.45)#69 | 0.61%(+6.25)#2,043 |
| 70. | 97846 | 6.8% | 1.4%(+5.40)#70 | 0.61%(+6.20)#2,054 |
| 71. | 97112 | 6.6% | 1.4%(+5.17)#71 | 0.61%(+5.97)#2,132 |
| 72. | 97390 | 6.5% | 1.4%(+5.06)#72 | 0.61%(+5.86)#2,176 |
| 73. | 97481 | 6.4% | 1.4%(+5.04)#73 | 0.61%(+5.84)#2,187 |
| 74. | 97635 | 6.2% | 1.4%(+4.78)#74 | 0.61%(+5.58)#2,298 |
| 75. | 97058 | 6.1% | 1.4%(+4.73)#75 | 0.61%(+5.54)#2,322 |
| 76. | 97037 | 6.1% | 1.4%(+4.66)#76 | 0.61%(+5.46)#2,359 |
| 77. | 97002 | 6.0% | 1.4%(+4.55)#77 | 0.61%(+5.35)#2,414 |
| 78. | 97305 | 5.8% | 1.4%(+4.44)#78 | 0.61%(+5.24)#2,471 |
| 79. | 97761 | 5.8% | 1.4%(+4.38)#79 | 0.61%(+5.19)#2,496 |
| 80. | 97838 | 5.7% | 1.4%(+4.28)#80 | 0.61%(+5.08)#2,556 |
| 81. | 97825 | 5.6% | 1.4%(+4.24)#81 | 0.61%(+5.04)#2,571 |
| 82. | 97826 | 5.6% | 1.4%(+4.20)#82 | 0.61%(+5.00)#2,597 |
| 83. | 97137 | 5.6% | 1.4%(+4.16)#83 | 0.61%(+4.96)#2,617 |
| 84. | 97865 | 5.5% | 1.4%(+4.11)#84 | 0.61%(+4.91)#2,642 |
| 85. | 97352 | 5.1% | 1.4%(+3.71)#85 | 0.61%(+4.51)#2,853 |
| 86. | 97882 | 4.9% | 1.4%(+3.53)#86 | 0.61%(+4.33)#2,966 |
| 87. | 97880 | 4.9% | 1.4%(+3.51)#87 | 0.61%(+4.31)#2,983 |
| 88. | 97394 | 4.9% | 1.4%(+3.50)#88 | 0.61%(+4.30)#2,993 |
| 89. | 97630 | 4.9% | 1.4%(+3.47)#89 | 0.61%(+4.27)#3,020 |
| 90. | 97017 | 4.8% | 1.4%(+3.43)#90 | 0.61%(+4.23)#3,048 |
| 91. | 97380 | 4.8% | 1.4%(+3.35)#91 | 0.61%(+4.16)#3,099 |
| 92. | 97347 | 4.7% | 1.4%(+3.34)#92 | 0.61%(+4.14)#3,119 |
| 93. | 97857 | 4.7% | 1.4%(+3.29)#93 | 0.61%(+4.10)#3,153 |
| 94. | 97532 | 4.7% | 1.4%(+3.27)#94 | 0.61%(+4.07)#3,168 |
| 95. | 97458 | 4.6% | 1.4%(+3.24)#95 | 0.61%(+4.04)#3,197 |
| 96. | 97442 | 4.6% | 1.4%(+3.22)#96 | 0.61%(+4.02)#3,208 |
| 97. | 97810 | 4.6% | 1.4%(+3.17)#97 | 0.61%(+3.97)#3,244 |
| 98. | 97492 | 4.5% | 1.4%(+3.08)#98 | 0.61%(+3.88)#3,317 |
| 99. | 97836 | 4.5% | 1.4%(+3.06)#99 | 0.61%(+3.86)#3,330 |
| 100. | 97039 | 4.5% | 1.4%(+3.06)#100 | 0.61%(+3.86)#3,332 |
Common Questions
What are the Top 10 Zip Codes with the Highest Percentage of Population Employed in Farming, Fishing & Forestry in Oregon?
Top 10 Zip Codes with the Highest Percentage of Population Employed in Farming, Fishing & Forestry in Oregon are:
What zip code has the Highest Percentage of Population Employed in Farming, Fishing & Forestry in Oregon?
97712 has the Highest Percentage of Population Employed in Farming, Fishing & Forestry in Oregon with 100.0%.
What is the Percentage of Population Employed in Farming, Fishing & Forestry in the State of Oregon?
Percentage of Population Employed in Farming, Fishing & Forestry in Oregon is 1.4%.
What is the Percentage of Population Employed in Farming, Fishing & Forestry in the United States?
Percentage of Population Employed in Farming, Fishing & Forestry in the United States is 0.61%.