Zip Codes with the Highest Percentage of Population Employed in Farming, Fishing & Forestry in Beaverton, OR
RELATED REPORTS & OPTIONS
Farming, Fishing & Forestry
Beaverton
Compare Zip Codes
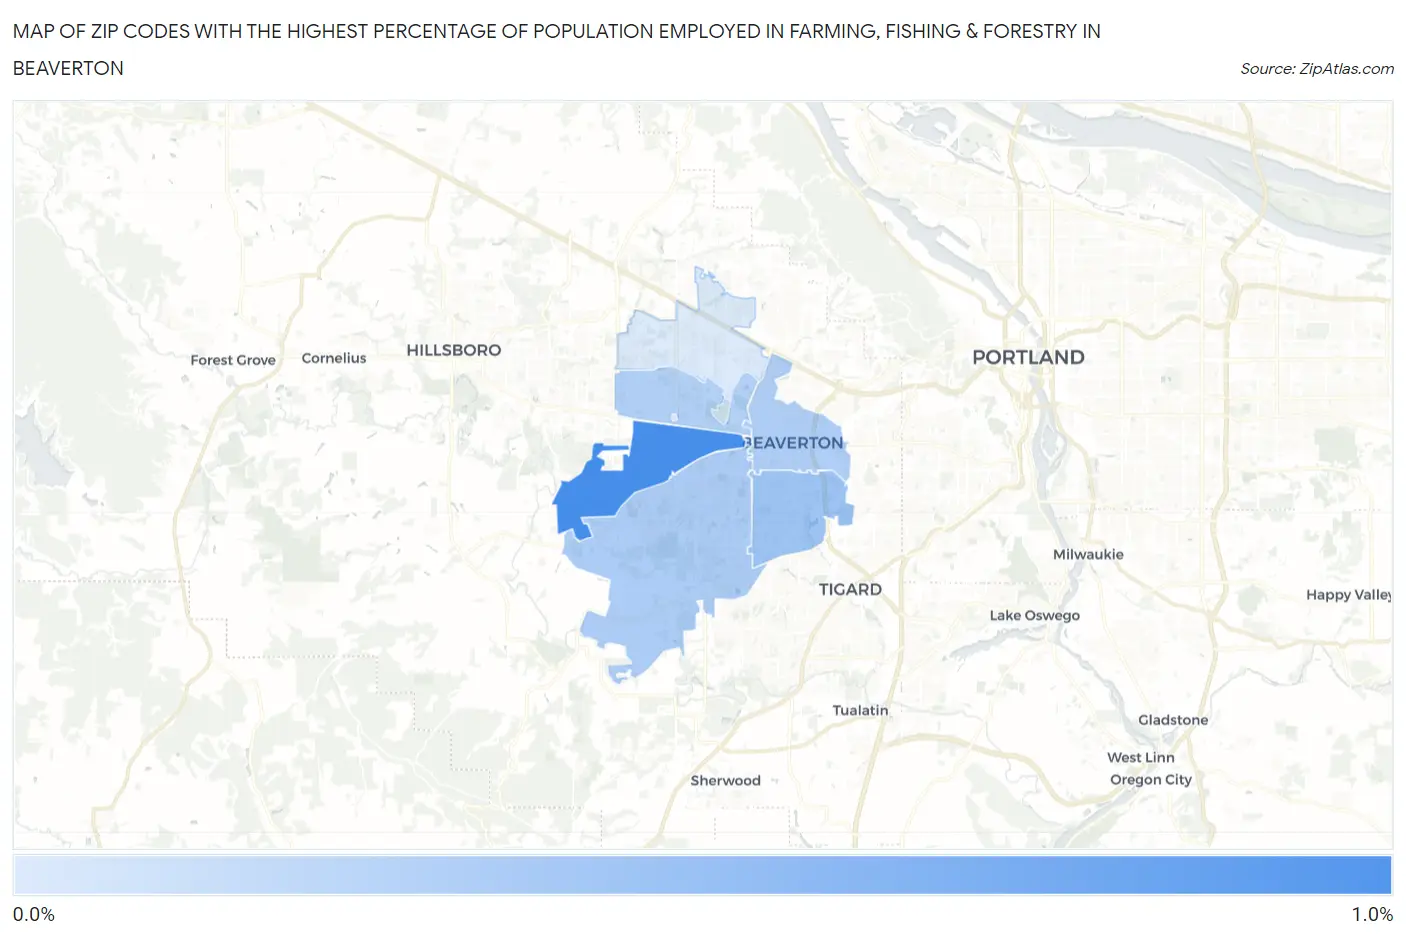
Map of Zip Codes with the Highest Percentage of Population Employed in Farming, Fishing & Forestry in Beaverton
0.0040%
0.96%
Zip Codes with the Highest Percentage of Population Employed in Farming, Fishing & Forestry in Beaverton, OR
| Zip Code | % Employed | vs State | vs National | |
| 1. | 97078 | 0.96% | 1.4%(-0.451)#227 | 0.61%(+0.351)#9,950 |
| 2. | 97008 | 0.40% | 1.4%(-1.00)#280 | 0.61%(-0.202)#13,726 |
| 3. | 97007 | 0.31% | 1.4%(-1.10)#290 | 0.61%(-0.297)#14,725 |
| 4. | 97005 | 0.30% | 1.4%(-1.11)#292 | 0.61%(-0.304)#14,814 |
| 5. | 97003 | 0.27% | 1.4%(-1.14)#296 | 0.61%(-0.336)#15,175 |
| 6. | 97006 | 0.0040% | 1.4%(-1.40)#323 | 0.61%(-0.602)#19,211 |
1
Common Questions
What are the Top 5 Zip Codes with the Highest Percentage of Population Employed in Farming, Fishing & Forestry in Beaverton, OR?
Top 5 Zip Codes with the Highest Percentage of Population Employed in Farming, Fishing & Forestry in Beaverton, OR are:
What zip code has the Highest Percentage of Population Employed in Farming, Fishing & Forestry in Beaverton, OR?
97078 has the Highest Percentage of Population Employed in Farming, Fishing & Forestry in Beaverton, OR with 0.96%.
What is the Percentage of Population Employed in Farming, Fishing & Forestry in Beaverton, OR?
Percentage of Population Employed in Farming, Fishing & Forestry in Beaverton is 0.20%.
What is the Percentage of Population Employed in Farming, Fishing & Forestry in Oregon?
Percentage of Population Employed in Farming, Fishing & Forestry in Oregon is 1.4%.
What is the Percentage of Population Employed in Farming, Fishing & Forestry in the United States?
Percentage of Population Employed in Farming, Fishing & Forestry in the United States is 0.61%.