Zip Codes with the Highest Percentage of Population Employed in Education Instruction & Library in Oregon
RELATED REPORTS & OPTIONS
Education Instruction & Library
Oregon
Compare Zip Codes
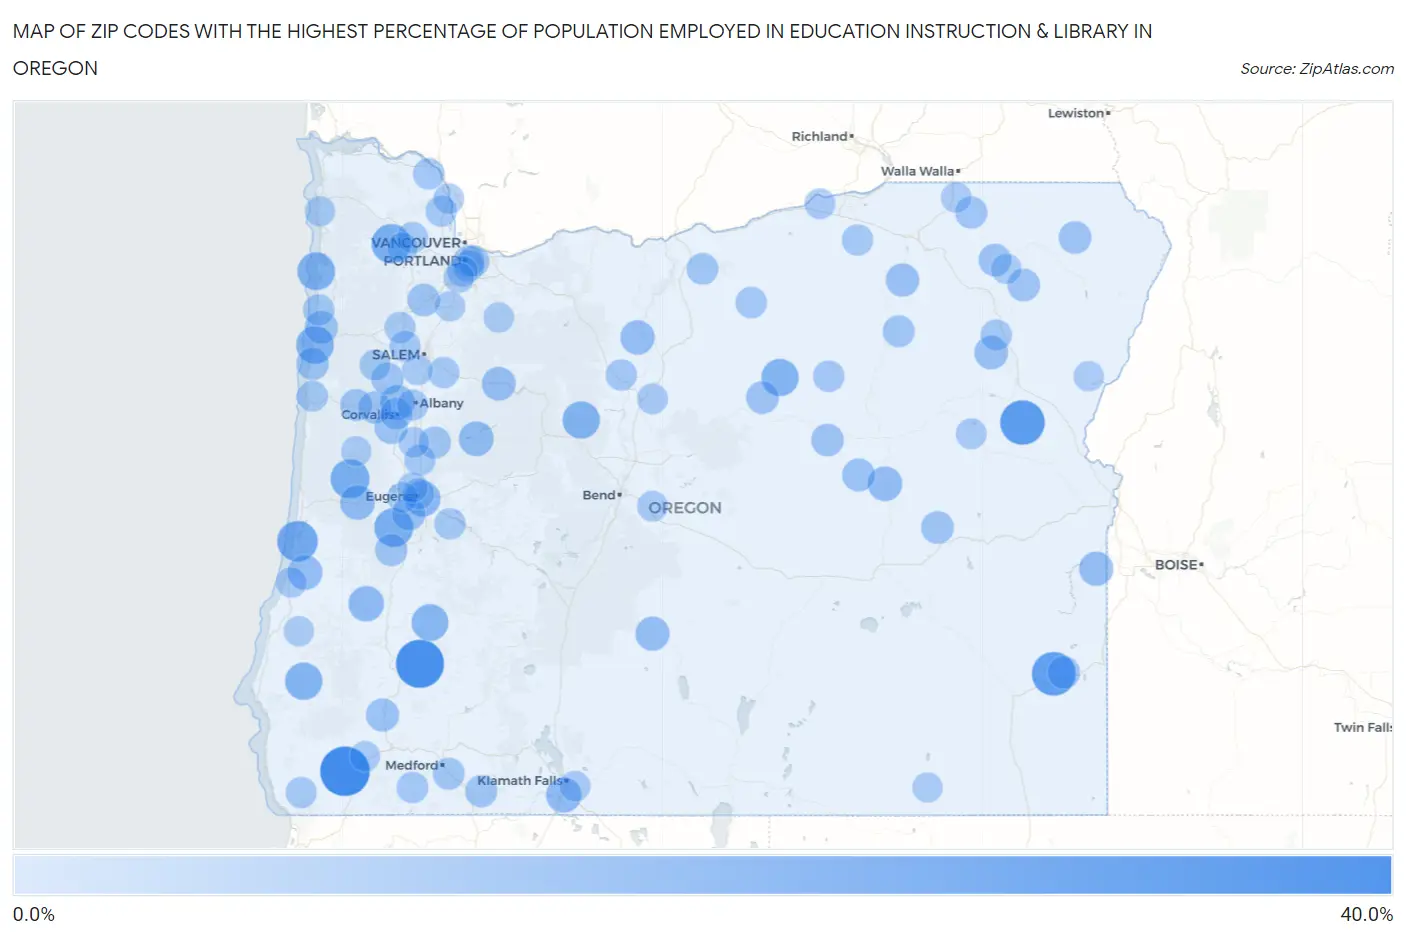
Map of Zip Codes with the Highest Percentage of Population Employed in Education Instruction & Library in Oregon
0.0%
40.0%
Zip Codes with the Highest Percentage of Population Employed in Education Instruction & Library in Oregon
| Zip Code | % Employed | vs State | vs National | |
| 1. | 97538 | 38.1% | 5.6%(+32.5)#1 | 6.2%(+32.0)#145 |
| 2. | 97429 | 36.0% | 5.6%(+30.3)#2 | 6.2%(+29.8)#169 |
| 3. | 97819 | 30.0% | 5.6%(+24.4)#3 | 6.2%(+23.8)#264 |
| 4. | 97902 | 28.6% | 5.6%(+22.9)#4 | 6.2%(+22.4)#288 |
| 5. | 97441 | 23.5% | 5.6%(+17.9)#5 | 6.2%(+17.3)#433 |
| 6. | 97117 | 21.4% | 5.6%(+15.8)#6 | 6.2%(+15.3)#543 |
| 7. | 97430 | 20.9% | 5.6%(+15.3)#7 | 6.2%(+14.7)#573 |
| 8. | 97451 | 20.8% | 5.6%(+15.2)#8 | 6.2%(+14.6)#578 |
| 9. | 97364 | 18.9% | 5.6%(+13.2)#9 | 6.2%(+12.7)#755 |
| 10. | 97134 | 18.8% | 5.6%(+13.2)#10 | 6.2%(+12.7)#758 |
| 11. | 97466 | 18.3% | 5.6%(+12.7)#11 | 6.2%(+12.1)#801 |
| 12. | 97874 | 18.3% | 5.6%(+12.6)#12 | 6.2%(+12.1)#807 |
| 13. | 97730 | 18.2% | 5.6%(+12.5)#13 | 6.2%(+12.0)#816 |
| 14. | 97443 | 17.4% | 5.6%(+11.7)#14 | 6.2%(+11.2)#906 |
| 15. | 97403 | 15.9% | 5.6%(+10.3)#15 | 6.2%(+9.71)#1,111 |
| 16. | 97486 | 15.2% | 5.6%(+9.61)#16 | 6.2%(+9.06)#1,243 |
| 17. | 97634 | 15.0% | 5.6%(+9.39)#17 | 6.2%(+8.85)#1,276 |
| 18. | 97449 | 14.2% | 5.6%(+8.54)#18 | 6.2%(+7.99)#1,492 |
| 19. | 97345 | 14.2% | 5.6%(+8.51)#19 | 6.2%(+7.97)#1,497 |
| 20. | 97490 | 14.1% | 5.6%(+8.47)#20 | 6.2%(+7.92)#1,516 |
| 21. | 97330 | 14.0% | 5.6%(+8.41)#21 | 6.2%(+7.86)#1,532 |
| 22. | 97873 | 13.8% | 5.6%(+8.16)#22 | 6.2%(+7.61)#1,618 |
| 23. | 97037 | 13.6% | 5.6%(+7.95)#23 | 6.2%(+7.40)#1,684 |
| 24. | 97901 | 13.4% | 5.6%(+7.72)#24 | 6.2%(+7.17)#1,761 |
| 25. | 97638 | 13.2% | 5.6%(+7.59)#25 | 6.2%(+7.04)#1,814 |
| 26. | 97346 | 12.6% | 5.6%(+6.93)#26 | 6.2%(+6.39)#2,087 |
| 27. | 97833 | 12.4% | 5.6%(+6.81)#27 | 6.2%(+6.27)#2,150 |
| 28. | 97405 | 12.0% | 5.6%(+6.34)#28 | 6.2%(+5.80)#2,395 |
| 29. | 97868 | 11.9% | 5.6%(+6.26)#29 | 6.2%(+5.71)#2,444 |
| 30. | 97333 | 11.7% | 5.6%(+6.07)#30 | 6.2%(+5.53)#2,564 |
| 31. | 97497 | 11.5% | 5.6%(+5.86)#31 | 6.2%(+5.31)#2,702 |
| 32. | 97149 | 11.4% | 5.6%(+5.81)#32 | 6.2%(+5.26)#2,742 |
| 33. | 97820 | 11.3% | 5.6%(+5.63)#33 | 6.2%(+5.08)#2,877 |
| 34. | 97750 | 10.9% | 5.6%(+5.26)#34 | 6.2%(+4.71)#3,137 |
| 35. | 97904 | 10.9% | 5.6%(+5.25)#35 | 6.2%(+4.71)#3,142 |
| 36. | 97388 | 10.8% | 5.6%(+5.15)#36 | 6.2%(+4.60)#3,215 |
| 37. | 97370 | 10.8% | 5.6%(+5.15)#37 | 6.2%(+4.60)#3,220 |
| 38. | 97828 | 10.8% | 5.6%(+5.12)#38 | 6.2%(+4.58)#3,232 |
| 39. | 97824 | 10.7% | 5.6%(+5.11)#39 | 6.2%(+4.57)#3,241 |
| 40. | 97825 | 10.7% | 5.6%(+5.10)#40 | 6.2%(+4.55)#3,252 |
| 41. | 97876 | 10.7% | 5.6%(+5.07)#41 | 6.2%(+4.52)#3,268 |
| 42. | 97910 | 10.7% | 5.6%(+5.03)#42 | 6.2%(+4.49)#3,300 |
| 43. | 97115 | 10.7% | 5.6%(+5.03)#43 | 6.2%(+4.48)#3,302 |
| 44. | 97361 | 10.4% | 5.6%(+4.78)#44 | 6.2%(+4.23)#3,537 |
| 45. | 97435 | 10.3% | 5.6%(+4.68)#45 | 6.2%(+4.13)#3,631 |
| 46. | 97886 | 10.1% | 5.6%(+4.50)#46 | 6.2%(+3.95)#3,794 |
| 47. | 97326 | 10.1% | 5.6%(+4.42)#47 | 6.2%(+3.87)#3,876 |
| 48. | 97520 | 10.0% | 5.6%(+4.33)#48 | 6.2%(+3.78)#3,978 |
| 49. | 97327 | 9.9% | 5.6%(+4.27)#49 | 6.2%(+3.72)#4,044 |
| 50. | 97880 | 9.8% | 5.6%(+4.20)#50 | 6.2%(+3.65)#4,131 |
| 51. | 97331 | 9.6% | 5.6%(+3.95)#51 | 6.2%(+3.40)#4,423 |
| 52. | 97535 | 9.4% | 5.6%(+3.80)#52 | 6.2%(+3.25)#4,596 |
| 53. | 97039 | 9.4% | 5.6%(+3.74)#53 | 6.2%(+3.19)#4,681 |
| 54. | 97530 | 9.0% | 5.6%(+3.38)#54 | 6.2%(+2.83)#5,209 |
| 55. | 97135 | 9.0% | 5.6%(+3.34)#55 | 6.2%(+2.80)#5,268 |
| 56. | 97823 | 8.9% | 5.6%(+3.27)#56 | 6.2%(+2.73)#5,371 |
| 57. | 97048 | 8.9% | 5.6%(+3.23)#57 | 6.2%(+2.68)#5,448 |
| 58. | 97761 | 8.8% | 5.6%(+3.14)#58 | 6.2%(+2.59)#5,584 |
| 59. | 97864 | 8.8% | 5.6%(+3.13)#59 | 6.2%(+2.59)#5,589 |
| 60. | 97202 | 8.7% | 5.6%(+3.05)#60 | 6.2%(+2.50)#5,762 |
| 61. | 97867 | 8.7% | 5.6%(+3.04)#61 | 6.2%(+2.49)#5,775 |
| 62. | 97214 | 8.7% | 5.6%(+3.02)#62 | 6.2%(+2.48)#5,807 |
| 63. | 97321 | 8.6% | 5.6%(+3.01)#63 | 6.2%(+2.46)#5,831 |
| 64. | 97826 | 8.6% | 5.6%(+2.98)#64 | 6.2%(+2.44)#5,885 |
| 65. | 97215 | 8.6% | 5.6%(+2.98)#65 | 6.2%(+2.43)#5,895 |
| 66. | 97325 | 8.6% | 5.6%(+2.97)#66 | 6.2%(+2.43)#5,905 |
| 67. | 97431 | 8.6% | 5.6%(+2.97)#67 | 6.2%(+2.42)#5,914 |
| 68. | 97106 | 8.6% | 5.6%(+2.96)#68 | 6.2%(+2.41)#5,933 |
| 69. | 97101 | 8.6% | 5.6%(+2.92)#69 | 6.2%(+2.38)#5,993 |
| 70. | 97446 | 8.5% | 5.6%(+2.90)#70 | 6.2%(+2.36)#6,019 |
| 71. | 97053 | 8.5% | 5.6%(+2.82)#71 | 6.2%(+2.27)#6,169 |
| 72. | 97415 | 8.4% | 5.6%(+2.81)#72 | 6.2%(+2.26)#6,196 |
| 73. | 97371 | 8.4% | 5.6%(+2.80)#73 | 6.2%(+2.26)#6,205 |
| 74. | 97401 | 8.3% | 5.6%(+2.71)#74 | 6.2%(+2.16)#6,408 |
| 75. | 97365 | 8.3% | 5.6%(+2.69)#75 | 6.2%(+2.14)#6,474 |
| 76. | 97344 | 8.3% | 5.6%(+2.63)#76 | 6.2%(+2.09)#6,571 |
| 77. | 97884 | 8.0% | 5.6%(+2.36)#77 | 6.2%(+1.82)#7,159 |
| 78. | 97603 | 8.0% | 5.6%(+2.34)#78 | 6.2%(+1.79)#7,206 |
| 79. | 97844 | 7.9% | 5.6%(+2.27)#79 | 6.2%(+1.72)#7,369 |
| 80. | 97701 | 7.9% | 5.6%(+2.22)#80 | 6.2%(+1.68)#7,481 |
| 81. | 97741 | 7.8% | 5.6%(+2.12)#81 | 6.2%(+1.57)#7,741 |
| 82. | 97402 | 7.7% | 5.6%(+2.07)#82 | 6.2%(+1.52)#7,872 |
| 83. | 97219 | 7.7% | 5.6%(+2.07)#83 | 6.2%(+1.52)#7,881 |
| 84. | 97018 | 7.6% | 5.6%(+2.00)#84 | 6.2%(+1.45)#8,091 |
| 85. | 97459 | 7.6% | 5.6%(+1.97)#85 | 6.2%(+1.43)#8,152 |
| 86. | 97348 | 7.6% | 5.6%(+1.97)#86 | 6.2%(+1.42)#8,165 |
| 87. | 97116 | 7.5% | 5.6%(+1.88)#87 | 6.2%(+1.33)#8,394 |
| 88. | 97306 | 7.4% | 5.6%(+1.81)#88 | 6.2%(+1.26)#8,594 |
| 89. | 97017 | 7.4% | 5.6%(+1.77)#89 | 6.2%(+1.22)#8,685 |
| 90. | 97841 | 7.4% | 5.6%(+1.73)#90 | 6.2%(+1.18)#8,809 |
| 91. | 97404 | 7.4% | 5.6%(+1.71)#91 | 6.2%(+1.17)#8,844 |
| 92. | 97035 | 7.3% | 5.6%(+1.66)#92 | 6.2%(+1.12)#8,993 |
| 93. | 97862 | 7.3% | 5.6%(+1.64)#93 | 6.2%(+1.10)#9,054 |
| 94. | 97423 | 7.2% | 5.6%(+1.59)#94 | 6.2%(+1.05)#9,208 |
| 95. | 97870 | 7.2% | 5.6%(+1.57)#95 | 6.2%(+1.02)#9,281 |
| 96. | 97543 | 7.2% | 5.6%(+1.55)#96 | 6.2%(+0.999)#9,343 |
| 97. | 97002 | 7.2% | 5.6%(+1.52)#97 | 6.2%(+0.977)#9,395 |
| 98. | 97324 | 7.1% | 5.6%(+1.51)#98 | 6.2%(+0.959)#9,431 |
| 99. | 97102 | 7.1% | 5.6%(+1.51)#99 | 6.2%(+0.959)#9,441 |
| 100. | 97710 | 7.1% | 5.6%(+1.51)#100 | 6.2%(+0.959)#9,450 |
Common Questions
What are the Top 10 Zip Codes with the Highest Percentage of Population Employed in Education Instruction & Library in Oregon?
Top 10 Zip Codes with the Highest Percentage of Population Employed in Education Instruction & Library in Oregon are:
What zip code has the Highest Percentage of Population Employed in Education Instruction & Library in Oregon?
97538 has the Highest Percentage of Population Employed in Education Instruction & Library in Oregon with 38.1%.
What is the Percentage of Population Employed in Education Instruction & Library in the State of Oregon?
Percentage of Population Employed in Education Instruction & Library in Oregon is 5.6%.
What is the Percentage of Population Employed in Education Instruction & Library in the United States?
Percentage of Population Employed in Education Instruction & Library in the United States is 6.2%.