Foley, MO Map & Demographics
Foley Map
Foley Overview
$16,577
PER CAPITA INCOME
$35,750
AVG FAMILY INCOME
$51,250
AVG HOUSEHOLD INCOME
46.5%
WAGE / INCOME GAP [ % ]
53.5¢/ $1
WAGE / INCOME GAP [ $ ]
0.28
INEQUALITY / GINI INDEX
159
TOTAL POPULATION
80
MALE POPULATION
79
FEMALE POPULATION
101.27
MALES / 100 FEMALES
98.75
FEMALES / 100 MALES
35.3
MEDIAN AGE
3.7
AVG FAMILY SIZE
3.7
AVG HOUSEHOLD SIZE
67
LABOR FORCE [ PEOPLE ]
58.3%
PERCENT IN LABOR FORCE
3.0%
UNEMPLOYMENT RATE
Foley Zip Codes
Foley Area Codes
Income in Foley
Income Overview in Foley
Per Capita Income in Foley is $16,577, while median incomes of families and households are $35,750 and $51,250 respectively.
| Characteristic | Number | Measure |
| Per Capita Income | 159 | $16,577 |
| Median Family Income | 37 | $35,750 |
| Mean Family Income | 37 | $51,470 |
| Median Household Income | 43 | $51,250 |
| Mean Household Income | 43 | $60,260 |
| Income Deficit | 37 | $0 |
| Wage / Income Gap (%) | 159 | 46.53% |
| Wage / Income Gap ($) | 159 | 53.47¢ per $1 |
| Gini / Inequality Index | 159 | 0.28 |
Earnings by Sex in Foley
Average Earnings in Foley are $32,917, $40,208 for men and $21,500 for women, a difference of 46.5%.
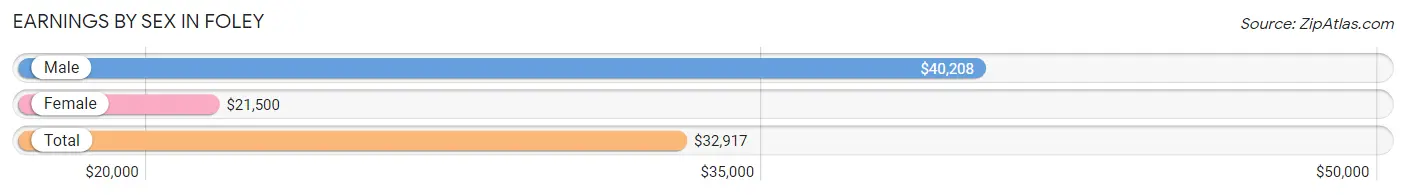
| Sex | Number | Average Earnings |
| Male | 43 (60.6%) | $40,208 |
| Female | 28 (39.4%) | $21,500 |
| Total | 71 (100.0%) | $32,917 |
Earnings by Sex by Income Bracket in Foley
The most common earnings brackets in Foley are $50,000 to $54,999 for men (12 | 27.9%) and $30,000 to $34,999 for women (8 | 28.6%).
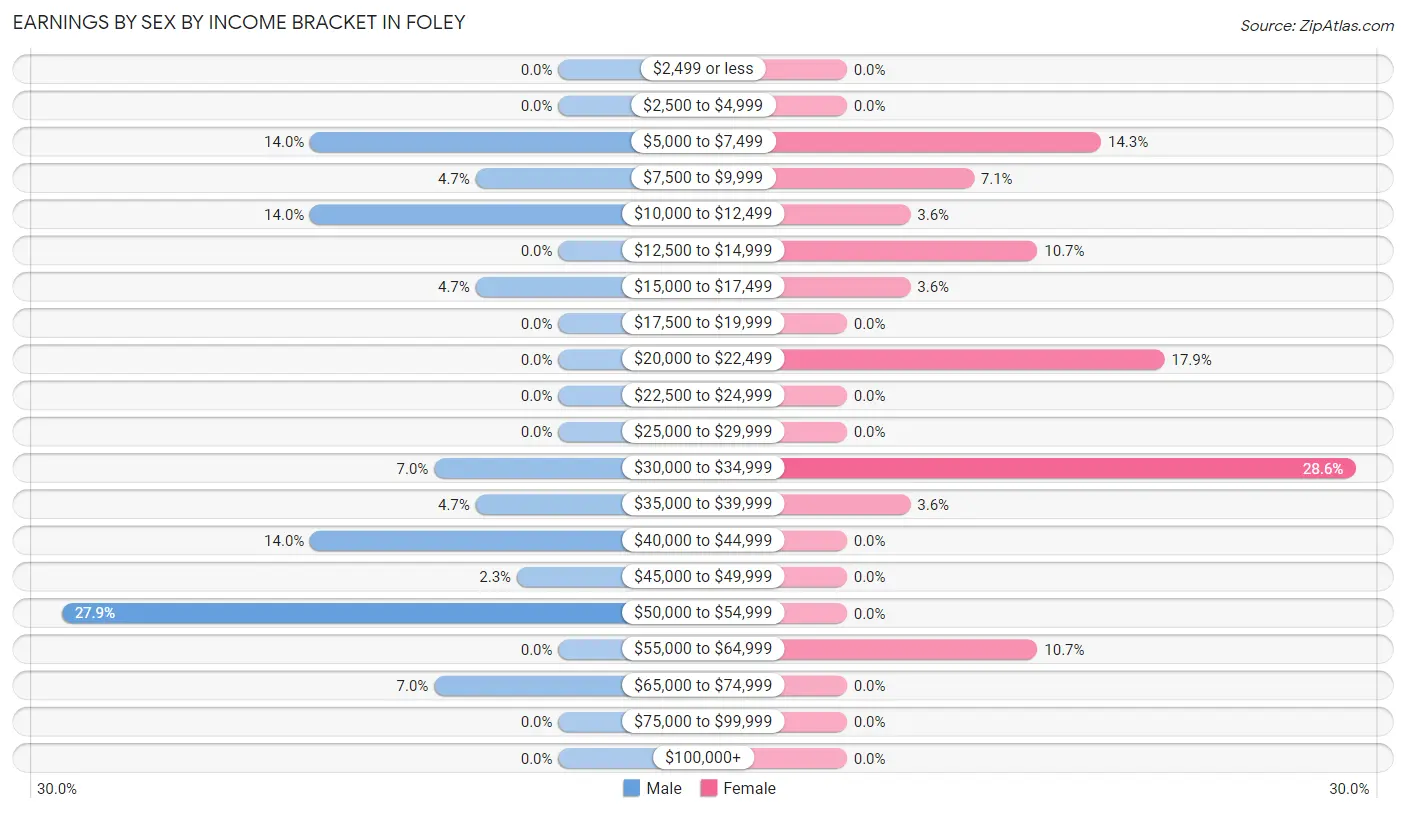
| Income | Male | Female |
| $2,499 or less | 0 (0.0%) | 0 (0.0%) |
| $2,500 to $4,999 | 0 (0.0%) | 0 (0.0%) |
| $5,000 to $7,499 | 6 (14.0%) | 4 (14.3%) |
| $7,500 to $9,999 | 2 (4.6%) | 2 (7.1%) |
| $10,000 to $12,499 | 6 (14.0%) | 1 (3.6%) |
| $12,500 to $14,999 | 0 (0.0%) | 3 (10.7%) |
| $15,000 to $17,499 | 2 (4.6%) | 1 (3.6%) |
| $17,500 to $19,999 | 0 (0.0%) | 0 (0.0%) |
| $20,000 to $22,499 | 0 (0.0%) | 5 (17.9%) |
| $22,500 to $24,999 | 0 (0.0%) | 0 (0.0%) |
| $25,000 to $29,999 | 0 (0.0%) | 0 (0.0%) |
| $30,000 to $34,999 | 3 (7.0%) | 8 (28.6%) |
| $35,000 to $39,999 | 2 (4.6%) | 1 (3.6%) |
| $40,000 to $44,999 | 6 (14.0%) | 0 (0.0%) |
| $45,000 to $49,999 | 1 (2.3%) | 0 (0.0%) |
| $50,000 to $54,999 | 12 (27.9%) | 0 (0.0%) |
| $55,000 to $64,999 | 0 (0.0%) | 3 (10.7%) |
| $65,000 to $74,999 | 3 (7.0%) | 0 (0.0%) |
| $75,000 to $99,999 | 0 (0.0%) | 0 (0.0%) |
| $100,000+ | 0 (0.0%) | 0 (0.0%) |
| Total | 43 (100.0%) | 28 (100.0%) |
Earnings by Sex by Educational Attainment in Foley
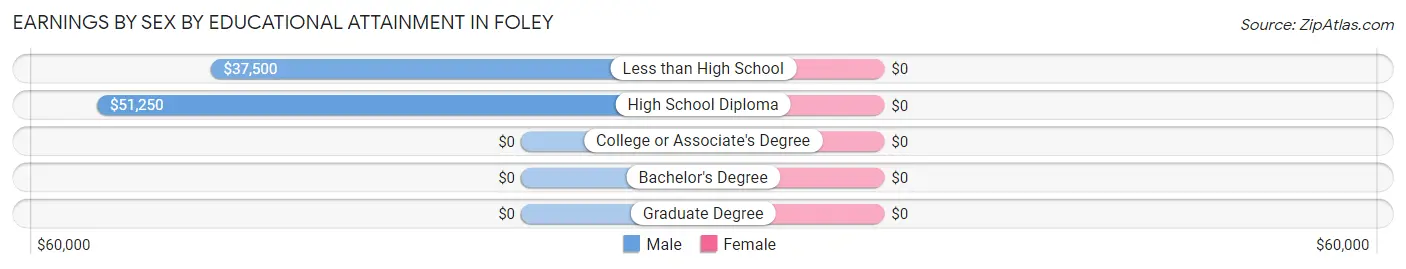
| Educational Attainment | Male Income | Female Income |
| Less than High School | $37,500 | $0 |
| High School Diploma | $51,250 | $0 |
| College or Associate's Degree | - | - |
| Bachelor's Degree | - | - |
| Graduate Degree | - | - |
| Total | $41,563 | $21,000 |
Family Income in Foley
Family Income Brackets in Foley
According to the Foley family income data, there are 7 families falling into the $25,000 to $34,999 income range, which is the most common income bracket and makes up 18.9% of all families.

| Income Bracket | # Families | % Families |
| Less than $10,000 | 4 | 10.8% |
| $10,000 to $14,999 | 0 | 0.0% |
| $15,000 to $24,999 | 6 | 16.2% |
| $25,000 to $34,999 | 7 | 18.9% |
| $35,000 to $49,999 | 5 | 13.5% |
| $50,000 to $74,999 | 5 | 13.5% |
| $75,000 to $99,999 | 3 | 8.1% |
| $100,000 to $149,999 | 7 | 18.9% |
| $150,000 to $199,999 | 0 | 0.0% |
| $200,000+ | 0 | 0.0% |
Family Income by Famaliy Size in Foley
2-person families (8 | 21.6%) account for the highest median family income in Foley with $32,000 per family, while 2-person families (8 | 21.6%) have the highest median income of $16,000 per family member.
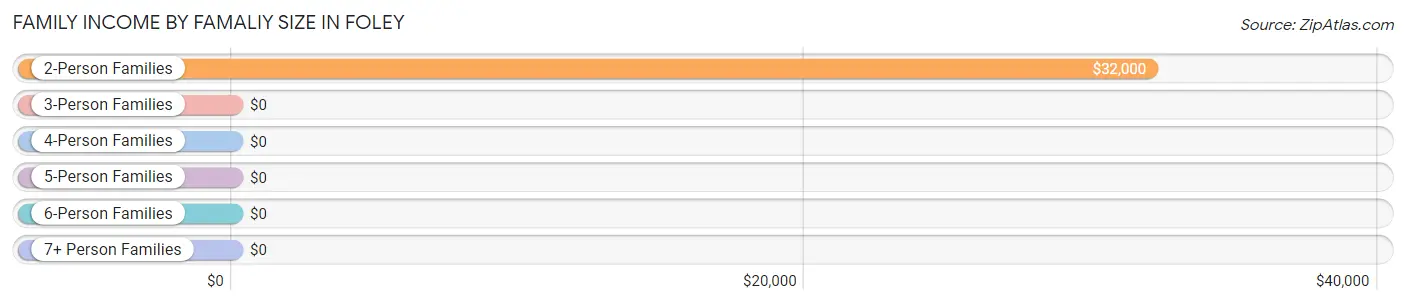
| Income Bracket | # Families | Median Income |
| 2-Person Families | 8 (21.6%) | $32,000 |
| 3-Person Families | 16 (43.2%) | $0 |
| 4-Person Families | 5 (13.5%) | $0 |
| 5-Person Families | 3 (8.1%) | $0 |
| 6-Person Families | 0 (0.0%) | $0 |
| 7+ Person Families | 5 (13.5%) | $0 |
| Total | 37 (100.0%) | $35,750 |
Family Income by Number of Earners in Foley
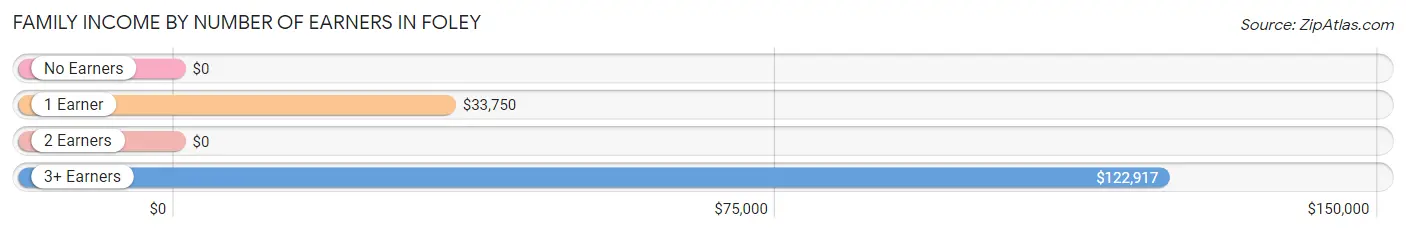
| Number of Earners | # Families | Median Income |
| No Earners | 10 (27.0%) | $0 |
| 1 Earner | 14 (37.8%) | $33,750 |
| 2 Earners | 3 (8.1%) | $0 |
| 3+ Earners | 10 (27.0%) | $122,917 |
| Total | 37 (100.0%) | $35,750 |
Household Income in Foley
Household Income Brackets in Foley
With 15 households falling in the category, the $35,000 to $49,999 income range is the most frequent in Foley, accounting for 34.9% of all households.
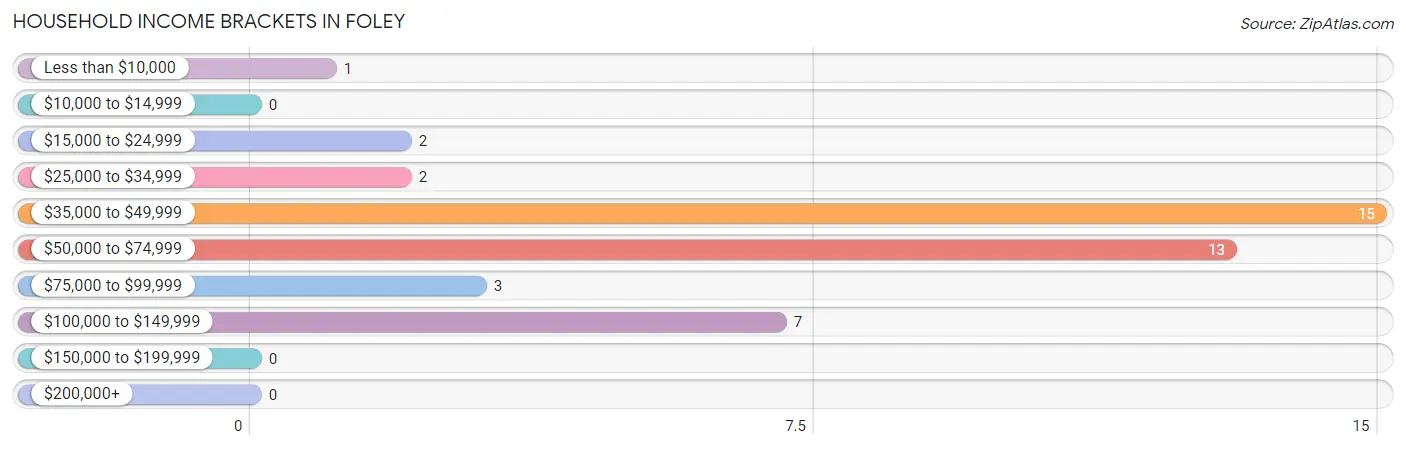
| Income Bracket | # Households | % Households |
| Less than $10,000 | 1 | 2.3% |
| $10,000 to $14,999 | 0 | 0.0% |
| $15,000 to $24,999 | 2 | 4.7% |
| $25,000 to $34,999 | 2 | 4.7% |
| $35,000 to $49,999 | 15 | 34.9% |
| $50,000 to $74,999 | 13 | 30.2% |
| $75,000 to $99,999 | 3 | 7.0% |
| $100,000 to $149,999 | 7 | 16.3% |
| $150,000 to $199,999 | 0 | 0.0% |
| $200,000+ | 0 | 0.0% |
Household Income by Householder Age in Foley
The median household income in Foley is $51,250, with the highest median household income of $101,250 found in the 25 to 44 years age bracket for the primary householder. A total of 13 households (30.2%) fall into this category.
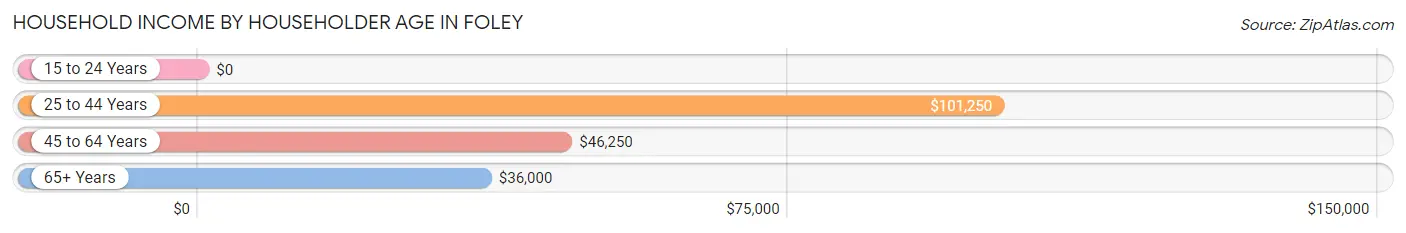
| Income Bracket | # Households | Median Income |
| 15 to 24 Years | 0 (0.0%) | $0 |
| 25 to 44 Years | 13 (30.2%) | $101,250 |
| 45 to 64 Years | 24 (55.8%) | $46,250 |
| 65+ Years | 6 (14.0%) | $36,000 |
| Total | 43 (100.0%) | $51,250 |
Poverty in Foley
Income Below Poverty by Sex and Age in Foley
With 38.8% poverty level for males and 35.4% for females among the residents of Foley, under 5 year old males and 5 year old females are the most vulnerable to poverty, with 5 males (100.0%) and 5 females (100.0%) in their respective age groups living below the poverty level.
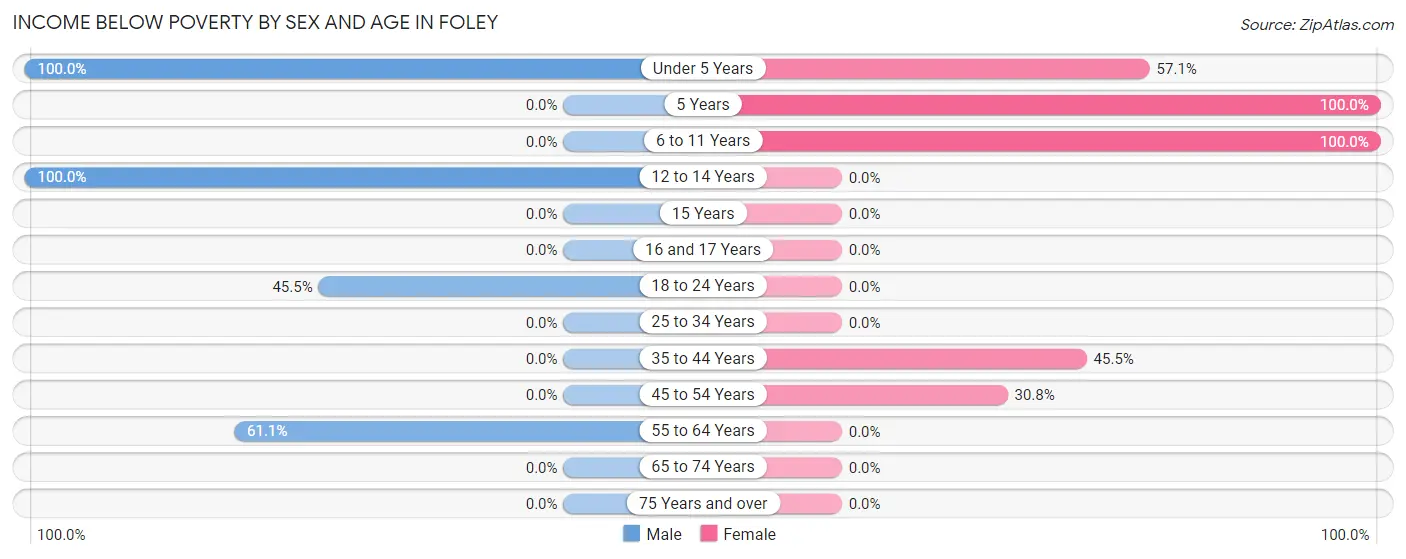
| Age Bracket | Male | Female |
| Under 5 Years | 5 (100.0%) | 4 (57.1%) |
| 5 Years | 0 (0.0%) | 5 (100.0%) |
| 6 to 11 Years | 0 (0.0%) | 10 (100.0%) |
| 12 to 14 Years | 10 (100.0%) | 0 (0.0%) |
| 15 Years | 0 (0.0%) | 0 (0.0%) |
| 16 and 17 Years | 0 (0.0%) | 0 (0.0%) |
| 18 to 24 Years | 5 (45.5%) | 0 (0.0%) |
| 25 to 34 Years | 0 (0.0%) | 0 (0.0%) |
| 35 to 44 Years | 0 (0.0%) | 5 (45.5%) |
| 45 to 54 Years | 0 (0.0%) | 4 (30.8%) |
| 55 to 64 Years | 11 (61.1%) | 0 (0.0%) |
| 65 to 74 Years | 0 (0.0%) | 0 (0.0%) |
| 75 Years and over | 0 (0.0%) | 0 (0.0%) |
| Total | 31 (38.8%) | 28 (35.4%) |
Income Above Poverty by Sex and Age in Foley
According to the poverty statistics in Foley, males aged 6 to 11 years and females aged 12 to 14 years are the age groups that are most secure financially, with 100.0% of males and 100.0% of females in these age groups living above the poverty line.
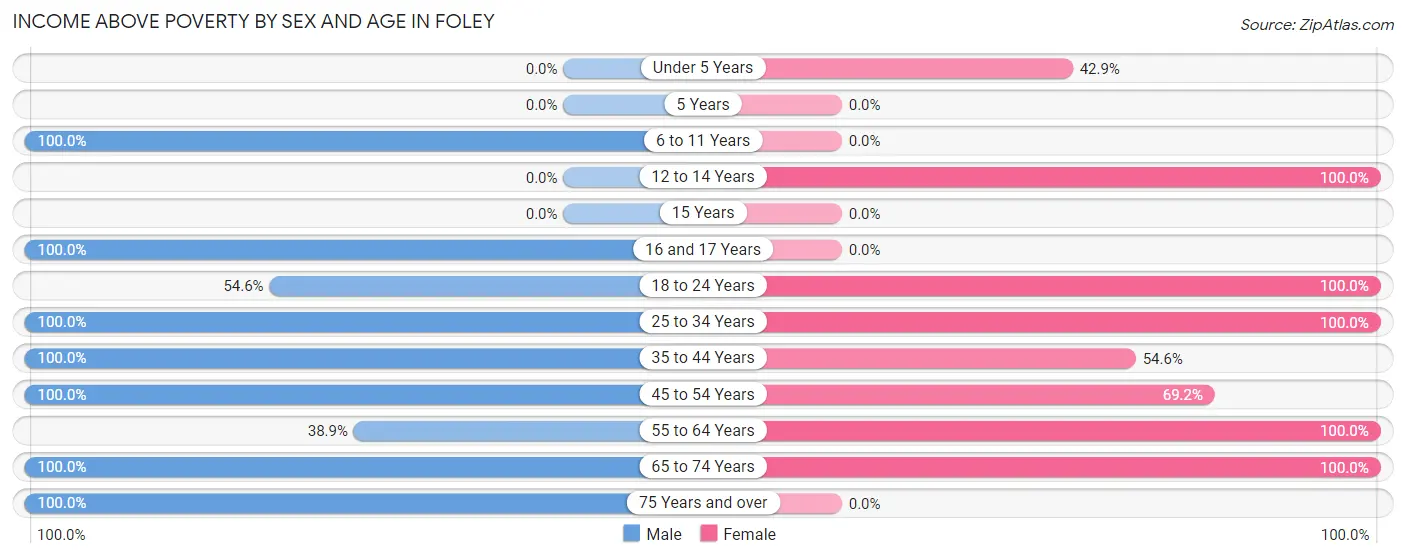
| Age Bracket | Male | Female |
| Under 5 Years | 0 (0.0%) | 3 (42.9%) |
| 5 Years | 0 (0.0%) | 0 (0.0%) |
| 6 to 11 Years | 4 (100.0%) | 0 (0.0%) |
| 12 to 14 Years | 0 (0.0%) | 3 (100.0%) |
| 15 Years | 0 (0.0%) | 0 (0.0%) |
| 16 and 17 Years | 2 (100.0%) | 0 (0.0%) |
| 18 to 24 Years | 6 (54.5%) | 10 (100.0%) |
| 25 to 34 Years | 10 (100.0%) | 1 (100.0%) |
| 35 to 44 Years | 9 (100.0%) | 6 (54.5%) |
| 45 to 54 Years | 7 (100.0%) | 9 (69.2%) |
| 55 to 64 Years | 7 (38.9%) | 10 (100.0%) |
| 65 to 74 Years | 3 (100.0%) | 9 (100.0%) |
| 75 Years and over | 1 (100.0%) | 0 (0.0%) |
| Total | 49 (61.3%) | 51 (64.6%) |
Income Below Poverty Among Married-Couple Families in Foley
The poverty statistics for married-couple families in Foley show that 16.0% or 4 of the total 25 families live below the poverty line. Families with no children have the highest poverty rate of 23.5%, comprising of 4 families. On the other hand, families with 1 or 2 children have the lowest poverty rate of 0.0%, which includes 0 families.
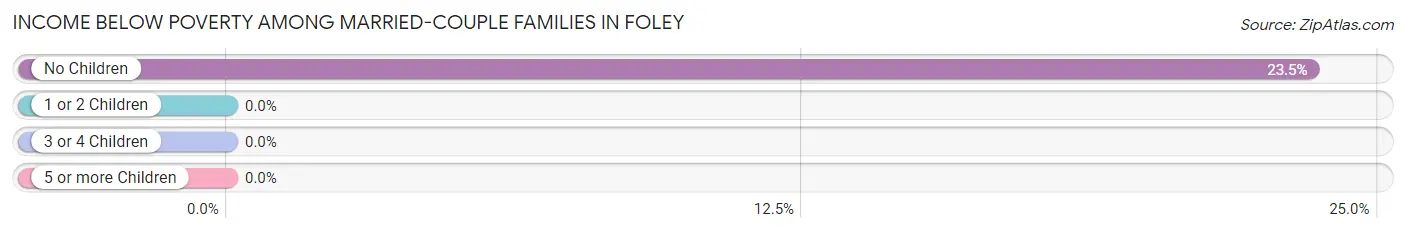
| Children | Above Poverty | Below Poverty |
| No Children | 13 (76.5%) | 4 (23.5%) |
| 1 or 2 Children | 8 (100.0%) | 0 (0.0%) |
| 3 or 4 Children | 0 (0.0%) | 0 (0.0%) |
| 5 or more Children | 0 (0.0%) | 0 (0.0%) |
| Total | 21 (84.0%) | 4 (16.0%) |
Income Below Poverty Among Single-Parent Households in Foley
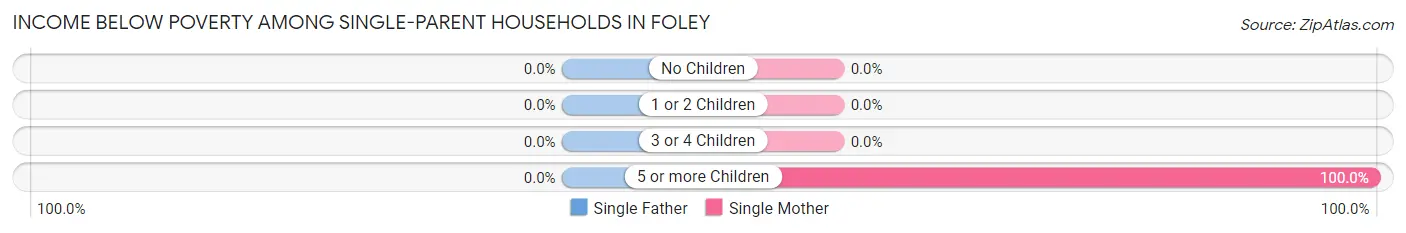
| Children | Single Father | Single Mother |
| No Children | 0 (0.0%) | 0 (0.0%) |
| 1 or 2 Children | 0 (0.0%) | 0 (0.0%) |
| 3 or 4 Children | 0 (0.0%) | 0 (0.0%) |
| 5 or more Children | 0 (0.0%) | 5 (100.0%) |
| Total | 0 (0.0%) | 5 (41.7%) |
Income Below Poverty Among Married-Couple vs Single-Parent Households in Foley
The poverty data for Foley shows that 4 of the married-couple family households (16.0%) and 5 of the single-parent households (41.7%) are living below the poverty level. Within the married-couple family households, those with no children have the highest poverty rate, with 4 households (23.5%) falling below the poverty line. Among the single-parent households, those with 5 or more children have the highest poverty rate, with 5 household (100.0%) living below poverty.
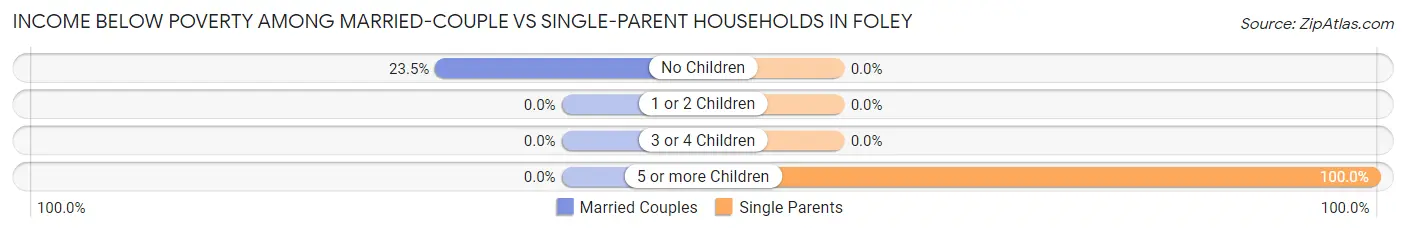
| Children | Married-Couple Families | Single-Parent Households |
| No Children | 4 (23.5%) | 0 (0.0%) |
| 1 or 2 Children | 0 (0.0%) | 0 (0.0%) |
| 3 or 4 Children | 0 (0.0%) | 0 (0.0%) |
| 5 or more Children | 0 (0.0%) | 5 (100.0%) |
| Total | 4 (16.0%) | 5 (41.7%) |
Race in Foley
The most populous races in Foley are White / Caucasian (147 | 92.4%), and Two or more Races (12 | 7.5%).
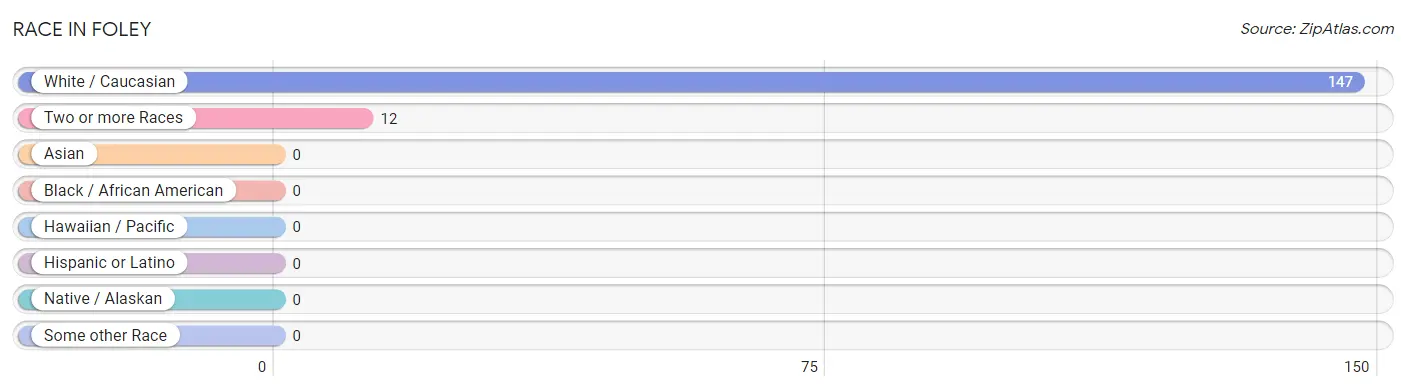
| Race | # Population | % Population |
| Asian | 0 | 0.0% |
| Black / African American | 0 | 0.0% |
| Hawaiian / Pacific | 0 | 0.0% |
| Hispanic or Latino | 0 | 0.0% |
| Native / Alaskan | 0 | 0.0% |
| White / Caucasian | 147 | 92.4% |
| Two or more Races | 12 | 7.5% |
| Some other Race | 0 | 0.0% |
| Total | 159 | 100.0% |
Ancestry in Foley
The most populous ancestries reported in Foley are German (43 | 27.0%), Irish (30 | 18.9%), Cherokee (10 | 6.3%), English (7 | 4.4%), and French (4 | 2.5%), together accounting for 59.1% of all Foley residents.
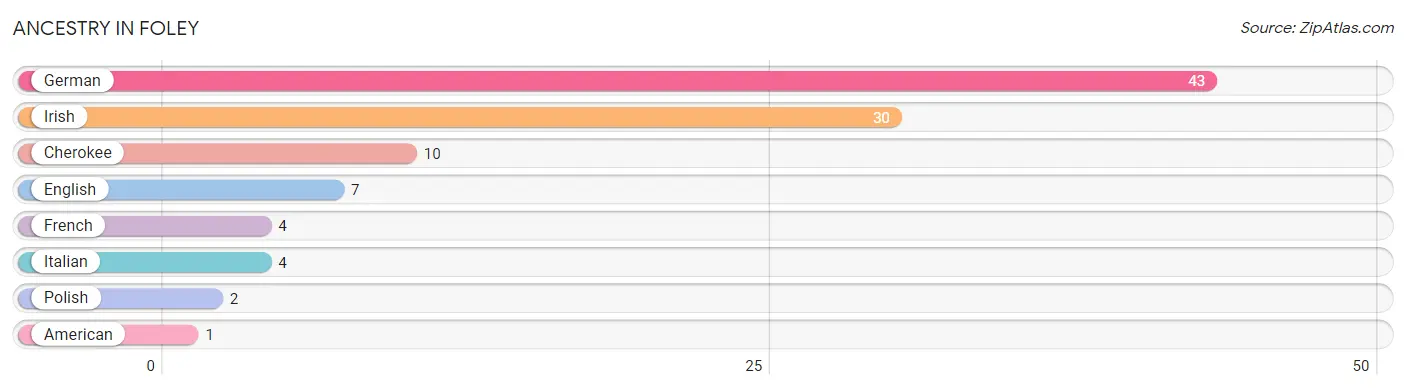
| Ancestry | # Population | % Population |
| American | 1 | 0.6% |
| Cherokee | 10 | 6.3% |
| English | 7 | 4.4% |
| French | 4 | 2.5% |
| German | 43 | 27.0% |
| Irish | 30 | 18.9% |
| Italian | 4 | 2.5% |
| Polish | 2 | 1.3% | View All 8 Rows |
Immigrants in Foley

| Immigration Origin | # Population | % Population | View All 0 Rows |
Sex and Age in Foley
Sex and Age in Foley
The most populous age groups in Foley are 20 to 24 Years (11 | 13.8%) for men and 5 to 9 Years (15 | 19.0%) for women.
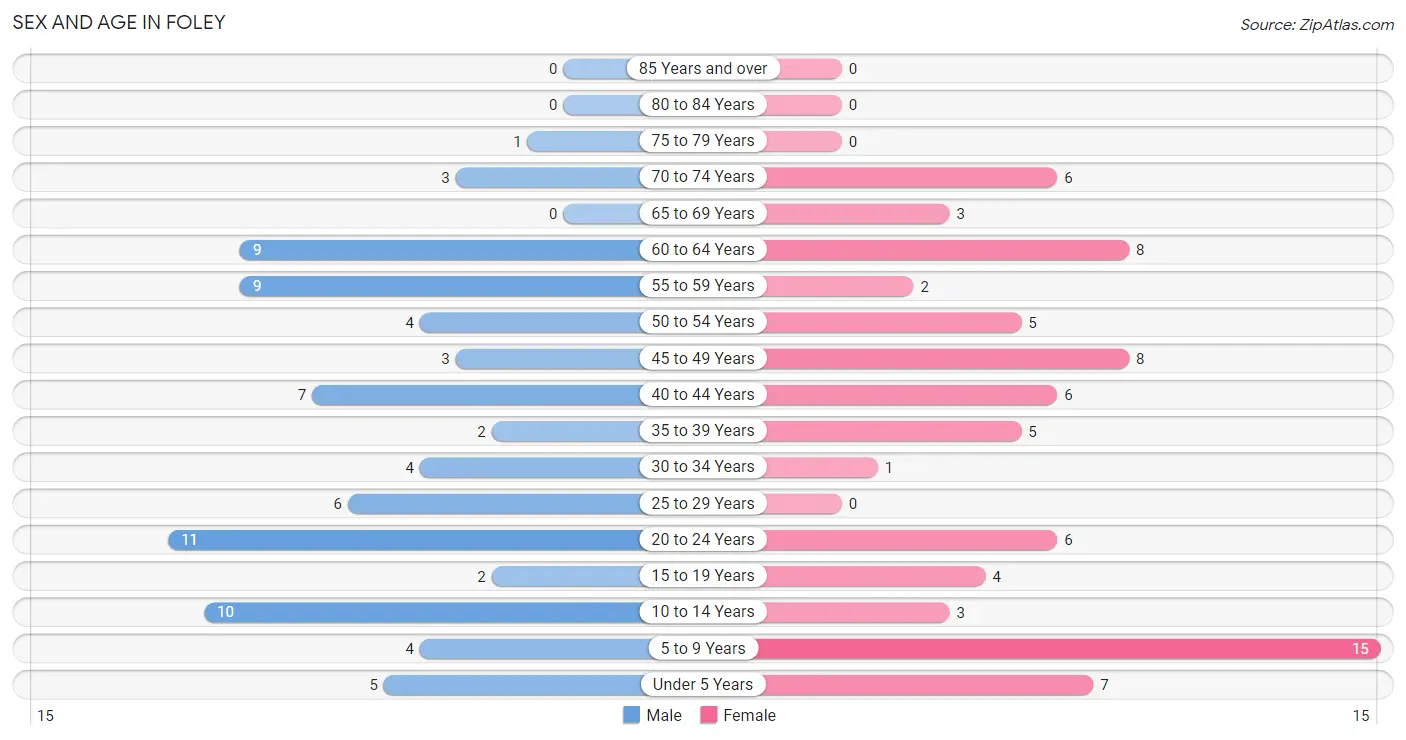
| Age Bracket | Male | Female |
| Under 5 Years | 5 (6.2%) | 7 (8.9%) |
| 5 to 9 Years | 4 (5.0%) | 15 (19.0%) |
| 10 to 14 Years | 10 (12.5%) | 3 (3.8%) |
| 15 to 19 Years | 2 (2.5%) | 4 (5.1%) |
| 20 to 24 Years | 11 (13.8%) | 6 (7.6%) |
| 25 to 29 Years | 6 (7.5%) | 0 (0.0%) |
| 30 to 34 Years | 4 (5.0%) | 1 (1.3%) |
| 35 to 39 Years | 2 (2.5%) | 5 (6.3%) |
| 40 to 44 Years | 7 (8.7%) | 6 (7.6%) |
| 45 to 49 Years | 3 (3.7%) | 8 (10.1%) |
| 50 to 54 Years | 4 (5.0%) | 5 (6.3%) |
| 55 to 59 Years | 9 (11.3%) | 2 (2.5%) |
| 60 to 64 Years | 9 (11.3%) | 8 (10.1%) |
| 65 to 69 Years | 0 (0.0%) | 3 (3.8%) |
| 70 to 74 Years | 3 (3.7%) | 6 (7.6%) |
| 75 to 79 Years | 1 (1.3%) | 0 (0.0%) |
| 80 to 84 Years | 0 (0.0%) | 0 (0.0%) |
| 85 Years and over | 0 (0.0%) | 0 (0.0%) |
| Total | 80 (100.0%) | 79 (100.0%) |
Families and Households in Foley
Median Family Size in Foley
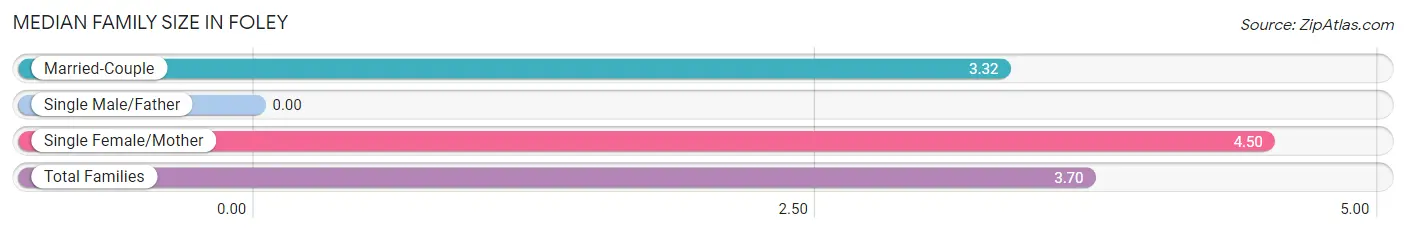
| Family Type | # Families | Family Size |
| Married-Couple | 25 (67.6%) | 3.32 |
| Single Male/Father | 0 (0.0%) | - |
| Single Female/Mother | 12 (32.4%) | 4.50 |
| Total Families | 37 (100.0%) | 3.70 |
Median Household Size in Foley
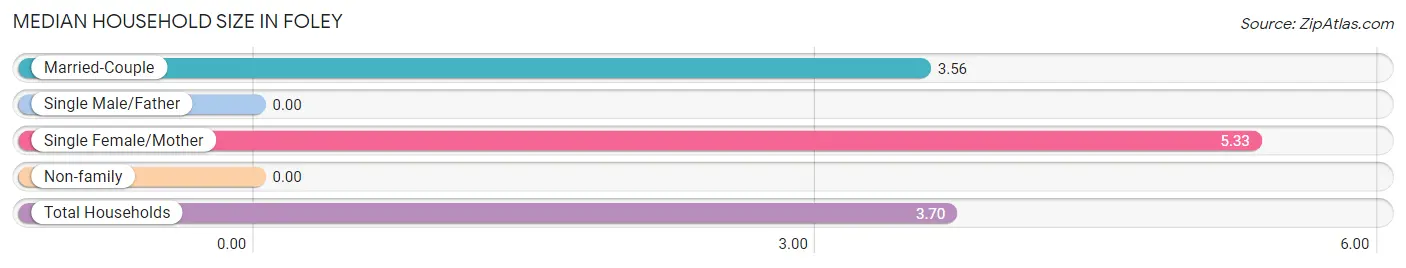
| Household Type | # Households | Household Size |
| Married-Couple | 25 (58.1%) | 3.56 |
| Single Male/Father | 0 (0.0%) | - |
| Single Female/Mother | 12 (27.9%) | 5.33 |
| Non-family | 6 (14.0%) | - |
| Total Households | 43 (100.0%) | 3.70 |
Household Size by Marriage Status in Foley
Out of a total of 43 households in Foley, 37 (86.1%) are family households, while 6 (14.0%) are nonfamily households. The most numerous type of family households are 3-person households, comprising 17, and the most common type of nonfamily households are 1-person households, comprising 6.
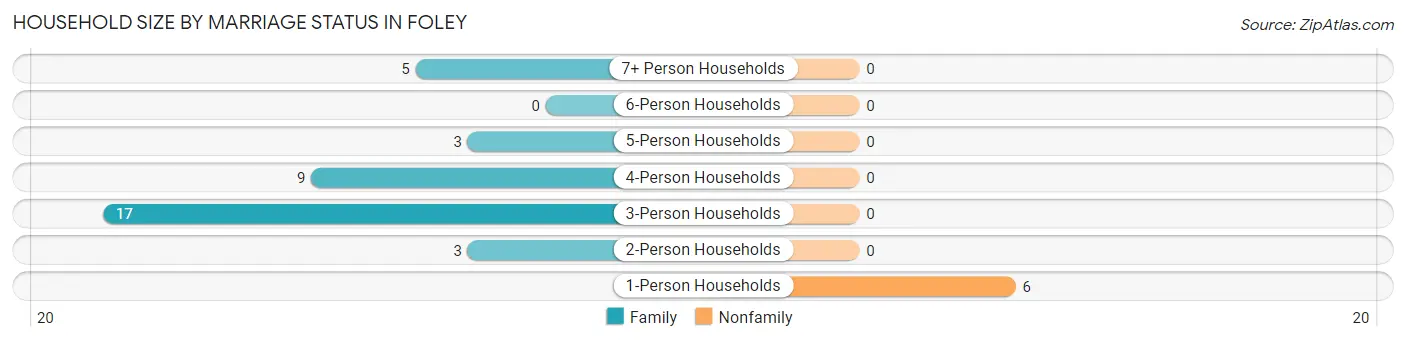
| Household Size | Family Households | Nonfamily Households |
| 1-Person Households | - | 6 (14.0%) |
| 2-Person Households | 3 (7.0%) | 0 (0.0%) |
| 3-Person Households | 17 (39.5%) | 0 (0.0%) |
| 4-Person Households | 9 (20.9%) | 0 (0.0%) |
| 5-Person Households | 3 (7.0%) | 0 (0.0%) |
| 6-Person Households | 0 (0.0%) | 0 (0.0%) |
| 7+ Person Households | 5 (11.6%) | 0 (0.0%) |
| Total | 37 (86.1%) | 6 (14.0%) |
Female Fertility in Foley
Fertility by Age in Foley
| Age Bracket | Women with Births | Births / 1,000 Women |
| 15 to 19 years | 0 (0.0%) | 0.0 |
| 20 to 34 years | 0 (0.0%) | 0.0 |
| 35 to 50 years | 0 (0.0%) | 0.0 |
| Total | 0 (0.0%) | 0.0 |
Fertility by Age by Marriage Status in Foley
| Age Bracket | Married | Unmarried |
| 15 to 19 years | 0 (0.0%) | 0 (0.0%) |
| 20 to 34 years | 0 (0.0%) | 0 (0.0%) |
| 35 to 50 years | 0 (0.0%) | 0 (0.0%) |
| Total | 0 (0.0%) | 0 (0.0%) |
Fertility by Education in Foley
| Educational Attainment | Women with Births | Births / 1,000 Women |
| Less than High School | 0 (0.0%) | 0.0 |
| High School Diploma | 0 (0.0%) | 0.0 |
| College or Associate's Degree | 0 (0.0%) | 0.0 |
| Bachelor's Degree | 0 (0.0%) | 0.0 |
| Graduate Degree | 0 (0.0%) | 0.0 |
| Total | 0 (0.0%) | 0.0 |
Fertility by Education by Marriage Status in Foley
| Educational Attainment | Married | Unmarried |
| Less than High School | 0 (0.0%) | 0 (0.0%) |
| High School Diploma | 0 (0.0%) | 0 (0.0%) |
| College or Associate's Degree | 0 (0.0%) | 0 (0.0%) |
| Bachelor's Degree | 0 (0.0%) | 0 (0.0%) |
| Graduate Degree | 0 (0.0%) | 0 (0.0%) |
| Total | 0 (0.0%) | 0 (0.0%) |
Employment Characteristics in Foley
Employment by Class of Employer in Foley
Among the 65 employed individuals in Foley, private company employees (52 | 80.0%), not-for-profit organizations (10 | 15.4%), and self-employed (incorporated) (1 | 1.5%) make up the most common classes of employment.
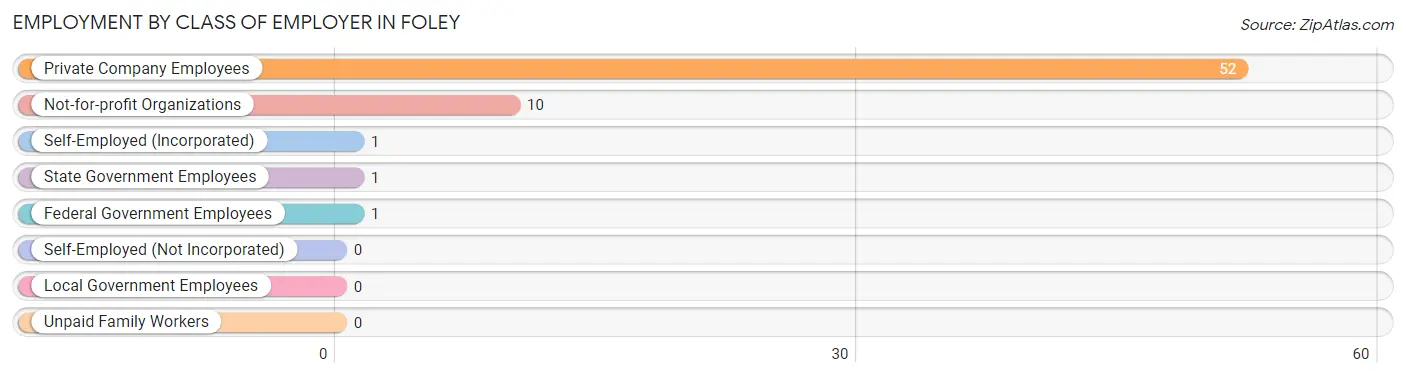
| Employer Class | # Employees | % Employees |
| Private Company Employees | 52 | 80.0% |
| Self-Employed (Incorporated) | 1 | 1.5% |
| Self-Employed (Not Incorporated) | 0 | 0.0% |
| Not-for-profit Organizations | 10 | 15.4% |
| Local Government Employees | 0 | 0.0% |
| State Government Employees | 1 | 1.5% |
| Federal Government Employees | 1 | 1.5% |
| Unpaid Family Workers | 0 | 0.0% |
| Total | 65 | 100.0% |
Employment Status by Age in Foley
According to the labor force statistics for Foley, out of the total population over 16 years of age (115), 58.3% or 67 individuals are in the labor force, with 3.0% or 2 of them unemployed. The age group with the highest labor force participation rate is 16 to 19 years, with 100.0% or 6 individuals in the labor force. Within the labor force, the 35 to 44 years age range has the highest percentage of unemployed individuals, with 16.7% or 2 of them being unemployed.
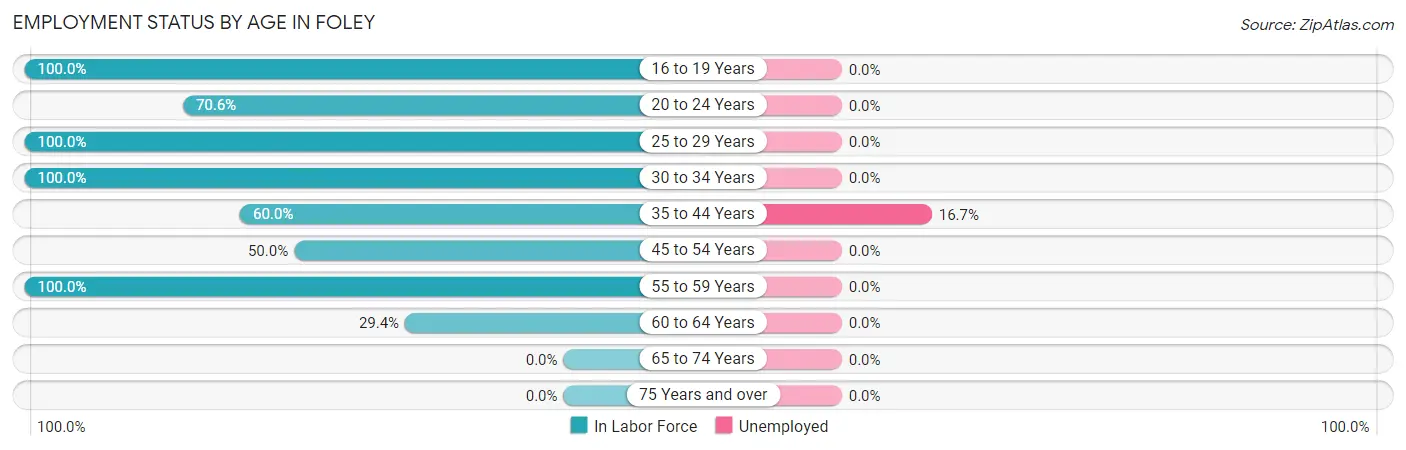
| Age Bracket | In Labor Force | Unemployed |
| 16 to 19 Years | 6 (100.0%) | 0 (0.0%) |
| 20 to 24 Years | 12 (70.6%) | 0 (0.0%) |
| 25 to 29 Years | 6 (100.0%) | 0 (0.0%) |
| 30 to 34 Years | 5 (100.0%) | 0 (0.0%) |
| 35 to 44 Years | 12 (60.0%) | 2 (16.7%) |
| 45 to 54 Years | 10 (50.0%) | 0 (0.0%) |
| 55 to 59 Years | 11 (100.0%) | 0 (0.0%) |
| 60 to 64 Years | 5 (29.4%) | 0 (0.0%) |
| 65 to 74 Years | 0 (0.0%) | 0 (0.0%) |
| 75 Years and over | 0 (0.0%) | 0 (0.0%) |
| Total | 67 (58.3%) | 2 (3.0%) |
Employment Status by Educational Attainment in Foley
According to labor force statistics for Foley, 62.0% of individuals (49) out of the total population between 25 and 64 years of age (79) are in the labor force, with 4.1% or 2 of them being unemployed. The group with the highest labor force participation rate are those with the educational attainment of less than high school, with 88.9% or 24 individuals in the labor force. Within the labor force, individuals with less than high school education have the highest percentage of unemployment, with 8.3% or 2 of them being unemployed.
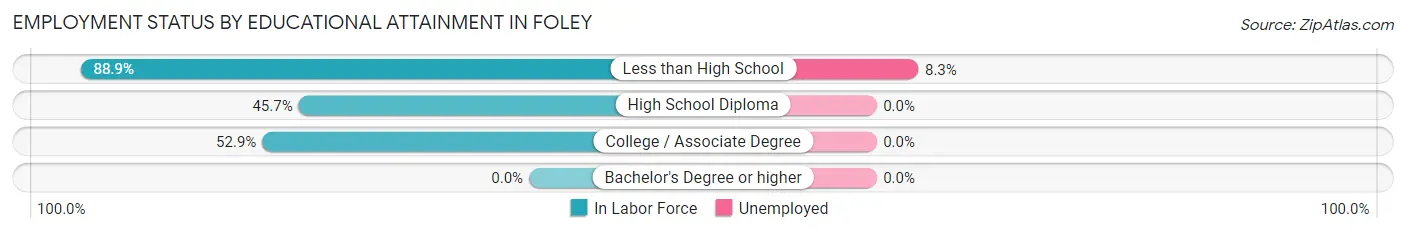
| Educational Attainment | In Labor Force | Unemployed |
| Less than High School | 24 (88.9%) | 2 (8.3%) |
| High School Diploma | 16 (45.7%) | 0 (0.0%) |
| College / Associate Degree | 9 (52.9%) | 0 (0.0%) |
| Bachelor's Degree or higher | 0 (0.0%) | 0 (0.0%) |
| Total | 49 (62.0%) | 3 (4.1%) |
Employment Occupations by Sex in Foley
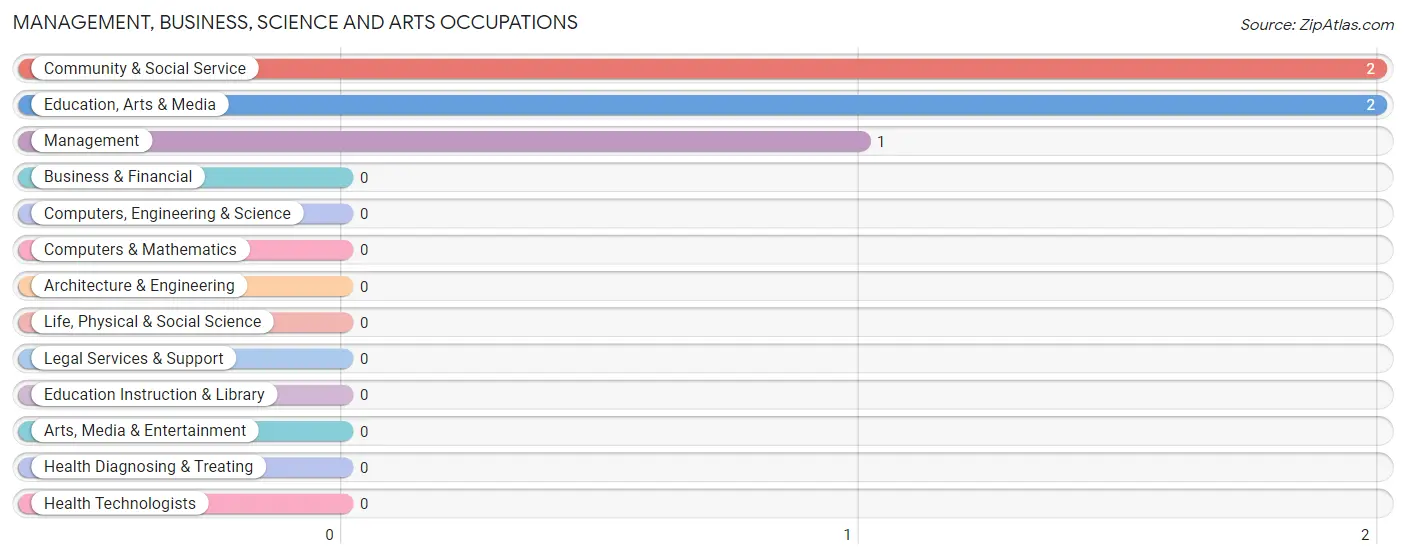
Management, Business, Science and Arts Occupations
The most common Management, Business, Science and Arts occupations in Foley are Community & Social Service (2 | 3.1%), Education, Arts & Media (2 | 3.1%), and Management (1 | 1.5%).
Management, Business, Science and Arts Occupations by Sex
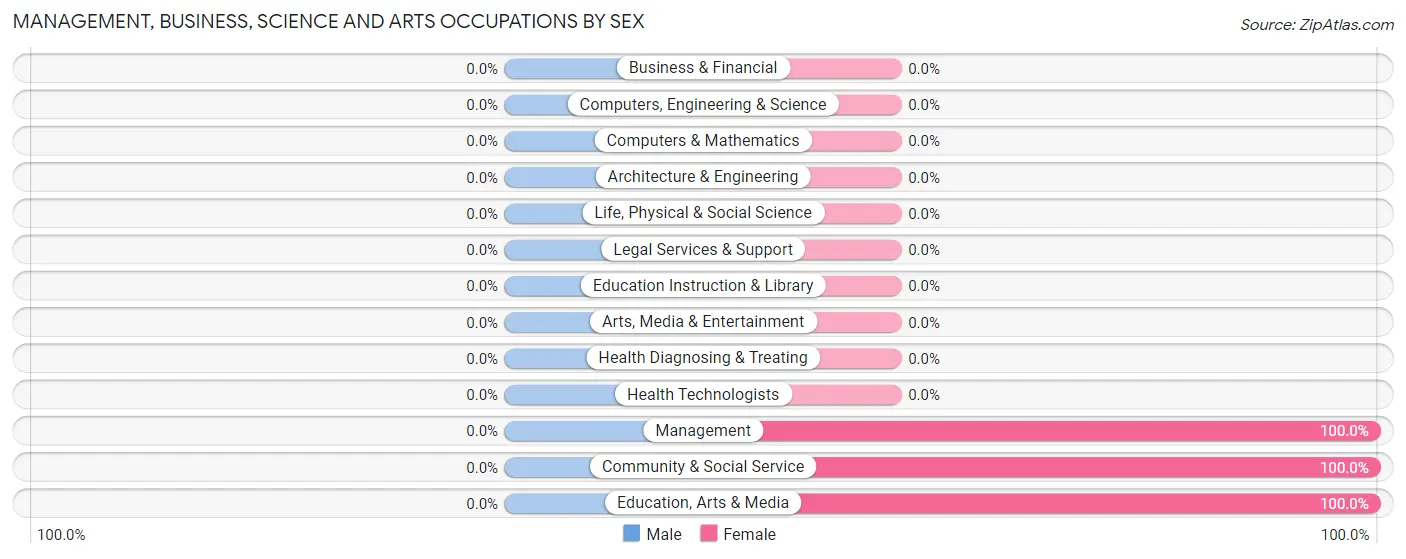
| Occupation | Male | Female |
| Management | 0 (0.0%) | 1 (100.0%) |
| Business & Financial | 0 (0.0%) | 0 (0.0%) |
| Computers, Engineering & Science | 0 (0.0%) | 0 (0.0%) |
| Computers & Mathematics | 0 (0.0%) | 0 (0.0%) |
| Architecture & Engineering | 0 (0.0%) | 0 (0.0%) |
| Life, Physical & Social Science | 0 (0.0%) | 0 (0.0%) |
| Community & Social Service | 0 (0.0%) | 2 (100.0%) |
| Education, Arts & Media | 0 (0.0%) | 2 (100.0%) |
| Legal Services & Support | 0 (0.0%) | 0 (0.0%) |
| Education Instruction & Library | 0 (0.0%) | 0 (0.0%) |
| Arts, Media & Entertainment | 0 (0.0%) | 0 (0.0%) |
| Health Diagnosing & Treating | 0 (0.0%) | 0 (0.0%) |
| Health Technologists | 0 (0.0%) | 0 (0.0%) |
| Total (Category) | 0 (0.0%) | 3 (100.0%) |
| Total (Overall) | 40 (61.5%) | 25 (38.5%) |
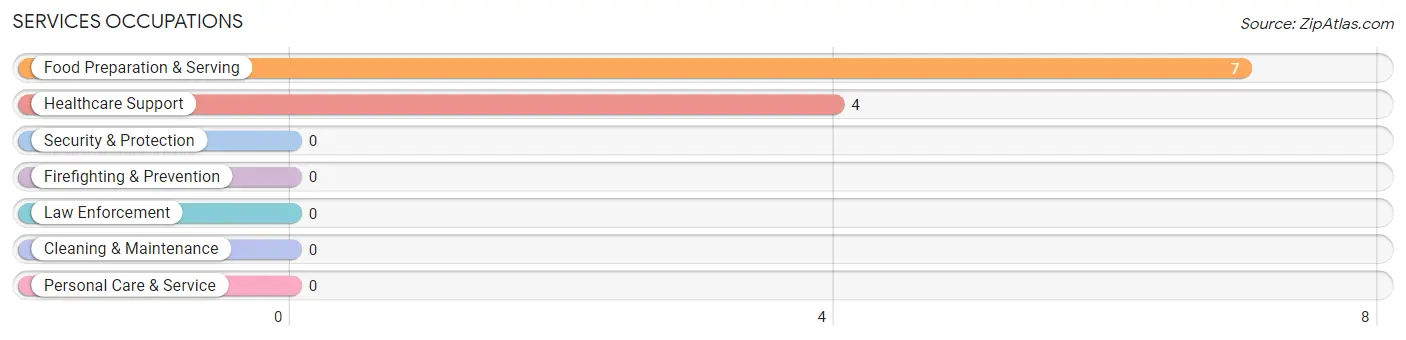
Services Occupations
The most common Services occupations in Foley are Food Preparation & Serving (7 | 10.8%), and Healthcare Support (4 | 6.1%).
Services Occupations by Sex
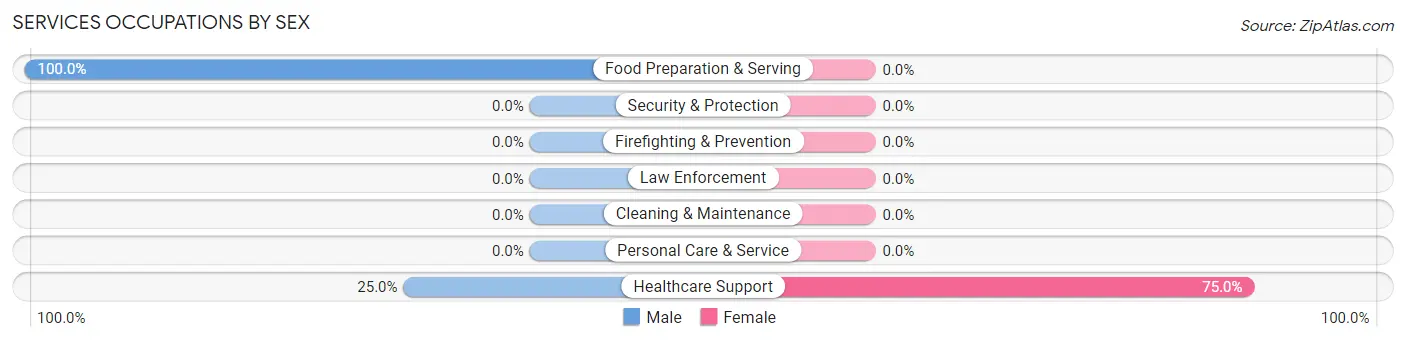
| Occupation | Male | Female |
| Healthcare Support | 1 (25.0%) | 3 (75.0%) |
| Security & Protection | 0 (0.0%) | 0 (0.0%) |
| Firefighting & Prevention | 0 (0.0%) | 0 (0.0%) |
| Law Enforcement | 0 (0.0%) | 0 (0.0%) |
| Food Preparation & Serving | 7 (100.0%) | 0 (0.0%) |
| Cleaning & Maintenance | 0 (0.0%) | 0 (0.0%) |
| Personal Care & Service | 0 (0.0%) | 0 (0.0%) |
| Total (Category) | 8 (72.7%) | 3 (27.3%) |
| Total (Overall) | 40 (61.5%) | 25 (38.5%) |
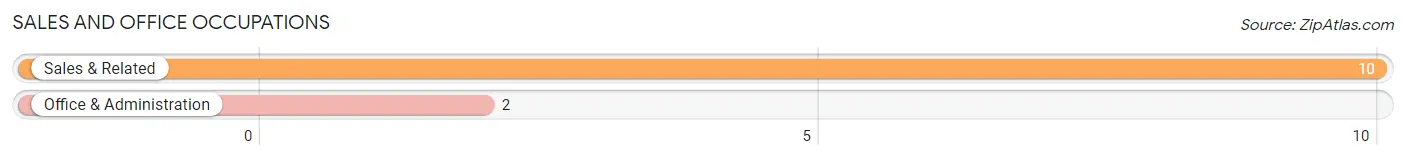
Sales and Office Occupations
The most common Sales and Office occupations in Foley are Sales & Related (10 | 15.4%), and Office & Administration (2 | 3.1%).
Sales and Office Occupations by Sex
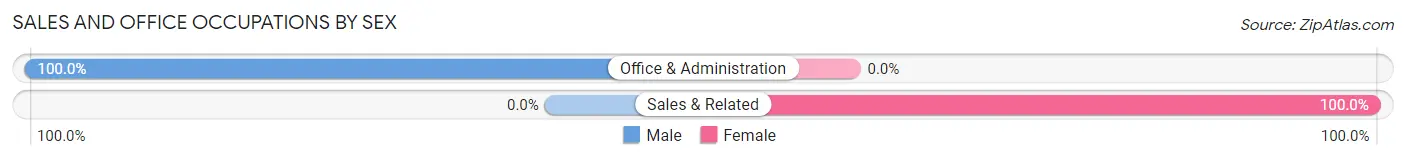
| Occupation | Male | Female |
| Sales & Related | 0 (0.0%) | 10 (100.0%) |
| Office & Administration | 2 (100.0%) | 0 (0.0%) |
| Total (Category) | 2 (16.7%) | 10 (83.3%) |
| Total (Overall) | 40 (61.5%) | 25 (38.5%) |
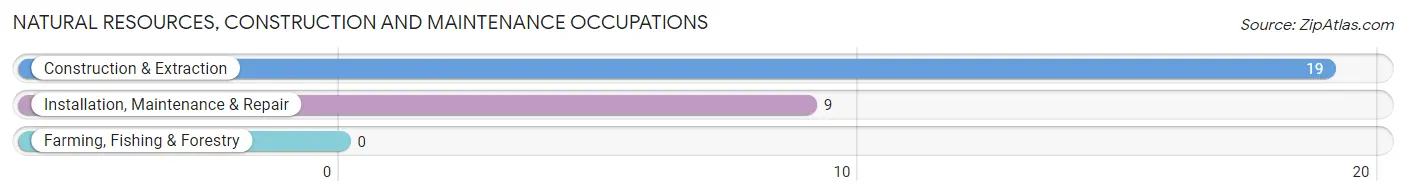
Natural Resources, Construction and Maintenance Occupations
The most common Natural Resources, Construction and Maintenance occupations in Foley are Construction & Extraction (19 | 29.2%), and Installation, Maintenance & Repair (9 | 13.9%).
Natural Resources, Construction and Maintenance Occupations by Sex
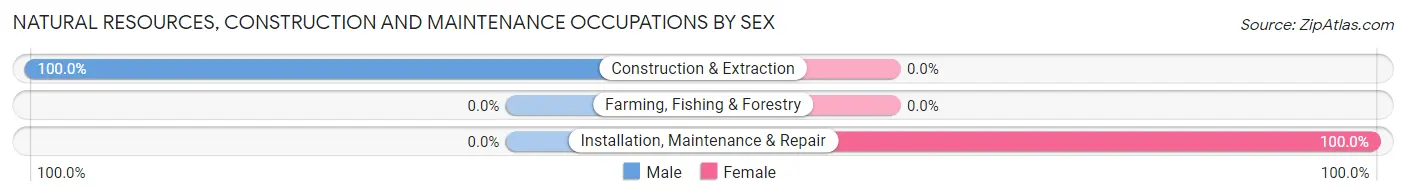
| Occupation | Male | Female |
| Farming, Fishing & Forestry | 0 (0.0%) | 0 (0.0%) |
| Construction & Extraction | 19 (100.0%) | 0 (0.0%) |
| Installation, Maintenance & Repair | 0 (0.0%) | 9 (100.0%) |
| Total (Category) | 19 (67.9%) | 9 (32.1%) |
| Total (Overall) | 40 (61.5%) | 25 (38.5%) |
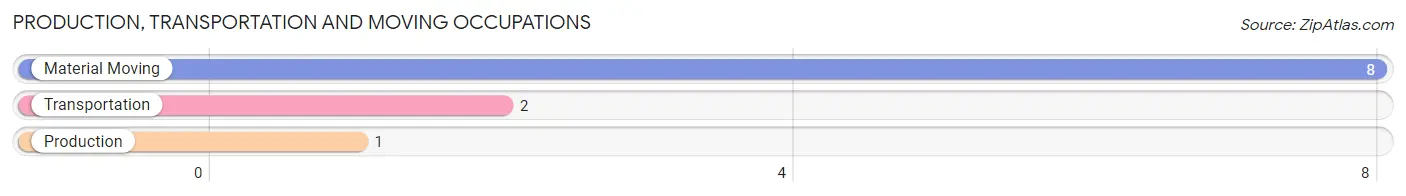
Production, Transportation and Moving Occupations
The most common Production, Transportation and Moving occupations in Foley are Material Moving (8 | 12.3%), Transportation (2 | 3.1%), and Production (1 | 1.5%).
Production, Transportation and Moving Occupations by Sex
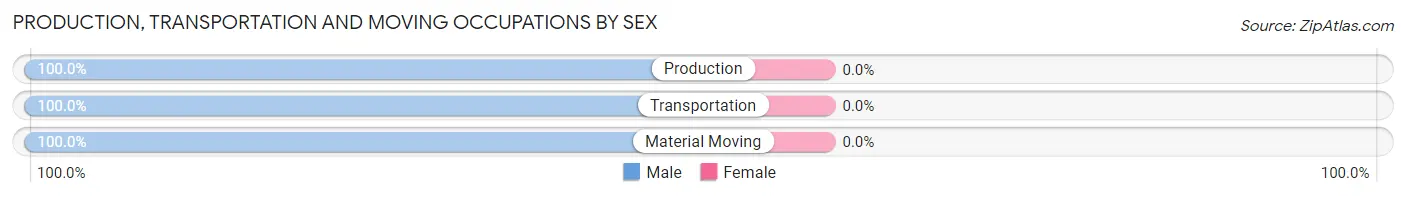
| Occupation | Male | Female |
| Production | 1 (100.0%) | 0 (0.0%) |
| Transportation | 2 (100.0%) | 0 (0.0%) |
| Material Moving | 8 (100.0%) | 0 (0.0%) |
| Total (Category) | 11 (100.0%) | 0 (0.0%) |
| Total (Overall) | 40 (61.5%) | 25 (38.5%) |
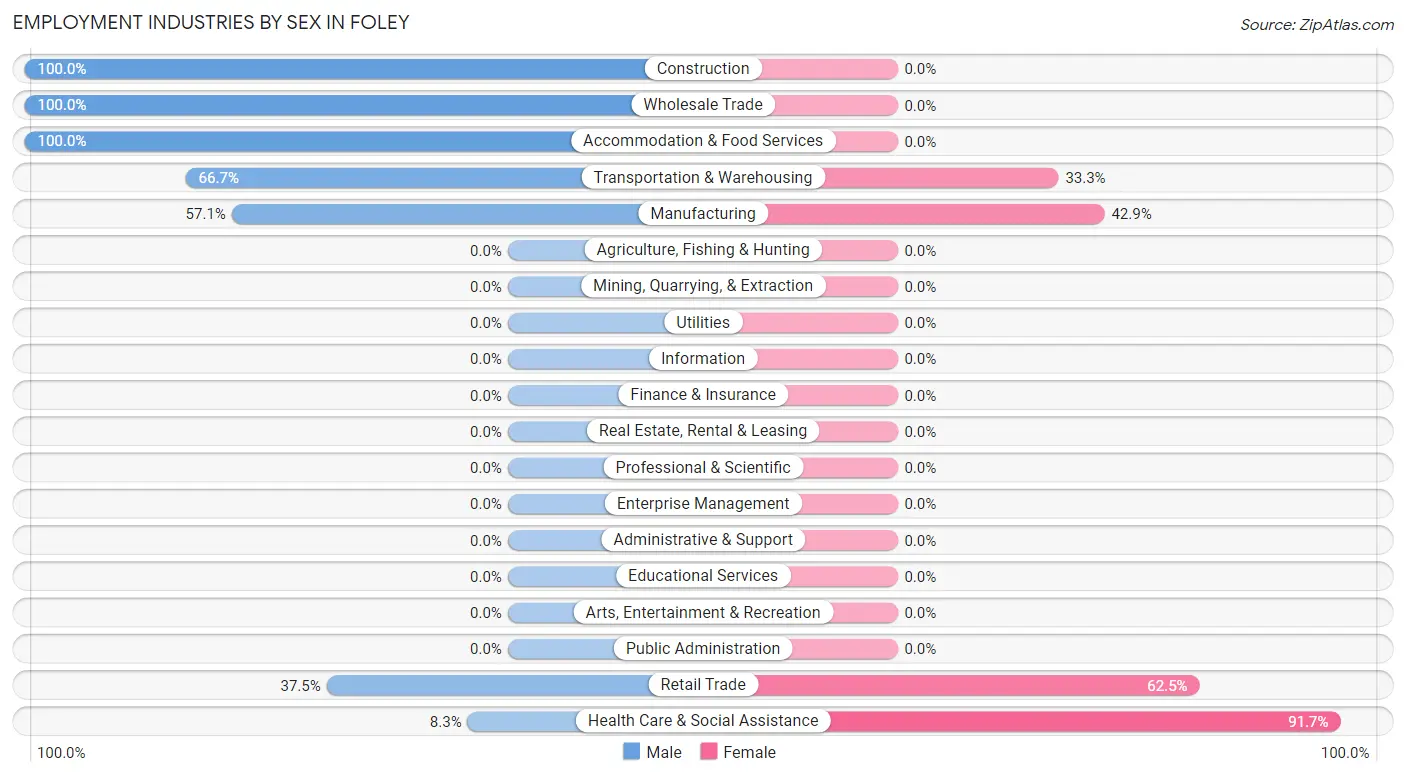
Employment Industries by Sex in Foley
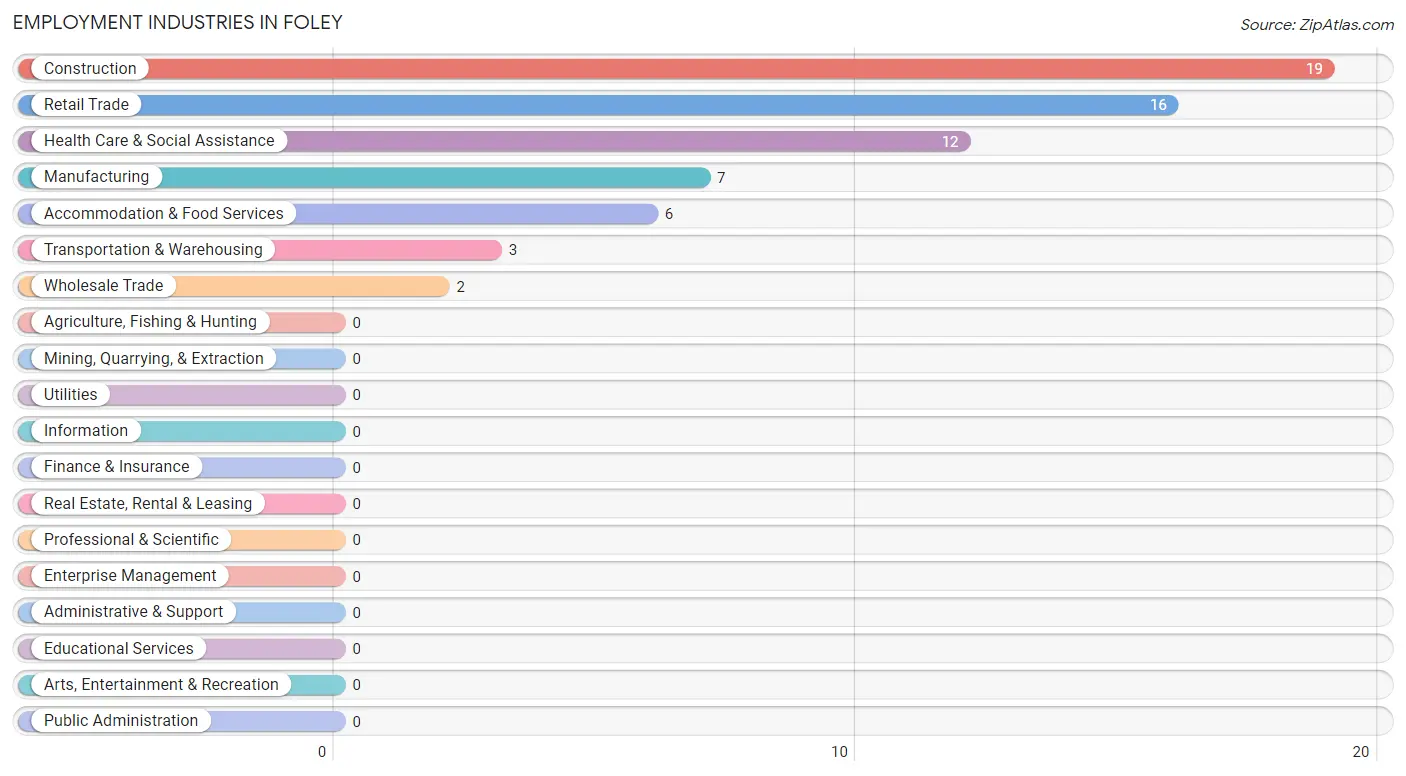
Employment Industries in Foley
The major employment industries in Foley include Construction (19 | 29.2%), Retail Trade (16 | 24.6%), Health Care & Social Assistance (12 | 18.5%), Manufacturing (7 | 10.8%), and Accommodation & Food Services (6 | 9.2%).
Employment Industries by Sex in Foley
The Foley industries that see more men than women are Construction (100.0%), Wholesale Trade (100.0%), and Accommodation & Food Services (100.0%), whereas the industries that tend to have a higher number of women are Health Care & Social Assistance (91.7%), Retail Trade (62.5%), and Manufacturing (42.9%).
| Industry | Male | Female |
| Agriculture, Fishing & Hunting | 0 (0.0%) | 0 (0.0%) |
| Mining, Quarrying, & Extraction | 0 (0.0%) | 0 (0.0%) |
| Construction | 19 (100.0%) | 0 (0.0%) |
| Manufacturing | 4 (57.1%) | 3 (42.9%) |
| Wholesale Trade | 2 (100.0%) | 0 (0.0%) |
| Retail Trade | 6 (37.5%) | 10 (62.5%) |
| Transportation & Warehousing | 2 (66.7%) | 1 (33.3%) |
| Utilities | 0 (0.0%) | 0 (0.0%) |
| Information | 0 (0.0%) | 0 (0.0%) |
| Finance & Insurance | 0 (0.0%) | 0 (0.0%) |
| Real Estate, Rental & Leasing | 0 (0.0%) | 0 (0.0%) |
| Professional & Scientific | 0 (0.0%) | 0 (0.0%) |
| Enterprise Management | 0 (0.0%) | 0 (0.0%) |
| Administrative & Support | 0 (0.0%) | 0 (0.0%) |
| Educational Services | 0 (0.0%) | 0 (0.0%) |
| Health Care & Social Assistance | 1 (8.3%) | 11 (91.7%) |
| Arts, Entertainment & Recreation | 0 (0.0%) | 0 (0.0%) |
| Accommodation & Food Services | 6 (100.0%) | 0 (0.0%) |
| Public Administration | 0 (0.0%) | 0 (0.0%) |
| Total | 40 (61.5%) | 25 (38.5%) |
Education in Foley
School Enrollment in Foley
The most common levels of schooling among the 47 students in Foley are elementary school (12 | 25.5%), high school (11 | 23.4%), and middle school (8 | 17.0%).
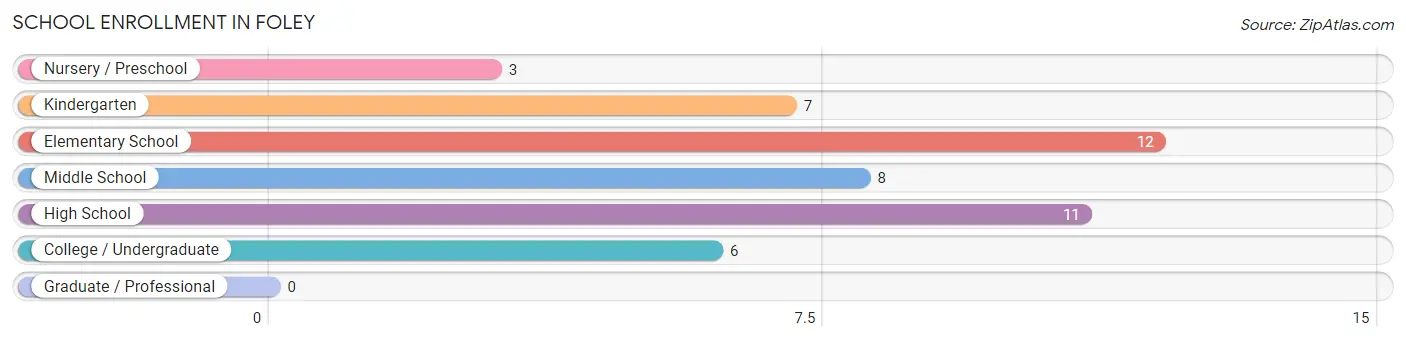
| School Level | # Students | % Students |
| Nursery / Preschool | 3 | 6.4% |
| Kindergarten | 7 | 14.9% |
| Elementary School | 12 | 25.5% |
| Middle School | 8 | 17.0% |
| High School | 11 | 23.4% |
| College / Undergraduate | 6 | 12.8% |
| Graduate / Professional | 0 | 0.0% |
| Total | 47 | 100.0% |
School Enrollment by Age by Funding Source in Foley
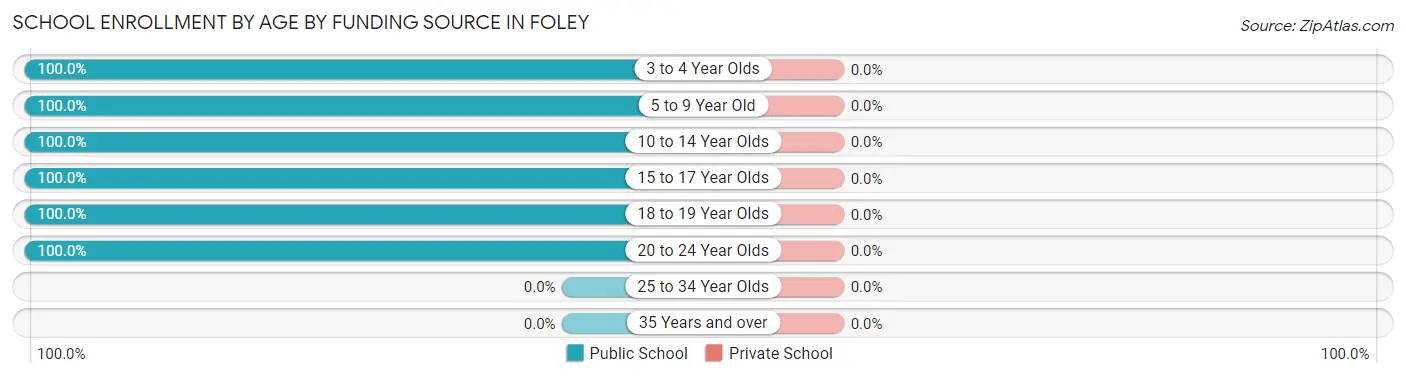
| Age Bracket | Public School | Private School |
| 3 to 4 Year Olds | 3 (100.0%) | 0 (0.0%) |
| 5 to 9 Year Old | 19 (100.0%) | 0 (0.0%) |
| 10 to 14 Year Olds | 13 (100.0%) | 0 (0.0%) |
| 15 to 17 Year Olds | 2 (100.0%) | 0 (0.0%) |
| 18 to 19 Year Olds | 4 (100.0%) | 0 (0.0%) |
| 20 to 24 Year Olds | 6 (100.0%) | 0 (0.0%) |
| 25 to 34 Year Olds | 0 (0.0%) | 0 (0.0%) |
| 35 Years and over | 0 (0.0%) | 0 (0.0%) |
| Total | 47 (100.0%) | 0 (0.0%) |
Educational Attainment by Field of Study in Foley
| Field of Study | # Graduates | % Graduates |
| Computers & Mathematics | 0 | 0.0% |
| Bio, Nature & Agricultural | 0 | 0.0% |
| Physical & Health Sciences | 0 | 0.0% |
| Psychology | 0 | 0.0% |
| Social Sciences | 0 | 0.0% |
| Engineering | 0 | 0.0% |
| Multidisciplinary Studies | 0 | 0.0% |
| Science & Technology | 0 | 0.0% |
| Business | 0 | 0.0% |
| Education | 0 | 0.0% |
| Literature & Languages | 0 | 0.0% |
| Liberal Arts & History | 0 | 0.0% |
| Visual & Performing Arts | 0 | 0.0% |
| Communications | 0 | 0.0% |
| Arts & Humanities | 0 | 0.0% |
| Total | 0 | 0.0% |
Transportation & Commute in Foley
Vehicle Availability by Sex in Foley
The most prevalent vehicle ownership categories in Foley are males with 2 vehicles (13, accounting for 32.5%) and females with 2 vehicles (3, making up 52.0%).
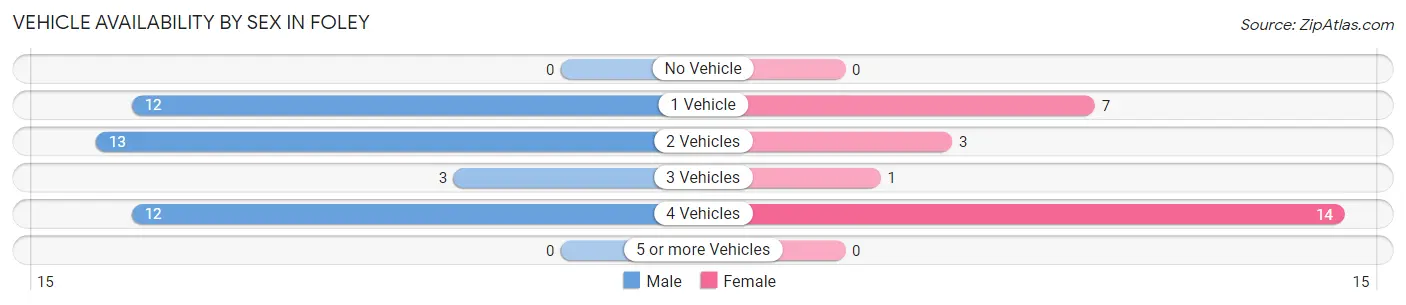
| Vehicles Available | Male | Female |
| No Vehicle | 0 (0.0%) | 0 (0.0%) |
| 1 Vehicle | 12 (30.0%) | 7 (28.0%) |
| 2 Vehicles | 13 (32.5%) | 3 (12.0%) |
| 3 Vehicles | 3 (7.5%) | 1 (4.0%) |
| 4 Vehicles | 12 (30.0%) | 14 (56.0%) |
| 5 or more Vehicles | 0 (0.0%) | 0 (0.0%) |
| Total | 40 (100.0%) | 25 (100.0%) |
Commute Time in Foley
The most frequently occuring commute durations in Foley are 30 to 34 minutes (28 commuters, 43.8%), 5 to 9 minutes (10 commuters, 15.6%), and 20 to 24 minutes (9 commuters, 14.1%).
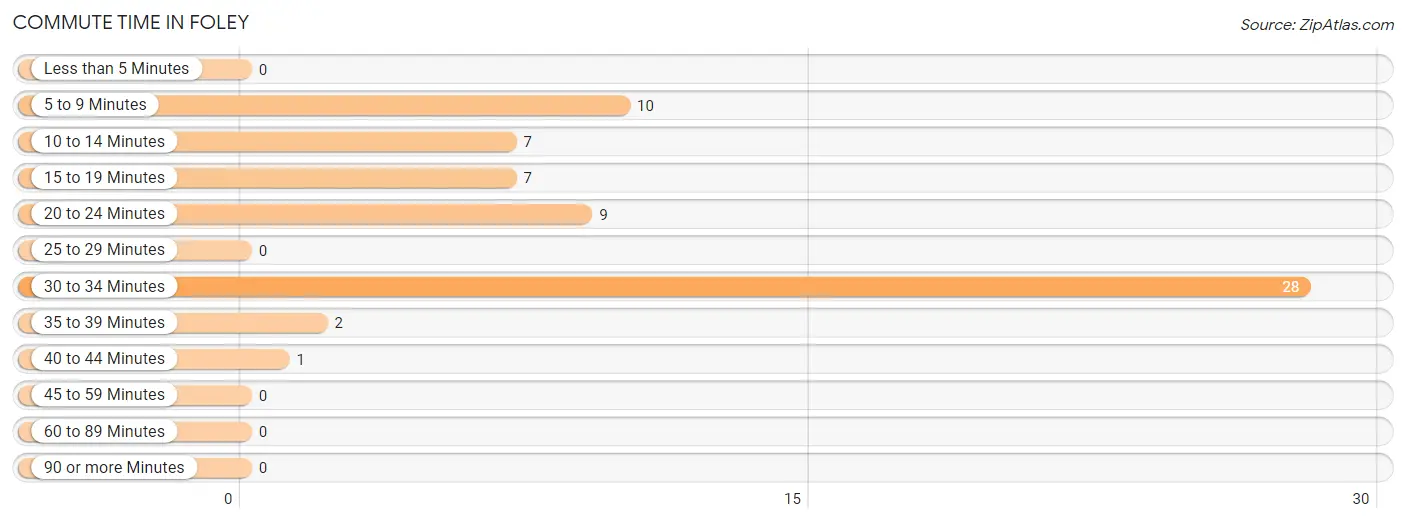
| Commute Time | # Commuters | % Commuters |
| Less than 5 Minutes | 0 | 0.0% |
| 5 to 9 Minutes | 10 | 15.6% |
| 10 to 14 Minutes | 7 | 10.9% |
| 15 to 19 Minutes | 7 | 10.9% |
| 20 to 24 Minutes | 9 | 14.1% |
| 25 to 29 Minutes | 0 | 0.0% |
| 30 to 34 Minutes | 28 | 43.8% |
| 35 to 39 Minutes | 2 | 3.1% |
| 40 to 44 Minutes | 1 | 1.6% |
| 45 to 59 Minutes | 0 | 0.0% |
| 60 to 89 Minutes | 0 | 0.0% |
| 90 or more Minutes | 0 | 0.0% |
Commute Time by Sex in Foley
The most common commute times in Foley are 30 to 34 minutes (17 commuters, 42.5%) for males and 30 to 34 minutes (11 commuters, 45.8%) for females.
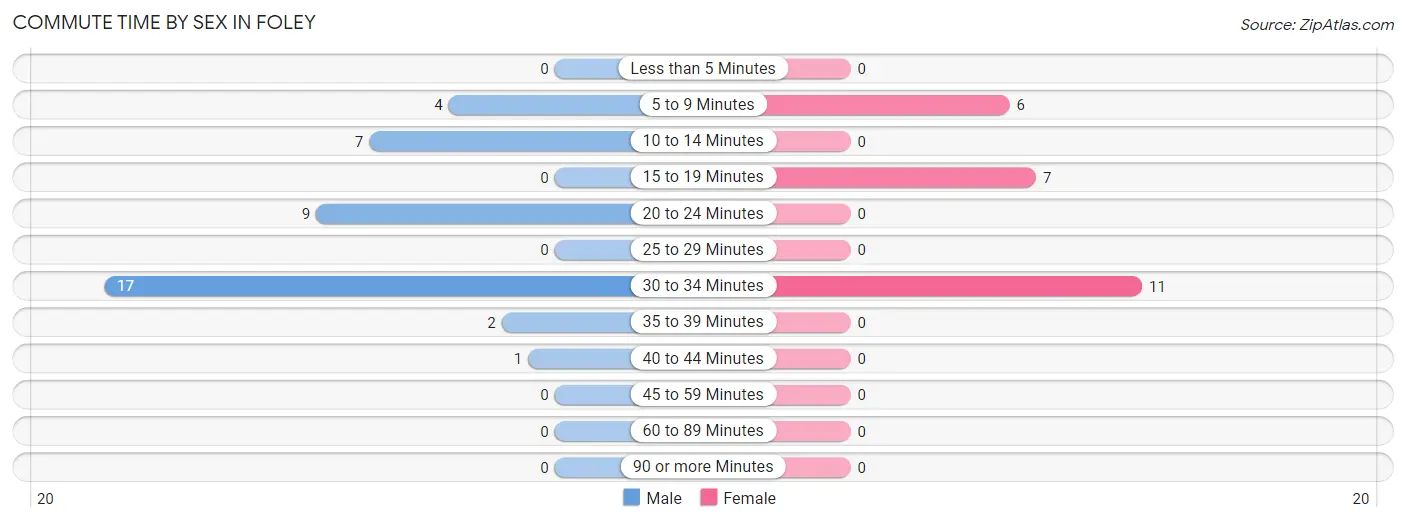
| Commute Time | Male | Female |
| Less than 5 Minutes | 0 (0.0%) | 0 (0.0%) |
| 5 to 9 Minutes | 4 (10.0%) | 6 (25.0%) |
| 10 to 14 Minutes | 7 (17.5%) | 0 (0.0%) |
| 15 to 19 Minutes | 0 (0.0%) | 7 (29.2%) |
| 20 to 24 Minutes | 9 (22.5%) | 0 (0.0%) |
| 25 to 29 Minutes | 0 (0.0%) | 0 (0.0%) |
| 30 to 34 Minutes | 17 (42.5%) | 11 (45.8%) |
| 35 to 39 Minutes | 2 (5.0%) | 0 (0.0%) |
| 40 to 44 Minutes | 1 (2.5%) | 0 (0.0%) |
| 45 to 59 Minutes | 0 (0.0%) | 0 (0.0%) |
| 60 to 89 Minutes | 0 (0.0%) | 0 (0.0%) |
| 90 or more Minutes | 0 (0.0%) | 0 (0.0%) |
Time of Departure to Work by Sex in Foley
The most frequent times of departure to work in Foley are 7:30 AM to 7:59 AM (15, 37.5%) for males and 7:30 AM to 7:59 AM (11, 45.8%) for females.
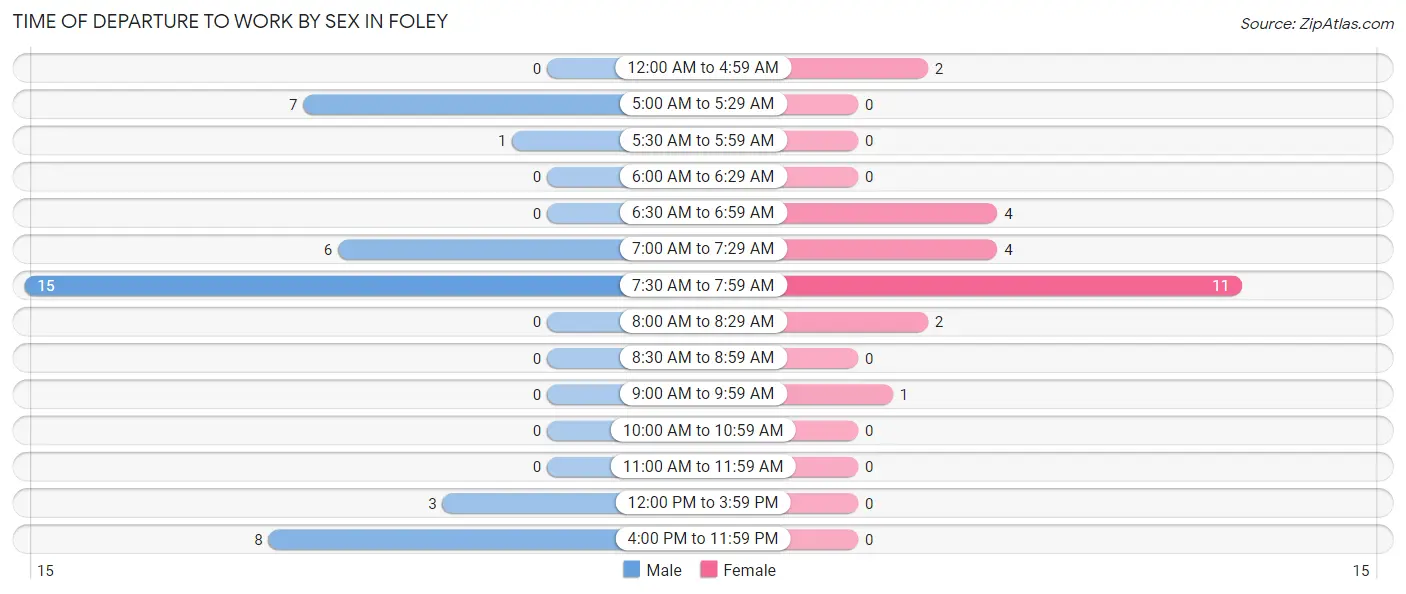
| Time of Departure | Male | Female |
| 12:00 AM to 4:59 AM | 0 (0.0%) | 2 (8.3%) |
| 5:00 AM to 5:29 AM | 7 (17.5%) | 0 (0.0%) |
| 5:30 AM to 5:59 AM | 1 (2.5%) | 0 (0.0%) |
| 6:00 AM to 6:29 AM | 0 (0.0%) | 0 (0.0%) |
| 6:30 AM to 6:59 AM | 0 (0.0%) | 4 (16.7%) |
| 7:00 AM to 7:29 AM | 6 (15.0%) | 4 (16.7%) |
| 7:30 AM to 7:59 AM | 15 (37.5%) | 11 (45.8%) |
| 8:00 AM to 8:29 AM | 0 (0.0%) | 2 (8.3%) |
| 8:30 AM to 8:59 AM | 0 (0.0%) | 0 (0.0%) |
| 9:00 AM to 9:59 AM | 0 (0.0%) | 1 (4.2%) |
| 10:00 AM to 10:59 AM | 0 (0.0%) | 0 (0.0%) |
| 11:00 AM to 11:59 AM | 0 (0.0%) | 0 (0.0%) |
| 12:00 PM to 3:59 PM | 3 (7.5%) | 0 (0.0%) |
| 4:00 PM to 11:59 PM | 8 (20.0%) | 0 (0.0%) |
| Total | 40 (100.0%) | 24 (100.0%) |
Housing Occupancy in Foley
Occupancy by Ownership in Foley
Of the total 43 dwellings in Foley, owner-occupied units account for 37 (86.1%), while renter-occupied units make up 6 (14.0%).
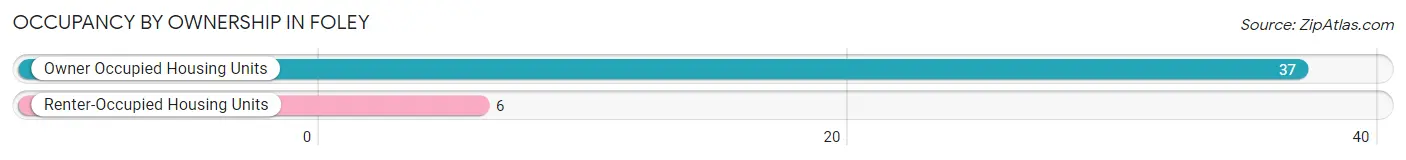
| Occupancy | # Housing Units | % Housing Units |
| Owner Occupied Housing Units | 37 | 86.1% |
| Renter-Occupied Housing Units | 6 | 14.0% |
| Total Occupied Housing Units | 43 | 100.0% |
Occupancy by Household Size in Foley
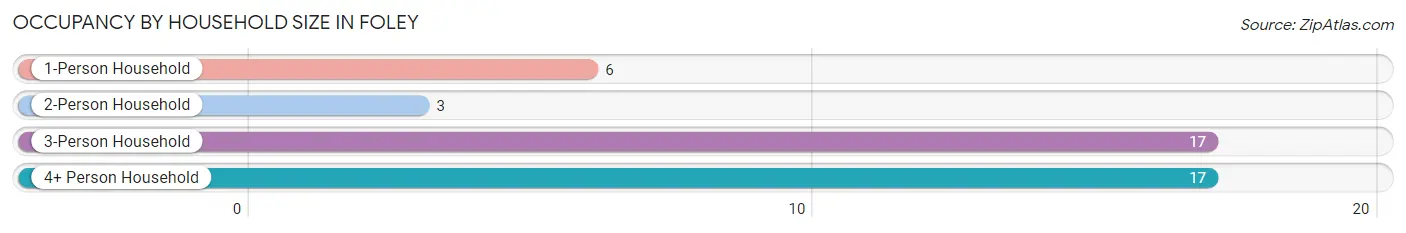
| Household Size | # Housing Units | % Housing Units |
| 1-Person Household | 6 | 14.0% |
| 2-Person Household | 3 | 7.0% |
| 3-Person Household | 17 | 39.5% |
| 4+ Person Household | 17 | 39.5% |
| Total Housing Units | 43 | 100.0% |
Occupancy by Ownership by Household Size in Foley
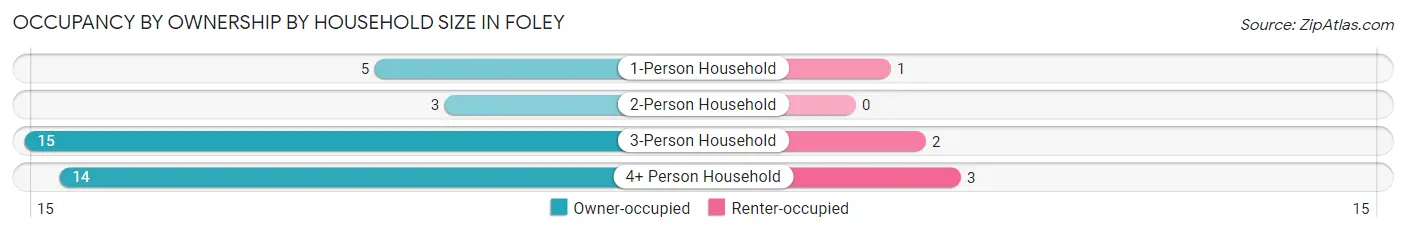
| Household Size | Owner-occupied | Renter-occupied |
| 1-Person Household | 5 (83.3%) | 1 (16.7%) |
| 2-Person Household | 3 (100.0%) | 0 (0.0%) |
| 3-Person Household | 15 (88.2%) | 2 (11.8%) |
| 4+ Person Household | 14 (82.4%) | 3 (17.6%) |
| Total Housing Units | 37 (86.1%) | 6 (14.0%) |
Occupancy by Educational Attainment in Foley
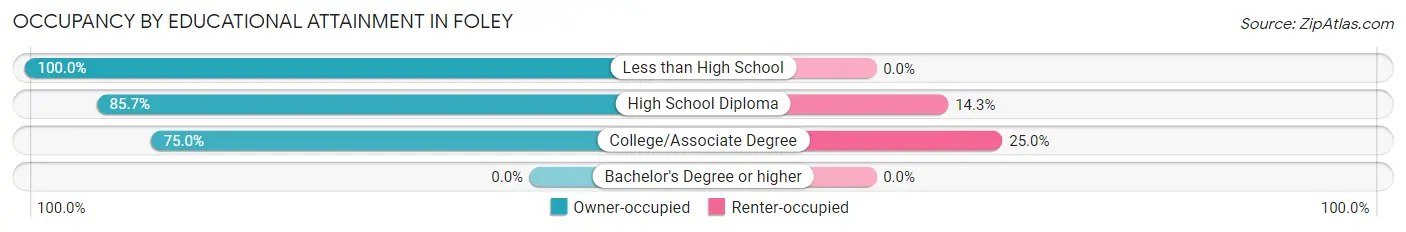
| Household Size | Owner-occupied | Renter-occupied |
| Less than High School | 7 (100.0%) | 0 (0.0%) |
| High School Diploma | 24 (85.7%) | 4 (14.3%) |
| College/Associate Degree | 6 (75.0%) | 2 (25.0%) |
| Bachelor's Degree or higher | 0 (0.0%) | 0 (0.0%) |
Occupancy by Age of Householder in Foley
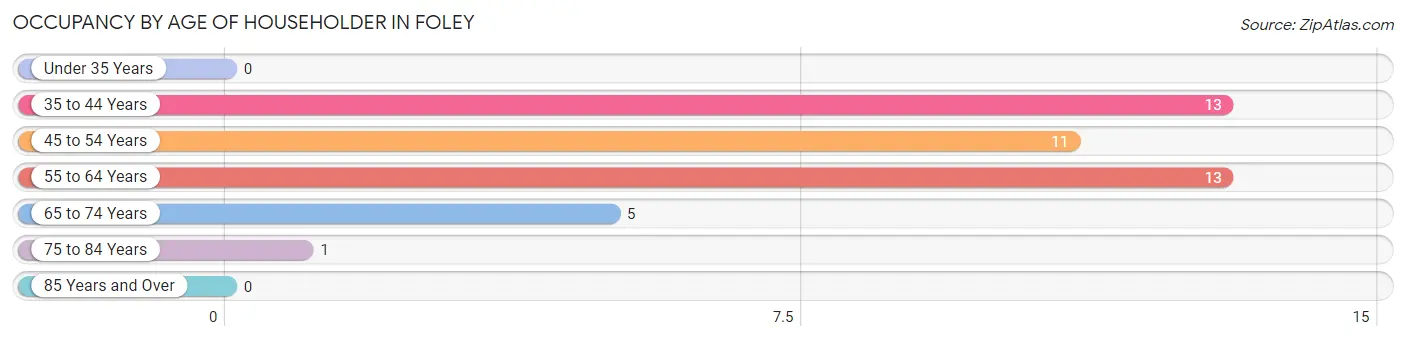
| Age Bracket | # Households | % Households |
| Under 35 Years | 0 | 0.0% |
| 35 to 44 Years | 13 | 30.2% |
| 45 to 54 Years | 11 | 25.6% |
| 55 to 64 Years | 13 | 30.2% |
| 65 to 74 Years | 5 | 11.6% |
| 75 to 84 Years | 1 | 2.3% |
| 85 Years and Over | 0 | 0.0% |
| Total | 43 | 100.0% |
Housing Finances in Foley
Median Income by Occupancy in Foley
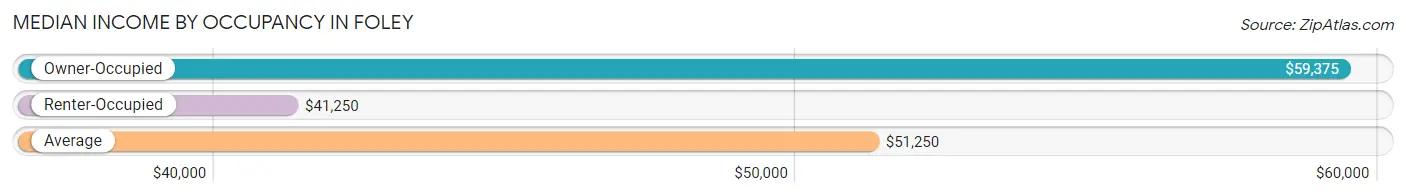
| Occupancy Type | # Households | Median Income |
| Owner-Occupied | 37 (86.1%) | $59,375 |
| Renter-Occupied | 6 (14.0%) | $41,250 |
| Average | 43 (100.0%) | $51,250 |
Occupancy by Householder Income Bracket in Foley
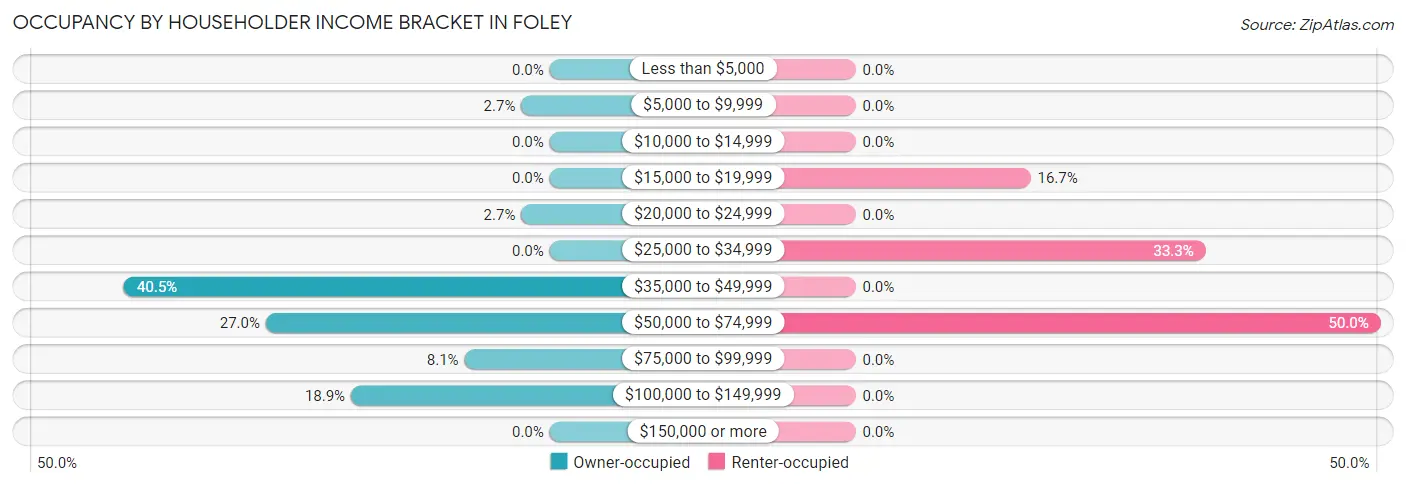
| Income Bracket | Owner-occupied | Renter-occupied |
| Less than $5,000 | 0 (0.0%) | 0 (0.0%) |
| $5,000 to $9,999 | 1 (2.7%) | 0 (0.0%) |
| $10,000 to $14,999 | 0 (0.0%) | 0 (0.0%) |
| $15,000 to $19,999 | 0 (0.0%) | 1 (16.7%) |
| $20,000 to $24,999 | 1 (2.7%) | 0 (0.0%) |
| $25,000 to $34,999 | 0 (0.0%) | 2 (33.3%) |
| $35,000 to $49,999 | 15 (40.5%) | 0 (0.0%) |
| $50,000 to $74,999 | 10 (27.0%) | 3 (50.0%) |
| $75,000 to $99,999 | 3 (8.1%) | 0 (0.0%) |
| $100,000 to $149,999 | 7 (18.9%) | 0 (0.0%) |
| $150,000 or more | 0 (0.0%) | 0 (0.0%) |
| Total | 37 (100.0%) | 6 (100.0%) |
Monthly Housing Cost Tiers in Foley
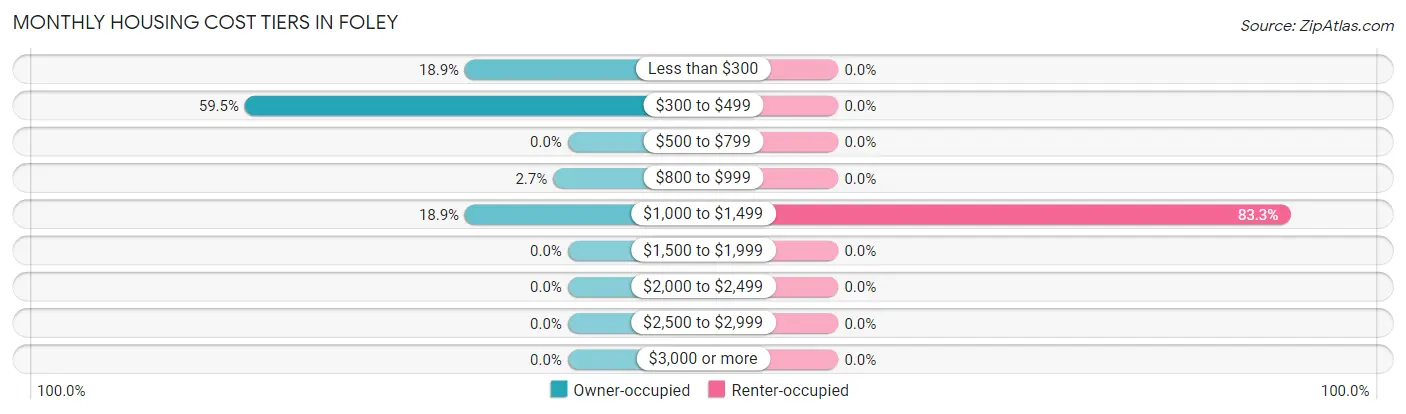
| Monthly Cost | Owner-occupied | Renter-occupied |
| Less than $300 | 7 (18.9%) | 0 (0.0%) |
| $300 to $499 | 22 (59.5%) | 0 (0.0%) |
| $500 to $799 | 0 (0.0%) | 0 (0.0%) |
| $800 to $999 | 1 (2.7%) | 0 (0.0%) |
| $1,000 to $1,499 | 7 (18.9%) | 5 (83.3%) |
| $1,500 to $1,999 | 0 (0.0%) | 0 (0.0%) |
| $2,000 to $2,499 | 0 (0.0%) | 0 (0.0%) |
| $2,500 to $2,999 | 0 (0.0%) | 0 (0.0%) |
| $3,000 or more | 0 (0.0%) | 0 (0.0%) |
| Total | 37 (100.0%) | 6 (100.0%) |
Physical Housing Characteristics in Foley
Housing Structures in Foley
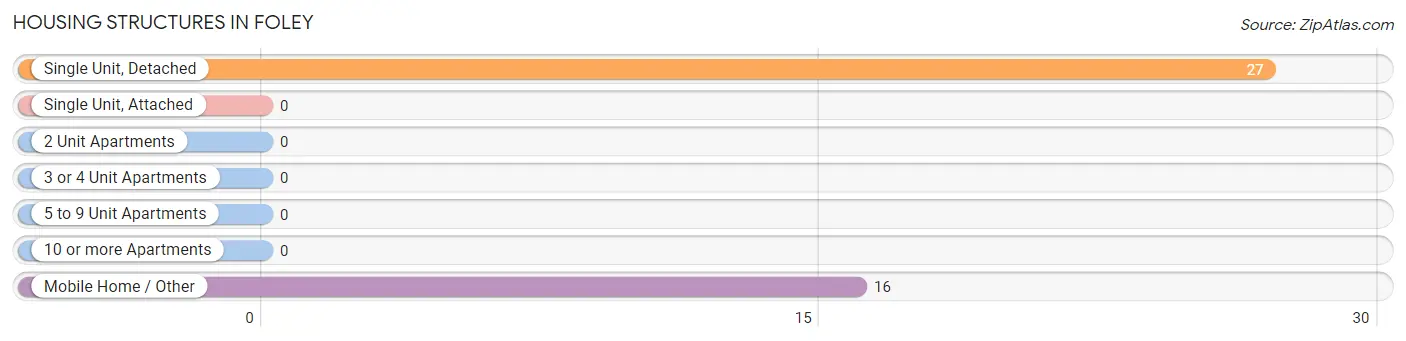
| Structure Type | # Housing Units | % Housing Units |
| Single Unit, Detached | 27 | 62.8% |
| Single Unit, Attached | 0 | 0.0% |
| 2 Unit Apartments | 0 | 0.0% |
| 3 or 4 Unit Apartments | 0 | 0.0% |
| 5 to 9 Unit Apartments | 0 | 0.0% |
| 10 or more Apartments | 0 | 0.0% |
| Mobile Home / Other | 16 | 37.2% |
| Total | 43 | 100.0% |
Housing Structures by Occupancy in Foley
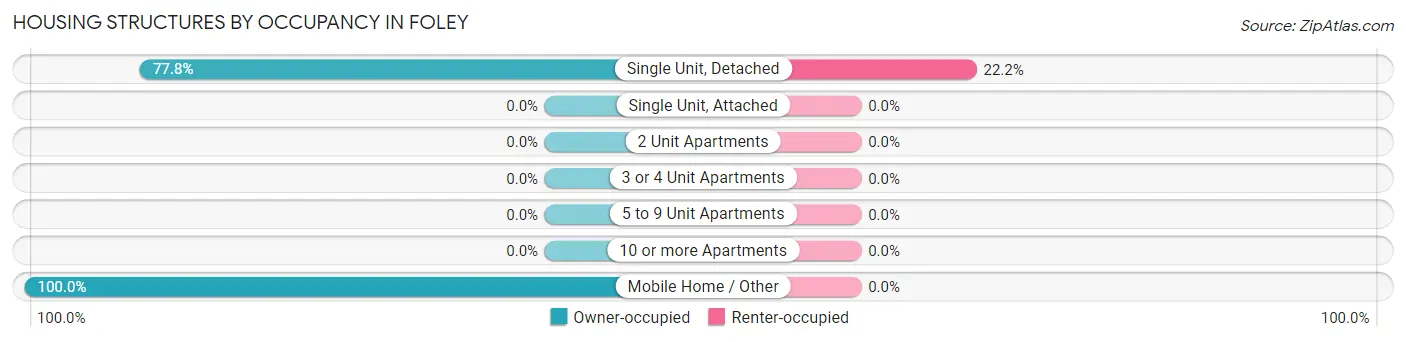
| Structure Type | Owner-occupied | Renter-occupied |
| Single Unit, Detached | 21 (77.8%) | 6 (22.2%) |
| Single Unit, Attached | 0 (0.0%) | 0 (0.0%) |
| 2 Unit Apartments | 0 (0.0%) | 0 (0.0%) |
| 3 or 4 Unit Apartments | 0 (0.0%) | 0 (0.0%) |
| 5 to 9 Unit Apartments | 0 (0.0%) | 0 (0.0%) |
| 10 or more Apartments | 0 (0.0%) | 0 (0.0%) |
| Mobile Home / Other | 16 (100.0%) | 0 (0.0%) |
| Total | 37 (86.1%) | 6 (14.0%) |
Housing Structures by Number of Rooms in Foley
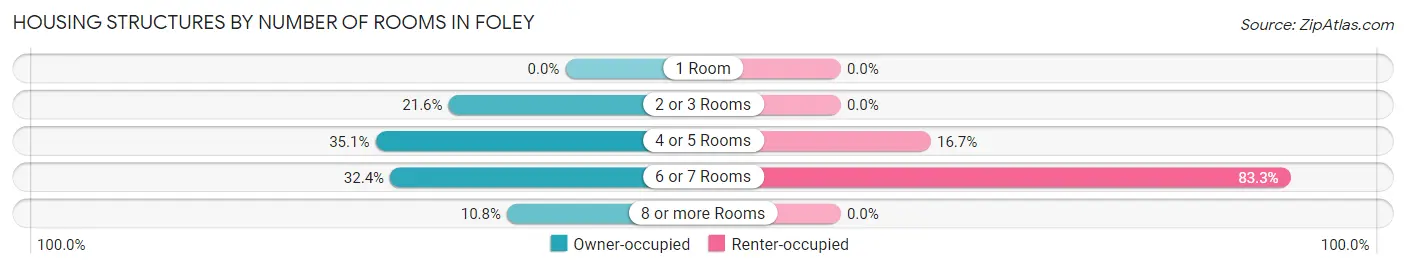
| Number of Rooms | Owner-occupied | Renter-occupied |
| 1 Room | 0 (0.0%) | 0 (0.0%) |
| 2 or 3 Rooms | 8 (21.6%) | 0 (0.0%) |
| 4 or 5 Rooms | 13 (35.1%) | 1 (16.7%) |
| 6 or 7 Rooms | 12 (32.4%) | 5 (83.3%) |
| 8 or more Rooms | 4 (10.8%) | 0 (0.0%) |
| Total | 37 (100.0%) | 6 (100.0%) |
Housing Structure by Heating Type in Foley
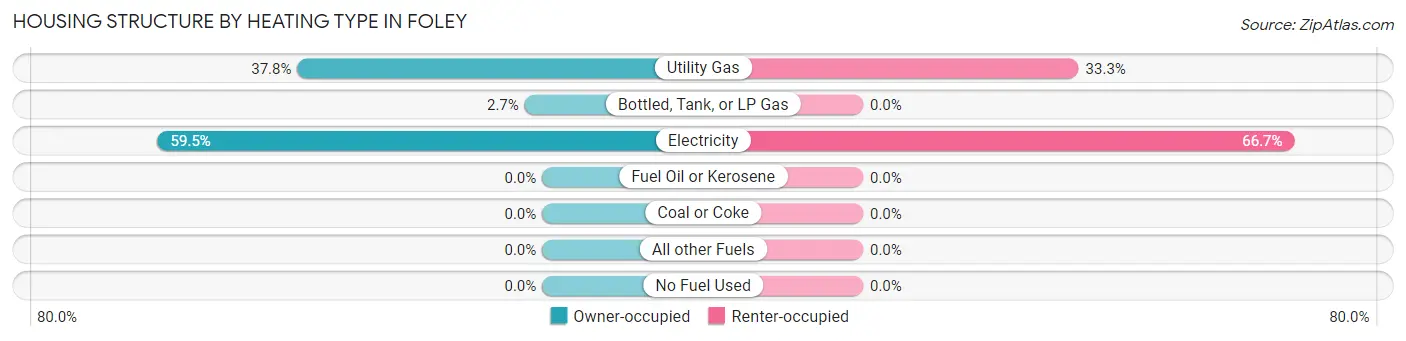
| Heating Type | Owner-occupied | Renter-occupied |
| Utility Gas | 14 (37.8%) | 2 (33.3%) |
| Bottled, Tank, or LP Gas | 1 (2.7%) | 0 (0.0%) |
| Electricity | 22 (59.5%) | 4 (66.7%) |
| Fuel Oil or Kerosene | 0 (0.0%) | 0 (0.0%) |
| Coal or Coke | 0 (0.0%) | 0 (0.0%) |
| All other Fuels | 0 (0.0%) | 0 (0.0%) |
| No Fuel Used | 0 (0.0%) | 0 (0.0%) |
| Total | 37 (100.0%) | 6 (100.0%) |
Household Vehicle Usage in Foley
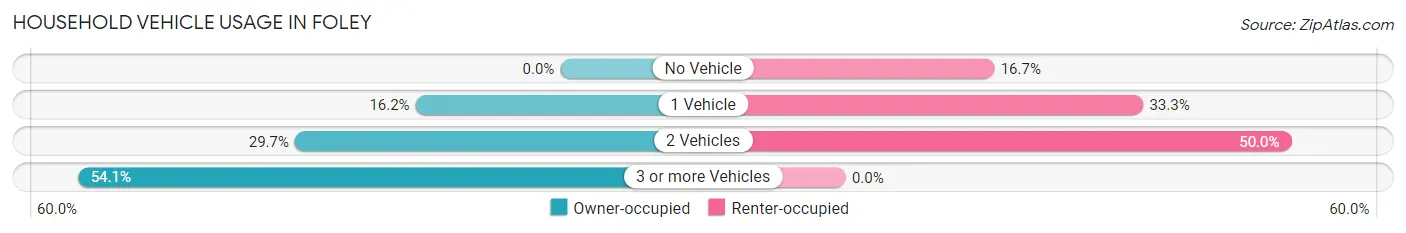
| Vehicles per Household | Owner-occupied | Renter-occupied |
| No Vehicle | 0 (0.0%) | 1 (16.7%) |
| 1 Vehicle | 6 (16.2%) | 2 (33.3%) |
| 2 Vehicles | 11 (29.7%) | 3 (50.0%) |
| 3 or more Vehicles | 20 (54.0%) | 0 (0.0%) |
| Total | 37 (100.0%) | 6 (100.0%) |
Real Estate & Mortgages in Foley
Real Estate and Mortgage Overview in Foley
| Characteristic | Without Mortgage | With Mortgage |
| Housing Units | 29 | 8 |
| Median Property Value | $51,900 | $82,000 |
| Median Household Income | $61,750 | $0 |
| Monthly Housing Costs | $331 | $0 |
| Real Estate Taxes | $478 | $0 |
Property Value by Mortgage Status in Foley
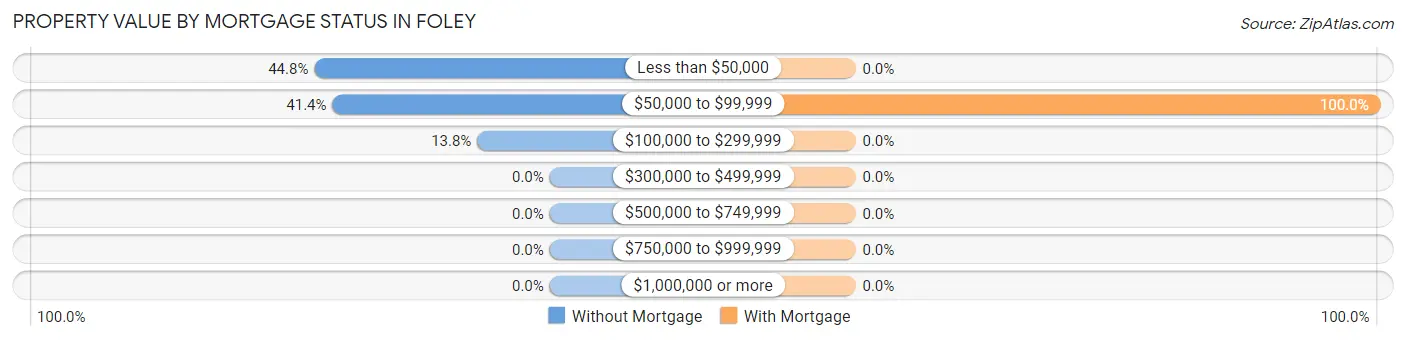
| Property Value | Without Mortgage | With Mortgage |
| Less than $50,000 | 13 (44.8%) | 0 (0.0%) |
| $50,000 to $99,999 | 12 (41.4%) | 8 (100.0%) |
| $100,000 to $299,999 | 4 (13.8%) | 0 (0.0%) |
| $300,000 to $499,999 | 0 (0.0%) | 0 (0.0%) |
| $500,000 to $749,999 | 0 (0.0%) | 0 (0.0%) |
| $750,000 to $999,999 | 0 (0.0%) | 0 (0.0%) |
| $1,000,000 or more | 0 (0.0%) | 0 (0.0%) |
| Total | 29 (100.0%) | 8 (100.0%) |
Household Income by Mortgage Status in Foley
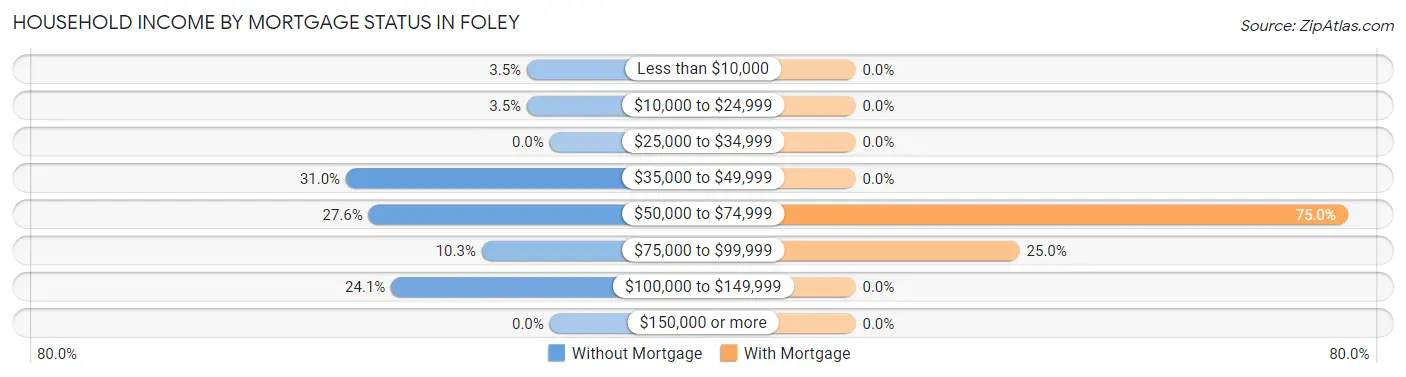
| Household Income | Without Mortgage | With Mortgage |
| Less than $10,000 | 1 (3.5%) | 0 (0.0%) |
| $10,000 to $24,999 | 1 (3.5%) | 0 (0.0%) |
| $25,000 to $34,999 | 0 (0.0%) | 0 (0.0%) |
| $35,000 to $49,999 | 9 (31.0%) | 0 (0.0%) |
| $50,000 to $74,999 | 8 (27.6%) | 6 (75.0%) |
| $75,000 to $99,999 | 3 (10.3%) | 2 (25.0%) |
| $100,000 to $149,999 | 7 (24.1%) | 0 (0.0%) |
| $150,000 or more | 0 (0.0%) | 0 (0.0%) |
| Total | 29 (100.0%) | 8 (100.0%) |
Property Value to Household Income Ratio in Foley
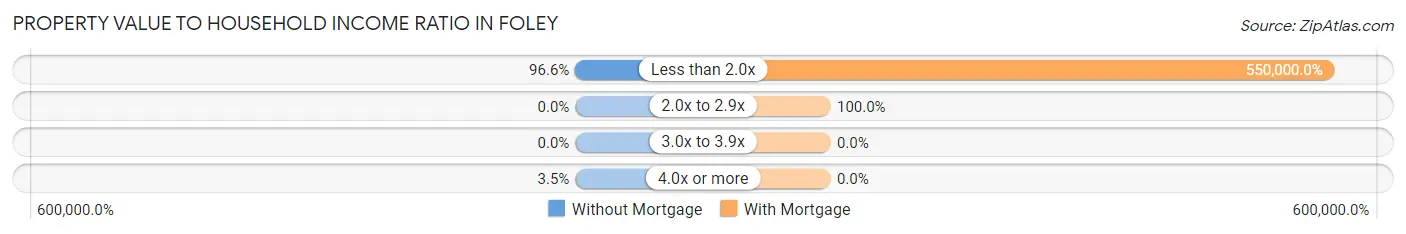
| Value-to-Income Ratio | Without Mortgage | With Mortgage |
| Less than 2.0x | 28 (96.6%) | 44,000 (550,000.0%) |
| 2.0x to 2.9x | 0 (0.0%) | 8 (100.0%) |
| 3.0x to 3.9x | 0 (0.0%) | 0 (0.0%) |
| 4.0x or more | 1 (3.5%) | 0 (0.0%) |
| Total | 29 (100.0%) | 8 (100.0%) |
Real Estate Taxes by Mortgage Status in Foley
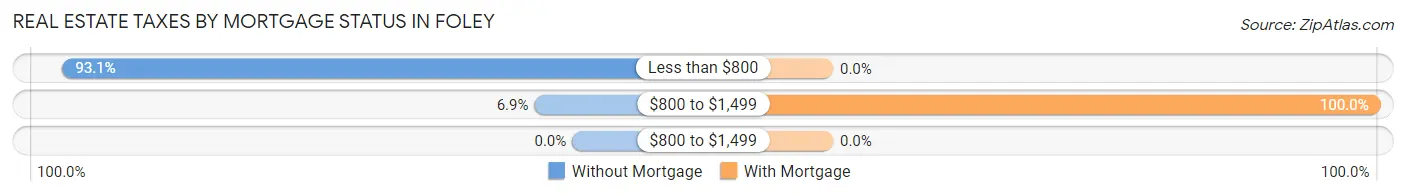
| Property Taxes | Without Mortgage | With Mortgage |
| Less than $800 | 27 (93.1%) | 0 (0.0%) |
| $800 to $1,499 | 2 (6.9%) | 8 (100.0%) |
| $800 to $1,499 | 0 (0.0%) | 0 (0.0%) |
| Total | 29 (100.0%) | 8 (100.0%) |
Health & Disability in Foley
Health Insurance Coverage by Age in Foley
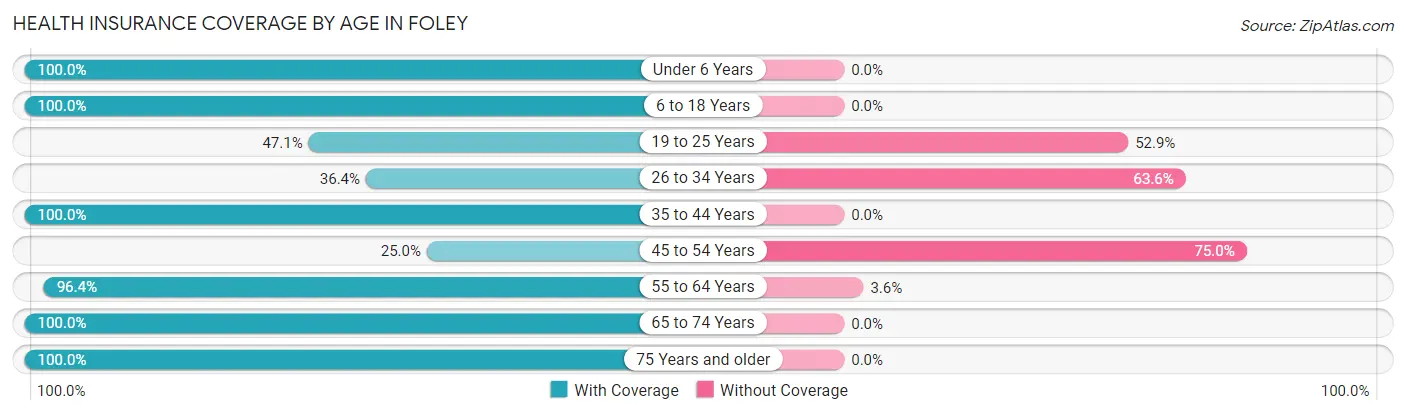
| Age Bracket | With Coverage | Without Coverage |
| Under 6 Years | 17 (100.0%) | 0 (0.0%) |
| 6 to 18 Years | 33 (100.0%) | 0 (0.0%) |
| 19 to 25 Years | 8 (47.1%) | 9 (52.9%) |
| 26 to 34 Years | 4 (36.4%) | 7 (63.6%) |
| 35 to 44 Years | 20 (100.0%) | 0 (0.0%) |
| 45 to 54 Years | 5 (25.0%) | 15 (75.0%) |
| 55 to 64 Years | 27 (96.4%) | 1 (3.6%) |
| 65 to 74 Years | 12 (100.0%) | 0 (0.0%) |
| 75 Years and older | 1 (100.0%) | 0 (0.0%) |
| Total | 127 (79.9%) | 32 (20.1%) |
Health Insurance Coverage by Citizenship Status in Foley
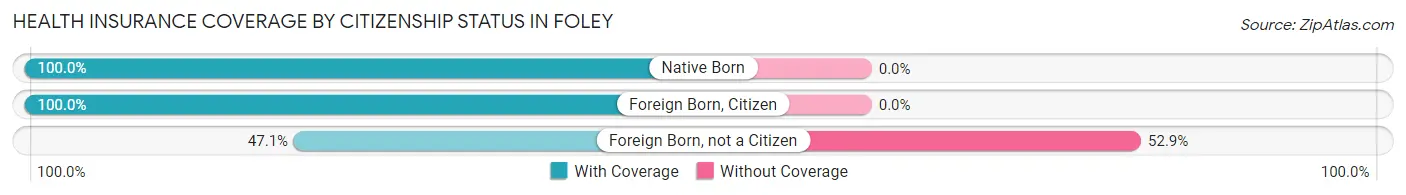
| Citizenship Status | With Coverage | Without Coverage |
| Native Born | 17 (100.0%) | 0 (0.0%) |
| Foreign Born, Citizen | 33 (100.0%) | 0 (0.0%) |
| Foreign Born, not a Citizen | 8 (47.1%) | 9 (52.9%) |
Health Insurance Coverage by Household Income in Foley
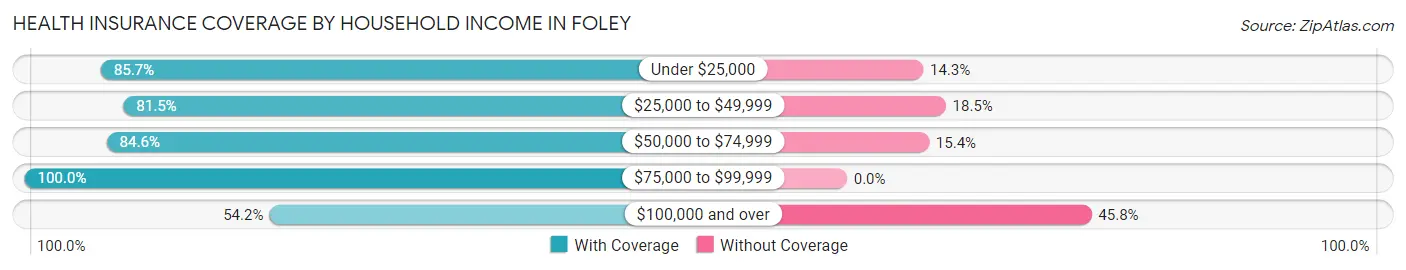
| Household Income | With Coverage | Without Coverage |
| Under $25,000 | 6 (85.7%) | 1 (14.3%) |
| $25,000 to $49,999 | 44 (81.5%) | 10 (18.5%) |
| $50,000 to $74,999 | 55 (84.6%) | 10 (15.4%) |
| $75,000 to $99,999 | 9 (100.0%) | 0 (0.0%) |
| $100,000 and over | 13 (54.2%) | 11 (45.8%) |
Public vs Private Health Insurance Coverage by Age in Foley
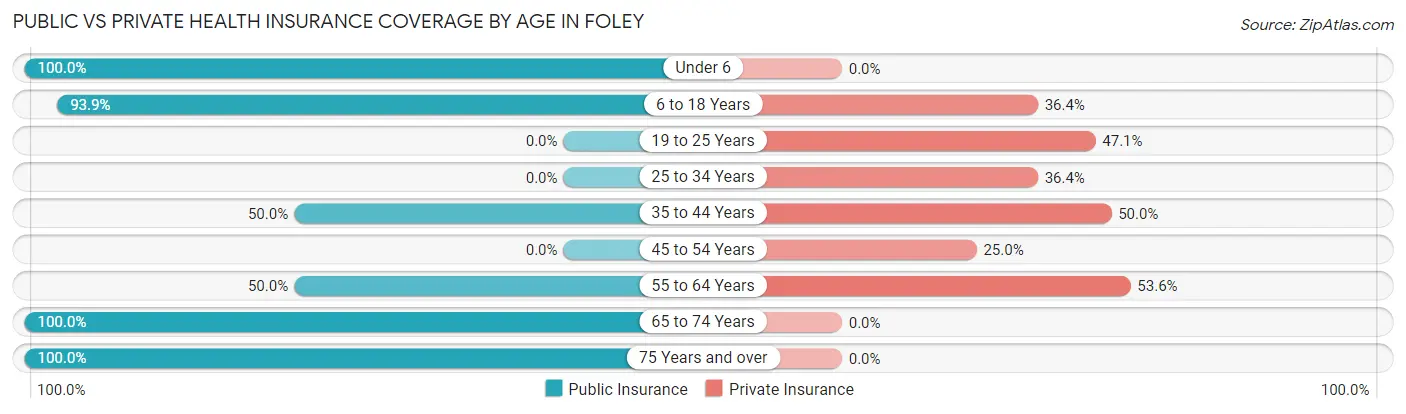
| Age Bracket | Public Insurance | Private Insurance |
| Under 6 | 17 (100.0%) | 0 (0.0%) |
| 6 to 18 Years | 31 (93.9%) | 12 (36.4%) |
| 19 to 25 Years | 0 (0.0%) | 8 (47.1%) |
| 25 to 34 Years | 0 (0.0%) | 4 (36.4%) |
| 35 to 44 Years | 10 (50.0%) | 10 (50.0%) |
| 45 to 54 Years | 0 (0.0%) | 5 (25.0%) |
| 55 to 64 Years | 14 (50.0%) | 15 (53.6%) |
| 65 to 74 Years | 12 (100.0%) | 0 (0.0%) |
| 75 Years and over | 1 (100.0%) | 0 (0.0%) |
| Total | 85 (53.5%) | 54 (34.0%) |
Disability Status by Sex by Age in Foley
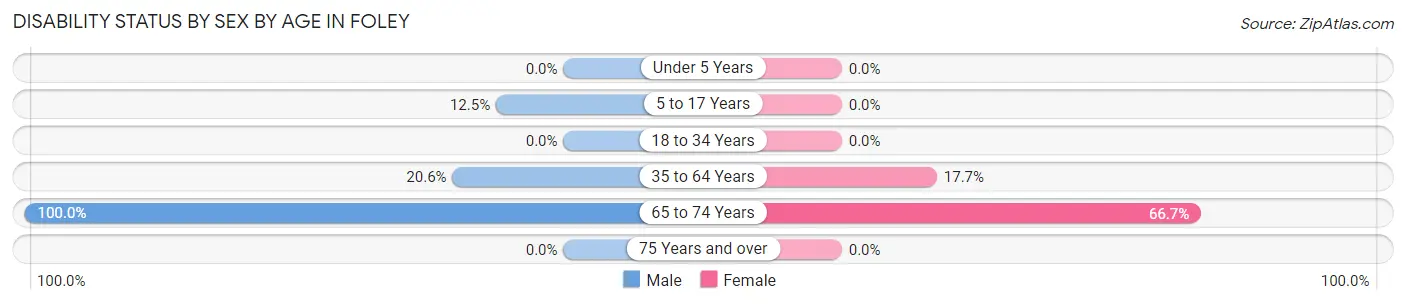
| Age Bracket | Male | Female |
| Under 5 Years | 0 (0.0%) | 0 (0.0%) |
| 5 to 17 Years | 2 (12.5%) | 0 (0.0%) |
| 18 to 34 Years | 0 (0.0%) | 0 (0.0%) |
| 35 to 64 Years | 7 (20.6%) | 6 (17.6%) |
| 65 to 74 Years | 3 (100.0%) | 6 (66.7%) |
| 75 Years and over | 0 (0.0%) | 0 (0.0%) |
Disability Class by Sex by Age in Foley
Disability Class: Hearing Difficulty
| Age Bracket | Male | Female |
| Under 5 Years | 0 (0.0%) | 0 (0.0%) |
| 5 to 17 Years | 0 (0.0%) | 0 (0.0%) |
| 18 to 34 Years | 0 (0.0%) | 0 (0.0%) |
| 35 to 64 Years | 0 (0.0%) | 0 (0.0%) |
| 65 to 74 Years | 0 (0.0%) | 0 (0.0%) |
| 75 Years and over | 0 (0.0%) | 0 (0.0%) |
Disability Class: Vision Difficulty
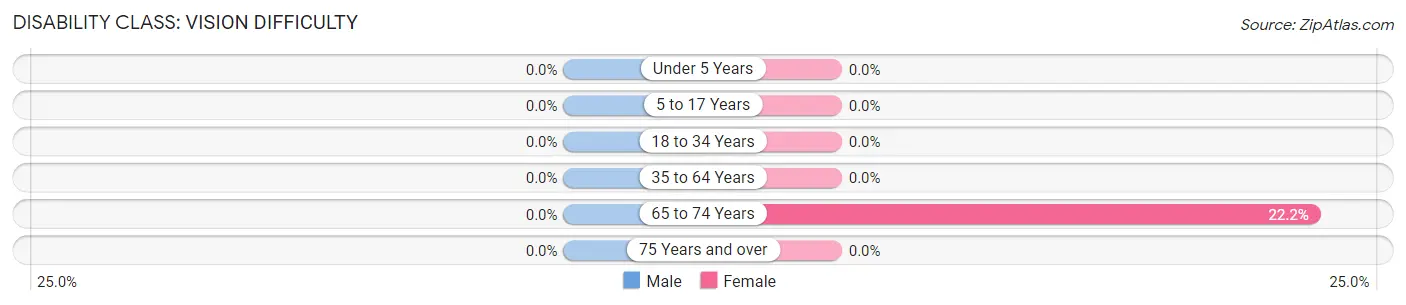
| Age Bracket | Male | Female |
| Under 5 Years | 0 (0.0%) | 0 (0.0%) |
| 5 to 17 Years | 0 (0.0%) | 0 (0.0%) |
| 18 to 34 Years | 0 (0.0%) | 0 (0.0%) |
| 35 to 64 Years | 0 (0.0%) | 0 (0.0%) |
| 65 to 74 Years | 0 (0.0%) | 2 (22.2%) |
| 75 Years and over | 0 (0.0%) | 0 (0.0%) |
Disability Class: Cognitive Difficulty
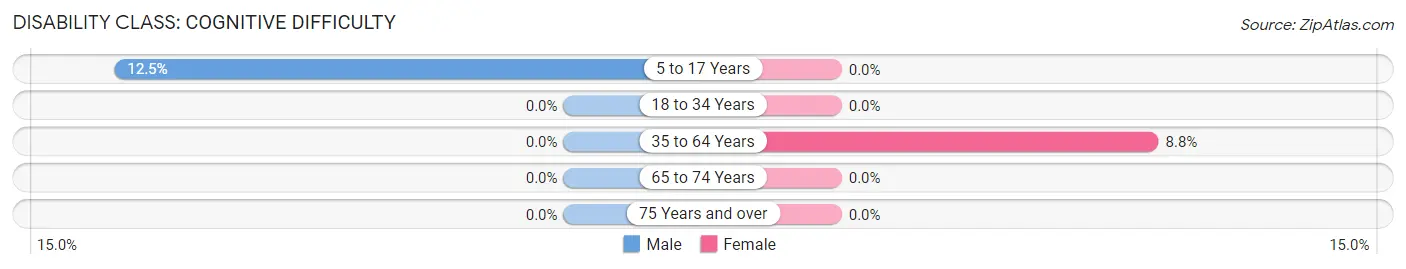
| Age Bracket | Male | Female |
| 5 to 17 Years | 2 (12.5%) | 0 (0.0%) |
| 18 to 34 Years | 0 (0.0%) | 0 (0.0%) |
| 35 to 64 Years | 0 (0.0%) | 3 (8.8%) |
| 65 to 74 Years | 0 (0.0%) | 0 (0.0%) |
| 75 Years and over | 0 (0.0%) | 0 (0.0%) |
Disability Class: Ambulatory Difficulty
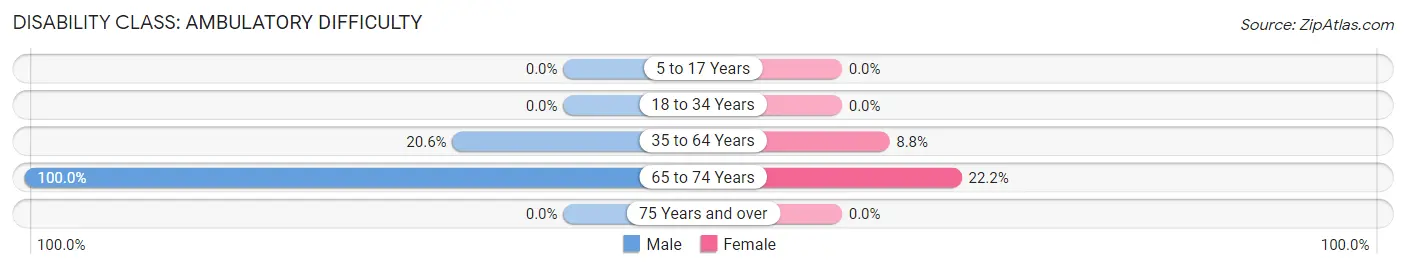
| Age Bracket | Male | Female |
| 5 to 17 Years | 0 (0.0%) | 0 (0.0%) |
| 18 to 34 Years | 0 (0.0%) | 0 (0.0%) |
| 35 to 64 Years | 7 (20.6%) | 3 (8.8%) |
| 65 to 74 Years | 3 (100.0%) | 2 (22.2%) |
| 75 Years and over | 0 (0.0%) | 0 (0.0%) |
Disability Class: Self-Care Difficulty
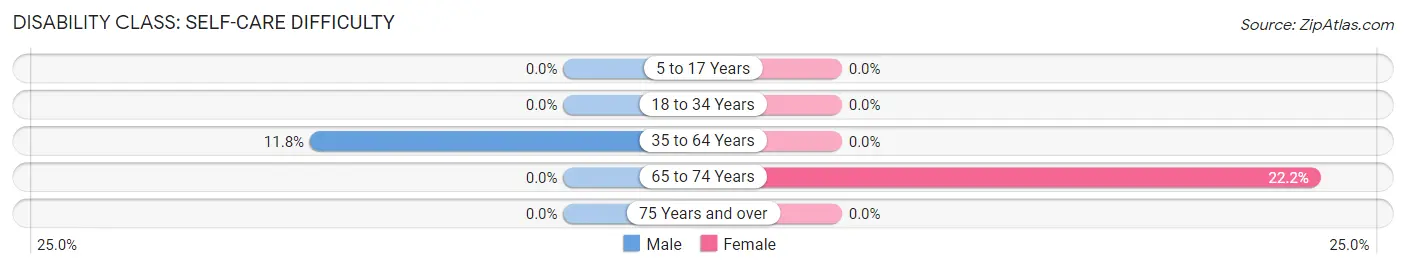
| Age Bracket | Male | Female |
| 5 to 17 Years | 0 (0.0%) | 0 (0.0%) |
| 18 to 34 Years | 0 (0.0%) | 0 (0.0%) |
| 35 to 64 Years | 4 (11.8%) | 0 (0.0%) |
| 65 to 74 Years | 0 (0.0%) | 2 (22.2%) |
| 75 Years and over | 0 (0.0%) | 0 (0.0%) |
Technology Access in Foley
Computing Device Access in Foley
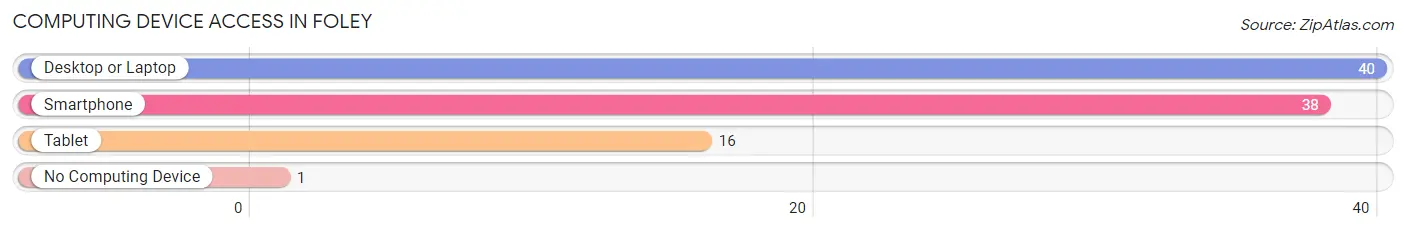
| Device Type | # Households | % Households |
| Desktop or Laptop | 40 | 93.0% |
| Smartphone | 38 | 88.4% |
| Tablet | 16 | 37.2% |
| No Computing Device | 1 | 2.3% |
| Total | 43 | 100.0% |
Internet Access in Foley
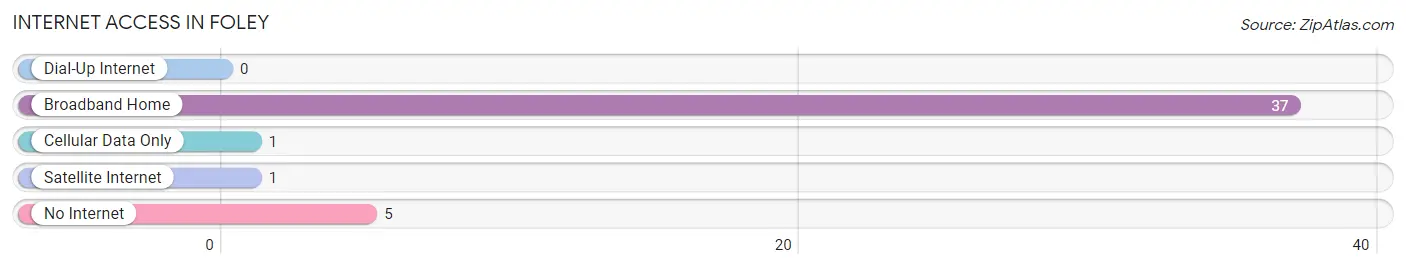
| Internet Type | # Households | % Households |
| Dial-Up Internet | 0 | 0.0% |
| Broadband Home | 37 | 86.1% |
| Cellular Data Only | 1 | 2.3% |
| Satellite Internet | 1 | 2.3% |
| No Internet | 5 | 11.6% |
| Total | 43 | 100.0% |
Foley Summary
Foley, Missouri is a small town located in the southeastern corner of the state, in St. Clair County. It is situated on the banks of the Meramec River, and is surrounded by rolling hills and farmland. The town was founded in 1883, and has a population of just over 1,000 people.
Foley is a rural community with a strong agricultural heritage. The town is home to several farms, and the surrounding area is known for its production of corn, soybeans, and hay. The town also has a small manufacturing sector, with several small businesses producing a variety of products.
The town is served by two major highways, US Route 66 and Missouri Route 13. The town is also served by a small airport, the Foley Municipal Airport.
The town has a rich history, and is home to several historic sites. The most notable of these is the Foley House, a historic home built in 1883. The house is listed on the National Register of Historic Places, and is open to the public for tours.
The town is also home to several churches, including the First Baptist Church of Foley, the Foley United Methodist Church, and the Foley Presbyterian Church.
The town is served by the St. Clair County School District, which includes two elementary schools, one middle school, and one high school. The town also has a library, a post office, and several restaurants.
The town has a median household income of $37,000, and the median home value is $90,000. The town has a low unemployment rate, and the majority of the population is employed in the agricultural and manufacturing sectors.
Foley is a small town with a rich history and a strong agricultural heritage. The town is home to several historic sites, churches, and businesses, and is served by the St. Clair County School District. The town has a median household income of $37,000, and the median home value is $90,000. The town has a low unemployment rate, and the majority of the population is employed in the agricultural and manufacturing sectors.
Common Questions
What is Per Capita Income in Foley?
Per Capita income in Foley is $16,577.
What is the Median Family Income in Foley?
Median Family Income in Foley is $35,750.
What is the Median Household income in Foley?
Median Household Income in Foley is $51,250.
What is Income or Wage Gap in Foley?
Income or Wage Gap in Foley is 46.5%.
Women in Foley earn 53.5 cents for every dollar earned by a man.
What is Inequality or Gini Index in Foley?
Inequality or Gini Index in Foley is 0.28.
What is the Total Population of Foley?
Total Population of Foley is 159.
What is the Total Male Population of Foley?
Total Male Population of Foley is 80.
What is the Total Female Population of Foley?
Total Female Population of Foley is 79.
What is the Ratio of Males per 100 Females in Foley?
There are 101.27 Males per 100 Females in Foley.
What is the Ratio of Females per 100 Males in Foley?
There are 98.75 Females per 100 Males in Foley.
What is the Median Population Age in Foley?
Median Population Age in Foley is 35.3 Years.
What is the Average Family Size in Foley
Average Family Size in Foley is 3.7 People.
What is the Average Household Size in Foley
Average Household Size in Foley is 3.7 People.
How Large is the Labor Force in Foley?
There are 67 People in the Labor Forcein in Foley.
What is the Percentage of People in the Labor Force in Foley?
58.3% of People are in the Labor Force in Foley.
What is the Unemployment Rate in Foley?
Unemployment Rate in Foley is 3.0%.