Amsterdam, MO Map & Demographics
Amsterdam Map
Amsterdam Overview
$25,097
PER CAPITA INCOME
$40,000
AVG FAMILY INCOME
$42,250
AVG HOUSEHOLD INCOME
0.29
INEQUALITY / GINI INDEX
146
TOTAL POPULATION
77
MALE POPULATION
69
FEMALE POPULATION
111.59
MALES / 100 FEMALES
89.61
FEMALES / 100 MALES
50.9
MEDIAN AGE
2.8
AVG FAMILY SIZE
1.8
AVG HOUSEHOLD SIZE
54
LABOR FORCE [ PEOPLE ]
39.7%
PERCENT IN LABOR FORCE
1.9%
UNEMPLOYMENT RATE
Amsterdam Zip Codes
Amsterdam Area Codes
Income in Amsterdam
Income Overview in Amsterdam
Per Capita Income in Amsterdam is $25,097, while median incomes of families and households are $40,000 and $42,250 respectively.
| Characteristic | Number | Measure |
| Per Capita Income | 146 | $25,097 |
| Median Family Income | 32 | $40,000 |
| Mean Family Income | 32 | $40,722 |
| Median Household Income | 80 | $42,250 |
| Mean Household Income | 80 | $44,013 |
| Income Deficit | 32 | $0 |
| Wage / Income Gap (%) | 146 | 0.00% |
| Wage / Income Gap ($) | 146 | 100.00¢ per $1 |
| Gini / Inequality Index | 146 | 0.29 |
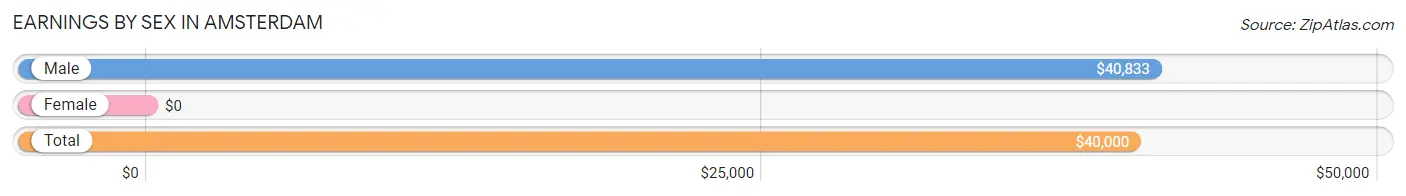
Earnings by Sex in Amsterdam
| Sex | Number | Average Earnings |
| Male | 38 (63.3%) | $40,833 |
| Female | 22 (36.7%) | $0 |
| Total | 60 (100.0%) | $40,000 |
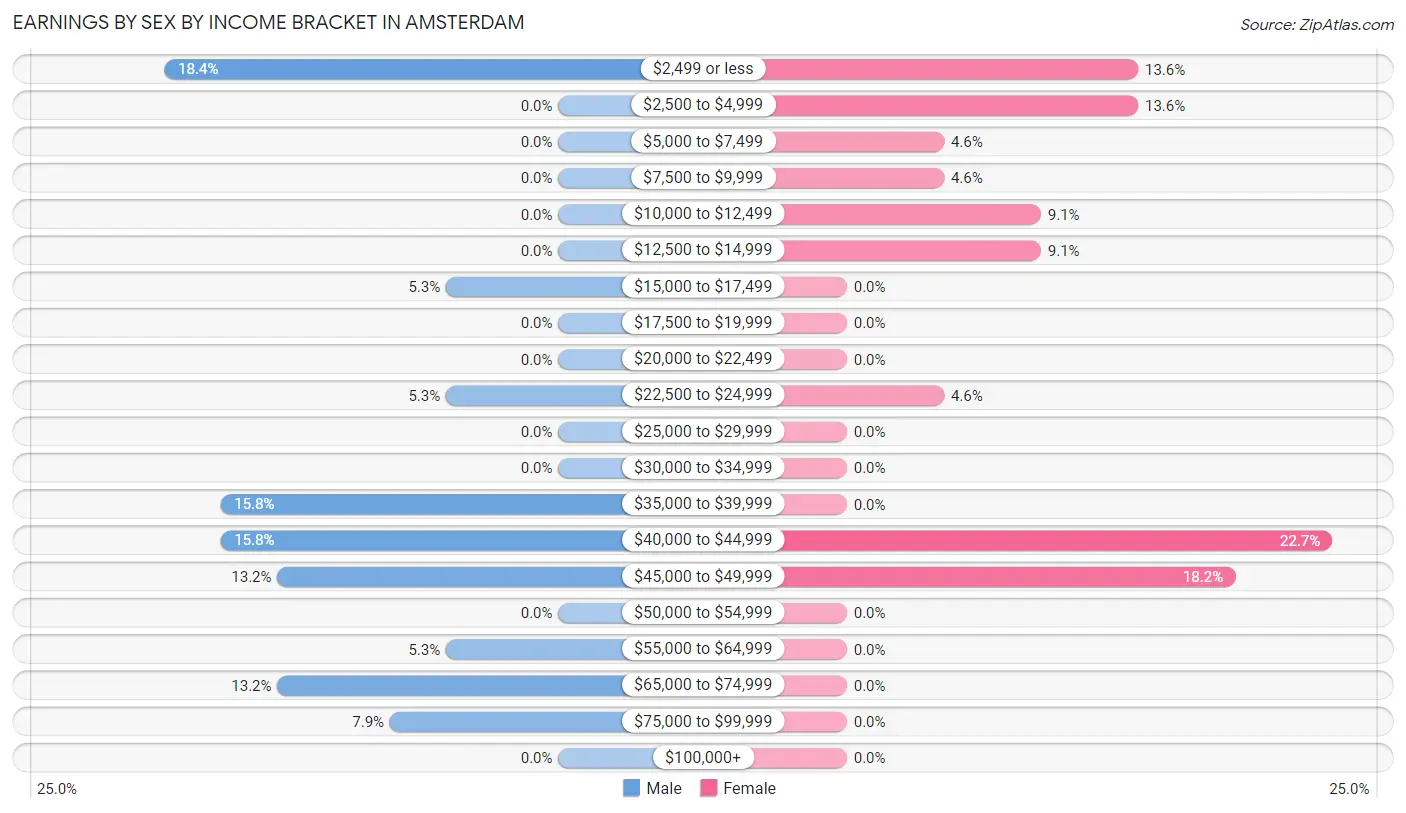
Earnings by Sex by Income Bracket in Amsterdam
The most common earnings brackets in Amsterdam are $2,499 or less for men (7 | 18.4%) and $40,000 to $44,999 for women (5 | 22.7%).
| Income | Male | Female |
| $2,499 or less | 7 (18.4%) | 3 (13.6%) |
| $2,500 to $4,999 | 0 (0.0%) | 3 (13.6%) |
| $5,000 to $7,499 | 0 (0.0%) | 1 (4.5%) |
| $7,500 to $9,999 | 0 (0.0%) | 1 (4.5%) |
| $10,000 to $12,499 | 0 (0.0%) | 2 (9.1%) |
| $12,500 to $14,999 | 0 (0.0%) | 2 (9.1%) |
| $15,000 to $17,499 | 2 (5.3%) | 0 (0.0%) |
| $17,500 to $19,999 | 0 (0.0%) | 0 (0.0%) |
| $20,000 to $22,499 | 0 (0.0%) | 0 (0.0%) |
| $22,500 to $24,999 | 2 (5.3%) | 1 (4.5%) |
| $25,000 to $29,999 | 0 (0.0%) | 0 (0.0%) |
| $30,000 to $34,999 | 0 (0.0%) | 0 (0.0%) |
| $35,000 to $39,999 | 6 (15.8%) | 0 (0.0%) |
| $40,000 to $44,999 | 6 (15.8%) | 5 (22.7%) |
| $45,000 to $49,999 | 5 (13.2%) | 4 (18.2%) |
| $50,000 to $54,999 | 0 (0.0%) | 0 (0.0%) |
| $55,000 to $64,999 | 2 (5.3%) | 0 (0.0%) |
| $65,000 to $74,999 | 5 (13.2%) | 0 (0.0%) |
| $75,000 to $99,999 | 3 (7.9%) | 0 (0.0%) |
| $100,000+ | 0 (0.0%) | 0 (0.0%) |
| Total | 38 (100.0%) | 22 (100.0%) |
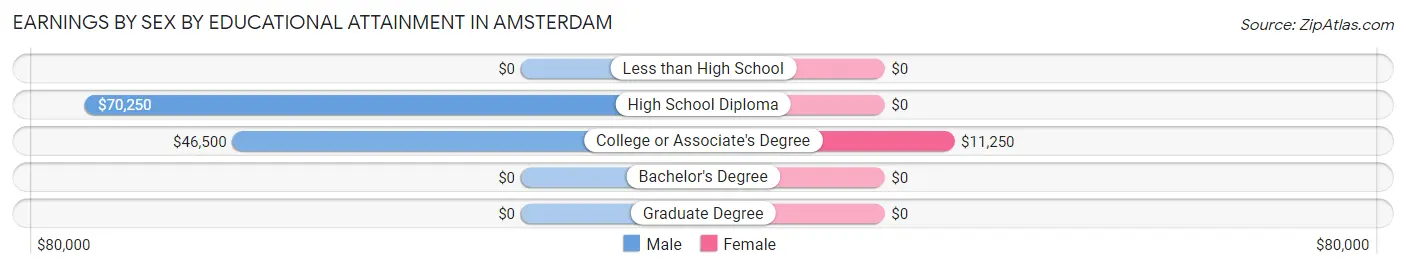
Earnings by Sex by Educational Attainment in Amsterdam
| Educational Attainment | Male Income | Female Income |
| Less than High School | - | - |
| High School Diploma | $70,250 | $0 |
| College or Associate's Degree | $46,500 | $11,250 |
| Bachelor's Degree | - | - |
| Graduate Degree | - | - |
| Total | $45,250 | $0 |
Family Income in Amsterdam
Family Income Brackets in Amsterdam
According to the Amsterdam family income data, there are 16 families falling into the $35,000 to $49,999 income range, which is the most common income bracket and makes up 50.0% of all families.
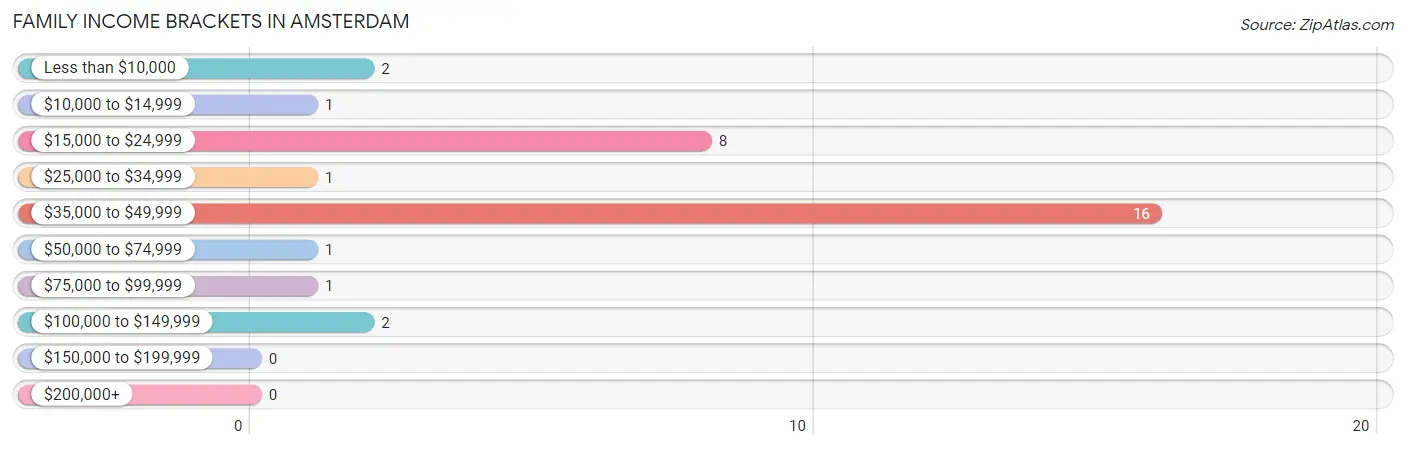
| Income Bracket | # Families | % Families |
| Less than $10,000 | 2 | 6.3% |
| $10,000 to $14,999 | 1 | 3.1% |
| $15,000 to $24,999 | 8 | 25.0% |
| $25,000 to $34,999 | 1 | 3.1% |
| $35,000 to $49,999 | 16 | 50.0% |
| $50,000 to $74,999 | 1 | 3.1% |
| $75,000 to $99,999 | 1 | 3.1% |
| $100,000 to $149,999 | 2 | 6.3% |
| $150,000 to $199,999 | 0 | 0.0% |
| $200,000+ | 0 | 0.0% |
Family Income by Famaliy Size in Amsterdam
3-person families (11 | 34.4%) account for the highest median family income in Amsterdam with $40,893 per family, while 2-person families (15 | 46.9%) have the highest median income of $19,532 per family member.
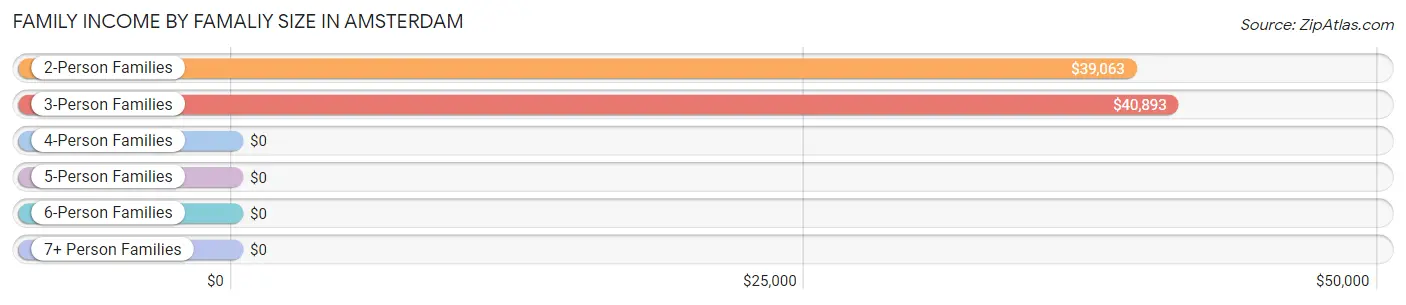
| Income Bracket | # Families | Median Income |
| 2-Person Families | 15 (46.9%) | $39,063 |
| 3-Person Families | 11 (34.4%) | $40,893 |
| 4-Person Families | 4 (12.5%) | $0 |
| 5-Person Families | 0 (0.0%) | $0 |
| 6-Person Families | 2 (6.2%) | $0 |
| 7+ Person Families | 0 (0.0%) | $0 |
| Total | 32 (100.0%) | $40,000 |
Family Income by Number of Earners in Amsterdam
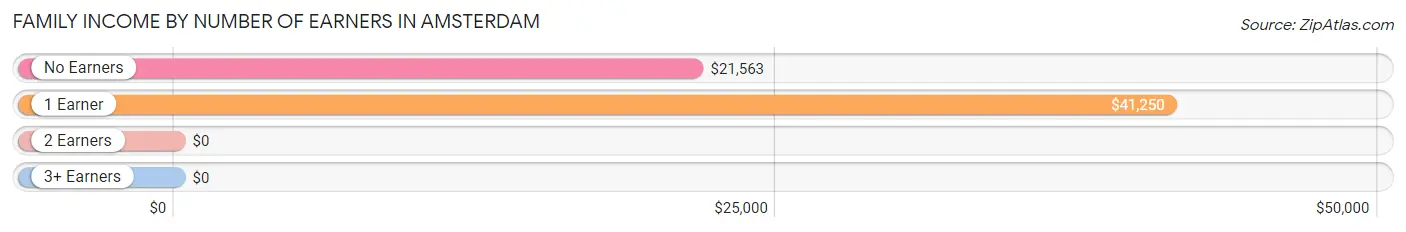
| Number of Earners | # Families | Median Income |
| No Earners | 5 (15.6%) | $21,563 |
| 1 Earner | 21 (65.6%) | $41,250 |
| 2 Earners | 4 (12.5%) | $0 |
| 3+ Earners | 2 (6.2%) | $0 |
| Total | 32 (100.0%) | $40,000 |
Household Income in Amsterdam
Household Income Brackets in Amsterdam
With 44 households falling in the category, the $35,000 to $49,999 income range is the most frequent in Amsterdam, accounting for 55.0% of all households.
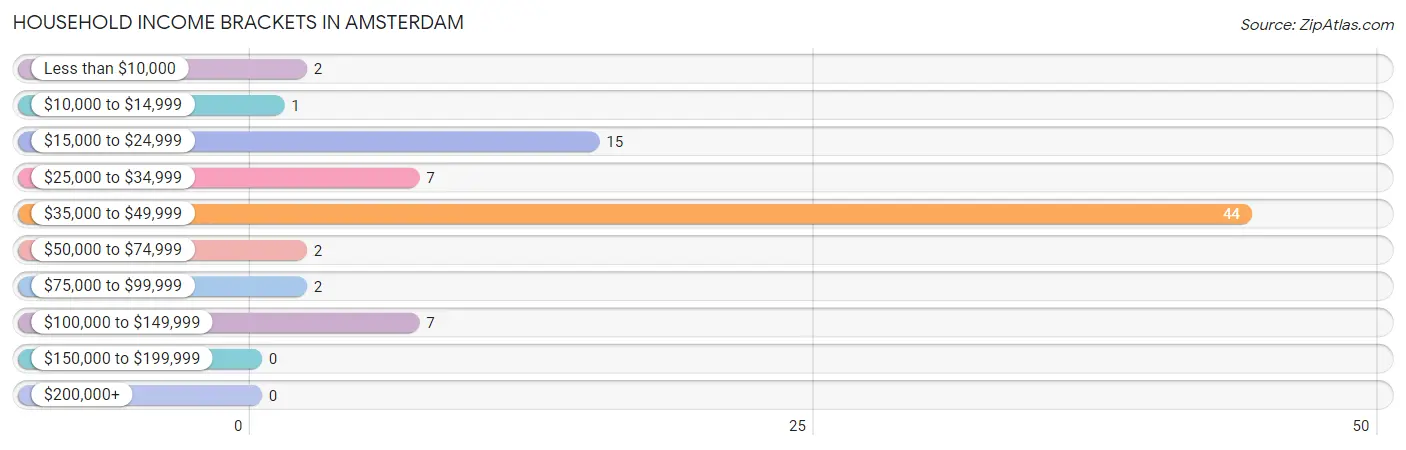
| Income Bracket | # Households | % Households |
| Less than $10,000 | 2 | 2.5% |
| $10,000 to $14,999 | 1 | 1.3% |
| $15,000 to $24,999 | 15 | 18.8% |
| $25,000 to $34,999 | 7 | 8.8% |
| $35,000 to $49,999 | 44 | 55.0% |
| $50,000 to $74,999 | 2 | 2.5% |
| $75,000 to $99,999 | 2 | 2.5% |
| $100,000 to $149,999 | 7 | 8.8% |
| $150,000 to $199,999 | 0 | 0.0% |
| $200,000+ | 0 | 0.0% |
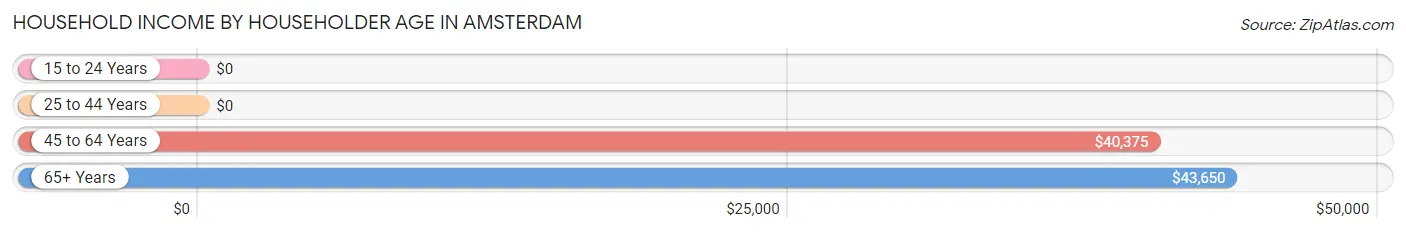
Household Income by Householder Age in Amsterdam
The median household income in Amsterdam is $42,250, with the highest median household income of $43,650 found in the 65+ years age bracket for the primary householder. A total of 37 households (46.3%) fall into this category. Meanwhile, the 15 to 24 years age bracket for the primary householder has the lowest median household income of $0, with 4 households (5.0%) in this group.
| Income Bracket | # Households | Median Income |
| 15 to 24 Years | 4 (5.0%) | $0 |
| 25 to 44 Years | 6 (7.5%) | $0 |
| 45 to 64 Years | 33 (41.2%) | $40,375 |
| 65+ Years | 37 (46.3%) | $43,650 |
| Total | 80 (100.0%) | $42,250 |
Poverty in Amsterdam
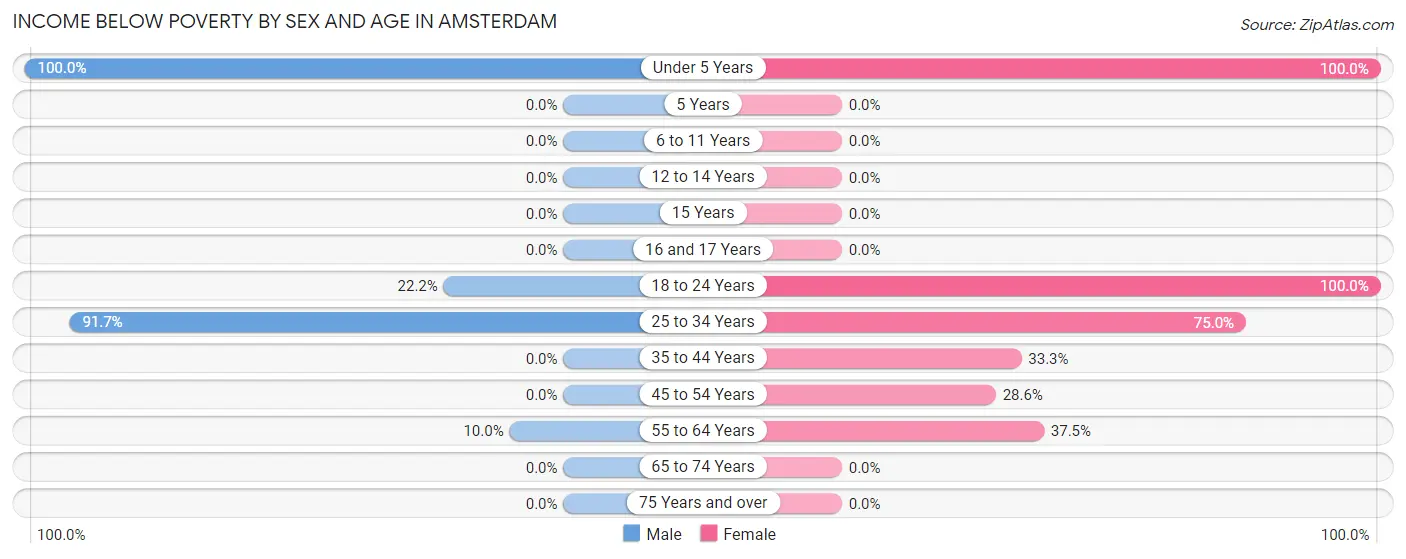
Income Below Poverty by Sex and Age in Amsterdam
With 24.7% poverty level for males and 24.6% for females among the residents of Amsterdam, under 5 year old males and under 5 year old females are the most vulnerable to poverty, with 5 males (100.0%) and 2 females (100.0%) in their respective age groups living below the poverty level.
| Age Bracket | Male | Female |
| Under 5 Years | 5 (100.0%) | 2 (100.0%) |
| 5 Years | 0 (0.0%) | 0 (0.0%) |
| 6 to 11 Years | 0 (0.0%) | 0 (0.0%) |
| 12 to 14 Years | 0 (0.0%) | 0 (0.0%) |
| 15 Years | 0 (0.0%) | 0 (0.0%) |
| 16 and 17 Years | 0 (0.0%) | 0 (0.0%) |
| 18 to 24 Years | 2 (22.2%) | 4 (100.0%) |
| 25 to 34 Years | 11 (91.7%) | 3 (75.0%) |
| 35 to 44 Years | 0 (0.0%) | 1 (33.3%) |
| 45 to 54 Years | 0 (0.0%) | 4 (28.6%) |
| 55 to 64 Years | 1 (10.0%) | 3 (37.5%) |
| 65 to 74 Years | 0 (0.0%) | 0 (0.0%) |
| 75 Years and over | 0 (0.0%) | 0 (0.0%) |
| Total | 19 (24.7%) | 17 (24.6%) |
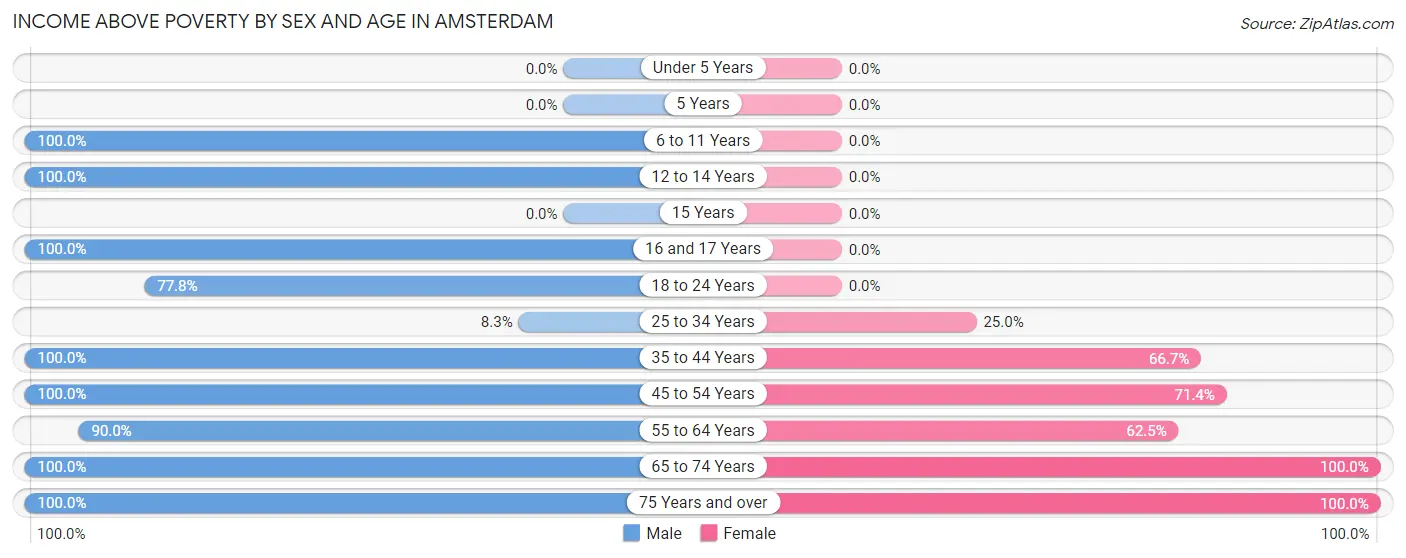
Income Above Poverty by Sex and Age in Amsterdam
According to the poverty statistics in Amsterdam, males aged 6 to 11 years and females aged 65 to 74 years are the age groups that are most secure financially, with 100.0% of males and 100.0% of females in these age groups living above the poverty line.
| Age Bracket | Male | Female |
| Under 5 Years | 0 (0.0%) | 0 (0.0%) |
| 5 Years | 0 (0.0%) | 0 (0.0%) |
| 6 to 11 Years | 2 (100.0%) | 0 (0.0%) |
| 12 to 14 Years | 1 (100.0%) | 0 (0.0%) |
| 15 Years | 0 (0.0%) | 0 (0.0%) |
| 16 and 17 Years | 3 (100.0%) | 0 (0.0%) |
| 18 to 24 Years | 7 (77.8%) | 0 (0.0%) |
| 25 to 34 Years | 1 (8.3%) | 1 (25.0%) |
| 35 to 44 Years | 4 (100.0%) | 2 (66.7%) |
| 45 to 54 Years | 23 (100.0%) | 10 (71.4%) |
| 55 to 64 Years | 9 (90.0%) | 5 (62.5%) |
| 65 to 74 Years | 6 (100.0%) | 30 (100.0%) |
| 75 Years and over | 2 (100.0%) | 4 (100.0%) |
| Total | 58 (75.3%) | 52 (75.4%) |
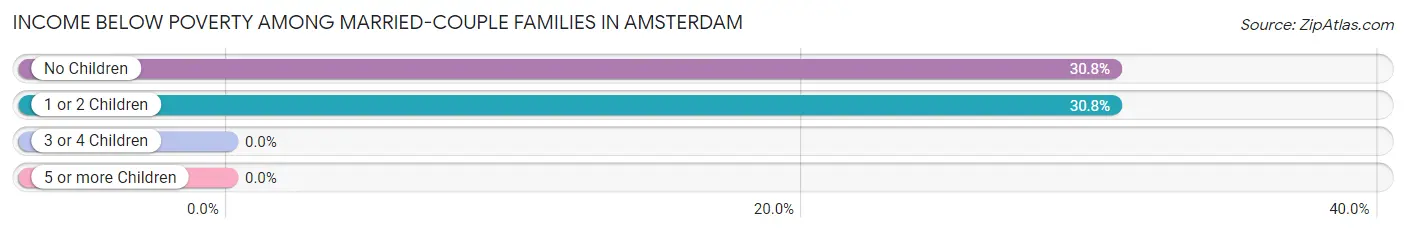
Income Below Poverty Among Married-Couple Families in Amsterdam
The poverty statistics for married-couple families in Amsterdam show that 30.8% or 8 of the total 26 families live below the poverty line. Families with no children have the highest poverty rate of 30.8%, comprising of 4 families. On the other hand, families with no children have the lowest poverty rate of 30.8%, which includes 4 families.
| Children | Above Poverty | Below Poverty |
| No Children | 9 (69.2%) | 4 (30.8%) |
| 1 or 2 Children | 9 (69.2%) | 4 (30.8%) |
| 3 or 4 Children | 0 (0.0%) | 0 (0.0%) |
| 5 or more Children | 0 (0.0%) | 0 (0.0%) |
| Total | 18 (69.2%) | 8 (30.8%) |
Income Below Poverty Among Single-Parent Households in Amsterdam
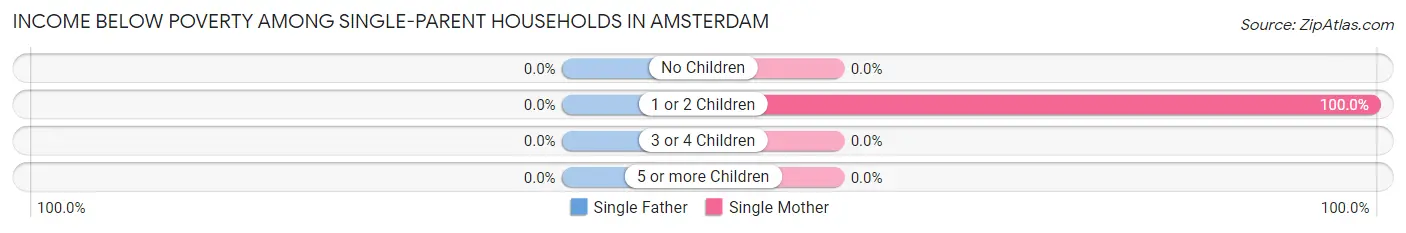
| Children | Single Father | Single Mother |
| No Children | 0 (0.0%) | 0 (0.0%) |
| 1 or 2 Children | 0 (0.0%) | 2 (100.0%) |
| 3 or 4 Children | 0 (0.0%) | 0 (0.0%) |
| 5 or more Children | 0 (0.0%) | 0 (0.0%) |
| Total | 0 (0.0%) | 2 (100.0%) |
Income Below Poverty Among Married-Couple vs Single-Parent Households in Amsterdam
The poverty data for Amsterdam shows that 8 of the married-couple family households (30.8%) and 2 of the single-parent households (33.3%) are living below the poverty level. Within the married-couple family households, those with no children have the highest poverty rate, with 4 households (30.8%) falling below the poverty line. Among the single-parent households, those with 1 or 2 children have the highest poverty rate, with 2 household (100.0%) living below poverty.
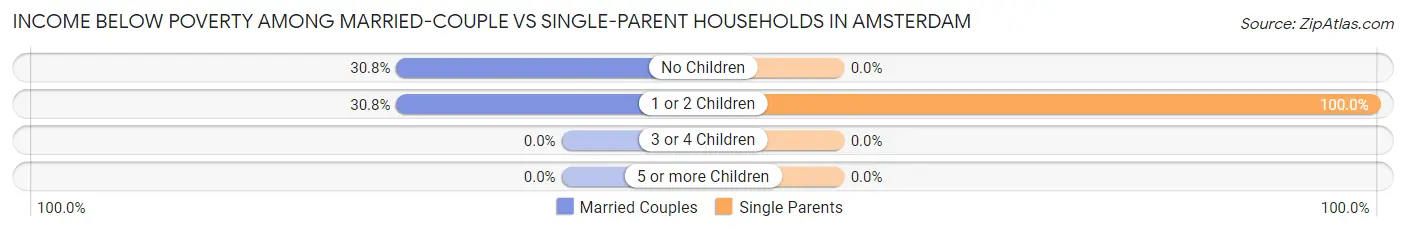
| Children | Married-Couple Families | Single-Parent Households |
| No Children | 4 (30.8%) | 0 (0.0%) |
| 1 or 2 Children | 4 (30.8%) | 2 (100.0%) |
| 3 or 4 Children | 0 (0.0%) | 0 (0.0%) |
| 5 or more Children | 0 (0.0%) | 0 (0.0%) |
| Total | 8 (30.8%) | 2 (33.3%) |
Race in Amsterdam
The most populous races in Amsterdam are White / Caucasian (144 | 98.6%), Two or more Races (2 | 1.4%), and Hispanic or Latino (1 | 0.7%).
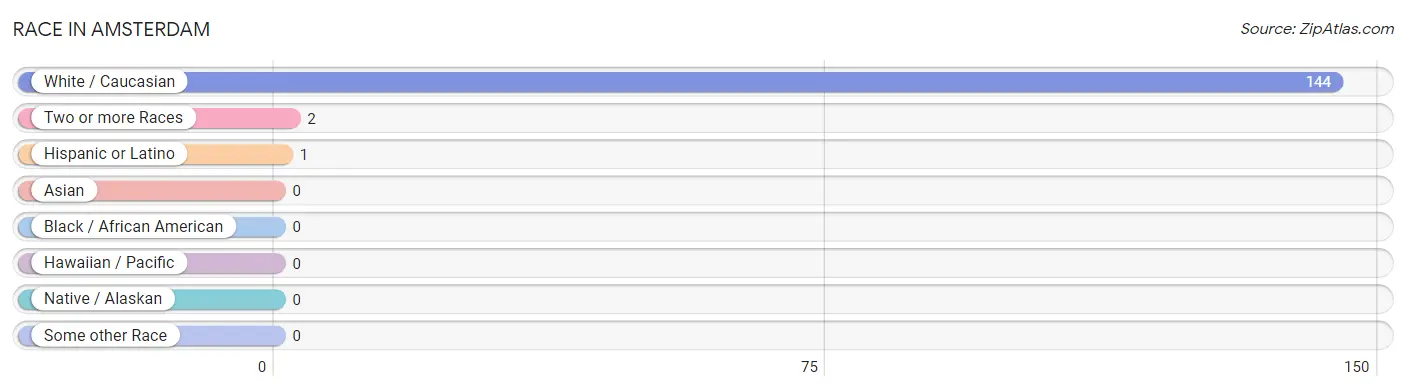
| Race | # Population | % Population |
| Asian | 0 | 0.0% |
| Black / African American | 0 | 0.0% |
| Hawaiian / Pacific | 0 | 0.0% |
| Hispanic or Latino | 1 | 0.7% |
| Native / Alaskan | 0 | 0.0% |
| White / Caucasian | 144 | 98.6% |
| Two or more Races | 2 | 1.4% |
| Some other Race | 0 | 0.0% |
| Total | 146 | 100.0% |
Ancestry in Amsterdam
The most populous ancestries reported in Amsterdam are Irish (45 | 30.8%), German (33 | 22.6%), American (23 | 15.8%), Norwegian (14 | 9.6%), and English (7 | 4.8%), together accounting for 83.5% of all Amsterdam residents.
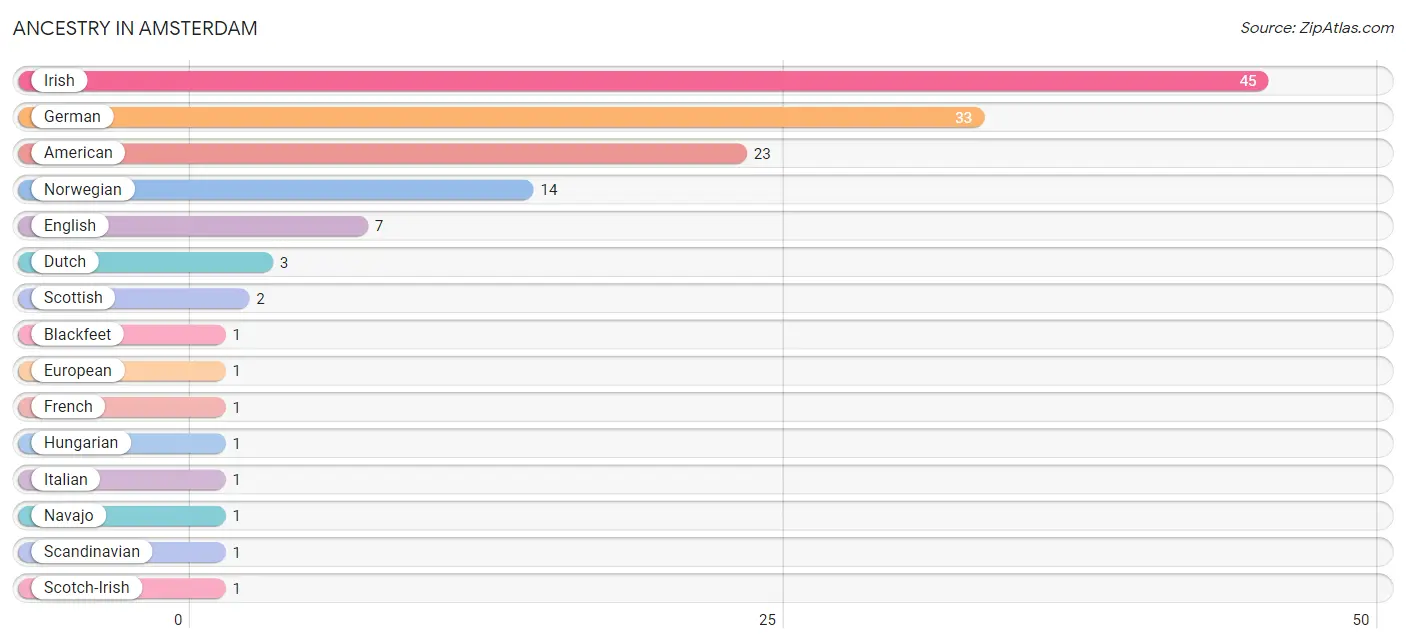
| Ancestry | # Population | % Population |
| American | 23 | 15.8% |
| Blackfeet | 1 | 0.7% |
| Dutch | 3 | 2.1% |
| English | 7 | 4.8% |
| European | 1 | 0.7% |
| French | 1 | 0.7% |
| German | 33 | 22.6% |
| Hungarian | 1 | 0.7% |
| Irish | 45 | 30.8% |
| Italian | 1 | 0.7% |
| Navajo | 1 | 0.7% |
| Norwegian | 14 | 9.6% |
| Scandinavian | 1 | 0.7% |
| Scotch-Irish | 1 | 0.7% |
| Scottish | 2 | 1.4% |
| Spanish | 1 | 0.7% | View All 16 Rows |
Immigrants in Amsterdam

| Immigration Origin | # Population | % Population | View All 0 Rows |
Sex and Age in Amsterdam
Sex and Age in Amsterdam
The most populous age groups in Amsterdam are 50 to 54 Years (14 | 18.2%) for men and 65 to 69 Years (25 | 36.2%) for women.
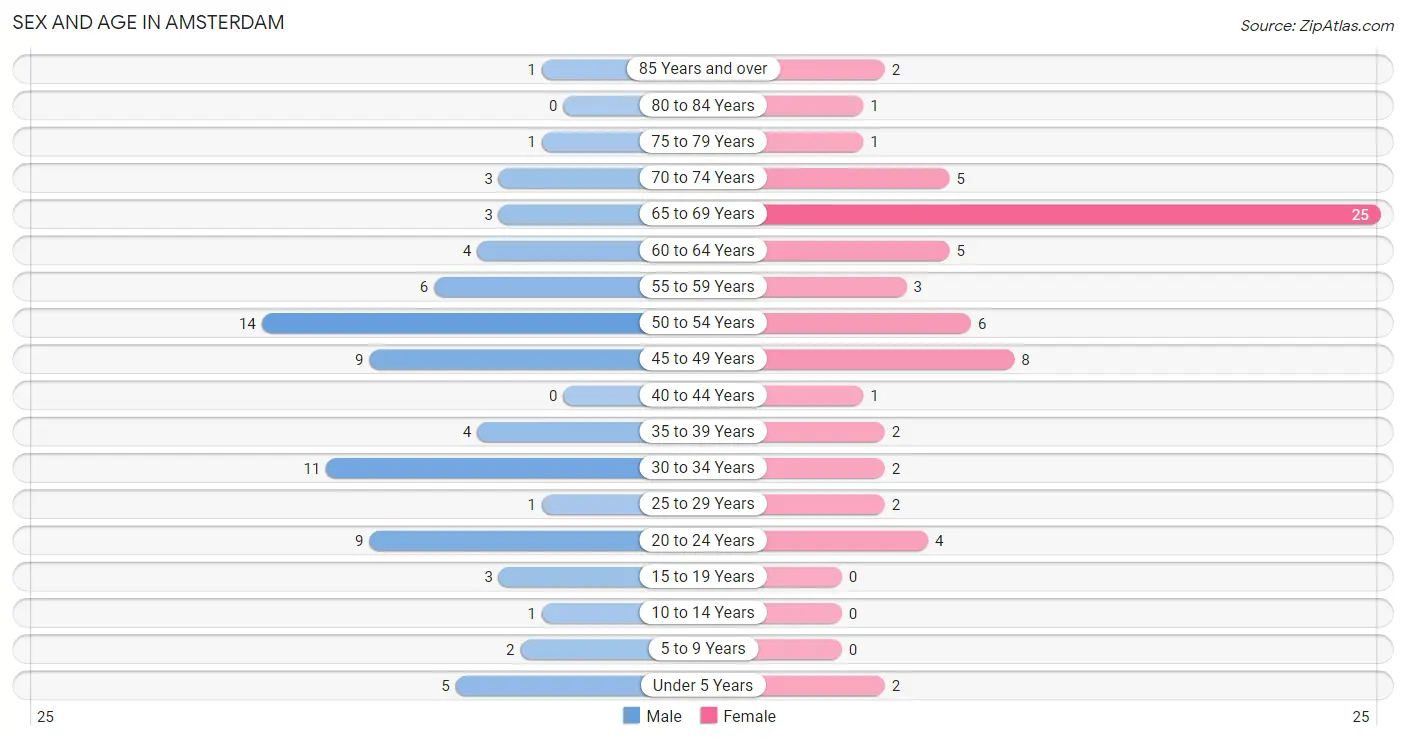
| Age Bracket | Male | Female |
| Under 5 Years | 5 (6.5%) | 2 (2.9%) |
| 5 to 9 Years | 2 (2.6%) | 0 (0.0%) |
| 10 to 14 Years | 1 (1.3%) | 0 (0.0%) |
| 15 to 19 Years | 3 (3.9%) | 0 (0.0%) |
| 20 to 24 Years | 9 (11.7%) | 4 (5.8%) |
| 25 to 29 Years | 1 (1.3%) | 2 (2.9%) |
| 30 to 34 Years | 11 (14.3%) | 2 (2.9%) |
| 35 to 39 Years | 4 (5.2%) | 2 (2.9%) |
| 40 to 44 Years | 0 (0.0%) | 1 (1.5%) |
| 45 to 49 Years | 9 (11.7%) | 8 (11.6%) |
| 50 to 54 Years | 14 (18.2%) | 6 (8.7%) |
| 55 to 59 Years | 6 (7.8%) | 3 (4.3%) |
| 60 to 64 Years | 4 (5.2%) | 5 (7.2%) |
| 65 to 69 Years | 3 (3.9%) | 25 (36.2%) |
| 70 to 74 Years | 3 (3.9%) | 5 (7.2%) |
| 75 to 79 Years | 1 (1.3%) | 1 (1.5%) |
| 80 to 84 Years | 0 (0.0%) | 1 (1.5%) |
| 85 Years and over | 1 (1.3%) | 2 (2.9%) |
| Total | 77 (100.0%) | 69 (100.0%) |
Families and Households in Amsterdam
Median Family Size in Amsterdam
The median family size in Amsterdam is 2.84 persons per family, with married-couple families (26 | 81.2%) accounting for the largest median family size of 2.92 persons per family. On the other hand, single female/mother families (2 | 6.2%) represent the smallest median family size with 2.00 persons per family.
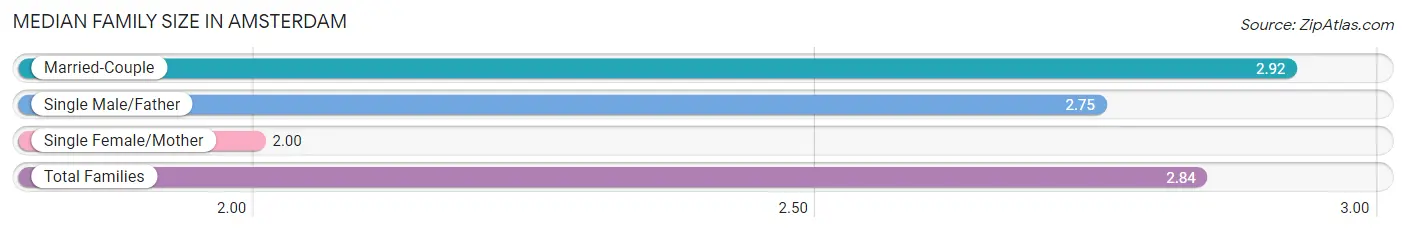
| Family Type | # Families | Family Size |
| Married-Couple | 26 (81.2%) | 2.92 |
| Single Male/Father | 4 (12.5%) | 2.75 |
| Single Female/Mother | 2 (6.2%) | 2.00 |
| Total Families | 32 (100.0%) | 2.84 |
Median Household Size in Amsterdam
The median household size in Amsterdam is 1.83 persons per household, with married-couple households (26 | 32.5%) accounting for the largest median household size of 2.92 persons per household. non-family households (48 | 60.0%) represent the smallest median household size with 1.15 persons per household.
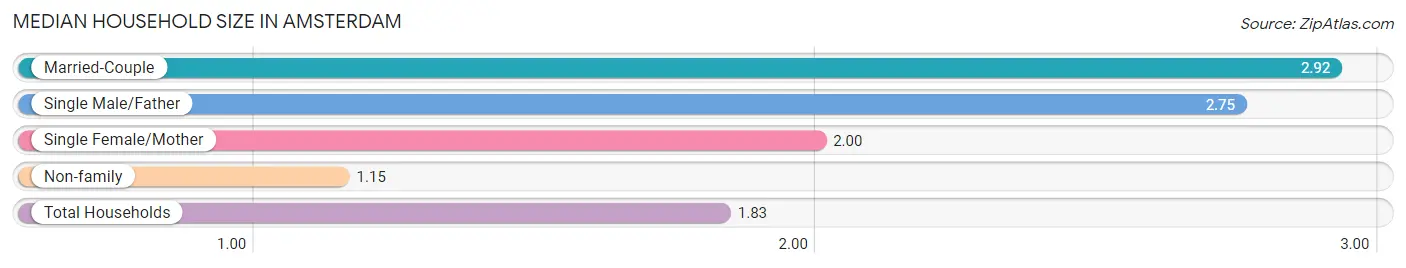
| Household Type | # Households | Household Size |
| Married-Couple | 26 (32.5%) | 2.92 |
| Single Male/Father | 4 (5.0%) | 2.75 |
| Single Female/Mother | 2 (2.5%) | 2.00 |
| Non-family | 48 (60.0%) | 1.15 |
| Total Households | 80 (100.0%) | 1.83 |
Household Size by Marriage Status in Amsterdam
Out of a total of 80 households in Amsterdam, 32 (40.0%) are family households, while 48 (60.0%) are nonfamily households. The most numerous type of family households are 2-person households, comprising 15, and the most common type of nonfamily households are 1-person households, comprising 42.
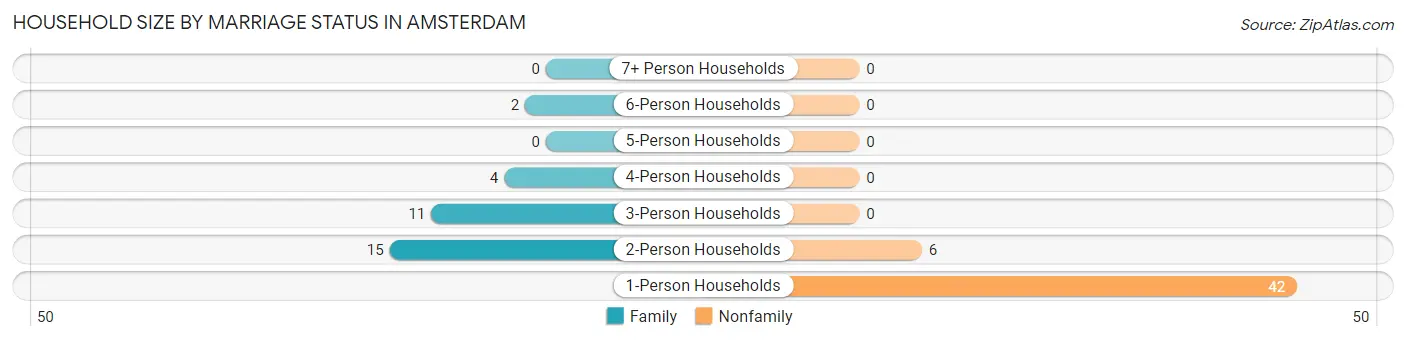
| Household Size | Family Households | Nonfamily Households |
| 1-Person Households | - | 42 (52.5%) |
| 2-Person Households | 15 (18.8%) | 6 (7.5%) |
| 3-Person Households | 11 (13.8%) | 0 (0.0%) |
| 4-Person Households | 4 (5.0%) | 0 (0.0%) |
| 5-Person Households | 0 (0.0%) | 0 (0.0%) |
| 6-Person Households | 2 (2.5%) | 0 (0.0%) |
| 7+ Person Households | 0 (0.0%) | 0 (0.0%) |
| Total | 32 (40.0%) | 48 (60.0%) |
Female Fertility in Amsterdam
Fertility by Age in Amsterdam
Average fertility rate in Amsterdam is 200.0 births per 1,000 women. Women in the age bracket of 20 to 34 years have the highest fertility rate with 500.0 births per 1,000 women. Women in the age bracket of 20 to 34 years acount for 100.0% of all women with births.
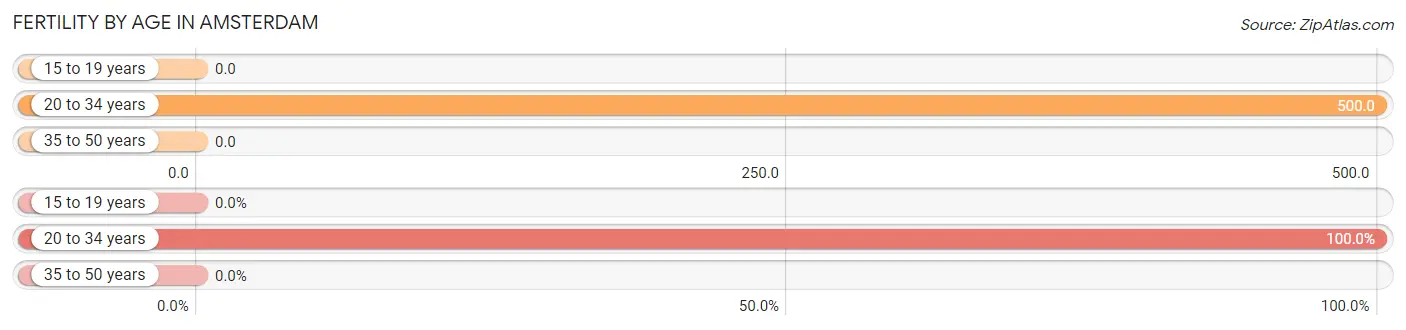
| Age Bracket | Women with Births | Births / 1,000 Women |
| 15 to 19 years | 0 (0.0%) | 0.0 |
| 20 to 34 years | 4 (100.0%) | 500.0 |
| 35 to 50 years | 0 (0.0%) | 0.0 |
| Total | 4 (100.0%) | 200.0 |
Fertility by Age by Marriage Status in Amsterdam
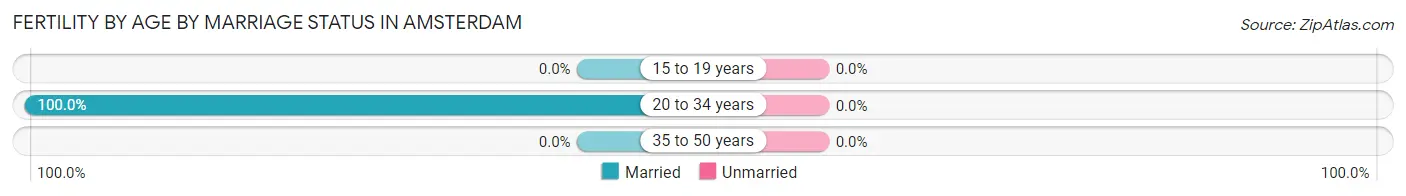
| Age Bracket | Married | Unmarried |
| 15 to 19 years | 0 (0.0%) | 0 (0.0%) |
| 20 to 34 years | 4 (100.0%) | 0 (0.0%) |
| 35 to 50 years | 0 (0.0%) | 0 (0.0%) |
| Total | 4 (100.0%) | 0 (0.0%) |
Fertility by Education in Amsterdam
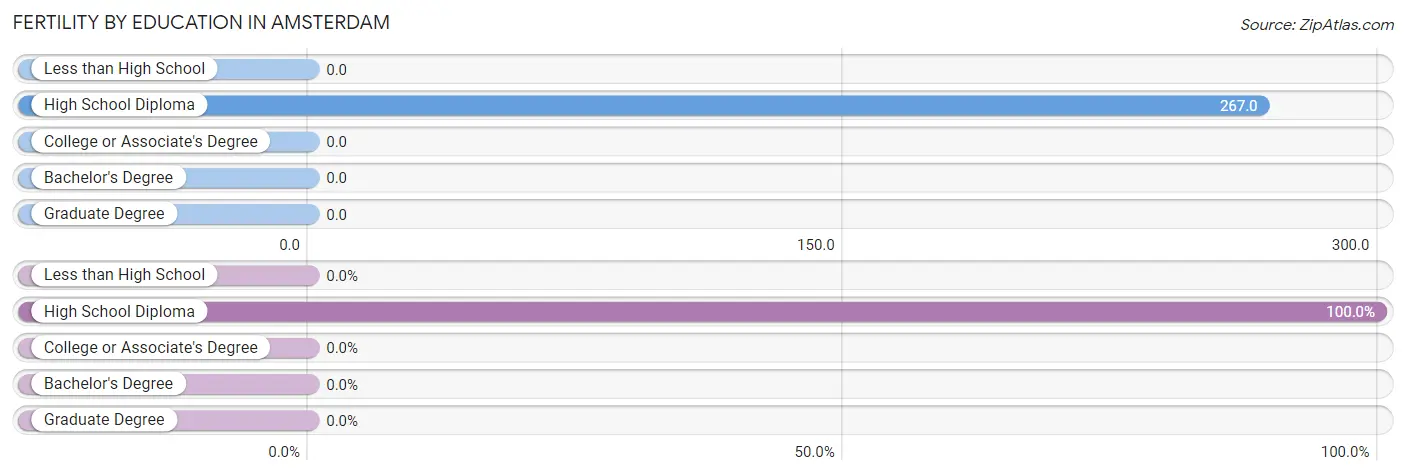
| Educational Attainment | Women with Births | Births / 1,000 Women |
| Less than High School | 0 (0.0%) | 0.0 |
| High School Diploma | 4 (100.0%) | 267.0 |
| College or Associate's Degree | 0 (0.0%) | 0.0 |
| Bachelor's Degree | 0 (0.0%) | 0.0 |
| Graduate Degree | 0 (0.0%) | 0.0 |
| Total | 4 (100.0%) | 200.0 |
Fertility by Education by Marriage Status in Amsterdam
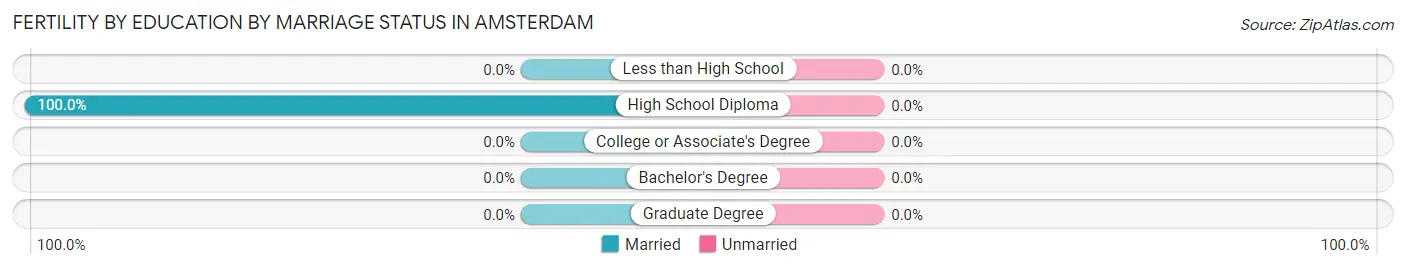
| Educational Attainment | Married | Unmarried |
| Less than High School | 0 (0.0%) | 0 (0.0%) |
| High School Diploma | 4 (100.0%) | 0 (0.0%) |
| College or Associate's Degree | 0 (0.0%) | 0 (0.0%) |
| Bachelor's Degree | 0 (0.0%) | 0 (0.0%) |
| Graduate Degree | 0 (0.0%) | 0 (0.0%) |
| Total | 4 (100.0%) | 0 (0.0%) |
Employment Characteristics in Amsterdam
Employment by Class of Employer in Amsterdam
Among the 49 employed individuals in Amsterdam, private company employees (45 | 91.8%), state government employees (3 | 6.1%), and local government employees (1 | 2.0%) make up the most common classes of employment.
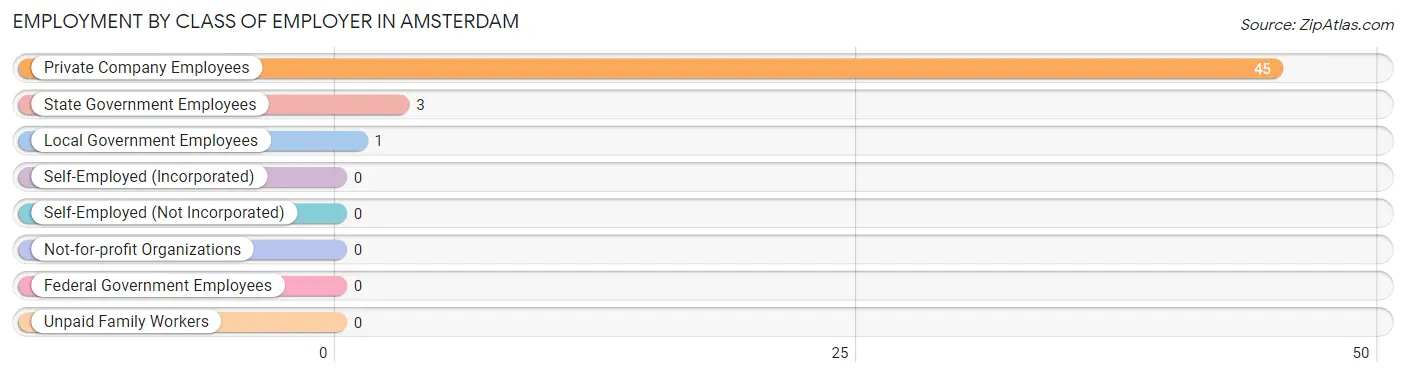
| Employer Class | # Employees | % Employees |
| Private Company Employees | 45 | 91.8% |
| Self-Employed (Incorporated) | 0 | 0.0% |
| Self-Employed (Not Incorporated) | 0 | 0.0% |
| Not-for-profit Organizations | 0 | 0.0% |
| Local Government Employees | 1 | 2.0% |
| State Government Employees | 3 | 6.1% |
| Federal Government Employees | 0 | 0.0% |
| Unpaid Family Workers | 0 | 0.0% |
| Total | 49 | 100.0% |
Employment Status by Age in Amsterdam
According to the labor force statistics for Amsterdam, out of the total population over 16 years of age (136), 39.7% or 54 individuals are in the labor force, with 1.9% or 1 of them unemployed. The age group with the highest labor force participation rate is 25 to 29 years, with 100.0% or 3 individuals in the labor force. Within the labor force, the 25 to 29 years age range has the highest percentage of unemployed individuals, with 33.3% or 1 of them being unemployed.
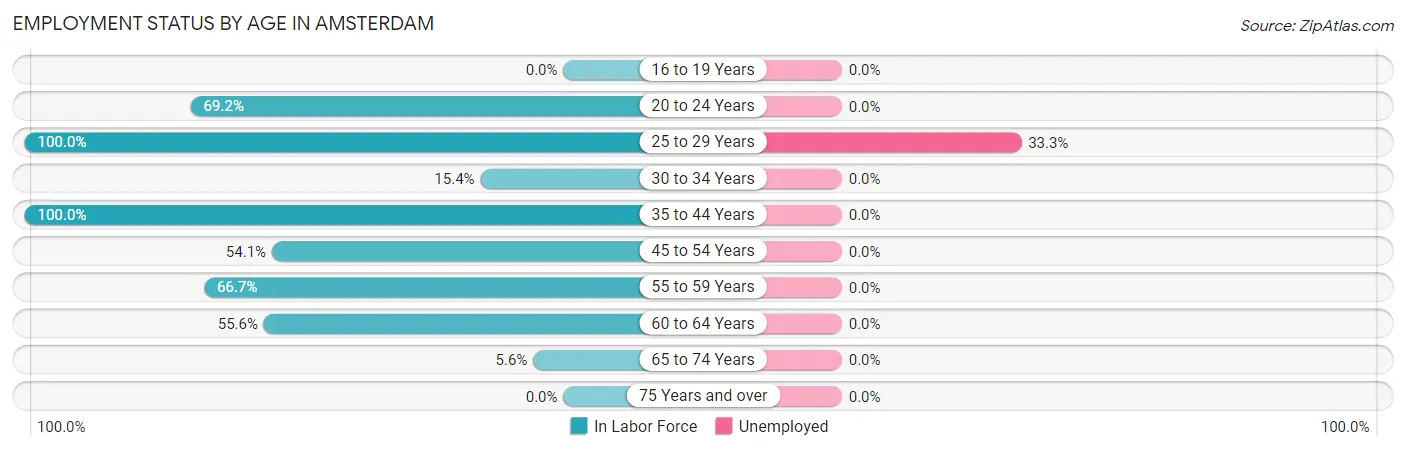
| Age Bracket | In Labor Force | Unemployed |
| 16 to 19 Years | 0 (0.0%) | 0 (0.0%) |
| 20 to 24 Years | 9 (69.2%) | 0 (0.0%) |
| 25 to 29 Years | 3 (100.0%) | 1 (33.3%) |
| 30 to 34 Years | 2 (15.4%) | 0 (0.0%) |
| 35 to 44 Years | 7 (100.0%) | 0 (0.0%) |
| 45 to 54 Years | 20 (54.1%) | 0 (0.0%) |
| 55 to 59 Years | 6 (66.7%) | 0 (0.0%) |
| 60 to 64 Years | 5 (55.6%) | 0 (0.0%) |
| 65 to 74 Years | 2 (5.6%) | 0 (0.0%) |
| 75 Years and over | 0 (0.0%) | 0 (0.0%) |
| Total | 54 (39.7%) | 1 (1.9%) |
Employment Status by Educational Attainment in Amsterdam
According to labor force statistics for Amsterdam, 55.1% of individuals (43) out of the total population between 25 and 64 years of age (78) are in the labor force, with 2.3% or 1 of them being unemployed. The group with the highest labor force participation rate are those with the educational attainment of bachelor's degree or higher, with 100.0% or 2 individuals in the labor force. Within the labor force, individuals with college / associate degree education have the highest percentage of unemployment, with 6.3% or 1 of them being unemployed.
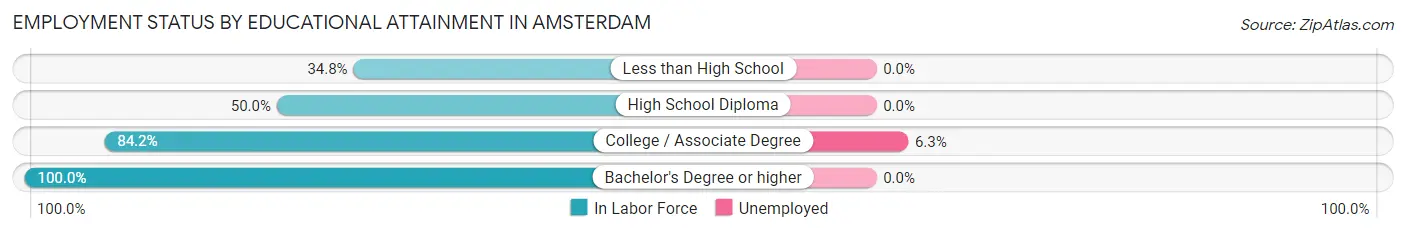
| Educational Attainment | In Labor Force | Unemployed |
| Less than High School | 8 (34.8%) | 0 (0.0%) |
| High School Diploma | 17 (50.0%) | 0 (0.0%) |
| College / Associate Degree | 16 (84.2%) | 1 (6.3%) |
| Bachelor's Degree or higher | 2 (100.0%) | 0 (0.0%) |
| Total | 43 (55.1%) | 2 (2.3%) |
Employment Occupations by Sex in Amsterdam
Management, Business, Science and Arts Occupations
The most common Management, Business, Science and Arts occupations in Amsterdam are Management (5 | 9.4%), Community & Social Service (2 | 3.8%), and Arts, Media & Entertainment (2 | 3.8%).
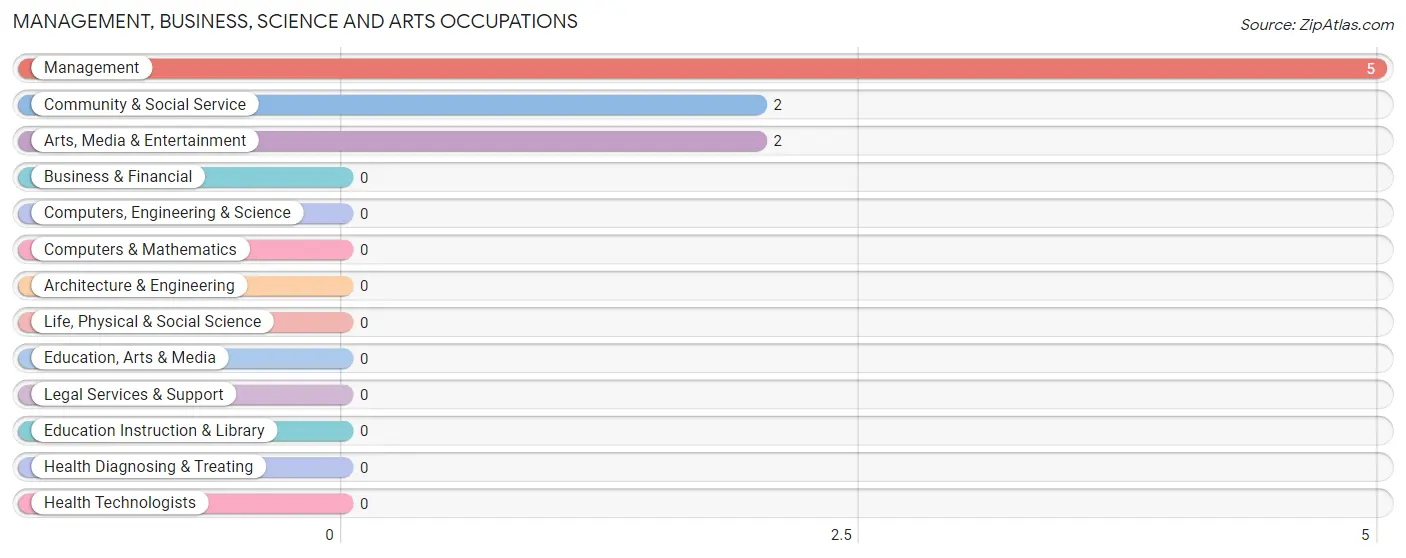
Management, Business, Science and Arts Occupations by Sex
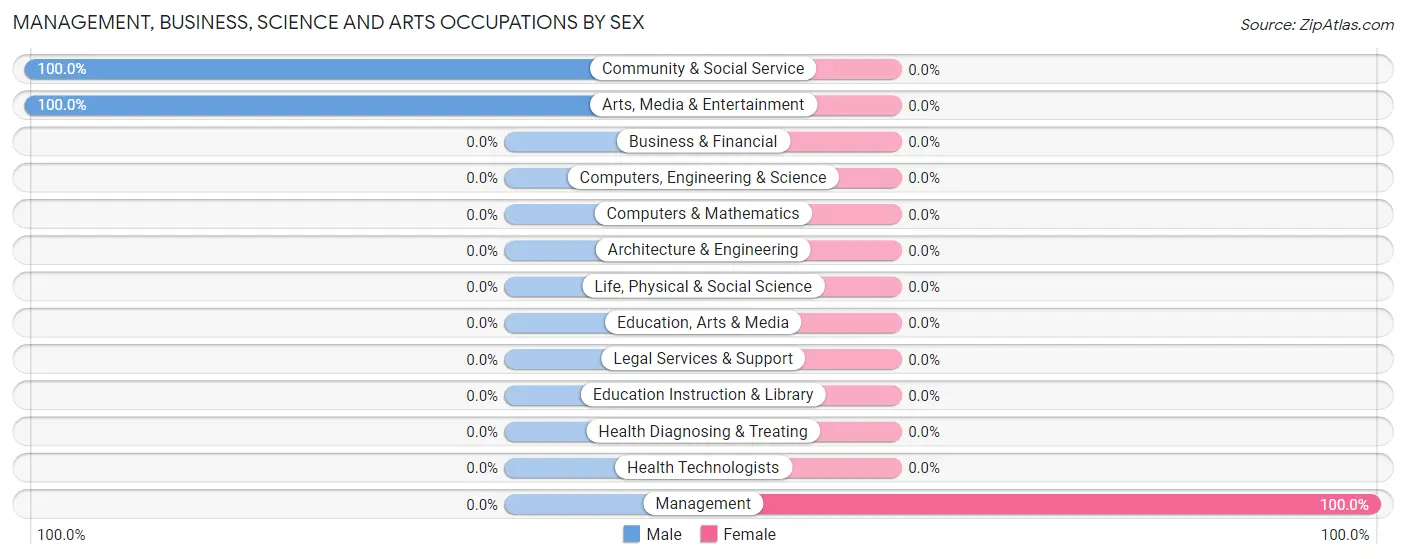
| Occupation | Male | Female |
| Management | 0 (0.0%) | 5 (100.0%) |
| Business & Financial | 0 (0.0%) | 0 (0.0%) |
| Computers, Engineering & Science | 0 (0.0%) | 0 (0.0%) |
| Computers & Mathematics | 0 (0.0%) | 0 (0.0%) |
| Architecture & Engineering | 0 (0.0%) | 0 (0.0%) |
| Life, Physical & Social Science | 0 (0.0%) | 0 (0.0%) |
| Community & Social Service | 2 (100.0%) | 0 (0.0%) |
| Education, Arts & Media | 0 (0.0%) | 0 (0.0%) |
| Legal Services & Support | 0 (0.0%) | 0 (0.0%) |
| Education Instruction & Library | 0 (0.0%) | 0 (0.0%) |
| Arts, Media & Entertainment | 2 (100.0%) | 0 (0.0%) |
| Health Diagnosing & Treating | 0 (0.0%) | 0 (0.0%) |
| Health Technologists | 0 (0.0%) | 0 (0.0%) |
| Total (Category) | 2 (28.6%) | 5 (71.4%) |
| Total (Overall) | 38 (71.7%) | 15 (28.3%) |
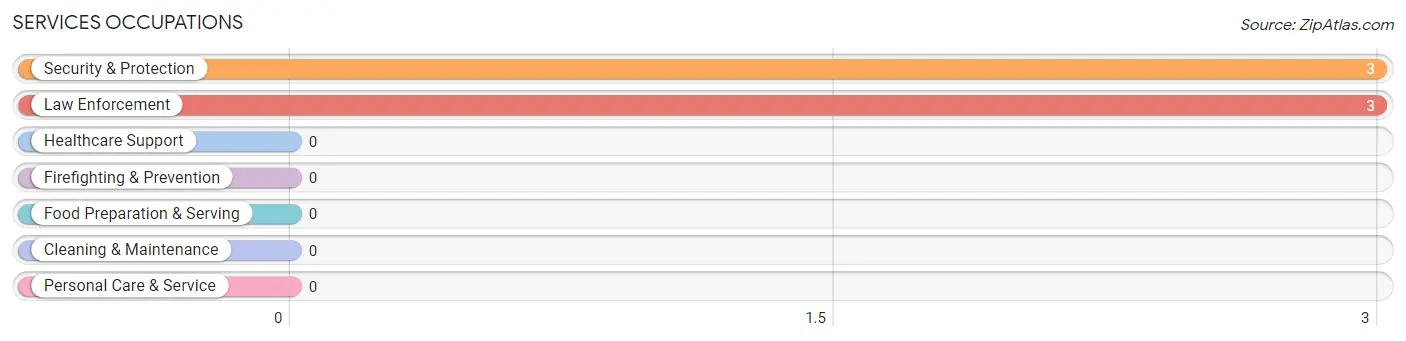
Services Occupations
The most common Services occupations in Amsterdam are Security & Protection (3 | 5.7%), and Law Enforcement (3 | 5.7%).
Services Occupations by Sex
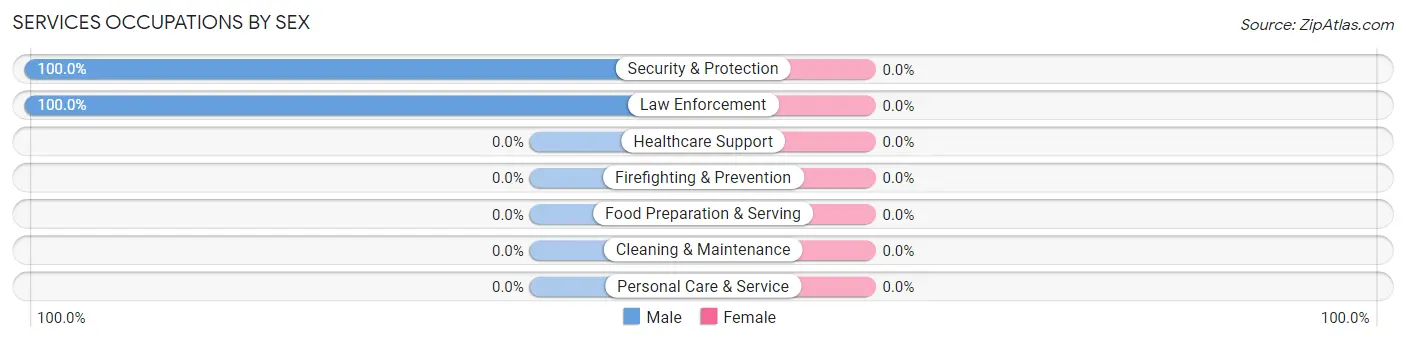
| Occupation | Male | Female |
| Healthcare Support | 0 (0.0%) | 0 (0.0%) |
| Security & Protection | 3 (100.0%) | 0 (0.0%) |
| Firefighting & Prevention | 0 (0.0%) | 0 (0.0%) |
| Law Enforcement | 3 (100.0%) | 0 (0.0%) |
| Food Preparation & Serving | 0 (0.0%) | 0 (0.0%) |
| Cleaning & Maintenance | 0 (0.0%) | 0 (0.0%) |
| Personal Care & Service | 0 (0.0%) | 0 (0.0%) |
| Total (Category) | 3 (100.0%) | 0 (0.0%) |
| Total (Overall) | 38 (71.7%) | 15 (28.3%) |
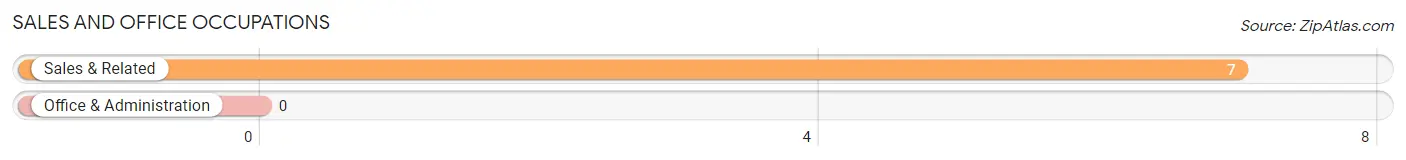
Sales and Office Occupations
The most common Sales and Office occupations in Amsterdam are , and Sales & Related (7 | 13.2%).
Sales and Office Occupations by Sex
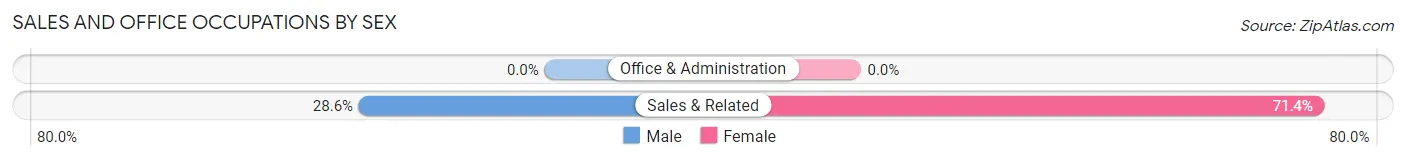
| Occupation | Male | Female |
| Sales & Related | 2 (28.6%) | 5 (71.4%) |
| Office & Administration | 0 (0.0%) | 0 (0.0%) |
| Total (Category) | 2 (28.6%) | 5 (71.4%) |
| Total (Overall) | 38 (71.7%) | 15 (28.3%) |
Natural Resources, Construction and Maintenance Occupations
The most common Natural Resources, Construction and Maintenance occupations in Amsterdam are Installation, Maintenance & Repair (10 | 18.9%), and Construction & Extraction (3 | 5.7%).
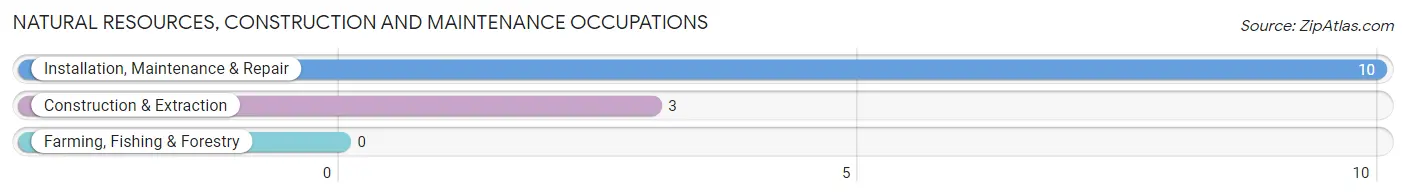
Natural Resources, Construction and Maintenance Occupations by Sex

| Occupation | Male | Female |
| Farming, Fishing & Forestry | 0 (0.0%) | 0 (0.0%) |
| Construction & Extraction | 3 (100.0%) | 0 (0.0%) |
| Installation, Maintenance & Repair | 10 (100.0%) | 0 (0.0%) |
| Total (Category) | 13 (100.0%) | 0 (0.0%) |
| Total (Overall) | 38 (71.7%) | 15 (28.3%) |
Production, Transportation and Moving Occupations
The most common Production, Transportation and Moving occupations in Amsterdam are Material Moving (12 | 22.6%), Transportation (8 | 15.1%), and Production (3 | 5.7%).
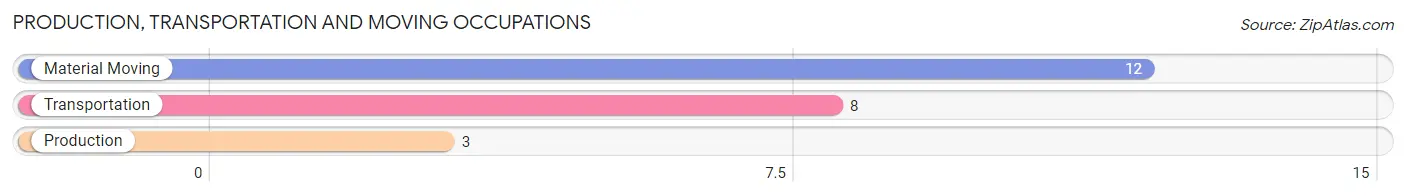
Production, Transportation and Moving Occupations by Sex
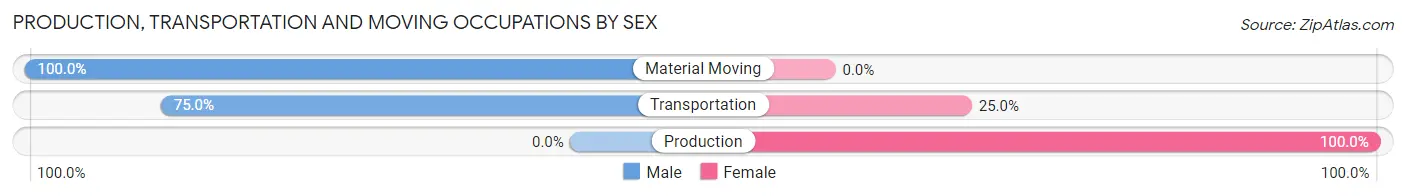
| Occupation | Male | Female |
| Production | 0 (0.0%) | 3 (100.0%) |
| Transportation | 6 (75.0%) | 2 (25.0%) |
| Material Moving | 12 (100.0%) | 0 (0.0%) |
| Total (Category) | 18 (78.3%) | 5 (21.7%) |
| Total (Overall) | 38 (71.7%) | 15 (28.3%) |
Employment Industries by Sex in Amsterdam
Employment Industries in Amsterdam
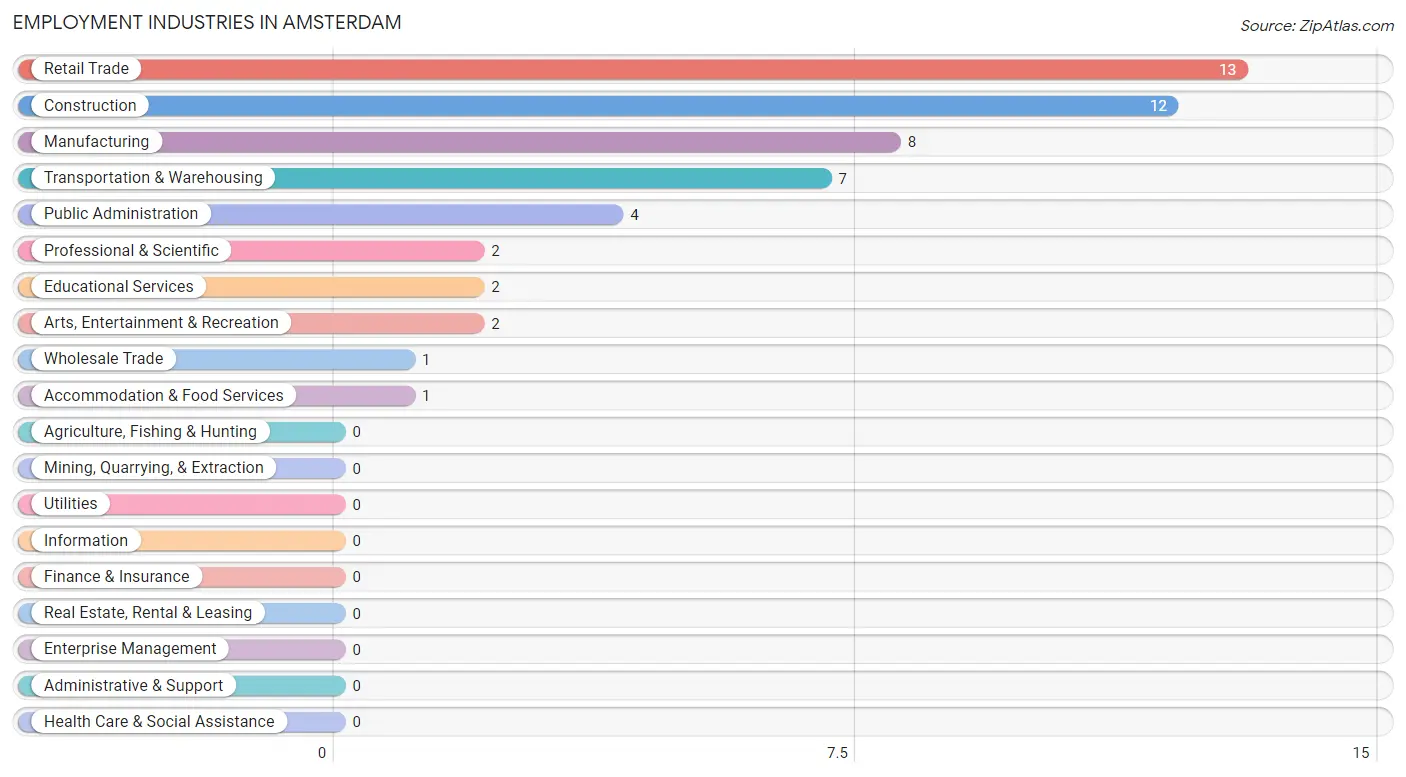
The major employment industries in Amsterdam include Retail Trade (13 | 24.5%), Construction (12 | 22.6%), Manufacturing (8 | 15.1%), Transportation & Warehousing (7 | 13.2%), and Public Administration (4 | 7.5%).
Employment Industries by Sex in Amsterdam
The Amsterdam industries that see more men than women are Construction (100.0%), Transportation & Warehousing (100.0%), and Arts, Entertainment & Recreation (100.0%), whereas the industries that tend to have a higher number of women are Wholesale Trade (100.0%), Professional & Scientific (100.0%), and Educational Services (100.0%).
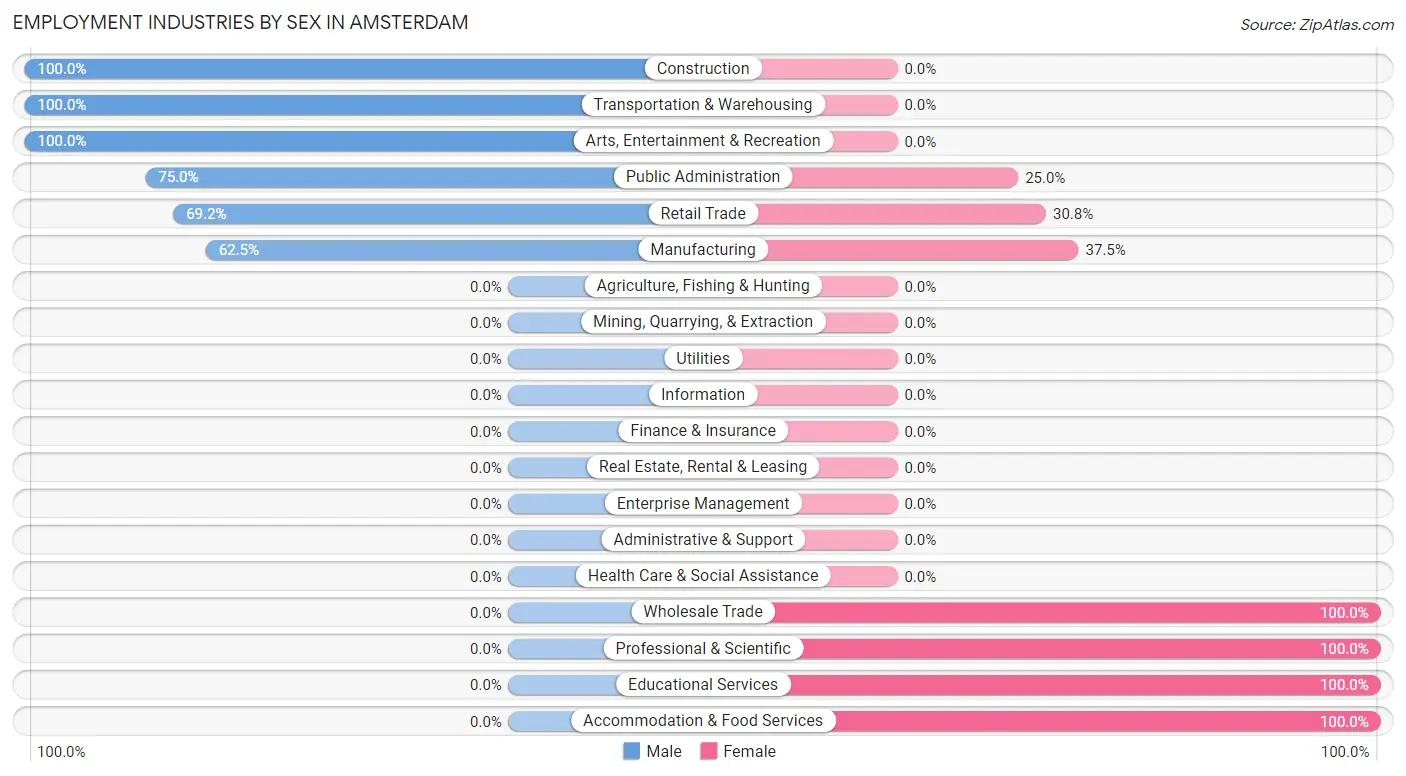
| Industry | Male | Female |
| Agriculture, Fishing & Hunting | 0 (0.0%) | 0 (0.0%) |
| Mining, Quarrying, & Extraction | 0 (0.0%) | 0 (0.0%) |
| Construction | 12 (100.0%) | 0 (0.0%) |
| Manufacturing | 5 (62.5%) | 3 (37.5%) |
| Wholesale Trade | 0 (0.0%) | 1 (100.0%) |
| Retail Trade | 9 (69.2%) | 4 (30.8%) |
| Transportation & Warehousing | 7 (100.0%) | 0 (0.0%) |
| Utilities | 0 (0.0%) | 0 (0.0%) |
| Information | 0 (0.0%) | 0 (0.0%) |
| Finance & Insurance | 0 (0.0%) | 0 (0.0%) |
| Real Estate, Rental & Leasing | 0 (0.0%) | 0 (0.0%) |
| Professional & Scientific | 0 (0.0%) | 2 (100.0%) |
| Enterprise Management | 0 (0.0%) | 0 (0.0%) |
| Administrative & Support | 0 (0.0%) | 0 (0.0%) |
| Educational Services | 0 (0.0%) | 2 (100.0%) |
| Health Care & Social Assistance | 0 (0.0%) | 0 (0.0%) |
| Arts, Entertainment & Recreation | 2 (100.0%) | 0 (0.0%) |
| Accommodation & Food Services | 0 (0.0%) | 1 (100.0%) |
| Public Administration | 3 (75.0%) | 1 (25.0%) |
| Total | 38 (71.7%) | 15 (28.3%) |
Education in Amsterdam
School Enrollment in Amsterdam
The most common levels of schooling among the 8 students in Amsterdam are high school (4 | 50.0%), elementary school (2 | 25.0%), and college / undergraduate (2 | 25.0%).
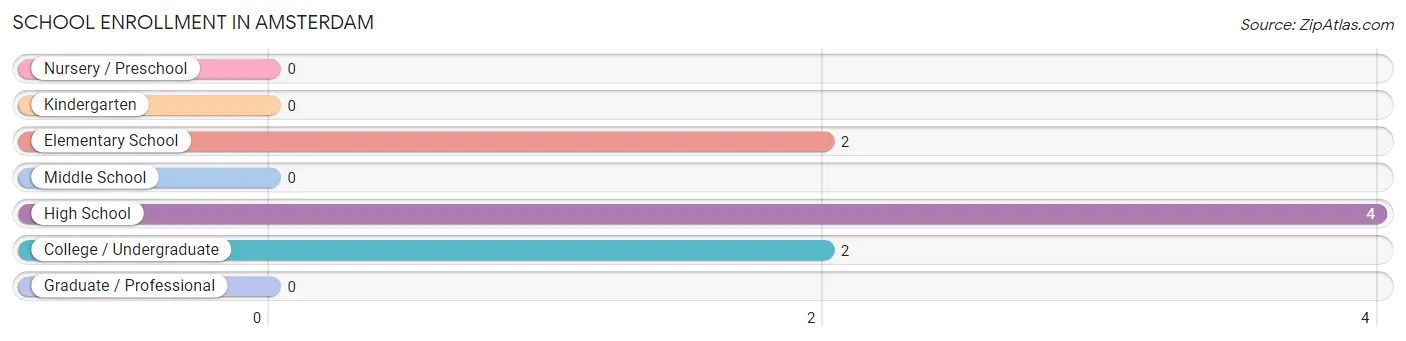
| School Level | # Students | % Students |
| Nursery / Preschool | 0 | 0.0% |
| Kindergarten | 0 | 0.0% |
| Elementary School | 2 | 25.0% |
| Middle School | 0 | 0.0% |
| High School | 4 | 50.0% |
| College / Undergraduate | 2 | 25.0% |
| Graduate / Professional | 0 | 0.0% |
| Total | 8 | 100.0% |
School Enrollment by Age by Funding Source in Amsterdam
Out of a total of 8 students who are enrolled in schools in Amsterdam, 2 (25.0%) attend a private institution, while the remaining 6 (75.0%) are enrolled in public schools. The age group of 35 years and over has the highest likelihood of being enrolled in private schools, with 2 (100.0% in the age bracket) enrolled. Conversely, the age group of 5 to 9 year old has the lowest likelihood of being enrolled in a private school, with 2 (100.0% in the age bracket) attending a public institution.
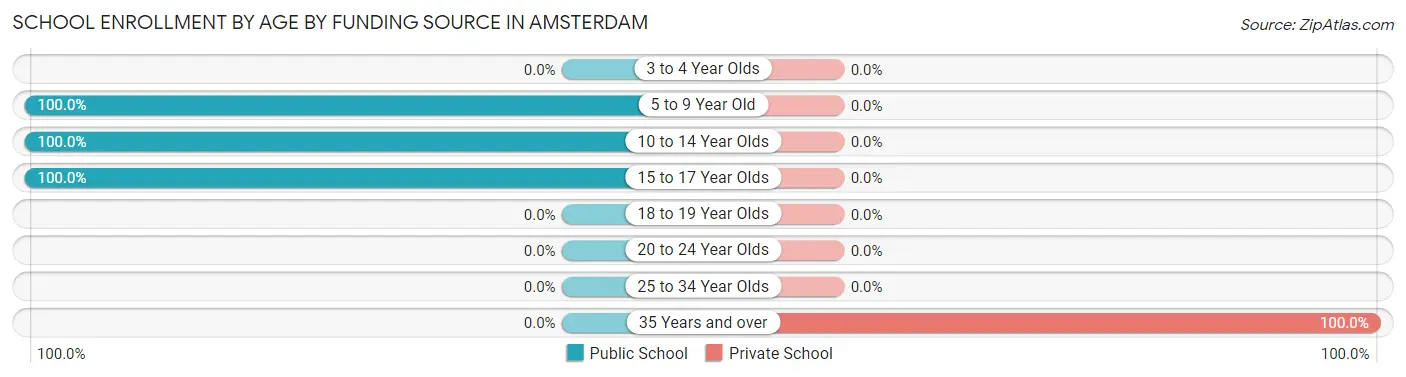
| Age Bracket | Public School | Private School |
| 3 to 4 Year Olds | 0 (0.0%) | 0 (0.0%) |
| 5 to 9 Year Old | 2 (100.0%) | 0 (0.0%) |
| 10 to 14 Year Olds | 1 (100.0%) | 0 (0.0%) |
| 15 to 17 Year Olds | 3 (100.0%) | 0 (0.0%) |
| 18 to 19 Year Olds | 0 (0.0%) | 0 (0.0%) |
| 20 to 24 Year Olds | 0 (0.0%) | 0 (0.0%) |
| 25 to 34 Year Olds | 0 (0.0%) | 0 (0.0%) |
| 35 Years and over | 0 (0.0%) | 2 (100.0%) |
| Total | 6 (75.0%) | 2 (25.0%) |
Educational Attainment by Field of Study in Amsterdam
Science & technology (23 | 46.9%), business (23 | 46.9%), liberal arts & history (2 | 4.1%), and psychology (1 | 2.0%) are the most common fields of study among 49 individuals in Amsterdam who have obtained a bachelor's degree or higher.
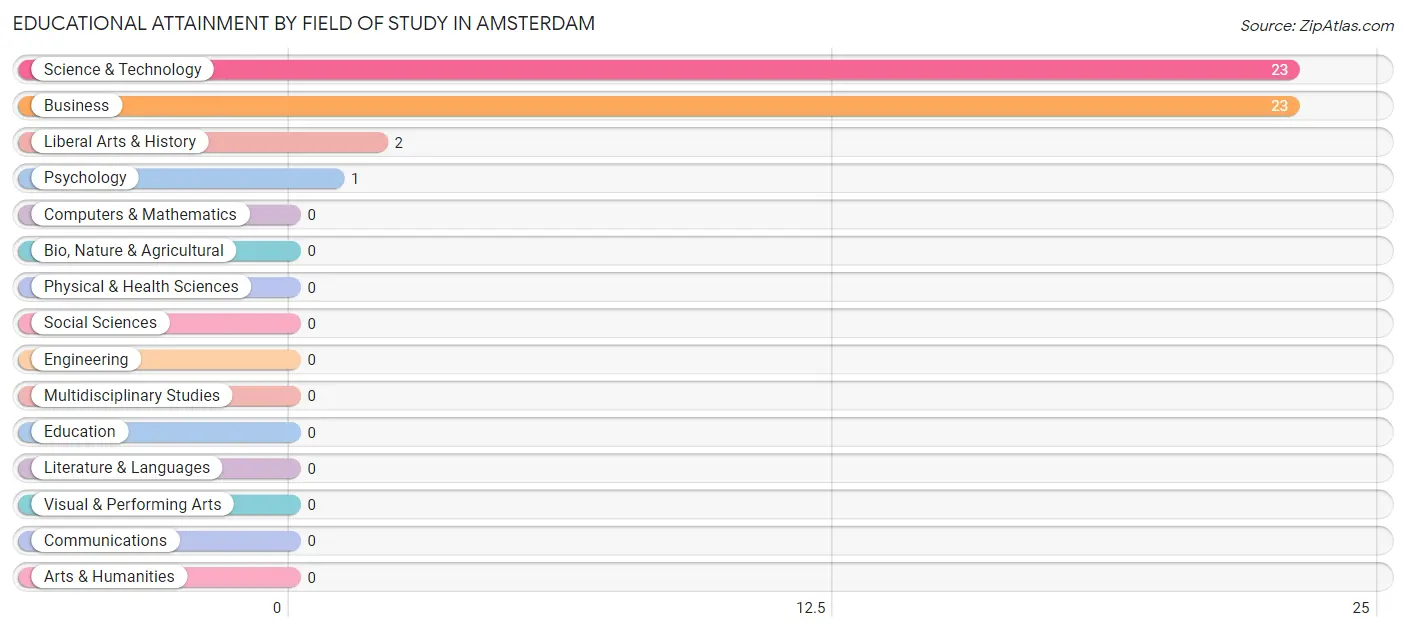
| Field of Study | # Graduates | % Graduates |
| Computers & Mathematics | 0 | 0.0% |
| Bio, Nature & Agricultural | 0 | 0.0% |
| Physical & Health Sciences | 0 | 0.0% |
| Psychology | 1 | 2.0% |
| Social Sciences | 0 | 0.0% |
| Engineering | 0 | 0.0% |
| Multidisciplinary Studies | 0 | 0.0% |
| Science & Technology | 23 | 46.9% |
| Business | 23 | 46.9% |
| Education | 0 | 0.0% |
| Literature & Languages | 0 | 0.0% |
| Liberal Arts & History | 2 | 4.1% |
| Visual & Performing Arts | 0 | 0.0% |
| Communications | 0 | 0.0% |
| Arts & Humanities | 0 | 0.0% |
| Total | 49 | 100.0% |
Transportation & Commute in Amsterdam
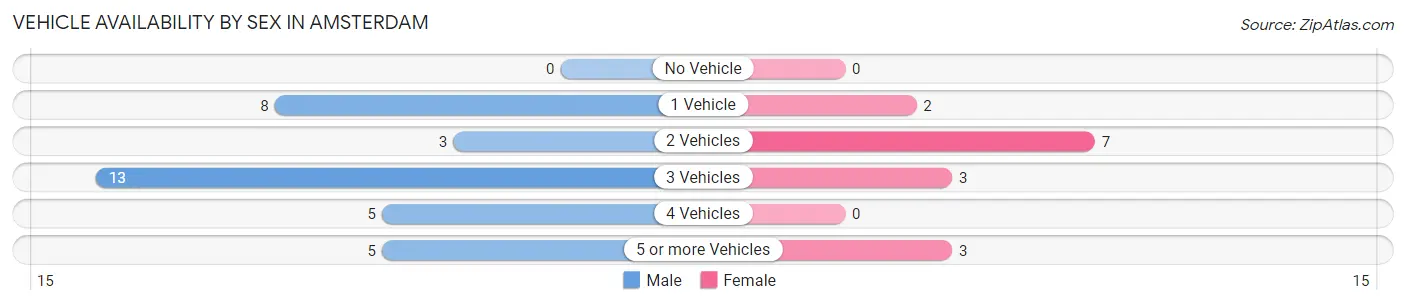
Vehicle Availability by Sex in Amsterdam
The most prevalent vehicle ownership categories in Amsterdam are males with 3 vehicles (13, accounting for 38.2%) and females with 3 vehicles (3, making up 86.7%).
| Vehicles Available | Male | Female |
| No Vehicle | 0 (0.0%) | 0 (0.0%) |
| 1 Vehicle | 8 (23.5%) | 2 (13.3%) |
| 2 Vehicles | 3 (8.8%) | 7 (46.7%) |
| 3 Vehicles | 13 (38.2%) | 3 (20.0%) |
| 4 Vehicles | 5 (14.7%) | 0 (0.0%) |
| 5 or more Vehicles | 5 (14.7%) | 3 (20.0%) |
| Total | 34 (100.0%) | 15 (100.0%) |
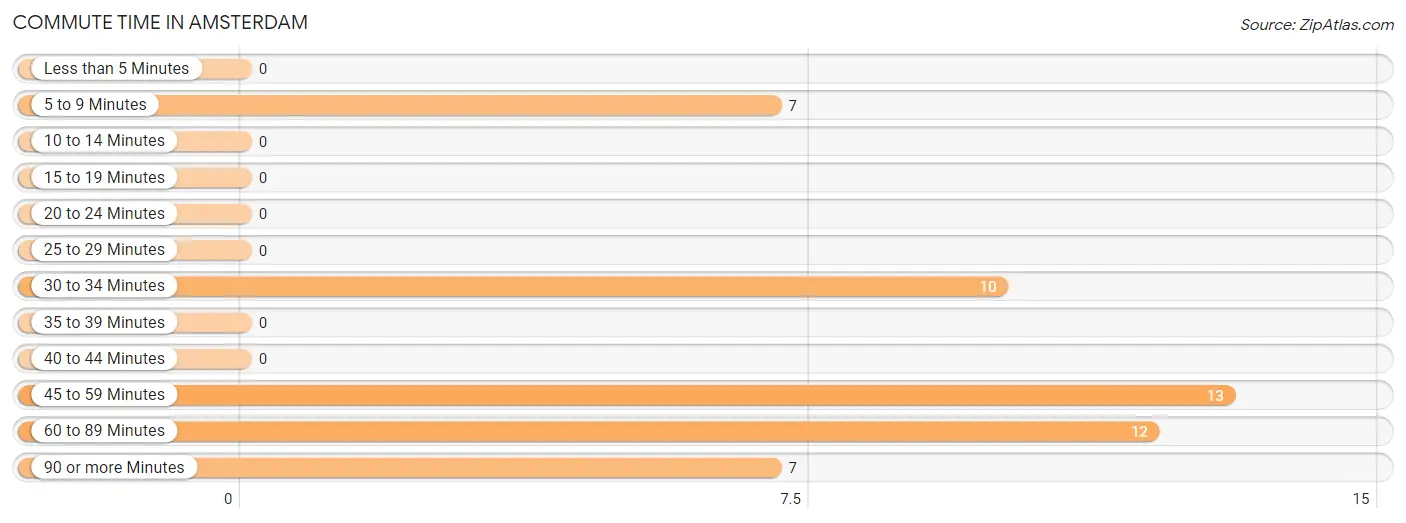
Commute Time in Amsterdam
The most frequently occuring commute durations in Amsterdam are 45 to 59 minutes (13 commuters, 26.5%), 60 to 89 minutes (12 commuters, 24.5%), and 30 to 34 minutes (10 commuters, 20.4%).
| Commute Time | # Commuters | % Commuters |
| Less than 5 Minutes | 0 | 0.0% |
| 5 to 9 Minutes | 7 | 14.3% |
| 10 to 14 Minutes | 0 | 0.0% |
| 15 to 19 Minutes | 0 | 0.0% |
| 20 to 24 Minutes | 0 | 0.0% |
| 25 to 29 Minutes | 0 | 0.0% |
| 30 to 34 Minutes | 10 | 20.4% |
| 35 to 39 Minutes | 0 | 0.0% |
| 40 to 44 Minutes | 0 | 0.0% |
| 45 to 59 Minutes | 13 | 26.5% |
| 60 to 89 Minutes | 12 | 24.5% |
| 90 or more Minutes | 7 | 14.3% |
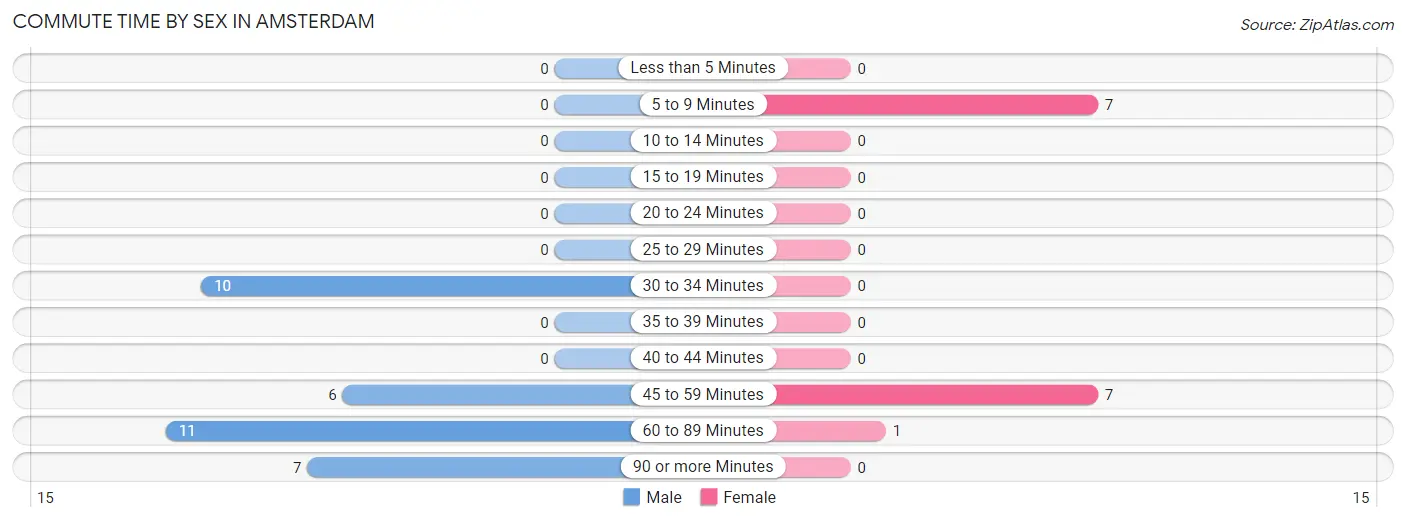
Commute Time by Sex in Amsterdam
The most common commute times in Amsterdam are 60 to 89 minutes (11 commuters, 32.4%) for males and 5 to 9 minutes (7 commuters, 46.7%) for females.
| Commute Time | Male | Female |
| Less than 5 Minutes | 0 (0.0%) | 0 (0.0%) |
| 5 to 9 Minutes | 0 (0.0%) | 7 (46.7%) |
| 10 to 14 Minutes | 0 (0.0%) | 0 (0.0%) |
| 15 to 19 Minutes | 0 (0.0%) | 0 (0.0%) |
| 20 to 24 Minutes | 0 (0.0%) | 0 (0.0%) |
| 25 to 29 Minutes | 0 (0.0%) | 0 (0.0%) |
| 30 to 34 Minutes | 10 (29.4%) | 0 (0.0%) |
| 35 to 39 Minutes | 0 (0.0%) | 0 (0.0%) |
| 40 to 44 Minutes | 0 (0.0%) | 0 (0.0%) |
| 45 to 59 Minutes | 6 (17.6%) | 7 (46.7%) |
| 60 to 89 Minutes | 11 (32.4%) | 1 (6.7%) |
| 90 or more Minutes | 7 (20.6%) | 0 (0.0%) |
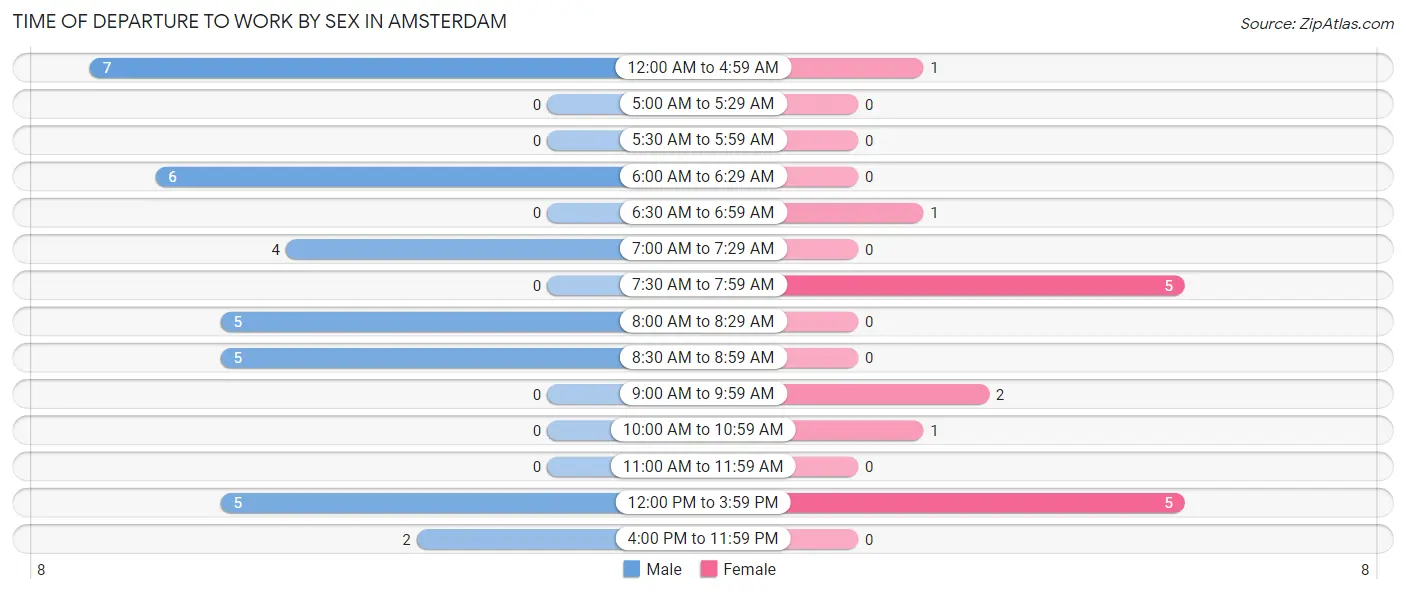
Time of Departure to Work by Sex in Amsterdam
The most frequent times of departure to work in Amsterdam are 12:00 AM to 4:59 AM (7, 20.6%) for males and 7:30 AM to 7:59 AM (5, 33.3%) for females.
| Time of Departure | Male | Female |
| 12:00 AM to 4:59 AM | 7 (20.6%) | 1 (6.7%) |
| 5:00 AM to 5:29 AM | 0 (0.0%) | 0 (0.0%) |
| 5:30 AM to 5:59 AM | 0 (0.0%) | 0 (0.0%) |
| 6:00 AM to 6:29 AM | 6 (17.6%) | 0 (0.0%) |
| 6:30 AM to 6:59 AM | 0 (0.0%) | 1 (6.7%) |
| 7:00 AM to 7:29 AM | 4 (11.8%) | 0 (0.0%) |
| 7:30 AM to 7:59 AM | 0 (0.0%) | 5 (33.3%) |
| 8:00 AM to 8:29 AM | 5 (14.7%) | 0 (0.0%) |
| 8:30 AM to 8:59 AM | 5 (14.7%) | 0 (0.0%) |
| 9:00 AM to 9:59 AM | 0 (0.0%) | 2 (13.3%) |
| 10:00 AM to 10:59 AM | 0 (0.0%) | 1 (6.7%) |
| 11:00 AM to 11:59 AM | 0 (0.0%) | 0 (0.0%) |
| 12:00 PM to 3:59 PM | 5 (14.7%) | 5 (33.3%) |
| 4:00 PM to 11:59 PM | 2 (5.9%) | 0 (0.0%) |
| Total | 34 (100.0%) | 15 (100.0%) |
Housing Occupancy in Amsterdam
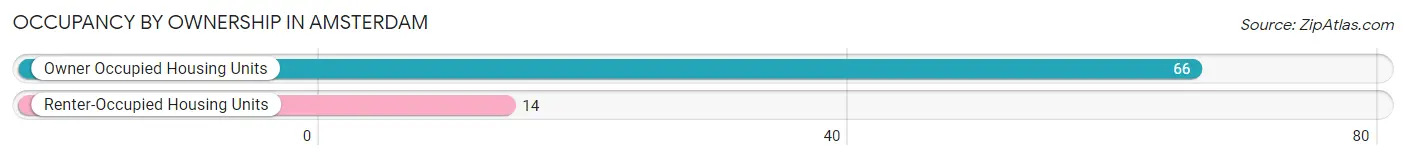
Occupancy by Ownership in Amsterdam
Of the total 80 dwellings in Amsterdam, owner-occupied units account for 66 (82.5%), while renter-occupied units make up 14 (17.5%).
| Occupancy | # Housing Units | % Housing Units |
| Owner Occupied Housing Units | 66 | 82.5% |
| Renter-Occupied Housing Units | 14 | 17.5% |
| Total Occupied Housing Units | 80 | 100.0% |
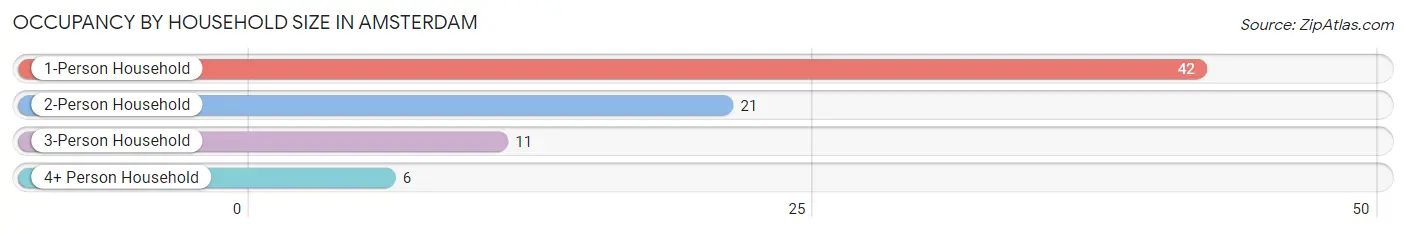
Occupancy by Household Size in Amsterdam
| Household Size | # Housing Units | % Housing Units |
| 1-Person Household | 42 | 52.5% |
| 2-Person Household | 21 | 26.3% |
| 3-Person Household | 11 | 13.8% |
| 4+ Person Household | 6 | 7.5% |
| Total Housing Units | 80 | 100.0% |
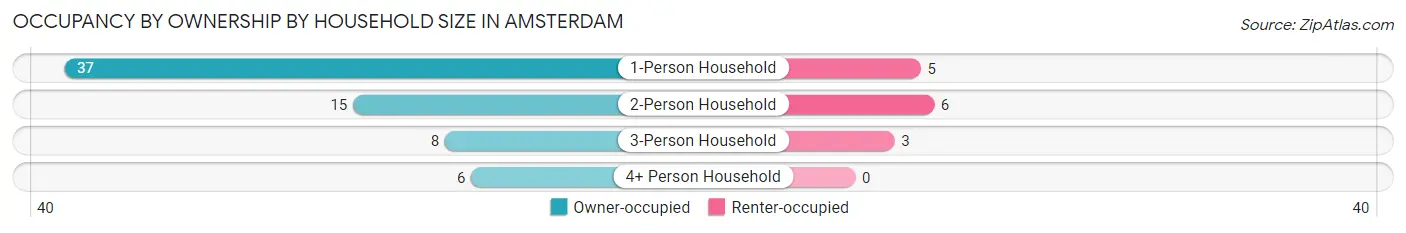
Occupancy by Ownership by Household Size in Amsterdam
| Household Size | Owner-occupied | Renter-occupied |
| 1-Person Household | 37 (88.1%) | 5 (11.9%) |
| 2-Person Household | 15 (71.4%) | 6 (28.6%) |
| 3-Person Household | 8 (72.7%) | 3 (27.3%) |
| 4+ Person Household | 6 (100.0%) | 0 (0.0%) |
| Total Housing Units | 66 (82.5%) | 14 (17.5%) |
Occupancy by Educational Attainment in Amsterdam
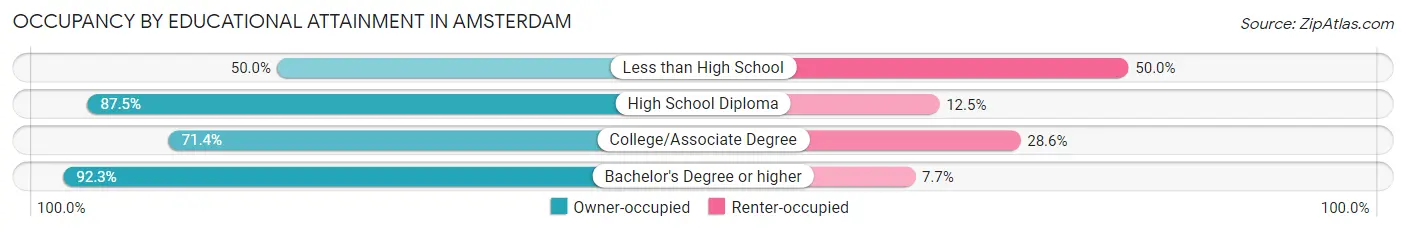
| Household Size | Owner-occupied | Renter-occupied |
| Less than High School | 4 (50.0%) | 4 (50.0%) |
| High School Diploma | 28 (87.5%) | 4 (12.5%) |
| College/Associate Degree | 10 (71.4%) | 4 (28.6%) |
| Bachelor's Degree or higher | 24 (92.3%) | 2 (7.7%) |
Occupancy by Age of Householder in Amsterdam
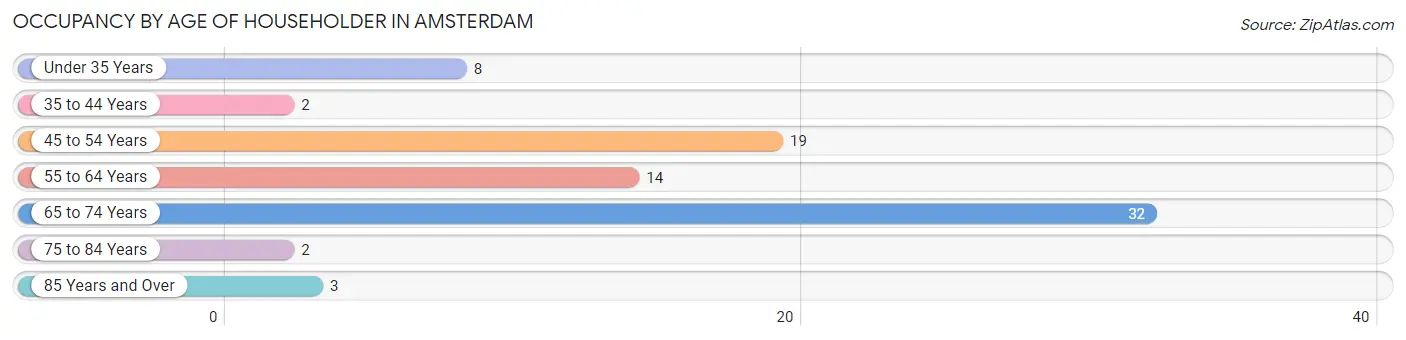
| Age Bracket | # Households | % Households |
| Under 35 Years | 8 | 10.0% |
| 35 to 44 Years | 2 | 2.5% |
| 45 to 54 Years | 19 | 23.7% |
| 55 to 64 Years | 14 | 17.5% |
| 65 to 74 Years | 32 | 40.0% |
| 75 to 84 Years | 2 | 2.5% |
| 85 Years and Over | 3 | 3.7% |
| Total | 80 | 100.0% |
Housing Finances in Amsterdam
Median Income by Occupancy in Amsterdam
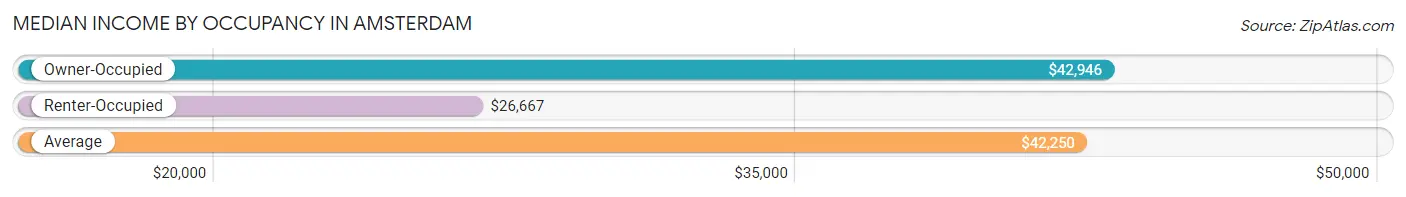
| Occupancy Type | # Households | Median Income |
| Owner-Occupied | 66 (82.5%) | $42,946 |
| Renter-Occupied | 14 (17.5%) | $26,667 |
| Average | 80 (100.0%) | $42,250 |
Occupancy by Householder Income Bracket in Amsterdam
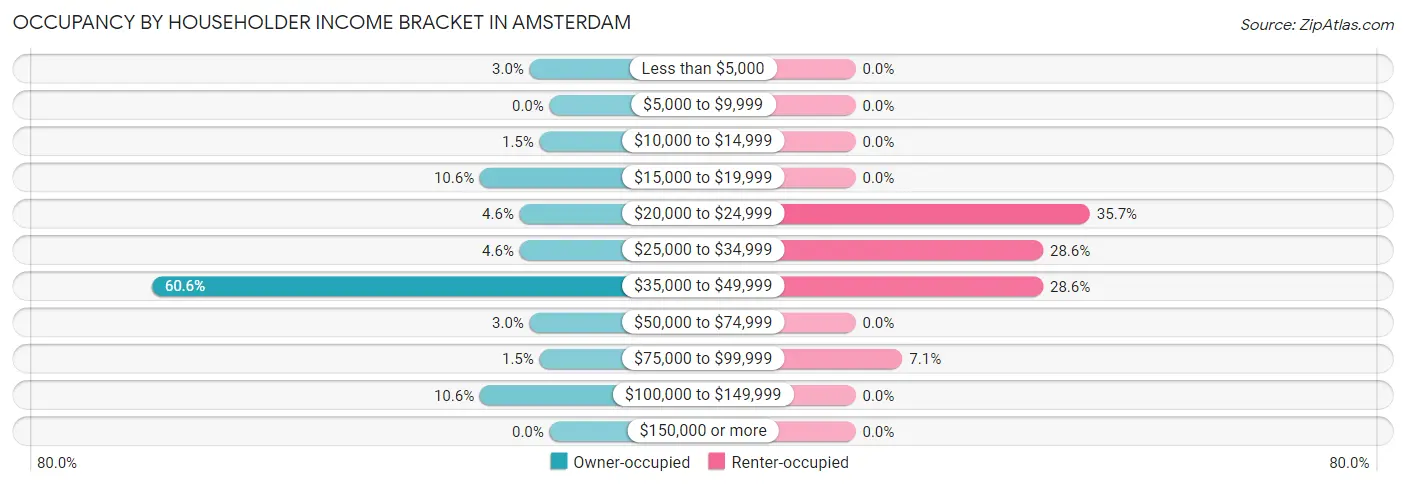
| Income Bracket | Owner-occupied | Renter-occupied |
| Less than $5,000 | 2 (3.0%) | 0 (0.0%) |
| $5,000 to $9,999 | 0 (0.0%) | 0 (0.0%) |
| $10,000 to $14,999 | 1 (1.5%) | 0 (0.0%) |
| $15,000 to $19,999 | 7 (10.6%) | 0 (0.0%) |
| $20,000 to $24,999 | 3 (4.5%) | 5 (35.7%) |
| $25,000 to $34,999 | 3 (4.5%) | 4 (28.6%) |
| $35,000 to $49,999 | 40 (60.6%) | 4 (28.6%) |
| $50,000 to $74,999 | 2 (3.0%) | 0 (0.0%) |
| $75,000 to $99,999 | 1 (1.5%) | 1 (7.1%) |
| $100,000 to $149,999 | 7 (10.6%) | 0 (0.0%) |
| $150,000 or more | 0 (0.0%) | 0 (0.0%) |
| Total | 66 (100.0%) | 14 (100.0%) |
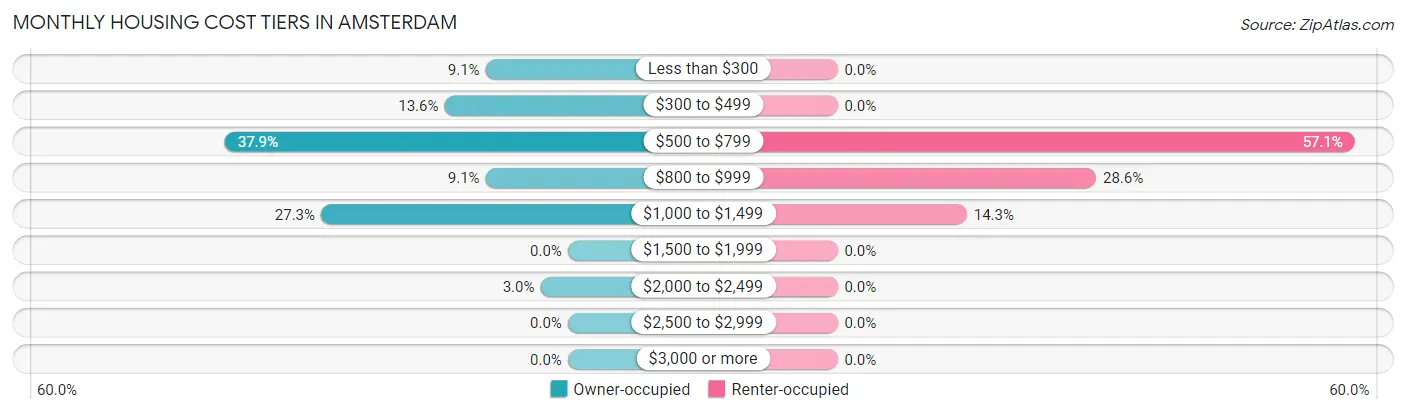
Monthly Housing Cost Tiers in Amsterdam
| Monthly Cost | Owner-occupied | Renter-occupied |
| Less than $300 | 6 (9.1%) | 0 (0.0%) |
| $300 to $499 | 9 (13.6%) | 0 (0.0%) |
| $500 to $799 | 25 (37.9%) | 8 (57.1%) |
| $800 to $999 | 6 (9.1%) | 4 (28.6%) |
| $1,000 to $1,499 | 18 (27.3%) | 2 (14.3%) |
| $1,500 to $1,999 | 0 (0.0%) | 0 (0.0%) |
| $2,000 to $2,499 | 2 (3.0%) | 0 (0.0%) |
| $2,500 to $2,999 | 0 (0.0%) | 0 (0.0%) |
| $3,000 or more | 0 (0.0%) | 0 (0.0%) |
| Total | 66 (100.0%) | 14 (100.0%) |
Physical Housing Characteristics in Amsterdam
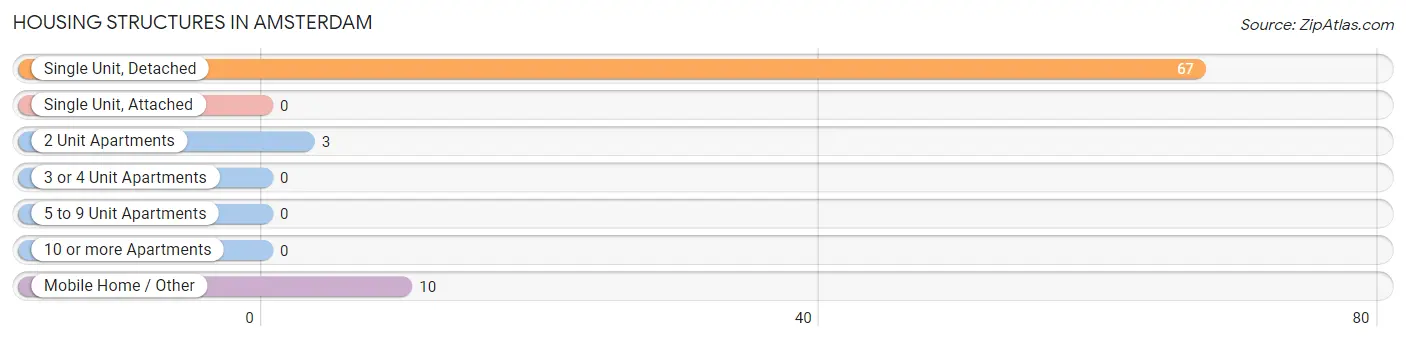
Housing Structures in Amsterdam
| Structure Type | # Housing Units | % Housing Units |
| Single Unit, Detached | 67 | 83.8% |
| Single Unit, Attached | 0 | 0.0% |
| 2 Unit Apartments | 3 | 3.7% |
| 3 or 4 Unit Apartments | 0 | 0.0% |
| 5 to 9 Unit Apartments | 0 | 0.0% |
| 10 or more Apartments | 0 | 0.0% |
| Mobile Home / Other | 10 | 12.5% |
| Total | 80 | 100.0% |
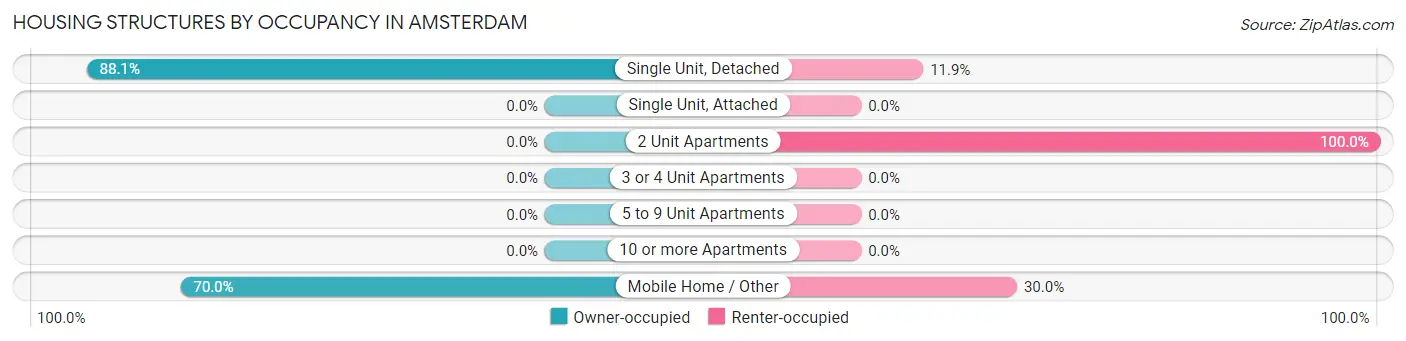
Housing Structures by Occupancy in Amsterdam
| Structure Type | Owner-occupied | Renter-occupied |
| Single Unit, Detached | 59 (88.1%) | 8 (11.9%) |
| Single Unit, Attached | 0 (0.0%) | 0 (0.0%) |
| 2 Unit Apartments | 0 (0.0%) | 3 (100.0%) |
| 3 or 4 Unit Apartments | 0 (0.0%) | 0 (0.0%) |
| 5 to 9 Unit Apartments | 0 (0.0%) | 0 (0.0%) |
| 10 or more Apartments | 0 (0.0%) | 0 (0.0%) |
| Mobile Home / Other | 7 (70.0%) | 3 (30.0%) |
| Total | 66 (82.5%) | 14 (17.5%) |
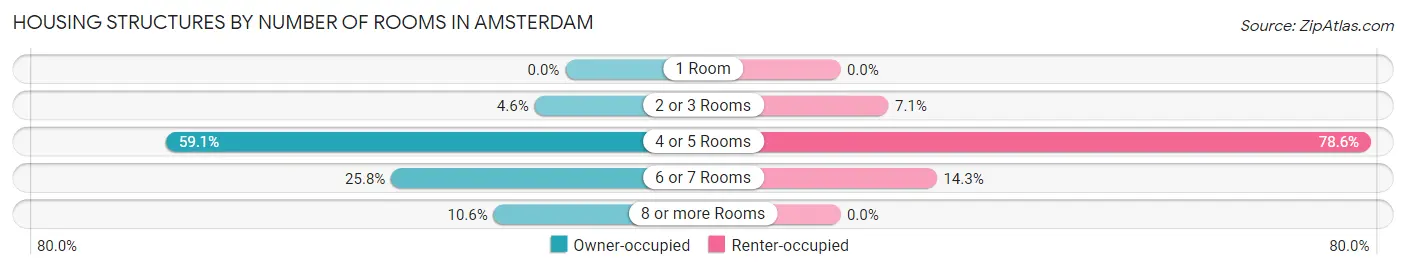
Housing Structures by Number of Rooms in Amsterdam
| Number of Rooms | Owner-occupied | Renter-occupied |
| 1 Room | 0 (0.0%) | 0 (0.0%) |
| 2 or 3 Rooms | 3 (4.5%) | 1 (7.1%) |
| 4 or 5 Rooms | 39 (59.1%) | 11 (78.6%) |
| 6 or 7 Rooms | 17 (25.8%) | 2 (14.3%) |
| 8 or more Rooms | 7 (10.6%) | 0 (0.0%) |
| Total | 66 (100.0%) | 14 (100.0%) |
Housing Structure by Heating Type in Amsterdam
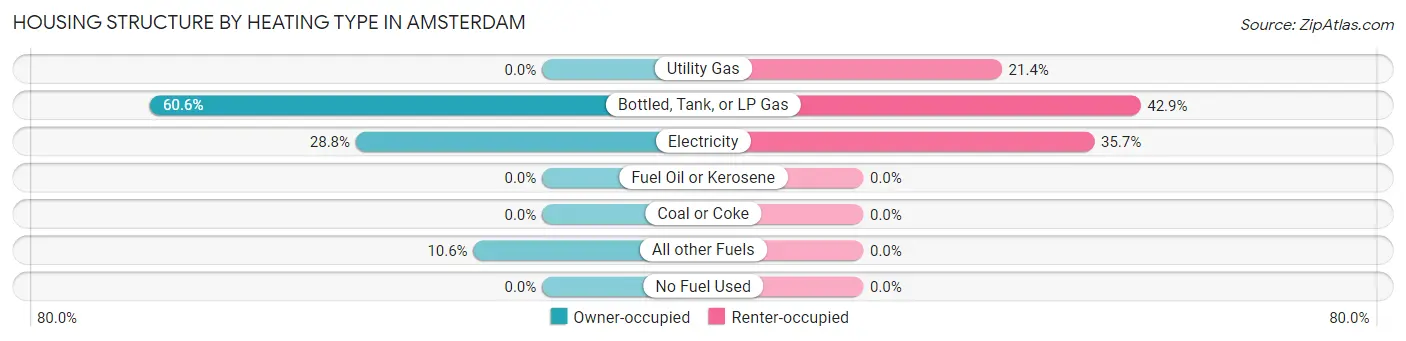
| Heating Type | Owner-occupied | Renter-occupied |
| Utility Gas | 0 (0.0%) | 3 (21.4%) |
| Bottled, Tank, or LP Gas | 40 (60.6%) | 6 (42.9%) |
| Electricity | 19 (28.8%) | 5 (35.7%) |
| Fuel Oil or Kerosene | 0 (0.0%) | 0 (0.0%) |
| Coal or Coke | 0 (0.0%) | 0 (0.0%) |
| All other Fuels | 7 (10.6%) | 0 (0.0%) |
| No Fuel Used | 0 (0.0%) | 0 (0.0%) |
| Total | 66 (100.0%) | 14 (100.0%) |
Household Vehicle Usage in Amsterdam
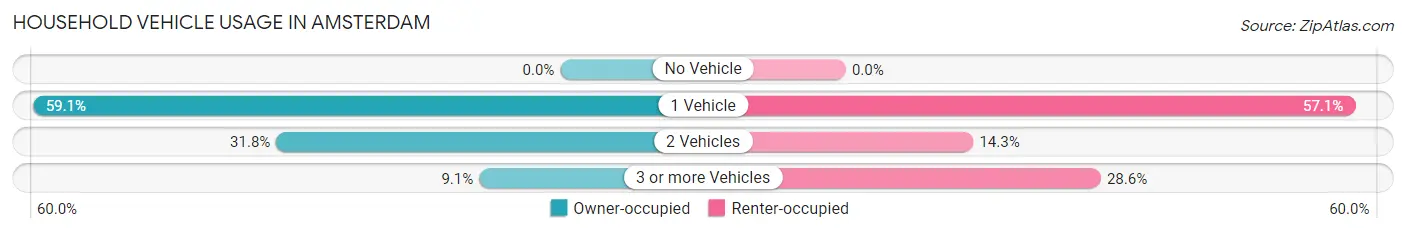
| Vehicles per Household | Owner-occupied | Renter-occupied |
| No Vehicle | 0 (0.0%) | 0 (0.0%) |
| 1 Vehicle | 39 (59.1%) | 8 (57.1%) |
| 2 Vehicles | 21 (31.8%) | 2 (14.3%) |
| 3 or more Vehicles | 6 (9.1%) | 4 (28.6%) |
| Total | 66 (100.0%) | 14 (100.0%) |
Real Estate & Mortgages in Amsterdam
Real Estate and Mortgage Overview in Amsterdam
| Characteristic | Without Mortgage | With Mortgage |
| Housing Units | 19 | 47 |
| Median Property Value | - | - |
| Median Household Income | $38,125 | $0 |
| Monthly Housing Costs | $421 | $0 |
| Real Estate Taxes | $500 | $0 |
Property Value by Mortgage Status in Amsterdam
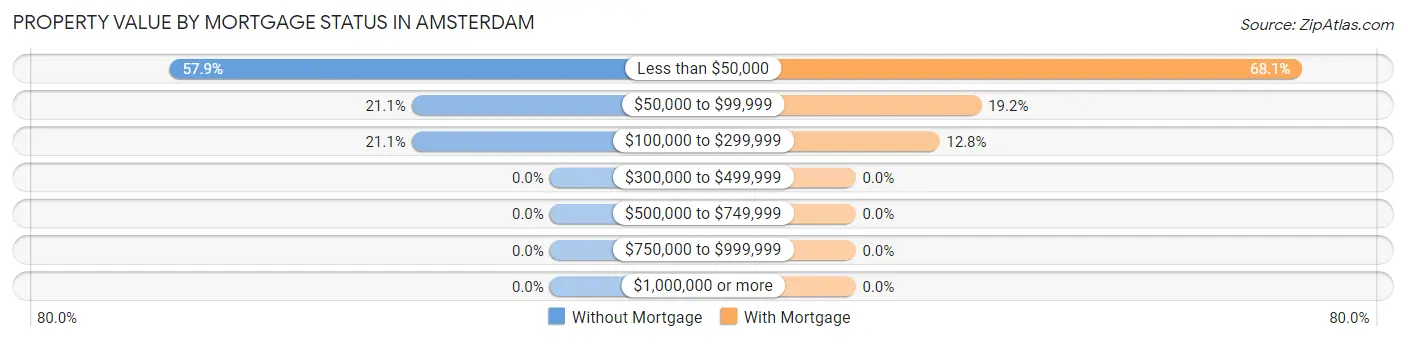
| Property Value | Without Mortgage | With Mortgage |
| Less than $50,000 | 11 (57.9%) | 32 (68.1%) |
| $50,000 to $99,999 | 4 (21.0%) | 9 (19.2%) |
| $100,000 to $299,999 | 4 (21.0%) | 6 (12.8%) |
| $300,000 to $499,999 | 0 (0.0%) | 0 (0.0%) |
| $500,000 to $749,999 | 0 (0.0%) | 0 (0.0%) |
| $750,000 to $999,999 | 0 (0.0%) | 0 (0.0%) |
| $1,000,000 or more | 0 (0.0%) | 0 (0.0%) |
| Total | 19 (100.0%) | 47 (100.0%) |
Household Income by Mortgage Status in Amsterdam
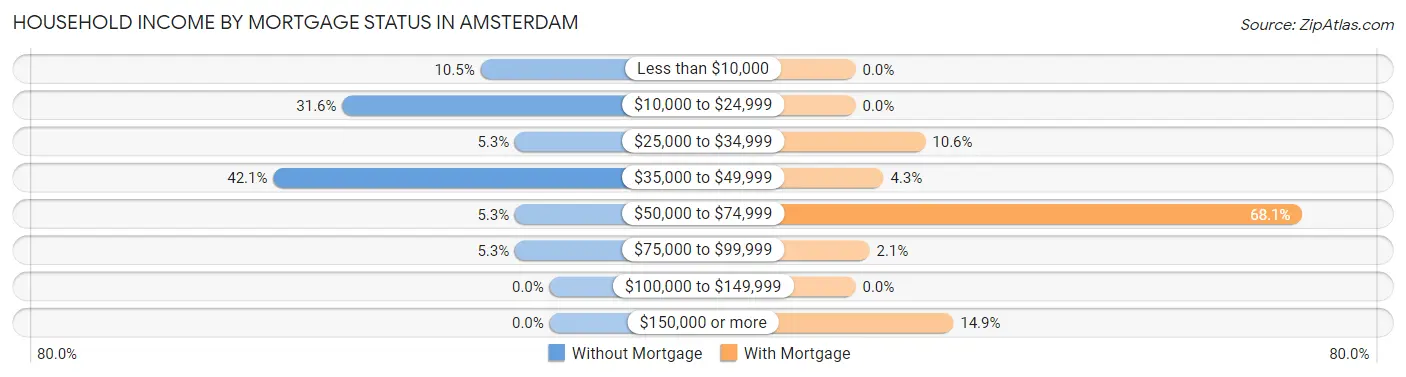
| Household Income | Without Mortgage | With Mortgage |
| Less than $10,000 | 2 (10.5%) | 0 (0.0%) |
| $10,000 to $24,999 | 6 (31.6%) | 0 (0.0%) |
| $25,000 to $34,999 | 1 (5.3%) | 5 (10.6%) |
| $35,000 to $49,999 | 8 (42.1%) | 2 (4.3%) |
| $50,000 to $74,999 | 1 (5.3%) | 32 (68.1%) |
| $75,000 to $99,999 | 1 (5.3%) | 1 (2.1%) |
| $100,000 to $149,999 | 0 (0.0%) | 0 (0.0%) |
| $150,000 or more | 0 (0.0%) | 7 (14.9%) |
| Total | 19 (100.0%) | 47 (100.0%) |
Property Value to Household Income Ratio in Amsterdam
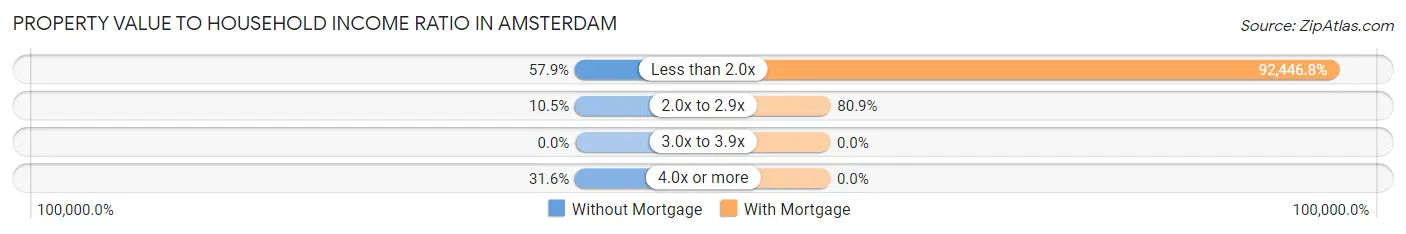
| Value-to-Income Ratio | Without Mortgage | With Mortgage |
| Less than 2.0x | 11 (57.9%) | 43,450 (92,446.8%) |
| 2.0x to 2.9x | 2 (10.5%) | 38 (80.8%) |
| 3.0x to 3.9x | 0 (0.0%) | 0 (0.0%) |
| 4.0x or more | 6 (31.6%) | 0 (0.0%) |
| Total | 19 (100.0%) | 47 (100.0%) |
Real Estate Taxes by Mortgage Status in Amsterdam
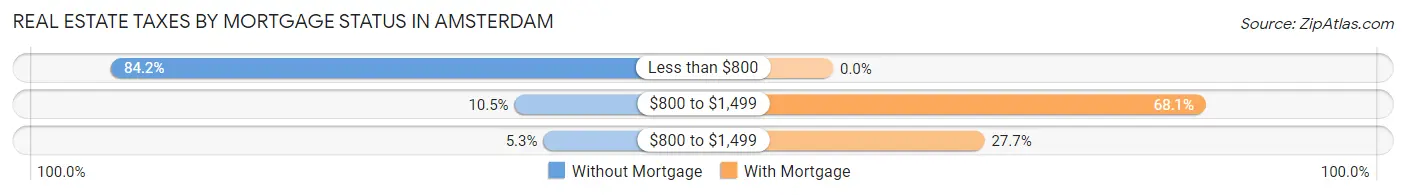
| Property Taxes | Without Mortgage | With Mortgage |
| Less than $800 | 16 (84.2%) | 0 (0.0%) |
| $800 to $1,499 | 2 (10.5%) | 32 (68.1%) |
| $800 to $1,499 | 1 (5.3%) | 13 (27.7%) |
| Total | 19 (100.0%) | 47 (100.0%) |
Health & Disability in Amsterdam
Health Insurance Coverage by Age in Amsterdam
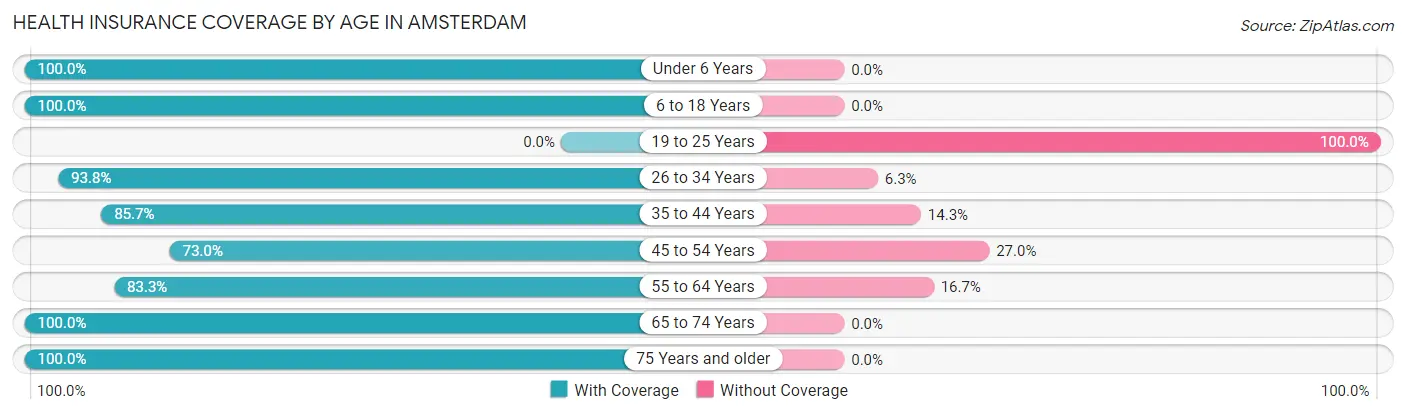
| Age Bracket | With Coverage | Without Coverage |
| Under 6 Years | 7 (100.0%) | 0 (0.0%) |
| 6 to 18 Years | 6 (100.0%) | 0 (0.0%) |
| 19 to 25 Years | 0 (0.0%) | 13 (100.0%) |
| 26 to 34 Years | 15 (93.8%) | 1 (6.2%) |
| 35 to 44 Years | 6 (85.7%) | 1 (14.3%) |
| 45 to 54 Years | 27 (73.0%) | 10 (27.0%) |
| 55 to 64 Years | 15 (83.3%) | 3 (16.7%) |
| 65 to 74 Years | 36 (100.0%) | 0 (0.0%) |
| 75 Years and older | 6 (100.0%) | 0 (0.0%) |
| Total | 118 (80.8%) | 28 (19.2%) |
Health Insurance Coverage by Citizenship Status in Amsterdam
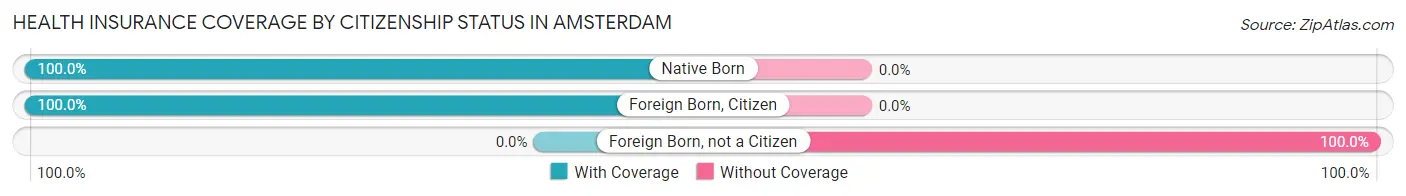
| Citizenship Status | With Coverage | Without Coverage |
| Native Born | 7 (100.0%) | 0 (0.0%) |
| Foreign Born, Citizen | 6 (100.0%) | 0 (0.0%) |
| Foreign Born, not a Citizen | 0 (0.0%) | 13 (100.0%) |
Health Insurance Coverage by Household Income in Amsterdam
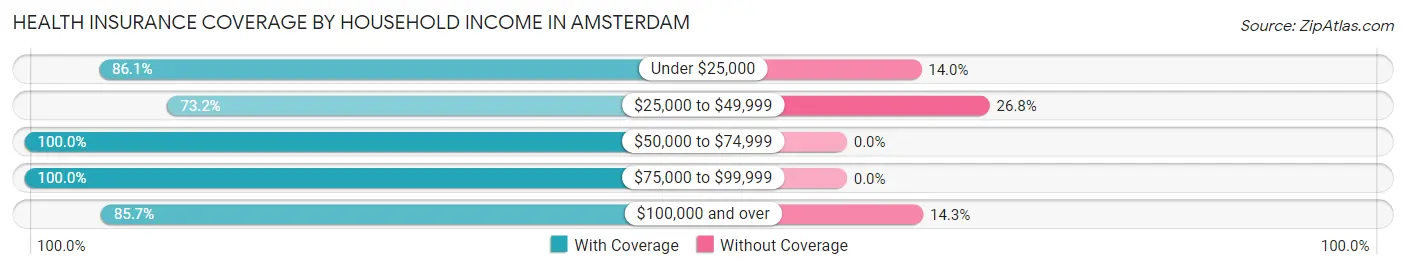
| Household Income | With Coverage | Without Coverage |
| Under $25,000 | 37 (86.1%) | 6 (14.0%) |
| $25,000 to $49,999 | 52 (73.2%) | 19 (26.8%) |
| $50,000 to $74,999 | 3 (100.0%) | 0 (0.0%) |
| $75,000 to $99,999 | 8 (100.0%) | 0 (0.0%) |
| $100,000 and over | 18 (85.7%) | 3 (14.3%) |
Public vs Private Health Insurance Coverage by Age in Amsterdam
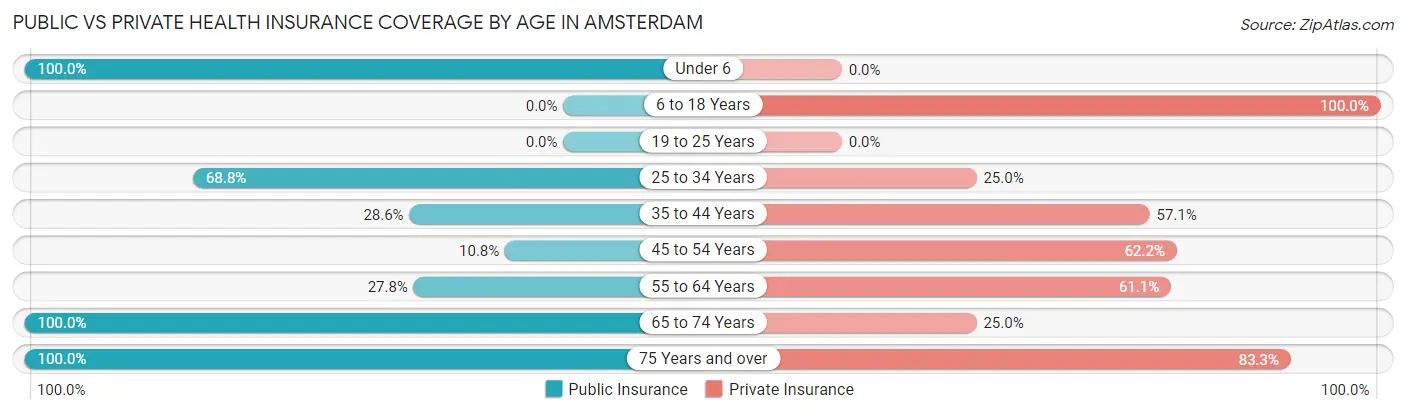
| Age Bracket | Public Insurance | Private Insurance |
| Under 6 | 7 (100.0%) | 0 (0.0%) |
| 6 to 18 Years | 0 (0.0%) | 6 (100.0%) |
| 19 to 25 Years | 0 (0.0%) | 0 (0.0%) |
| 25 to 34 Years | 11 (68.8%) | 4 (25.0%) |
| 35 to 44 Years | 2 (28.6%) | 4 (57.1%) |
| 45 to 54 Years | 4 (10.8%) | 23 (62.2%) |
| 55 to 64 Years | 5 (27.8%) | 11 (61.1%) |
| 65 to 74 Years | 36 (100.0%) | 9 (25.0%) |
| 75 Years and over | 6 (100.0%) | 5 (83.3%) |
| Total | 71 (48.6%) | 62 (42.5%) |
Disability Status by Sex by Age in Amsterdam
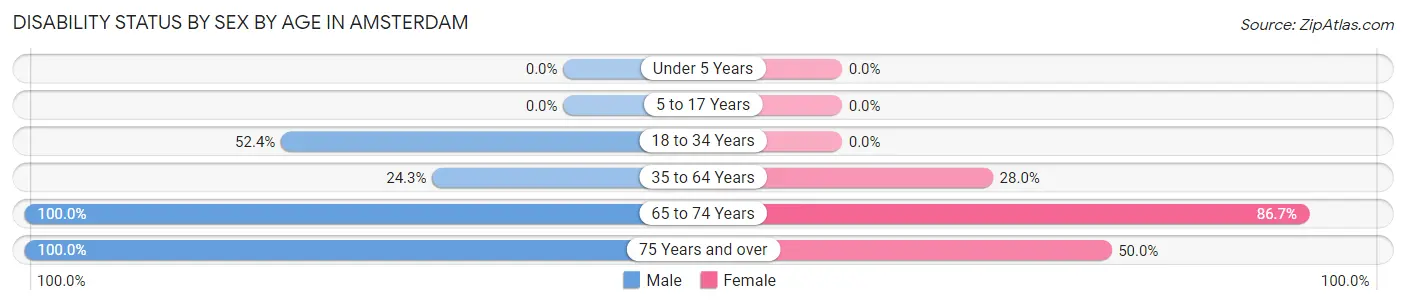
| Age Bracket | Male | Female |
| Under 5 Years | 0 (0.0%) | 0 (0.0%) |
| 5 to 17 Years | 0 (0.0%) | 0 (0.0%) |
| 18 to 34 Years | 11 (52.4%) | 0 (0.0%) |
| 35 to 64 Years | 9 (24.3%) | 7 (28.0%) |
| 65 to 74 Years | 6 (100.0%) | 26 (86.7%) |
| 75 Years and over | 2 (100.0%) | 2 (50.0%) |
Disability Class by Sex by Age in Amsterdam
Disability Class: Hearing Difficulty
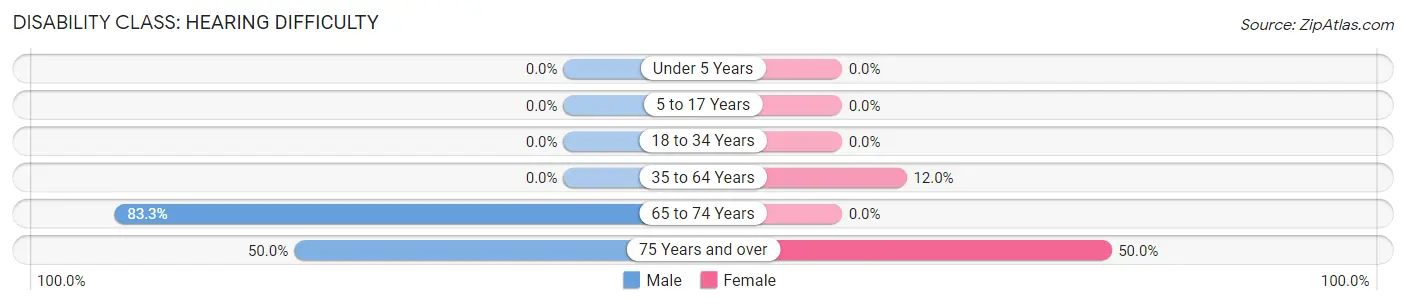
| Age Bracket | Male | Female |
| Under 5 Years | 0 (0.0%) | 0 (0.0%) |
| 5 to 17 Years | 0 (0.0%) | 0 (0.0%) |
| 18 to 34 Years | 0 (0.0%) | 0 (0.0%) |
| 35 to 64 Years | 0 (0.0%) | 3 (12.0%) |
| 65 to 74 Years | 5 (83.3%) | 0 (0.0%) |
| 75 Years and over | 1 (50.0%) | 2 (50.0%) |
Disability Class: Vision Difficulty
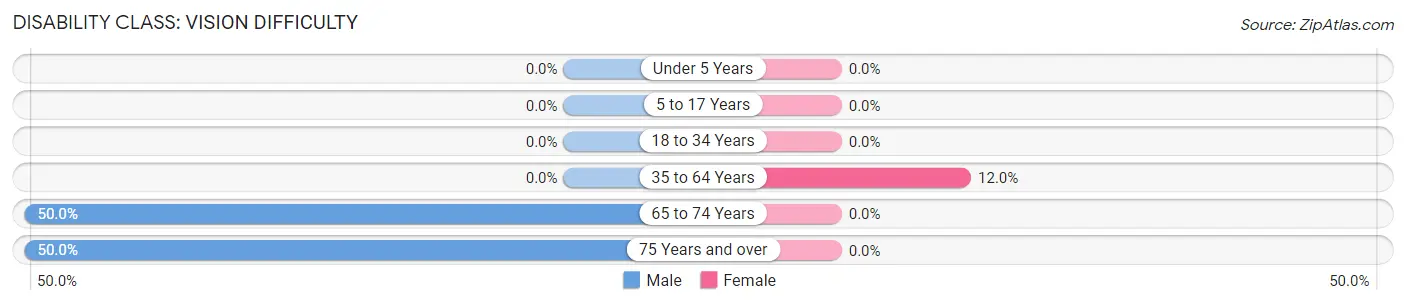
| Age Bracket | Male | Female |
| Under 5 Years | 0 (0.0%) | 0 (0.0%) |
| 5 to 17 Years | 0 (0.0%) | 0 (0.0%) |
| 18 to 34 Years | 0 (0.0%) | 0 (0.0%) |
| 35 to 64 Years | 0 (0.0%) | 3 (12.0%) |
| 65 to 74 Years | 3 (50.0%) | 0 (0.0%) |
| 75 Years and over | 1 (50.0%) | 0 (0.0%) |
Disability Class: Cognitive Difficulty
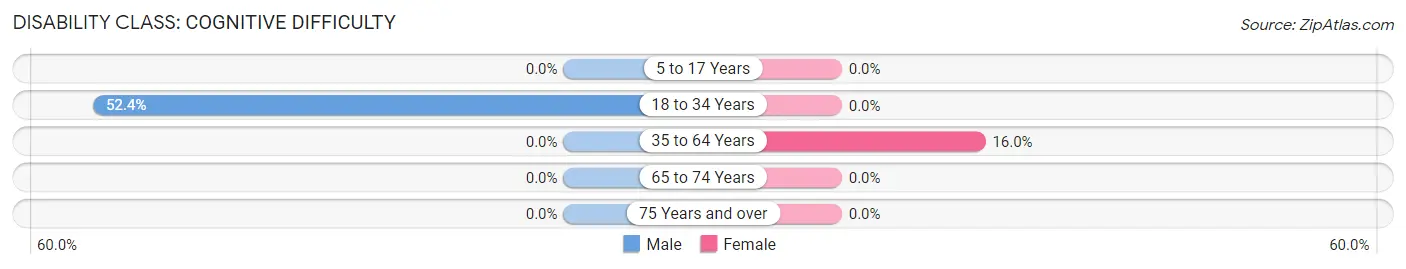
| Age Bracket | Male | Female |
| 5 to 17 Years | 0 (0.0%) | 0 (0.0%) |
| 18 to 34 Years | 11 (52.4%) | 0 (0.0%) |
| 35 to 64 Years | 0 (0.0%) | 4 (16.0%) |
| 65 to 74 Years | 0 (0.0%) | 0 (0.0%) |
| 75 Years and over | 0 (0.0%) | 0 (0.0%) |
Disability Class: Ambulatory Difficulty
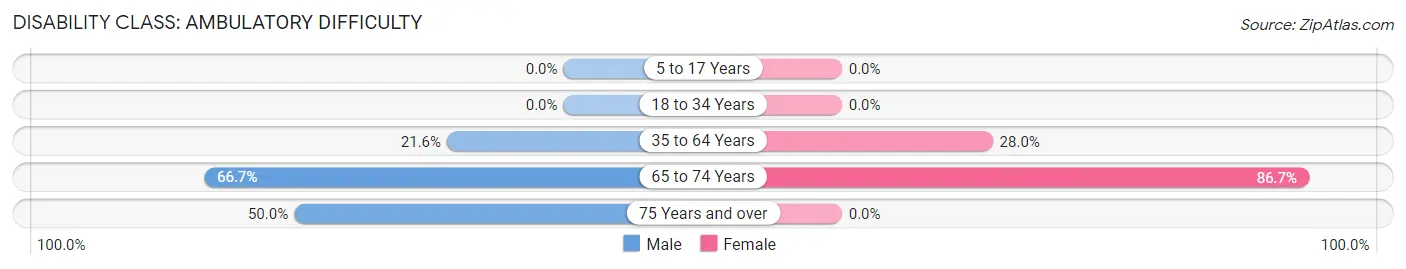
| Age Bracket | Male | Female |
| 5 to 17 Years | 0 (0.0%) | 0 (0.0%) |
| 18 to 34 Years | 0 (0.0%) | 0 (0.0%) |
| 35 to 64 Years | 8 (21.6%) | 7 (28.0%) |
| 65 to 74 Years | 4 (66.7%) | 26 (86.7%) |
| 75 Years and over | 1 (50.0%) | 0 (0.0%) |
Disability Class: Self-Care Difficulty
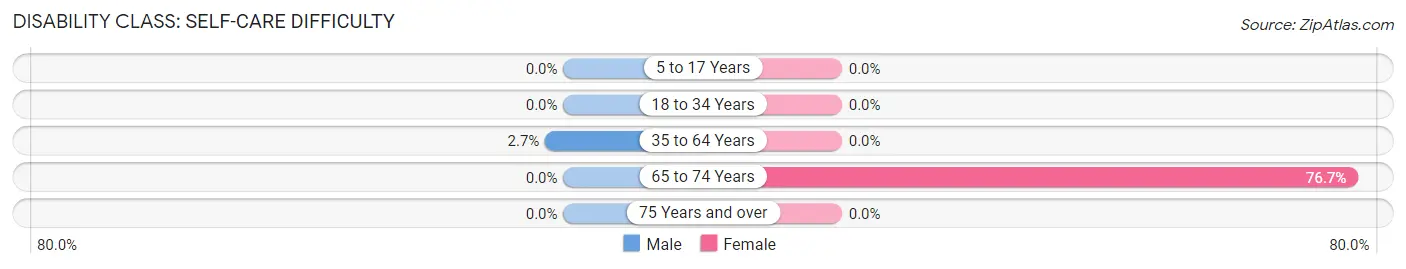
| Age Bracket | Male | Female |
| 5 to 17 Years | 0 (0.0%) | 0 (0.0%) |
| 18 to 34 Years | 0 (0.0%) | 0 (0.0%) |
| 35 to 64 Years | 1 (2.7%) | 0 (0.0%) |
| 65 to 74 Years | 0 (0.0%) | 23 (76.7%) |
| 75 Years and over | 0 (0.0%) | 0 (0.0%) |
Technology Access in Amsterdam
Computing Device Access in Amsterdam
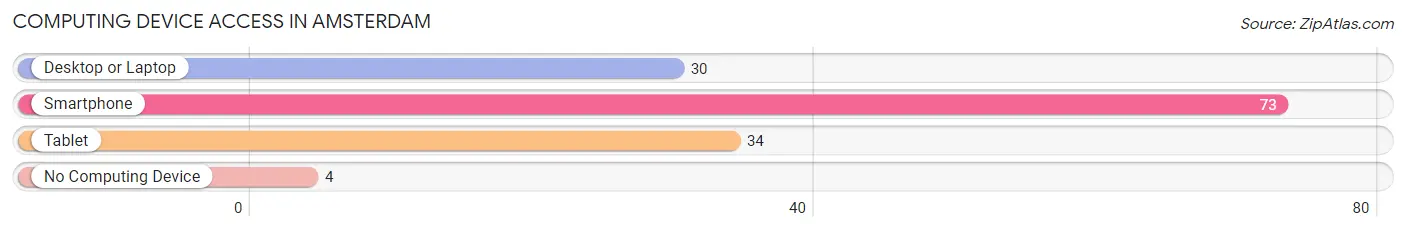
| Device Type | # Households | % Households |
| Desktop or Laptop | 30 | 37.5% |
| Smartphone | 73 | 91.2% |
| Tablet | 34 | 42.5% |
| No Computing Device | 4 | 5.0% |
| Total | 80 | 100.0% |
Internet Access in Amsterdam
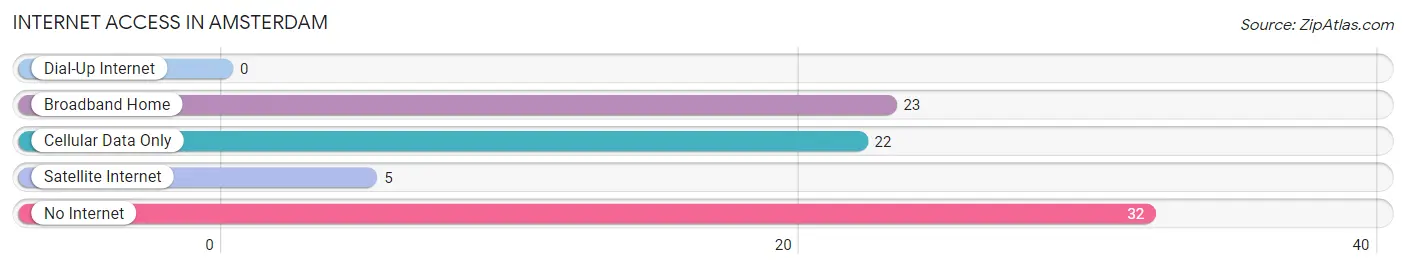
| Internet Type | # Households | % Households |
| Dial-Up Internet | 0 | 0.0% |
| Broadband Home | 23 | 28.7% |
| Cellular Data Only | 22 | 27.5% |
| Satellite Internet | 5 | 6.2% |
| No Internet | 32 | 40.0% |
| Total | 80 | 100.0% |
Amsterdam Summary
Amsterdam is a small city located in the Dutch province of North Holland. It is the capital of the Netherlands and the largest city in the country. Amsterdam is known for its canals, its rich cultural heritage, and its vibrant nightlife. The city is also home to many museums, galleries, and other attractions.
Geography
Amsterdam is located in the western part of the Netherlands, in the province of North Holland. It is situated on the banks of the Amstel River, which flows into the IJ Bay. The city is surrounded by a number of canals, which are connected to the Amstel River. The city is divided into seven boroughs, each with its own distinct character.
The city has a temperate climate, with mild winters and warm summers. The average temperature in the summer is around 21°C (70°F), while in the winter it is around 5°C (41°F).
Economy
Amsterdam is one of the most important economic centers in the Netherlands. It is home to many large companies, including Philips, Heineken, and ING. The city is also a major financial center, with the Amsterdam Stock Exchange being one of the oldest in the world.
The city is also a major tourist destination, with over 4.5 million visitors each year. Tourism is a major contributor to the city’s economy, with many visitors coming to see the city’s museums, galleries, and other attractions.
Demographics
As of 2020, Amsterdam had a population of 872,000 people. The city is home to a diverse population, with people from all over the world. The largest ethnic group is Dutch, followed by Turkish, Moroccan, and Surinamese.
The city is also home to a large number of immigrants, with over 40% of the population being foreign-born. The majority of immigrants come from other European countries, such as Turkey, Morocco, and Suriname.
The city is also home to a large number of students, with over 50,000 students enrolled in the city’s universities. The city is also home to a large number of expats, with many coming to work in the city’s financial and technology sectors.
Conclusion
Amsterdam is a vibrant and diverse city, with a rich cultural heritage and a thriving economy. The city is home to many large companies, financial institutions, and tourist attractions. It is also home to a diverse population, with people from all over the world. Amsterdam is a great place to live, work, and visit.
Common Questions
What is Per Capita Income in Amsterdam?
Per Capita income in Amsterdam is $25,097.
What is the Median Family Income in Amsterdam?
Median Family Income in Amsterdam is $40,000.
What is the Median Household income in Amsterdam?
Median Household Income in Amsterdam is $42,250.
What is Inequality or Gini Index in Amsterdam?
Inequality or Gini Index in Amsterdam is 0.29.
What is the Total Population of Amsterdam?
Total Population of Amsterdam is 146.
What is the Total Male Population of Amsterdam?
Total Male Population of Amsterdam is 77.
What is the Total Female Population of Amsterdam?
Total Female Population of Amsterdam is 69.
What is the Ratio of Males per 100 Females in Amsterdam?
There are 111.59 Males per 100 Females in Amsterdam.
What is the Ratio of Females per 100 Males in Amsterdam?
There are 89.61 Females per 100 Males in Amsterdam.
What is the Median Population Age in Amsterdam?
Median Population Age in Amsterdam is 50.9 Years.
What is the Average Family Size in Amsterdam
Average Family Size in Amsterdam is 2.8 People.
What is the Average Household Size in Amsterdam
Average Household Size in Amsterdam is 1.8 People.
How Large is the Labor Force in Amsterdam?
There are 54 People in the Labor Forcein in Amsterdam.
What is the Percentage of People in the Labor Force in Amsterdam?
39.7% of People are in the Labor Force in Amsterdam.
What is the Unemployment Rate in Amsterdam?
Unemployment Rate in Amsterdam is 1.9%.