Rutledge, MO Map & Demographics
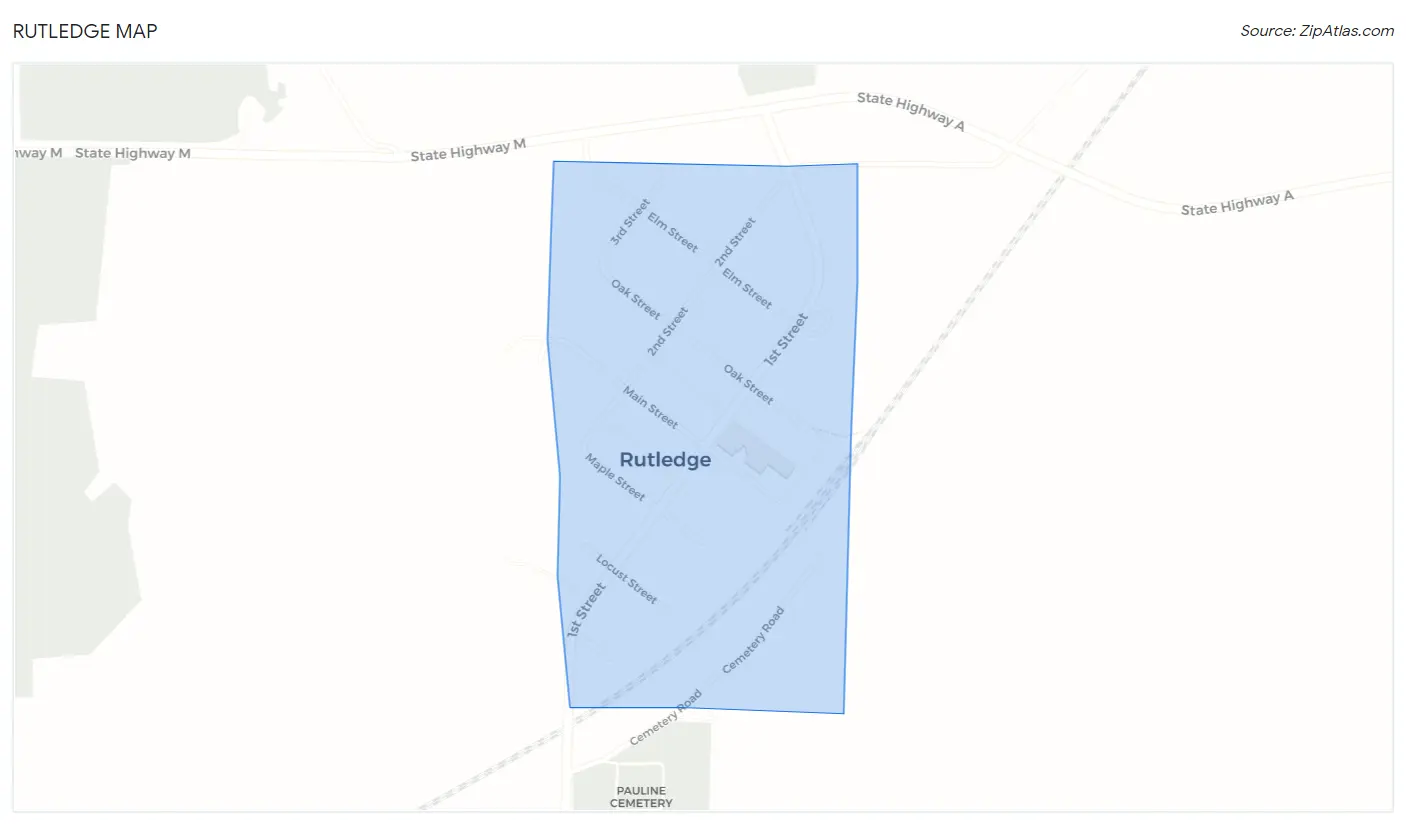
Rutledge Map
Rutledge Overview
$11,091
PER CAPITA INCOME
$91,250
AVG FAMILY INCOME
0.39
INEQUALITY / GINI INDEX
68
TOTAL POPULATION
44
MALE POPULATION
24
FEMALE POPULATION
183.33
MALES / 100 FEMALES
54.55
FEMALES / 100 MALES
14.3
MEDIAN AGE
9.8
AVG FAMILY SIZE
5.7
AVG HOUSEHOLD SIZE
17
LABOR FORCE [ PEOPLE ]
54.8%
PERCENT IN LABOR FORCE
Rutledge Zip Codes
Rutledge Area Codes
Income in Rutledge
Income Overview in Rutledge
| Characteristic | Number | Measure |
| Per Capita Income | 68 | $11,091 |
| Median Family Income | 6 | $91,250 |
| Mean Family Income | 6 | $92,567 |
| Median Household Income | 12 | $0 |
| Mean Household Income | 12 | $60,433 |
| Income Deficit | 6 | $0 |
| Wage / Income Gap (%) | 68 | 0.00% |
| Wage / Income Gap ($) | 68 | 100.00¢ per $1 |
| Gini / Inequality Index | 68 | 0.39 |
Earnings by Sex in Rutledge
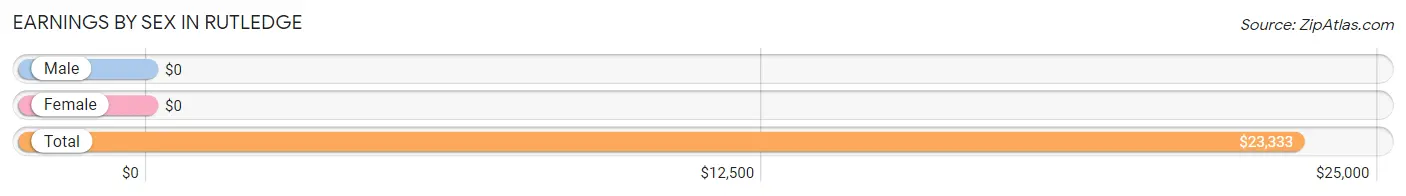
| Sex | Number | Average Earnings |
| Male | 14 (70.0%) | $0 |
| Female | 6 (30.0%) | $0 |
| Total | 20 (100.0%) | $23,333 |
Earnings by Sex by Income Bracket in Rutledge
The most common earnings brackets in Rutledge are $5,000 to $7,499 for men (5 | 35.7%) and $22,500 to $24,999 for women (3 | 50.0%).
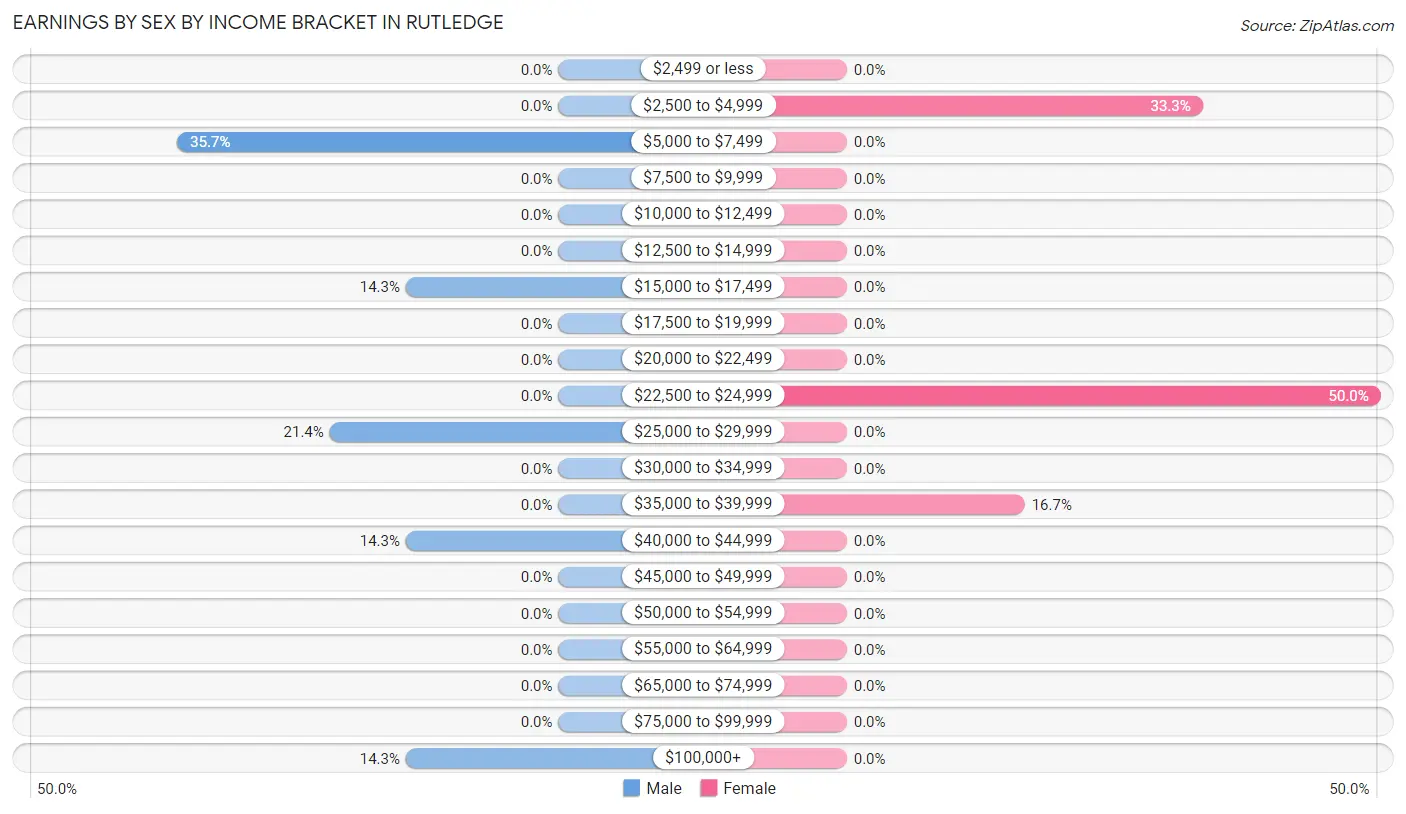
| Income | Male | Female |
| $2,499 or less | 0 (0.0%) | 0 (0.0%) |
| $2,500 to $4,999 | 0 (0.0%) | 2 (33.3%) |
| $5,000 to $7,499 | 5 (35.7%) | 0 (0.0%) |
| $7,500 to $9,999 | 0 (0.0%) | 0 (0.0%) |
| $10,000 to $12,499 | 0 (0.0%) | 0 (0.0%) |
| $12,500 to $14,999 | 0 (0.0%) | 0 (0.0%) |
| $15,000 to $17,499 | 2 (14.3%) | 0 (0.0%) |
| $17,500 to $19,999 | 0 (0.0%) | 0 (0.0%) |
| $20,000 to $22,499 | 0 (0.0%) | 0 (0.0%) |
| $22,500 to $24,999 | 0 (0.0%) | 3 (50.0%) |
| $25,000 to $29,999 | 3 (21.4%) | 0 (0.0%) |
| $30,000 to $34,999 | 0 (0.0%) | 0 (0.0%) |
| $35,000 to $39,999 | 0 (0.0%) | 1 (16.7%) |
| $40,000 to $44,999 | 2 (14.3%) | 0 (0.0%) |
| $45,000 to $49,999 | 0 (0.0%) | 0 (0.0%) |
| $50,000 to $54,999 | 0 (0.0%) | 0 (0.0%) |
| $55,000 to $64,999 | 0 (0.0%) | 0 (0.0%) |
| $65,000 to $74,999 | 0 (0.0%) | 0 (0.0%) |
| $75,000 to $99,999 | 0 (0.0%) | 0 (0.0%) |
| $100,000+ | 2 (14.3%) | 0 (0.0%) |
| Total | 14 (100.0%) | 6 (100.0%) |
Earnings by Sex by Educational Attainment in Rutledge
| Educational Attainment | Male Income | Female Income |
| Less than High School | - | - |
| High School Diploma | - | - |
| College or Associate's Degree | - | - |
| Bachelor's Degree | - | - |
| Graduate Degree | - | - |
| Total | - | - |
Family Income in Rutledge
Family Income Brackets in Rutledge
According to the Rutledge family income data, there are 2 families falling into the $75,000 to $99,999 income range, which is the most common income bracket and makes up 33.3% of all families.
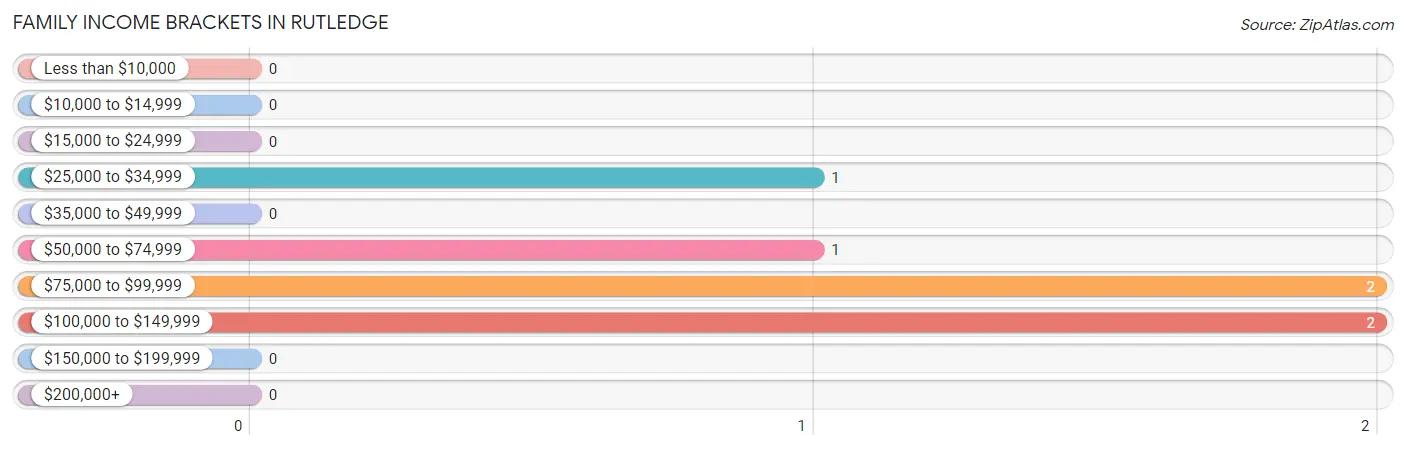
| Income Bracket | # Families | % Families |
| Less than $10,000 | 0 | 0.0% |
| $10,000 to $14,999 | 0 | 0.0% |
| $15,000 to $24,999 | 0 | 0.0% |
| $25,000 to $34,999 | 1 | 16.7% |
| $35,000 to $49,999 | 0 | 0.0% |
| $50,000 to $74,999 | 1 | 16.7% |
| $75,000 to $99,999 | 2 | 33.3% |
| $100,000 to $149,999 | 2 | 33.3% |
| $150,000 to $199,999 | 0 | 0.0% |
| $200,000+ | 0 | 0.0% |
Family Income by Famaliy Size in Rutledge
| Income Bracket | # Families | Median Income |
| 2-Person Families | 2 (33.3%) | $0 |
| 3-Person Families | 0 (0.0%) | $0 |
| 4-Person Families | 0 (0.0%) | $0 |
| 5-Person Families | 2 (33.3%) | $0 |
| 6-Person Families | 0 (0.0%) | $0 |
| 7+ Person Families | 2 (33.3%) | $0 |
| Total | 6 (100.0%) | $91,250 |
Family Income by Number of Earners in Rutledge
| Number of Earners | # Families | Median Income |
| No Earners | 1 (16.7%) | $0 |
| 1 Earner | 1 (16.7%) | $0 |
| 2 Earners | 2 (33.3%) | $0 |
| 3+ Earners | 2 (33.3%) | $0 |
| Total | 6 (100.0%) | $91,250 |
Household Income in Rutledge
Household Income Brackets in Rutledge
With 4 households falling in the category, the $15,000 to $24,999 income range is the most frequent in Rutledge, accounting for 33.3% of all households.
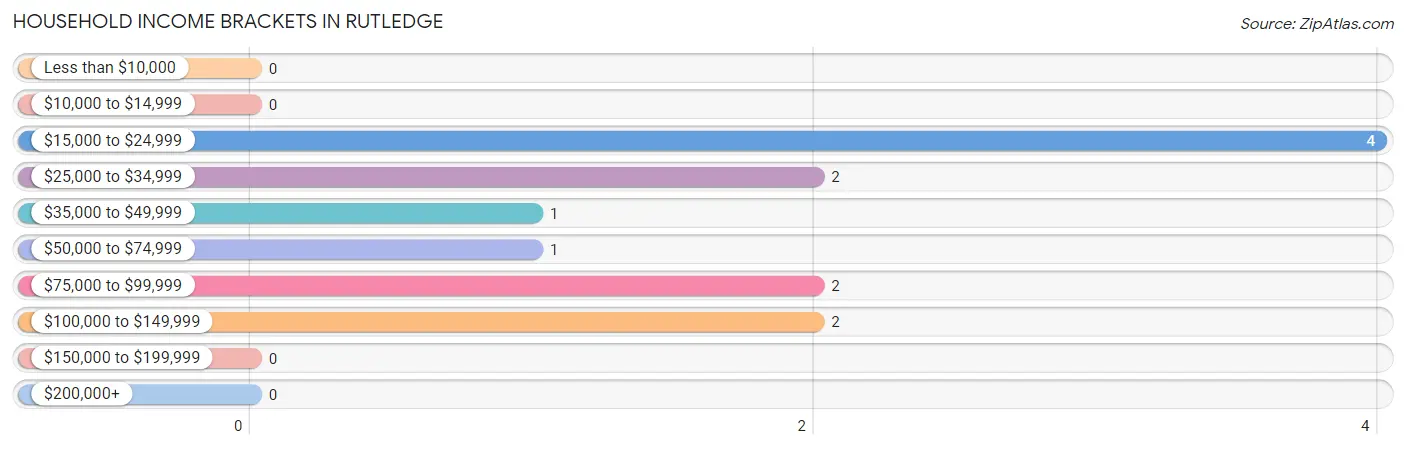
| Income Bracket | # Households | % Households |
| Less than $10,000 | 0 | 0.0% |
| $10,000 to $14,999 | 0 | 0.0% |
| $15,000 to $24,999 | 4 | 33.3% |
| $25,000 to $34,999 | 2 | 16.7% |
| $35,000 to $49,999 | 1 | 8.3% |
| $50,000 to $74,999 | 1 | 8.3% |
| $75,000 to $99,999 | 2 | 16.7% |
| $100,000 to $149,999 | 2 | 16.7% |
| $150,000 to $199,999 | 0 | 0.0% |
| $200,000+ | 0 | 0.0% |
Household Income by Householder Age in Rutledge
The median household income in Rutledge is $0, with the highest median household income of $24,375 found in the 65+ years age bracket for the primary householder. A total of 5 households (41.7%) fall into this category. Meanwhile, the 15 to 24 years age bracket for the primary householder has the lowest median household income of $0, with 1 households (8.3%) in this group.
| Income Bracket | # Households | Median Income |
| 15 to 24 Years | 1 (8.3%) | $0 |
| 25 to 44 Years | 2 (16.7%) | $0 |
| 45 to 64 Years | 4 (33.3%) | $0 |
| 65+ Years | 5 (41.7%) | $24,375 |
| Total | 12 (100.0%) | $0 |
Poverty in Rutledge
Income Below Poverty by Sex and Age in Rutledge
With 2.3% poverty level for males and 8.3% for females among the residents of Rutledge, 65 to 74 year old males and 75 year old and over females are the most vulnerable to poverty, with 1 males (100.0%) and 2 females (66.7%) in their respective age groups living below the poverty level.
| Age Bracket | Male | Female |
| Under 5 Years | 0 (0.0%) | 0 (0.0%) |
| 5 Years | 0 (0.0%) | 0 (0.0%) |
| 6 to 11 Years | 0 (0.0%) | 0 (0.0%) |
| 12 to 14 Years | 0 (0.0%) | 0 (0.0%) |
| 15 Years | 0 (0.0%) | 0 (0.0%) |
| 16 and 17 Years | 0 (0.0%) | 0 (0.0%) |
| 18 to 24 Years | 0 (0.0%) | 0 (0.0%) |
| 25 to 34 Years | 0 (0.0%) | 0 (0.0%) |
| 35 to 44 Years | 0 (0.0%) | 0 (0.0%) |
| 45 to 54 Years | 0 (0.0%) | 0 (0.0%) |
| 55 to 64 Years | 0 (0.0%) | 0 (0.0%) |
| 65 to 74 Years | 1 (100.0%) | 0 (0.0%) |
| 75 Years and over | 0 (0.0%) | 2 (66.7%) |
| Total | 1 (2.3%) | 2 (8.3%) |
Income Above Poverty by Sex and Age in Rutledge
According to the poverty statistics in Rutledge, males aged under 5 years and females aged under 5 years are the age groups that are most secure financially, with 100.0% of males and 100.0% of females in these age groups living above the poverty line.
| Age Bracket | Male | Female |
| Under 5 Years | 14 (100.0%) | 5 (100.0%) |
| 5 Years | 0 (0.0%) | 0 (0.0%) |
| 6 to 11 Years | 5 (100.0%) | 3 (100.0%) |
| 12 to 14 Years | 8 (100.0%) | 2 (100.0%) |
| 15 Years | 0 (0.0%) | 0 (0.0%) |
| 16 and 17 Years | 5 (100.0%) | 0 (0.0%) |
| 18 to 24 Years | 4 (100.0%) | 1 (100.0%) |
| 25 to 34 Years | 0 (0.0%) | 0 (0.0%) |
| 35 to 44 Years | 2 (100.0%) | 4 (100.0%) |
| 45 to 54 Years | 1 (100.0%) | 1 (100.0%) |
| 55 to 64 Years | 2 (100.0%) | 2 (100.0%) |
| 65 to 74 Years | 0 (0.0%) | 3 (100.0%) |
| 75 Years and over | 2 (100.0%) | 1 (33.3%) |
| Total | 43 (97.7%) | 22 (91.7%) |
Income Below Poverty Among Married-Couple Families in Rutledge
| Children | Above Poverty | Below Poverty |
| No Children | 1 (100.0%) | 0 (0.0%) |
| 1 or 2 Children | 2 (100.0%) | 0 (0.0%) |
| 3 or 4 Children | 0 (0.0%) | 0 (0.0%) |
| 5 or more Children | 2 (100.0%) | 0 (0.0%) |
| Total | 5 (100.0%) | 0 (0.0%) |
Income Below Poverty Among Single-Parent Households in Rutledge
| Children | Single Father | Single Mother |
| No Children | 0 (0.0%) | 0 (0.0%) |
| 1 or 2 Children | 0 (0.0%) | 0 (0.0%) |
| 3 or 4 Children | 0 (0.0%) | 0 (0.0%) |
| 5 or more Children | 0 (0.0%) | 0 (0.0%) |
| Total | 0 (0.0%) | 0 (0.0%) |
Income Below Poverty Among Married-Couple vs Single-Parent Households in Rutledge
| Children | Married-Couple Families | Single-Parent Households |
| No Children | 0 (0.0%) | 0 (0.0%) |
| 1 or 2 Children | 0 (0.0%) | 0 (0.0%) |
| 3 or 4 Children | 0 (0.0%) | 0 (0.0%) |
| 5 or more Children | 0 (0.0%) | 0 (0.0%) |
| Total | 0 (0.0%) | 0 (0.0%) |
Race in Rutledge
The most populous races in Rutledge are White / Caucasian (66 | 97.1%), and Some other Race (2 | 2.9%).
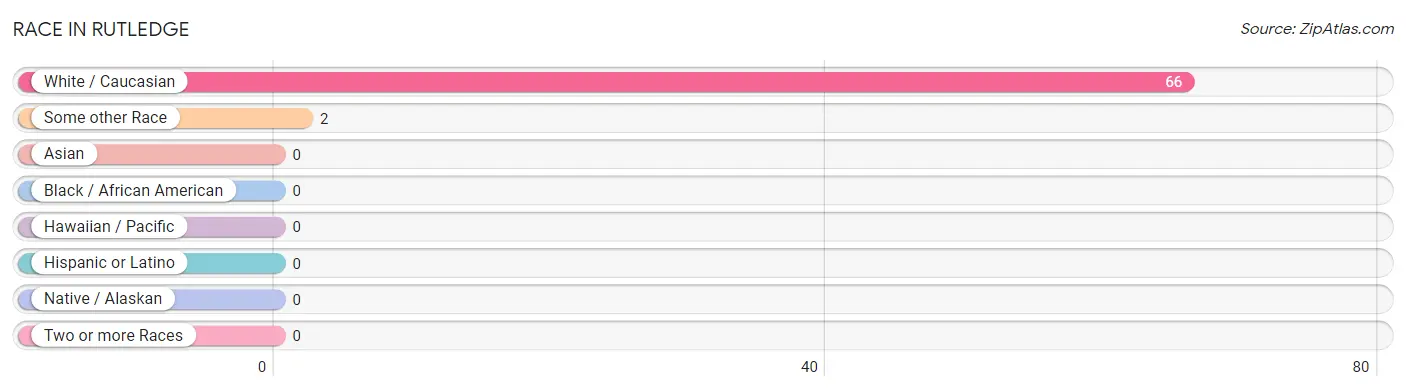
| Race | # Population | % Population |
| Asian | 0 | 0.0% |
| Black / African American | 0 | 0.0% |
| Hawaiian / Pacific | 0 | 0.0% |
| Hispanic or Latino | 0 | 0.0% |
| Native / Alaskan | 0 | 0.0% |
| White / Caucasian | 66 | 97.1% |
| Two or more Races | 0 | 0.0% |
| Some other Race | 2 | 2.9% |
| Total | 68 | 100.0% |
Ancestry in Rutledge
The most populous ancestries reported in Rutledge are German (15 | 22.1%), English (2 | 2.9%), Norwegian (2 | 2.9%), and Irish (1 | 1.5%), together accounting for 29.4% of all Rutledge residents.
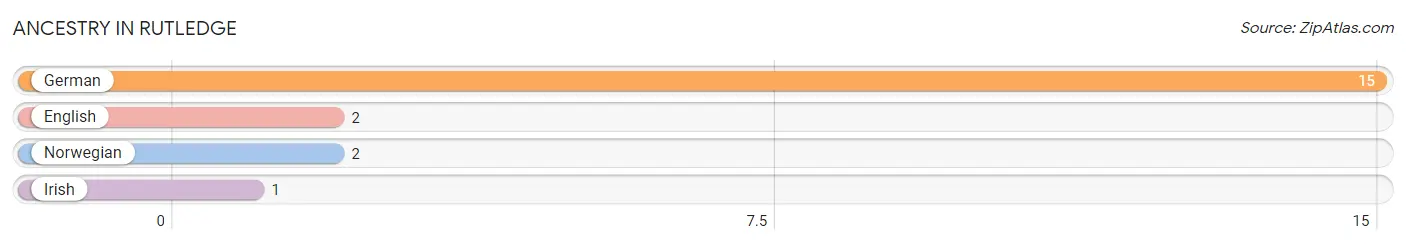
| Ancestry | # Population | % Population |
| English | 2 | 2.9% |
| German | 15 | 22.1% |
| Irish | 1 | 1.5% |
| Norwegian | 2 | 2.9% | View All 4 Rows |
Immigrants in Rutledge

| Immigration Origin | # Population | % Population | View All 0 Rows |
Sex and Age in Rutledge
Sex and Age in Rutledge
The most populous age groups in Rutledge are Under 5 Years (14 | 31.8%) for men and Under 5 Years (5 | 20.8%) for women.
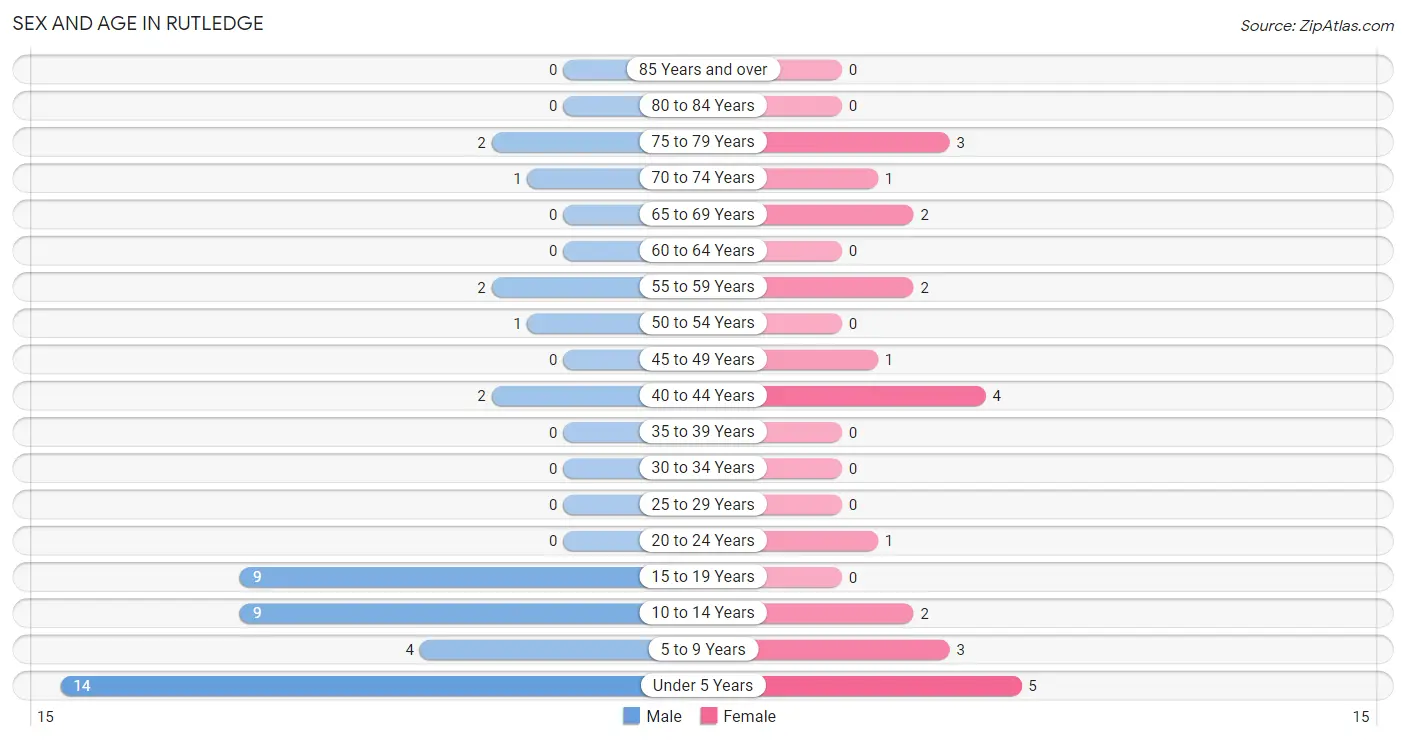
| Age Bracket | Male | Female |
| Under 5 Years | 14 (31.8%) | 5 (20.8%) |
| 5 to 9 Years | 4 (9.1%) | 3 (12.5%) |
| 10 to 14 Years | 9 (20.4%) | 2 (8.3%) |
| 15 to 19 Years | 9 (20.4%) | 0 (0.0%) |
| 20 to 24 Years | 0 (0.0%) | 1 (4.2%) |
| 25 to 29 Years | 0 (0.0%) | 0 (0.0%) |
| 30 to 34 Years | 0 (0.0%) | 0 (0.0%) |
| 35 to 39 Years | 0 (0.0%) | 0 (0.0%) |
| 40 to 44 Years | 2 (4.5%) | 4 (16.7%) |
| 45 to 49 Years | 0 (0.0%) | 1 (4.2%) |
| 50 to 54 Years | 1 (2.3%) | 0 (0.0%) |
| 55 to 59 Years | 2 (4.5%) | 2 (8.3%) |
| 60 to 64 Years | 0 (0.0%) | 0 (0.0%) |
| 65 to 69 Years | 0 (0.0%) | 2 (8.3%) |
| 70 to 74 Years | 1 (2.3%) | 1 (4.2%) |
| 75 to 79 Years | 2 (4.5%) | 3 (12.5%) |
| 80 to 84 Years | 0 (0.0%) | 0 (0.0%) |
| 85 Years and over | 0 (0.0%) | 0 (0.0%) |
| Total | 44 (100.0%) | 24 (100.0%) |
Families and Households in Rutledge
Median Family Size in Rutledge
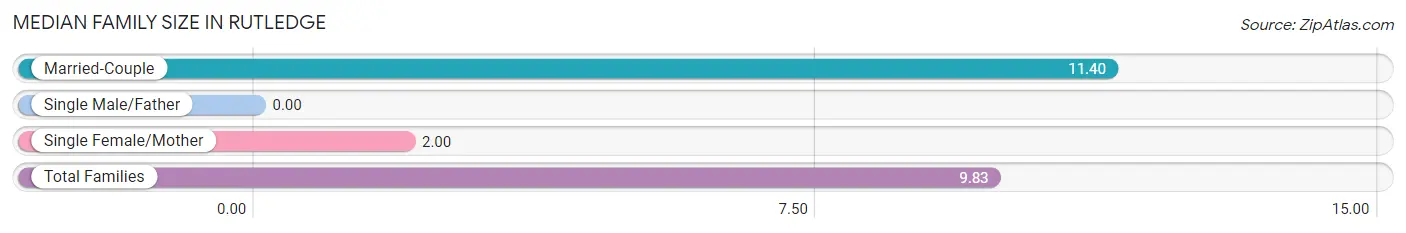
| Family Type | # Families | Family Size |
| Married-Couple | 5 (83.3%) | 11.40 |
| Single Male/Father | 0 (0.0%) | - |
| Single Female/Mother | 1 (16.7%) | 2.00 |
| Total Families | 6 (100.0%) | 9.83 |
Median Household Size in Rutledge
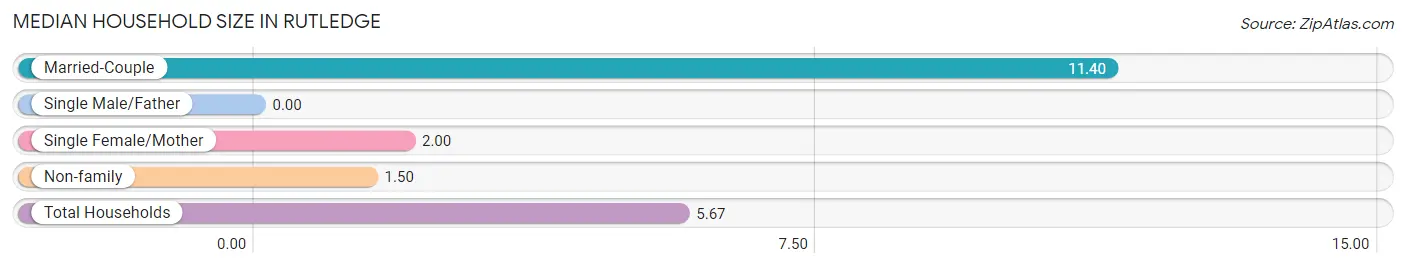
| Household Type | # Households | Household Size |
| Married-Couple | 5 (41.7%) | 11.40 |
| Single Male/Father | 0 (0.0%) | - |
| Single Female/Mother | 1 (8.3%) | 2.00 |
| Non-family | 6 (50.0%) | 1.50 |
| Total Households | 12 (100.0%) | 5.67 |
Household Size by Marriage Status in Rutledge
Out of a total of 12 households in Rutledge, 6 (50.0%) are family households, while 6 (50.0%) are nonfamily households. The most numerous type of family households are 2-person households, comprising 2, and the most common type of nonfamily households are 1-person households, comprising 4.
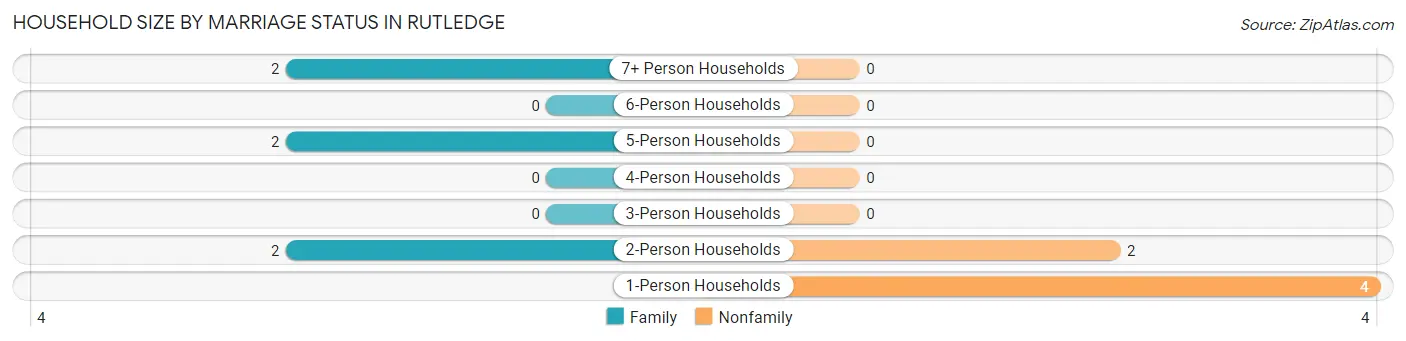
| Household Size | Family Households | Nonfamily Households |
| 1-Person Households | - | 4 (33.3%) |
| 2-Person Households | 2 (16.7%) | 2 (16.7%) |
| 3-Person Households | 0 (0.0%) | 0 (0.0%) |
| 4-Person Households | 0 (0.0%) | 0 (0.0%) |
| 5-Person Households | 2 (16.7%) | 0 (0.0%) |
| 6-Person Households | 0 (0.0%) | 0 (0.0%) |
| 7+ Person Households | 2 (16.7%) | 0 (0.0%) |
| Total | 6 (50.0%) | 6 (50.0%) |
Female Fertility in Rutledge
Fertility by Age in Rutledge
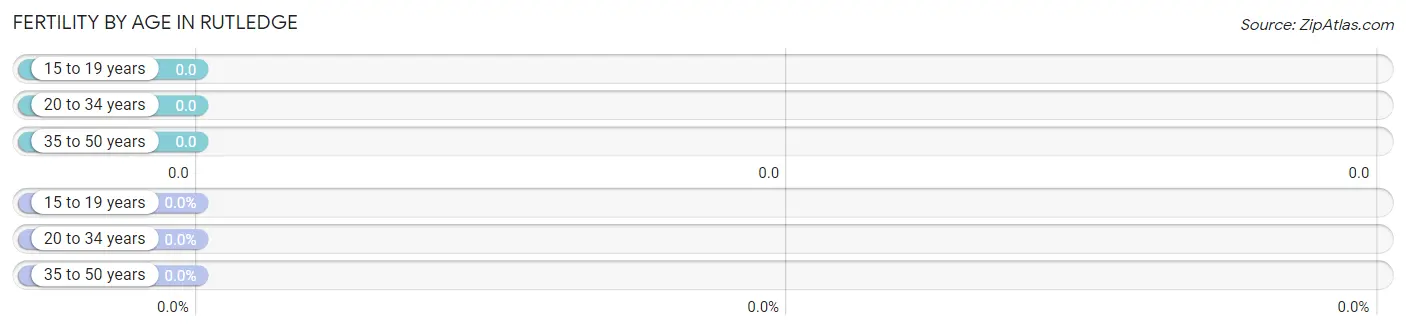
| Age Bracket | Women with Births | Births / 1,000 Women |
| 15 to 19 years | 0 (0.0%) | 0.0 |
| 20 to 34 years | 0 (0.0%) | 0.0 |
| 35 to 50 years | 0 (0.0%) | 0.0 |
| Total | 0 (0.0%) | 0.0 |
Fertility by Age by Marriage Status in Rutledge
| Age Bracket | Married | Unmarried |
| 15 to 19 years | 0 (0.0%) | 0 (0.0%) |
| 20 to 34 years | 0 (0.0%) | 0 (0.0%) |
| 35 to 50 years | 0 (0.0%) | 0 (0.0%) |
| Total | 0 (0.0%) | 0 (0.0%) |
Fertility by Education in Rutledge
| Educational Attainment | Women with Births | Births / 1,000 Women |
| Less than High School | 0 (0.0%) | 0.0 |
| High School Diploma | 0 (0.0%) | 0.0 |
| College or Associate's Degree | 0 (0.0%) | 0.0 |
| Bachelor's Degree | 0 (0.0%) | 0.0 |
| Graduate Degree | 0 (0.0%) | 0.0 |
| Total | 0 (0.0%) | 0.0 |
Fertility by Education by Marriage Status in Rutledge
| Educational Attainment | Married | Unmarried |
| Less than High School | 0 (0.0%) | 0 (0.0%) |
| High School Diploma | 0 (0.0%) | 0 (0.0%) |
| College or Associate's Degree | 0 (0.0%) | 0 (0.0%) |
| Bachelor's Degree | 0 (0.0%) | 0 (0.0%) |
| Graduate Degree | 0 (0.0%) | 0 (0.0%) |
| Total | 0 (0.0%) | 0 (0.0%) |
Employment Characteristics in Rutledge
Employment by Class of Employer in Rutledge
Among the 17 employed individuals in Rutledge, private company employees (13 | 76.5%), and self-employed (not incorporated) (4 | 23.5%) make up the most common classes of employment.
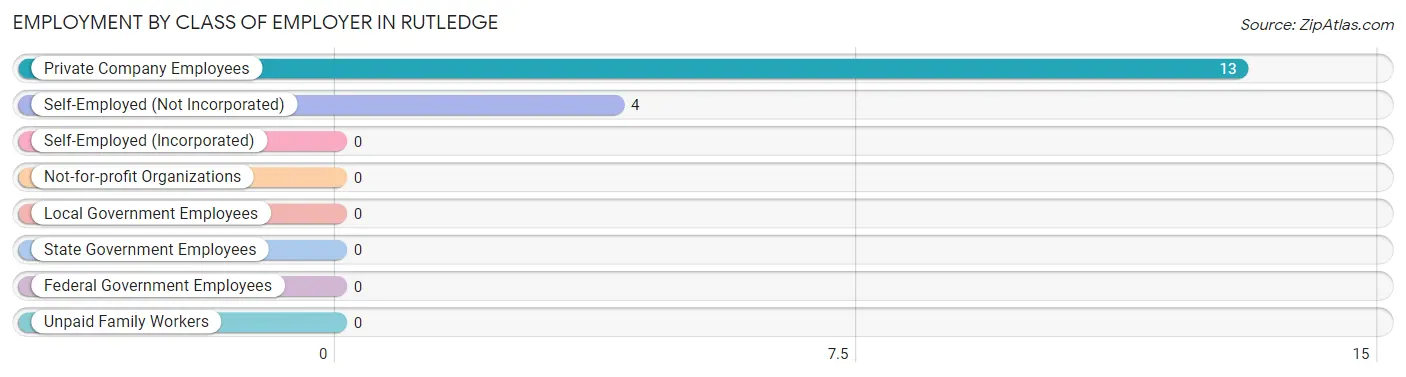
| Employer Class | # Employees | % Employees |
| Private Company Employees | 13 | 76.5% |
| Self-Employed (Incorporated) | 0 | 0.0% |
| Self-Employed (Not Incorporated) | 4 | 23.5% |
| Not-for-profit Organizations | 0 | 0.0% |
| Local Government Employees | 0 | 0.0% |
| State Government Employees | 0 | 0.0% |
| Federal Government Employees | 0 | 0.0% |
| Unpaid Family Workers | 0 | 0.0% |
| Total | 17 | 100.0% |
Employment Status by Age in Rutledge
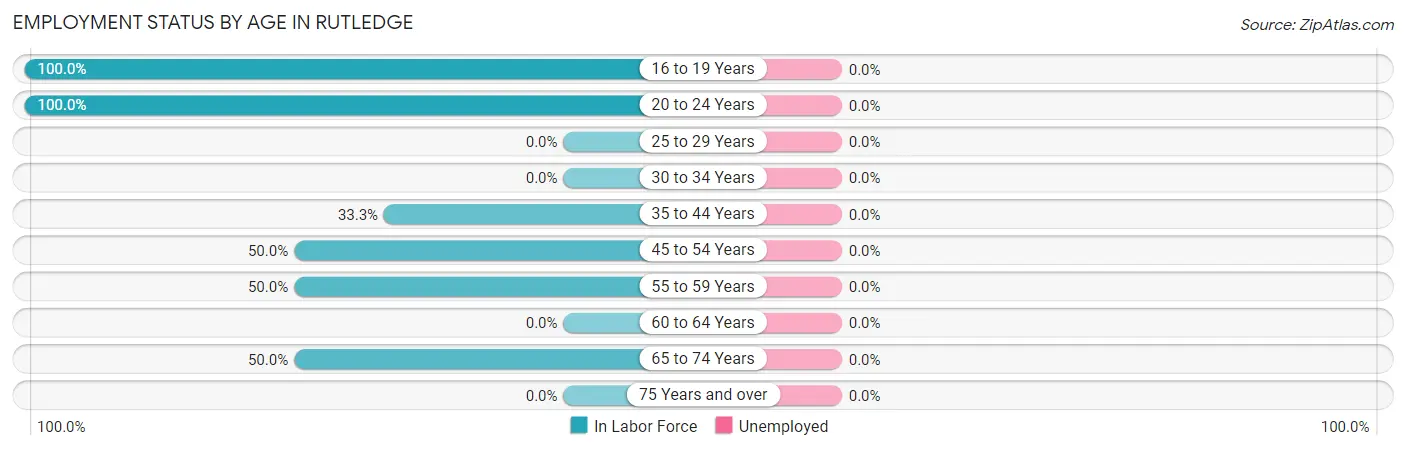
| Age Bracket | In Labor Force | Unemployed |
| 16 to 19 Years | 9 (100.0%) | 0 (0.0%) |
| 20 to 24 Years | 1 (100.0%) | 0 (0.0%) |
| 25 to 29 Years | 0 (0.0%) | 0 (0.0%) |
| 30 to 34 Years | 0 (0.0%) | 0 (0.0%) |
| 35 to 44 Years | 2 (33.3%) | 0 (0.0%) |
| 45 to 54 Years | 1 (50.0%) | 0 (0.0%) |
| 55 to 59 Years | 2 (50.0%) | 0 (0.0%) |
| 60 to 64 Years | 0 (0.0%) | 0 (0.0%) |
| 65 to 74 Years | 2 (50.0%) | 0 (0.0%) |
| 75 Years and over | 0 (0.0%) | 0 (0.0%) |
| Total | 17 (54.8%) | 0 (0.0%) |
Employment Status by Educational Attainment in Rutledge
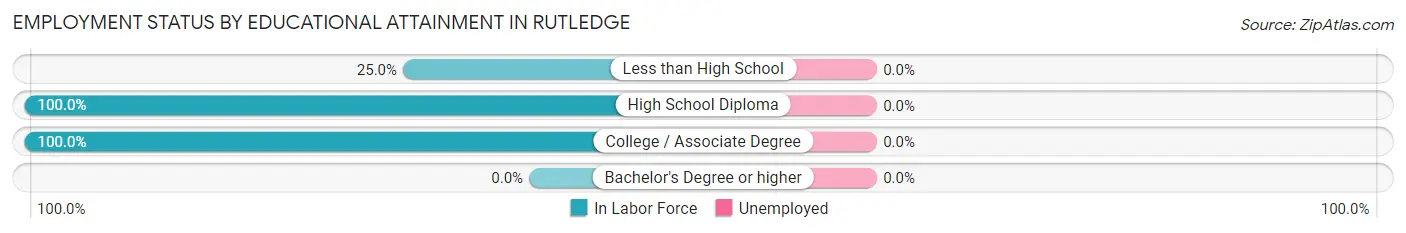
| Educational Attainment | In Labor Force | Unemployed |
| Less than High School | 2 (25.0%) | 0 (0.0%) |
| High School Diploma | 2 (100.0%) | 0 (0.0%) |
| College / Associate Degree | 1 (100.0%) | 0 (0.0%) |
| Bachelor's Degree or higher | 0 (0.0%) | 0 (0.0%) |
| Total | 5 (41.7%) | 0 (0.0%) |
Employment Occupations by Sex in Rutledge
Management, Business, Science and Arts Occupations
Management, Business, Science and Arts Occupations by Sex
| Occupation | Male | Female |
| Management | 0 (0.0%) | 0 (0.0%) |
| Business & Financial | 0 (0.0%) | 0 (0.0%) |
| Computers, Engineering & Science | 0 (0.0%) | 0 (0.0%) |
| Computers & Mathematics | 0 (0.0%) | 0 (0.0%) |
| Architecture & Engineering | 0 (0.0%) | 0 (0.0%) |
| Life, Physical & Social Science | 0 (0.0%) | 0 (0.0%) |
| Community & Social Service | 0 (0.0%) | 0 (0.0%) |
| Education, Arts & Media | 0 (0.0%) | 0 (0.0%) |
| Legal Services & Support | 0 (0.0%) | 0 (0.0%) |
| Education Instruction & Library | 0 (0.0%) | 0 (0.0%) |
| Arts, Media & Entertainment | 0 (0.0%) | 0 (0.0%) |
| Health Diagnosing & Treating | 0 (0.0%) | 0 (0.0%) |
| Health Technologists | 0 (0.0%) | 0 (0.0%) |
| Total (Category) | 0 (0.0%) | 0 (0.0%) |
| Total (Overall) | 14 (82.4%) | 3 (17.6%) |
Services Occupations
Services Occupations by Sex
| Occupation | Male | Female |
| Healthcare Support | 0 (0.0%) | 0 (0.0%) |
| Security & Protection | 0 (0.0%) | 0 (0.0%) |
| Firefighting & Prevention | 0 (0.0%) | 0 (0.0%) |
| Law Enforcement | 0 (0.0%) | 0 (0.0%) |
| Food Preparation & Serving | 0 (0.0%) | 0 (0.0%) |
| Cleaning & Maintenance | 0 (0.0%) | 0 (0.0%) |
| Personal Care & Service | 0 (0.0%) | 0 (0.0%) |
| Total (Category) | 0 (0.0%) | 0 (0.0%) |
| Total (Overall) | 14 (82.4%) | 3 (17.6%) |
Sales and Office Occupations
The most common Sales and Office occupations in Rutledge are , and Sales & Related (5 | 29.4%).
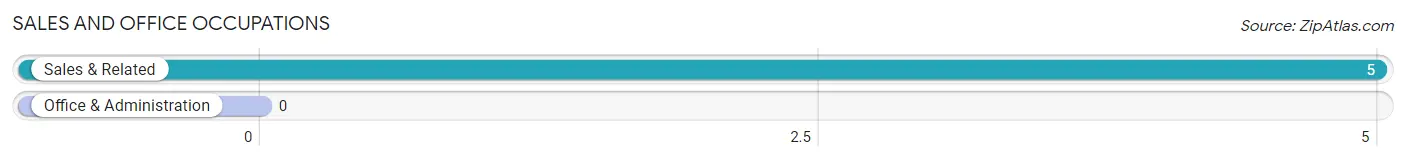
Sales and Office Occupations by Sex
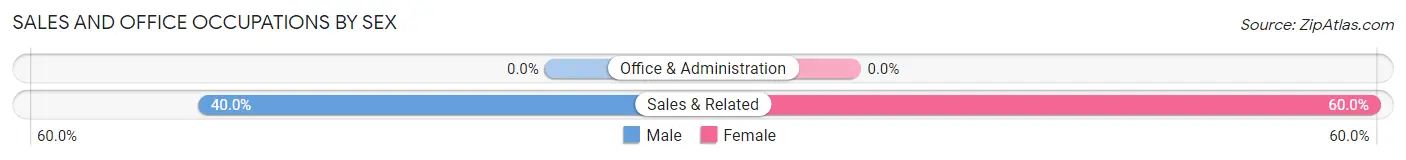
| Occupation | Male | Female |
| Sales & Related | 2 (40.0%) | 3 (60.0%) |
| Office & Administration | 0 (0.0%) | 0 (0.0%) |
| Total (Category) | 2 (40.0%) | 3 (60.0%) |
| Total (Overall) | 14 (82.4%) | 3 (17.6%) |
Natural Resources, Construction and Maintenance Occupations
The most common Natural Resources, Construction and Maintenance occupations in Rutledge are , and Installation, Maintenance & Repair (5 | 29.4%).
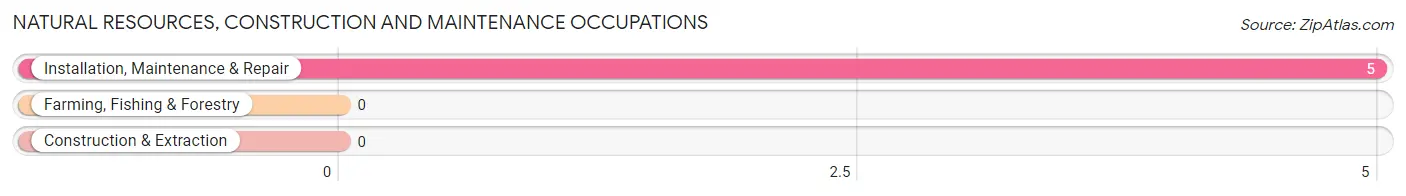
Natural Resources, Construction and Maintenance Occupations by Sex
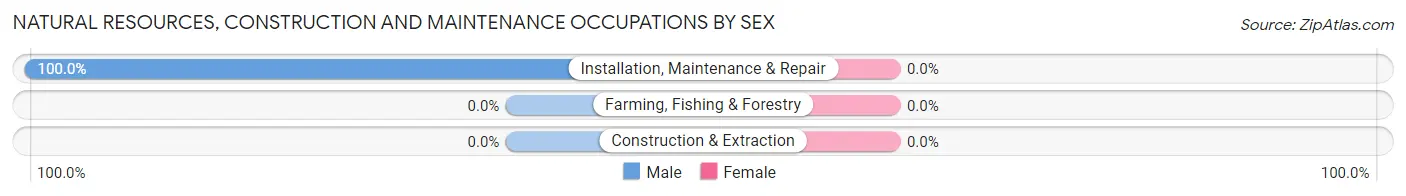
| Occupation | Male | Female |
| Farming, Fishing & Forestry | 0 (0.0%) | 0 (0.0%) |
| Construction & Extraction | 0 (0.0%) | 0 (0.0%) |
| Installation, Maintenance & Repair | 5 (100.0%) | 0 (0.0%) |
| Total (Category) | 5 (100.0%) | 0 (0.0%) |
| Total (Overall) | 14 (82.4%) | 3 (17.6%) |
Production, Transportation and Moving Occupations
The most common Production, Transportation and Moving occupations in Rutledge are Production (5 | 29.4%), and Transportation (2 | 11.8%).
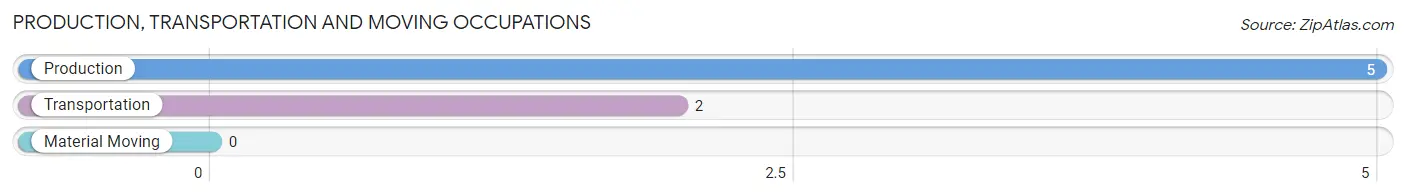
Production, Transportation and Moving Occupations by Sex
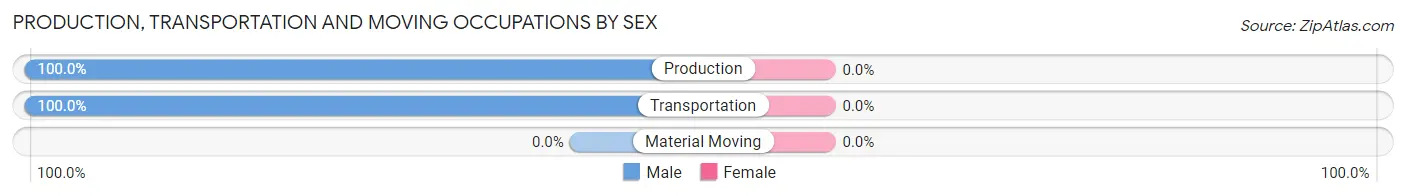
| Occupation | Male | Female |
| Production | 5 (100.0%) | 0 (0.0%) |
| Transportation | 2 (100.0%) | 0 (0.0%) |
| Material Moving | 0 (0.0%) | 0 (0.0%) |
| Total (Category) | 7 (100.0%) | 0 (0.0%) |
| Total (Overall) | 14 (82.4%) | 3 (17.6%) |
Employment Industries by Sex in Rutledge
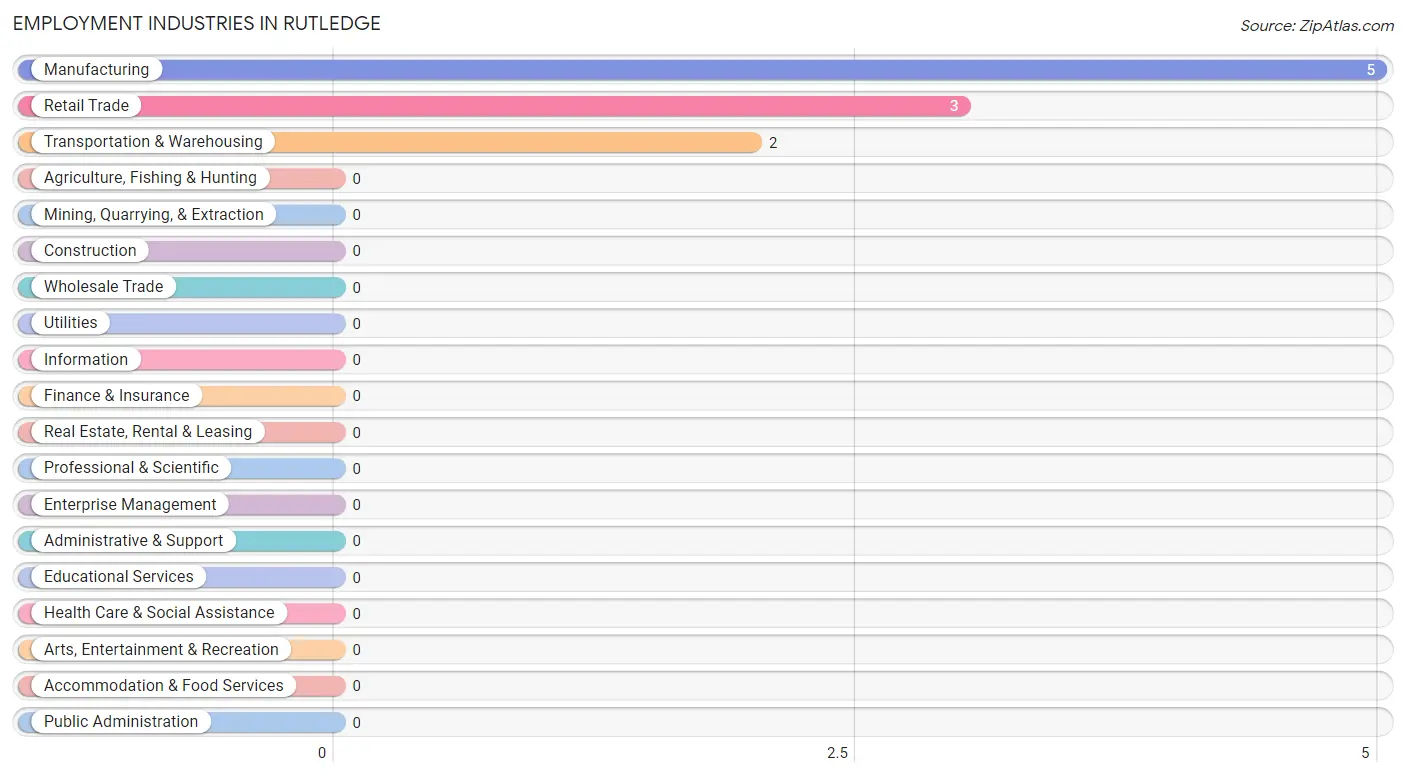
Employment Industries in Rutledge
The major employment industries in Rutledge include Manufacturing (5 | 29.4%), Retail Trade (3 | 17.6%), and Transportation & Warehousing (2 | 11.8%).
Employment Industries by Sex in Rutledge
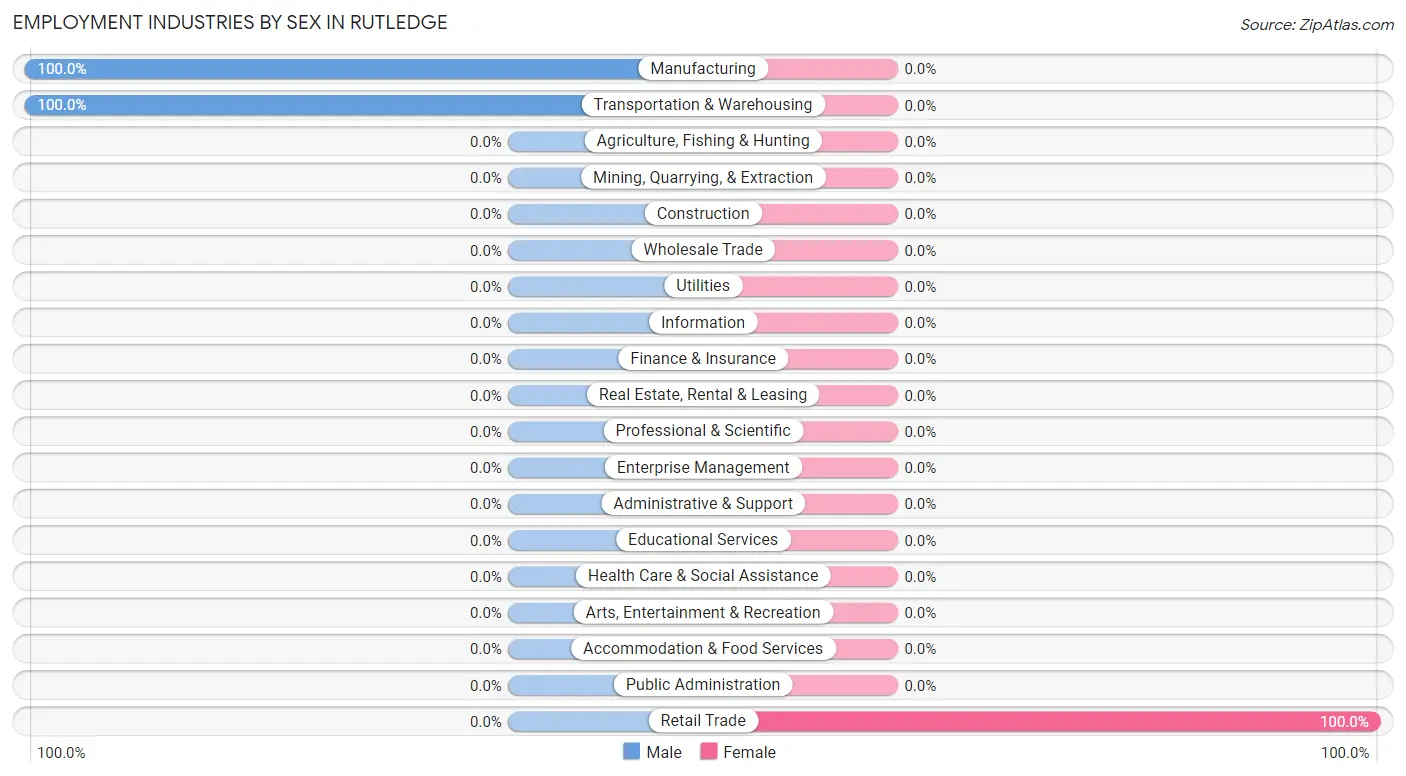
| Industry | Male | Female |
| Agriculture, Fishing & Hunting | 0 (0.0%) | 0 (0.0%) |
| Mining, Quarrying, & Extraction | 0 (0.0%) | 0 (0.0%) |
| Construction | 0 (0.0%) | 0 (0.0%) |
| Manufacturing | 5 (100.0%) | 0 (0.0%) |
| Wholesale Trade | 0 (0.0%) | 0 (0.0%) |
| Retail Trade | 0 (0.0%) | 3 (100.0%) |
| Transportation & Warehousing | 2 (100.0%) | 0 (0.0%) |
| Utilities | 0 (0.0%) | 0 (0.0%) |
| Information | 0 (0.0%) | 0 (0.0%) |
| Finance & Insurance | 0 (0.0%) | 0 (0.0%) |
| Real Estate, Rental & Leasing | 0 (0.0%) | 0 (0.0%) |
| Professional & Scientific | 0 (0.0%) | 0 (0.0%) |
| Enterprise Management | 0 (0.0%) | 0 (0.0%) |
| Administrative & Support | 0 (0.0%) | 0 (0.0%) |
| Educational Services | 0 (0.0%) | 0 (0.0%) |
| Health Care & Social Assistance | 0 (0.0%) | 0 (0.0%) |
| Arts, Entertainment & Recreation | 0 (0.0%) | 0 (0.0%) |
| Accommodation & Food Services | 0 (0.0%) | 0 (0.0%) |
| Public Administration | 0 (0.0%) | 0 (0.0%) |
| Total | 14 (82.4%) | 3 (17.6%) |
Education in Rutledge
School Enrollment in Rutledge
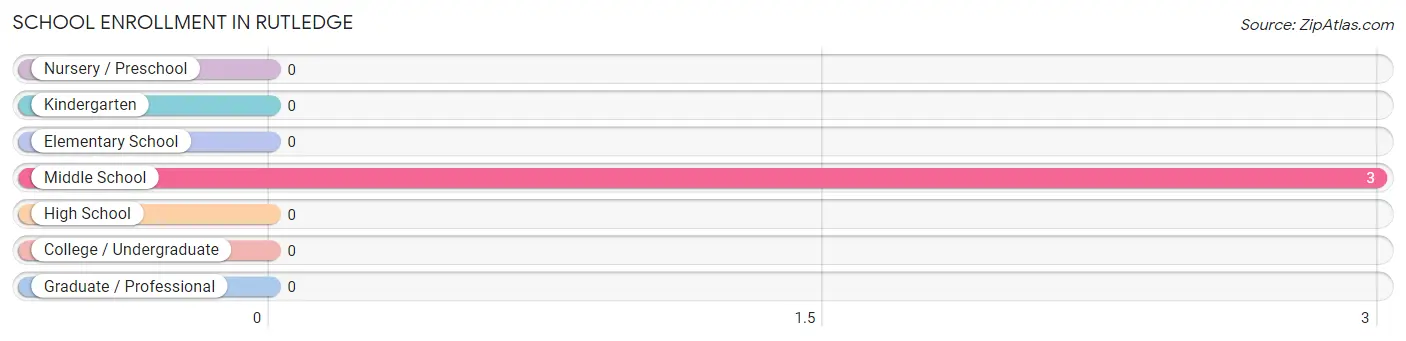
| School Level | # Students | % Students |
| Nursery / Preschool | 0 | 0.0% |
| Kindergarten | 0 | 0.0% |
| Elementary School | 0 | 0.0% |
| Middle School | 3 | 100.0% |
| High School | 0 | 0.0% |
| College / Undergraduate | 0 | 0.0% |
| Graduate / Professional | 0 | 0.0% |
| Total | 3 | 100.0% |
School Enrollment by Age by Funding Source in Rutledge
Out of a total of 3 students who are enrolled in schools in Rutledge, 2 (66.7%) attend a private institution, while the remaining 1 (33.3%) are enrolled in public schools. The age group of 10 to 14 year olds has the highest likelihood of being enrolled in private schools, with 2 (66.7% in the age bracket) enrolled. Conversely, the age group of 10 to 14 year olds has the lowest likelihood of being enrolled in a private school, with 1 (33.3% in the age bracket) attending a public institution.
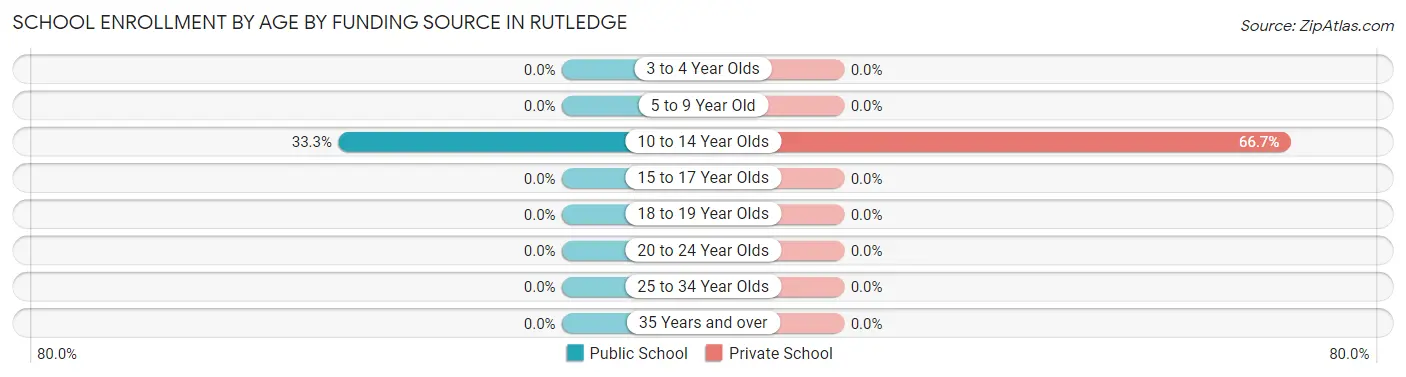
| Age Bracket | Public School | Private School |
| 3 to 4 Year Olds | 0 (0.0%) | 0 (0.0%) |
| 5 to 9 Year Old | 0 (0.0%) | 0 (0.0%) |
| 10 to 14 Year Olds | 1 (33.3%) | 2 (66.7%) |
| 15 to 17 Year Olds | 0 (0.0%) | 0 (0.0%) |
| 18 to 19 Year Olds | 0 (0.0%) | 0 (0.0%) |
| 20 to 24 Year Olds | 0 (0.0%) | 0 (0.0%) |
| 25 to 34 Year Olds | 0 (0.0%) | 0 (0.0%) |
| 35 Years and over | 0 (0.0%) | 0 (0.0%) |
| Total | 1 (33.3%) | 2 (66.7%) |
Educational Attainment by Field of Study in Rutledge
, and business (1 | 100.0%) are the most common fields of study among 1 individuals in Rutledge who have obtained a bachelor's degree or higher.
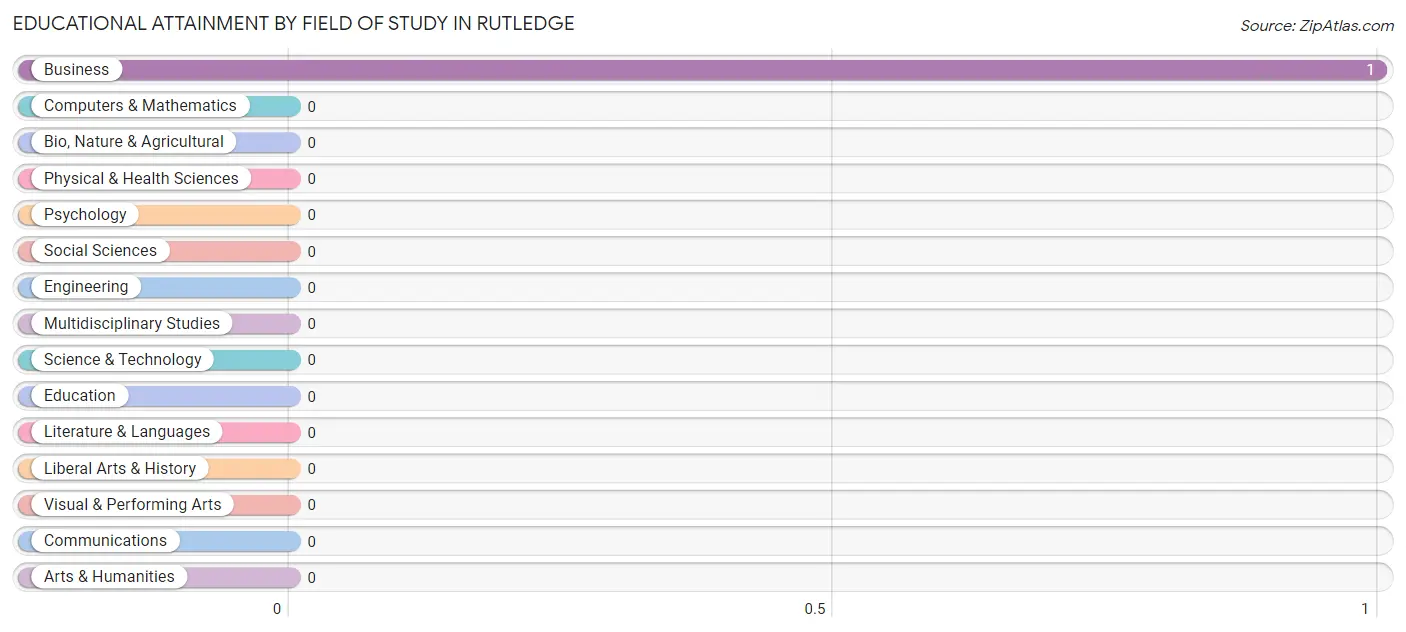
| Field of Study | # Graduates | % Graduates |
| Computers & Mathematics | 0 | 0.0% |
| Bio, Nature & Agricultural | 0 | 0.0% |
| Physical & Health Sciences | 0 | 0.0% |
| Psychology | 0 | 0.0% |
| Social Sciences | 0 | 0.0% |
| Engineering | 0 | 0.0% |
| Multidisciplinary Studies | 0 | 0.0% |
| Science & Technology | 0 | 0.0% |
| Business | 1 | 100.0% |
| Education | 0 | 0.0% |
| Literature & Languages | 0 | 0.0% |
| Liberal Arts & History | 0 | 0.0% |
| Visual & Performing Arts | 0 | 0.0% |
| Communications | 0 | 0.0% |
| Arts & Humanities | 0 | 0.0% |
| Total | 1 | 100.0% |
Transportation & Commute in Rutledge
Vehicle Availability by Sex in Rutledge
The most prevalent vehicle ownership categories in Rutledge are males with 5 or more vehicles (13, accounting for 92.9%) and females with 5 or more vehicles (0, making up 433.3%).
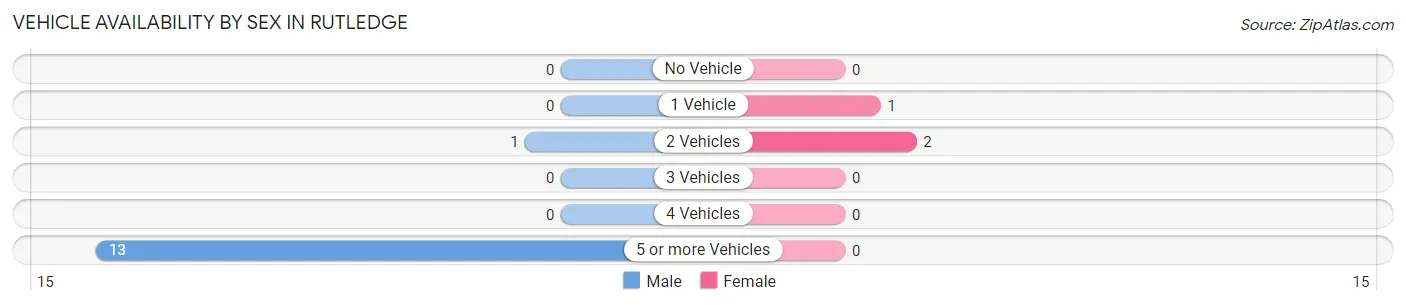
| Vehicles Available | Male | Female |
| No Vehicle | 0 (0.0%) | 0 (0.0%) |
| 1 Vehicle | 0 (0.0%) | 1 (33.3%) |
| 2 Vehicles | 1 (7.1%) | 2 (66.7%) |
| 3 Vehicles | 0 (0.0%) | 0 (0.0%) |
| 4 Vehicles | 0 (0.0%) | 0 (0.0%) |
| 5 or more Vehicles | 13 (92.9%) | 0 (0.0%) |
| Total | 14 (100.0%) | 3 (100.0%) |
Commute Time in Rutledge
The most frequently occuring commute durations in Rutledge are less than 5 minutes (7 commuters, 46.7%), 45 to 59 minutes (3 commuters, 20.0%), and 5 to 9 minutes (2 commuters, 13.3%).
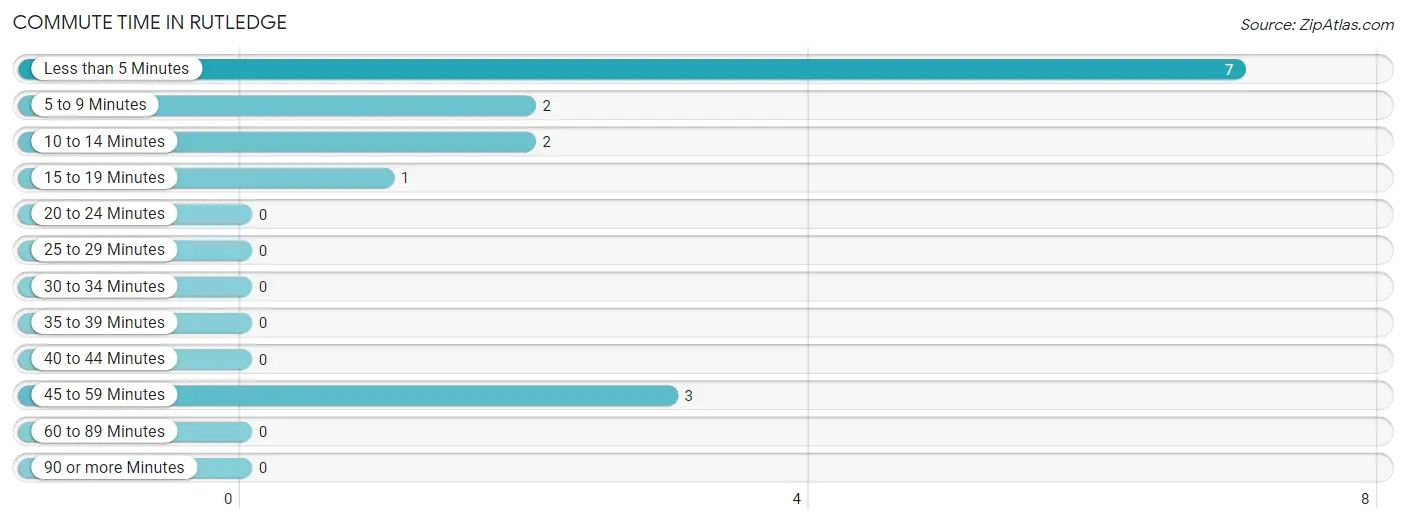
| Commute Time | # Commuters | % Commuters |
| Less than 5 Minutes | 7 | 46.7% |
| 5 to 9 Minutes | 2 | 13.3% |
| 10 to 14 Minutes | 2 | 13.3% |
| 15 to 19 Minutes | 1 | 6.7% |
| 20 to 24 Minutes | 0 | 0.0% |
| 25 to 29 Minutes | 0 | 0.0% |
| 30 to 34 Minutes | 0 | 0.0% |
| 35 to 39 Minutes | 0 | 0.0% |
| 40 to 44 Minutes | 0 | 0.0% |
| 45 to 59 Minutes | 3 | 20.0% |
| 60 to 89 Minutes | 0 | 0.0% |
| 90 or more Minutes | 0 | 0.0% |
Commute Time by Sex in Rutledge
The most common commute times in Rutledge are less than 5 minutes (7 commuters, 58.3%) for males and 10 to 14 minutes (2 commuters, 66.7%) for females.
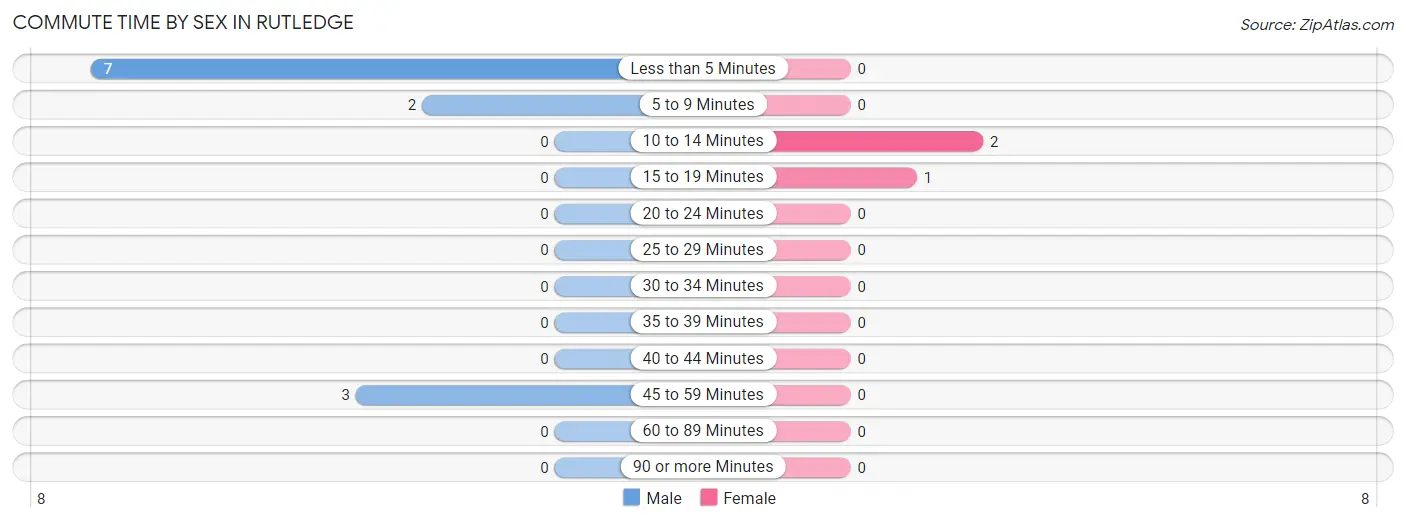
| Commute Time | Male | Female |
| Less than 5 Minutes | 7 (58.3%) | 0 (0.0%) |
| 5 to 9 Minutes | 2 (16.7%) | 0 (0.0%) |
| 10 to 14 Minutes | 0 (0.0%) | 2 (66.7%) |
| 15 to 19 Minutes | 0 (0.0%) | 1 (33.3%) |
| 20 to 24 Minutes | 0 (0.0%) | 0 (0.0%) |
| 25 to 29 Minutes | 0 (0.0%) | 0 (0.0%) |
| 30 to 34 Minutes | 0 (0.0%) | 0 (0.0%) |
| 35 to 39 Minutes | 0 (0.0%) | 0 (0.0%) |
| 40 to 44 Minutes | 0 (0.0%) | 0 (0.0%) |
| 45 to 59 Minutes | 3 (25.0%) | 0 (0.0%) |
| 60 to 89 Minutes | 0 (0.0%) | 0 (0.0%) |
| 90 or more Minutes | 0 (0.0%) | 0 (0.0%) |
Time of Departure to Work by Sex in Rutledge
The most frequent times of departure to work in Rutledge are 7:30 AM to 7:59 AM (7, 58.3%) for males and 12:00 PM to 3:59 PM (2, 66.7%) for females.
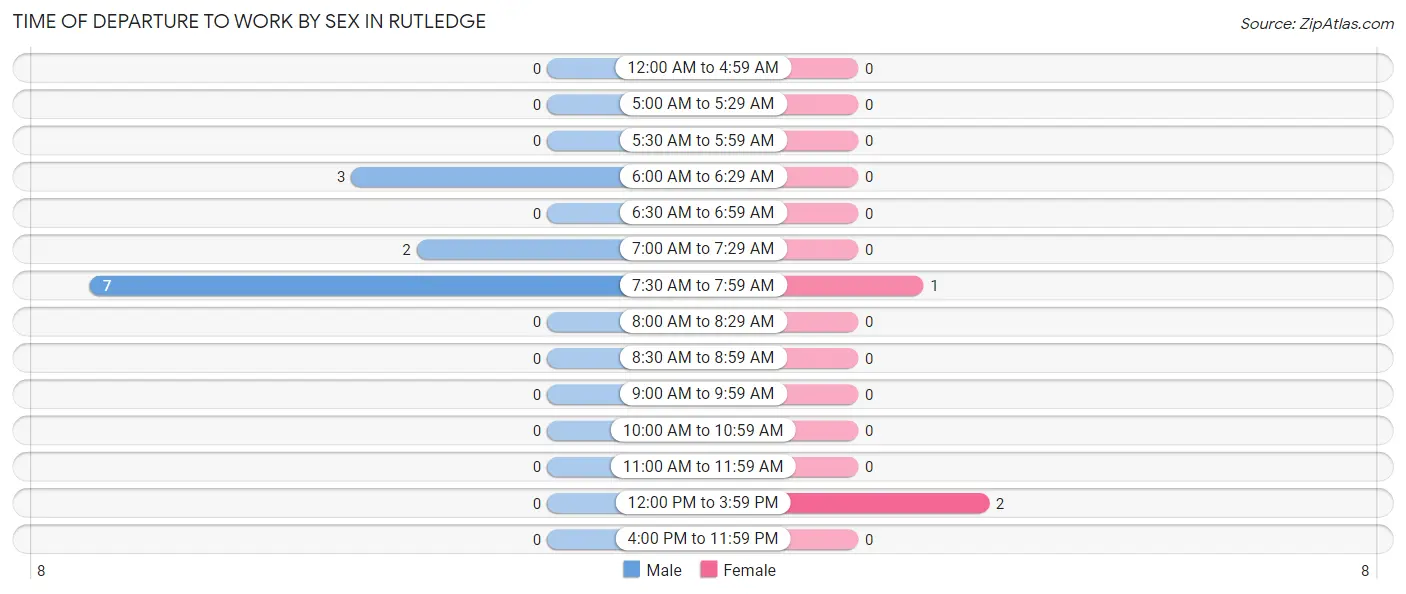
| Time of Departure | Male | Female |
| 12:00 AM to 4:59 AM | 0 (0.0%) | 0 (0.0%) |
| 5:00 AM to 5:29 AM | 0 (0.0%) | 0 (0.0%) |
| 5:30 AM to 5:59 AM | 0 (0.0%) | 0 (0.0%) |
| 6:00 AM to 6:29 AM | 3 (25.0%) | 0 (0.0%) |
| 6:30 AM to 6:59 AM | 0 (0.0%) | 0 (0.0%) |
| 7:00 AM to 7:29 AM | 2 (16.7%) | 0 (0.0%) |
| 7:30 AM to 7:59 AM | 7 (58.3%) | 1 (33.3%) |
| 8:00 AM to 8:29 AM | 0 (0.0%) | 0 (0.0%) |
| 8:30 AM to 8:59 AM | 0 (0.0%) | 0 (0.0%) |
| 9:00 AM to 9:59 AM | 0 (0.0%) | 0 (0.0%) |
| 10:00 AM to 10:59 AM | 0 (0.0%) | 0 (0.0%) |
| 11:00 AM to 11:59 AM | 0 (0.0%) | 0 (0.0%) |
| 12:00 PM to 3:59 PM | 0 (0.0%) | 2 (66.7%) |
| 4:00 PM to 11:59 PM | 0 (0.0%) | 0 (0.0%) |
| Total | 12 (100.0%) | 3 (100.0%) |
Housing Occupancy in Rutledge
Occupancy by Ownership in Rutledge
Of the total 12 dwellings in Rutledge, owner-occupied units account for 9 (75.0%), while renter-occupied units make up 3 (25.0%).
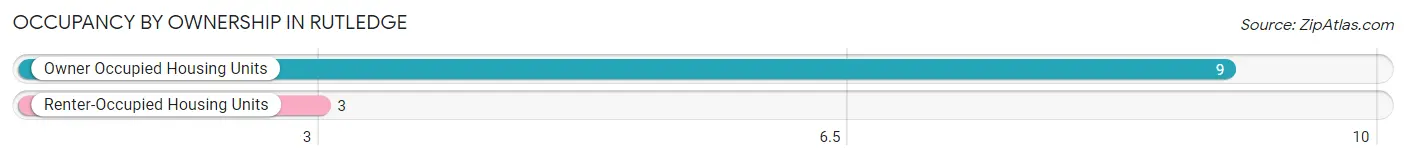
| Occupancy | # Housing Units | % Housing Units |
| Owner Occupied Housing Units | 9 | 75.0% |
| Renter-Occupied Housing Units | 3 | 25.0% |
| Total Occupied Housing Units | 12 | 100.0% |
Occupancy by Household Size in Rutledge
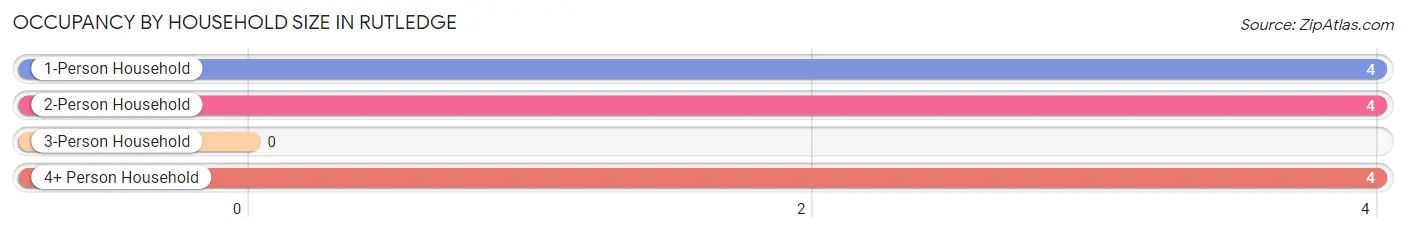
| Household Size | # Housing Units | % Housing Units |
| 1-Person Household | 4 | 33.3% |
| 2-Person Household | 4 | 33.3% |
| 3-Person Household | 0 | 0.0% |
| 4+ Person Household | 4 | 33.3% |
| Total Housing Units | 12 | 100.0% |
Occupancy by Ownership by Household Size in Rutledge
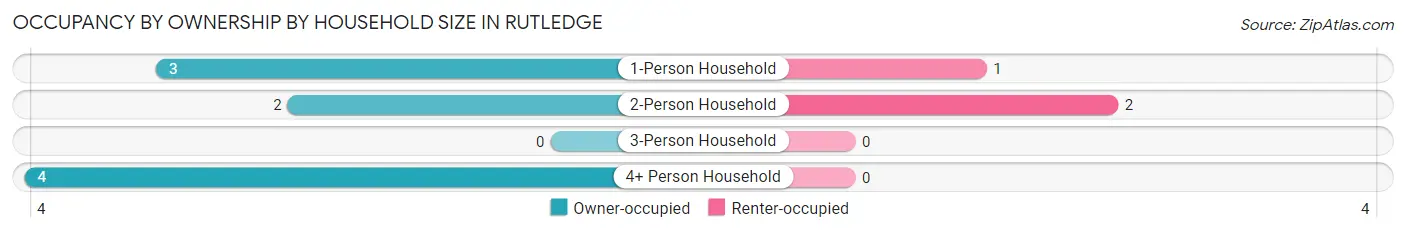
| Household Size | Owner-occupied | Renter-occupied |
| 1-Person Household | 3 (75.0%) | 1 (25.0%) |
| 2-Person Household | 2 (50.0%) | 2 (50.0%) |
| 3-Person Household | 0 (0.0%) | 0 (0.0%) |
| 4+ Person Household | 4 (100.0%) | 0 (0.0%) |
| Total Housing Units | 9 (75.0%) | 3 (25.0%) |
Occupancy by Educational Attainment in Rutledge
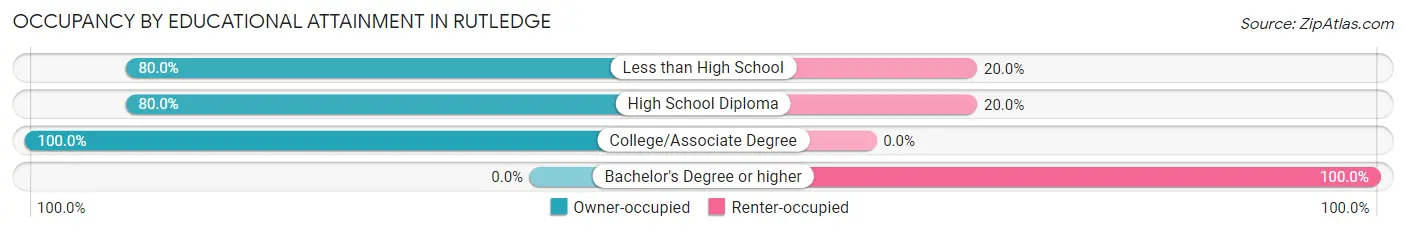
| Household Size | Owner-occupied | Renter-occupied |
| Less than High School | 4 (80.0%) | 1 (20.0%) |
| High School Diploma | 4 (80.0%) | 1 (20.0%) |
| College/Associate Degree | 1 (100.0%) | 0 (0.0%) |
| Bachelor's Degree or higher | 0 (0.0%) | 1 (100.0%) |
Occupancy by Age of Householder in Rutledge
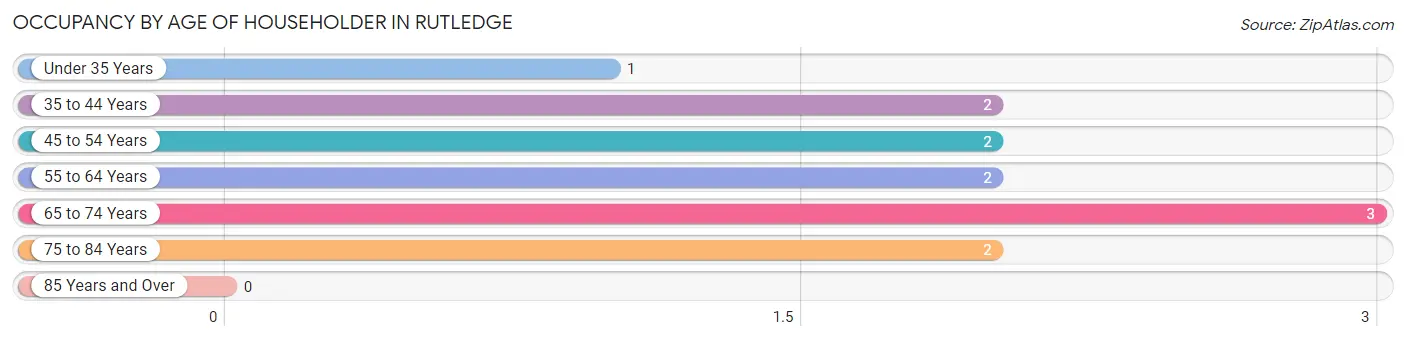
| Age Bracket | # Households | % Households |
| Under 35 Years | 1 | 8.3% |
| 35 to 44 Years | 2 | 16.7% |
| 45 to 54 Years | 2 | 16.7% |
| 55 to 64 Years | 2 | 16.7% |
| 65 to 74 Years | 3 | 25.0% |
| 75 to 84 Years | 2 | 16.7% |
| 85 Years and Over | 0 | 0.0% |
| Total | 12 | 100.0% |
Housing Finances in Rutledge
Median Income by Occupancy in Rutledge
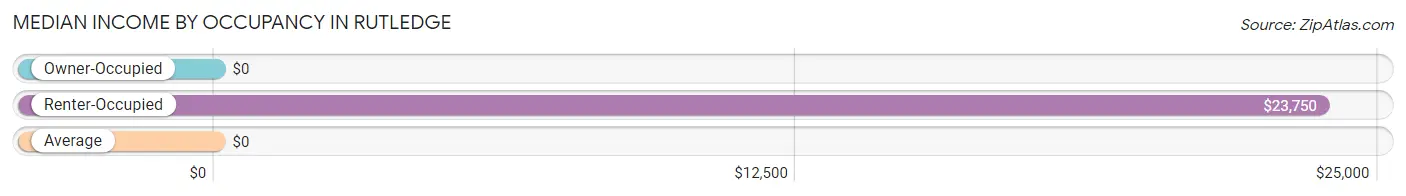
| Occupancy Type | # Households | Median Income |
| Owner-Occupied | 9 (75.0%) | $0 |
| Renter-Occupied | 3 (25.0%) | $23,750 |
| Average | 12 (100.0%) | $0 |
Occupancy by Householder Income Bracket in Rutledge
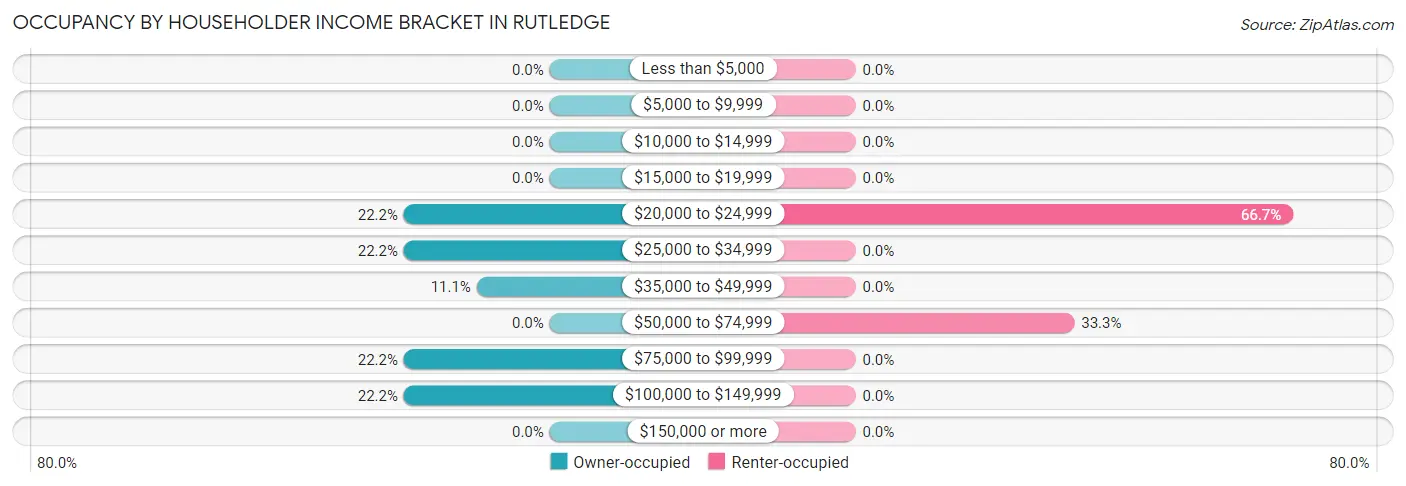
| Income Bracket | Owner-occupied | Renter-occupied |
| Less than $5,000 | 0 (0.0%) | 0 (0.0%) |
| $5,000 to $9,999 | 0 (0.0%) | 0 (0.0%) |
| $10,000 to $14,999 | 0 (0.0%) | 0 (0.0%) |
| $15,000 to $19,999 | 0 (0.0%) | 0 (0.0%) |
| $20,000 to $24,999 | 2 (22.2%) | 2 (66.7%) |
| $25,000 to $34,999 | 2 (22.2%) | 0 (0.0%) |
| $35,000 to $49,999 | 1 (11.1%) | 0 (0.0%) |
| $50,000 to $74,999 | 0 (0.0%) | 1 (33.3%) |
| $75,000 to $99,999 | 2 (22.2%) | 0 (0.0%) |
| $100,000 to $149,999 | 2 (22.2%) | 0 (0.0%) |
| $150,000 or more | 0 (0.0%) | 0 (0.0%) |
| Total | 9 (100.0%) | 3 (100.0%) |
Monthly Housing Cost Tiers in Rutledge
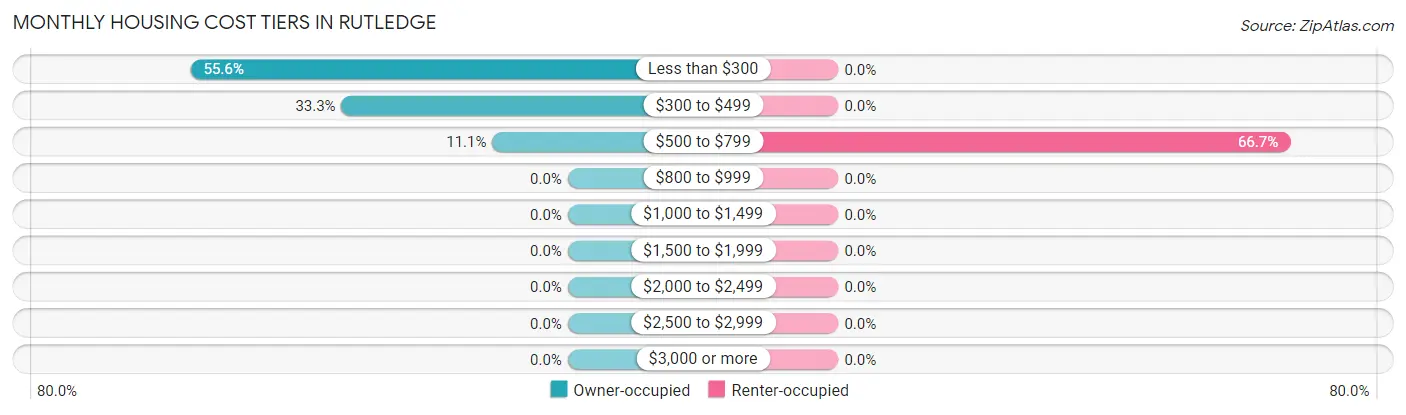
| Monthly Cost | Owner-occupied | Renter-occupied |
| Less than $300 | 5 (55.6%) | 0 (0.0%) |
| $300 to $499 | 3 (33.3%) | 0 (0.0%) |
| $500 to $799 | 1 (11.1%) | 2 (66.7%) |
| $800 to $999 | 0 (0.0%) | 0 (0.0%) |
| $1,000 to $1,499 | 0 (0.0%) | 0 (0.0%) |
| $1,500 to $1,999 | 0 (0.0%) | 0 (0.0%) |
| $2,000 to $2,499 | 0 (0.0%) | 0 (0.0%) |
| $2,500 to $2,999 | 0 (0.0%) | 0 (0.0%) |
| $3,000 or more | 0 (0.0%) | 0 (0.0%) |
| Total | 9 (100.0%) | 3 (100.0%) |
Physical Housing Characteristics in Rutledge
Housing Structures in Rutledge
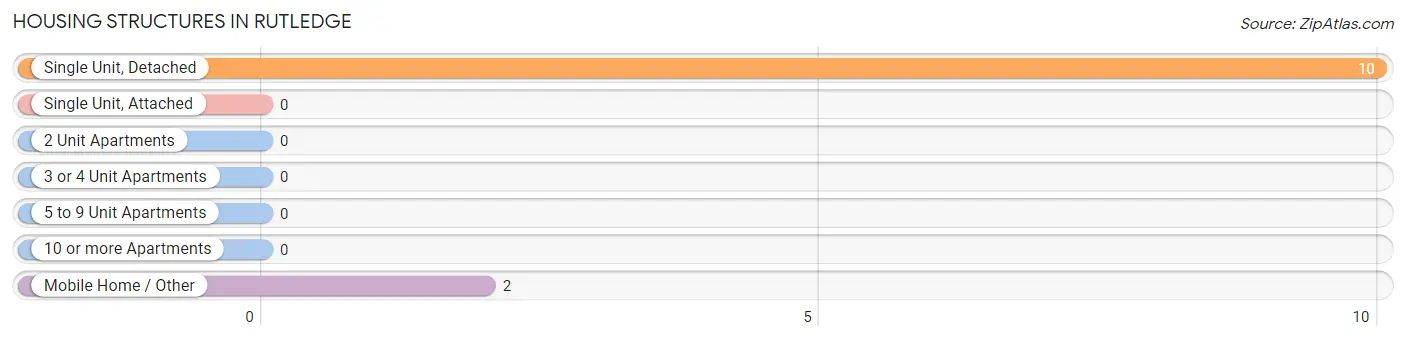
| Structure Type | # Housing Units | % Housing Units |
| Single Unit, Detached | 10 | 83.3% |
| Single Unit, Attached | 0 | 0.0% |
| 2 Unit Apartments | 0 | 0.0% |
| 3 or 4 Unit Apartments | 0 | 0.0% |
| 5 to 9 Unit Apartments | 0 | 0.0% |
| 10 or more Apartments | 0 | 0.0% |
| Mobile Home / Other | 2 | 16.7% |
| Total | 12 | 100.0% |
Housing Structures by Occupancy in Rutledge
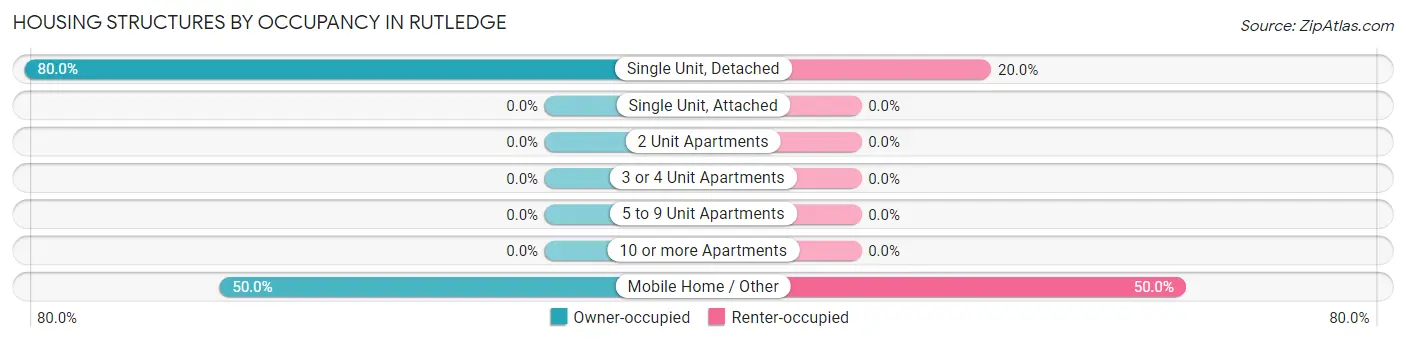
| Structure Type | Owner-occupied | Renter-occupied |
| Single Unit, Detached | 8 (80.0%) | 2 (20.0%) |
| Single Unit, Attached | 0 (0.0%) | 0 (0.0%) |
| 2 Unit Apartments | 0 (0.0%) | 0 (0.0%) |
| 3 or 4 Unit Apartments | 0 (0.0%) | 0 (0.0%) |
| 5 to 9 Unit Apartments | 0 (0.0%) | 0 (0.0%) |
| 10 or more Apartments | 0 (0.0%) | 0 (0.0%) |
| Mobile Home / Other | 1 (50.0%) | 1 (50.0%) |
| Total | 9 (75.0%) | 3 (25.0%) |
Housing Structures by Number of Rooms in Rutledge
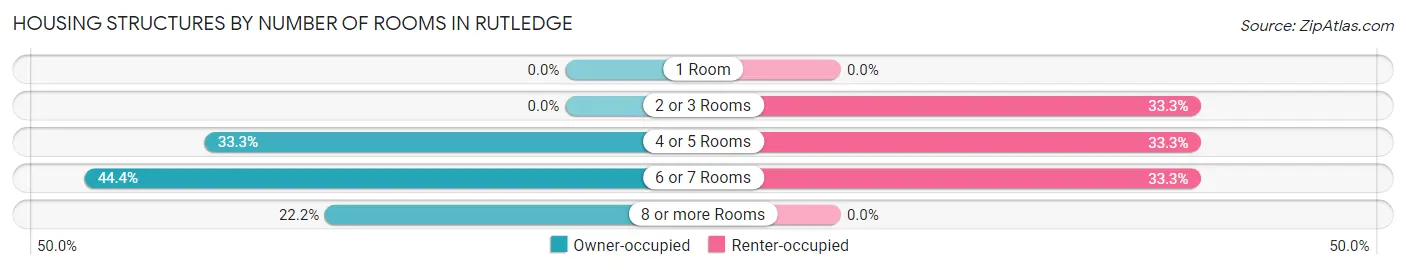
| Number of Rooms | Owner-occupied | Renter-occupied |
| 1 Room | 0 (0.0%) | 0 (0.0%) |
| 2 or 3 Rooms | 0 (0.0%) | 1 (33.3%) |
| 4 or 5 Rooms | 3 (33.3%) | 1 (33.3%) |
| 6 or 7 Rooms | 4 (44.4%) | 1 (33.3%) |
| 8 or more Rooms | 2 (22.2%) | 0 (0.0%) |
| Total | 9 (100.0%) | 3 (100.0%) |
Housing Structure by Heating Type in Rutledge
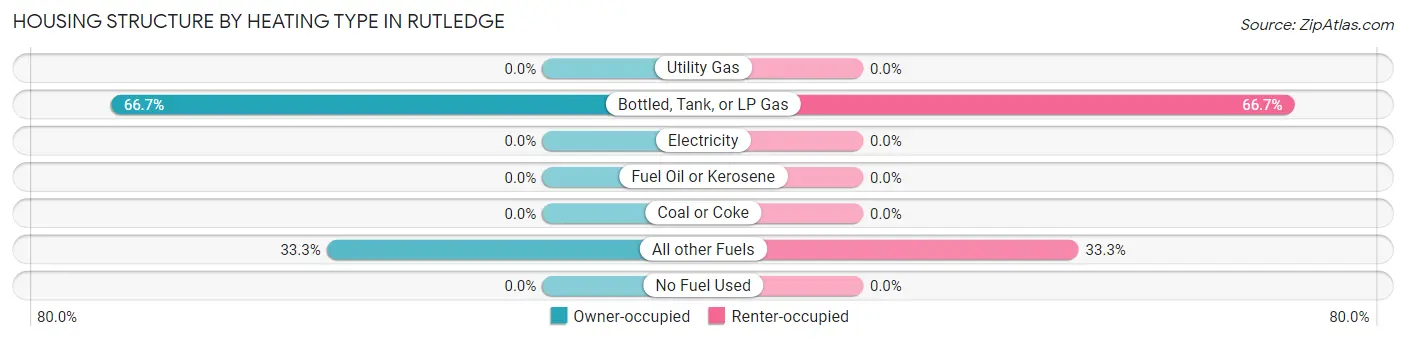
| Heating Type | Owner-occupied | Renter-occupied |
| Utility Gas | 0 (0.0%) | 0 (0.0%) |
| Bottled, Tank, or LP Gas | 6 (66.7%) | 2 (66.7%) |
| Electricity | 0 (0.0%) | 0 (0.0%) |
| Fuel Oil or Kerosene | 0 (0.0%) | 0 (0.0%) |
| Coal or Coke | 0 (0.0%) | 0 (0.0%) |
| All other Fuels | 3 (33.3%) | 1 (33.3%) |
| No Fuel Used | 0 (0.0%) | 0 (0.0%) |
| Total | 9 (100.0%) | 3 (100.0%) |
Household Vehicle Usage in Rutledge
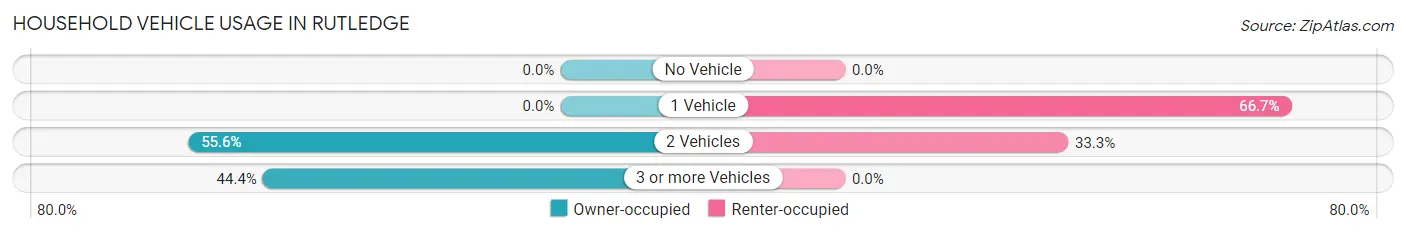
| Vehicles per Household | Owner-occupied | Renter-occupied |
| No Vehicle | 0 (0.0%) | 0 (0.0%) |
| 1 Vehicle | 0 (0.0%) | 2 (66.7%) |
| 2 Vehicles | 5 (55.6%) | 1 (33.3%) |
| 3 or more Vehicles | 4 (44.4%) | 0 (0.0%) |
| Total | 9 (100.0%) | 3 (100.0%) |
Real Estate & Mortgages in Rutledge
Real Estate and Mortgage Overview in Rutledge
| Characteristic | Without Mortgage | With Mortgage |
| Housing Units | 7 | 2 |
| Median Property Value | $11,300 | $0 |
| Median Household Income | - | - |
| Monthly Housing Costs | $358 | $0 |
| Real Estate Taxes | $275 | $2 |
Property Value by Mortgage Status in Rutledge
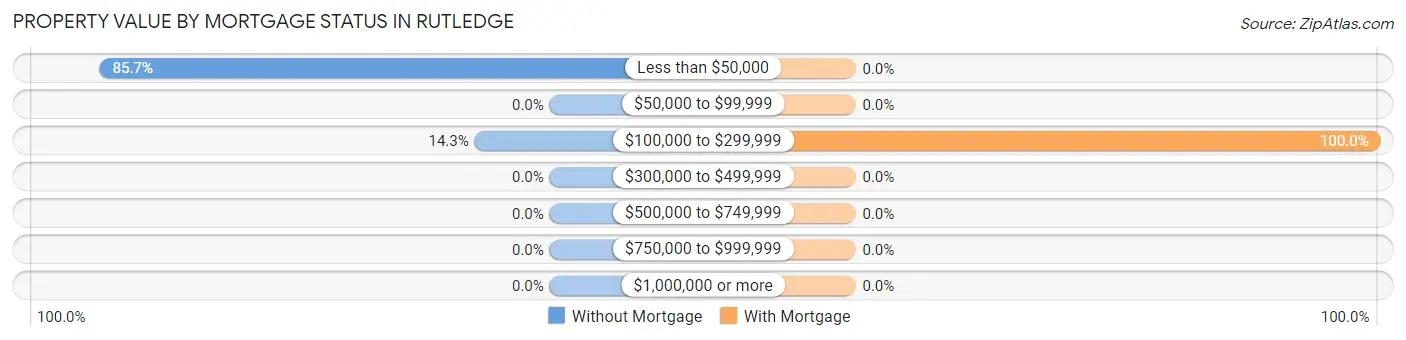
| Property Value | Without Mortgage | With Mortgage |
| Less than $50,000 | 6 (85.7%) | 0 (0.0%) |
| $50,000 to $99,999 | 0 (0.0%) | 0 (0.0%) |
| $100,000 to $299,999 | 1 (14.3%) | 2 (100.0%) |
| $300,000 to $499,999 | 0 (0.0%) | 0 (0.0%) |
| $500,000 to $749,999 | 0 (0.0%) | 0 (0.0%) |
| $750,000 to $999,999 | 0 (0.0%) | 0 (0.0%) |
| $1,000,000 or more | 0 (0.0%) | 0 (0.0%) |
| Total | 7 (100.0%) | 2 (100.0%) |
Household Income by Mortgage Status in Rutledge
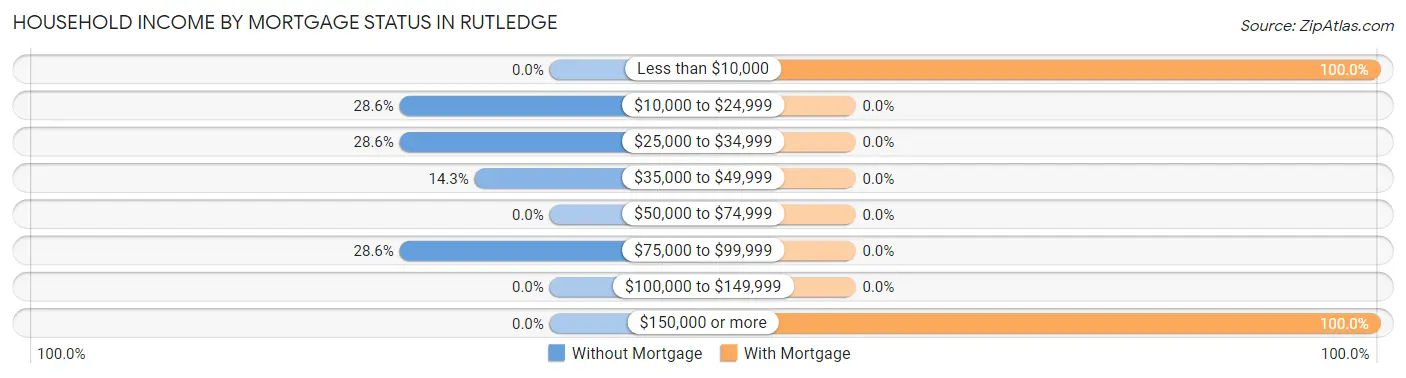
| Household Income | Without Mortgage | With Mortgage |
| Less than $10,000 | 0 (0.0%) | 2 (100.0%) |
| $10,000 to $24,999 | 2 (28.6%) | 0 (0.0%) |
| $25,000 to $34,999 | 2 (28.6%) | 0 (0.0%) |
| $35,000 to $49,999 | 1 (14.3%) | 0 (0.0%) |
| $50,000 to $74,999 | 0 (0.0%) | 0 (0.0%) |
| $75,000 to $99,999 | 2 (28.6%) | 0 (0.0%) |
| $100,000 to $149,999 | 0 (0.0%) | 0 (0.0%) |
| $150,000 or more | 0 (0.0%) | 2 (100.0%) |
| Total | 7 (100.0%) | 2 (100.0%) |
Property Value to Household Income Ratio in Rutledge
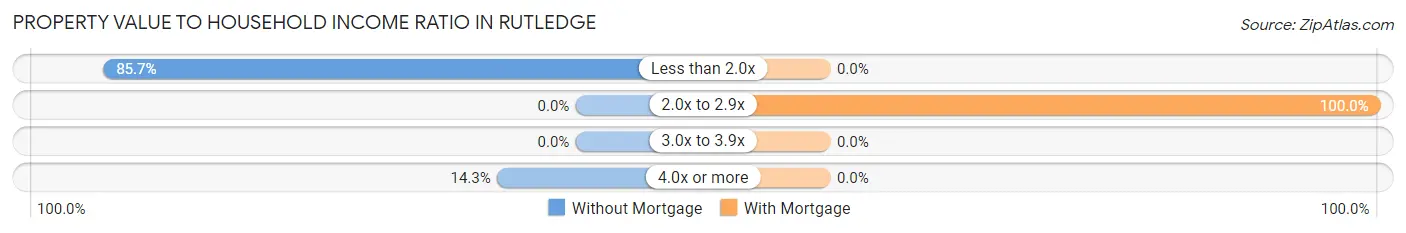
| Value-to-Income Ratio | Without Mortgage | With Mortgage |
| Less than 2.0x | 6 (85.7%) | 0 (0.0%) |
| 2.0x to 2.9x | 0 (0.0%) | 2 (100.0%) |
| 3.0x to 3.9x | 0 (0.0%) | 0 (0.0%) |
| 4.0x or more | 1 (14.3%) | 0 (0.0%) |
| Total | 7 (100.0%) | 2 (100.0%) |
Real Estate Taxes by Mortgage Status in Rutledge
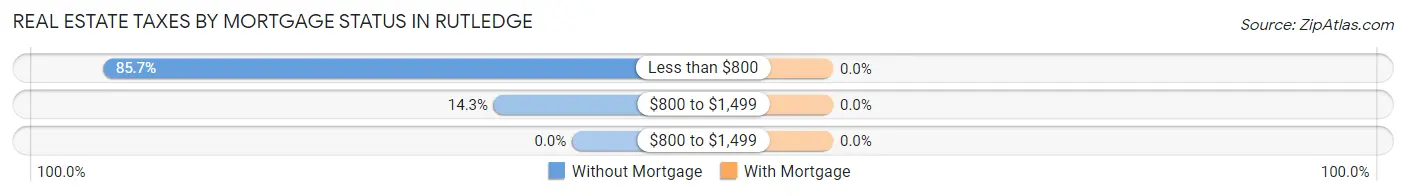
| Property Taxes | Without Mortgage | With Mortgage |
| Less than $800 | 6 (85.7%) | 0 (0.0%) |
| $800 to $1,499 | 1 (14.3%) | 0 (0.0%) |
| $800 to $1,499 | 0 (0.0%) | 0 (0.0%) |
| Total | 7 (100.0%) | 2 (100.0%) |
Health & Disability in Rutledge
Health Insurance Coverage by Age in Rutledge
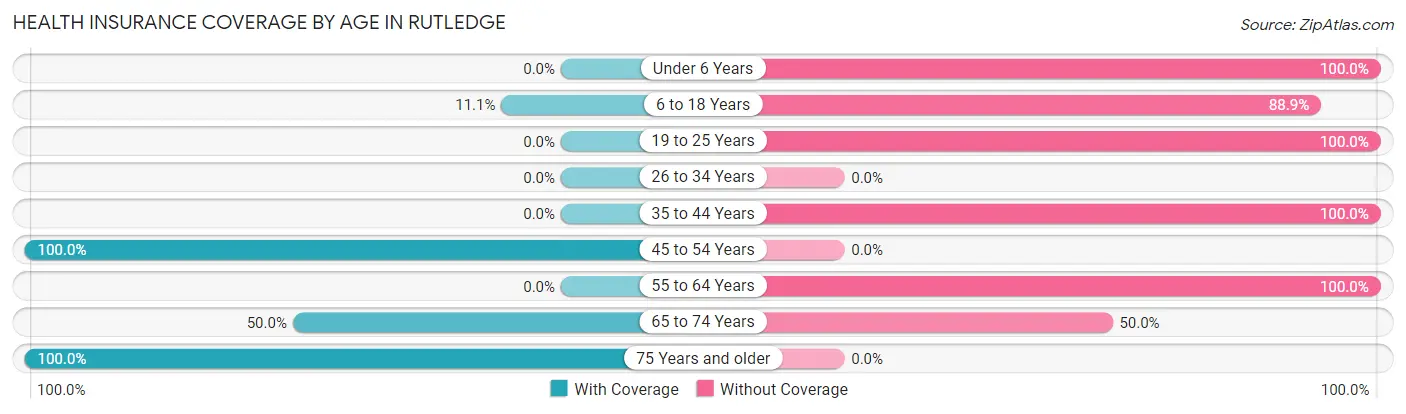
| Age Bracket | With Coverage | Without Coverage |
| Under 6 Years | 0 (0.0%) | 19 (100.0%) |
| 6 to 18 Years | 3 (11.1%) | 24 (88.9%) |
| 19 to 25 Years | 0 (0.0%) | 1 (100.0%) |
| 26 to 34 Years | 0 (0.0%) | 0 (0.0%) |
| 35 to 44 Years | 0 (0.0%) | 6 (100.0%) |
| 45 to 54 Years | 2 (100.0%) | 0 (0.0%) |
| 55 to 64 Years | 0 (0.0%) | 4 (100.0%) |
| 65 to 74 Years | 2 (50.0%) | 2 (50.0%) |
| 75 Years and older | 5 (100.0%) | 0 (0.0%) |
| Total | 12 (17.6%) | 56 (82.4%) |
Health Insurance Coverage by Citizenship Status in Rutledge
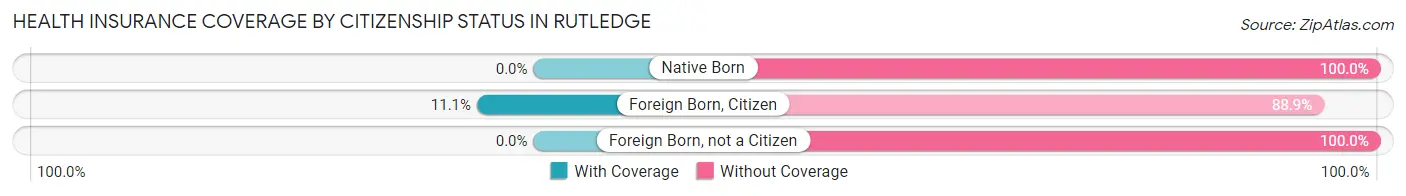
| Citizenship Status | With Coverage | Without Coverage |
| Native Born | 0 (0.0%) | 19 (100.0%) |
| Foreign Born, Citizen | 3 (11.1%) | 24 (88.9%) |
| Foreign Born, not a Citizen | 0 (0.0%) | 1 (100.0%) |
Health Insurance Coverage by Household Income in Rutledge
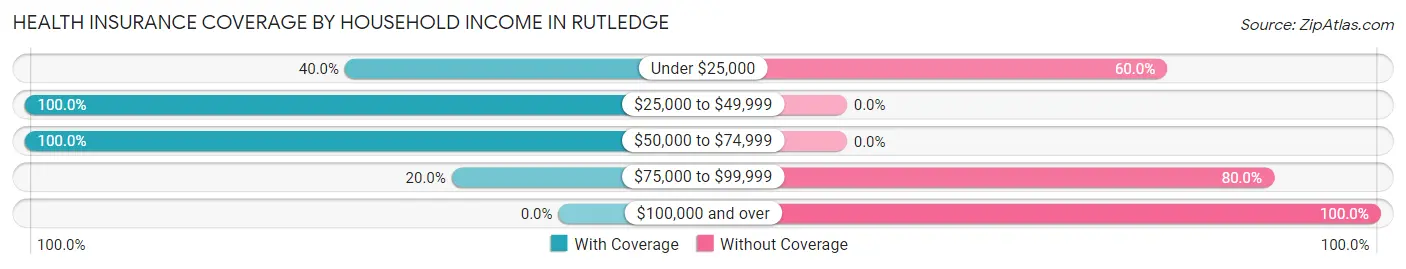
| Household Income | With Coverage | Without Coverage |
| Under $25,000 | 2 (40.0%) | 3 (60.0%) |
| $25,000 to $49,999 | 6 (100.0%) | 0 (0.0%) |
| $50,000 to $74,999 | 2 (100.0%) | 0 (0.0%) |
| $75,000 to $99,999 | 2 (20.0%) | 8 (80.0%) |
| $100,000 and over | 0 (0.0%) | 45 (100.0%) |
Public vs Private Health Insurance Coverage by Age in Rutledge
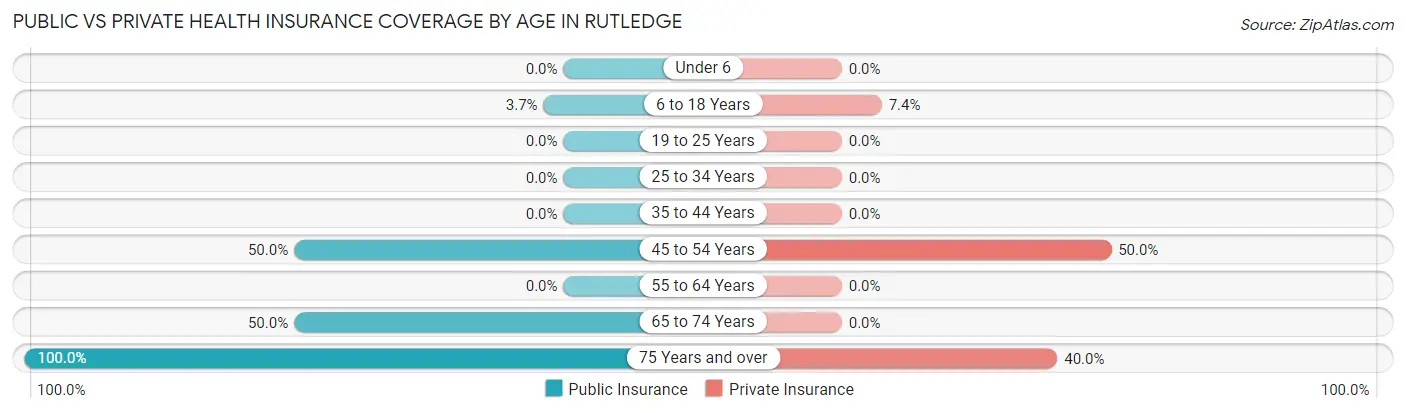
| Age Bracket | Public Insurance | Private Insurance |
| Under 6 | 0 (0.0%) | 0 (0.0%) |
| 6 to 18 Years | 1 (3.7%) | 2 (7.4%) |
| 19 to 25 Years | 0 (0.0%) | 0 (0.0%) |
| 25 to 34 Years | 0 (0.0%) | 0 (0.0%) |
| 35 to 44 Years | 0 (0.0%) | 0 (0.0%) |
| 45 to 54 Years | 1 (50.0%) | 1 (50.0%) |
| 55 to 64 Years | 0 (0.0%) | 0 (0.0%) |
| 65 to 74 Years | 2 (50.0%) | 0 (0.0%) |
| 75 Years and over | 5 (100.0%) | 2 (40.0%) |
| Total | 9 (13.2%) | 5 (7.3%) |
Disability Status by Sex by Age in Rutledge
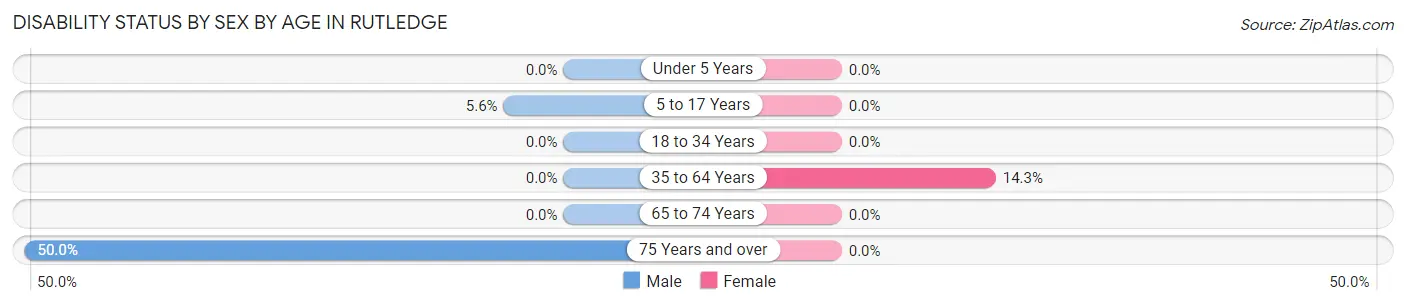
| Age Bracket | Male | Female |
| Under 5 Years | 0 (0.0%) | 0 (0.0%) |
| 5 to 17 Years | 1 (5.6%) | 0 (0.0%) |
| 18 to 34 Years | 0 (0.0%) | 0 (0.0%) |
| 35 to 64 Years | 0 (0.0%) | 1 (14.3%) |
| 65 to 74 Years | 0 (0.0%) | 0 (0.0%) |
| 75 Years and over | 1 (50.0%) | 0 (0.0%) |
Disability Class by Sex by Age in Rutledge
Disability Class: Hearing Difficulty
| Age Bracket | Male | Female |
| Under 5 Years | 0 (0.0%) | 0 (0.0%) |
| 5 to 17 Years | 0 (0.0%) | 0 (0.0%) |
| 18 to 34 Years | 0 (0.0%) | 0 (0.0%) |
| 35 to 64 Years | 0 (0.0%) | 0 (0.0%) |
| 65 to 74 Years | 0 (0.0%) | 0 (0.0%) |
| 75 Years and over | 0 (0.0%) | 0 (0.0%) |
Disability Class: Vision Difficulty
| Age Bracket | Male | Female |
| Under 5 Years | 0 (0.0%) | 0 (0.0%) |
| 5 to 17 Years | 0 (0.0%) | 0 (0.0%) |
| 18 to 34 Years | 0 (0.0%) | 0 (0.0%) |
| 35 to 64 Years | 0 (0.0%) | 0 (0.0%) |
| 65 to 74 Years | 0 (0.0%) | 0 (0.0%) |
| 75 Years and over | 0 (0.0%) | 0 (0.0%) |
Disability Class: Cognitive Difficulty
| Age Bracket | Male | Female |
| 5 to 17 Years | 1 (5.6%) | 0 (0.0%) |
| 18 to 34 Years | 0 (0.0%) | 0 (0.0%) |
| 35 to 64 Years | 0 (0.0%) | 1 (14.3%) |
| 65 to 74 Years | 0 (0.0%) | 0 (0.0%) |
| 75 Years and over | 0 (0.0%) | 0 (0.0%) |
Disability Class: Ambulatory Difficulty
| Age Bracket | Male | Female |
| 5 to 17 Years | 1 (5.6%) | 0 (0.0%) |
| 18 to 34 Years | 0 (0.0%) | 0 (0.0%) |
| 35 to 64 Years | 0 (0.0%) | 0 (0.0%) |
| 65 to 74 Years | 0 (0.0%) | 0 (0.0%) |
| 75 Years and over | 1 (50.0%) | 0 (0.0%) |
Disability Class: Self-Care Difficulty
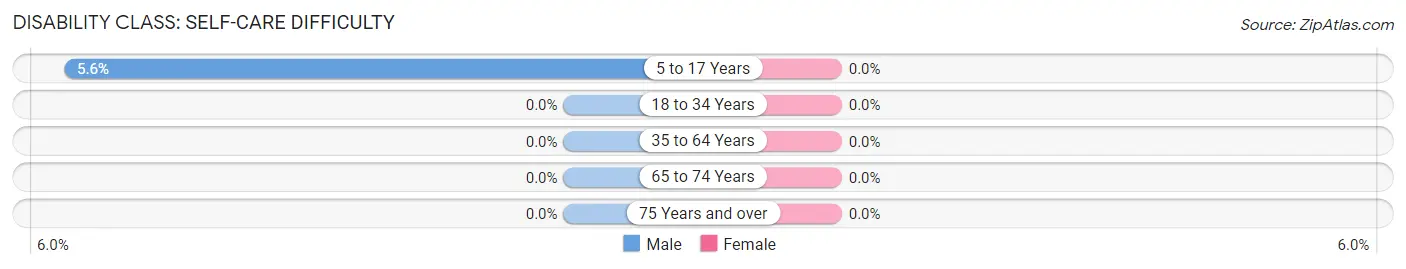
| Age Bracket | Male | Female |
| 5 to 17 Years | 1 (5.6%) | 0 (0.0%) |
| 18 to 34 Years | 0 (0.0%) | 0 (0.0%) |
| 35 to 64 Years | 0 (0.0%) | 0 (0.0%) |
| 65 to 74 Years | 0 (0.0%) | 0 (0.0%) |
| 75 Years and over | 0 (0.0%) | 0 (0.0%) |
Technology Access in Rutledge
Computing Device Access in Rutledge
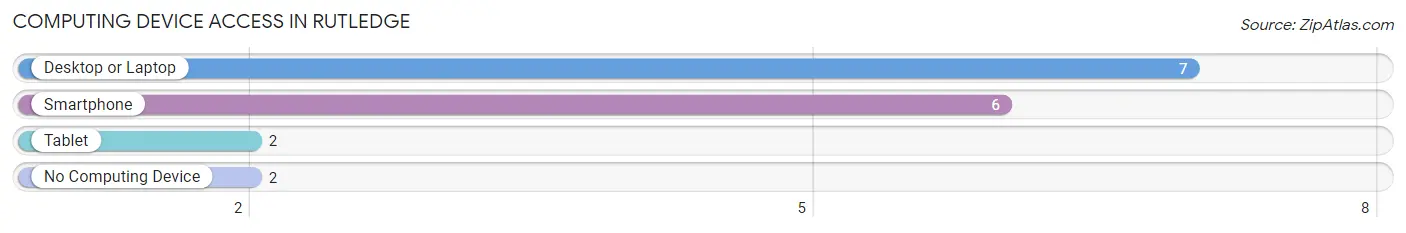
| Device Type | # Households | % Households |
| Desktop or Laptop | 7 | 58.3% |
| Smartphone | 6 | 50.0% |
| Tablet | 2 | 16.7% |
| No Computing Device | 2 | 16.7% |
| Total | 12 | 100.0% |
Internet Access in Rutledge
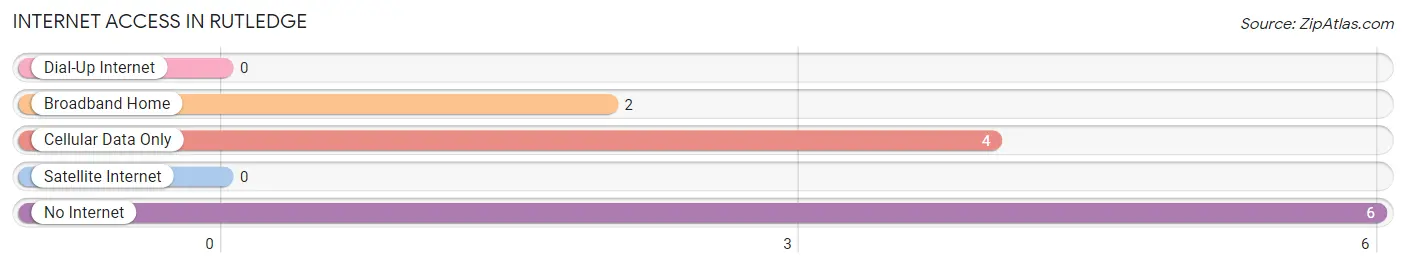
| Internet Type | # Households | % Households |
| Dial-Up Internet | 0 | 0.0% |
| Broadband Home | 2 | 16.7% |
| Cellular Data Only | 4 | 33.3% |
| Satellite Internet | 0 | 0.0% |
| No Internet | 6 | 50.0% |
| Total | 12 | 100.0% |
Rutledge Summary
Rutledge is a small town located in the southeastern corner of Missouri, in the United States. It is situated in the Ozark Mountains, and is part of the Ozark Plateau. The town is located in the county of Shannon, and is part of the West Plains Micropolitan Statistical Area. The population of Rutledge was estimated to be around 500 people in 2020.
History
Rutledge was founded in 1883 by a group of settlers from the nearby town of West Plains. The town was named after a local settler, William Rutledge, who had a large farm in the area. The town was originally a farming community, and the main crops grown were cotton, corn, and wheat. The town also had a sawmill and a gristmill.
In the early 1900s, Rutledge began to experience a period of growth. The town was incorporated in 1909, and the first mayor was elected in 1910. The town also had a post office, a bank, and a hotel.
In the 1920s, Rutledge experienced a period of decline. The Great Depression caused many of the businesses in the town to close, and the population began to decline. The town was able to survive, however, and in the 1940s, the population began to increase again.
Geography
Rutledge is located in the southeastern corner of Missouri, in the Ozark Mountains. The town is situated in the county of Shannon, and is part of the West Plains Micropolitan Statistical Area. The town is located at an elevation of 890 feet above sea level.
The town is located in a hilly area, and is surrounded by forests and rolling hills. The town is located near the Mark Twain National Forest, and is close to the Eleven Point River. The town is also located near the towns of West Plains, Mountain View, and Thayer.
Economy
Rutledge is a small town, and the economy is largely based on agriculture. The main crops grown in the area are cotton, corn, and wheat. The town also has a sawmill and a gristmill.
The town also has a few small businesses, including a grocery store, a hardware store, and a few restaurants. The town also has a post office, a bank, and a hotel.
Demographics
Rutledge is a small town, and the population was estimated to be around 500 people in 2020. The town is predominantly white, with a small African American population. The median household income in the town is around $30,000, and the median age is around 40 years old. The town has a low unemployment rate, and the poverty rate is below the national average.
Common Questions
What is Per Capita Income in Rutledge?
Per Capita income in Rutledge is $11,091.
What is the Median Family Income in Rutledge?
Median Family Income in Rutledge is $91,250.
What is Inequality or Gini Index in Rutledge?
Inequality or Gini Index in Rutledge is 0.39.
What is the Total Population of Rutledge?
Total Population of Rutledge is 68.
What is the Total Male Population of Rutledge?
Total Male Population of Rutledge is 44.
What is the Total Female Population of Rutledge?
Total Female Population of Rutledge is 24.
What is the Ratio of Males per 100 Females in Rutledge?
There are 183.33 Males per 100 Females in Rutledge.
What is the Ratio of Females per 100 Males in Rutledge?
There are 54.55 Females per 100 Males in Rutledge.
What is the Median Population Age in Rutledge?
Median Population Age in Rutledge is 14.3 Years.
What is the Average Family Size in Rutledge
Average Family Size in Rutledge is 9.8 People.
What is the Average Household Size in Rutledge
Average Household Size in Rutledge is 5.7 People.
How Large is the Labor Force in Rutledge?
There are 17 People in the Labor Forcein in Rutledge.
What is the Percentage of People in the Labor Force in Rutledge?
54.8% of People are in the Labor Force in Rutledge.