Gorham, ME Map & Demographics
Gorham Map
Gorham Overview
$46,521
PER CAPITA INCOME
$157,132
AVG FAMILY INCOME
$96,332
AVG HOUSEHOLD INCOME
52.7%
WAGE / INCOME GAP [ % ]
47.3¢/ $1
WAGE / INCOME GAP [ $ ]
0.40
INEQUALITY / GINI INDEX
7,050
TOTAL POPULATION
3,064
MALE POPULATION
3,986
FEMALE POPULATION
76.87
MALES / 100 FEMALES
130.09
FEMALES / 100 MALES
38.0
MEDIAN AGE
2.9
AVG FAMILY SIZE
2.3
AVG HOUSEHOLD SIZE
4,355
LABOR FORCE [ PEOPLE ]
69.8%
PERCENT IN LABOR FORCE
4.1%
UNEMPLOYMENT RATE
Gorham Zip Codes
Gorham Area Codes
Income in Gorham
Income Overview in Gorham
Per Capita Income in Gorham is $46,521, while median incomes of families and households are $157,132 and $96,332 respectively.
| Characteristic | Number | Measure |
| Per Capita Income | 7,050 | $46,521 |
| Median Family Income | 1,504 | $157,132 |
| Mean Family Income | 1,504 | $151,289 |
| Median Household Income | 2,413 | $96,332 |
| Mean Household Income | 2,413 | $125,709 |
| Income Deficit | 1,504 | $0 |
| Wage / Income Gap (%) | 7,050 | 52.71% |
| Wage / Income Gap ($) | 7,050 | 47.29¢ per $1 |
| Gini / Inequality Index | 7,050 | 0.40 |
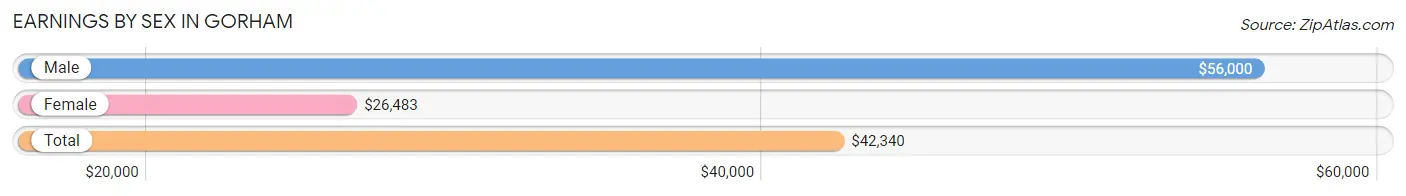
Earnings by Sex in Gorham
Average Earnings in Gorham are $42,340, $56,000 for men and $26,483 for women, a difference of 52.7%.
| Sex | Number | Average Earnings |
| Male | 2,228 (47.8%) | $56,000 |
| Female | 2,437 (52.2%) | $26,483 |
| Total | 4,665 (100.0%) | $42,340 |
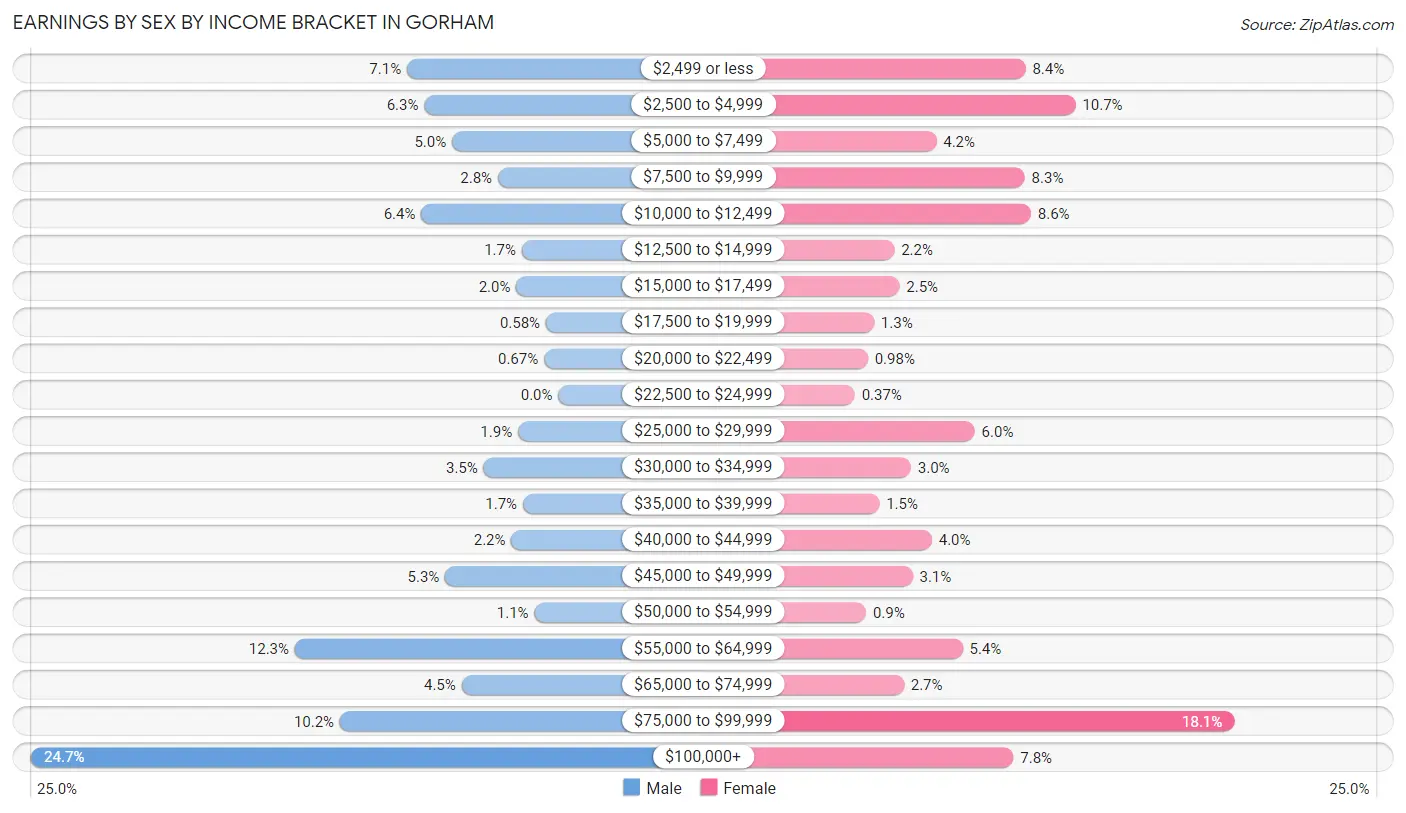
Earnings by Sex by Income Bracket in Gorham
The most common earnings brackets in Gorham are $100,000+ for men (550 | 24.7%) and $75,000 to $99,999 for women (442 | 18.1%).
| Income | Male | Female |
| $2,499 or less | 158 (7.1%) | 204 (8.4%) |
| $2,500 to $4,999 | 140 (6.3%) | 261 (10.7%) |
| $5,000 to $7,499 | 111 (5.0%) | 102 (4.2%) |
| $7,500 to $9,999 | 63 (2.8%) | 203 (8.3%) |
| $10,000 to $12,499 | 143 (6.4%) | 210 (8.6%) |
| $12,500 to $14,999 | 38 (1.7%) | 54 (2.2%) |
| $15,000 to $17,499 | 44 (2.0%) | 60 (2.5%) |
| $17,500 to $19,999 | 13 (0.6%) | 31 (1.3%) |
| $20,000 to $22,499 | 15 (0.7%) | 24 (1.0%) |
| $22,500 to $24,999 | 0 (0.0%) | 9 (0.4%) |
| $25,000 to $29,999 | 42 (1.9%) | 146 (6.0%) |
| $30,000 to $34,999 | 78 (3.5%) | 73 (3.0%) |
| $35,000 to $39,999 | 37 (1.7%) | 37 (1.5%) |
| $40,000 to $44,999 | 49 (2.2%) | 97 (4.0%) |
| $45,000 to $49,999 | 118 (5.3%) | 75 (3.1%) |
| $50,000 to $54,999 | 25 (1.1%) | 22 (0.9%) |
| $55,000 to $64,999 | 275 (12.3%) | 132 (5.4%) |
| $65,000 to $74,999 | 101 (4.5%) | 65 (2.7%) |
| $75,000 to $99,999 | 228 (10.2%) | 442 (18.1%) |
| $100,000+ | 550 (24.7%) | 190 (7.8%) |
| Total | 2,228 (100.0%) | 2,437 (100.0%) |
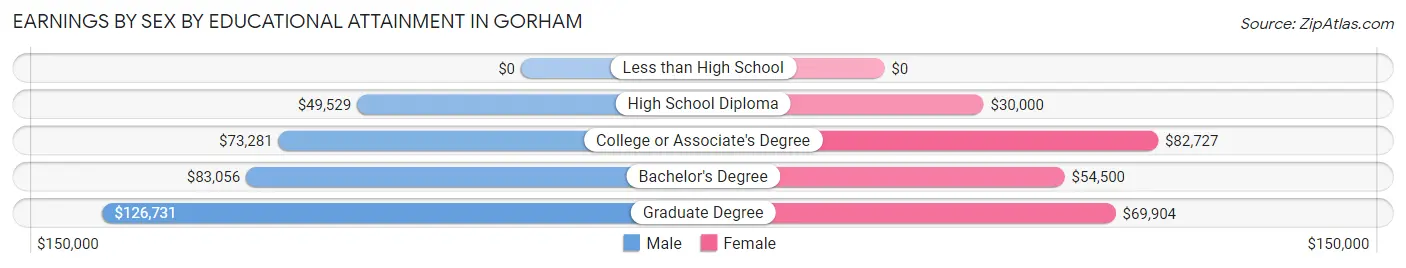
Earnings by Sex by Educational Attainment in Gorham
Average earnings in Gorham are $72,943 for men and $55,974 for women, a difference of 23.3%. Men with an educational attainment of graduate degree enjoy the highest average annual earnings of $126,731, while those with high school diploma education earn the least with $49,529. Women with an educational attainment of college or associate's degree earn the most with the average annual earnings of $82,727, while those with high school diploma education have the smallest earnings of $30,000.
| Educational Attainment | Male Income | Female Income |
| Less than High School | - | - |
| High School Diploma | $49,529 | $30,000 |
| College or Associate's Degree | $73,281 | $82,727 |
| Bachelor's Degree | $83,056 | $54,500 |
| Graduate Degree | $126,731 | $69,904 |
| Total | $72,943 | $55,974 |
Family Income in Gorham
Family Income Brackets in Gorham
According to the Gorham family income data, there are 456 families falling into the $150,000 to $199,999 income range, which is the most common income bracket and makes up 30.3% of all families.
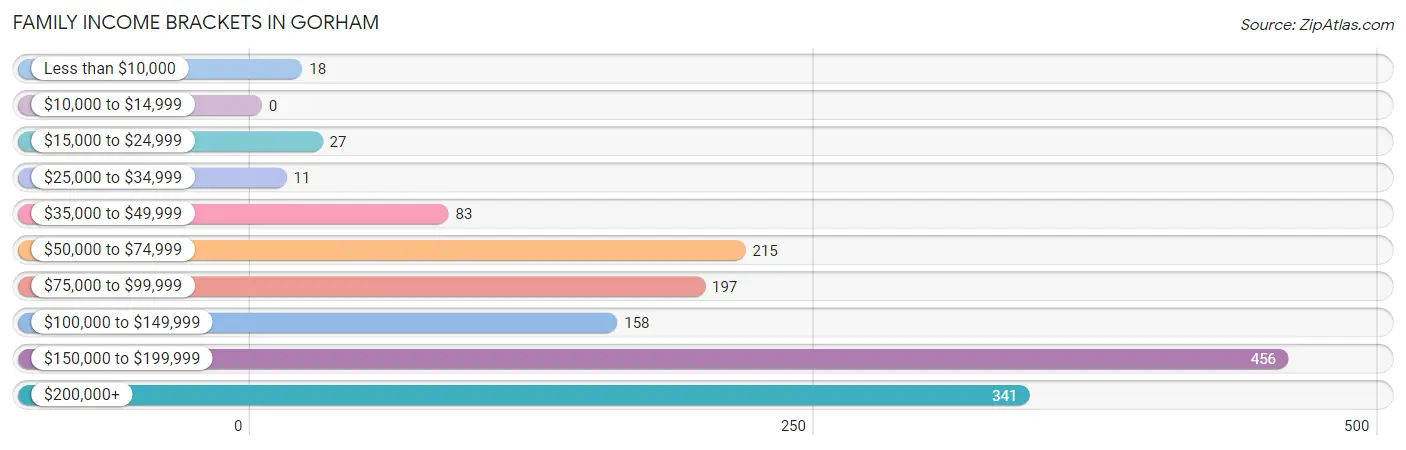
| Income Bracket | # Families | % Families |
| Less than $10,000 | 18 | 1.2% |
| $10,000 to $14,999 | 0 | 0.0% |
| $15,000 to $24,999 | 27 | 1.8% |
| $25,000 to $34,999 | 11 | 0.7% |
| $35,000 to $49,999 | 83 | 5.5% |
| $50,000 to $74,999 | 215 | 14.3% |
| $75,000 to $99,999 | 197 | 13.1% |
| $100,000 to $149,999 | 158 | 10.5% |
| $150,000 to $199,999 | 456 | 30.3% |
| $200,000+ | 341 | 22.7% |
Family Income by Famaliy Size in Gorham
4-person families (425 | 28.3%) account for the highest median family income in Gorham with $192,260 per family, while 2-person families (685 | 45.6%) have the highest median income of $58,894 per family member.
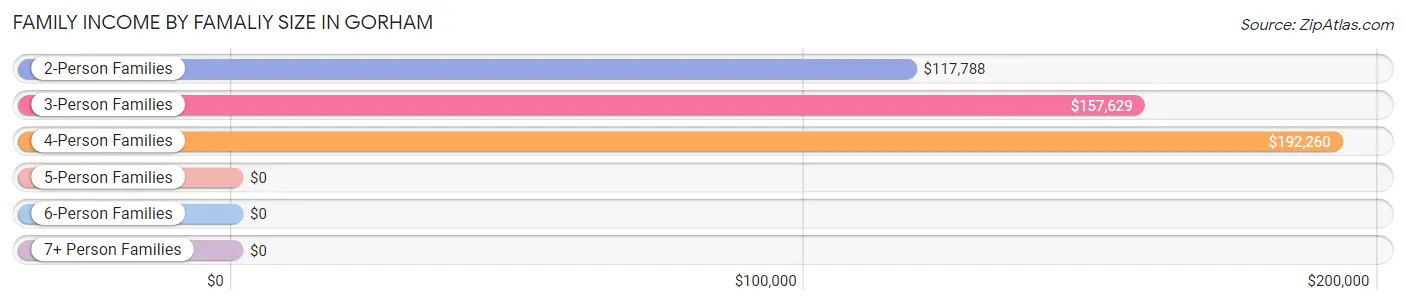
| Income Bracket | # Families | Median Income |
| 2-Person Families | 685 (45.6%) | $117,788 |
| 3-Person Families | 276 (18.3%) | $157,629 |
| 4-Person Families | 425 (28.3%) | $192,260 |
| 5-Person Families | 118 (7.9%) | $0 |
| 6-Person Families | 0 (0.0%) | $0 |
| 7+ Person Families | 0 (0.0%) | $0 |
| Total | 1,504 (100.0%) | $157,132 |
Family Income by Number of Earners in Gorham
The median family income in Gorham is $157,132, with families comprising 3+ earners (116) having the highest median family income of $240,882, while families with no earners (180) have the lowest median family income of $91,034, accounting for 7.7% and 12.0% of families, respectively.
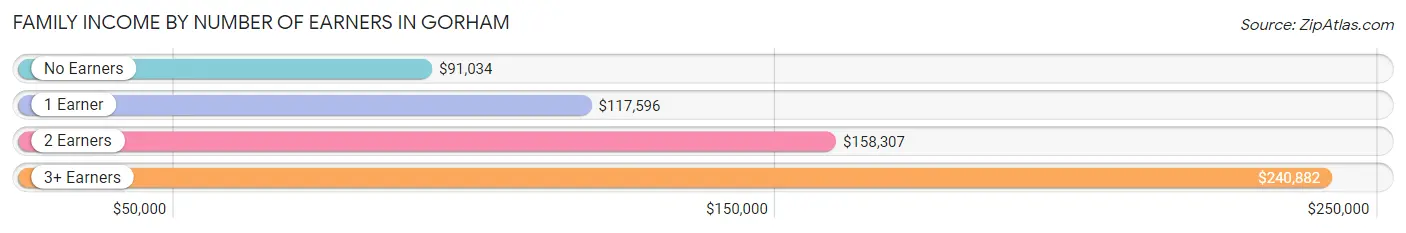
| Number of Earners | # Families | Median Income |
| No Earners | 180 (12.0%) | $91,034 |
| 1 Earner | 241 (16.0%) | $117,596 |
| 2 Earners | 967 (64.3%) | $158,307 |
| 3+ Earners | 116 (7.7%) | $240,882 |
| Total | 1,504 (100.0%) | $157,132 |
Household Income in Gorham
Household Income Brackets in Gorham
With 502 households falling in the category, the $150,000 to $199,999 income range is the most frequent in Gorham, accounting for 20.8% of all households. In contrast, only 36 households (1.5%) fall into the less than $10,000 income bracket, making it the least populous group.
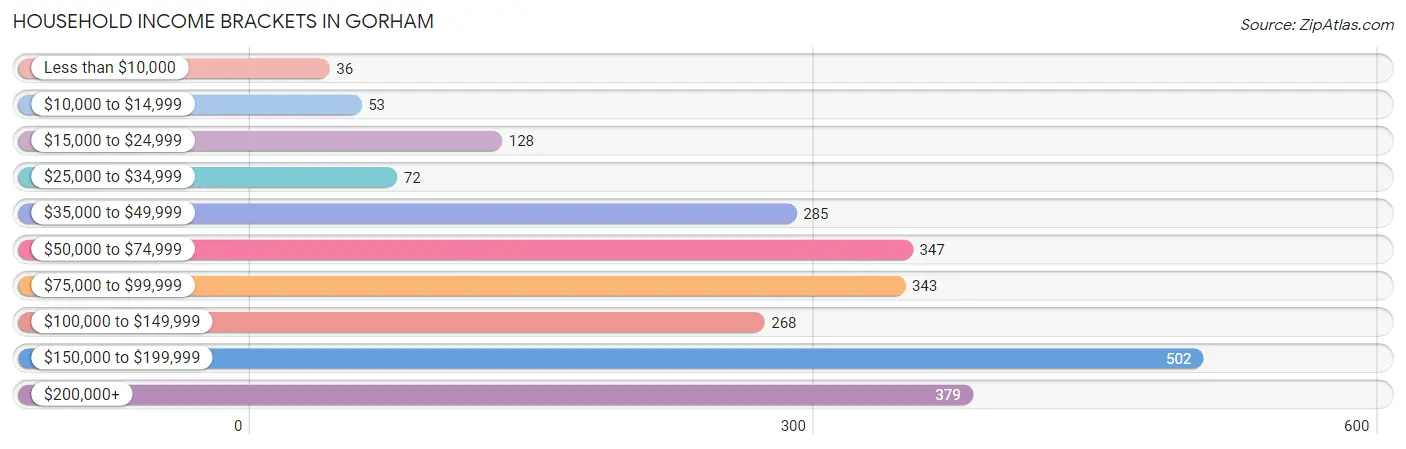
| Income Bracket | # Households | % Households |
| Less than $10,000 | 36 | 1.5% |
| $10,000 to $14,999 | 53 | 2.2% |
| $15,000 to $24,999 | 128 | 5.3% |
| $25,000 to $34,999 | 72 | 3.0% |
| $35,000 to $49,999 | 285 | 11.8% |
| $50,000 to $74,999 | 347 | 14.4% |
| $75,000 to $99,999 | 343 | 14.2% |
| $100,000 to $149,999 | 268 | 11.1% |
| $150,000 to $199,999 | 502 | 20.8% |
| $200,000+ | 379 | 15.7% |
Household Income by Householder Age in Gorham
The median household income in Gorham is $96,332, with the highest median household income of $155,294 found in the 25 to 44 years age bracket for the primary householder. A total of 562 households (23.3%) fall into this category. Meanwhile, the 15 to 24 years age bracket for the primary householder has the lowest median household income of $0, with 20 households (0.8%) in this group.
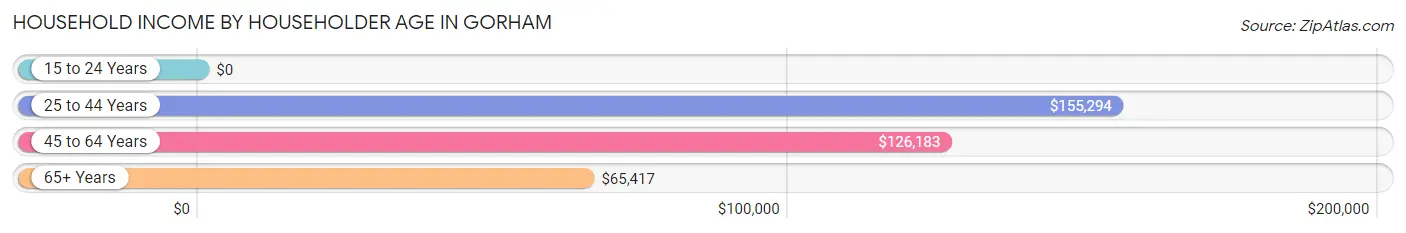
| Income Bracket | # Households | Median Income |
| 15 to 24 Years | 20 (0.8%) | $0 |
| 25 to 44 Years | 562 (23.3%) | $155,294 |
| 45 to 64 Years | 1,107 (45.9%) | $126,183 |
| 65+ Years | 724 (30.0%) | $65,417 |
| Total | 2,413 (100.0%) | $96,332 |
Poverty in Gorham
Income Below Poverty by Sex and Age in Gorham
With 0.9% poverty level for males and 3.3% for females among the residents of Gorham, 55 to 64 year old males and 75 year old and over females are the most vulnerable to poverty, with 18 males (3.6%) and 83 females (28.0%) in their respective age groups living below the poverty level.
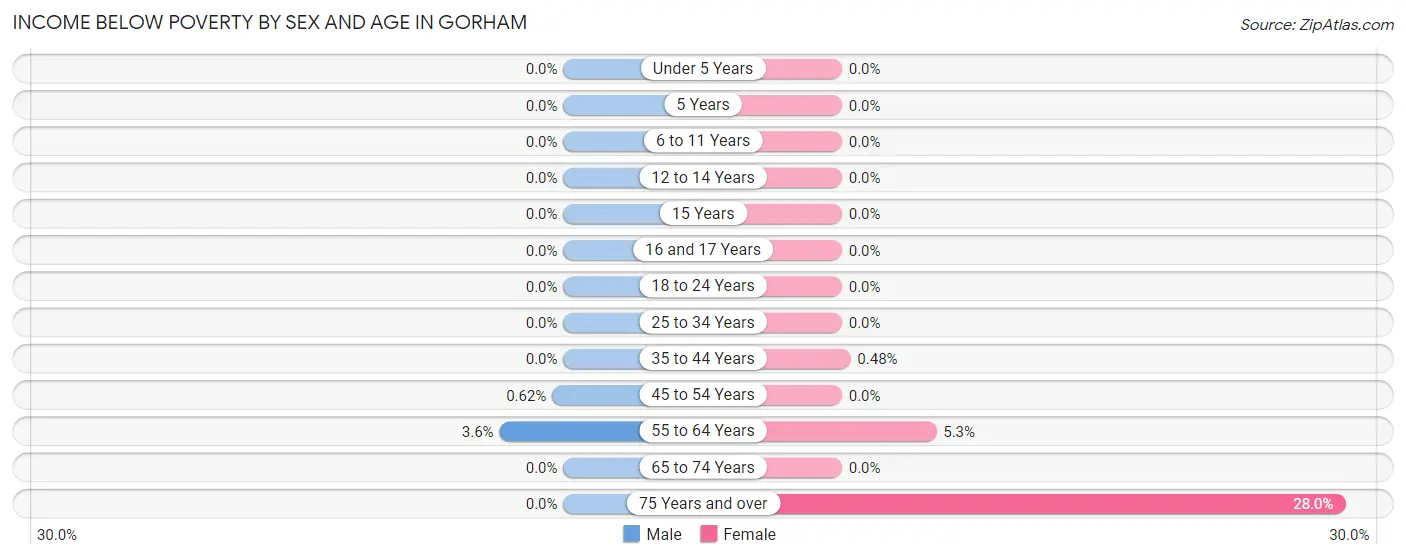
| Age Bracket | Male | Female |
| Under 5 Years | 0 (0.0%) | 0 (0.0%) |
| 5 Years | 0 (0.0%) | 0 (0.0%) |
| 6 to 11 Years | 0 (0.0%) | 0 (0.0%) |
| 12 to 14 Years | 0 (0.0%) | 0 (0.0%) |
| 15 Years | 0 (0.0%) | 0 (0.0%) |
| 16 and 17 Years | 0 (0.0%) | 0 (0.0%) |
| 18 to 24 Years | 0 (0.0%) | 0 (0.0%) |
| 25 to 34 Years | 0 (0.0%) | 0 (0.0%) |
| 35 to 44 Years | 0 (0.0%) | 2 (0.5%) |
| 45 to 54 Years | 3 (0.6%) | 0 (0.0%) |
| 55 to 64 Years | 18 (3.6%) | 18 (5.3%) |
| 65 to 74 Years | 0 (0.0%) | 0 (0.0%) |
| 75 Years and over | 0 (0.0%) | 83 (28.0%) |
| Total | 21 (0.9%) | 103 (3.3%) |
Income Above Poverty by Sex and Age in Gorham
According to the poverty statistics in Gorham, males aged under 5 years and females aged under 5 years are the age groups that are most secure financially, with 100.0% of males and 100.0% of females in these age groups living above the poverty line.
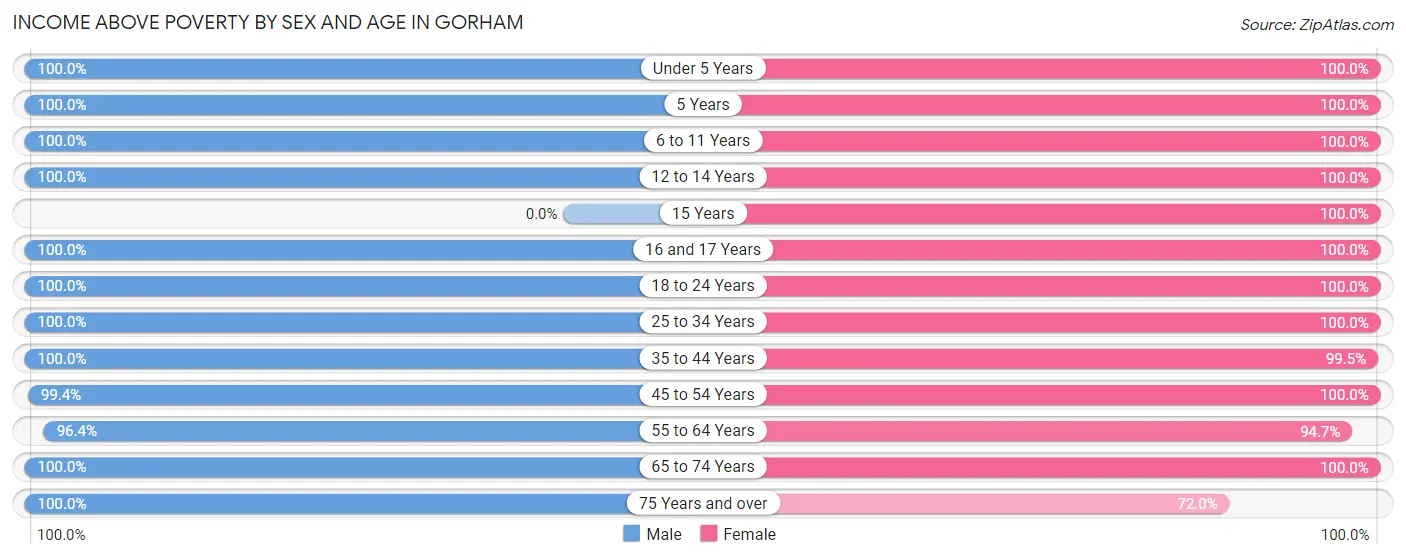
| Age Bracket | Male | Female |
| Under 5 Years | 91 (100.0%) | 53 (100.0%) |
| 5 Years | 11 (100.0%) | 26 (100.0%) |
| 6 to 11 Years | 129 (100.0%) | 177 (100.0%) |
| 12 to 14 Years | 80 (100.0%) | 201 (100.0%) |
| 15 Years | 0 (0.0%) | 27 (100.0%) |
| 16 and 17 Years | 7 (100.0%) | 55 (100.0%) |
| 18 to 24 Years | 271 (100.0%) | 233 (100.0%) |
| 25 to 34 Years | 272 (100.0%) | 333 (100.0%) |
| 35 to 44 Years | 245 (100.0%) | 413 (99.5%) |
| 45 to 54 Years | 478 (99.4%) | 521 (100.0%) |
| 55 to 64 Years | 488 (96.4%) | 324 (94.7%) |
| 65 to 74 Years | 248 (100.0%) | 433 (100.0%) |
| 75 Years and over | 88 (100.0%) | 213 (72.0%) |
| Total | 2,408 (99.1%) | 3,009 (96.7%) |
Income Below Poverty Among Married-Couple Families in Gorham
The poverty statistics for married-couple families in Gorham show that 1.5% or 18 of the total 1,237 families live below the poverty line. Families with no children have the highest poverty rate of 2.6%, comprising of 18 families. On the other hand, families with 1 or 2 children have the lowest poverty rate of 0.0%, which includes 0 families.
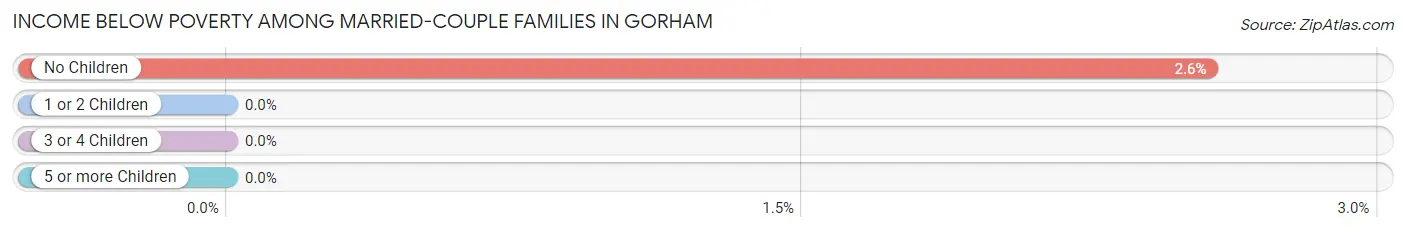
| Children | Above Poverty | Below Poverty |
| No Children | 685 (97.4%) | 18 (2.6%) |
| 1 or 2 Children | 519 (100.0%) | 0 (0.0%) |
| 3 or 4 Children | 15 (100.0%) | 0 (0.0%) |
| 5 or more Children | 0 (0.0%) | 0 (0.0%) |
| Total | 1,219 (98.5%) | 18 (1.5%) |
Income Below Poverty Among Single-Parent Households in Gorham
| Children | Single Father | Single Mother |
| No Children | 0 (0.0%) | 0 (0.0%) |
| 1 or 2 Children | 0 (0.0%) | 0 (0.0%) |
| 3 or 4 Children | 0 (0.0%) | 0 (0.0%) |
| 5 or more Children | 0 (0.0%) | 0 (0.0%) |
| Total | 0 (0.0%) | 0 (0.0%) |
Income Below Poverty Among Married-Couple vs Single-Parent Households in Gorham
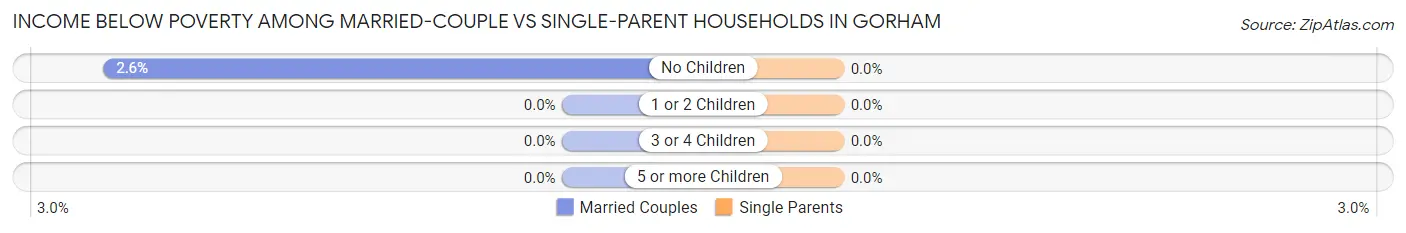
| Children | Married-Couple Families | Single-Parent Households |
| No Children | 18 (2.6%) | 0 (0.0%) |
| 1 or 2 Children | 0 (0.0%) | 0 (0.0%) |
| 3 or 4 Children | 0 (0.0%) | 0 (0.0%) |
| 5 or more Children | 0 (0.0%) | 0 (0.0%) |
| Total | 18 (1.5%) | 0 (0.0%) |
Race in Gorham
The most populous races in Gorham are White / Caucasian (6,100 | 86.5%), Two or more Races (549 | 7.8%), and Asian (214 | 3.0%).
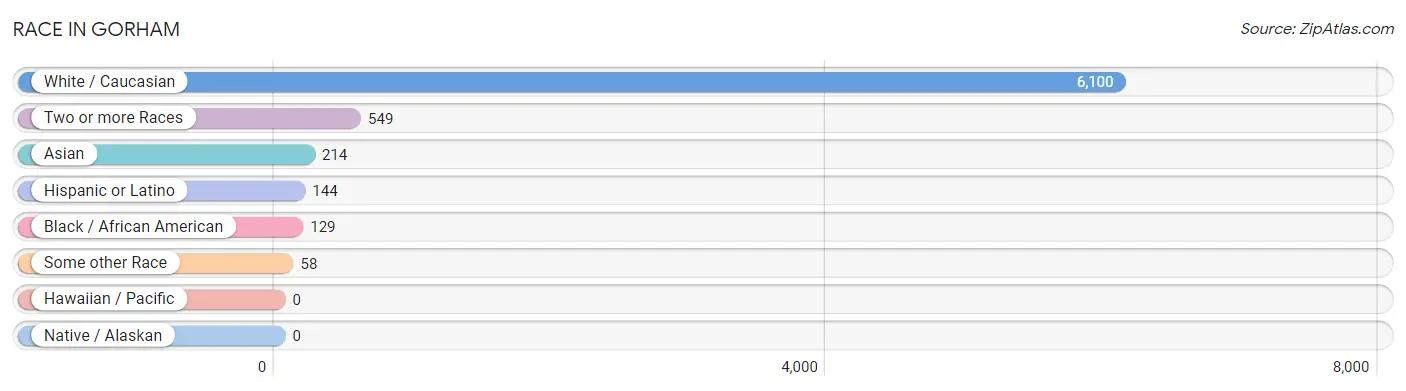
| Race | # Population | % Population |
| Asian | 214 | 3.0% |
| Black / African American | 129 | 1.8% |
| Hawaiian / Pacific | 0 | 0.0% |
| Hispanic or Latino | 144 | 2.0% |
| Native / Alaskan | 0 | 0.0% |
| White / Caucasian | 6,100 | 86.5% |
| Two or more Races | 549 | 7.8% |
| Some other Race | 58 | 0.8% |
| Total | 7,050 | 100.0% |
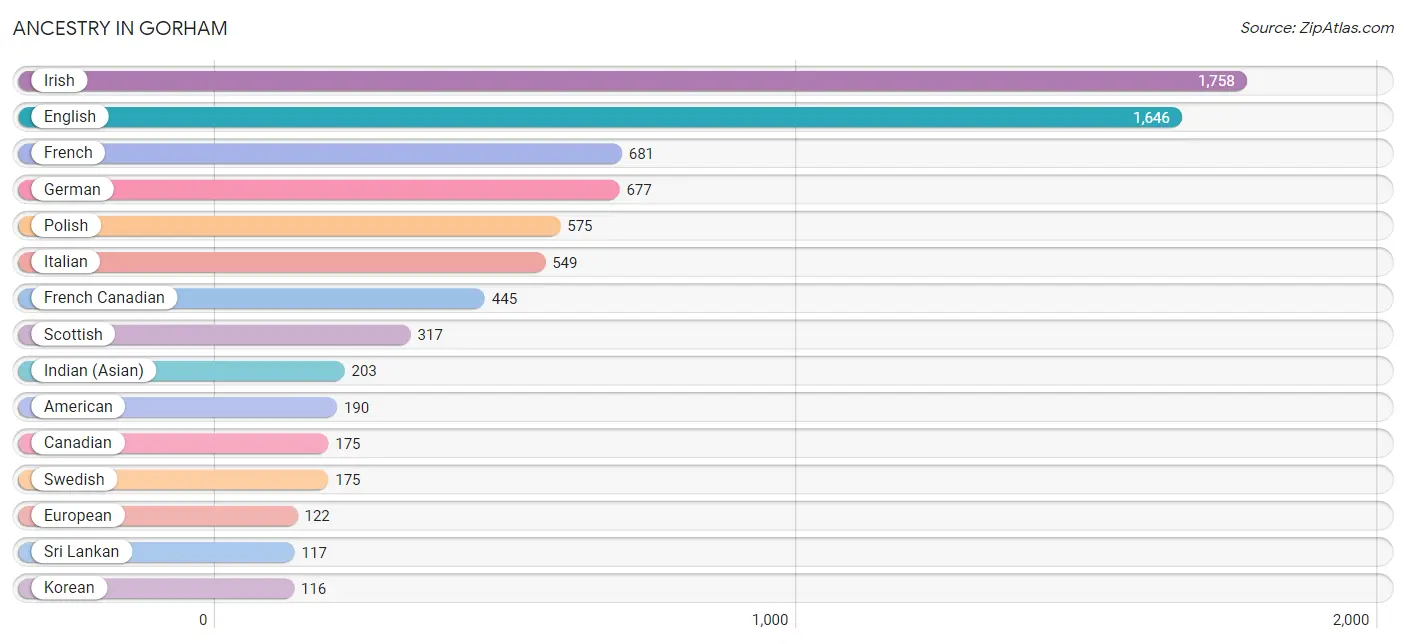
Ancestry in Gorham
The most populous ancestries reported in Gorham are Irish (1,758 | 24.9%), English (1,646 | 23.4%), French (681 | 9.7%), German (677 | 9.6%), and Polish (575 | 8.2%), together accounting for 75.7% of all Gorham residents.
| Ancestry | # Population | % Population |
| African | 6 | 0.1% |
| American | 190 | 2.7% |
| Arab | 20 | 0.3% |
| Austrian | 20 | 0.3% |
| Brazilian | 19 | 0.3% |
| British | 71 | 1.0% |
| Burmese | 68 | 1.0% |
| Canadian | 175 | 2.5% |
| Celtic | 19 | 0.3% |
| Central American | 40 | 0.6% |
| Czech | 62 | 0.9% |
| Danish | 8 | 0.1% |
| Dominican | 21 | 0.3% |
| Dutch | 20 | 0.3% |
| Ecuadorian | 5 | 0.1% |
| English | 1,646 | 23.4% |
| European | 122 | 1.7% |
| Finnish | 37 | 0.5% |
| French | 681 | 9.7% |
| French Canadian | 445 | 6.3% |
| German | 677 | 9.6% |
| Greek | 57 | 0.8% |
| Guatemalan | 34 | 0.5% |
| Hungarian | 8 | 0.1% |
| Indian (Asian) | 203 | 2.9% |
| Iranian | 7 | 0.1% |
| Irish | 1,758 | 24.9% |
| Italian | 549 | 7.8% |
| Jamaican | 7 | 0.1% |
| Japanese | 6 | 0.1% |
| Kenyan | 6 | 0.1% |
| Korean | 116 | 1.7% |
| Lebanese | 14 | 0.2% |
| Mexican | 39 | 0.5% |
| Navajo | 26 | 0.4% |
| Norwegian | 6 | 0.1% |
| Pakistani | 7 | 0.1% |
| Panamanian | 6 | 0.1% |
| Polish | 575 | 8.2% |
| Portuguese | 72 | 1.0% |
| Puerto Rican | 4 | 0.1% |
| Romanian | 25 | 0.4% |
| Russian | 6 | 0.1% |
| Scotch-Irish | 58 | 0.8% |
| Scottish | 317 | 4.5% |
| Slovak | 35 | 0.5% |
| Somali | 25 | 0.4% |
| South American | 15 | 0.2% |
| Spaniard | 7 | 0.1% |
| Sri Lankan | 117 | 1.7% |
| Subsaharan African | 65 | 0.9% |
| Sudanese | 7 | 0.1% |
| Swedish | 175 | 2.5% |
| Thai | 5 | 0.1% |
| Trinidadian and Tobagonian | 7 | 0.1% |
| Ukrainian | 21 | 0.3% |
| Uruguayan | 10 | 0.1% |
| Welsh | 21 | 0.3% |
| Zimbabwean | 7 | 0.1% | View All 59 Rows |
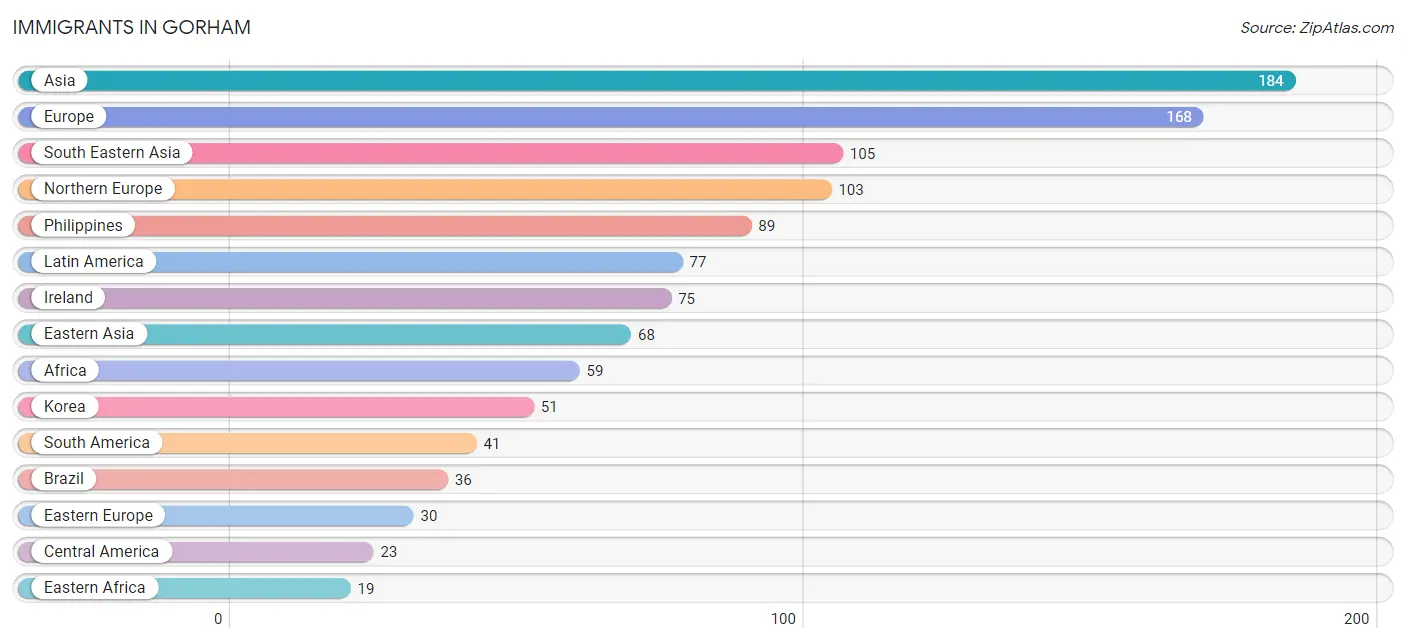
Immigrants in Gorham
The most numerous immigrant groups reported in Gorham came from Asia (184 | 2.6%), Europe (168 | 2.4%), South Eastern Asia (105 | 1.5%), Northern Europe (103 | 1.5%), and Philippines (89 | 1.3%), together accounting for 9.2% of all Gorham residents.
| Immigration Origin | # Population | % Population |
| Africa | 59 | 0.8% |
| Asia | 184 | 2.6% |
| Brazil | 36 | 0.5% |
| Canada | 6 | 0.1% |
| Caribbean | 13 | 0.2% |
| Central America | 23 | 0.3% |
| China | 17 | 0.2% |
| Czechoslovakia | 16 | 0.2% |
| Eastern Africa | 19 | 0.3% |
| Eastern Asia | 68 | 1.0% |
| Eastern Europe | 30 | 0.4% |
| Ecuador | 5 | 0.1% |
| England | 12 | 0.2% |
| Ethiopia | 6 | 0.1% |
| Europe | 168 | 2.4% |
| Germany | 17 | 0.2% |
| Guatemala | 16 | 0.2% |
| India | 5 | 0.1% |
| Iraq | 6 | 0.1% |
| Ireland | 75 | 1.1% |
| Italy | 18 | 0.3% |
| Jamaica | 13 | 0.2% |
| Kenya | 2 | 0.0% |
| Korea | 51 | 0.7% |
| Latin America | 77 | 1.1% |
| Mexico | 7 | 0.1% |
| Middle Africa | 14 | 0.2% |
| Northern Africa | 7 | 0.1% |
| Northern Europe | 103 | 1.5% |
| Philippines | 89 | 1.3% |
| Poland | 7 | 0.1% |
| Russia | 7 | 0.1% |
| Somalia | 11 | 0.2% |
| South Africa | 12 | 0.2% |
| South America | 41 | 0.6% |
| South Central Asia | 5 | 0.1% |
| South Eastern Asia | 105 | 1.5% |
| Southern Europe | 18 | 0.3% |
| Sudan | 7 | 0.1% |
| Taiwan | 2 | 0.0% |
| Thailand | 3 | 0.0% |
| Vietnam | 13 | 0.2% |
| Western Asia | 6 | 0.1% |
| Western Europe | 17 | 0.2% |
| Zaire | 14 | 0.2% | View All 45 Rows |
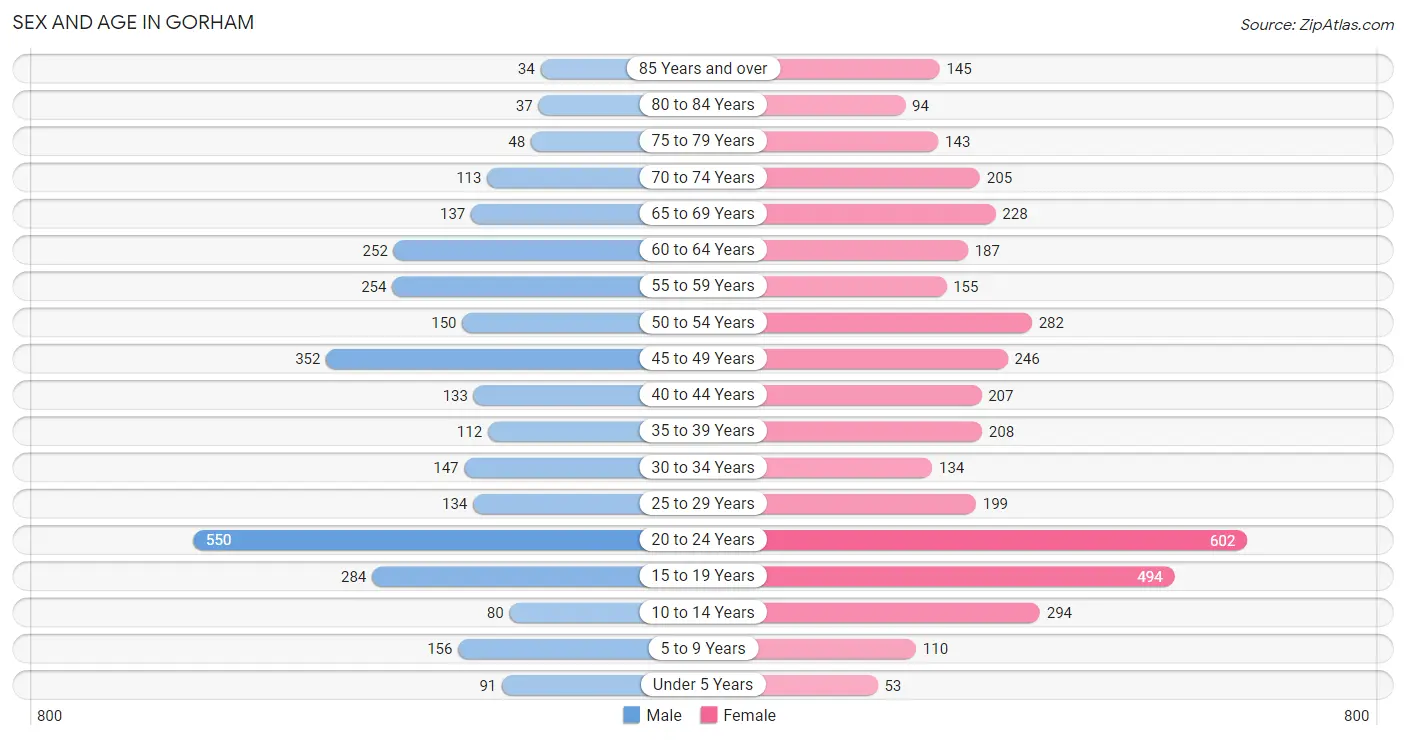
Sex and Age in Gorham
Sex and Age in Gorham
The most populous age groups in Gorham are 20 to 24 Years (550 | 17.9%) for men and 20 to 24 Years (602 | 15.1%) for women.
| Age Bracket | Male | Female |
| Under 5 Years | 91 (3.0%) | 53 (1.3%) |
| 5 to 9 Years | 156 (5.1%) | 110 (2.8%) |
| 10 to 14 Years | 80 (2.6%) | 294 (7.4%) |
| 15 to 19 Years | 284 (9.3%) | 494 (12.4%) |
| 20 to 24 Years | 550 (17.9%) | 602 (15.1%) |
| 25 to 29 Years | 134 (4.4%) | 199 (5.0%) |
| 30 to 34 Years | 147 (4.8%) | 134 (3.4%) |
| 35 to 39 Years | 112 (3.7%) | 208 (5.2%) |
| 40 to 44 Years | 133 (4.3%) | 207 (5.2%) |
| 45 to 49 Years | 352 (11.5%) | 246 (6.2%) |
| 50 to 54 Years | 150 (4.9%) | 282 (7.1%) |
| 55 to 59 Years | 254 (8.3%) | 155 (3.9%) |
| 60 to 64 Years | 252 (8.2%) | 187 (4.7%) |
| 65 to 69 Years | 137 (4.5%) | 228 (5.7%) |
| 70 to 74 Years | 113 (3.7%) | 205 (5.1%) |
| 75 to 79 Years | 48 (1.6%) | 143 (3.6%) |
| 80 to 84 Years | 37 (1.2%) | 94 (2.4%) |
| 85 Years and over | 34 (1.1%) | 145 (3.6%) |
| Total | 3,064 (100.0%) | 3,986 (100.0%) |
Families and Households in Gorham
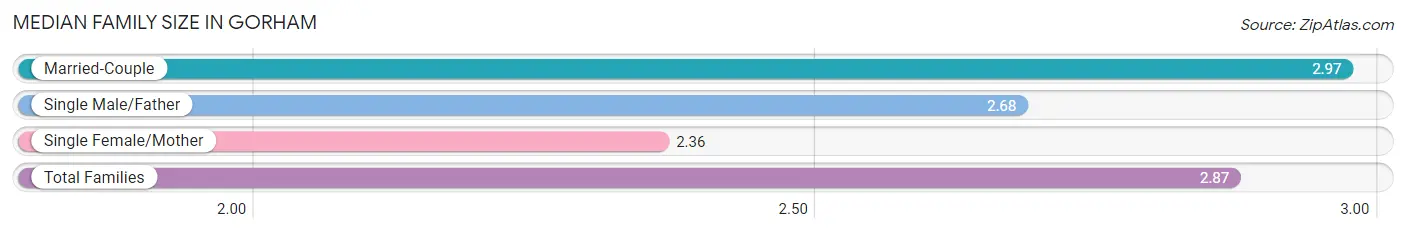
Median Family Size in Gorham
The median family size in Gorham is 2.87 persons per family, with married-couple families (1,237 | 82.3%) accounting for the largest median family size of 2.97 persons per family. On the other hand, single female/mother families (205 | 13.6%) represent the smallest median family size with 2.36 persons per family.
| Family Type | # Families | Family Size |
| Married-Couple | 1,237 (82.3%) | 2.97 |
| Single Male/Father | 62 (4.1%) | 2.68 |
| Single Female/Mother | 205 (13.6%) | 2.36 |
| Total Families | 1,504 (100.0%) | 2.87 |
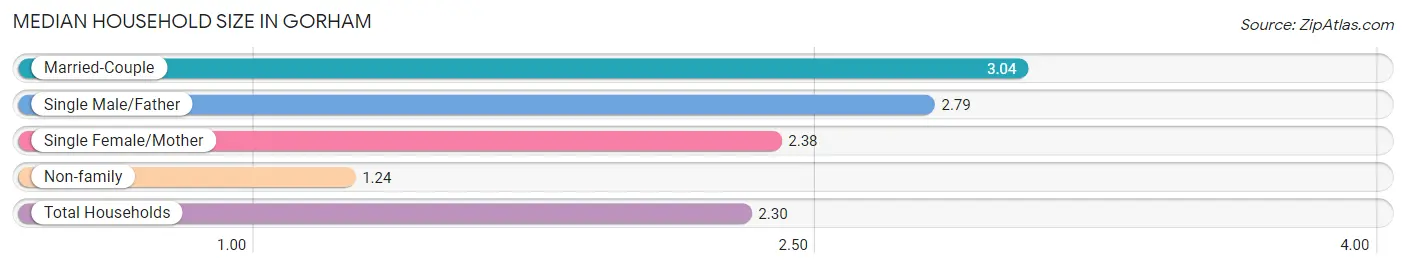
Median Household Size in Gorham
The median household size in Gorham is 2.30 persons per household, with married-couple households (1,237 | 51.3%) accounting for the largest median household size of 3.04 persons per household. non-family households (909 | 37.7%) represent the smallest median household size with 1.24 persons per household.
| Household Type | # Households | Household Size |
| Married-Couple | 1,237 (51.3%) | 3.04 |
| Single Male/Father | 62 (2.6%) | 2.79 |
| Single Female/Mother | 205 (8.5%) | 2.38 |
| Non-family | 909 (37.7%) | 1.24 |
| Total Households | 2,413 (100.0%) | 2.30 |
Household Size by Marriage Status in Gorham
Out of a total of 2,413 households in Gorham, 1,504 (62.3%) are family households, while 909 (37.7%) are nonfamily households. The most numerous type of family households are 2-person households, comprising 660, and the most common type of nonfamily households are 1-person households, comprising 738.
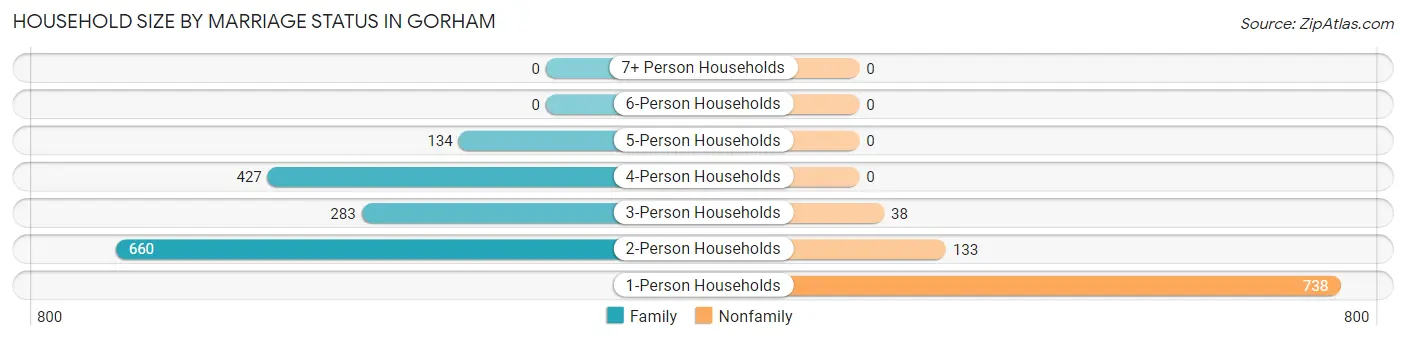
| Household Size | Family Households | Nonfamily Households |
| 1-Person Households | - | 738 (30.6%) |
| 2-Person Households | 660 (27.4%) | 133 (5.5%) |
| 3-Person Households | 283 (11.7%) | 38 (1.6%) |
| 4-Person Households | 427 (17.7%) | 0 (0.0%) |
| 5-Person Households | 134 (5.6%) | 0 (0.0%) |
| 6-Person Households | 0 (0.0%) | 0 (0.0%) |
| 7+ Person Households | 0 (0.0%) | 0 (0.0%) |
| Total | 1,504 (62.3%) | 909 (37.7%) |
Female Fertility in Gorham
Fertility by Age in Gorham
Average fertility rate in Gorham is 9.0 births per 1,000 women. Women in the age bracket of 20 to 34 years have the highest fertility rate with 22.0 births per 1,000 women. Women in the age bracket of 20 to 34 years acount for 100.0% of all women with births.
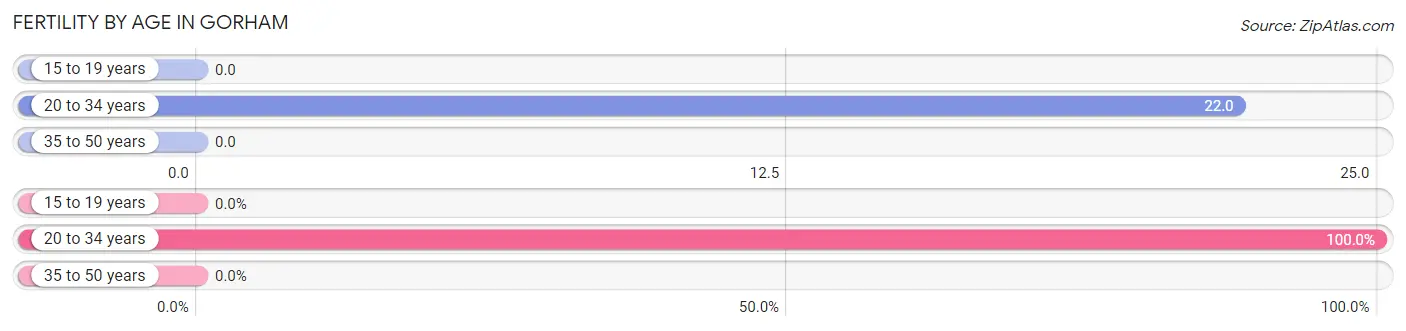
| Age Bracket | Women with Births | Births / 1,000 Women |
| 15 to 19 years | 0 (0.0%) | 0.0 |
| 20 to 34 years | 21 (100.0%) | 22.0 |
| 35 to 50 years | 0 (0.0%) | 0.0 |
| Total | 21 (100.0%) | 9.0 |
Fertility by Age by Marriage Status in Gorham
66.7% of women with births (21) in Gorham are married. The highest percentage of unmarried women with births falls into 20 to 34 years age bracket with 33.3% of them unmarried at the time of birth, while the lowest percentage of unmarried women with births belong to 20 to 34 years age bracket with 33.3% of them unmarried.
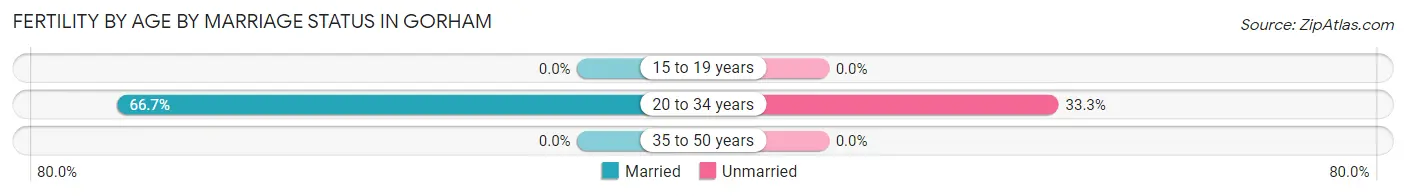
| Age Bracket | Married | Unmarried |
| 15 to 19 years | 0 (0.0%) | 0 (0.0%) |
| 20 to 34 years | 14 (66.7%) | 7 (33.3%) |
| 35 to 50 years | 0 (0.0%) | 0 (0.0%) |
| Total | 14 (66.7%) | 7 (33.3%) |
Fertility by Education in Gorham
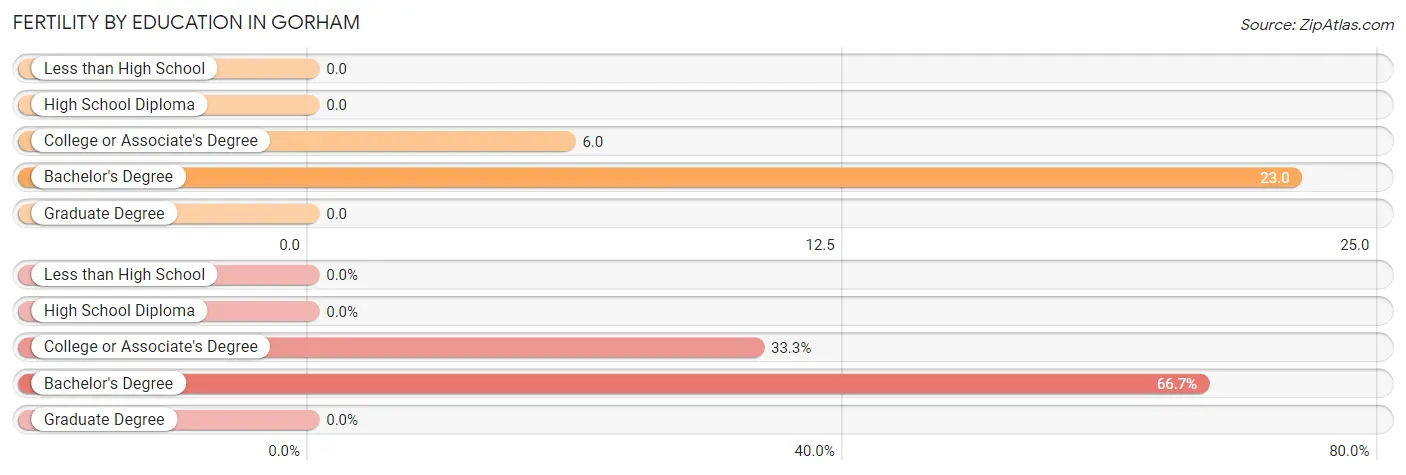
| Educational Attainment | Women with Births | Births / 1,000 Women |
| Less than High School | 0 (0.0%) | 0.0 |
| High School Diploma | 0 (0.0%) | 0.0 |
| College or Associate's Degree | 7 (33.3%) | 6.0 |
| Bachelor's Degree | 14 (66.7%) | 23.0 |
| Graduate Degree | 0 (0.0%) | 0.0 |
| Total | 21 (100.0%) | 9.0 |
Fertility by Education by Marriage Status in Gorham
33.3% of women with births in Gorham are unmarried. Women with the educational attainment of bachelor's degree are most likely to be married with 100.0% of them married at childbirth, while women with the educational attainment of college or associate's degree are least likely to be married with 100.0% of them unmarried at childbirth.
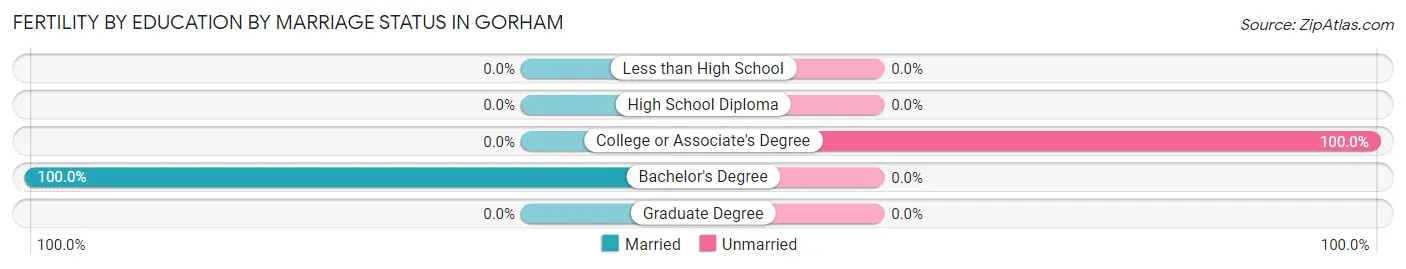
| Educational Attainment | Married | Unmarried |
| Less than High School | 0 (0.0%) | 0 (0.0%) |
| High School Diploma | 0 (0.0%) | 0 (0.0%) |
| College or Associate's Degree | 0 (0.0%) | 7 (100.0%) |
| Bachelor's Degree | 14 (100.0%) | 0 (0.0%) |
| Graduate Degree | 0 (0.0%) | 0 (0.0%) |
| Total | 14 (66.7%) | 7 (33.3%) |
Employment Characteristics in Gorham
Employment by Class of Employer in Gorham
Among the 4,119 employed individuals in Gorham, private company employees (2,313 | 56.1%), not-for-profit organizations (699 | 17.0%), and local government employees (412 | 10.0%) make up the most common classes of employment.
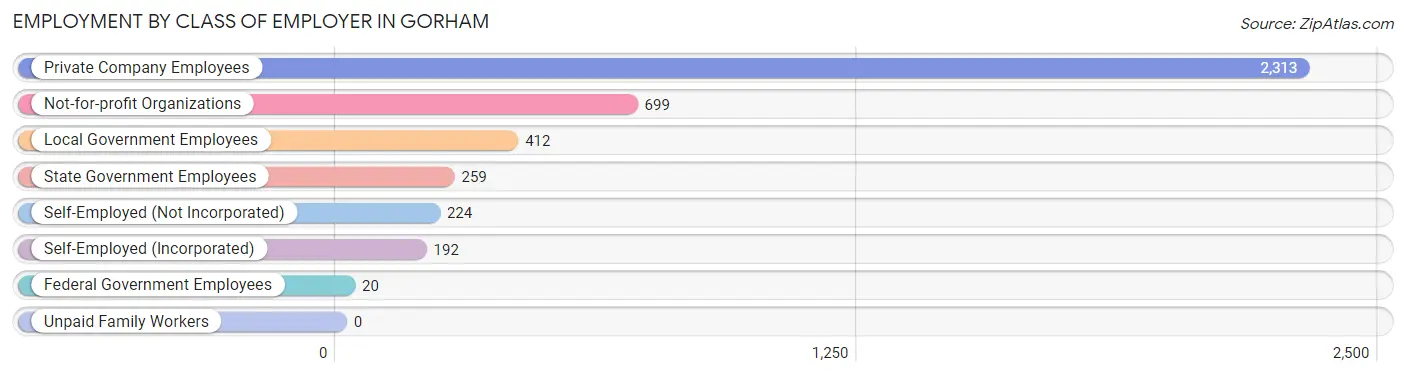
| Employer Class | # Employees | % Employees |
| Private Company Employees | 2,313 | 56.1% |
| Self-Employed (Incorporated) | 192 | 4.7% |
| Self-Employed (Not Incorporated) | 224 | 5.4% |
| Not-for-profit Organizations | 699 | 17.0% |
| Local Government Employees | 412 | 10.0% |
| State Government Employees | 259 | 6.3% |
| Federal Government Employees | 20 | 0.5% |
| Unpaid Family Workers | 0 | 0.0% |
| Total | 4,119 | 100.0% |
Employment Status by Age in Gorham
According to the labor force statistics for Gorham, out of the total population over 16 years of age (6,239), 69.8% or 4,355 individuals are in the labor force, with 4.1% or 179 of them unemployed. The age group with the highest labor force participation rate is 25 to 29 years, with 97.3% or 324 individuals in the labor force. Within the labor force, the 45 to 54 years age range has the highest percentage of unemployed individuals, with 8.0% or 77 of them being unemployed.
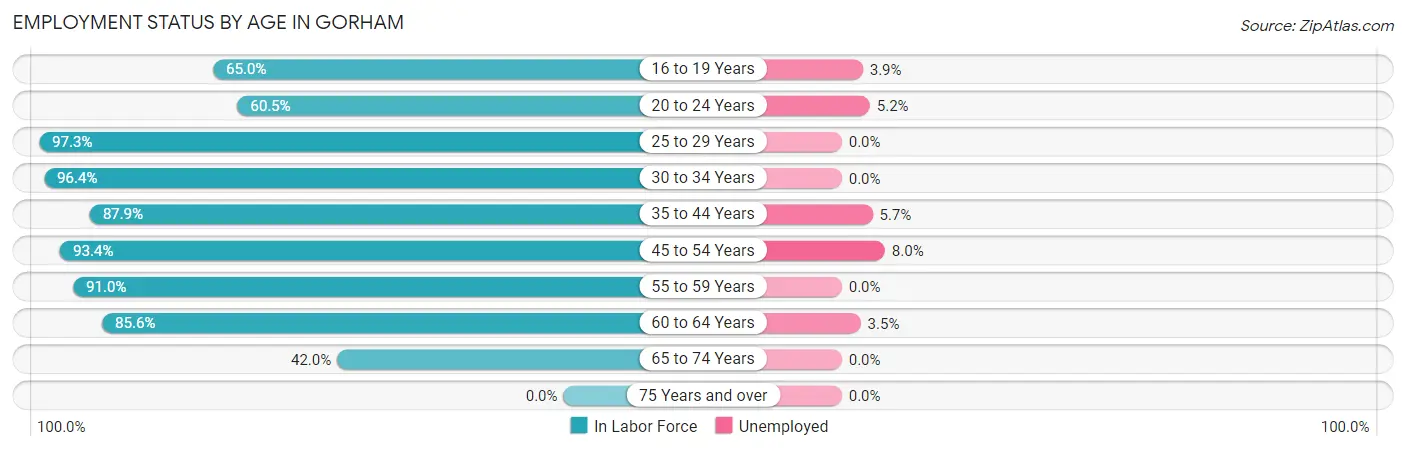
| Age Bracket | In Labor Force | Unemployed |
| 16 to 19 Years | 488 (65.0%) | 19 (3.9%) |
| 20 to 24 Years | 697 (60.5%) | 36 (5.2%) |
| 25 to 29 Years | 324 (97.3%) | 0 (0.0%) |
| 30 to 34 Years | 271 (96.4%) | 0 (0.0%) |
| 35 to 44 Years | 580 (87.9%) | 33 (5.7%) |
| 45 to 54 Years | 962 (93.4%) | 77 (8.0%) |
| 55 to 59 Years | 372 (91.0%) | 0 (0.0%) |
| 60 to 64 Years | 376 (85.6%) | 13 (3.5%) |
| 65 to 74 Years | 287 (42.0%) | 0 (0.0%) |
| 75 Years and over | 0 (0.0%) | 0 (0.0%) |
| Total | 4,355 (69.8%) | 179 (4.1%) |
Employment Status by Educational Attainment in Gorham
According to labor force statistics for Gorham, 91.5% of individuals (2,884) out of the total population between 25 and 64 years of age (3,152) are in the labor force, with 4.3% or 124 of them being unemployed. The group with the highest labor force participation rate are those with the educational attainment of bachelor's degree or higher, with 96.0% or 1,648 individuals in the labor force. Within the labor force, individuals with less than high school education have the highest percentage of unemployment, with 100.0% or 13 of them being unemployed.
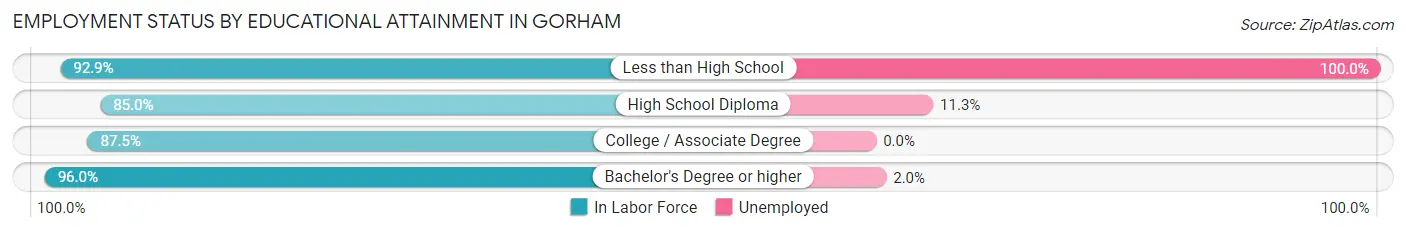
| Educational Attainment | In Labor Force | Unemployed |
| Less than High School | 13 (92.9%) | 14 (100.0%) |
| High School Diploma | 683 (85.0%) | 91 (11.3%) |
| College / Associate Degree | 540 (87.5%) | 0 (0.0%) |
| Bachelor's Degree or higher | 1,648 (96.0%) | 34 (2.0%) |
| Total | 2,884 (91.5%) | 136 (4.3%) |
Employment Occupations by Sex in Gorham
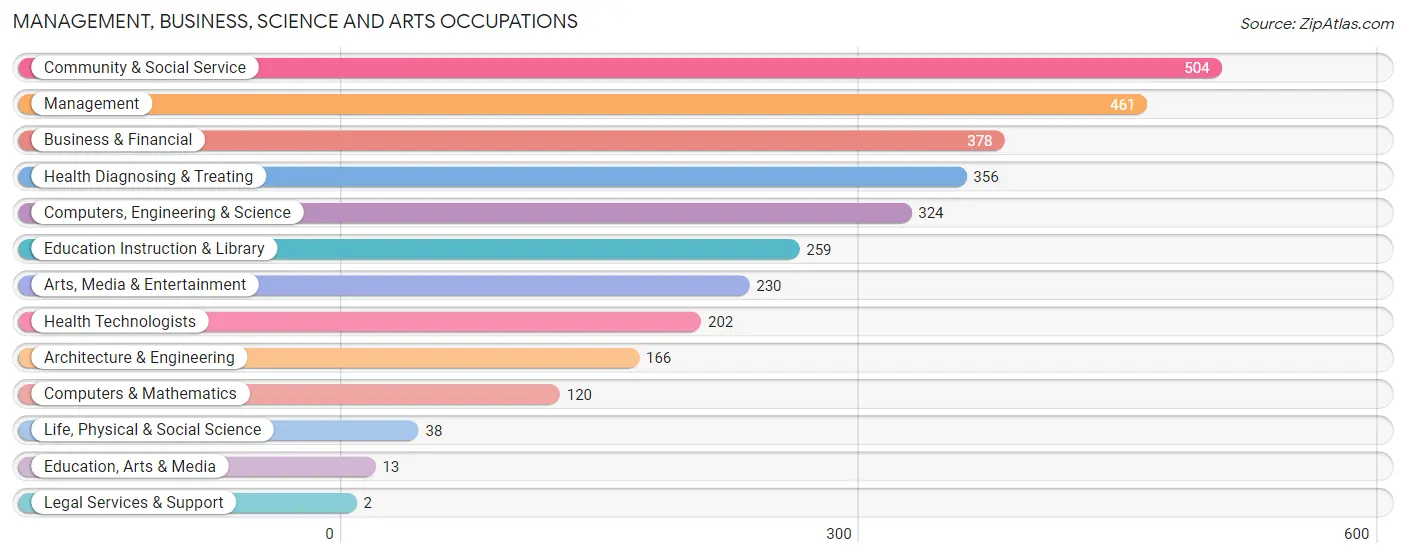
Management, Business, Science and Arts Occupations
The most common Management, Business, Science and Arts occupations in Gorham are Community & Social Service (504 | 12.1%), Management (461 | 11.0%), Business & Financial (378 | 9.0%), Health Diagnosing & Treating (356 | 8.5%), and Computers, Engineering & Science (324 | 7.7%).
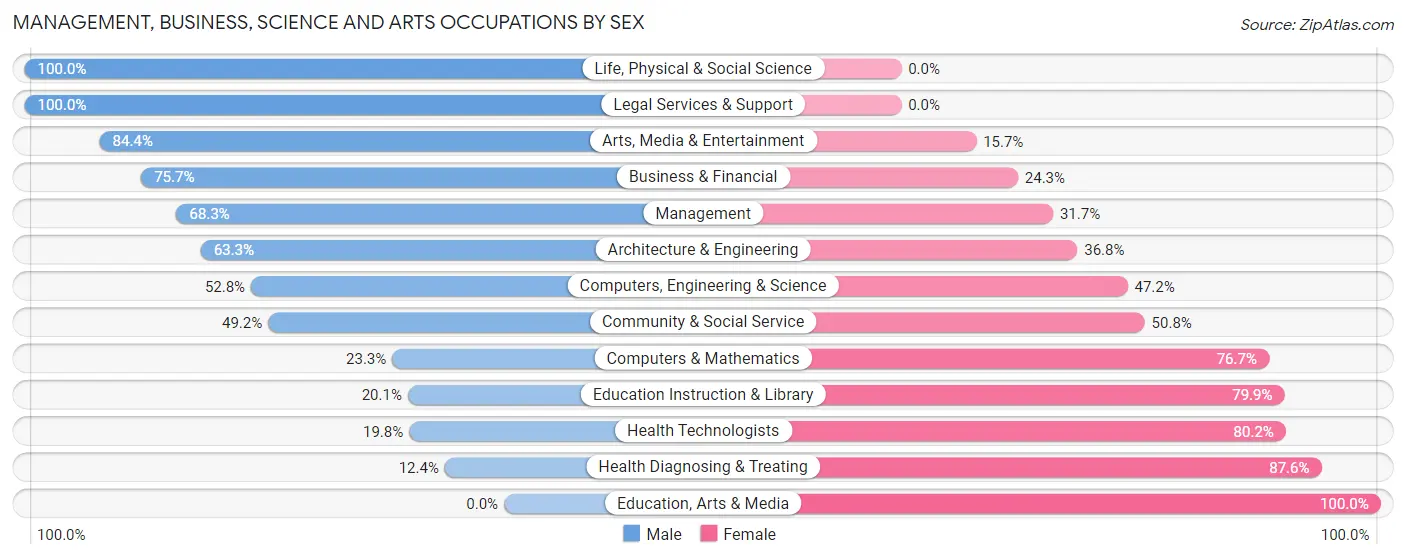
Management, Business, Science and Arts Occupations by Sex
Within the Management, Business, Science and Arts occupations in Gorham, the most male-oriented occupations are Life, Physical & Social Science (100.0%), Legal Services & Support (100.0%), and Arts, Media & Entertainment (84.4%), while the most female-oriented occupations are Education, Arts & Media (100.0%), Health Diagnosing & Treating (87.6%), and Health Technologists (80.2%).
| Occupation | Male | Female |
| Management | 315 (68.3%) | 146 (31.7%) |
| Business & Financial | 286 (75.7%) | 92 (24.3%) |
| Computers, Engineering & Science | 171 (52.8%) | 153 (47.2%) |
| Computers & Mathematics | 28 (23.3%) | 92 (76.7%) |
| Architecture & Engineering | 105 (63.2%) | 61 (36.7%) |
| Life, Physical & Social Science | 38 (100.0%) | 0 (0.0%) |
| Community & Social Service | 248 (49.2%) | 256 (50.8%) |
| Education, Arts & Media | 0 (0.0%) | 13 (100.0%) |
| Legal Services & Support | 2 (100.0%) | 0 (0.0%) |
| Education Instruction & Library | 52 (20.1%) | 207 (79.9%) |
| Arts, Media & Entertainment | 194 (84.4%) | 36 (15.7%) |
| Health Diagnosing & Treating | 44 (12.4%) | 312 (87.6%) |
| Health Technologists | 40 (19.8%) | 162 (80.2%) |
| Total (Category) | 1,064 (52.6%) | 959 (47.4%) |
| Total (Overall) | 2,002 (47.9%) | 2,177 (52.1%) |
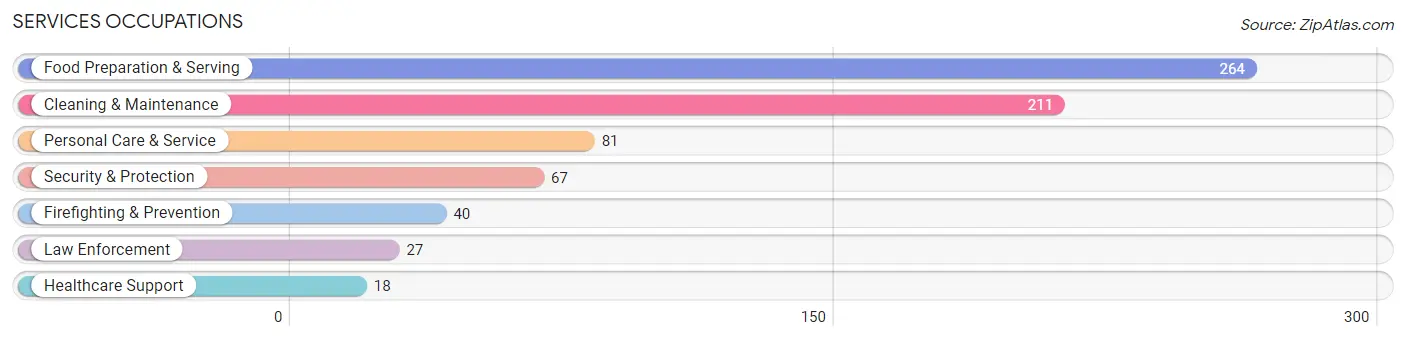
Services Occupations
The most common Services occupations in Gorham are Food Preparation & Serving (264 | 6.3%), Cleaning & Maintenance (211 | 5.1%), Personal Care & Service (81 | 1.9%), Security & Protection (67 | 1.6%), and Firefighting & Prevention (40 | 1.0%).
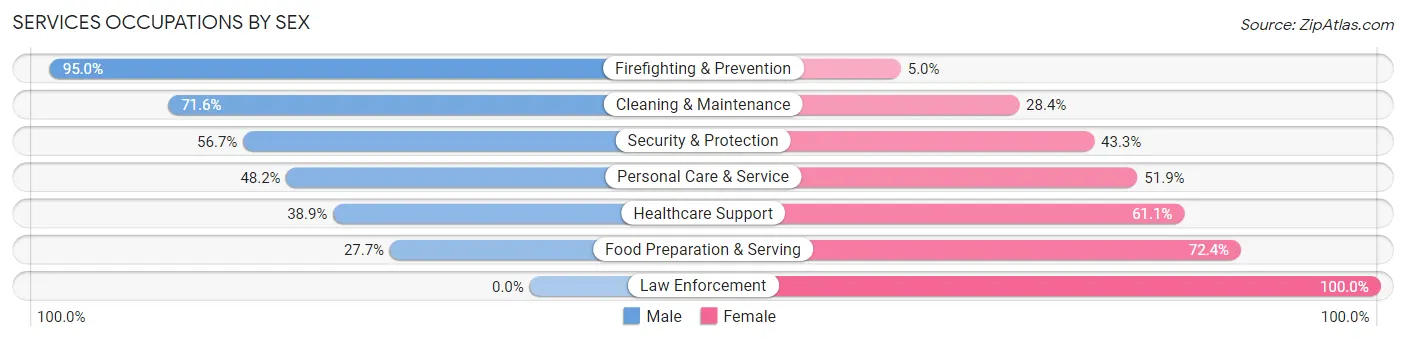
Services Occupations by Sex
Within the Services occupations in Gorham, the most male-oriented occupations are Firefighting & Prevention (95.0%), Cleaning & Maintenance (71.6%), and Security & Protection (56.7%), while the most female-oriented occupations are Law Enforcement (100.0%), Food Preparation & Serving (72.4%), and Healthcare Support (61.1%).
| Occupation | Male | Female |
| Healthcare Support | 7 (38.9%) | 11 (61.1%) |
| Security & Protection | 38 (56.7%) | 29 (43.3%) |
| Firefighting & Prevention | 38 (95.0%) | 2 (5.0%) |
| Law Enforcement | 0 (0.0%) | 27 (100.0%) |
| Food Preparation & Serving | 73 (27.7%) | 191 (72.4%) |
| Cleaning & Maintenance | 151 (71.6%) | 60 (28.4%) |
| Personal Care & Service | 39 (48.1%) | 42 (51.8%) |
| Total (Category) | 308 (48.0%) | 333 (51.9%) |
| Total (Overall) | 2,002 (47.9%) | 2,177 (52.1%) |
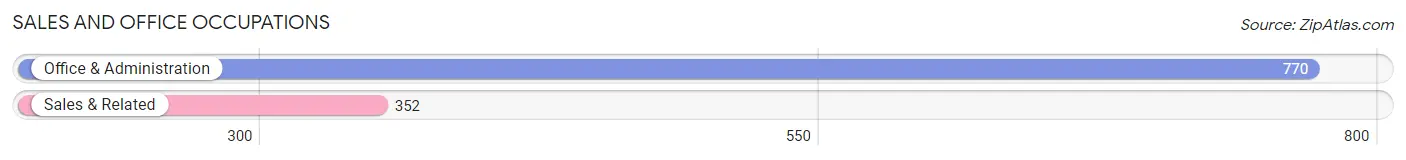
Sales and Office Occupations
The most common Sales and Office occupations in Gorham are Office & Administration (770 | 18.4%), and Sales & Related (352 | 8.4%).
Sales and Office Occupations by Sex
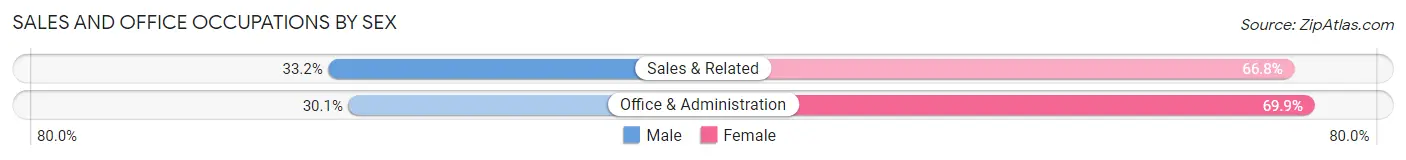
| Occupation | Male | Female |
| Sales & Related | 117 (33.2%) | 235 (66.8%) |
| Office & Administration | 232 (30.1%) | 538 (69.9%) |
| Total (Category) | 349 (31.1%) | 773 (68.9%) |
| Total (Overall) | 2,002 (47.9%) | 2,177 (52.1%) |
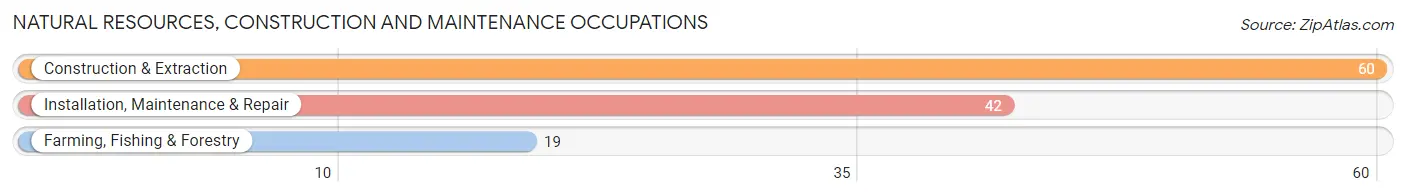
Natural Resources, Construction and Maintenance Occupations
The most common Natural Resources, Construction and Maintenance occupations in Gorham are Construction & Extraction (60 | 1.4%), Installation, Maintenance & Repair (42 | 1.0%), and Farming, Fishing & Forestry (19 | 0.4%).
Natural Resources, Construction and Maintenance Occupations by Sex
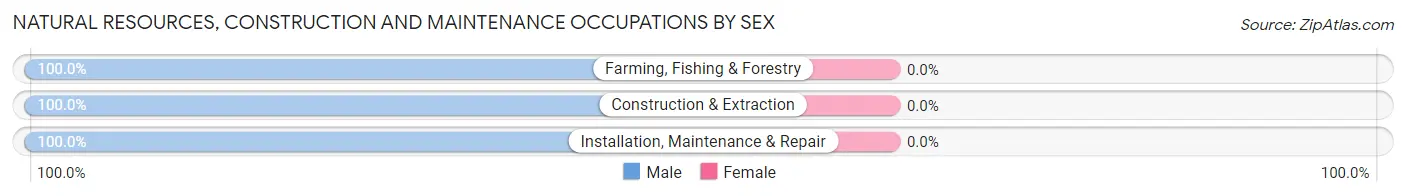
| Occupation | Male | Female |
| Farming, Fishing & Forestry | 19 (100.0%) | 0 (0.0%) |
| Construction & Extraction | 60 (100.0%) | 0 (0.0%) |
| Installation, Maintenance & Repair | 42 (100.0%) | 0 (0.0%) |
| Total (Category) | 121 (100.0%) | 0 (0.0%) |
| Total (Overall) | 2,002 (47.9%) | 2,177 (52.1%) |
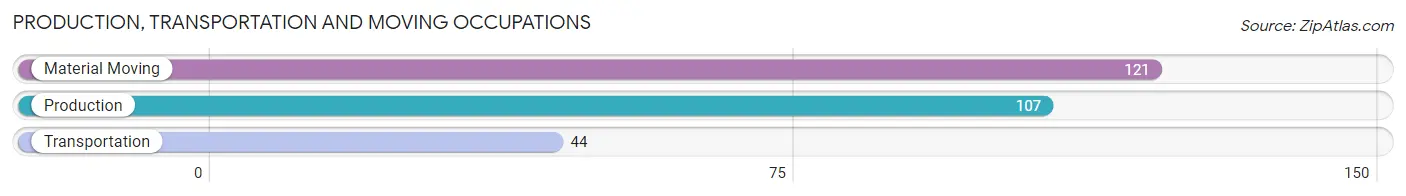
Production, Transportation and Moving Occupations
The most common Production, Transportation and Moving occupations in Gorham are Material Moving (121 | 2.9%), Production (107 | 2.6%), and Transportation (44 | 1.1%).
Production, Transportation and Moving Occupations by Sex
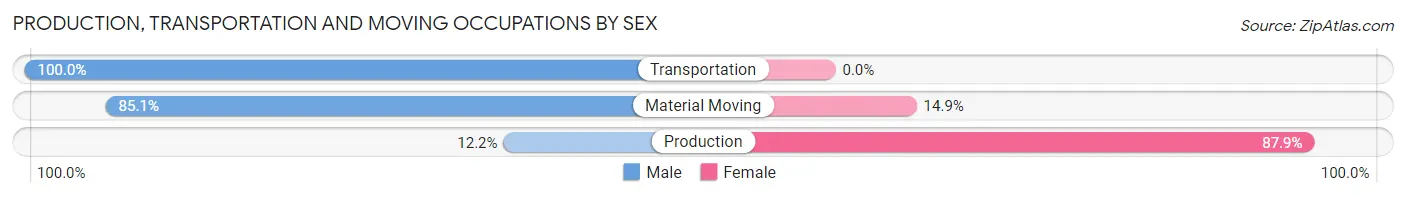
| Occupation | Male | Female |
| Production | 13 (12.1%) | 94 (87.8%) |
| Transportation | 44 (100.0%) | 0 (0.0%) |
| Material Moving | 103 (85.1%) | 18 (14.9%) |
| Total (Category) | 160 (58.8%) | 112 (41.2%) |
| Total (Overall) | 2,002 (47.9%) | 2,177 (52.1%) |
Employment Industries by Sex in Gorham
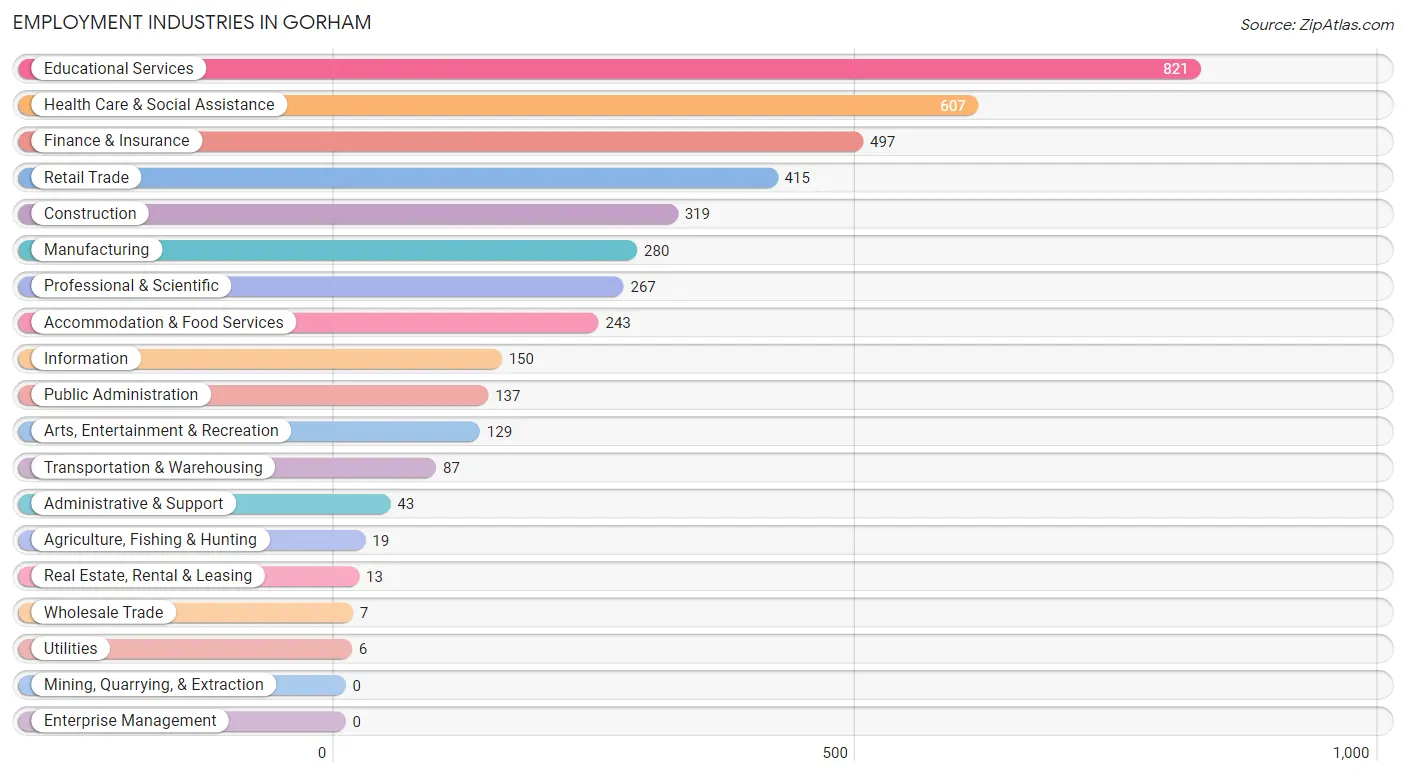
Employment Industries in Gorham
The major employment industries in Gorham include Educational Services (821 | 19.7%), Health Care & Social Assistance (607 | 14.5%), Finance & Insurance (497 | 11.9%), Retail Trade (415 | 9.9%), and Construction (319 | 7.6%).
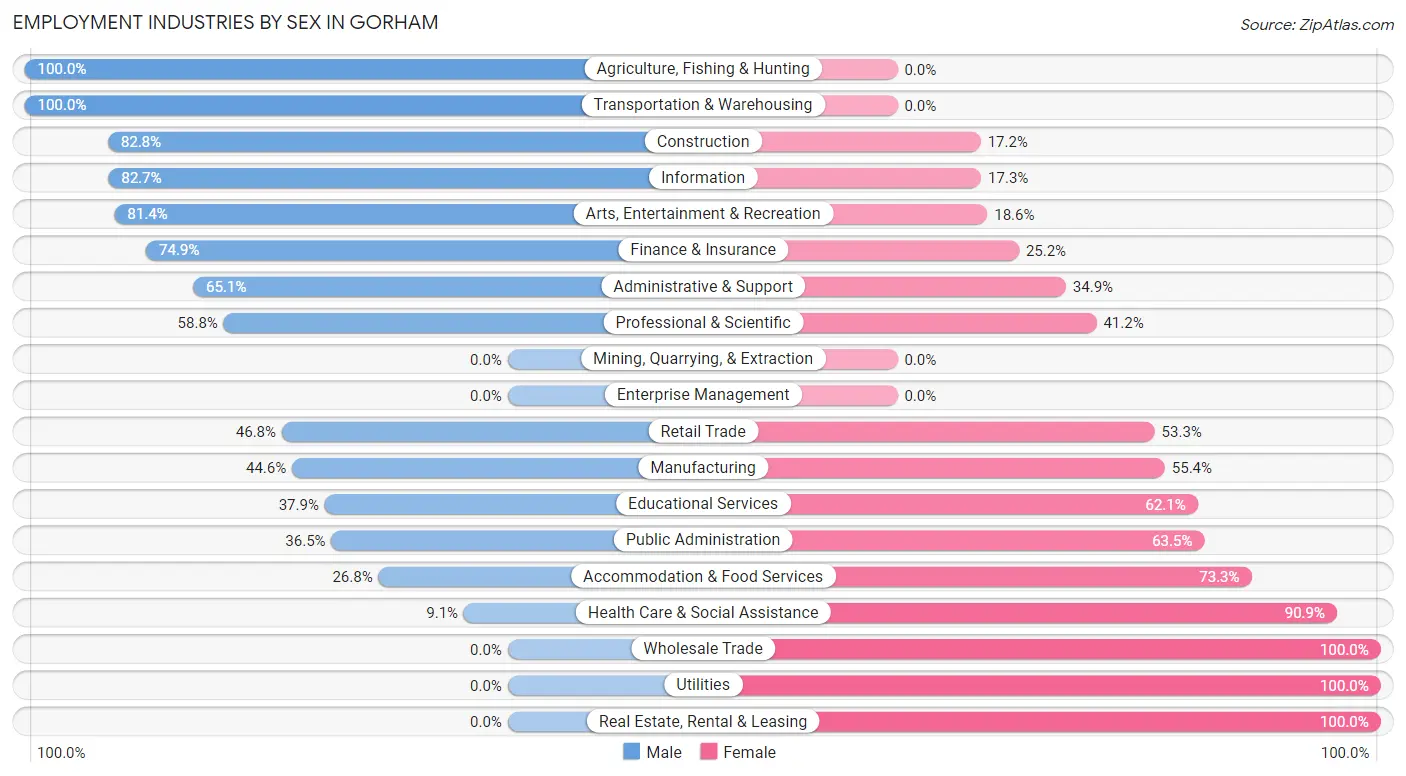
Employment Industries by Sex in Gorham
The Gorham industries that see more men than women are Agriculture, Fishing & Hunting (100.0%), Transportation & Warehousing (100.0%), and Construction (82.8%), whereas the industries that tend to have a higher number of women are Wholesale Trade (100.0%), Utilities (100.0%), and Real Estate, Rental & Leasing (100.0%).
| Industry | Male | Female |
| Agriculture, Fishing & Hunting | 19 (100.0%) | 0 (0.0%) |
| Mining, Quarrying, & Extraction | 0 (0.0%) | 0 (0.0%) |
| Construction | 264 (82.8%) | 55 (17.2%) |
| Manufacturing | 125 (44.6%) | 155 (55.4%) |
| Wholesale Trade | 0 (0.0%) | 7 (100.0%) |
| Retail Trade | 194 (46.8%) | 221 (53.2%) |
| Transportation & Warehousing | 87 (100.0%) | 0 (0.0%) |
| Utilities | 0 (0.0%) | 6 (100.0%) |
| Information | 124 (82.7%) | 26 (17.3%) |
| Finance & Insurance | 372 (74.9%) | 125 (25.2%) |
| Real Estate, Rental & Leasing | 0 (0.0%) | 13 (100.0%) |
| Professional & Scientific | 157 (58.8%) | 110 (41.2%) |
| Enterprise Management | 0 (0.0%) | 0 (0.0%) |
| Administrative & Support | 28 (65.1%) | 15 (34.9%) |
| Educational Services | 311 (37.9%) | 510 (62.1%) |
| Health Care & Social Assistance | 55 (9.1%) | 552 (90.9%) |
| Arts, Entertainment & Recreation | 105 (81.4%) | 24 (18.6%) |
| Accommodation & Food Services | 65 (26.8%) | 178 (73.3%) |
| Public Administration | 50 (36.5%) | 87 (63.5%) |
| Total | 2,002 (47.9%) | 2,177 (52.1%) |
Education in Gorham
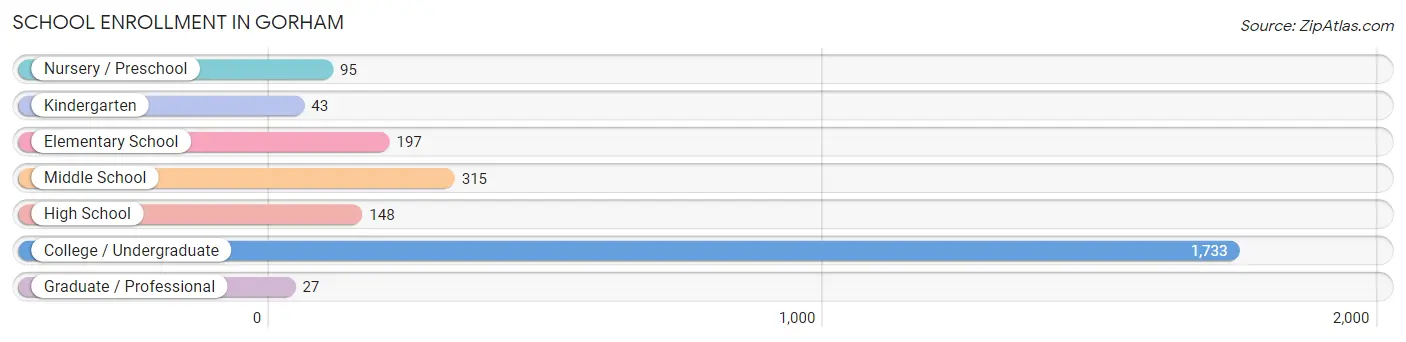
School Enrollment in Gorham
The most common levels of schooling among the 2,558 students in Gorham are college / undergraduate (1,733 | 67.7%), middle school (315 | 12.3%), and elementary school (197 | 7.7%).
| School Level | # Students | % Students |
| Nursery / Preschool | 95 | 3.7% |
| Kindergarten | 43 | 1.7% |
| Elementary School | 197 | 7.7% |
| Middle School | 315 | 12.3% |
| High School | 148 | 5.8% |
| College / Undergraduate | 1,733 | 67.7% |
| Graduate / Professional | 27 | 1.1% |
| Total | 2,558 | 100.0% |
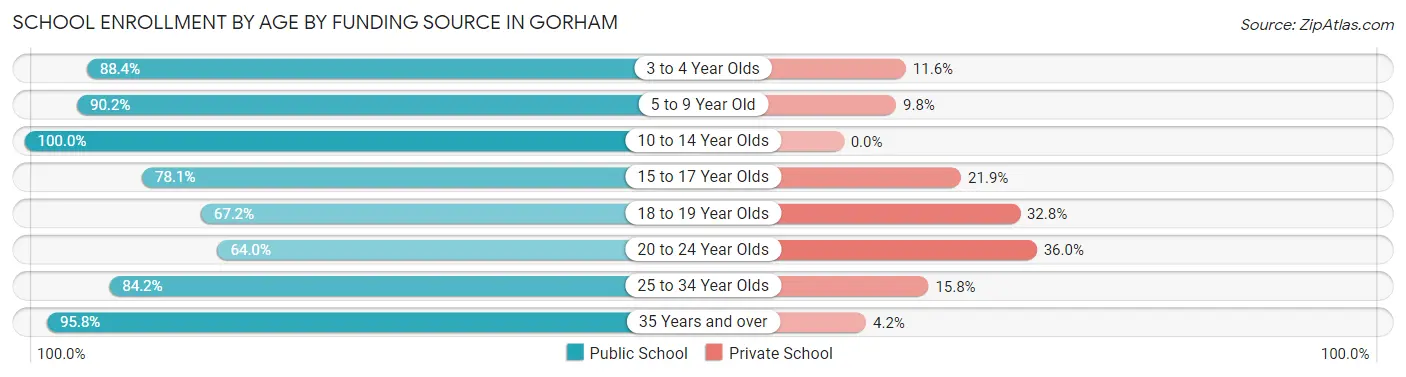
School Enrollment by Age by Funding Source in Gorham
Out of a total of 2,558 students who are enrolled in schools in Gorham, 645 (25.2%) attend a private institution, while the remaining 1,913 (74.8%) are enrolled in public schools. The age group of 20 to 24 year olds has the highest likelihood of being enrolled in private schools, with 361 (36.0% in the age bracket) enrolled. Conversely, the age group of 10 to 14 year olds has the lowest likelihood of being enrolled in a private school, with 374 (100.0% in the age bracket) attending a public institution.
| Age Bracket | Public School | Private School |
| 3 to 4 Year Olds | 61 (88.4%) | 8 (11.6%) |
| 5 to 9 Year Old | 240 (90.2%) | 26 (9.8%) |
| 10 to 14 Year Olds | 374 (100.0%) | 0 (0.0%) |
| 15 to 17 Year Olds | 75 (78.1%) | 21 (21.9%) |
| 18 to 19 Year Olds | 458 (67.2%) | 224 (32.8%) |
| 20 to 24 Year Olds | 643 (64.0%) | 361 (36.0%) |
| 25 to 34 Year Olds | 16 (84.2%) | 3 (15.8%) |
| 35 Years and over | 46 (95.8%) | 2 (4.2%) |
| Total | 1,913 (74.8%) | 645 (25.2%) |
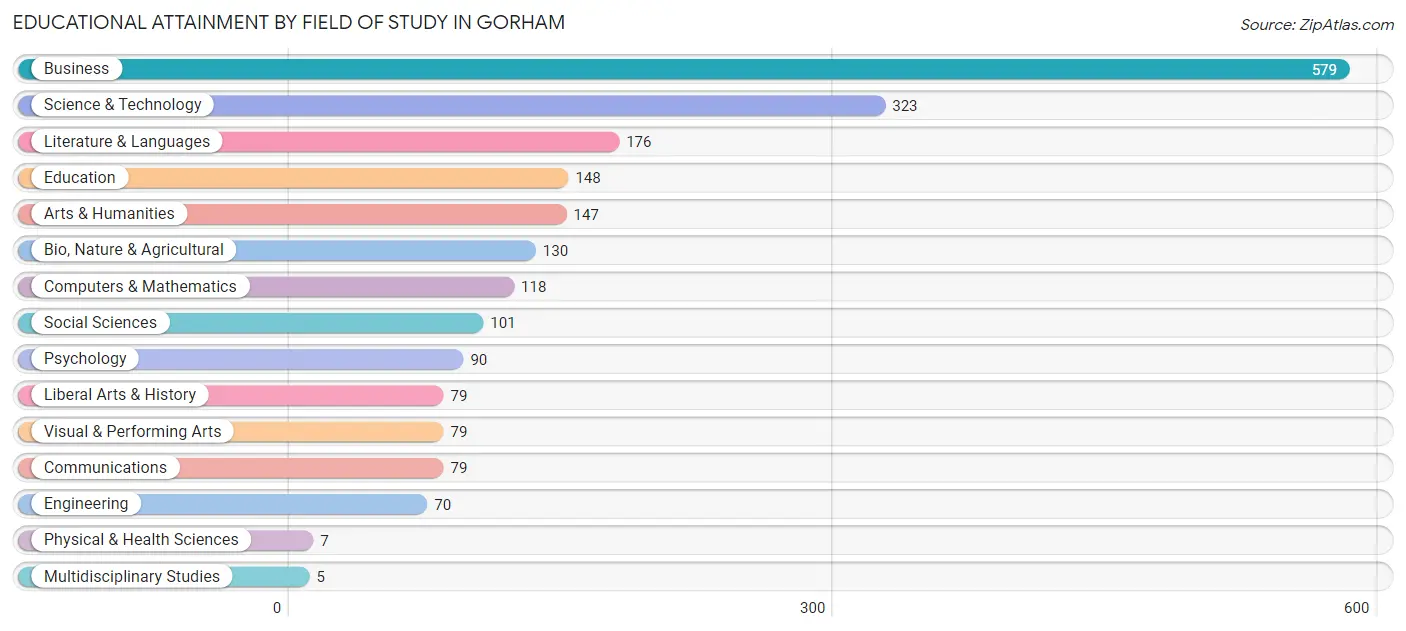
Educational Attainment by Field of Study in Gorham
Business (579 | 27.2%), science & technology (323 | 15.2%), literature & languages (176 | 8.3%), education (148 | 7.0%), and arts & humanities (147 | 6.9%) are the most common fields of study among 2,131 individuals in Gorham who have obtained a bachelor's degree or higher.
| Field of Study | # Graduates | % Graduates |
| Computers & Mathematics | 118 | 5.5% |
| Bio, Nature & Agricultural | 130 | 6.1% |
| Physical & Health Sciences | 7 | 0.3% |
| Psychology | 90 | 4.2% |
| Social Sciences | 101 | 4.7% |
| Engineering | 70 | 3.3% |
| Multidisciplinary Studies | 5 | 0.2% |
| Science & Technology | 323 | 15.2% |
| Business | 579 | 27.2% |
| Education | 148 | 7.0% |
| Literature & Languages | 176 | 8.3% |
| Liberal Arts & History | 79 | 3.7% |
| Visual & Performing Arts | 79 | 3.7% |
| Communications | 79 | 3.7% |
| Arts & Humanities | 147 | 6.9% |
| Total | 2,131 | 100.0% |
Transportation & Commute in Gorham
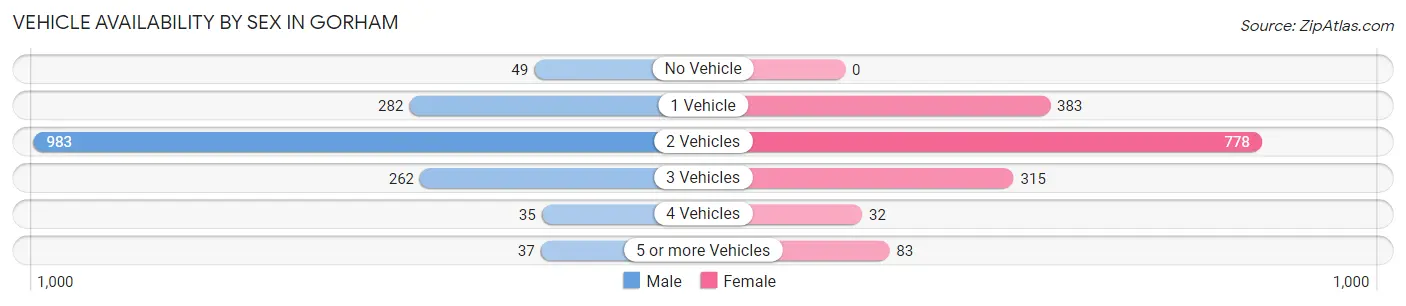
Vehicle Availability by Sex in Gorham
The most prevalent vehicle ownership categories in Gorham are males with 2 vehicles (983, accounting for 59.7%) and females with 2 vehicles (778, making up 61.8%).
| Vehicles Available | Male | Female |
| No Vehicle | 49 (3.0%) | 0 (0.0%) |
| 1 Vehicle | 282 (17.1%) | 383 (24.1%) |
| 2 Vehicles | 983 (59.7%) | 778 (48.9%) |
| 3 Vehicles | 262 (15.9%) | 315 (19.8%) |
| 4 Vehicles | 35 (2.1%) | 32 (2.0%) |
| 5 or more Vehicles | 37 (2.2%) | 83 (5.2%) |
| Total | 1,648 (100.0%) | 1,591 (100.0%) |
Commute Time in Gorham
The most frequently occuring commute durations in Gorham are 30 to 34 minutes (554 commuters, 15.8%), 20 to 24 minutes (551 commuters, 15.7%), and 5 to 9 minutes (440 commuters, 12.6%).
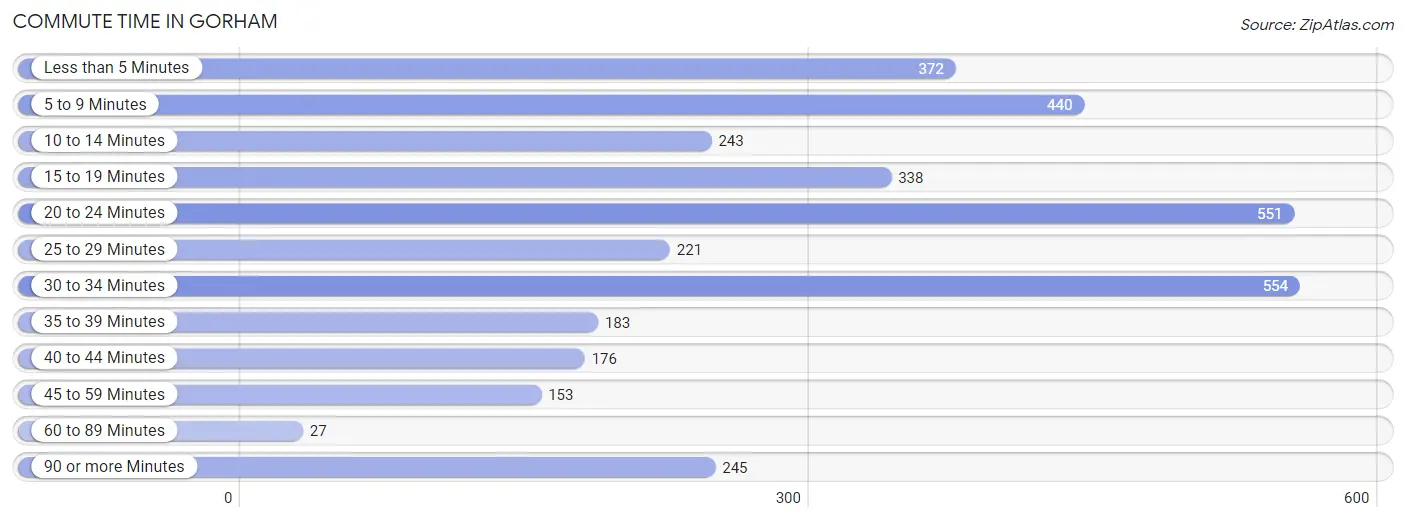
| Commute Time | # Commuters | % Commuters |
| Less than 5 Minutes | 372 | 10.6% |
| 5 to 9 Minutes | 440 | 12.6% |
| 10 to 14 Minutes | 243 | 6.9% |
| 15 to 19 Minutes | 338 | 9.7% |
| 20 to 24 Minutes | 551 | 15.7% |
| 25 to 29 Minutes | 221 | 6.3% |
| 30 to 34 Minutes | 554 | 15.8% |
| 35 to 39 Minutes | 183 | 5.2% |
| 40 to 44 Minutes | 176 | 5.0% |
| 45 to 59 Minutes | 153 | 4.4% |
| 60 to 89 Minutes | 27 | 0.8% |
| 90 or more Minutes | 245 | 7.0% |
Commute Time by Sex in Gorham
The most common commute times in Gorham are 20 to 24 minutes (318 commuters, 19.5%) for males and 5 to 9 minutes (346 commuters, 18.5%) for females.
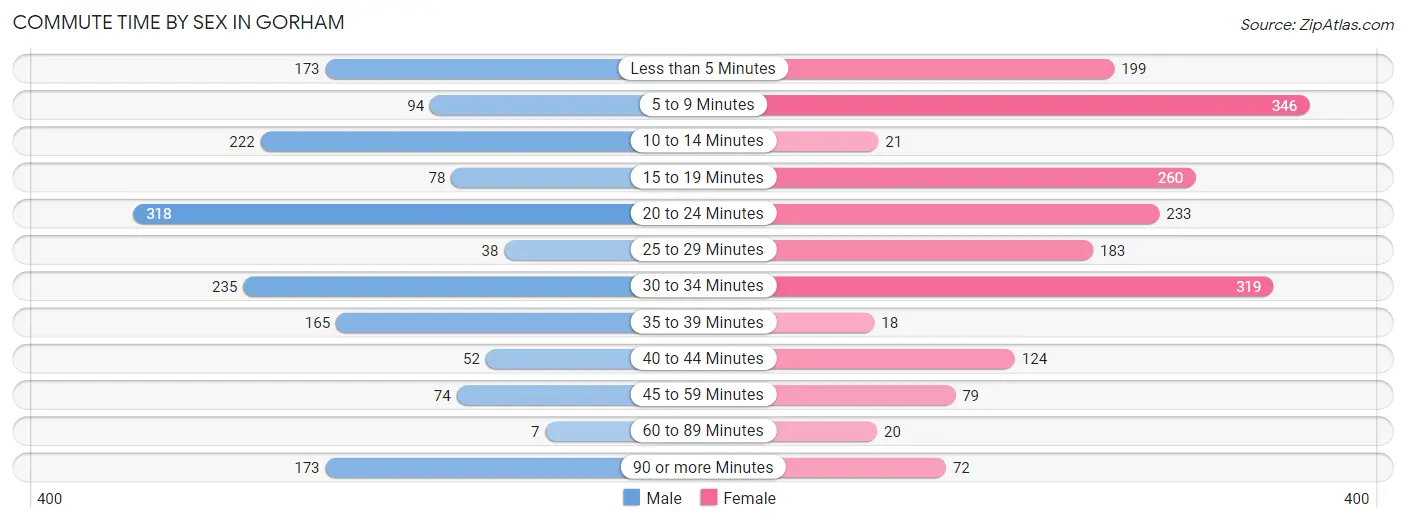
| Commute Time | Male | Female |
| Less than 5 Minutes | 173 (10.6%) | 199 (10.6%) |
| 5 to 9 Minutes | 94 (5.8%) | 346 (18.5%) |
| 10 to 14 Minutes | 222 (13.6%) | 21 (1.1%) |
| 15 to 19 Minutes | 78 (4.8%) | 260 (13.9%) |
| 20 to 24 Minutes | 318 (19.5%) | 233 (12.4%) |
| 25 to 29 Minutes | 38 (2.3%) | 183 (9.8%) |
| 30 to 34 Minutes | 235 (14.4%) | 319 (17.0%) |
| 35 to 39 Minutes | 165 (10.1%) | 18 (1.0%) |
| 40 to 44 Minutes | 52 (3.2%) | 124 (6.6%) |
| 45 to 59 Minutes | 74 (4.5%) | 79 (4.2%) |
| 60 to 89 Minutes | 7 (0.4%) | 20 (1.1%) |
| 90 or more Minutes | 173 (10.6%) | 72 (3.8%) |
Time of Departure to Work by Sex in Gorham
The most frequent times of departure to work in Gorham are 8:00 AM to 8:29 AM (273, 16.8%) for males and 7:00 AM to 7:29 AM (315, 16.8%) for females.
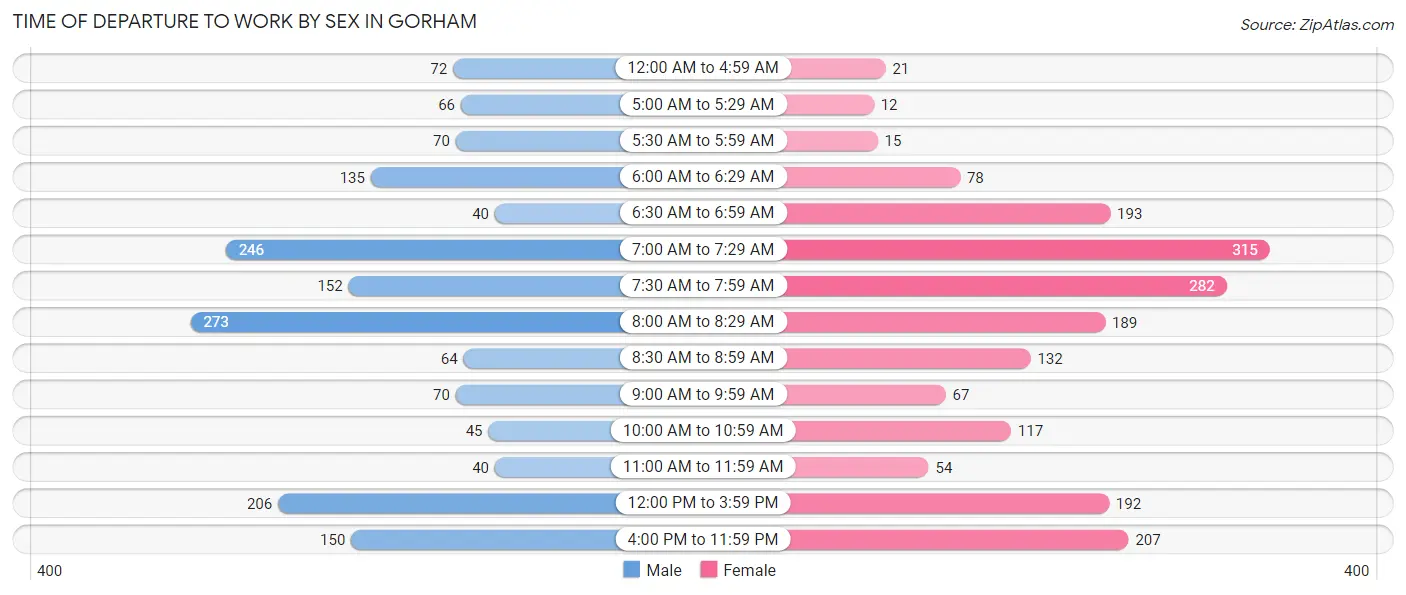
| Time of Departure | Male | Female |
| 12:00 AM to 4:59 AM | 72 (4.4%) | 21 (1.1%) |
| 5:00 AM to 5:29 AM | 66 (4.1%) | 12 (0.6%) |
| 5:30 AM to 5:59 AM | 70 (4.3%) | 15 (0.8%) |
| 6:00 AM to 6:29 AM | 135 (8.3%) | 78 (4.2%) |
| 6:30 AM to 6:59 AM | 40 (2.5%) | 193 (10.3%) |
| 7:00 AM to 7:29 AM | 246 (15.1%) | 315 (16.8%) |
| 7:30 AM to 7:59 AM | 152 (9.3%) | 282 (15.0%) |
| 8:00 AM to 8:29 AM | 273 (16.8%) | 189 (10.1%) |
| 8:30 AM to 8:59 AM | 64 (3.9%) | 132 (7.0%) |
| 9:00 AM to 9:59 AM | 70 (4.3%) | 67 (3.6%) |
| 10:00 AM to 10:59 AM | 45 (2.8%) | 117 (6.2%) |
| 11:00 AM to 11:59 AM | 40 (2.5%) | 54 (2.9%) |
| 12:00 PM to 3:59 PM | 206 (12.7%) | 192 (10.2%) |
| 4:00 PM to 11:59 PM | 150 (9.2%) | 207 (11.1%) |
| Total | 1,629 (100.0%) | 1,874 (100.0%) |
Housing Occupancy in Gorham
Occupancy by Ownership in Gorham
Of the total 2,413 dwellings in Gorham, owner-occupied units account for 1,755 (72.7%), while renter-occupied units make up 658 (27.3%).
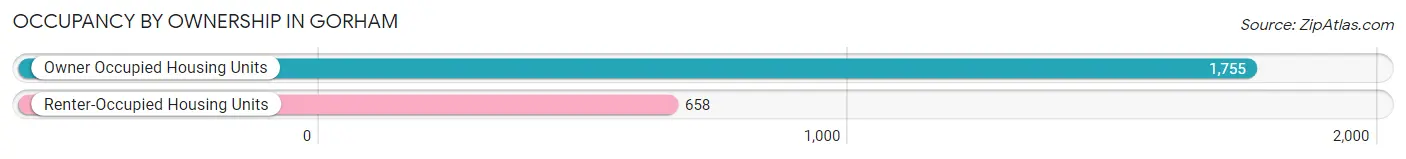
| Occupancy | # Housing Units | % Housing Units |
| Owner Occupied Housing Units | 1,755 | 72.7% |
| Renter-Occupied Housing Units | 658 | 27.3% |
| Total Occupied Housing Units | 2,413 | 100.0% |
Occupancy by Household Size in Gorham
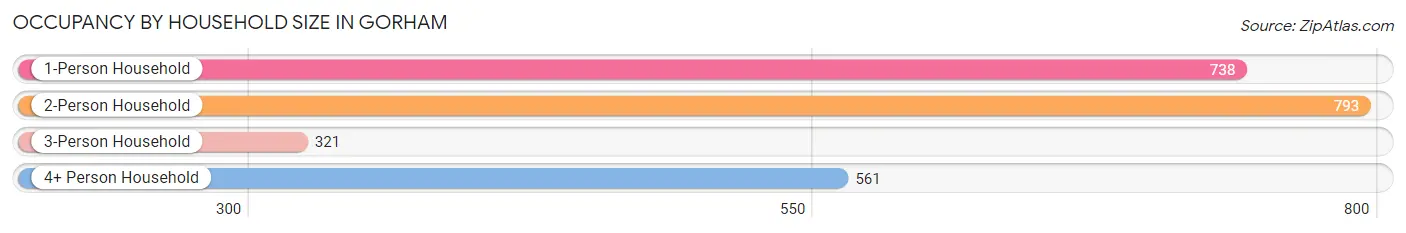
| Household Size | # Housing Units | % Housing Units |
| 1-Person Household | 738 | 30.6% |
| 2-Person Household | 793 | 32.9% |
| 3-Person Household | 321 | 13.3% |
| 4+ Person Household | 561 | 23.3% |
| Total Housing Units | 2,413 | 100.0% |
Occupancy by Ownership by Household Size in Gorham
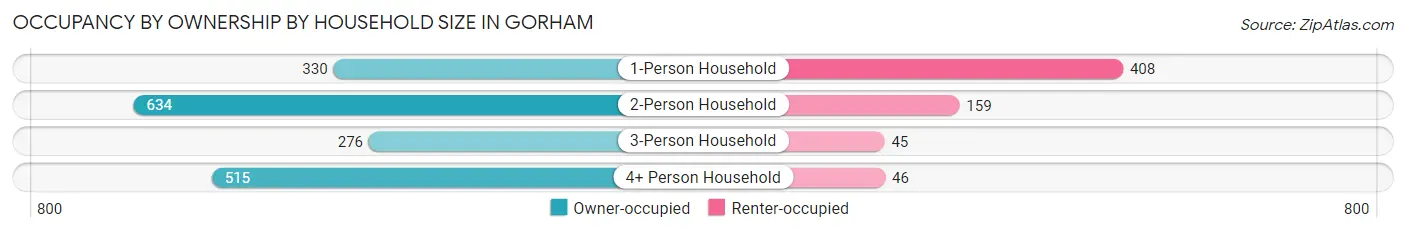
| Household Size | Owner-occupied | Renter-occupied |
| 1-Person Household | 330 (44.7%) | 408 (55.3%) |
| 2-Person Household | 634 (79.9%) | 159 (20.1%) |
| 3-Person Household | 276 (86.0%) | 45 (14.0%) |
| 4+ Person Household | 515 (91.8%) | 46 (8.2%) |
| Total Housing Units | 1,755 (72.7%) | 658 (27.3%) |
Occupancy by Educational Attainment in Gorham
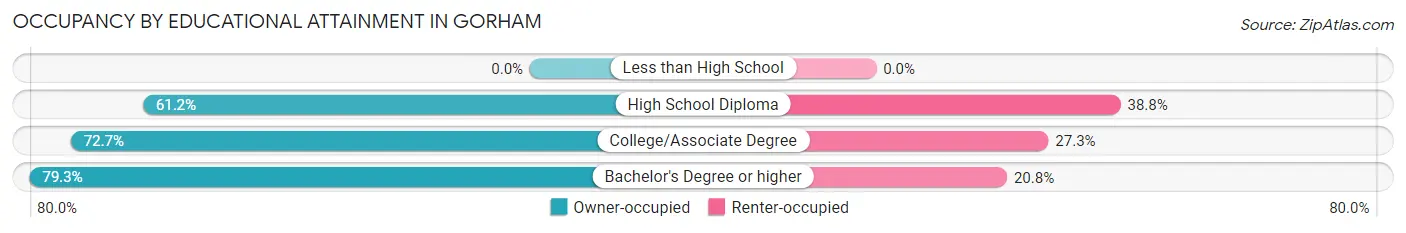
| Household Size | Owner-occupied | Renter-occupied |
| Less than High School | 0 (0.0%) | 0 (0.0%) |
| High School Diploma | 395 (61.2%) | 250 (38.8%) |
| College/Associate Degree | 455 (72.7%) | 171 (27.3%) |
| Bachelor's Degree or higher | 905 (79.2%) | 237 (20.7%) |
Occupancy by Age of Householder in Gorham
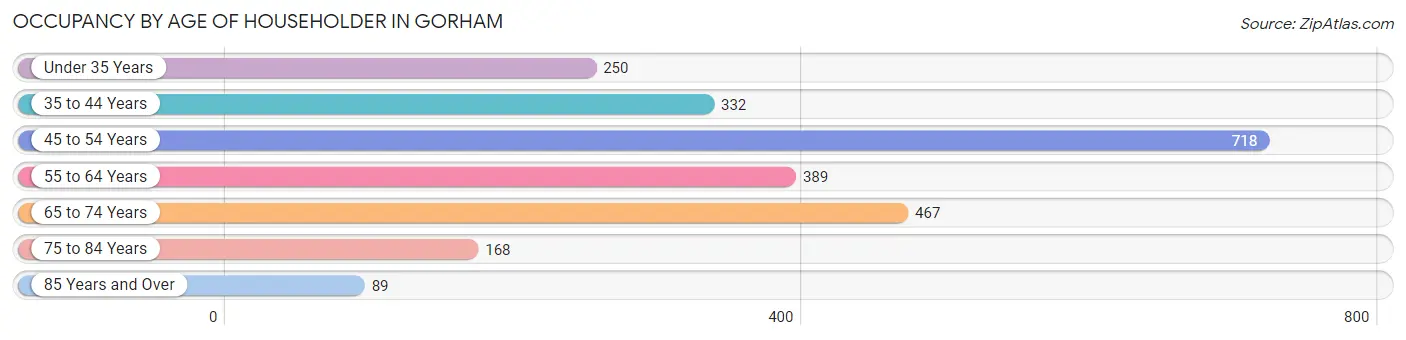
| Age Bracket | # Households | % Households |
| Under 35 Years | 250 | 10.4% |
| 35 to 44 Years | 332 | 13.8% |
| 45 to 54 Years | 718 | 29.8% |
| 55 to 64 Years | 389 | 16.1% |
| 65 to 74 Years | 467 | 19.4% |
| 75 to 84 Years | 168 | 7.0% |
| 85 Years and Over | 89 | 3.7% |
| Total | 2,413 | 100.0% |
Housing Finances in Gorham
Median Income by Occupancy in Gorham
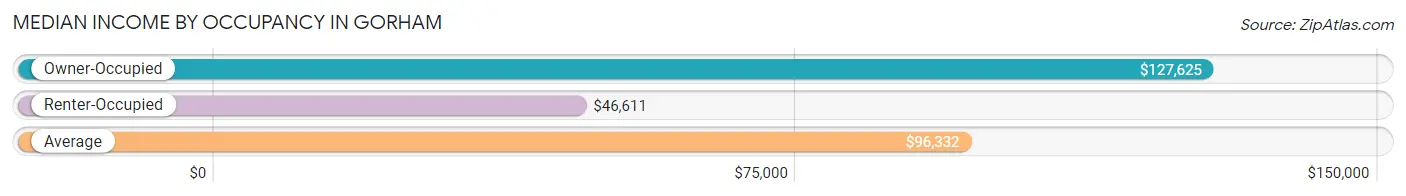
| Occupancy Type | # Households | Median Income |
| Owner-Occupied | 1,755 (72.7%) | $127,625 |
| Renter-Occupied | 658 (27.3%) | $46,611 |
| Average | 2,413 (100.0%) | $96,332 |
Occupancy by Householder Income Bracket in Gorham
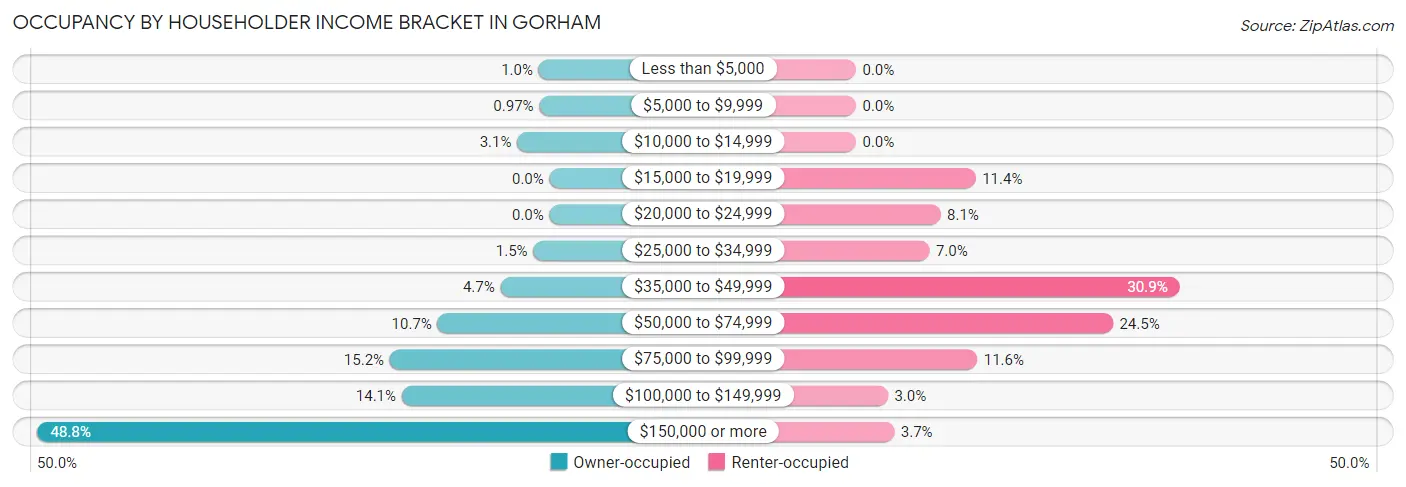
| Income Bracket | Owner-occupied | Renter-occupied |
| Less than $5,000 | 18 (1.0%) | 0 (0.0%) |
| $5,000 to $9,999 | 17 (1.0%) | 0 (0.0%) |
| $10,000 to $14,999 | 54 (3.1%) | 0 (0.0%) |
| $15,000 to $19,999 | 0 (0.0%) | 75 (11.4%) |
| $20,000 to $24,999 | 0 (0.0%) | 53 (8.1%) |
| $25,000 to $34,999 | 27 (1.5%) | 46 (7.0%) |
| $35,000 to $49,999 | 82 (4.7%) | 203 (30.8%) |
| $50,000 to $74,999 | 187 (10.7%) | 161 (24.5%) |
| $75,000 to $99,999 | 267 (15.2%) | 76 (11.6%) |
| $100,000 to $149,999 | 247 (14.1%) | 20 (3.0%) |
| $150,000 or more | 856 (48.8%) | 24 (3.6%) |
| Total | 1,755 (100.0%) | 658 (100.0%) |
Monthly Housing Cost Tiers in Gorham
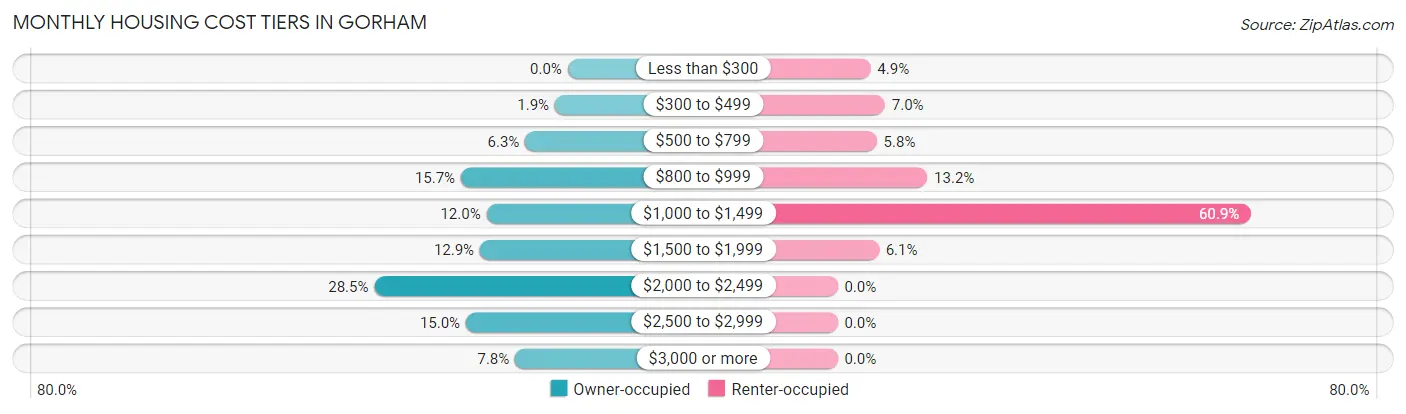
| Monthly Cost | Owner-occupied | Renter-occupied |
| Less than $300 | 0 (0.0%) | 32 (4.9%) |
| $300 to $499 | 33 (1.9%) | 46 (7.0%) |
| $500 to $799 | 110 (6.3%) | 38 (5.8%) |
| $800 to $999 | 276 (15.7%) | 87 (13.2%) |
| $1,000 to $1,499 | 210 (12.0%) | 401 (60.9%) |
| $1,500 to $1,999 | 227 (12.9%) | 40 (6.1%) |
| $2,000 to $2,499 | 500 (28.5%) | 0 (0.0%) |
| $2,500 to $2,999 | 263 (15.0%) | 0 (0.0%) |
| $3,000 or more | 136 (7.7%) | 0 (0.0%) |
| Total | 1,755 (100.0%) | 658 (100.0%) |
Physical Housing Characteristics in Gorham
Housing Structures in Gorham
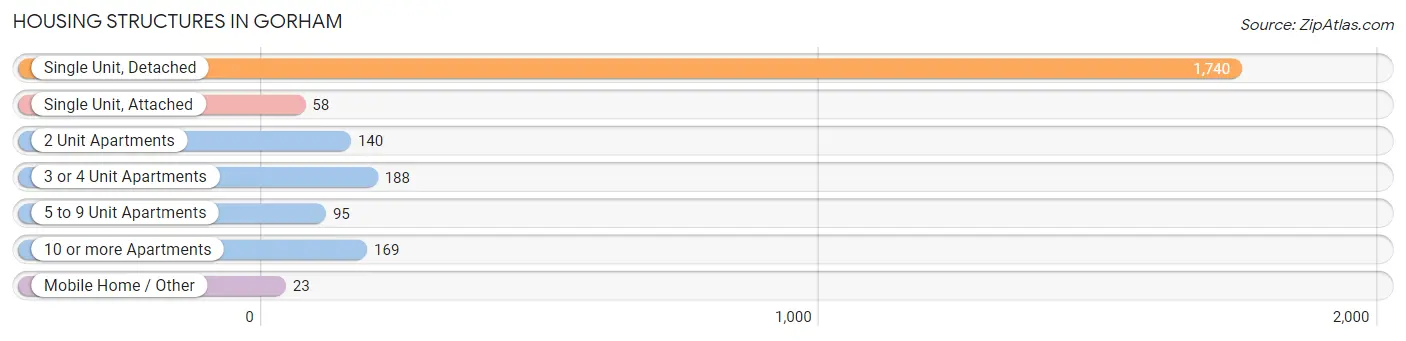
| Structure Type | # Housing Units | % Housing Units |
| Single Unit, Detached | 1,740 | 72.1% |
| Single Unit, Attached | 58 | 2.4% |
| 2 Unit Apartments | 140 | 5.8% |
| 3 or 4 Unit Apartments | 188 | 7.8% |
| 5 to 9 Unit Apartments | 95 | 3.9% |
| 10 or more Apartments | 169 | 7.0% |
| Mobile Home / Other | 23 | 0.9% |
| Total | 2,413 | 100.0% |
Housing Structures by Occupancy in Gorham
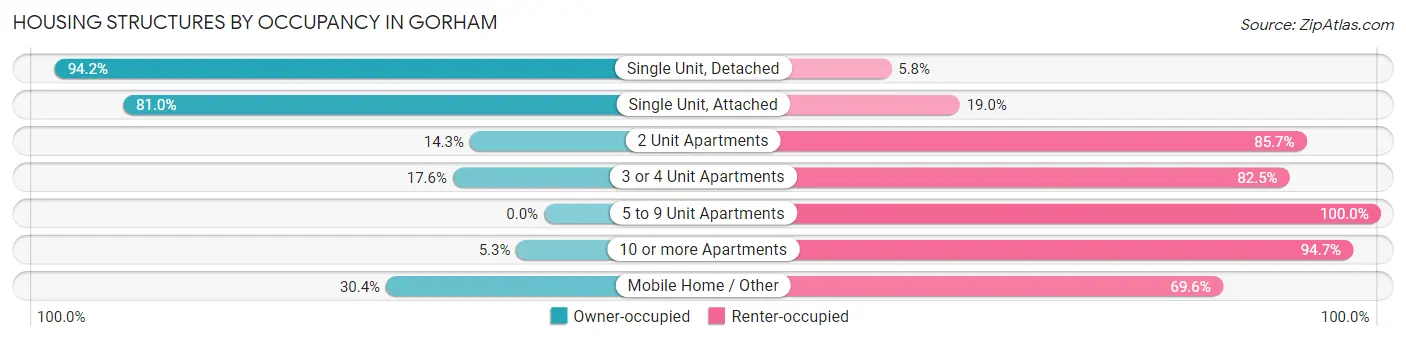
| Structure Type | Owner-occupied | Renter-occupied |
| Single Unit, Detached | 1,639 (94.2%) | 101 (5.8%) |
| Single Unit, Attached | 47 (81.0%) | 11 (19.0%) |
| 2 Unit Apartments | 20 (14.3%) | 120 (85.7%) |
| 3 or 4 Unit Apartments | 33 (17.5%) | 155 (82.5%) |
| 5 to 9 Unit Apartments | 0 (0.0%) | 95 (100.0%) |
| 10 or more Apartments | 9 (5.3%) | 160 (94.7%) |
| Mobile Home / Other | 7 (30.4%) | 16 (69.6%) |
| Total | 1,755 (72.7%) | 658 (27.3%) |
Housing Structures by Number of Rooms in Gorham
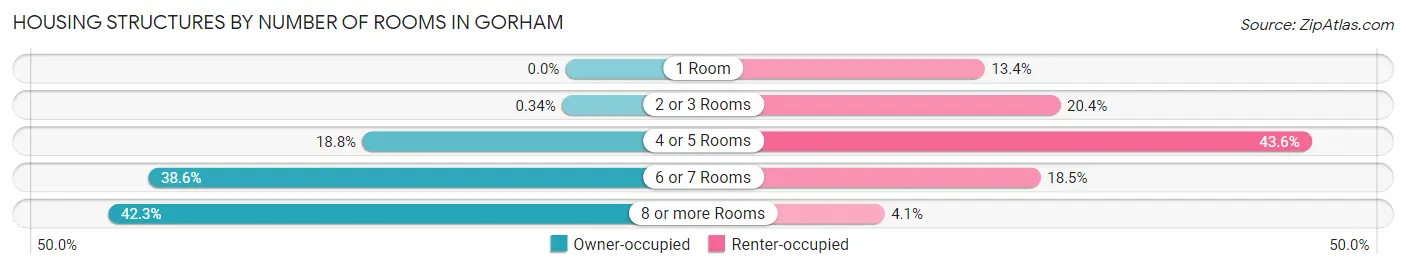
| Number of Rooms | Owner-occupied | Renter-occupied |
| 1 Room | 0 (0.0%) | 88 (13.4%) |
| 2 or 3 Rooms | 6 (0.3%) | 134 (20.4%) |
| 4 or 5 Rooms | 330 (18.8%) | 287 (43.6%) |
| 6 or 7 Rooms | 677 (38.6%) | 122 (18.5%) |
| 8 or more Rooms | 742 (42.3%) | 27 (4.1%) |
| Total | 1,755 (100.0%) | 658 (100.0%) |
Housing Structure by Heating Type in Gorham
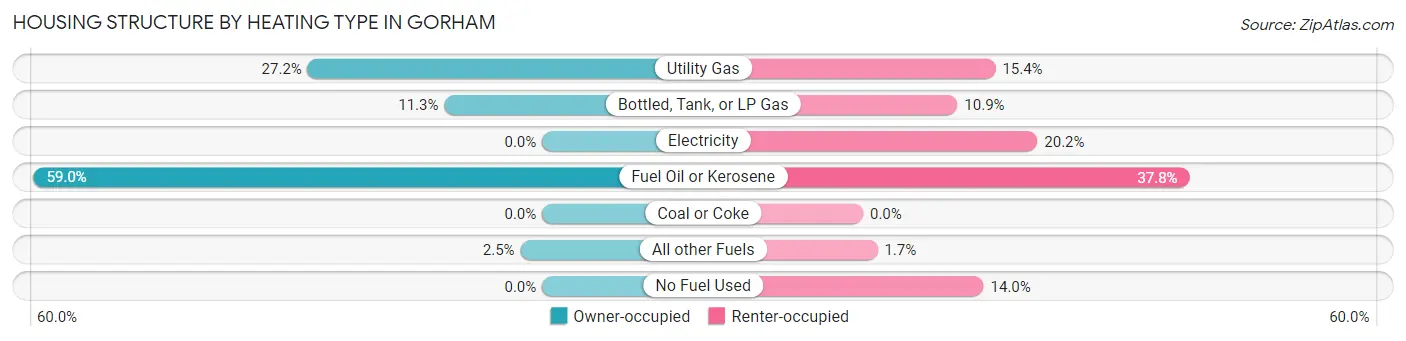
| Heating Type | Owner-occupied | Renter-occupied |
| Utility Gas | 477 (27.2%) | 101 (15.3%) |
| Bottled, Tank, or LP Gas | 199 (11.3%) | 72 (10.9%) |
| Electricity | 0 (0.0%) | 133 (20.2%) |
| Fuel Oil or Kerosene | 1,035 (59.0%) | 249 (37.8%) |
| Coal or Coke | 0 (0.0%) | 0 (0.0%) |
| All other Fuels | 44 (2.5%) | 11 (1.7%) |
| No Fuel Used | 0 (0.0%) | 92 (14.0%) |
| Total | 1,755 (100.0%) | 658 (100.0%) |
Household Vehicle Usage in Gorham
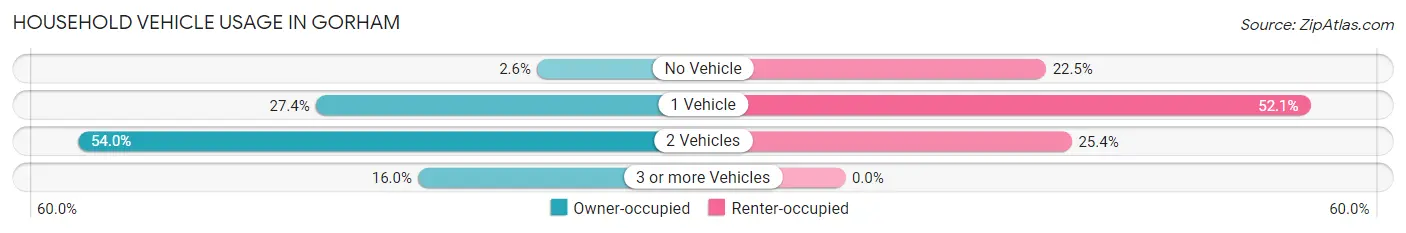
| Vehicles per Household | Owner-occupied | Renter-occupied |
| No Vehicle | 46 (2.6%) | 148 (22.5%) |
| 1 Vehicle | 481 (27.4%) | 343 (52.1%) |
| 2 Vehicles | 948 (54.0%) | 167 (25.4%) |
| 3 or more Vehicles | 280 (16.0%) | 0 (0.0%) |
| Total | 1,755 (100.0%) | 658 (100.0%) |
Real Estate & Mortgages in Gorham
Real Estate and Mortgage Overview in Gorham
| Characteristic | Without Mortgage | With Mortgage |
| Housing Units | 457 | 1,298 |
| Median Property Value | $440,600 | $415,500 |
| Median Household Income | $104,526 | $675 |
| Monthly Housing Costs | $904 | $136 |
| Real Estate Taxes | $5,648 | $12 |
Property Value by Mortgage Status in Gorham
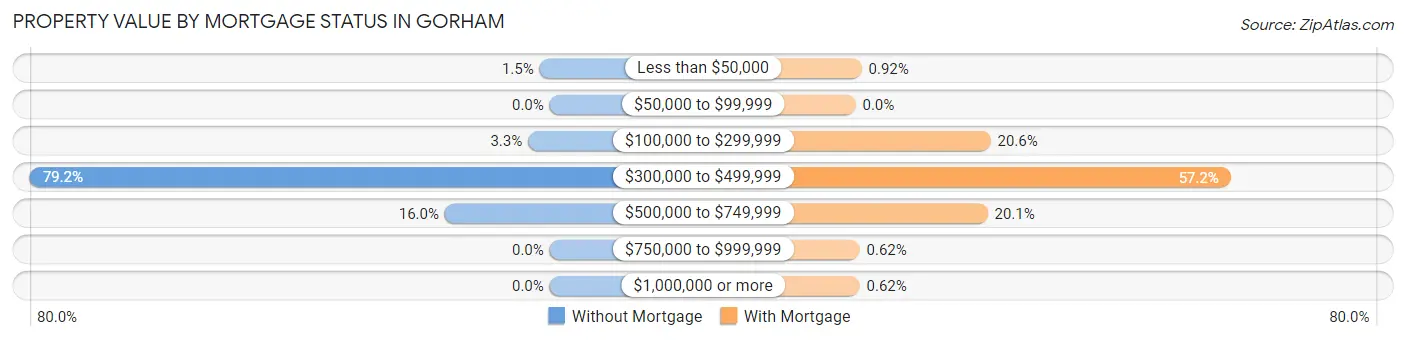
| Property Value | Without Mortgage | With Mortgage |
| Less than $50,000 | 7 (1.5%) | 12 (0.9%) |
| $50,000 to $99,999 | 0 (0.0%) | 0 (0.0%) |
| $100,000 to $299,999 | 15 (3.3%) | 267 (20.6%) |
| $300,000 to $499,999 | 362 (79.2%) | 742 (57.2%) |
| $500,000 to $749,999 | 73 (16.0%) | 261 (20.1%) |
| $750,000 to $999,999 | 0 (0.0%) | 8 (0.6%) |
| $1,000,000 or more | 0 (0.0%) | 8 (0.6%) |
| Total | 457 (100.0%) | 1,298 (100.0%) |
Household Income by Mortgage Status in Gorham
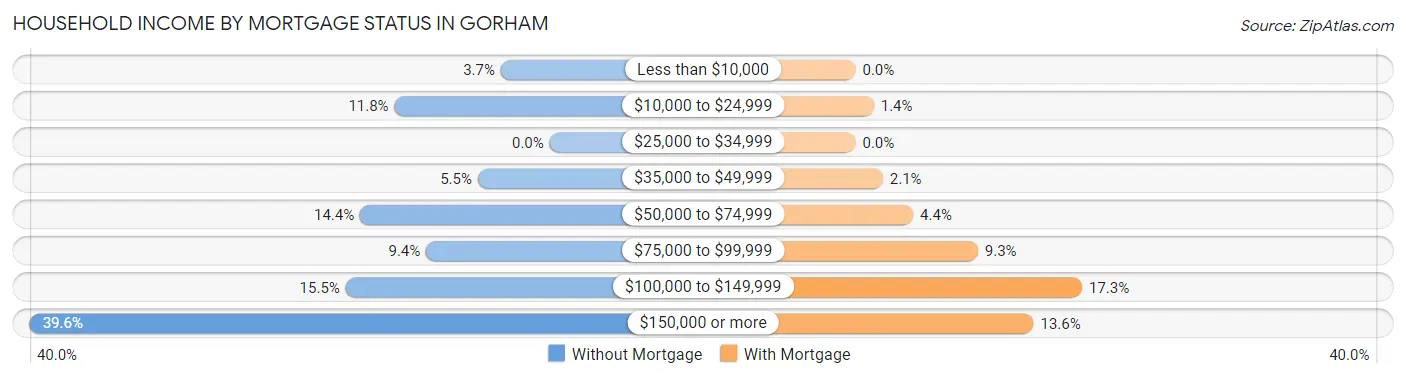
| Household Income | Without Mortgage | With Mortgage |
| Less than $10,000 | 17 (3.7%) | 0 (0.0%) |
| $10,000 to $24,999 | 54 (11.8%) | 18 (1.4%) |
| $25,000 to $34,999 | 0 (0.0%) | 0 (0.0%) |
| $35,000 to $49,999 | 25 (5.5%) | 27 (2.1%) |
| $50,000 to $74,999 | 66 (14.4%) | 57 (4.4%) |
| $75,000 to $99,999 | 43 (9.4%) | 121 (9.3%) |
| $100,000 to $149,999 | 71 (15.5%) | 224 (17.3%) |
| $150,000 or more | 181 (39.6%) | 176 (13.6%) |
| Total | 457 (100.0%) | 1,298 (100.0%) |
Property Value to Household Income Ratio in Gorham
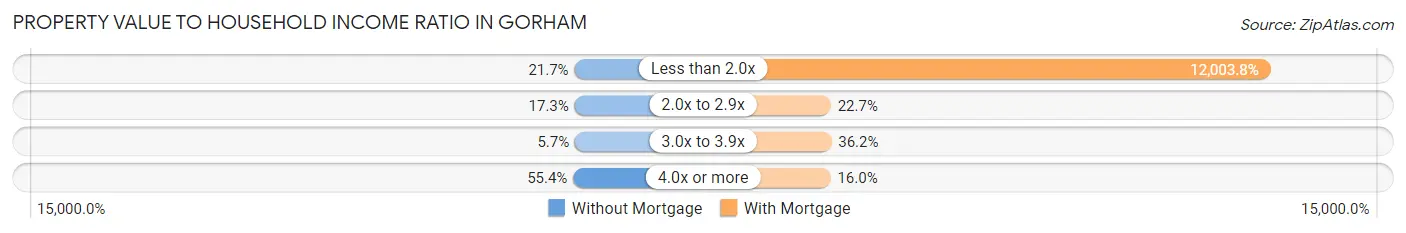
| Value-to-Income Ratio | Without Mortgage | With Mortgage |
| Less than 2.0x | 99 (21.7%) | 155,809 (12,003.8%) |
| 2.0x to 2.9x | 79 (17.3%) | 295 (22.7%) |
| 3.0x to 3.9x | 26 (5.7%) | 470 (36.2%) |
| 4.0x or more | 253 (55.4%) | 207 (16.0%) |
| Total | 457 (100.0%) | 1,298 (100.0%) |
Real Estate Taxes by Mortgage Status in Gorham
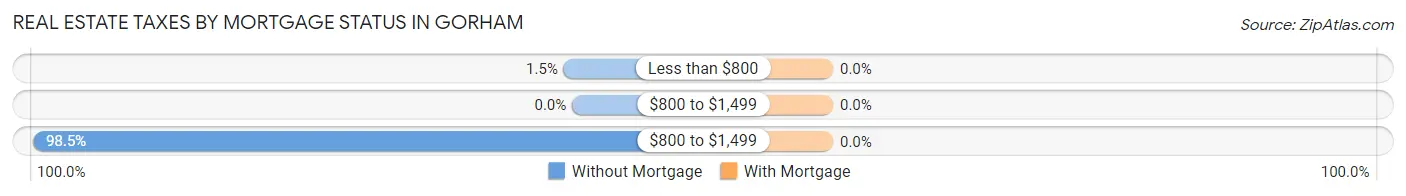
| Property Taxes | Without Mortgage | With Mortgage |
| Less than $800 | 7 (1.5%) | 0 (0.0%) |
| $800 to $1,499 | 0 (0.0%) | 0 (0.0%) |
| $800 to $1,499 | 450 (98.5%) | 0 (0.0%) |
| Total | 457 (100.0%) | 1,298 (100.0%) |
Health & Disability in Gorham
Health Insurance Coverage by Age in Gorham
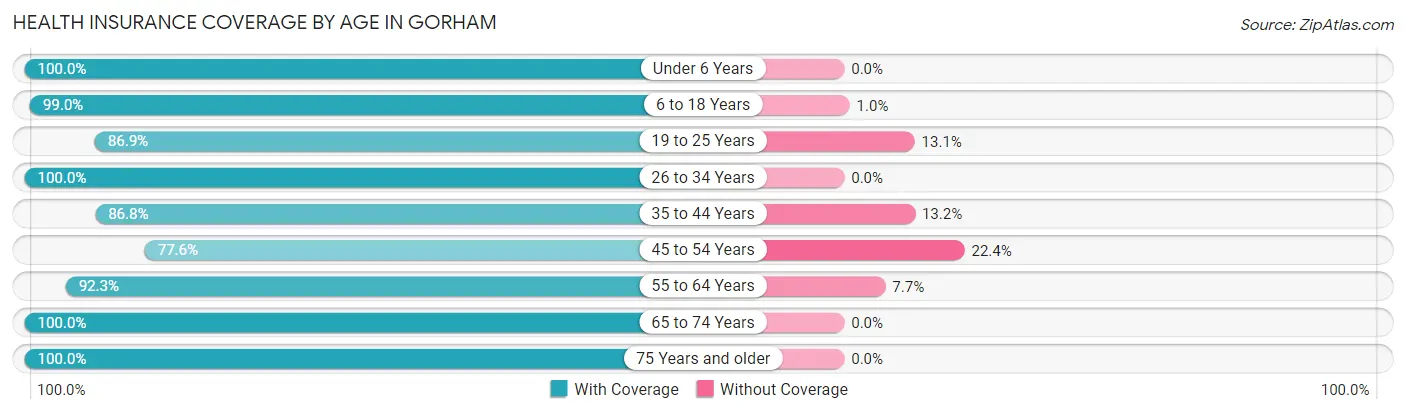
| Age Bracket | With Coverage | Without Coverage |
| Under 6 Years | 181 (100.0%) | 0 (0.0%) |
| 6 to 18 Years | 986 (99.0%) | 10 (1.0%) |
| 19 to 25 Years | 1,351 (86.9%) | 204 (13.1%) |
| 26 to 34 Years | 596 (100.0%) | 0 (0.0%) |
| 35 to 44 Years | 573 (86.8%) | 87 (13.2%) |
| 45 to 54 Years | 782 (77.6%) | 226 (22.4%) |
| 55 to 64 Years | 783 (92.3%) | 65 (7.7%) |
| 65 to 74 Years | 681 (100.0%) | 0 (0.0%) |
| 75 Years and older | 384 (100.0%) | 0 (0.0%) |
| Total | 6,317 (91.4%) | 592 (8.6%) |
Health Insurance Coverage by Citizenship Status in Gorham
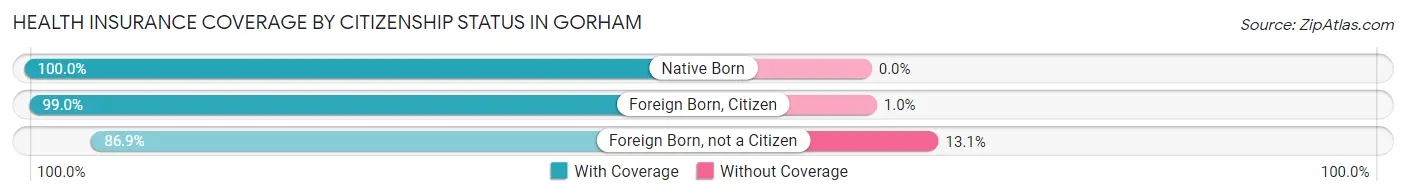
| Citizenship Status | With Coverage | Without Coverage |
| Native Born | 181 (100.0%) | 0 (0.0%) |
| Foreign Born, Citizen | 986 (99.0%) | 10 (1.0%) |
| Foreign Born, not a Citizen | 1,351 (86.9%) | 204 (13.1%) |
Health Insurance Coverage by Household Income in Gorham
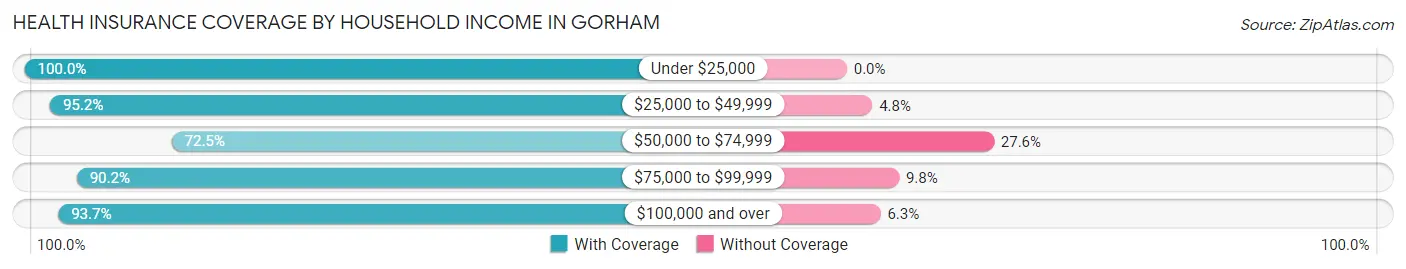
| Household Income | With Coverage | Without Coverage |
| Under $25,000 | 265 (100.0%) | 0 (0.0%) |
| $25,000 to $49,999 | 480 (95.2%) | 24 (4.8%) |
| $50,000 to $74,999 | 668 (72.5%) | 254 (27.6%) |
| $75,000 to $99,999 | 554 (90.2%) | 60 (9.8%) |
| $100,000 and over | 3,042 (93.7%) | 205 (6.3%) |
Public vs Private Health Insurance Coverage by Age in Gorham
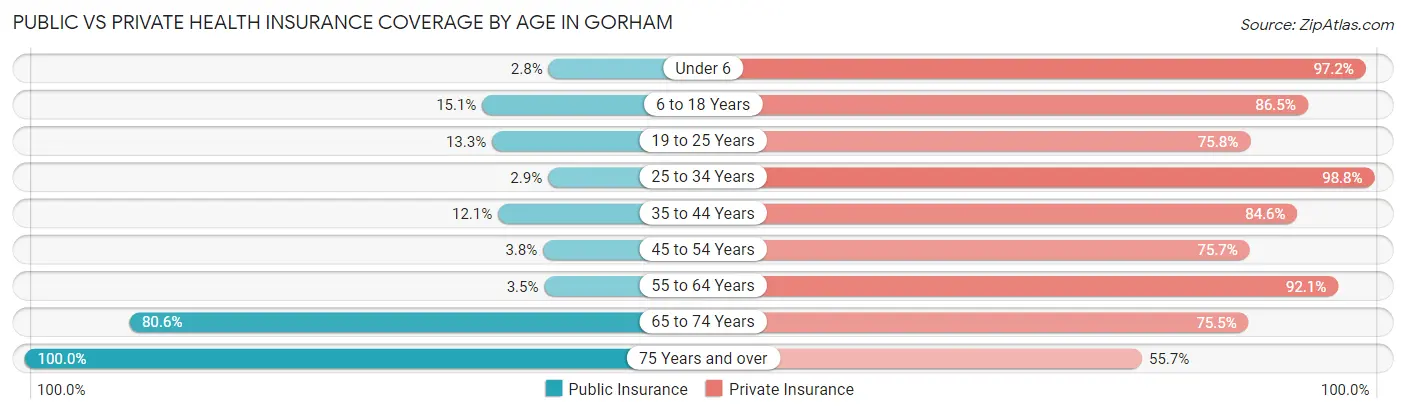
| Age Bracket | Public Insurance | Private Insurance |
| Under 6 | 5 (2.8%) | 176 (97.2%) |
| 6 to 18 Years | 150 (15.1%) | 861 (86.5%) |
| 19 to 25 Years | 206 (13.3%) | 1,178 (75.8%) |
| 25 to 34 Years | 17 (2.9%) | 589 (98.8%) |
| 35 to 44 Years | 80 (12.1%) | 558 (84.6%) |
| 45 to 54 Years | 38 (3.8%) | 763 (75.7%) |
| 55 to 64 Years | 30 (3.5%) | 781 (92.1%) |
| 65 to 74 Years | 549 (80.6%) | 514 (75.5%) |
| 75 Years and over | 384 (100.0%) | 214 (55.7%) |
| Total | 1,459 (21.1%) | 5,634 (81.6%) |
Disability Status by Sex by Age in Gorham
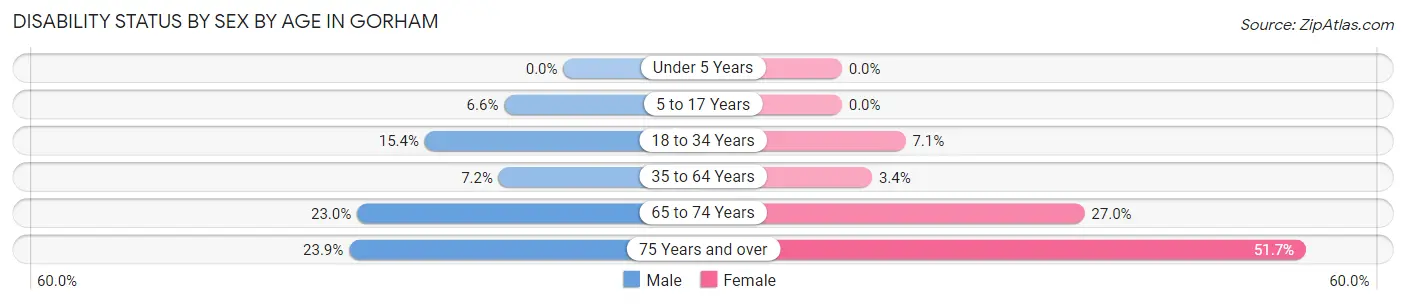
| Age Bracket | Male | Female |
| Under 5 Years | 0 (0.0%) | 0 (0.0%) |
| 5 to 17 Years | 16 (6.6%) | 0 (0.0%) |
| 18 to 34 Years | 171 (15.4%) | 95 (7.1%) |
| 35 to 64 Years | 89 (7.2%) | 43 (3.4%) |
| 65 to 74 Years | 57 (23.0%) | 117 (27.0%) |
| 75 Years and over | 21 (23.9%) | 153 (51.7%) |
Disability Class by Sex by Age in Gorham
Disability Class: Hearing Difficulty
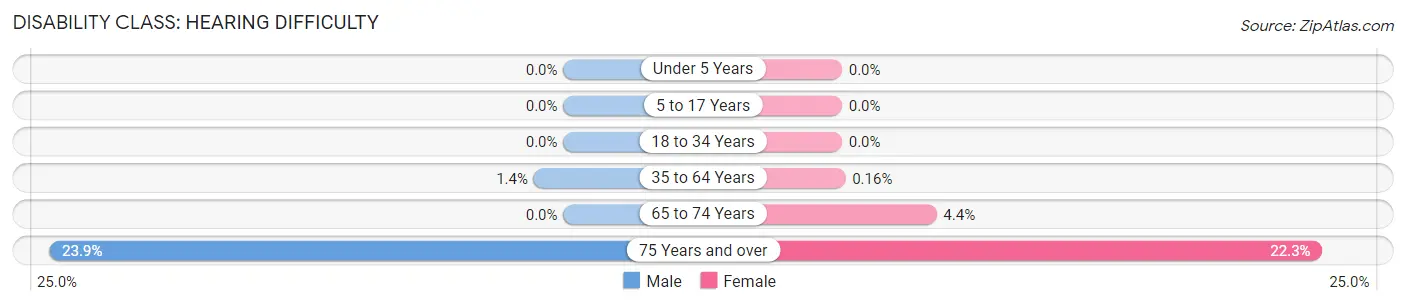
| Age Bracket | Male | Female |
| Under 5 Years | 0 (0.0%) | 0 (0.0%) |
| 5 to 17 Years | 0 (0.0%) | 0 (0.0%) |
| 18 to 34 Years | 0 (0.0%) | 0 (0.0%) |
| 35 to 64 Years | 17 (1.4%) | 2 (0.2%) |
| 65 to 74 Years | 0 (0.0%) | 19 (4.4%) |
| 75 Years and over | 21 (23.9%) | 66 (22.3%) |
Disability Class: Vision Difficulty
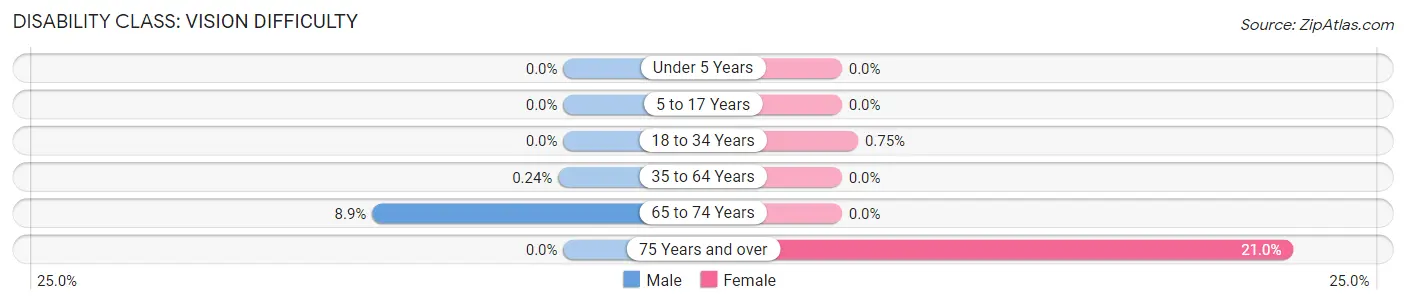
| Age Bracket | Male | Female |
| Under 5 Years | 0 (0.0%) | 0 (0.0%) |
| 5 to 17 Years | 0 (0.0%) | 0 (0.0%) |
| 18 to 34 Years | 0 (0.0%) | 10 (0.7%) |
| 35 to 64 Years | 3 (0.2%) | 0 (0.0%) |
| 65 to 74 Years | 22 (8.9%) | 0 (0.0%) |
| 75 Years and over | 0 (0.0%) | 62 (20.9%) |
Disability Class: Cognitive Difficulty
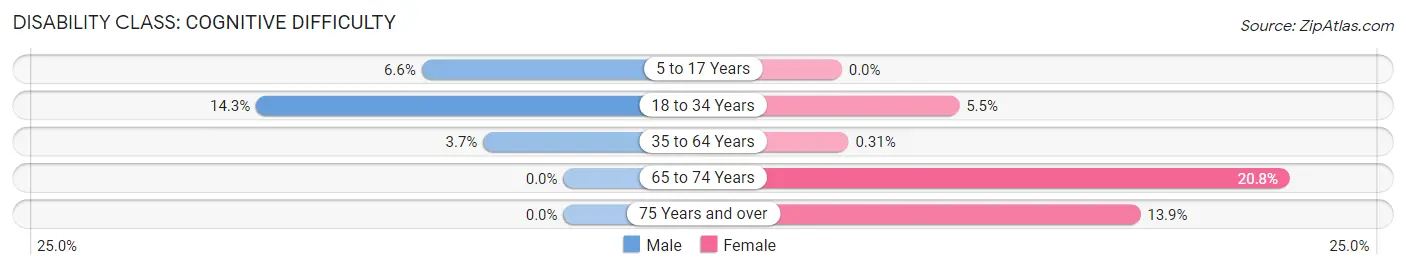
| Age Bracket | Male | Female |
| 5 to 17 Years | 16 (6.6%) | 0 (0.0%) |
| 18 to 34 Years | 158 (14.3%) | 73 (5.4%) |
| 35 to 64 Years | 46 (3.7%) | 4 (0.3%) |
| 65 to 74 Years | 0 (0.0%) | 90 (20.8%) |
| 75 Years and over | 0 (0.0%) | 41 (13.9%) |
Disability Class: Ambulatory Difficulty
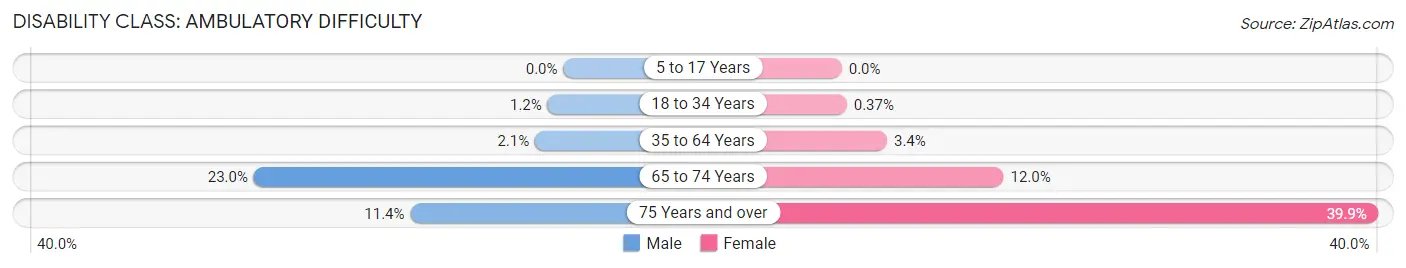
| Age Bracket | Male | Female |
| 5 to 17 Years | 0 (0.0%) | 0 (0.0%) |
| 18 to 34 Years | 13 (1.2%) | 5 (0.4%) |
| 35 to 64 Years | 26 (2.1%) | 43 (3.4%) |
| 65 to 74 Years | 57 (23.0%) | 52 (12.0%) |
| 75 Years and over | 10 (11.4%) | 118 (39.9%) |
Disability Class: Self-Care Difficulty
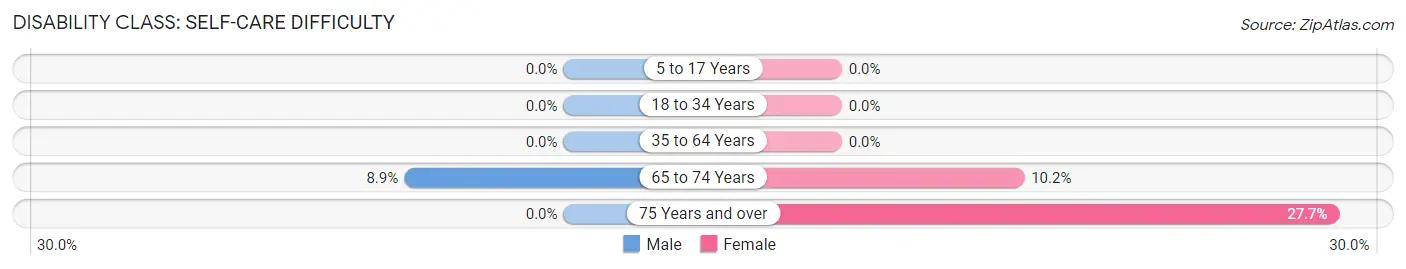
| Age Bracket | Male | Female |
| 5 to 17 Years | 0 (0.0%) | 0 (0.0%) |
| 18 to 34 Years | 0 (0.0%) | 0 (0.0%) |
| 35 to 64 Years | 0 (0.0%) | 0 (0.0%) |
| 65 to 74 Years | 22 (8.9%) | 44 (10.2%) |
| 75 Years and over | 0 (0.0%) | 82 (27.7%) |
Technology Access in Gorham
Computing Device Access in Gorham
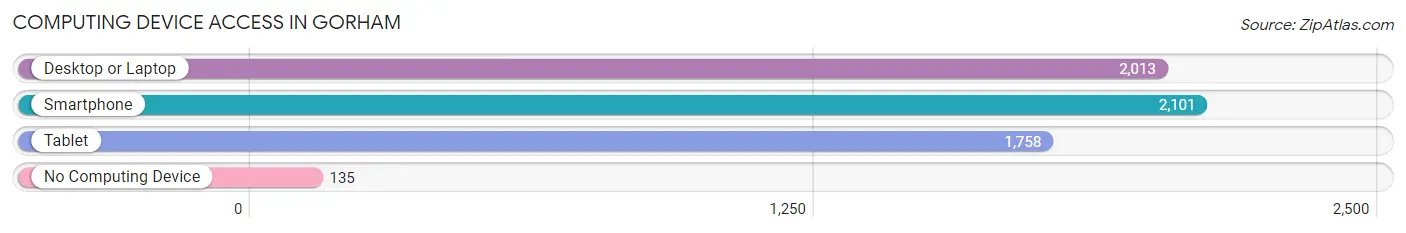
| Device Type | # Households | % Households |
| Desktop or Laptop | 2,013 | 83.4% |
| Smartphone | 2,101 | 87.1% |
| Tablet | 1,758 | 72.9% |
| No Computing Device | 135 | 5.6% |
| Total | 2,413 | 100.0% |
Internet Access in Gorham
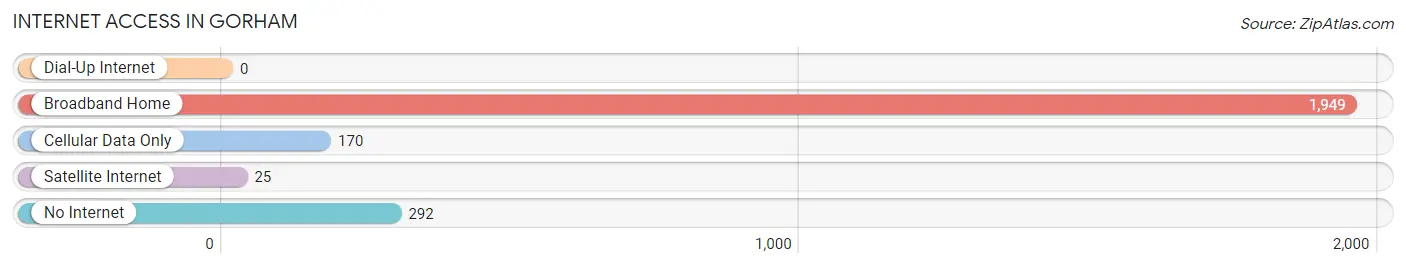
| Internet Type | # Households | % Households |
| Dial-Up Internet | 0 | 0.0% |
| Broadband Home | 1,949 | 80.8% |
| Cellular Data Only | 170 | 7.0% |
| Satellite Internet | 25 | 1.0% |
| No Internet | 292 | 12.1% |
| Total | 2,413 | 100.0% |
Gorham Summary
Gorham, Maine is a town located in Cumberland County, Maine, United States. The town is situated on the western edge of the state, just south of Portland. As of the 2010 census, the town had a population of 16,381.
History
Gorham was first settled in 1736 by John Gorham and his family. The town was incorporated in 1764 and named after John Gorham. The town was originally part of the town of Scarborough, but was set off and incorporated in 1764.
Gorham was an important center of industry in the 19th century. The town was home to several mills, including a sawmill, gristmill, and a paper mill. The town was also home to a number of shoe factories, which produced shoes for the Union Army during the Civil War.
Geography
Gorham is located in western Maine, just south of Portland. The town is situated on the Presumpscot River, which flows through the town. The town is bordered by the towns of Scarborough to the east, Windham to the north, and Standish to the south.
Gorham is located in a hilly region of Maine, with elevations ranging from sea level to over 500 feet. The town is located in a temperate climate, with average temperatures ranging from the low 30s in the winter to the mid-70s in the summer.
Economy
Gorham is a largely residential community, with a small but vibrant business community. The town is home to a number of small businesses, including restaurants, retail stores, and professional services. The town is also home to a number of manufacturing companies, including a paper mill and a shoe factory.
Gorham is also home to the University of Southern Maine, which is located in the town. The university is the largest employer in the town, with over 2,000 employees.
Demographics
As of the 2010 census, the town had a population of 16,381. The racial makeup of the town was 94.3% White, 1.3% African American, 0.7% Native American, 1.2% Asian, 0.1% Pacific Islander, 0.7% from other races, and 1.9% from two or more races. Hispanic or Latino of any race were 2.2% of the population.
The median income for a household in the town was $50,945, and the median income for a family was $63,945. The per capita income for the town was $25,945. About 5.3% of families and 8.2% of the population were below the poverty line, including 10.2% of those under age 18 and 5.2% of those age 65 or over.
Common Questions
What is Per Capita Income in Gorham?
Per Capita income in Gorham is $46,521.
What is the Median Family Income in Gorham?
Median Family Income in Gorham is $157,132.
What is the Median Household income in Gorham?
Median Household Income in Gorham is $96,332.
What is Income or Wage Gap in Gorham?
Income or Wage Gap in Gorham is 52.7%.
Women in Gorham earn 47.3 cents for every dollar earned by a man.
What is Inequality or Gini Index in Gorham?
Inequality or Gini Index in Gorham is 0.40.
What is the Total Population of Gorham?
Total Population of Gorham is 7,050.
What is the Total Male Population of Gorham?
Total Male Population of Gorham is 3,064.
What is the Total Female Population of Gorham?
Total Female Population of Gorham is 3,986.
What is the Ratio of Males per 100 Females in Gorham?
There are 76.87 Males per 100 Females in Gorham.
What is the Ratio of Females per 100 Males in Gorham?
There are 130.09 Females per 100 Males in Gorham.
What is the Median Population Age in Gorham?
Median Population Age in Gorham is 38.0 Years.
What is the Average Family Size in Gorham
Average Family Size in Gorham is 2.9 People.
What is the Average Household Size in Gorham
Average Household Size in Gorham is 2.3 People.
How Large is the Labor Force in Gorham?
There are 4,355 People in the Labor Forcein in Gorham.
What is the Percentage of People in the Labor Force in Gorham?
69.8% of People are in the Labor Force in Gorham.
What is the Unemployment Rate in Gorham?
Unemployment Rate in Gorham is 4.1%.