Winter Harbor, ME Map & Demographics
Winter Harbor Map
Winter Harbor Overview
$42,992
PER CAPITA INCOME
$93,500
AVG FAMILY INCOME
$57,917
AVG HOUSEHOLD INCOME
0.40
INEQUALITY / GINI INDEX
315
TOTAL POPULATION
127
MALE POPULATION
188
FEMALE POPULATION
67.55
MALES / 100 FEMALES
148.03
FEMALES / 100 MALES
68.0
MEDIAN AGE
2.8
AVG FAMILY SIZE
1.8
AVG HOUSEHOLD SIZE
76
LABOR FORCE [ PEOPLE ]
25.8%
PERCENT IN LABOR FORCE
Winter Harbor Zip Codes
Winter Harbor Area Codes
Income in Winter Harbor
Income Overview in Winter Harbor
Per Capita Income in Winter Harbor is $42,992, while median incomes of families and households are $93,500 and $57,917 respectively.
| Characteristic | Number | Measure |
| Per Capita Income | 315 | $42,992 |
| Median Family Income | 76 | $93,500 |
| Mean Family Income | 76 | $114,272 |
| Median Household Income | 173 | $57,917 |
| Mean Household Income | 173 | $78,781 |
| Income Deficit | 76 | $0 |
| Wage / Income Gap (%) | 315 | 0.00% |
| Wage / Income Gap ($) | 315 | 100.00¢ per $1 |
| Gini / Inequality Index | 315 | 0.40 |
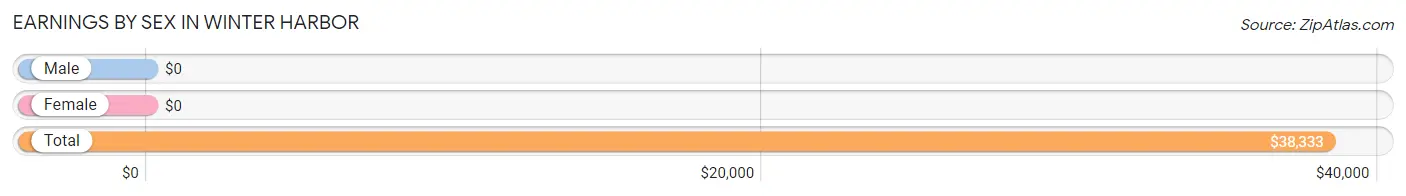
Earnings by Sex in Winter Harbor
| Sex | Number | Average Earnings |
| Male | 42 (38.2%) | $0 |
| Female | 68 (61.8%) | $0 |
| Total | 110 (100.0%) | $38,333 |
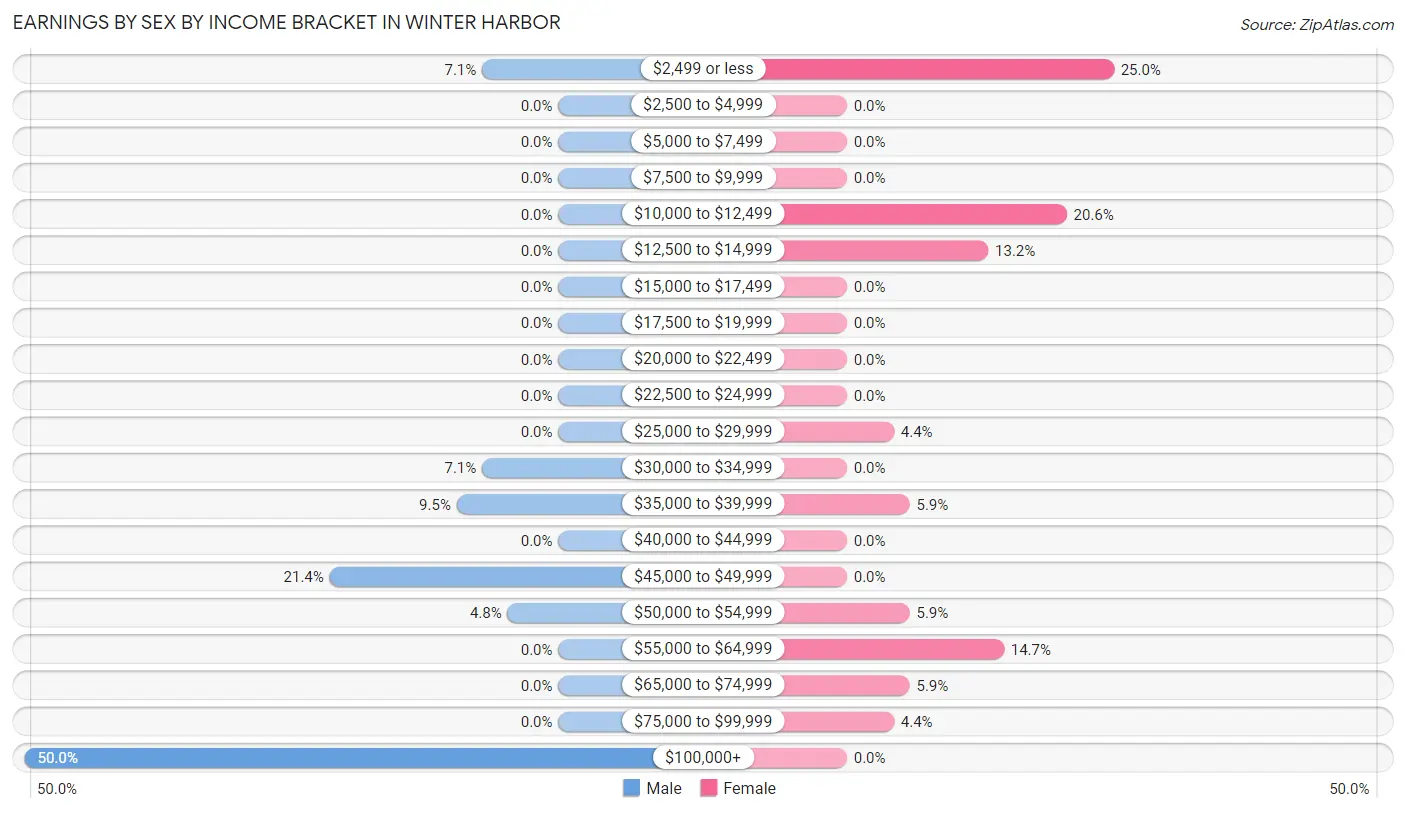
Earnings by Sex by Income Bracket in Winter Harbor
The most common earnings brackets in Winter Harbor are $100,000+ for men (21 | 50.0%) and $2,499 or less for women (17 | 25.0%).
| Income | Male | Female |
| $2,499 or less | 3 (7.1%) | 17 (25.0%) |
| $2,500 to $4,999 | 0 (0.0%) | 0 (0.0%) |
| $5,000 to $7,499 | 0 (0.0%) | 0 (0.0%) |
| $7,500 to $9,999 | 0 (0.0%) | 0 (0.0%) |
| $10,000 to $12,499 | 0 (0.0%) | 14 (20.6%) |
| $12,500 to $14,999 | 0 (0.0%) | 9 (13.2%) |
| $15,000 to $17,499 | 0 (0.0%) | 0 (0.0%) |
| $17,500 to $19,999 | 0 (0.0%) | 0 (0.0%) |
| $20,000 to $22,499 | 0 (0.0%) | 0 (0.0%) |
| $22,500 to $24,999 | 0 (0.0%) | 0 (0.0%) |
| $25,000 to $29,999 | 0 (0.0%) | 3 (4.4%) |
| $30,000 to $34,999 | 3 (7.1%) | 0 (0.0%) |
| $35,000 to $39,999 | 4 (9.5%) | 4 (5.9%) |
| $40,000 to $44,999 | 0 (0.0%) | 0 (0.0%) |
| $45,000 to $49,999 | 9 (21.4%) | 0 (0.0%) |
| $50,000 to $54,999 | 2 (4.8%) | 4 (5.9%) |
| $55,000 to $64,999 | 0 (0.0%) | 10 (14.7%) |
| $65,000 to $74,999 | 0 (0.0%) | 4 (5.9%) |
| $75,000 to $99,999 | 0 (0.0%) | 3 (4.4%) |
| $100,000+ | 21 (50.0%) | 0 (0.0%) |
| Total | 42 (100.0%) | 68 (100.0%) |
Earnings by Sex by Educational Attainment in Winter Harbor
| Educational Attainment | Male Income | Female Income |
| Less than High School | - | - |
| High School Diploma | - | - |
| College or Associate's Degree | - | - |
| Bachelor's Degree | - | - |
| Graduate Degree | - | - |
| Total | - | - |
Family Income in Winter Harbor
Family Income Brackets in Winter Harbor
According to the Winter Harbor family income data, there are 24 families falling into the $50,000 to $74,999 income range, which is the most common income bracket and makes up 31.6% of all families.
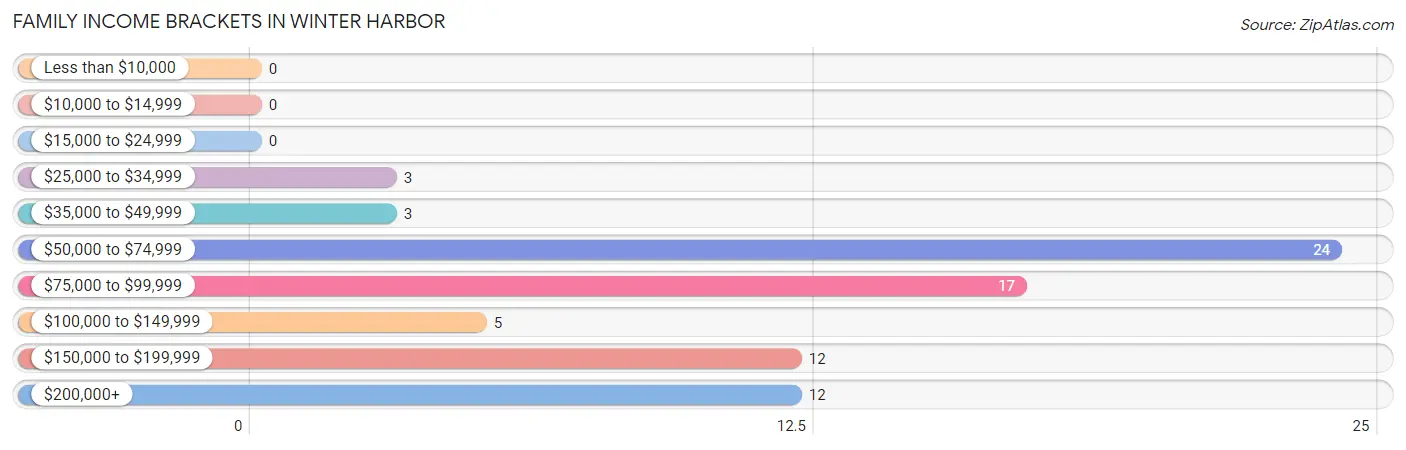
| Income Bracket | # Families | % Families |
| Less than $10,000 | 0 | 0.0% |
| $10,000 to $14,999 | 0 | 0.0% |
| $15,000 to $24,999 | 0 | 0.0% |
| $25,000 to $34,999 | 3 | 3.9% |
| $35,000 to $49,999 | 3 | 3.9% |
| $50,000 to $74,999 | 24 | 31.6% |
| $75,000 to $99,999 | 17 | 22.4% |
| $100,000 to $149,999 | 5 | 6.6% |
| $150,000 to $199,999 | 12 | 15.8% |
| $200,000+ | 12 | 15.8% |
Family Income by Famaliy Size in Winter Harbor
2-person families (70 | 92.1%) account for the highest median family income in Winter Harbor with $93,333 per family, while 2-person families (70 | 92.1%) have the highest median income of $46,666 per family member.
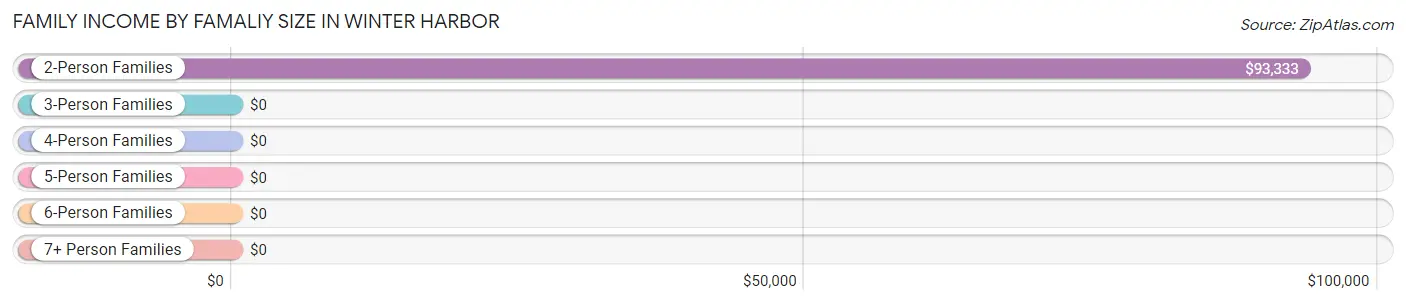
| Income Bracket | # Families | Median Income |
| 2-Person Families | 70 (92.1%) | $93,333 |
| 3-Person Families | 2 (2.6%) | $0 |
| 4-Person Families | 0 (0.0%) | $0 |
| 5-Person Families | 0 (0.0%) | $0 |
| 6-Person Families | 4 (5.3%) | $0 |
| 7+ Person Families | 0 (0.0%) | $0 |
| Total | 76 (100.0%) | $93,500 |
Family Income by Number of Earners in Winter Harbor
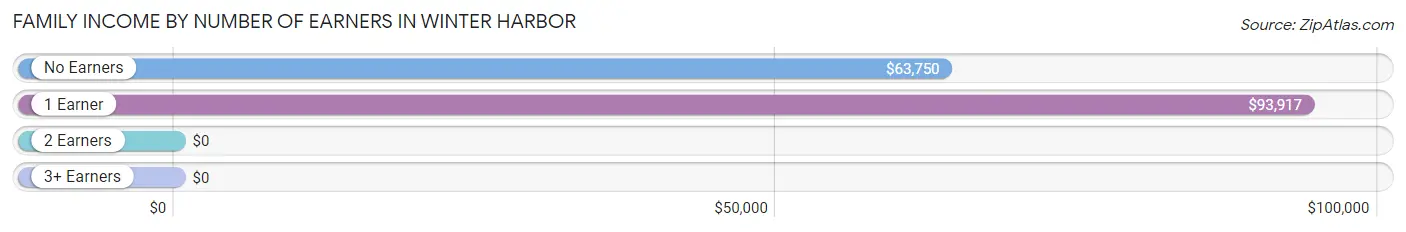
| Number of Earners | # Families | Median Income |
| No Earners | 38 (50.0%) | $63,750 |
| 1 Earner | 27 (35.5%) | $93,917 |
| 2 Earners | 11 (14.5%) | $0 |
| 3+ Earners | 0 (0.0%) | $0 |
| Total | 76 (100.0%) | $93,500 |
Household Income in Winter Harbor
Household Income Brackets in Winter Harbor
With 46 households falling in the category, the $35,000 to $49,999 income range is the most frequent in Winter Harbor, accounting for 26.6% of all households.
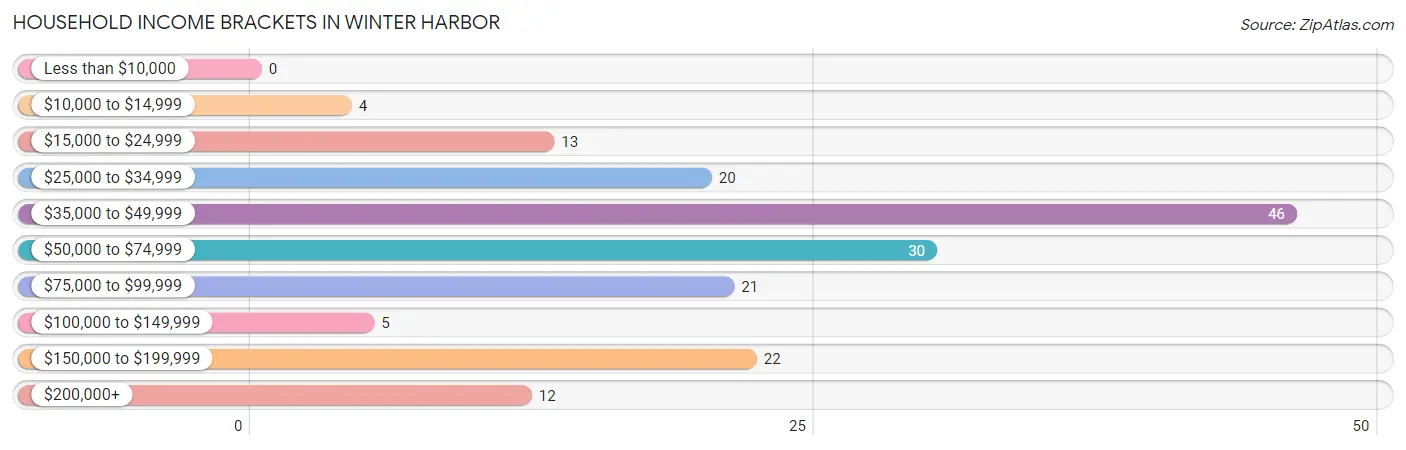
| Income Bracket | # Households | % Households |
| Less than $10,000 | 0 | 0.0% |
| $10,000 to $14,999 | 4 | 2.3% |
| $15,000 to $24,999 | 13 | 7.5% |
| $25,000 to $34,999 | 20 | 11.6% |
| $35,000 to $49,999 | 46 | 26.6% |
| $50,000 to $74,999 | 30 | 17.3% |
| $75,000 to $99,999 | 21 | 12.1% |
| $100,000 to $149,999 | 5 | 2.9% |
| $150,000 to $199,999 | 22 | 12.7% |
| $200,000+ | 12 | 6.9% |
Household Income by Householder Age in Winter Harbor
The median household income in Winter Harbor is $57,917, with the highest median household income of $49,167 found in the 65+ years age bracket for the primary householder. A total of 122 households (70.5%) fall into this category.
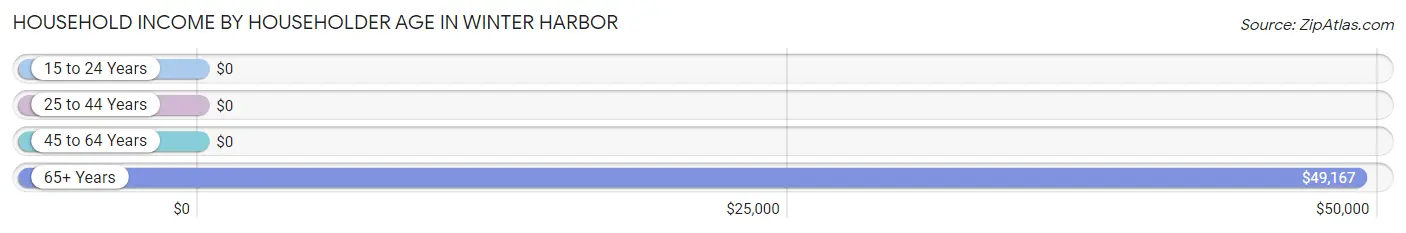
| Income Bracket | # Households | Median Income |
| 15 to 24 Years | 0 (0.0%) | $0 |
| 25 to 44 Years | 8 (4.6%) | $0 |
| 45 to 64 Years | 43 (24.9%) | $0 |
| 65+ Years | 122 (70.5%) | $49,167 |
| Total | 173 (100.0%) | $57,917 |
Poverty in Winter Harbor
Income Below Poverty by Sex and Age in Winter Harbor
With 2.4% poverty level for males and 2.1% for females among the residents of Winter Harbor, 75 year old and over males and 55 to 64 year old females are the most vulnerable to poverty, with 3 males (9.1%) and 4 females (11.8%) in their respective age groups living below the poverty level.
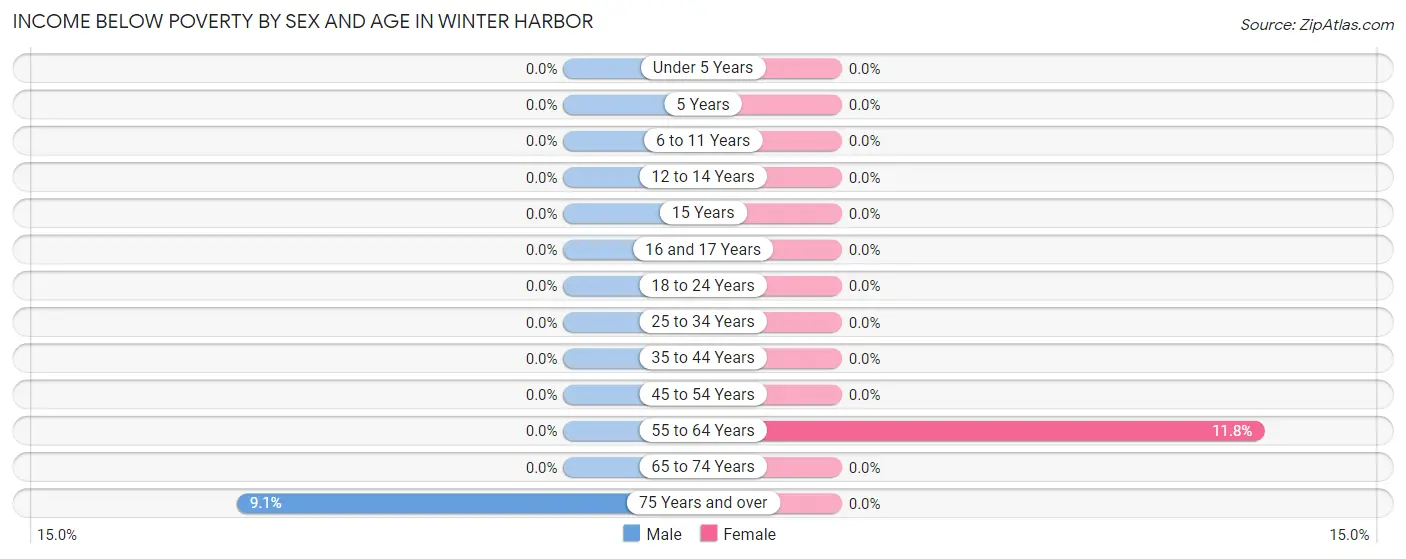
| Age Bracket | Male | Female |
| Under 5 Years | 0 (0.0%) | 0 (0.0%) |
| 5 Years | 0 (0.0%) | 0 (0.0%) |
| 6 to 11 Years | 0 (0.0%) | 0 (0.0%) |
| 12 to 14 Years | 0 (0.0%) | 0 (0.0%) |
| 15 Years | 0 (0.0%) | 0 (0.0%) |
| 16 and 17 Years | 0 (0.0%) | 0 (0.0%) |
| 18 to 24 Years | 0 (0.0%) | 0 (0.0%) |
| 25 to 34 Years | 0 (0.0%) | 0 (0.0%) |
| 35 to 44 Years | 0 (0.0%) | 0 (0.0%) |
| 45 to 54 Years | 0 (0.0%) | 0 (0.0%) |
| 55 to 64 Years | 0 (0.0%) | 4 (11.8%) |
| 65 to 74 Years | 0 (0.0%) | 0 (0.0%) |
| 75 Years and over | 3 (9.1%) | 0 (0.0%) |
| Total | 3 (2.4%) | 4 (2.1%) |
Income Above Poverty by Sex and Age in Winter Harbor
According to the poverty statistics in Winter Harbor, males aged 6 to 11 years and females aged 5 years are the age groups that are most secure financially, with 100.0% of males and 100.0% of females in these age groups living above the poverty line.
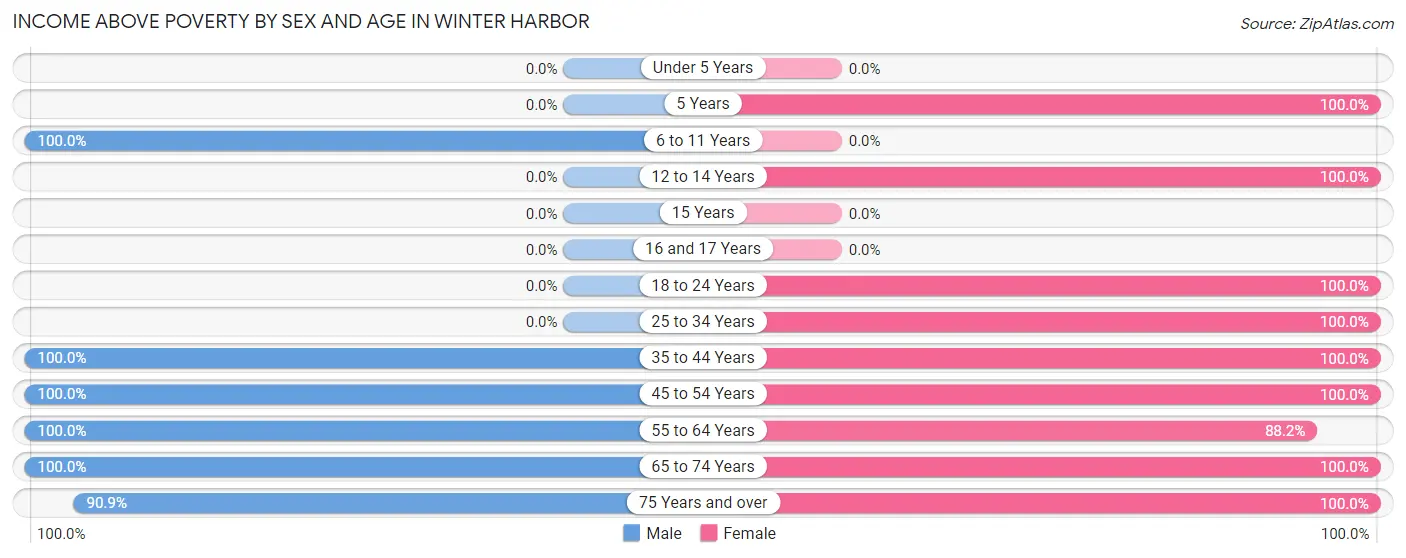
| Age Bracket | Male | Female |
| Under 5 Years | 0 (0.0%) | 0 (0.0%) |
| 5 Years | 0 (0.0%) | 7 (100.0%) |
| 6 to 11 Years | 8 (100.0%) | 0 (0.0%) |
| 12 to 14 Years | 0 (0.0%) | 5 (100.0%) |
| 15 Years | 0 (0.0%) | 0 (0.0%) |
| 16 and 17 Years | 0 (0.0%) | 0 (0.0%) |
| 18 to 24 Years | 0 (0.0%) | 26 (100.0%) |
| 25 to 34 Years | 0 (0.0%) | 4 (100.0%) |
| 35 to 44 Years | 7 (100.0%) | 5 (100.0%) |
| 45 to 54 Years | 3 (100.0%) | 14 (100.0%) |
| 55 to 64 Years | 21 (100.0%) | 30 (88.2%) |
| 65 to 74 Years | 55 (100.0%) | 51 (100.0%) |
| 75 Years and over | 30 (90.9%) | 42 (100.0%) |
| Total | 124 (97.6%) | 184 (97.9%) |
Income Below Poverty Among Married-Couple Families in Winter Harbor
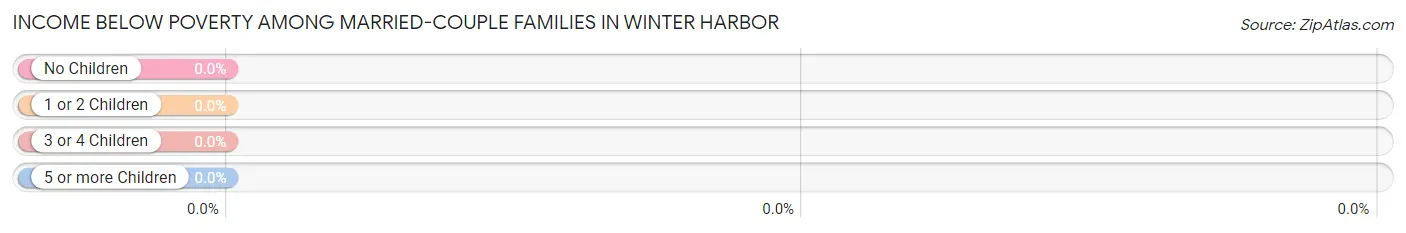
| Children | Above Poverty | Below Poverty |
| No Children | 69 (100.0%) | 0 (0.0%) |
| 1 or 2 Children | 0 (0.0%) | 0 (0.0%) |
| 3 or 4 Children | 4 (100.0%) | 0 (0.0%) |
| 5 or more Children | 0 (0.0%) | 0 (0.0%) |
| Total | 73 (100.0%) | 0 (0.0%) |
Income Below Poverty Among Single-Parent Households in Winter Harbor
| Children | Single Father | Single Mother |
| No Children | 0 (0.0%) | 0 (0.0%) |
| 1 or 2 Children | 0 (0.0%) | 0 (0.0%) |
| 3 or 4 Children | 0 (0.0%) | 0 (0.0%) |
| 5 or more Children | 0 (0.0%) | 0 (0.0%) |
| Total | 0 (0.0%) | 0 (0.0%) |
Income Below Poverty Among Married-Couple vs Single-Parent Households in Winter Harbor
| Children | Married-Couple Families | Single-Parent Households |
| No Children | 0 (0.0%) | 0 (0.0%) |
| 1 or 2 Children | 0 (0.0%) | 0 (0.0%) |
| 3 or 4 Children | 0 (0.0%) | 0 (0.0%) |
| 5 or more Children | 0 (0.0%) | 0 (0.0%) |
| Total | 0 (0.0%) | 0 (0.0%) |
Race in Winter Harbor
The most populous races in Winter Harbor are White / Caucasian (311 | 98.7%), and Black / African American (4 | 1.3%).
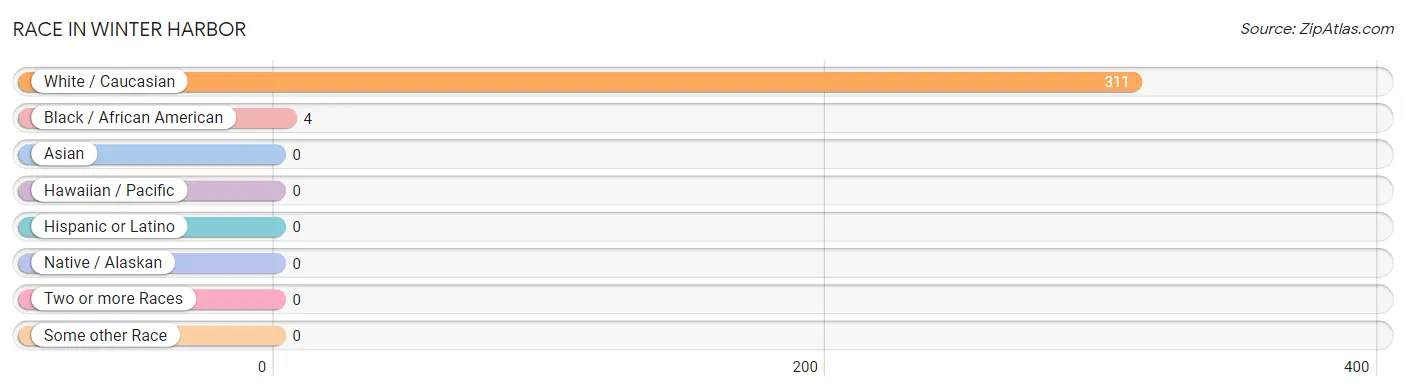
| Race | # Population | % Population |
| Asian | 0 | 0.0% |
| Black / African American | 4 | 1.3% |
| Hawaiian / Pacific | 0 | 0.0% |
| Hispanic or Latino | 0 | 0.0% |
| Native / Alaskan | 0 | 0.0% |
| White / Caucasian | 311 | 98.7% |
| Two or more Races | 0 | 0.0% |
| Some other Race | 0 | 0.0% |
| Total | 315 | 100.0% |
Ancestry in Winter Harbor
The most populous ancestries reported in Winter Harbor are English (100 | 31.8%), Irish (75 | 23.8%), French (53 | 16.8%), German (42 | 13.3%), and Scottish (17 | 5.4%), together accounting for 91.1% of all Winter Harbor residents.
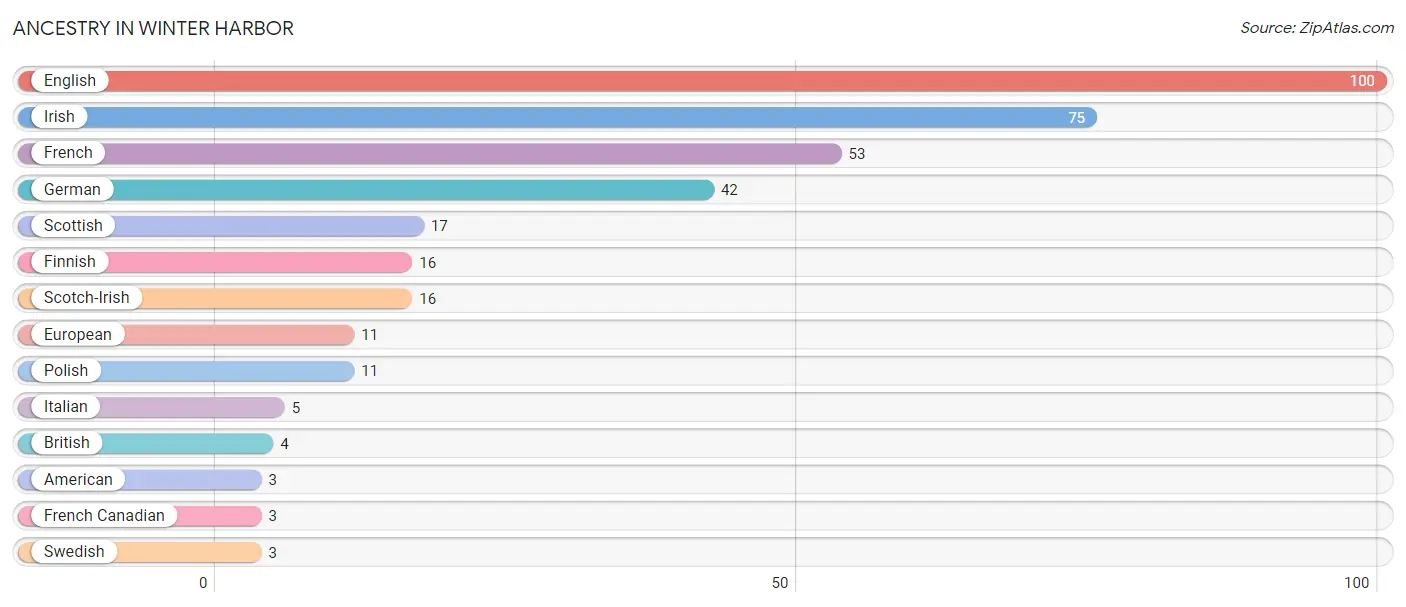
| Ancestry | # Population | % Population |
| American | 3 | 0.9% |
| British | 4 | 1.3% |
| English | 100 | 31.8% |
| European | 11 | 3.5% |
| Finnish | 16 | 5.1% |
| French | 53 | 16.8% |
| French Canadian | 3 | 0.9% |
| German | 42 | 13.3% |
| Irish | 75 | 23.8% |
| Italian | 5 | 1.6% |
| Polish | 11 | 3.5% |
| Scotch-Irish | 16 | 5.1% |
| Scottish | 17 | 5.4% |
| Swedish | 3 | 0.9% | View All 14 Rows |
Immigrants in Winter Harbor
The most numerous immigrant groups reported in Winter Harbor came from Europe (8 | 2.5%), and Northern Europe (8 | 2.5%), together accounting for 5.1% of all Winter Harbor residents.
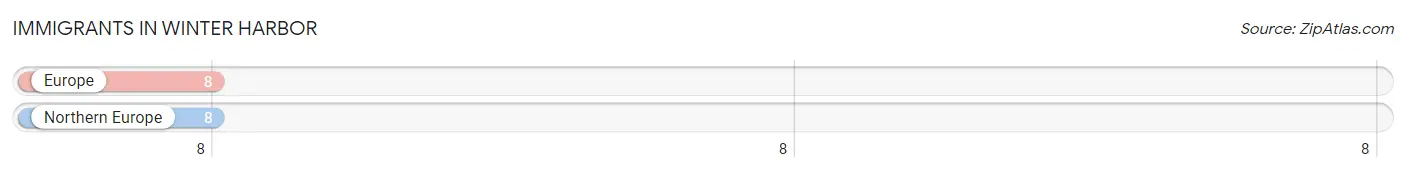
| Immigration Origin | # Population | % Population |
| Europe | 8 | 2.5% |
| Northern Europe | 8 | 2.5% | View All 2 Rows |
Sex and Age in Winter Harbor
Sex and Age in Winter Harbor
The most populous age groups in Winter Harbor are 65 to 69 Years (33 | 26.0%) for men and 70 to 74 Years (36 | 19.2%) for women.
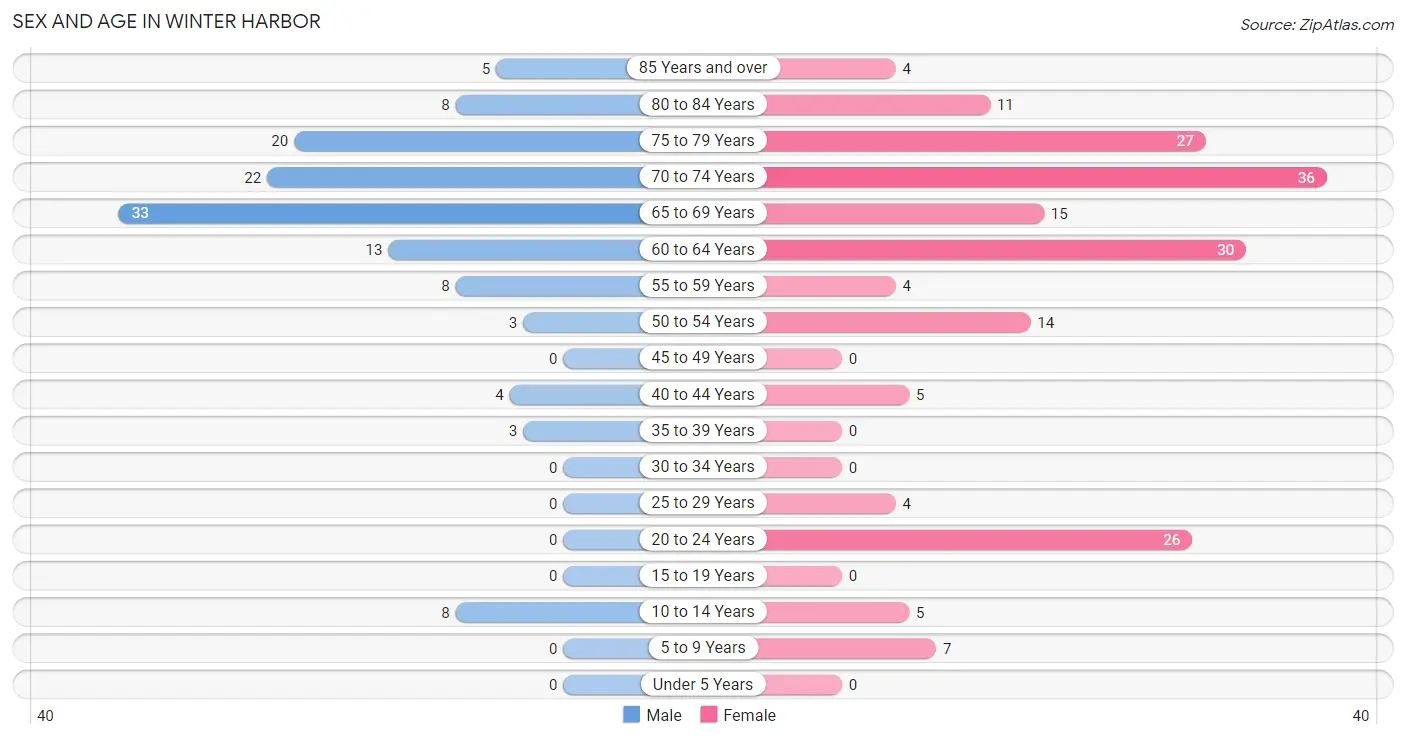
| Age Bracket | Male | Female |
| Under 5 Years | 0 (0.0%) | 0 (0.0%) |
| 5 to 9 Years | 0 (0.0%) | 7 (3.7%) |
| 10 to 14 Years | 8 (6.3%) | 5 (2.7%) |
| 15 to 19 Years | 0 (0.0%) | 0 (0.0%) |
| 20 to 24 Years | 0 (0.0%) | 26 (13.8%) |
| 25 to 29 Years | 0 (0.0%) | 4 (2.1%) |
| 30 to 34 Years | 0 (0.0%) | 0 (0.0%) |
| 35 to 39 Years | 3 (2.4%) | 0 (0.0%) |
| 40 to 44 Years | 4 (3.2%) | 5 (2.7%) |
| 45 to 49 Years | 0 (0.0%) | 0 (0.0%) |
| 50 to 54 Years | 3 (2.4%) | 14 (7.4%) |
| 55 to 59 Years | 8 (6.3%) | 4 (2.1%) |
| 60 to 64 Years | 13 (10.2%) | 30 (16.0%) |
| 65 to 69 Years | 33 (26.0%) | 15 (8.0%) |
| 70 to 74 Years | 22 (17.3%) | 36 (19.2%) |
| 75 to 79 Years | 20 (15.8%) | 27 (14.4%) |
| 80 to 84 Years | 8 (6.3%) | 11 (5.9%) |
| 85 Years and over | 5 (3.9%) | 4 (2.1%) |
| Total | 127 (100.0%) | 188 (100.0%) |
Families and Households in Winter Harbor
Median Family Size in Winter Harbor
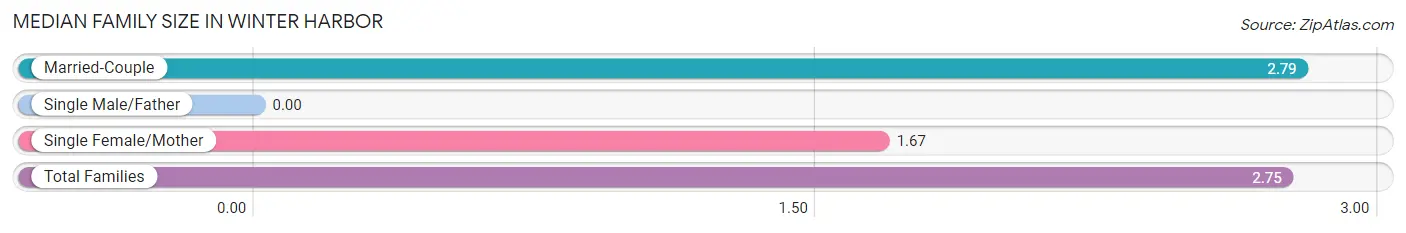
| Family Type | # Families | Family Size |
| Married-Couple | 73 (96.1%) | 2.79 |
| Single Male/Father | 0 (0.0%) | - |
| Single Female/Mother | 3 (4.0%) | 1.67 |
| Total Families | 76 (100.0%) | 2.75 |
Median Household Size in Winter Harbor
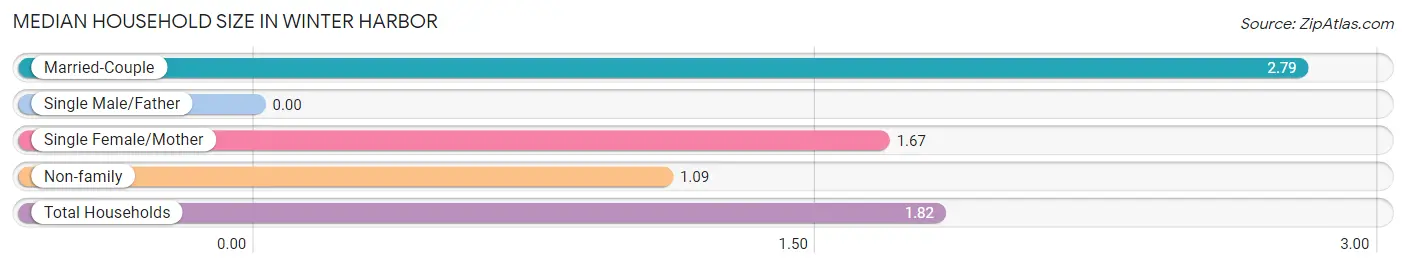
| Household Type | # Households | Household Size |
| Married-Couple | 73 (42.2%) | 2.79 |
| Single Male/Father | 0 (0.0%) | - |
| Single Female/Mother | 3 (1.7%) | 1.67 |
| Non-family | 97 (56.1%) | 1.09 |
| Total Households | 173 (100.0%) | 1.82 |
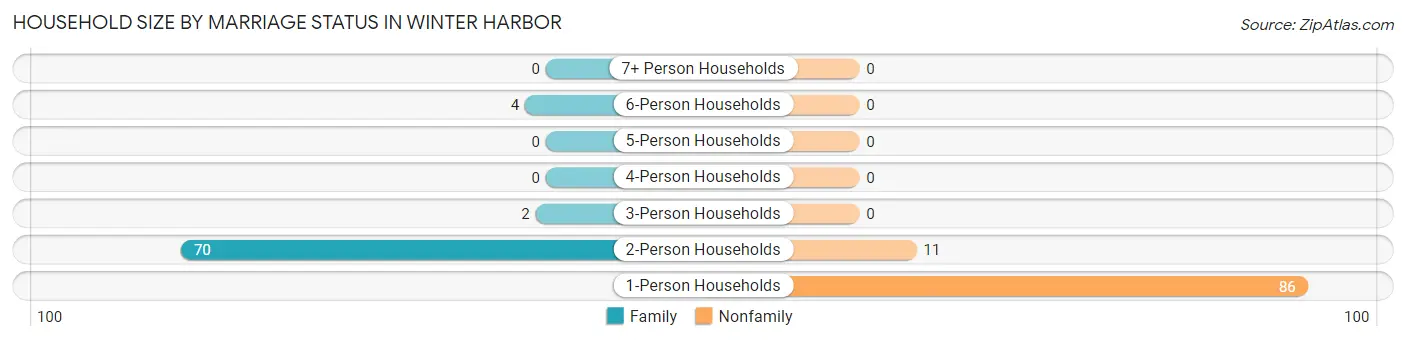
Household Size by Marriage Status in Winter Harbor
Out of a total of 173 households in Winter Harbor, 76 (43.9%) are family households, while 97 (56.1%) are nonfamily households. The most numerous type of family households are 2-person households, comprising 70, and the most common type of nonfamily households are 1-person households, comprising 86.
| Household Size | Family Households | Nonfamily Households |
| 1-Person Households | - | 86 (49.7%) |
| 2-Person Households | 70 (40.5%) | 11 (6.4%) |
| 3-Person Households | 2 (1.2%) | 0 (0.0%) |
| 4-Person Households | 0 (0.0%) | 0 (0.0%) |
| 5-Person Households | 0 (0.0%) | 0 (0.0%) |
| 6-Person Households | 4 (2.3%) | 0 (0.0%) |
| 7+ Person Households | 0 (0.0%) | 0 (0.0%) |
| Total | 76 (43.9%) | 97 (56.1%) |
Female Fertility in Winter Harbor
Fertility by Age in Winter Harbor
| Age Bracket | Women with Births | Births / 1,000 Women |
| 15 to 19 years | 0 (0.0%) | 0.0 |
| 20 to 34 years | 0 (0.0%) | 0.0 |
| 35 to 50 years | 0 (0.0%) | 0.0 |
| Total | 0 (0.0%) | 0.0 |
Fertility by Age by Marriage Status in Winter Harbor
| Age Bracket | Married | Unmarried |
| 15 to 19 years | 0 (0.0%) | 0 (0.0%) |
| 20 to 34 years | 0 (0.0%) | 0 (0.0%) |
| 35 to 50 years | 0 (0.0%) | 0 (0.0%) |
| Total | 0 (0.0%) | 0 (0.0%) |
Fertility by Education in Winter Harbor
| Educational Attainment | Women with Births | Births / 1,000 Women |
| Less than High School | 0 (0.0%) | 0.0 |
| High School Diploma | 0 (0.0%) | 0.0 |
| College or Associate's Degree | 0 (0.0%) | 0.0 |
| Bachelor's Degree | 0 (0.0%) | 0.0 |
| Graduate Degree | 0 (0.0%) | 0.0 |
| Total | 0 (0.0%) | 0.0 |
Fertility by Education by Marriage Status in Winter Harbor
| Educational Attainment | Married | Unmarried |
| Less than High School | 0 (0.0%) | 0 (0.0%) |
| High School Diploma | 0 (0.0%) | 0 (0.0%) |
| College or Associate's Degree | 0 (0.0%) | 0 (0.0%) |
| Bachelor's Degree | 0 (0.0%) | 0 (0.0%) |
| Graduate Degree | 0 (0.0%) | 0 (0.0%) |
| Total | 0 (0.0%) | 0 (0.0%) |
Employment Characteristics in Winter Harbor
Employment by Class of Employer in Winter Harbor
Among the 76 employed individuals in Winter Harbor, private company employees (39 | 51.3%), self-employed (not incorporated) (12 | 15.8%), and federal government employees (9 | 11.8%) make up the most common classes of employment.
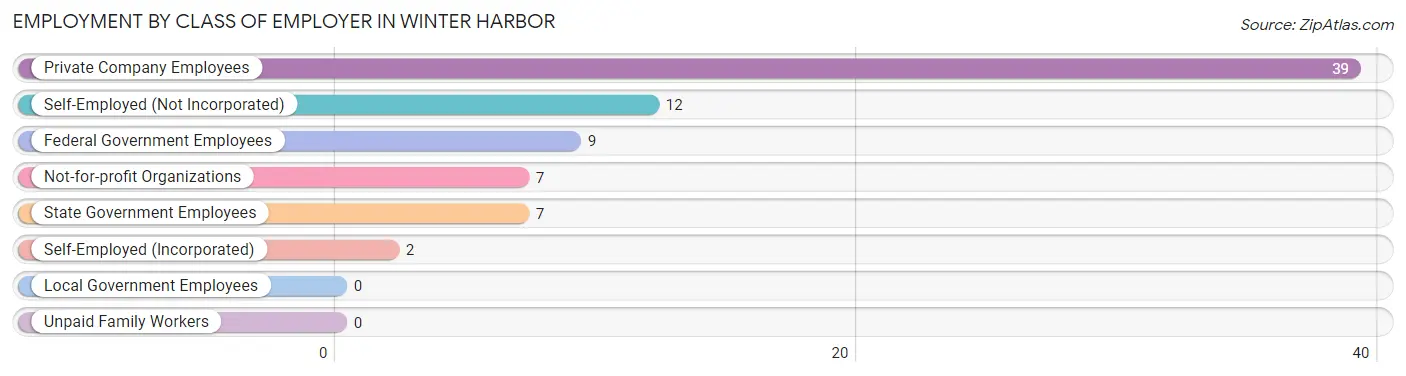
| Employer Class | # Employees | % Employees |
| Private Company Employees | 39 | 51.3% |
| Self-Employed (Incorporated) | 2 | 2.6% |
| Self-Employed (Not Incorporated) | 12 | 15.8% |
| Not-for-profit Organizations | 7 | 9.2% |
| Local Government Employees | 0 | 0.0% |
| State Government Employees | 7 | 9.2% |
| Federal Government Employees | 9 | 11.8% |
| Unpaid Family Workers | 0 | 0.0% |
| Total | 76 | 100.0% |
Employment Status by Age in Winter Harbor
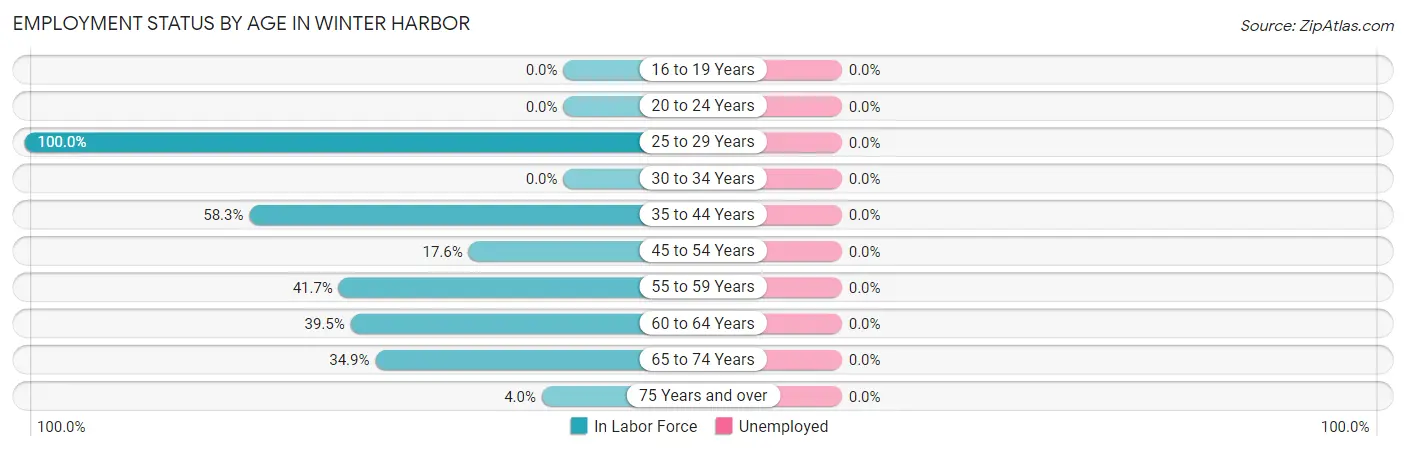
| Age Bracket | In Labor Force | Unemployed |
| 16 to 19 Years | 0 (0.0%) | 0 (0.0%) |
| 20 to 24 Years | 0 (0.0%) | 0 (0.0%) |
| 25 to 29 Years | 4 (100.0%) | 0 (0.0%) |
| 30 to 34 Years | 0 (0.0%) | 0 (0.0%) |
| 35 to 44 Years | 7 (58.3%) | 0 (0.0%) |
| 45 to 54 Years | 3 (17.6%) | 0 (0.0%) |
| 55 to 59 Years | 5 (41.7%) | 0 (0.0%) |
| 60 to 64 Years | 17 (39.5%) | 0 (0.0%) |
| 65 to 74 Years | 37 (34.9%) | 0 (0.0%) |
| 75 Years and over | 3 (4.0%) | 0 (0.0%) |
| Total | 76 (25.8%) | 0 (0.0%) |
Employment Status by Educational Attainment in Winter Harbor
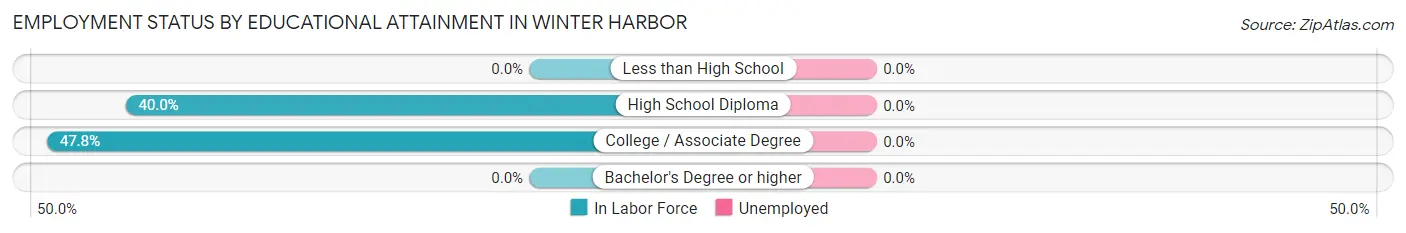
| Educational Attainment | In Labor Force | Unemployed |
| Less than High School | 0 (0.0%) | 0 (0.0%) |
| High School Diploma | 14 (40.0%) | 0 (0.0%) |
| College / Associate Degree | 22 (47.8%) | 0 (0.0%) |
| Bachelor's Degree or higher | 0 (0.0%) | 0 (0.0%) |
| Total | 36 (40.9%) | 0 (0.0%) |
Employment Occupations by Sex in Winter Harbor
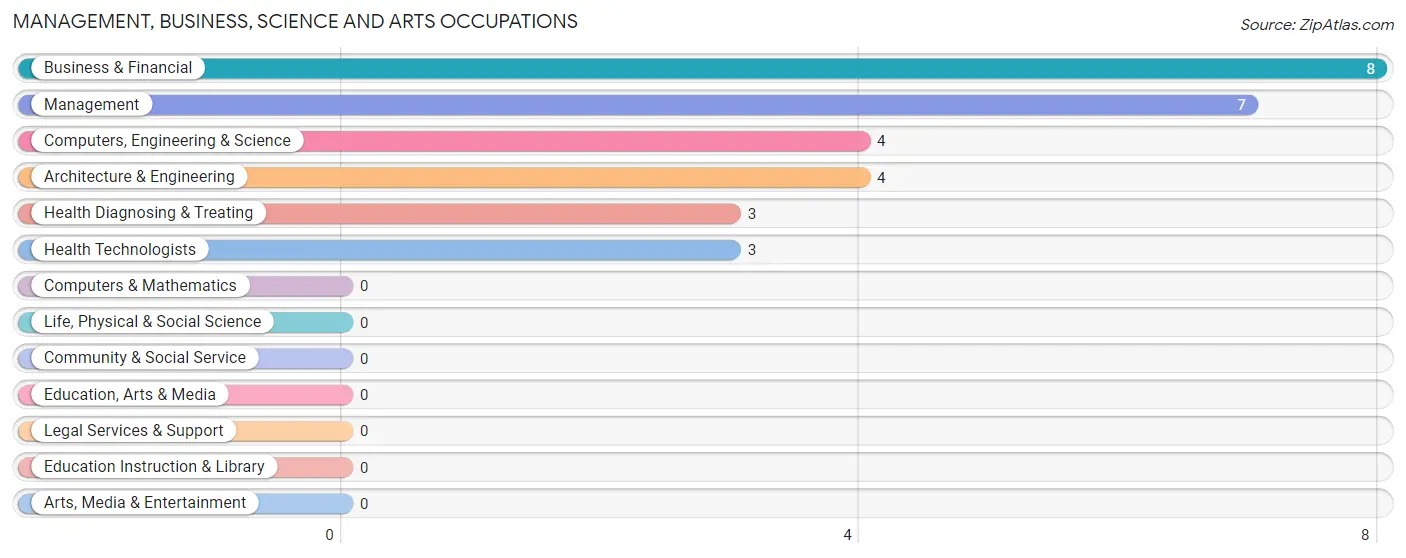
Management, Business, Science and Arts Occupations
The most common Management, Business, Science and Arts occupations in Winter Harbor are Business & Financial (8 | 10.5%), Management (7 | 9.2%), Computers, Engineering & Science (4 | 5.3%), Architecture & Engineering (4 | 5.3%), and Health Diagnosing & Treating (3 | 4.0%).
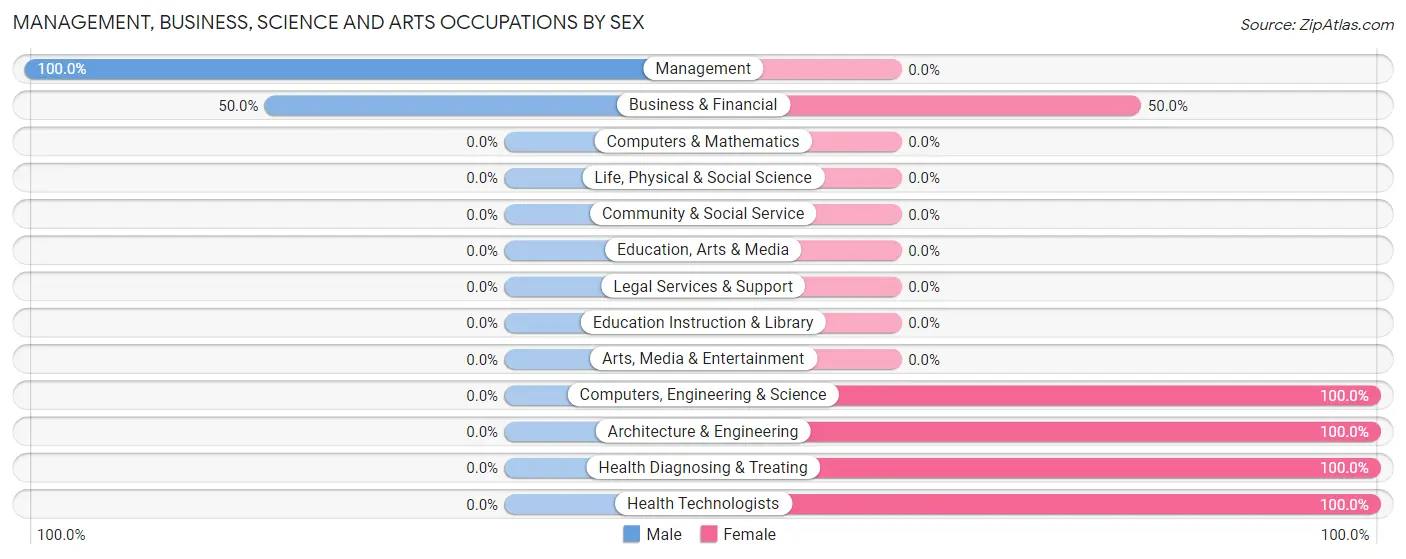
Management, Business, Science and Arts Occupations by Sex
Within the Management, Business, Science and Arts occupations in Winter Harbor, the most male-oriented occupations are Management (100.0%), and Business & Financial (50.0%), while the most female-oriented occupations are Computers, Engineering & Science (100.0%), Architecture & Engineering (100.0%), and Health Diagnosing & Treating (100.0%).
| Occupation | Male | Female |
| Management | 7 (100.0%) | 0 (0.0%) |
| Business & Financial | 4 (50.0%) | 4 (50.0%) |
| Computers, Engineering & Science | 0 (0.0%) | 4 (100.0%) |
| Computers & Mathematics | 0 (0.0%) | 0 (0.0%) |
| Architecture & Engineering | 0 (0.0%) | 4 (100.0%) |
| Life, Physical & Social Science | 0 (0.0%) | 0 (0.0%) |
| Community & Social Service | 0 (0.0%) | 0 (0.0%) |
| Education, Arts & Media | 0 (0.0%) | 0 (0.0%) |
| Legal Services & Support | 0 (0.0%) | 0 (0.0%) |
| Education Instruction & Library | 0 (0.0%) | 0 (0.0%) |
| Arts, Media & Entertainment | 0 (0.0%) | 0 (0.0%) |
| Health Diagnosing & Treating | 0 (0.0%) | 3 (100.0%) |
| Health Technologists | 0 (0.0%) | 3 (100.0%) |
| Total (Category) | 11 (50.0%) | 11 (50.0%) |
| Total (Overall) | 42 (55.3%) | 34 (44.7%) |
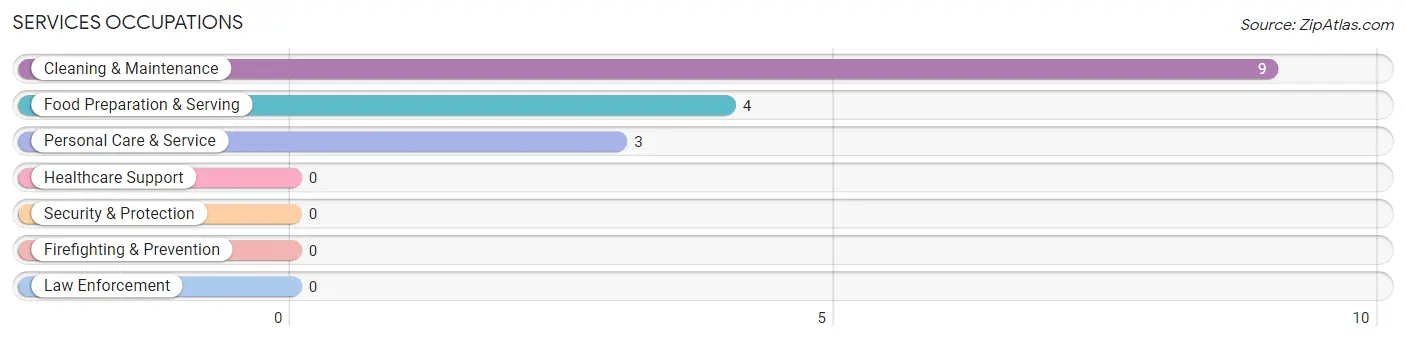
Services Occupations
The most common Services occupations in Winter Harbor are Cleaning & Maintenance (9 | 11.8%), Food Preparation & Serving (4 | 5.3%), and Personal Care & Service (3 | 4.0%).
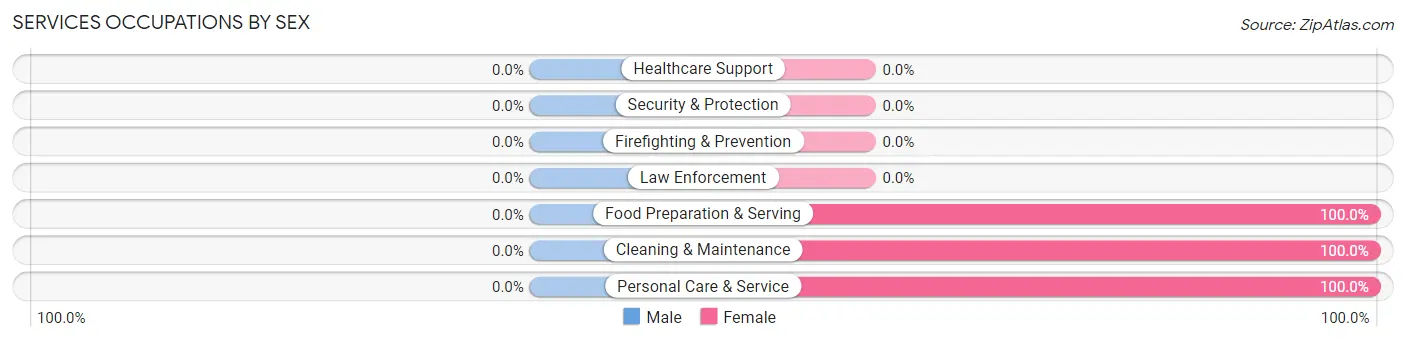
Services Occupations by Sex
| Occupation | Male | Female |
| Healthcare Support | 0 (0.0%) | 0 (0.0%) |
| Security & Protection | 0 (0.0%) | 0 (0.0%) |
| Firefighting & Prevention | 0 (0.0%) | 0 (0.0%) |
| Law Enforcement | 0 (0.0%) | 0 (0.0%) |
| Food Preparation & Serving | 0 (0.0%) | 4 (100.0%) |
| Cleaning & Maintenance | 0 (0.0%) | 9 (100.0%) |
| Personal Care & Service | 0 (0.0%) | 3 (100.0%) |
| Total (Category) | 0 (0.0%) | 16 (100.0%) |
| Total (Overall) | 42 (55.3%) | 34 (44.7%) |
Sales and Office Occupations
The most common Sales and Office occupations in Winter Harbor are Office & Administration (7 | 9.2%), and Sales & Related (2 | 2.6%).
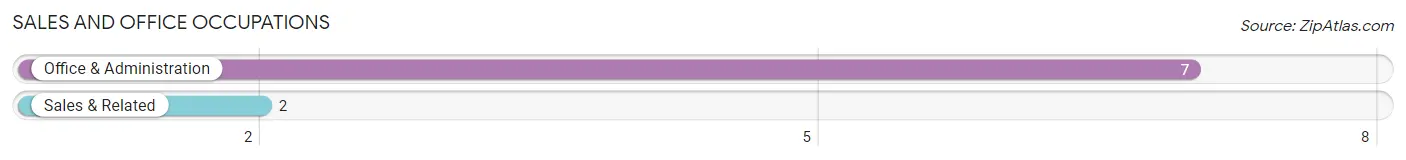
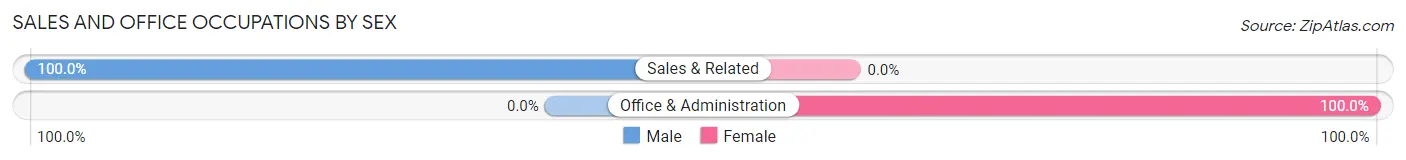
Sales and Office Occupations by Sex
| Occupation | Male | Female |
| Sales & Related | 2 (100.0%) | 0 (0.0%) |
| Office & Administration | 0 (0.0%) | 7 (100.0%) |
| Total (Category) | 2 (22.2%) | 7 (77.8%) |
| Total (Overall) | 42 (55.3%) | 34 (44.7%) |
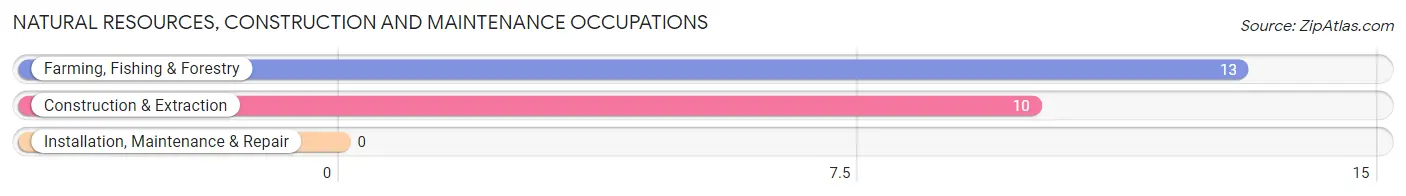
Natural Resources, Construction and Maintenance Occupations
The most common Natural Resources, Construction and Maintenance occupations in Winter Harbor are Farming, Fishing & Forestry (13 | 17.1%), and Construction & Extraction (10 | 13.2%).
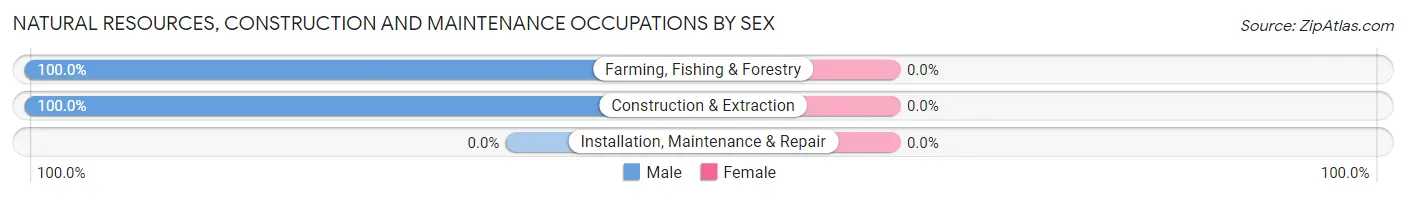
Natural Resources, Construction and Maintenance Occupations by Sex
| Occupation | Male | Female |
| Farming, Fishing & Forestry | 13 (100.0%) | 0 (0.0%) |
| Construction & Extraction | 10 (100.0%) | 0 (0.0%) |
| Installation, Maintenance & Repair | 0 (0.0%) | 0 (0.0%) |
| Total (Category) | 23 (100.0%) | 0 (0.0%) |
| Total (Overall) | 42 (55.3%) | 34 (44.7%) |
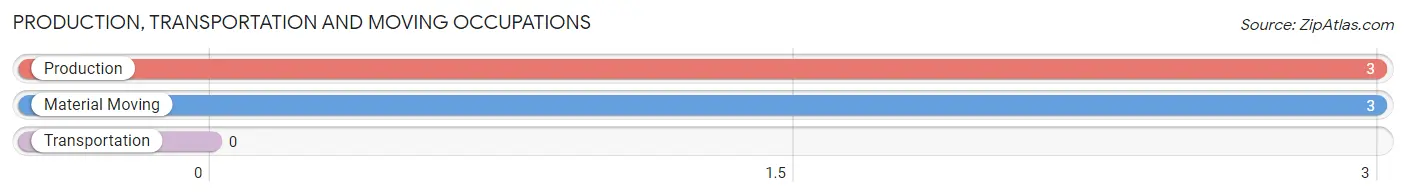
Production, Transportation and Moving Occupations
The most common Production, Transportation and Moving occupations in Winter Harbor are Production (3 | 4.0%), and Material Moving (3 | 4.0%).
Production, Transportation and Moving Occupations by Sex
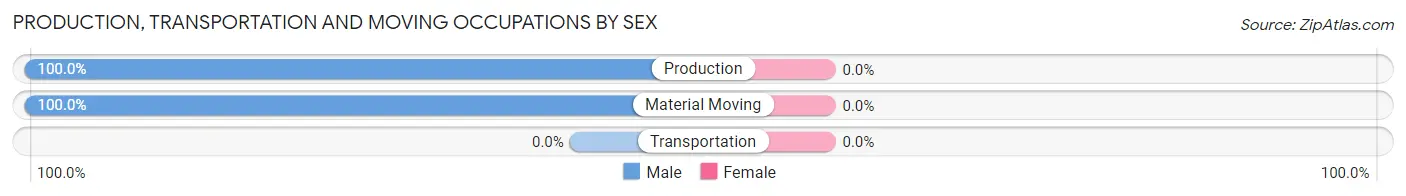
| Occupation | Male | Female |
| Production | 3 (100.0%) | 0 (0.0%) |
| Transportation | 0 (0.0%) | 0 (0.0%) |
| Material Moving | 3 (100.0%) | 0 (0.0%) |
| Total (Category) | 6 (100.0%) | 0 (0.0%) |
| Total (Overall) | 42 (55.3%) | 34 (44.7%) |
Employment Industries by Sex in Winter Harbor
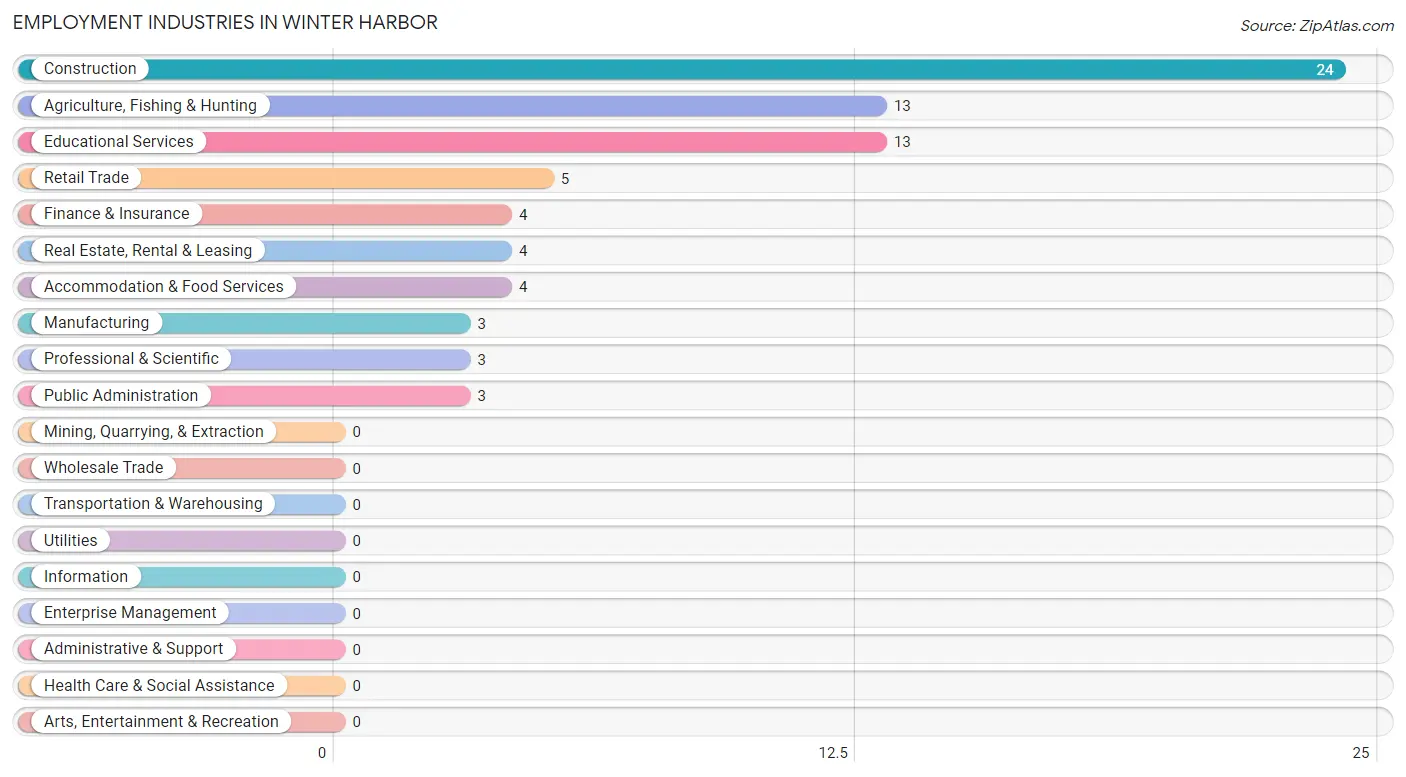
Employment Industries in Winter Harbor
The major employment industries in Winter Harbor include Construction (24 | 31.6%), Agriculture, Fishing & Hunting (13 | 17.1%), Educational Services (13 | 17.1%), Retail Trade (5 | 6.6%), and Finance & Insurance (4 | 5.3%).
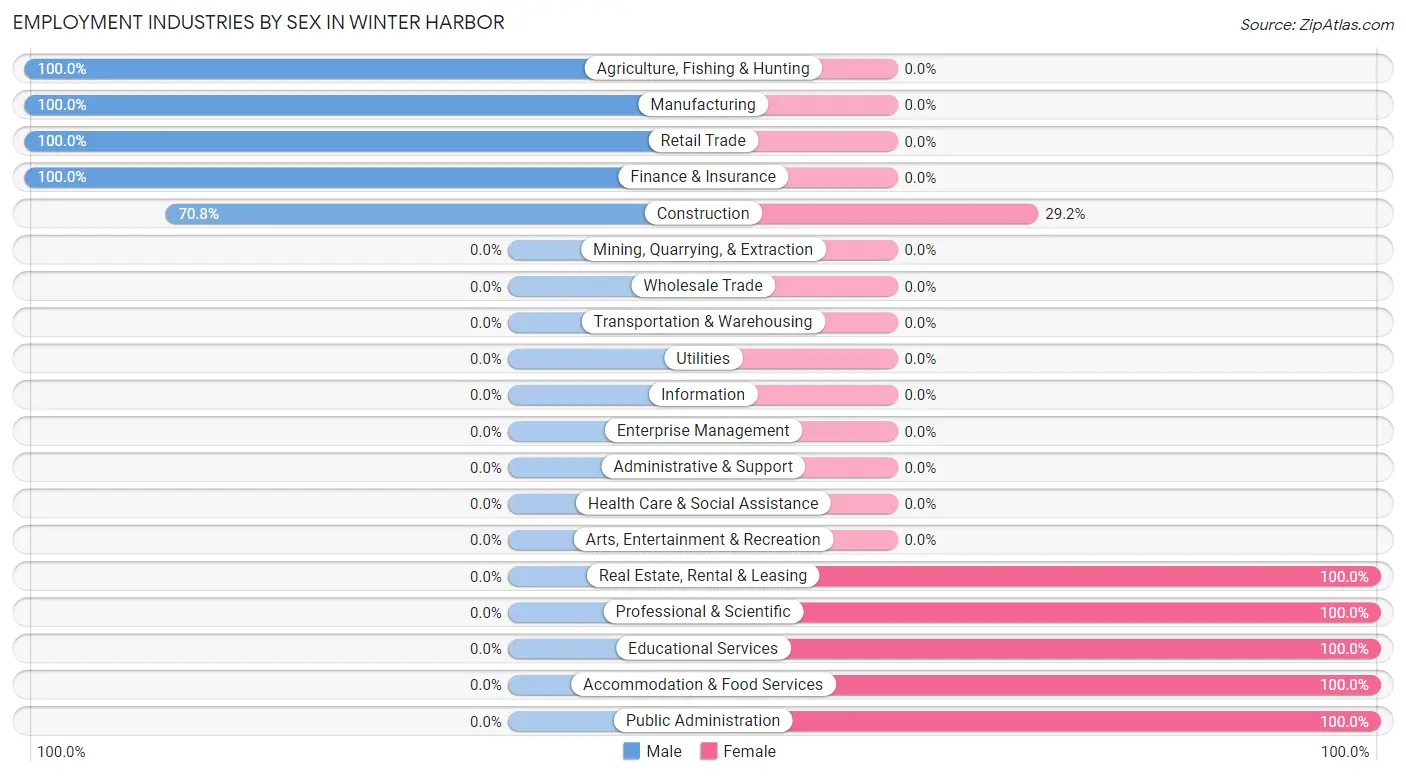
Employment Industries by Sex in Winter Harbor
The Winter Harbor industries that see more men than women are Agriculture, Fishing & Hunting (100.0%), Manufacturing (100.0%), and Retail Trade (100.0%), whereas the industries that tend to have a higher number of women are Real Estate, Rental & Leasing (100.0%), Professional & Scientific (100.0%), and Educational Services (100.0%).
| Industry | Male | Female |
| Agriculture, Fishing & Hunting | 13 (100.0%) | 0 (0.0%) |
| Mining, Quarrying, & Extraction | 0 (0.0%) | 0 (0.0%) |
| Construction | 17 (70.8%) | 7 (29.2%) |
| Manufacturing | 3 (100.0%) | 0 (0.0%) |
| Wholesale Trade | 0 (0.0%) | 0 (0.0%) |
| Retail Trade | 5 (100.0%) | 0 (0.0%) |
| Transportation & Warehousing | 0 (0.0%) | 0 (0.0%) |
| Utilities | 0 (0.0%) | 0 (0.0%) |
| Information | 0 (0.0%) | 0 (0.0%) |
| Finance & Insurance | 4 (100.0%) | 0 (0.0%) |
| Real Estate, Rental & Leasing | 0 (0.0%) | 4 (100.0%) |
| Professional & Scientific | 0 (0.0%) | 3 (100.0%) |
| Enterprise Management | 0 (0.0%) | 0 (0.0%) |
| Administrative & Support | 0 (0.0%) | 0 (0.0%) |
| Educational Services | 0 (0.0%) | 13 (100.0%) |
| Health Care & Social Assistance | 0 (0.0%) | 0 (0.0%) |
| Arts, Entertainment & Recreation | 0 (0.0%) | 0 (0.0%) |
| Accommodation & Food Services | 0 (0.0%) | 4 (100.0%) |
| Public Administration | 0 (0.0%) | 3 (100.0%) |
| Total | 42 (55.3%) | 34 (44.7%) |
Education in Winter Harbor
School Enrollment in Winter Harbor
The most common levels of schooling among the 50 students in Winter Harbor are college / undergraduate (30 | 60.0%), middle school (8 | 16.0%), and elementary school (7 | 14.0%).
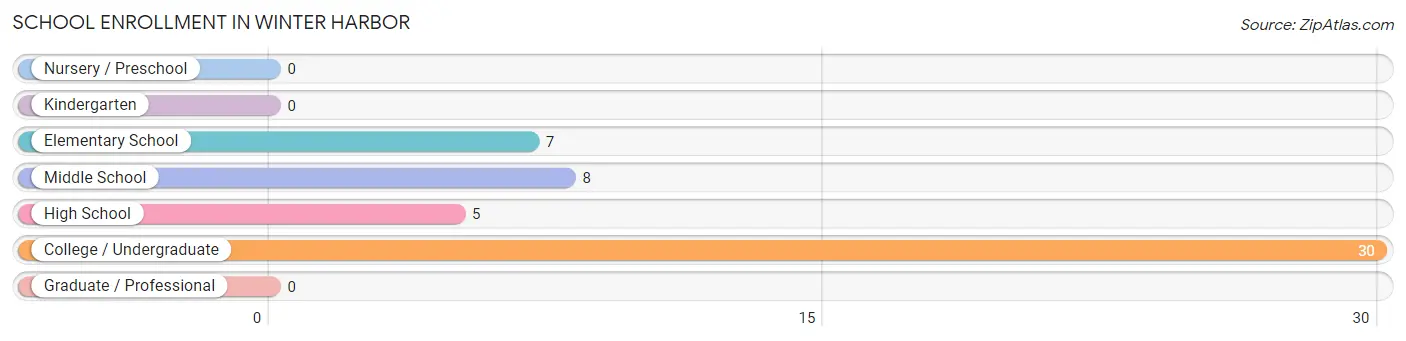
| School Level | # Students | % Students |
| Nursery / Preschool | 0 | 0.0% |
| Kindergarten | 0 | 0.0% |
| Elementary School | 7 | 14.0% |
| Middle School | 8 | 16.0% |
| High School | 5 | 10.0% |
| College / Undergraduate | 30 | 60.0% |
| Graduate / Professional | 0 | 0.0% |
| Total | 50 | 100.0% |
School Enrollment by Age by Funding Source in Winter Harbor
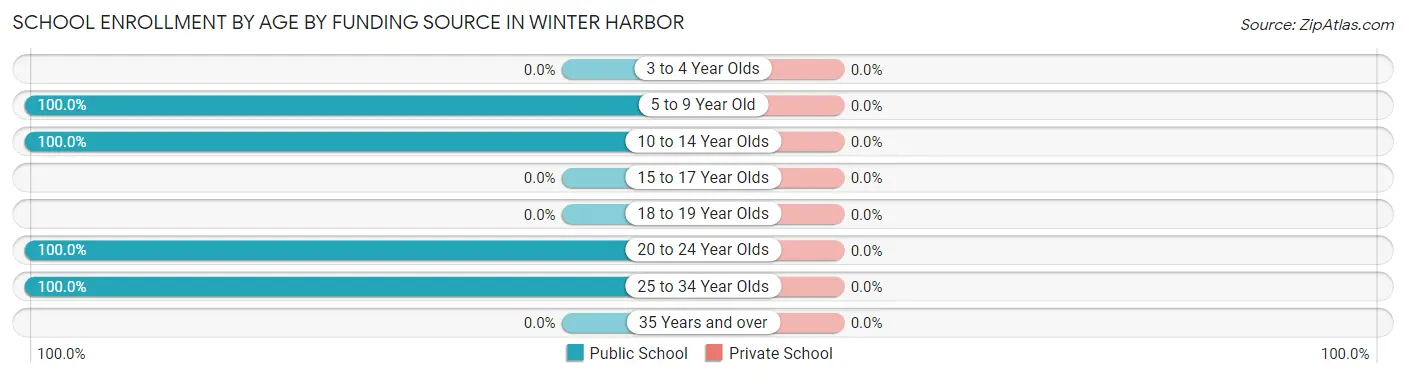
| Age Bracket | Public School | Private School |
| 3 to 4 Year Olds | 0 (0.0%) | 0 (0.0%) |
| 5 to 9 Year Old | 7 (100.0%) | 0 (0.0%) |
| 10 to 14 Year Olds | 13 (100.0%) | 0 (0.0%) |
| 15 to 17 Year Olds | 0 (0.0%) | 0 (0.0%) |
| 18 to 19 Year Olds | 0 (0.0%) | 0 (0.0%) |
| 20 to 24 Year Olds | 26 (100.0%) | 0 (0.0%) |
| 25 to 34 Year Olds | 4 (100.0%) | 0 (0.0%) |
| 35 Years and over | 0 (0.0%) | 0 (0.0%) |
| Total | 50 (100.0%) | 0 (0.0%) |
Educational Attainment by Field of Study in Winter Harbor
Education (16 | 18.8%), literature & languages (16 | 18.8%), arts & humanities (10 | 11.8%), liberal arts & history (9 | 10.6%), and psychology (6 | 7.1%) are the most common fields of study among 85 individuals in Winter Harbor who have obtained a bachelor's degree or higher.
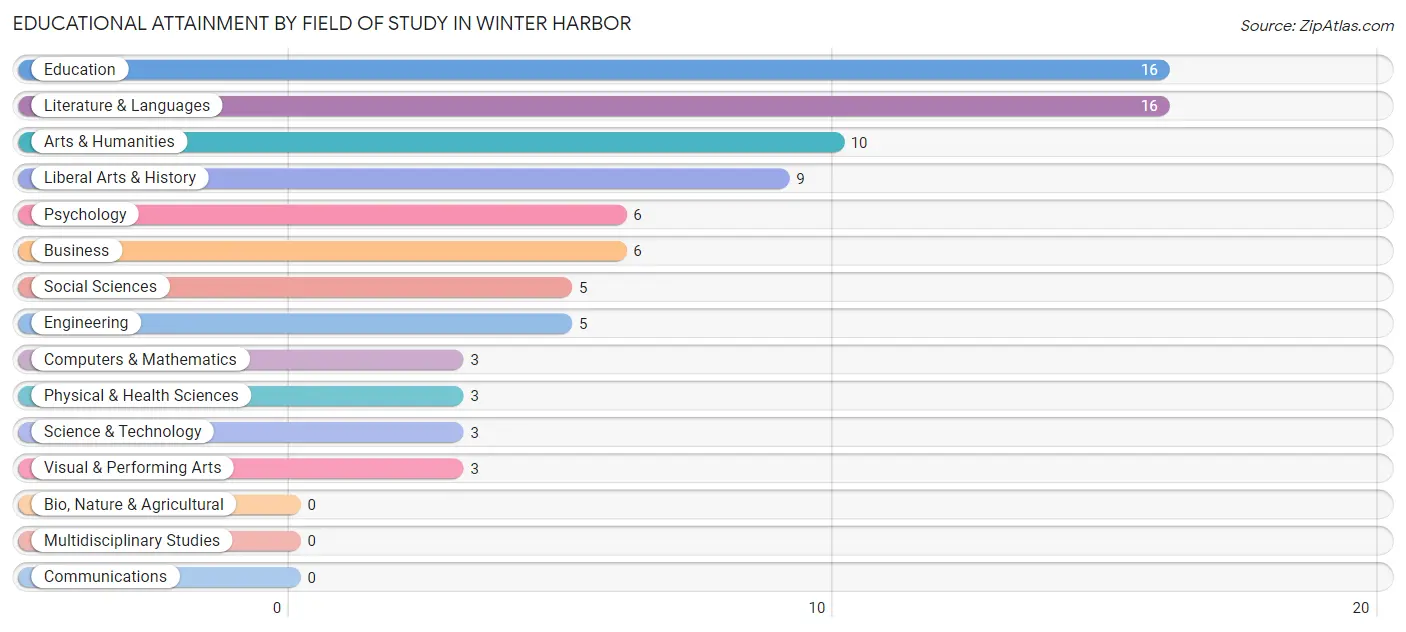
| Field of Study | # Graduates | % Graduates |
| Computers & Mathematics | 3 | 3.5% |
| Bio, Nature & Agricultural | 0 | 0.0% |
| Physical & Health Sciences | 3 | 3.5% |
| Psychology | 6 | 7.1% |
| Social Sciences | 5 | 5.9% |
| Engineering | 5 | 5.9% |
| Multidisciplinary Studies | 0 | 0.0% |
| Science & Technology | 3 | 3.5% |
| Business | 6 | 7.1% |
| Education | 16 | 18.8% |
| Literature & Languages | 16 | 18.8% |
| Liberal Arts & History | 9 | 10.6% |
| Visual & Performing Arts | 3 | 3.5% |
| Communications | 0 | 0.0% |
| Arts & Humanities | 10 | 11.8% |
| Total | 85 | 100.0% |
Transportation & Commute in Winter Harbor
Vehicle Availability by Sex in Winter Harbor
The most prevalent vehicle ownership categories in Winter Harbor are males with 2 vehicles (24, accounting for 57.1%) and females with 2 vehicles (18, making up 70.6%).
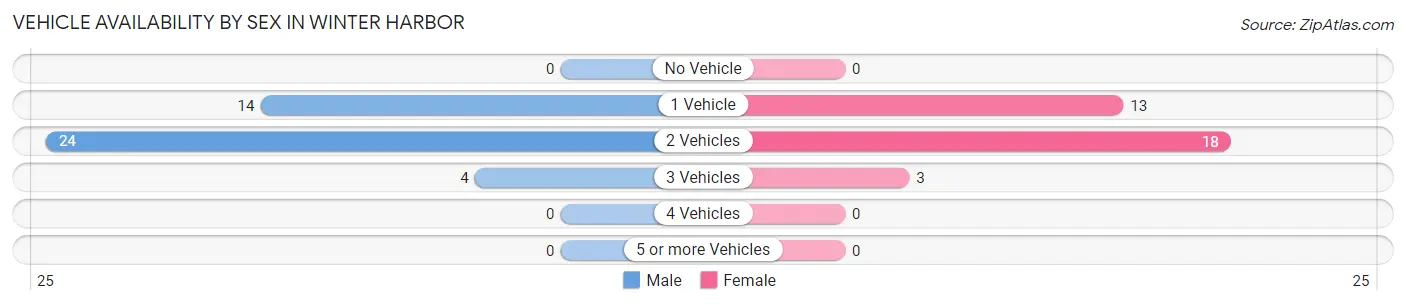
| Vehicles Available | Male | Female |
| No Vehicle | 0 (0.0%) | 0 (0.0%) |
| 1 Vehicle | 14 (33.3%) | 13 (38.2%) |
| 2 Vehicles | 24 (57.1%) | 18 (52.9%) |
| 3 Vehicles | 4 (9.5%) | 3 (8.8%) |
| 4 Vehicles | 0 (0.0%) | 0 (0.0%) |
| 5 or more Vehicles | 0 (0.0%) | 0 (0.0%) |
| Total | 42 (100.0%) | 34 (100.0%) |
Commute Time in Winter Harbor
The most frequently occuring commute durations in Winter Harbor are 10 to 14 minutes (32 commuters, 45.7%), 30 to 34 minutes (14 commuters, 20.0%), and 60 to 89 minutes (14 commuters, 20.0%).
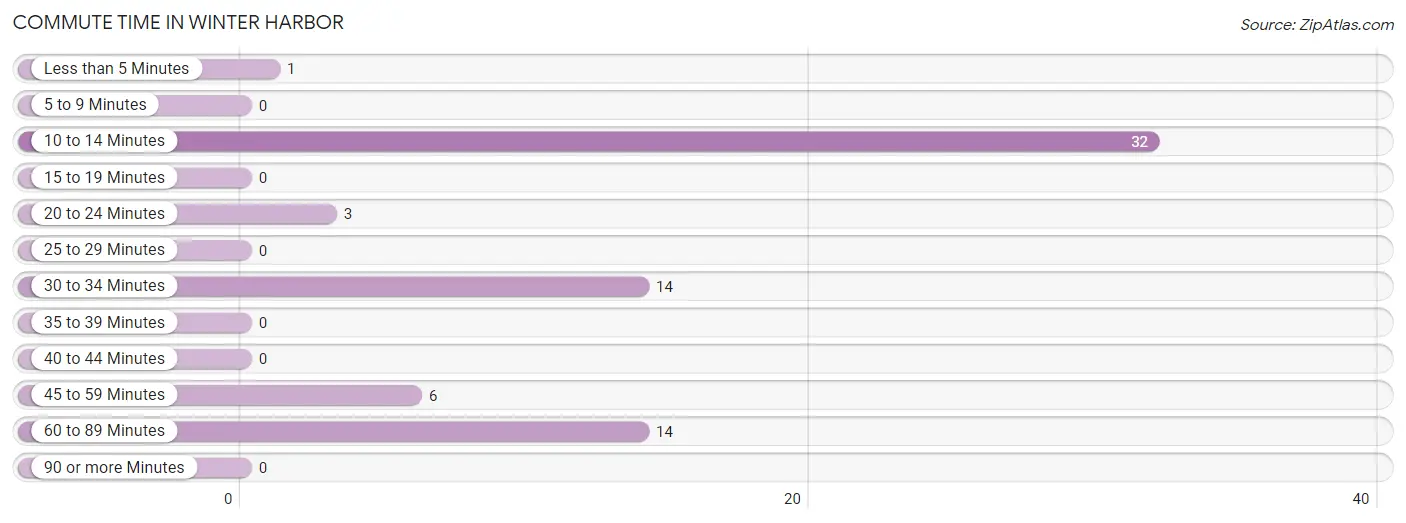
| Commute Time | # Commuters | % Commuters |
| Less than 5 Minutes | 1 | 1.4% |
| 5 to 9 Minutes | 0 | 0.0% |
| 10 to 14 Minutes | 32 | 45.7% |
| 15 to 19 Minutes | 0 | 0.0% |
| 20 to 24 Minutes | 3 | 4.3% |
| 25 to 29 Minutes | 0 | 0.0% |
| 30 to 34 Minutes | 14 | 20.0% |
| 35 to 39 Minutes | 0 | 0.0% |
| 40 to 44 Minutes | 0 | 0.0% |
| 45 to 59 Minutes | 6 | 8.6% |
| 60 to 89 Minutes | 14 | 20.0% |
| 90 or more Minutes | 0 | 0.0% |
Commute Time by Sex in Winter Harbor
The most common commute times in Winter Harbor are 10 to 14 minutes (16 commuters, 40.0%) for males and 10 to 14 minutes (16 commuters, 53.3%) for females.
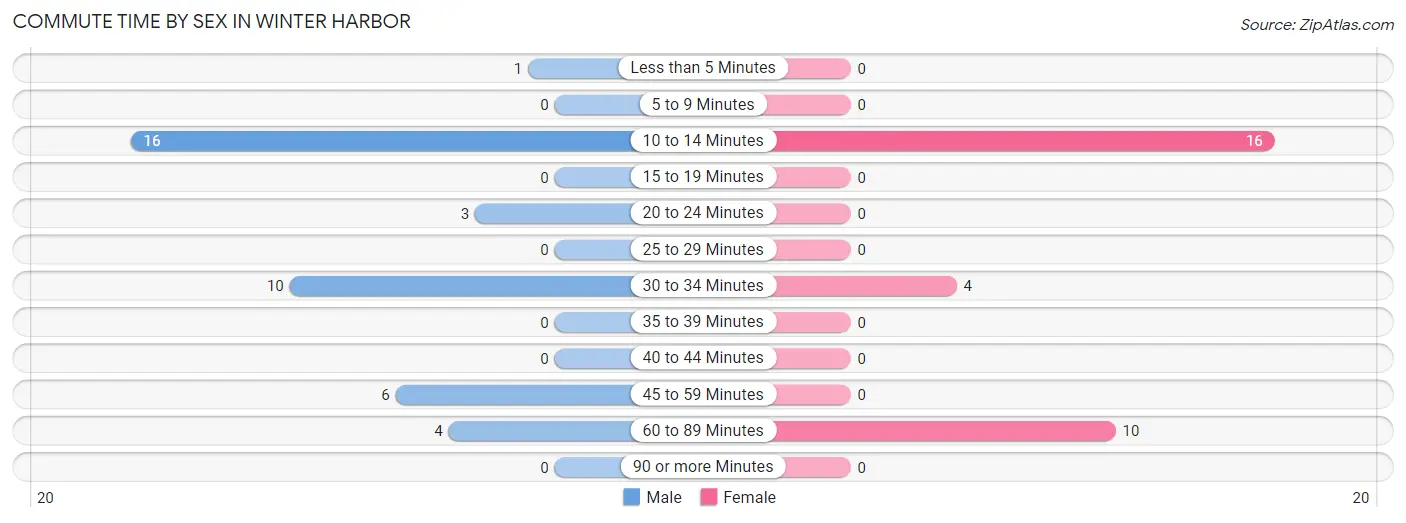
| Commute Time | Male | Female |
| Less than 5 Minutes | 1 (2.5%) | 0 (0.0%) |
| 5 to 9 Minutes | 0 (0.0%) | 0 (0.0%) |
| 10 to 14 Minutes | 16 (40.0%) | 16 (53.3%) |
| 15 to 19 Minutes | 0 (0.0%) | 0 (0.0%) |
| 20 to 24 Minutes | 3 (7.5%) | 0 (0.0%) |
| 25 to 29 Minutes | 0 (0.0%) | 0 (0.0%) |
| 30 to 34 Minutes | 10 (25.0%) | 4 (13.3%) |
| 35 to 39 Minutes | 0 (0.0%) | 0 (0.0%) |
| 40 to 44 Minutes | 0 (0.0%) | 0 (0.0%) |
| 45 to 59 Minutes | 6 (15.0%) | 0 (0.0%) |
| 60 to 89 Minutes | 4 (10.0%) | 10 (33.3%) |
| 90 or more Minutes | 0 (0.0%) | 0 (0.0%) |
Time of Departure to Work by Sex in Winter Harbor
The most frequent times of departure to work in Winter Harbor are 8:30 AM to 8:59 AM (16, 40.0%) for males and 8:00 AM to 8:29 AM (9, 30.0%) for females.
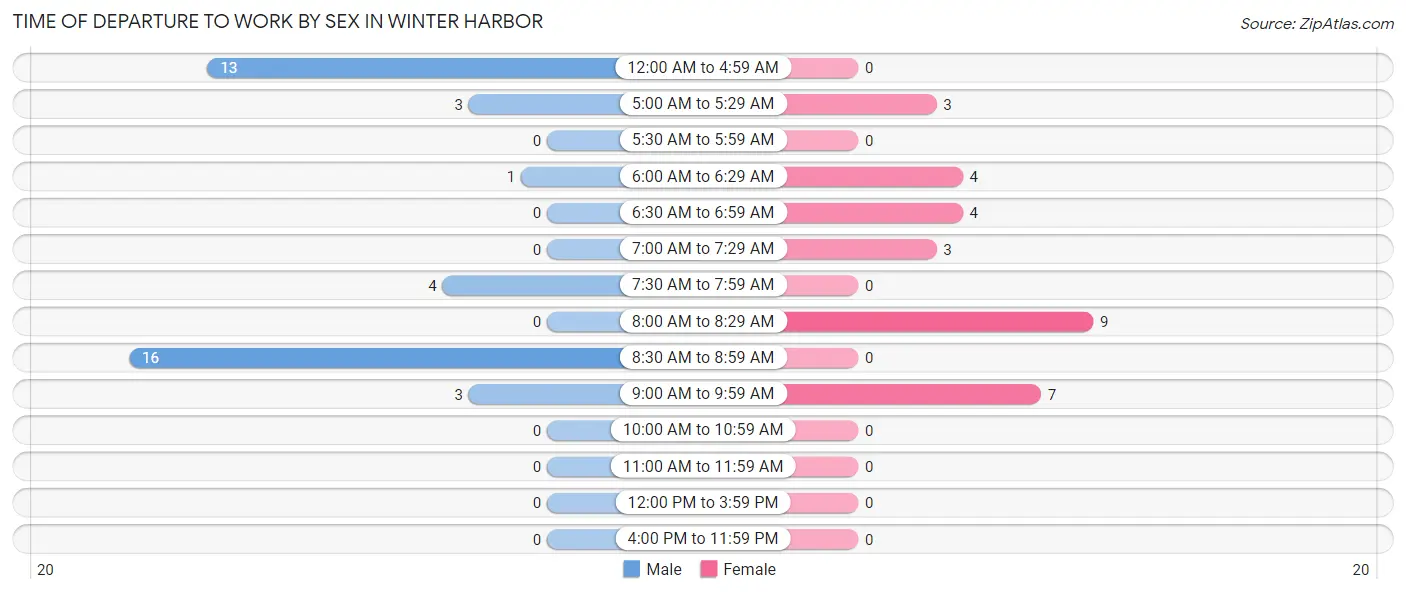
| Time of Departure | Male | Female |
| 12:00 AM to 4:59 AM | 13 (32.5%) | 0 (0.0%) |
| 5:00 AM to 5:29 AM | 3 (7.5%) | 3 (10.0%) |
| 5:30 AM to 5:59 AM | 0 (0.0%) | 0 (0.0%) |
| 6:00 AM to 6:29 AM | 1 (2.5%) | 4 (13.3%) |
| 6:30 AM to 6:59 AM | 0 (0.0%) | 4 (13.3%) |
| 7:00 AM to 7:29 AM | 0 (0.0%) | 3 (10.0%) |
| 7:30 AM to 7:59 AM | 4 (10.0%) | 0 (0.0%) |
| 8:00 AM to 8:29 AM | 0 (0.0%) | 9 (30.0%) |
| 8:30 AM to 8:59 AM | 16 (40.0%) | 0 (0.0%) |
| 9:00 AM to 9:59 AM | 3 (7.5%) | 7 (23.3%) |
| 10:00 AM to 10:59 AM | 0 (0.0%) | 0 (0.0%) |
| 11:00 AM to 11:59 AM | 0 (0.0%) | 0 (0.0%) |
| 12:00 PM to 3:59 PM | 0 (0.0%) | 0 (0.0%) |
| 4:00 PM to 11:59 PM | 0 (0.0%) | 0 (0.0%) |
| Total | 40 (100.0%) | 30 (100.0%) |
Housing Occupancy in Winter Harbor
Occupancy by Ownership in Winter Harbor
Of the total 173 dwellings in Winter Harbor, owner-occupied units account for 139 (80.3%), while renter-occupied units make up 34 (19.7%).
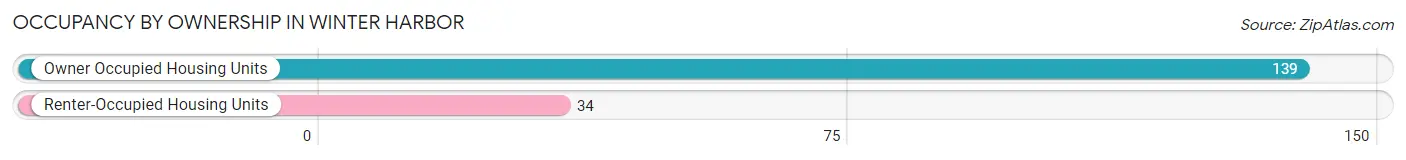
| Occupancy | # Housing Units | % Housing Units |
| Owner Occupied Housing Units | 139 | 80.3% |
| Renter-Occupied Housing Units | 34 | 19.7% |
| Total Occupied Housing Units | 173 | 100.0% |
Occupancy by Household Size in Winter Harbor
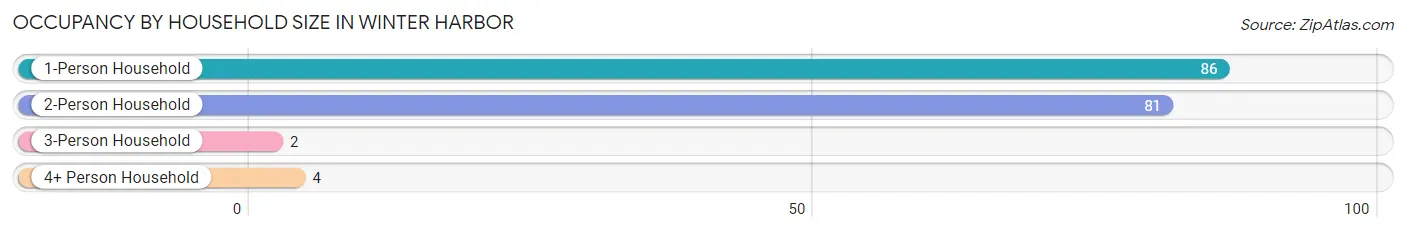
| Household Size | # Housing Units | % Housing Units |
| 1-Person Household | 86 | 49.7% |
| 2-Person Household | 81 | 46.8% |
| 3-Person Household | 2 | 1.2% |
| 4+ Person Household | 4 | 2.3% |
| Total Housing Units | 173 | 100.0% |
Occupancy by Ownership by Household Size in Winter Harbor
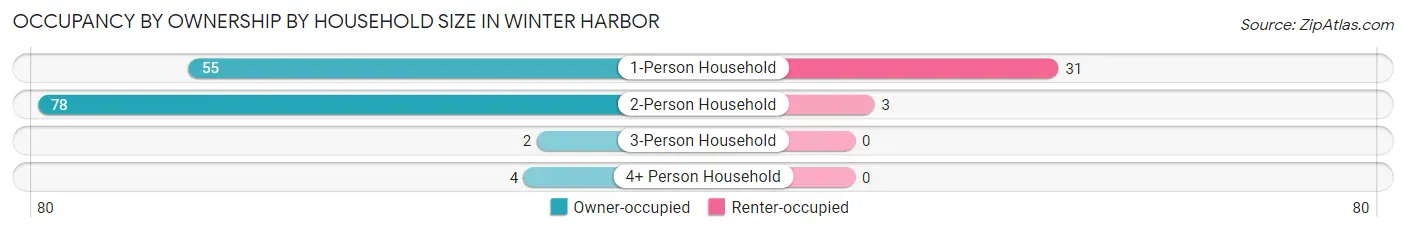
| Household Size | Owner-occupied | Renter-occupied |
| 1-Person Household | 55 (63.9%) | 31 (36.0%) |
| 2-Person Household | 78 (96.3%) | 3 (3.7%) |
| 3-Person Household | 2 (100.0%) | 0 (0.0%) |
| 4+ Person Household | 4 (100.0%) | 0 (0.0%) |
| Total Housing Units | 139 (80.3%) | 34 (19.7%) |
Occupancy by Educational Attainment in Winter Harbor
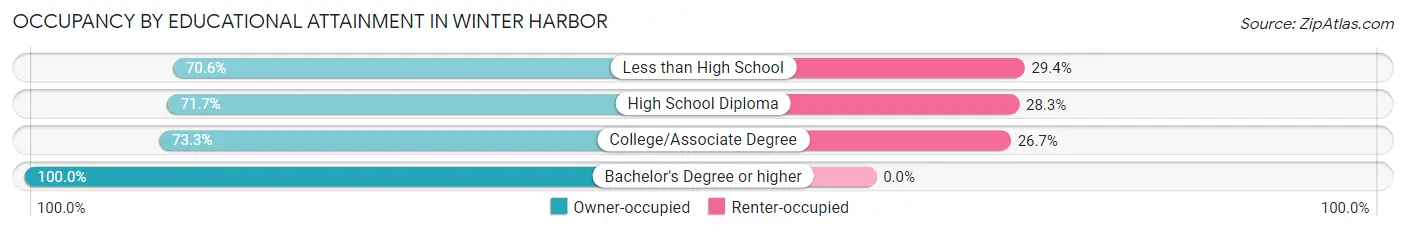
| Household Size | Owner-occupied | Renter-occupied |
| Less than High School | 12 (70.6%) | 5 (29.4%) |
| High School Diploma | 43 (71.7%) | 17 (28.3%) |
| College/Associate Degree | 33 (73.3%) | 12 (26.7%) |
| Bachelor's Degree or higher | 51 (100.0%) | 0 (0.0%) |
Occupancy by Age of Householder in Winter Harbor
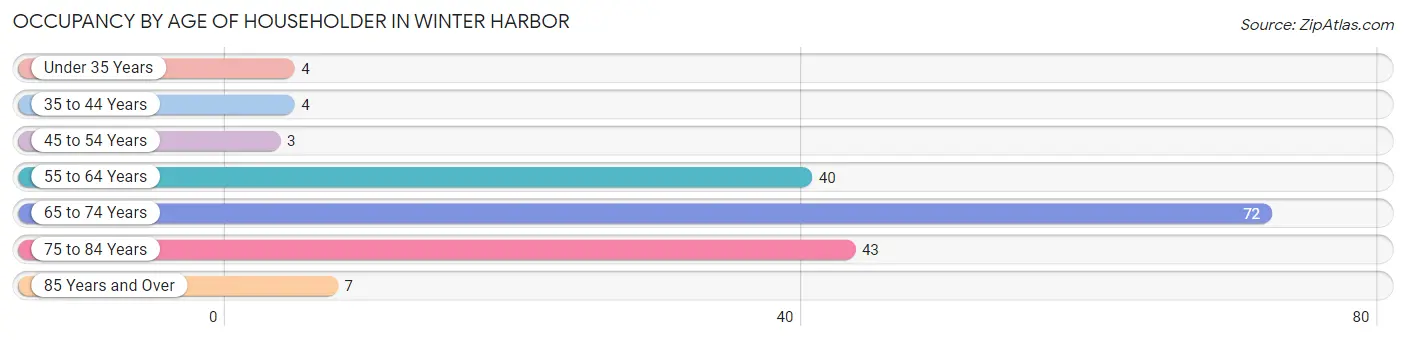
| Age Bracket | # Households | % Households |
| Under 35 Years | 4 | 2.3% |
| 35 to 44 Years | 4 | 2.3% |
| 45 to 54 Years | 3 | 1.7% |
| 55 to 64 Years | 40 | 23.1% |
| 65 to 74 Years | 72 | 41.6% |
| 75 to 84 Years | 43 | 24.9% |
| 85 Years and Over | 7 | 4.1% |
| Total | 173 | 100.0% |
Housing Finances in Winter Harbor
Median Income by Occupancy in Winter Harbor
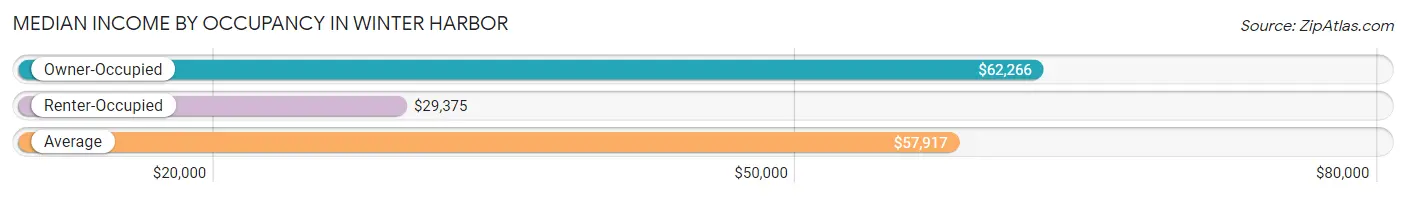
| Occupancy Type | # Households | Median Income |
| Owner-Occupied | 139 (80.3%) | $62,266 |
| Renter-Occupied | 34 (19.7%) | $29,375 |
| Average | 173 (100.0%) | $57,917 |
Occupancy by Householder Income Bracket in Winter Harbor
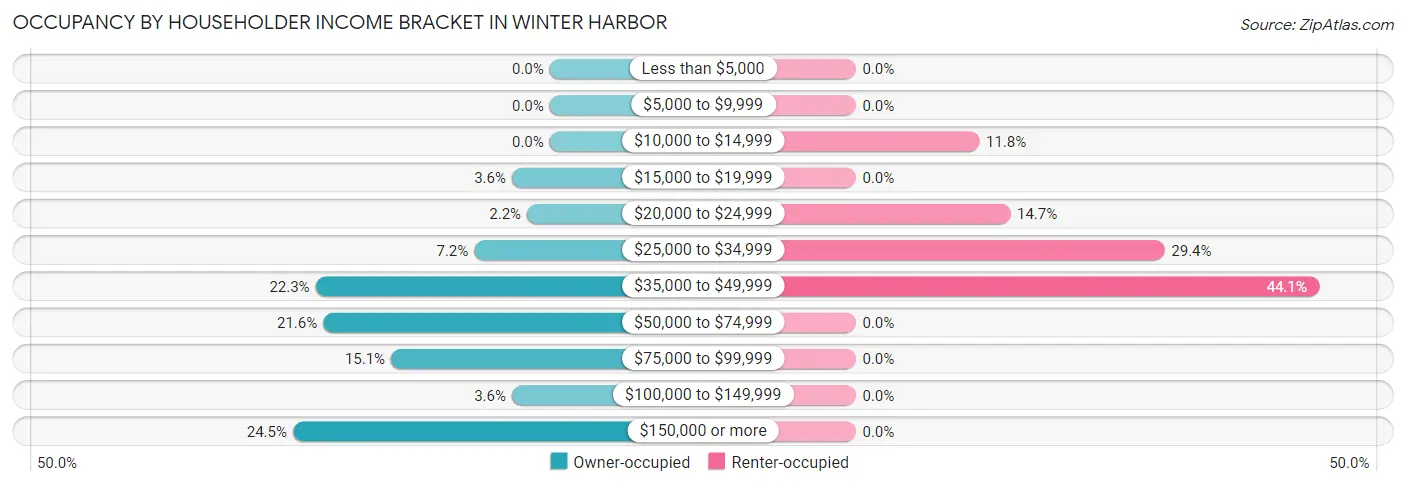
| Income Bracket | Owner-occupied | Renter-occupied |
| Less than $5,000 | 0 (0.0%) | 0 (0.0%) |
| $5,000 to $9,999 | 0 (0.0%) | 0 (0.0%) |
| $10,000 to $14,999 | 0 (0.0%) | 4 (11.8%) |
| $15,000 to $19,999 | 5 (3.6%) | 0 (0.0%) |
| $20,000 to $24,999 | 3 (2.2%) | 5 (14.7%) |
| $25,000 to $34,999 | 10 (7.2%) | 10 (29.4%) |
| $35,000 to $49,999 | 31 (22.3%) | 15 (44.1%) |
| $50,000 to $74,999 | 30 (21.6%) | 0 (0.0%) |
| $75,000 to $99,999 | 21 (15.1%) | 0 (0.0%) |
| $100,000 to $149,999 | 5 (3.6%) | 0 (0.0%) |
| $150,000 or more | 34 (24.5%) | 0 (0.0%) |
| Total | 139 (100.0%) | 34 (100.0%) |
Monthly Housing Cost Tiers in Winter Harbor
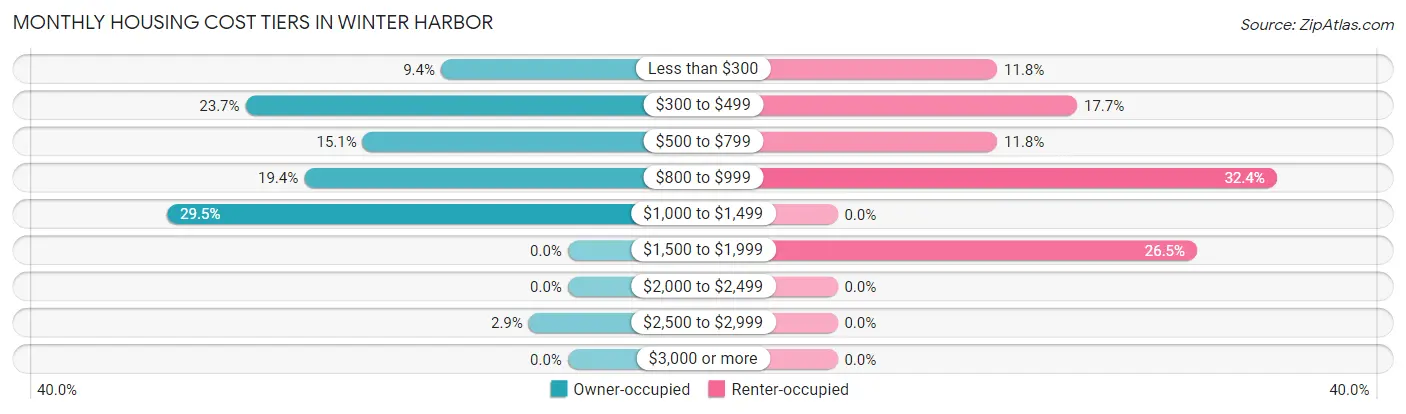
| Monthly Cost | Owner-occupied | Renter-occupied |
| Less than $300 | 13 (9.3%) | 4 (11.8%) |
| $300 to $499 | 33 (23.7%) | 6 (17.6%) |
| $500 to $799 | 21 (15.1%) | 4 (11.8%) |
| $800 to $999 | 27 (19.4%) | 11 (32.4%) |
| $1,000 to $1,499 | 41 (29.5%) | 0 (0.0%) |
| $1,500 to $1,999 | 0 (0.0%) | 9 (26.5%) |
| $2,000 to $2,499 | 0 (0.0%) | 0 (0.0%) |
| $2,500 to $2,999 | 4 (2.9%) | 0 (0.0%) |
| $3,000 or more | 0 (0.0%) | 0 (0.0%) |
| Total | 139 (100.0%) | 34 (100.0%) |
Physical Housing Characteristics in Winter Harbor
Housing Structures in Winter Harbor
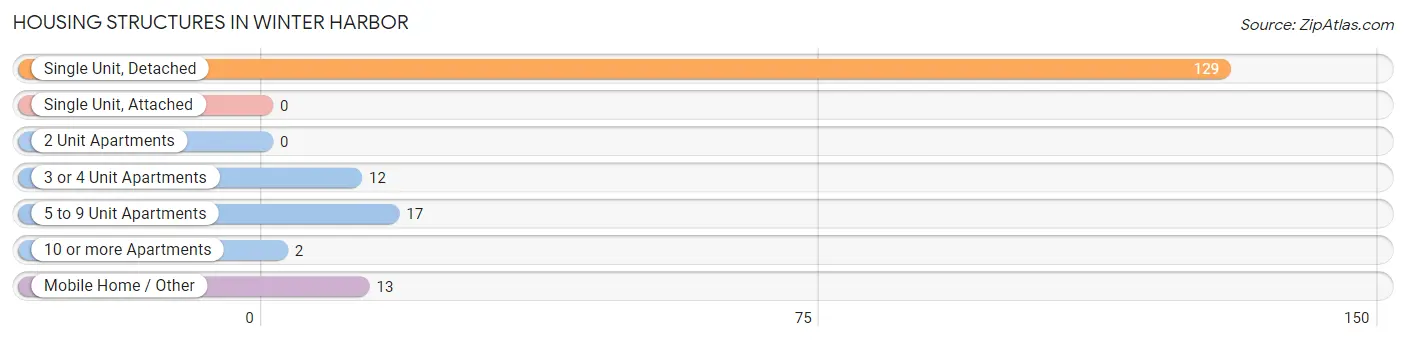
| Structure Type | # Housing Units | % Housing Units |
| Single Unit, Detached | 129 | 74.6% |
| Single Unit, Attached | 0 | 0.0% |
| 2 Unit Apartments | 0 | 0.0% |
| 3 or 4 Unit Apartments | 12 | 6.9% |
| 5 to 9 Unit Apartments | 17 | 9.8% |
| 10 or more Apartments | 2 | 1.2% |
| Mobile Home / Other | 13 | 7.5% |
| Total | 173 | 100.0% |
Housing Structures by Occupancy in Winter Harbor
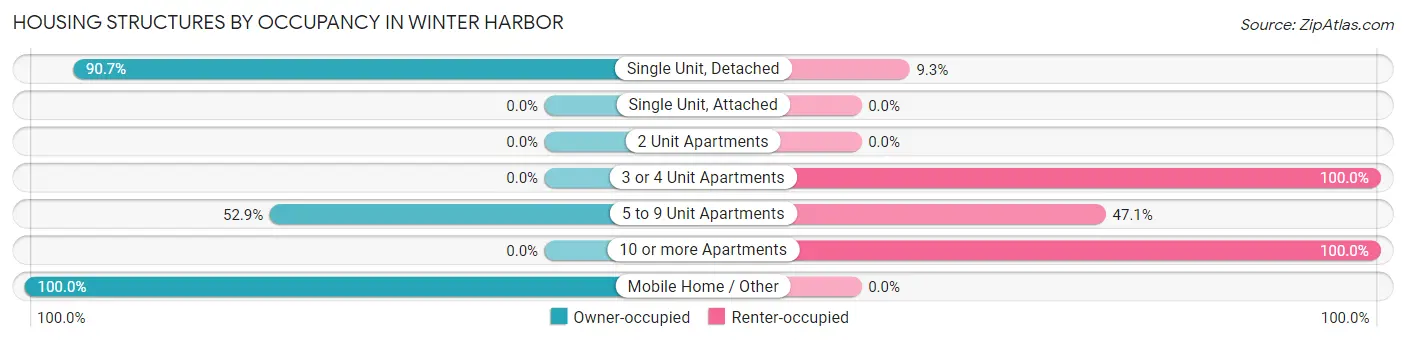
| Structure Type | Owner-occupied | Renter-occupied |
| Single Unit, Detached | 117 (90.7%) | 12 (9.3%) |
| Single Unit, Attached | 0 (0.0%) | 0 (0.0%) |
| 2 Unit Apartments | 0 (0.0%) | 0 (0.0%) |
| 3 or 4 Unit Apartments | 0 (0.0%) | 12 (100.0%) |
| 5 to 9 Unit Apartments | 9 (52.9%) | 8 (47.1%) |
| 10 or more Apartments | 0 (0.0%) | 2 (100.0%) |
| Mobile Home / Other | 13 (100.0%) | 0 (0.0%) |
| Total | 139 (80.3%) | 34 (19.7%) |
Housing Structures by Number of Rooms in Winter Harbor
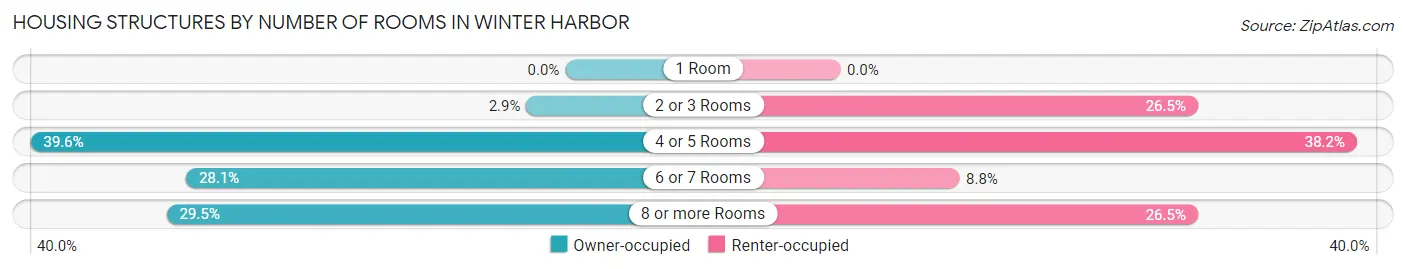
| Number of Rooms | Owner-occupied | Renter-occupied |
| 1 Room | 0 (0.0%) | 0 (0.0%) |
| 2 or 3 Rooms | 4 (2.9%) | 9 (26.5%) |
| 4 or 5 Rooms | 55 (39.6%) | 13 (38.2%) |
| 6 or 7 Rooms | 39 (28.1%) | 3 (8.8%) |
| 8 or more Rooms | 41 (29.5%) | 9 (26.5%) |
| Total | 139 (100.0%) | 34 (100.0%) |
Housing Structure by Heating Type in Winter Harbor
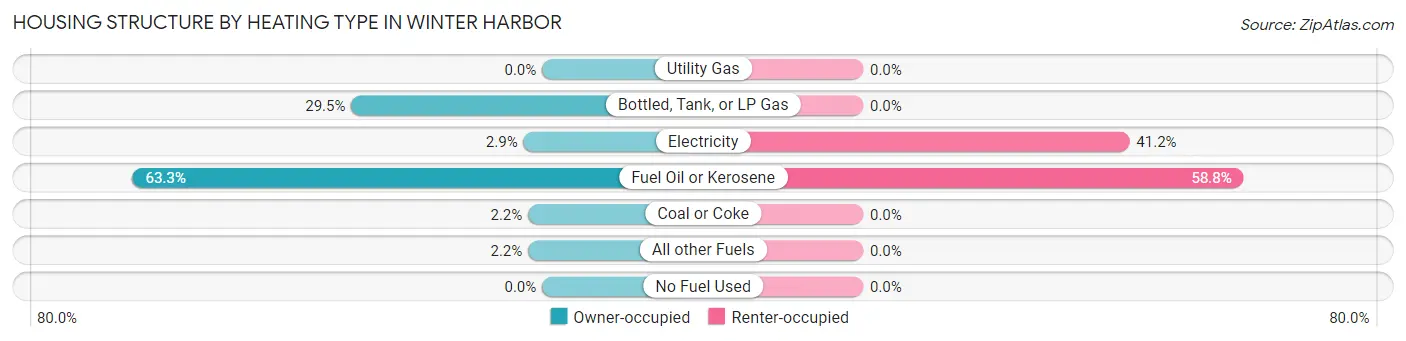
| Heating Type | Owner-occupied | Renter-occupied |
| Utility Gas | 0 (0.0%) | 0 (0.0%) |
| Bottled, Tank, or LP Gas | 41 (29.5%) | 0 (0.0%) |
| Electricity | 4 (2.9%) | 14 (41.2%) |
| Fuel Oil or Kerosene | 88 (63.3%) | 20 (58.8%) |
| Coal or Coke | 3 (2.2%) | 0 (0.0%) |
| All other Fuels | 3 (2.2%) | 0 (0.0%) |
| No Fuel Used | 0 (0.0%) | 0 (0.0%) |
| Total | 139 (100.0%) | 34 (100.0%) |
Household Vehicle Usage in Winter Harbor
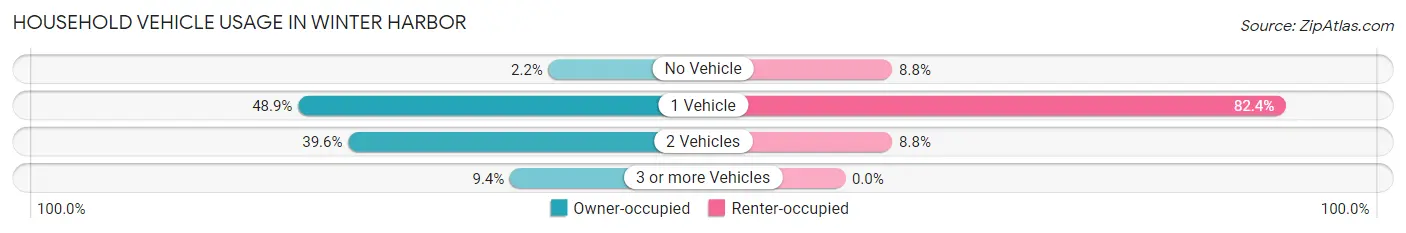
| Vehicles per Household | Owner-occupied | Renter-occupied |
| No Vehicle | 3 (2.2%) | 3 (8.8%) |
| 1 Vehicle | 68 (48.9%) | 28 (82.4%) |
| 2 Vehicles | 55 (39.6%) | 3 (8.8%) |
| 3 or more Vehicles | 13 (9.3%) | 0 (0.0%) |
| Total | 139 (100.0%) | 34 (100.0%) |
Real Estate & Mortgages in Winter Harbor
Real Estate and Mortgage Overview in Winter Harbor
| Characteristic | Without Mortgage | With Mortgage |
| Housing Units | 72 | 67 |
| Median Property Value | $163,100 | $180,800 |
| Median Household Income | - | - |
| Monthly Housing Costs | $429 | $0 |
| Real Estate Taxes | $1,333 | $0 |
Property Value by Mortgage Status in Winter Harbor
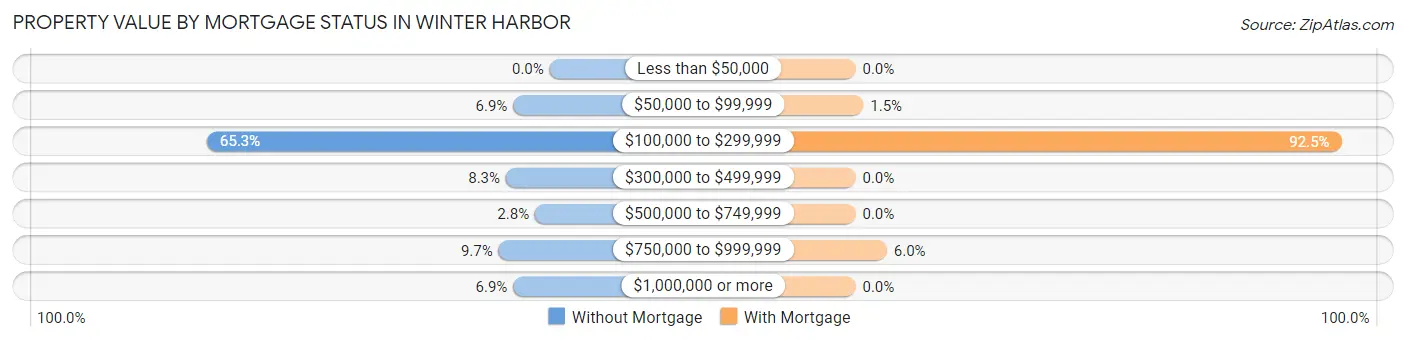
| Property Value | Without Mortgage | With Mortgage |
| Less than $50,000 | 0 (0.0%) | 0 (0.0%) |
| $50,000 to $99,999 | 5 (6.9%) | 1 (1.5%) |
| $100,000 to $299,999 | 47 (65.3%) | 62 (92.5%) |
| $300,000 to $499,999 | 6 (8.3%) | 0 (0.0%) |
| $500,000 to $749,999 | 2 (2.8%) | 0 (0.0%) |
| $750,000 to $999,999 | 7 (9.7%) | 4 (6.0%) |
| $1,000,000 or more | 5 (6.9%) | 0 (0.0%) |
| Total | 72 (100.0%) | 67 (100.0%) |
Household Income by Mortgage Status in Winter Harbor
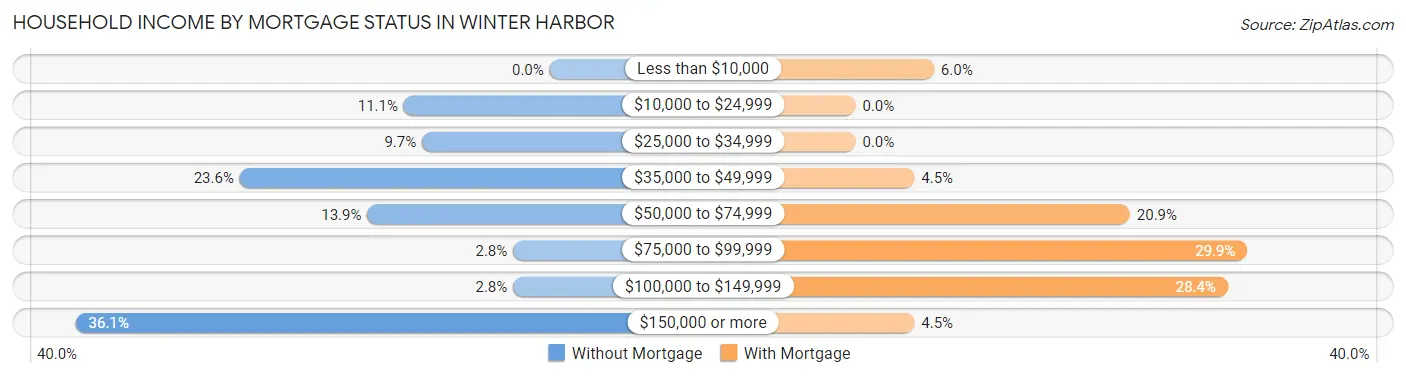
| Household Income | Without Mortgage | With Mortgage |
| Less than $10,000 | 0 (0.0%) | 4 (6.0%) |
| $10,000 to $24,999 | 8 (11.1%) | 0 (0.0%) |
| $25,000 to $34,999 | 7 (9.7%) | 0 (0.0%) |
| $35,000 to $49,999 | 17 (23.6%) | 3 (4.5%) |
| $50,000 to $74,999 | 10 (13.9%) | 14 (20.9%) |
| $75,000 to $99,999 | 2 (2.8%) | 20 (29.8%) |
| $100,000 to $149,999 | 2 (2.8%) | 19 (28.4%) |
| $150,000 or more | 26 (36.1%) | 3 (4.5%) |
| Total | 72 (100.0%) | 67 (100.0%) |
Property Value to Household Income Ratio in Winter Harbor
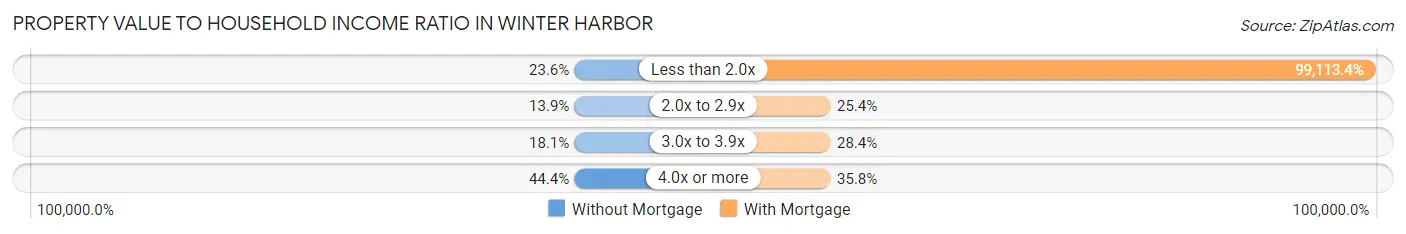
| Value-to-Income Ratio | Without Mortgage | With Mortgage |
| Less than 2.0x | 17 (23.6%) | 66,406 (99,113.4%) |
| 2.0x to 2.9x | 10 (13.9%) | 17 (25.4%) |
| 3.0x to 3.9x | 13 (18.1%) | 19 (28.4%) |
| 4.0x or more | 32 (44.4%) | 24 (35.8%) |
| Total | 72 (100.0%) | 67 (100.0%) |
Real Estate Taxes by Mortgage Status in Winter Harbor
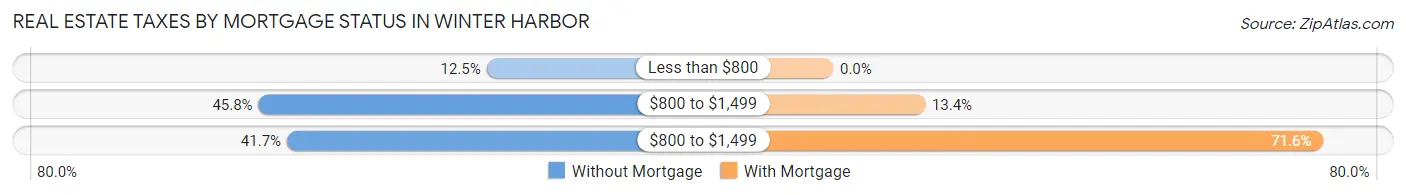
| Property Taxes | Without Mortgage | With Mortgage |
| Less than $800 | 9 (12.5%) | 0 (0.0%) |
| $800 to $1,499 | 33 (45.8%) | 9 (13.4%) |
| $800 to $1,499 | 30 (41.7%) | 48 (71.6%) |
| Total | 72 (100.0%) | 67 (100.0%) |
Health & Disability in Winter Harbor
Health Insurance Coverage by Age in Winter Harbor
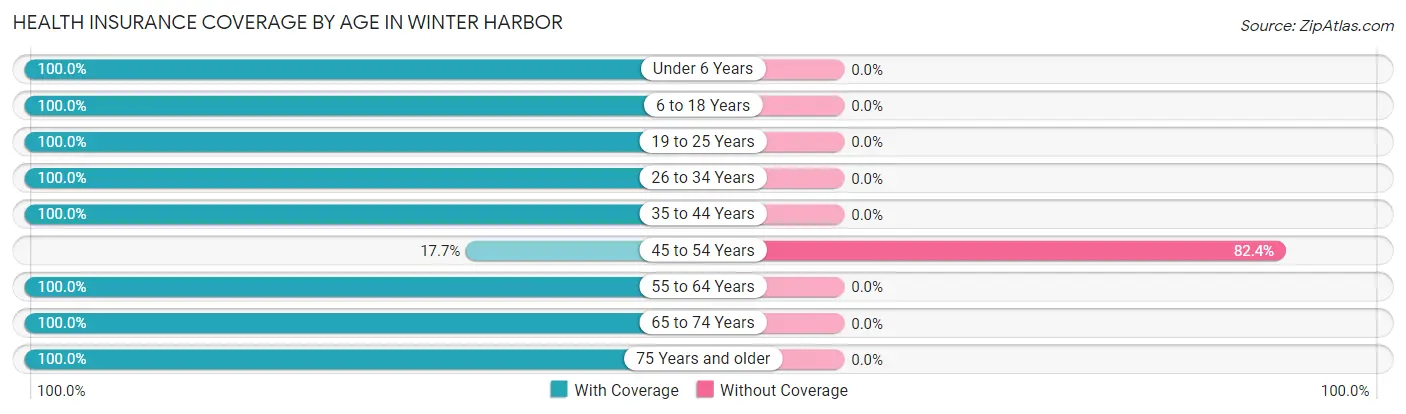
| Age Bracket | With Coverage | Without Coverage |
| Under 6 Years | 7 (100.0%) | 0 (0.0%) |
| 6 to 18 Years | 13 (100.0%) | 0 (0.0%) |
| 19 to 25 Years | 26 (100.0%) | 0 (0.0%) |
| 26 to 34 Years | 4 (100.0%) | 0 (0.0%) |
| 35 to 44 Years | 12 (100.0%) | 0 (0.0%) |
| 45 to 54 Years | 3 (17.6%) | 14 (82.4%) |
| 55 to 64 Years | 55 (100.0%) | 0 (0.0%) |
| 65 to 74 Years | 106 (100.0%) | 0 (0.0%) |
| 75 Years and older | 75 (100.0%) | 0 (0.0%) |
| Total | 301 (95.6%) | 14 (4.4%) |
Health Insurance Coverage by Citizenship Status in Winter Harbor
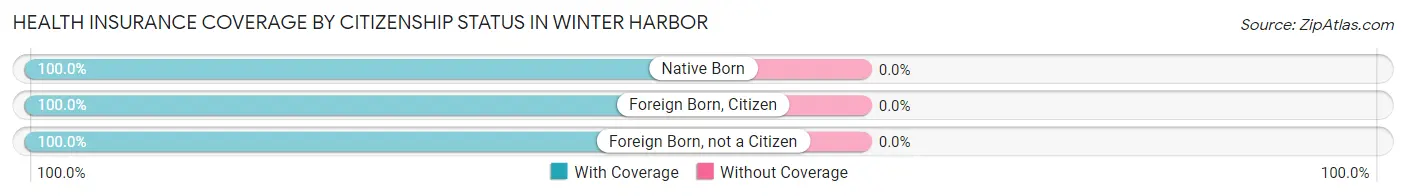
| Citizenship Status | With Coverage | Without Coverage |
| Native Born | 7 (100.0%) | 0 (0.0%) |
| Foreign Born, Citizen | 13 (100.0%) | 0 (0.0%) |
| Foreign Born, not a Citizen | 26 (100.0%) | 0 (0.0%) |
Health Insurance Coverage by Household Income in Winter Harbor
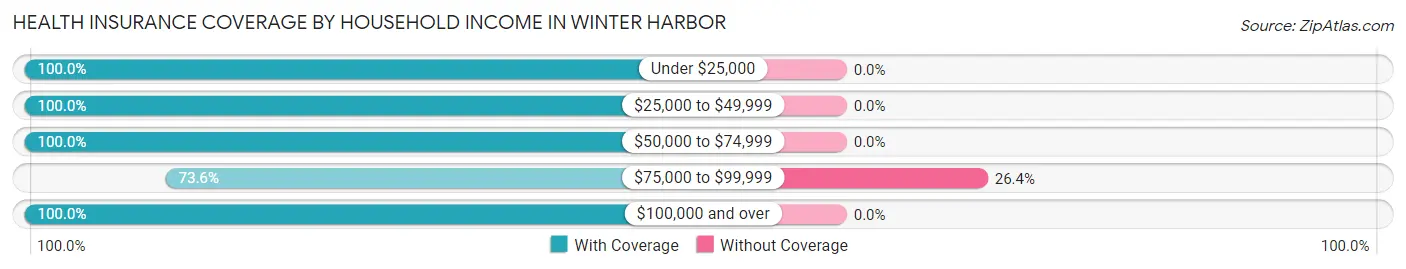
| Household Income | With Coverage | Without Coverage |
| Under $25,000 | 17 (100.0%) | 0 (0.0%) |
| $25,000 to $49,999 | 76 (100.0%) | 0 (0.0%) |
| $50,000 to $74,999 | 54 (100.0%) | 0 (0.0%) |
| $75,000 to $99,999 | 39 (73.6%) | 14 (26.4%) |
| $100,000 and over | 115 (100.0%) | 0 (0.0%) |
Public vs Private Health Insurance Coverage by Age in Winter Harbor
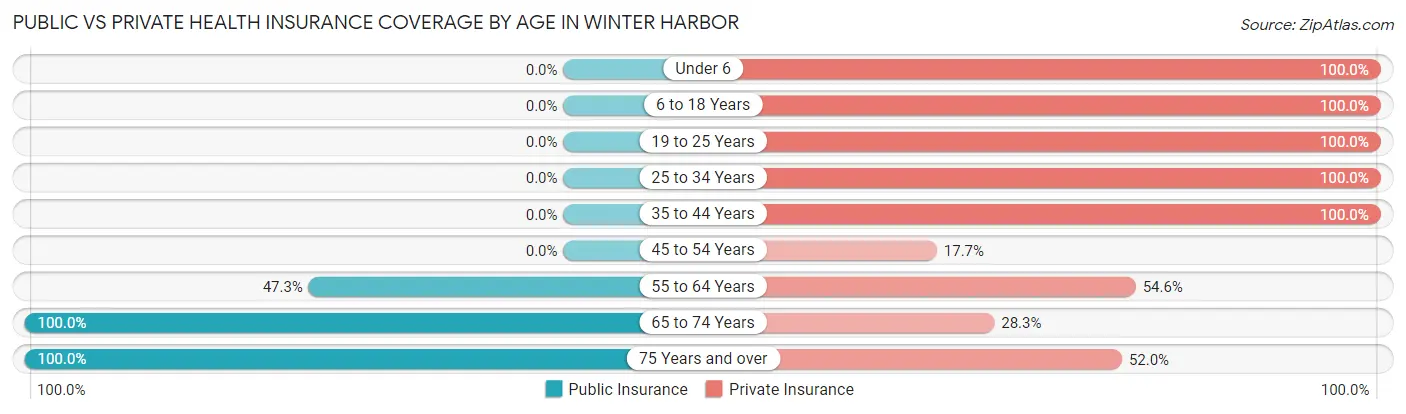
| Age Bracket | Public Insurance | Private Insurance |
| Under 6 | 0 (0.0%) | 7 (100.0%) |
| 6 to 18 Years | 0 (0.0%) | 13 (100.0%) |
| 19 to 25 Years | 0 (0.0%) | 26 (100.0%) |
| 25 to 34 Years | 0 (0.0%) | 4 (100.0%) |
| 35 to 44 Years | 0 (0.0%) | 12 (100.0%) |
| 45 to 54 Years | 0 (0.0%) | 3 (17.6%) |
| 55 to 64 Years | 26 (47.3%) | 30 (54.5%) |
| 65 to 74 Years | 106 (100.0%) | 30 (28.3%) |
| 75 Years and over | 75 (100.0%) | 39 (52.0%) |
| Total | 207 (65.7%) | 164 (52.1%) |
Disability Status by Sex by Age in Winter Harbor
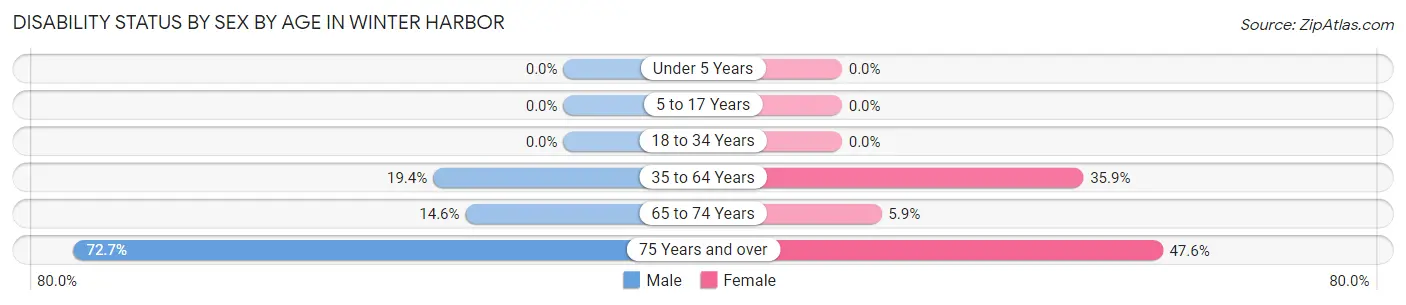
| Age Bracket | Male | Female |
| Under 5 Years | 0 (0.0%) | 0 (0.0%) |
| 5 to 17 Years | 0 (0.0%) | 0 (0.0%) |
| 18 to 34 Years | 0 (0.0%) | 0 (0.0%) |
| 35 to 64 Years | 6 (19.4%) | 19 (35.8%) |
| 65 to 74 Years | 8 (14.5%) | 3 (5.9%) |
| 75 Years and over | 24 (72.7%) | 20 (47.6%) |
Disability Class by Sex by Age in Winter Harbor
Disability Class: Hearing Difficulty
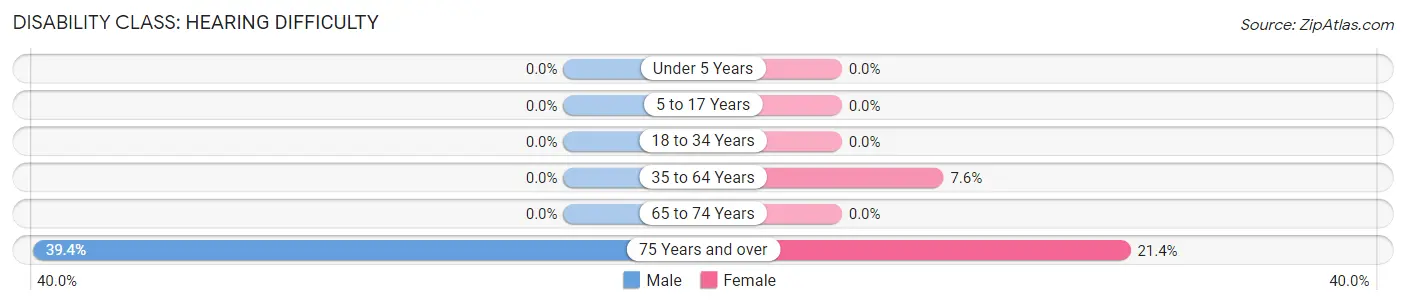
| Age Bracket | Male | Female |
| Under 5 Years | 0 (0.0%) | 0 (0.0%) |
| 5 to 17 Years | 0 (0.0%) | 0 (0.0%) |
| 18 to 34 Years | 0 (0.0%) | 0 (0.0%) |
| 35 to 64 Years | 0 (0.0%) | 4 (7.5%) |
| 65 to 74 Years | 0 (0.0%) | 0 (0.0%) |
| 75 Years and over | 13 (39.4%) | 9 (21.4%) |
Disability Class: Vision Difficulty
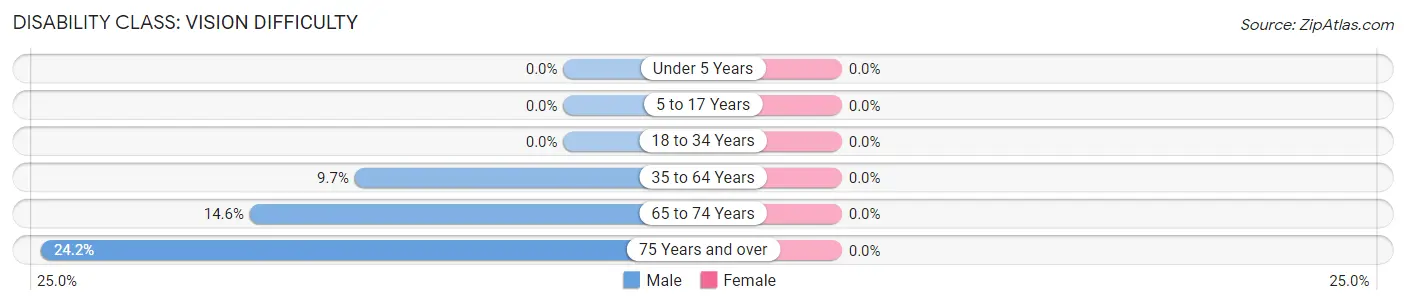
| Age Bracket | Male | Female |
| Under 5 Years | 0 (0.0%) | 0 (0.0%) |
| 5 to 17 Years | 0 (0.0%) | 0 (0.0%) |
| 18 to 34 Years | 0 (0.0%) | 0 (0.0%) |
| 35 to 64 Years | 3 (9.7%) | 0 (0.0%) |
| 65 to 74 Years | 8 (14.5%) | 0 (0.0%) |
| 75 Years and over | 8 (24.2%) | 0 (0.0%) |
Disability Class: Cognitive Difficulty
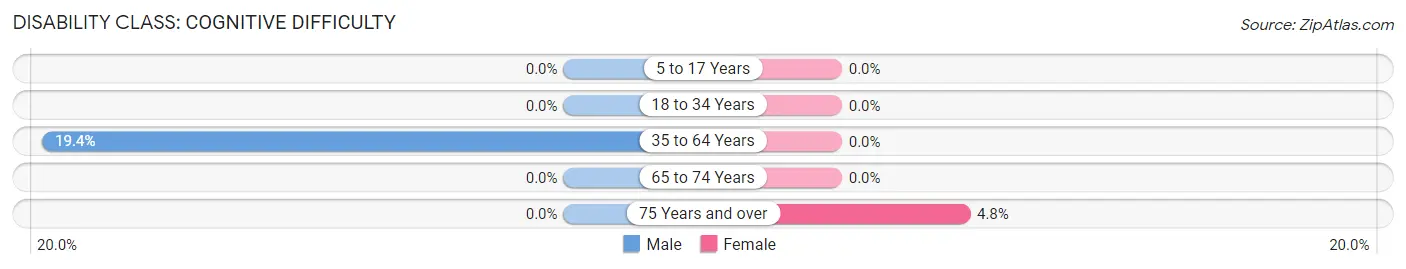
| Age Bracket | Male | Female |
| 5 to 17 Years | 0 (0.0%) | 0 (0.0%) |
| 18 to 34 Years | 0 (0.0%) | 0 (0.0%) |
| 35 to 64 Years | 6 (19.4%) | 0 (0.0%) |
| 65 to 74 Years | 0 (0.0%) | 0 (0.0%) |
| 75 Years and over | 0 (0.0%) | 2 (4.8%) |
Disability Class: Ambulatory Difficulty
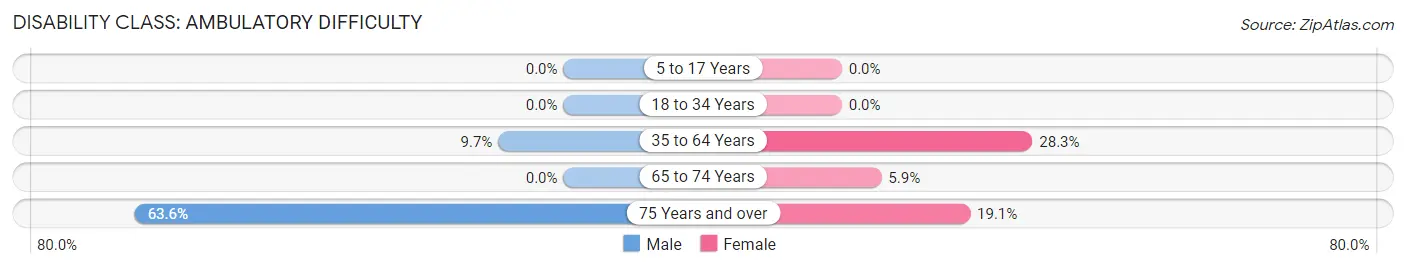
| Age Bracket | Male | Female |
| 5 to 17 Years | 0 (0.0%) | 0 (0.0%) |
| 18 to 34 Years | 0 (0.0%) | 0 (0.0%) |
| 35 to 64 Years | 3 (9.7%) | 15 (28.3%) |
| 65 to 74 Years | 0 (0.0%) | 3 (5.9%) |
| 75 Years and over | 21 (63.6%) | 8 (19.1%) |
Disability Class: Self-Care Difficulty
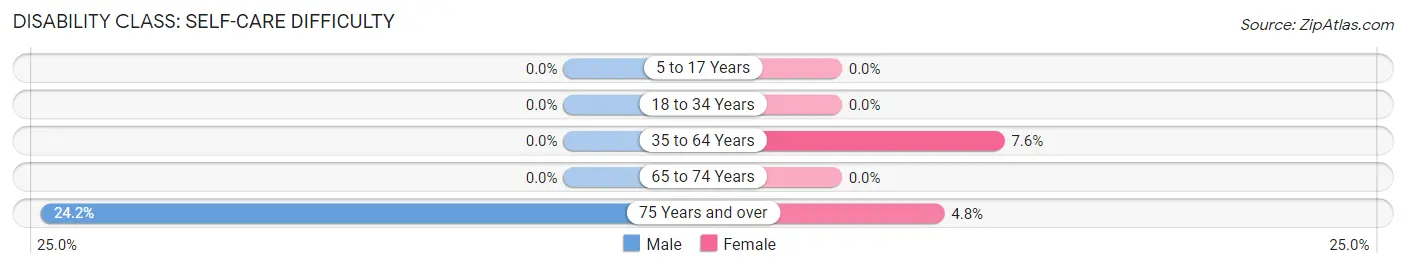
| Age Bracket | Male | Female |
| 5 to 17 Years | 0 (0.0%) | 0 (0.0%) |
| 18 to 34 Years | 0 (0.0%) | 0 (0.0%) |
| 35 to 64 Years | 0 (0.0%) | 4 (7.5%) |
| 65 to 74 Years | 0 (0.0%) | 0 (0.0%) |
| 75 Years and over | 8 (24.2%) | 2 (4.8%) |
Technology Access in Winter Harbor
Computing Device Access in Winter Harbor
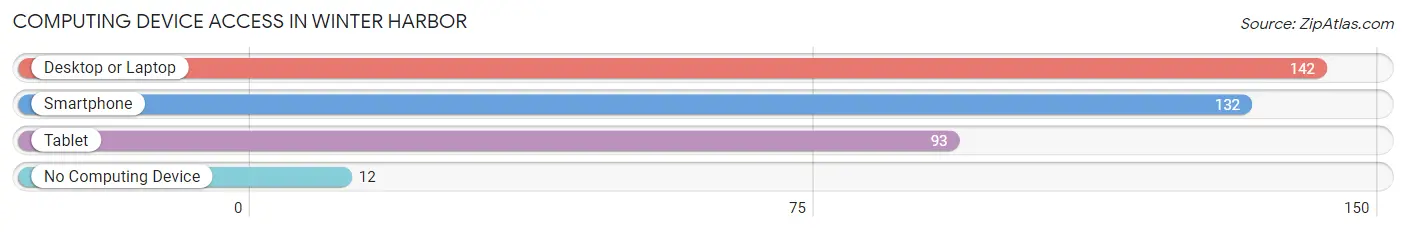
| Device Type | # Households | % Households |
| Desktop or Laptop | 142 | 82.1% |
| Smartphone | 132 | 76.3% |
| Tablet | 93 | 53.8% |
| No Computing Device | 12 | 6.9% |
| Total | 173 | 100.0% |
Internet Access in Winter Harbor
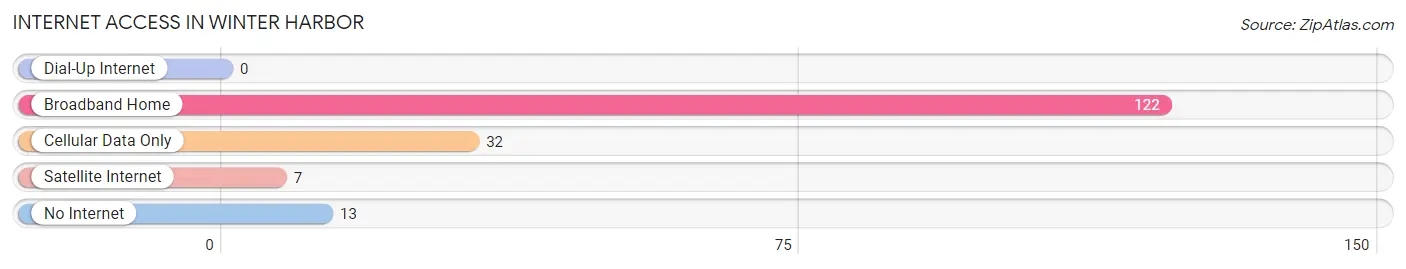
| Internet Type | # Households | % Households |
| Dial-Up Internet | 0 | 0.0% |
| Broadband Home | 122 | 70.5% |
| Cellular Data Only | 32 | 18.5% |
| Satellite Internet | 7 | 4.1% |
| No Internet | 13 | 7.5% |
| Total | 173 | 100.0% |
Winter Harbor Summary
History
The town of Winter Harbor, Maine is located on the Schoodic Peninsula in Hancock County. It is a small fishing village that was first settled in the early 1800s. The town was originally called “Little River” and was part of the town of Gouldsboro. In 1845, the town was incorporated as Winter Harbor.
The town was originally a fishing and farming community, with the main industry being the harvesting of herring. The herring industry was so successful that it was the main source of income for the town. In the late 1800s, the herring industry began to decline and the town began to focus on other industries such as lumber and shipbuilding.
The town was also home to a number of shipyards, which built many of the ships that sailed the Atlantic Ocean. The town was also home to a number of wharves, which were used to load and unload cargo.
In the early 1900s, the town began to focus on tourism. The town was home to a number of hotels and resorts, which attracted visitors from all over the world. The town was also home to a number of summer camps, which were popular with families.
The town was also home to a number of artists, who were attracted to the area for its natural beauty. The town was also home to a number of writers, who were inspired by the area’s natural beauty.
Geography
Winter Harbor is located on the Schoodic Peninsula in Hancock County, Maine. The town is located on the eastern side of the peninsula, which is bordered by Frenchman Bay to the north and the Atlantic Ocean to the south. The town is located approximately 25 miles from the city of Ellsworth.
The town is located on a peninsula, which is surrounded by water on three sides. The town is located on a small island, which is connected to the mainland by a bridge. The town is located on a small harbor, which is protected from the ocean by a breakwater.
The town is located in a rural area, which is surrounded by forests and mountains. The town is located in a temperate climate, which is characterized by mild winters and warm summers.
Economy
The economy of Winter Harbor is largely based on tourism and fishing. The town is home to a number of hotels and resorts, which attract visitors from all over the world. The town is also home to a number of summer camps, which are popular with families.
The town is also home to a number of fishing boats, which are used to harvest herring, lobster, and other seafood. The town is also home to a number of seafood processing plants, which process the seafood for sale.
The town is also home to a number of artists, who are attracted to the area for its natural beauty. The town is also home to a number of writers, who are inspired by the area’s natural beauty.
Demographics
As of the 2010 census, the town of Winter Harbor had a population of 1,092. The population is largely white (97.2%), with a small percentage of African Americans (1.2%) and Native Americans (0.7%). The median age of the population is 44.7 years.
The median household income in the town is $41,250, and the median family income is $50,000. The town has a poverty rate of 11.2%, which is slightly higher than the national average.
Conclusion
Winter Harbor, Maine is a small fishing village located on the Schoodic Peninsula in Hancock County. The town was originally a fishing and farming community, but has since shifted its focus to tourism and fishing. The town is home to a number of hotels and resorts, which attract visitors from all over the world. The town is also home to a number of artists, writers, and fishermen, who are attracted to the area for its natural beauty. The town has a population of 1,092, with a median household income of $41,250 and a poverty rate of 11.2%.
Common Questions
What is Per Capita Income in Winter Harbor?
Per Capita income in Winter Harbor is $42,992.
What is the Median Family Income in Winter Harbor?
Median Family Income in Winter Harbor is $93,500.
What is the Median Household income in Winter Harbor?
Median Household Income in Winter Harbor is $57,917.
What is Inequality or Gini Index in Winter Harbor?
Inequality or Gini Index in Winter Harbor is 0.40.
What is the Total Population of Winter Harbor?
Total Population of Winter Harbor is 315.
What is the Total Male Population of Winter Harbor?
Total Male Population of Winter Harbor is 127.
What is the Total Female Population of Winter Harbor?
Total Female Population of Winter Harbor is 188.
What is the Ratio of Males per 100 Females in Winter Harbor?
There are 67.55 Males per 100 Females in Winter Harbor.
What is the Ratio of Females per 100 Males in Winter Harbor?
There are 148.03 Females per 100 Males in Winter Harbor.
What is the Median Population Age in Winter Harbor?
Median Population Age in Winter Harbor is 68.0 Years.
What is the Average Family Size in Winter Harbor
Average Family Size in Winter Harbor is 2.8 People.
What is the Average Household Size in Winter Harbor
Average Household Size in Winter Harbor is 1.8 People.
How Large is the Labor Force in Winter Harbor?
There are 76 People in the Labor Forcein in Winter Harbor.
What is the Percentage of People in the Labor Force in Winter Harbor?
25.8% of People are in the Labor Force in Winter Harbor.