Saco, ME Map & Demographics
Saco Map
Saco Overview
$45,129
PER CAPITA INCOME
$108,489
AVG FAMILY INCOME
$81,326
AVG HOUSEHOLD INCOME
18.9%
WAGE / INCOME GAP [ % ]
81.1¢/ $1
WAGE / INCOME GAP [ $ ]
0.41
INEQUALITY / GINI INDEX
20,446
TOTAL POPULATION
10,006
MALE POPULATION
10,440
FEMALE POPULATION
95.84
MALES / 100 FEMALES
104.34
FEMALES / 100 MALES
43.2
MEDIAN AGE
2.8
AVG FAMILY SIZE
2.3
AVG HOUSEHOLD SIZE
12,484
LABOR FORCE [ PEOPLE ]
72.2%
PERCENT IN LABOR FORCE
1.1%
UNEMPLOYMENT RATE
Saco Zip Codes
Saco Area Codes
Income in Saco
Income Overview in Saco
Per Capita Income in Saco is $45,129, while median incomes of families and households are $108,489 and $81,326 respectively.
| Characteristic | Number | Measure |
| Per Capita Income | 20,446 | $45,129 |
| Median Family Income | 5,360 | $108,489 |
| Mean Family Income | 5,360 | $126,451 |
| Median Household Income | 8,872 | $81,326 |
| Mean Household Income | 8,872 | $102,731 |
| Income Deficit | 5,360 | $0 |
| Wage / Income Gap (%) | 20,446 | 18.89% |
| Wage / Income Gap ($) | 20,446 | 81.11¢ per $1 |
| Gini / Inequality Index | 20,446 | 0.41 |
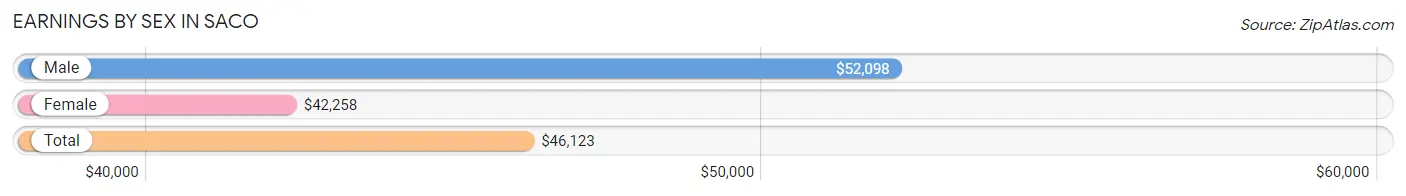
Earnings by Sex in Saco
Average Earnings in Saco are $46,123, $52,098 for men and $42,258 for women, a difference of 18.9%.
| Sex | Number | Average Earnings |
| Male | 6,529 (50.4%) | $52,098 |
| Female | 6,429 (49.6%) | $42,258 |
| Total | 12,958 (100.0%) | $46,123 |
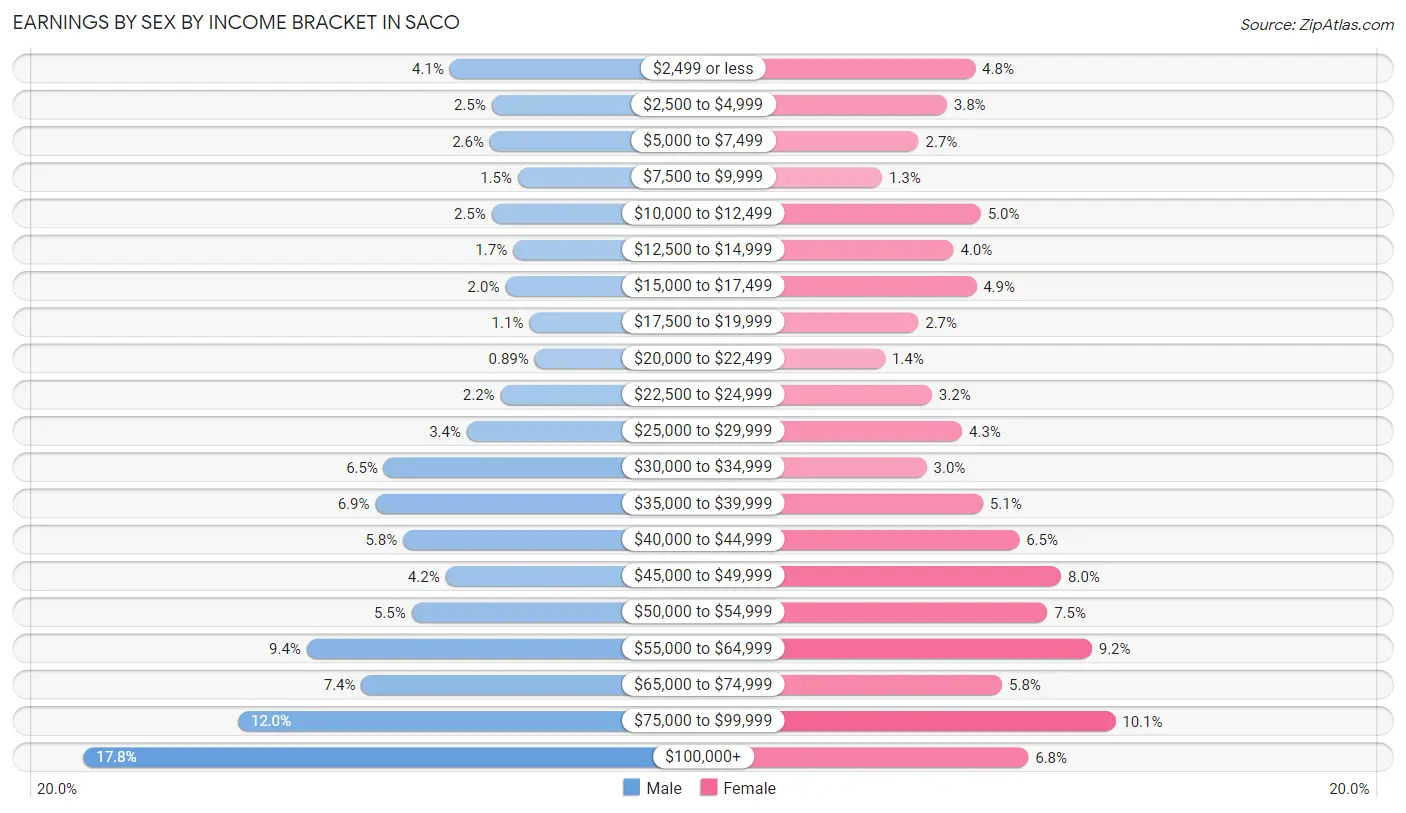
Earnings by Sex by Income Bracket in Saco
The most common earnings brackets in Saco are $100,000+ for men (1,162 | 17.8%) and $75,000 to $99,999 for women (647 | 10.1%).
| Income | Male | Female |
| $2,499 or less | 266 (4.1%) | 309 (4.8%) |
| $2,500 to $4,999 | 163 (2.5%) | 241 (3.7%) |
| $5,000 to $7,499 | 168 (2.6%) | 173 (2.7%) |
| $7,500 to $9,999 | 99 (1.5%) | 85 (1.3%) |
| $10,000 to $12,499 | 163 (2.5%) | 323 (5.0%) |
| $12,500 to $14,999 | 111 (1.7%) | 257 (4.0%) |
| $15,000 to $17,499 | 130 (2.0%) | 312 (4.9%) |
| $17,500 to $19,999 | 71 (1.1%) | 172 (2.7%) |
| $20,000 to $22,499 | 58 (0.9%) | 92 (1.4%) |
| $22,500 to $24,999 | 142 (2.2%) | 205 (3.2%) |
| $25,000 to $29,999 | 224 (3.4%) | 278 (4.3%) |
| $30,000 to $34,999 | 427 (6.5%) | 192 (3.0%) |
| $35,000 to $39,999 | 448 (6.9%) | 328 (5.1%) |
| $40,000 to $44,999 | 380 (5.8%) | 415 (6.5%) |
| $45,000 to $49,999 | 276 (4.2%) | 516 (8.0%) |
| $50,000 to $54,999 | 359 (5.5%) | 483 (7.5%) |
| $55,000 to $64,999 | 616 (9.4%) | 590 (9.2%) |
| $65,000 to $74,999 | 482 (7.4%) | 374 (5.8%) |
| $75,000 to $99,999 | 784 (12.0%) | 647 (10.1%) |
| $100,000+ | 1,162 (17.8%) | 437 (6.8%) |
| Total | 6,529 (100.0%) | 6,429 (100.0%) |
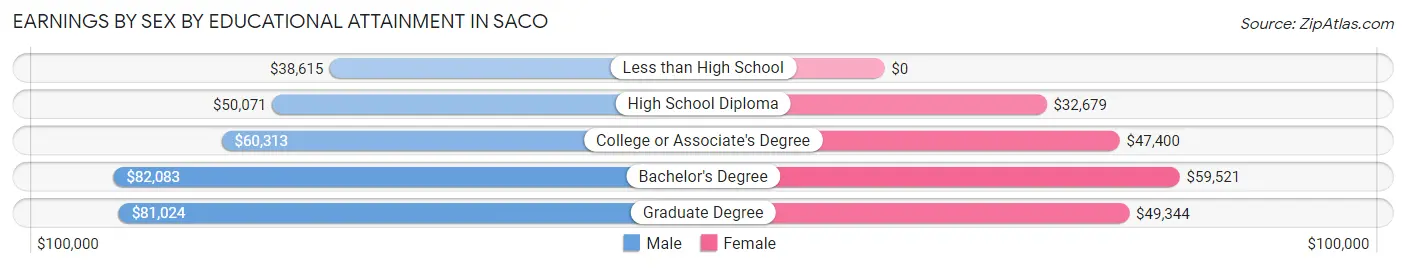
Earnings by Sex by Educational Attainment in Saco
Average earnings in Saco are $60,302 for men and $46,076 for women, a difference of 23.6%. Men with an educational attainment of bachelor's degree enjoy the highest average annual earnings of $82,083, while those with less than high school education earn the least with $38,615. Women with an educational attainment of bachelor's degree earn the most with the average annual earnings of $59,521, while those with high school diploma education have the smallest earnings of $32,679.
| Educational Attainment | Male Income | Female Income |
| Less than High School | $38,615 | $0 |
| High School Diploma | $50,071 | $32,679 |
| College or Associate's Degree | $60,313 | $47,400 |
| Bachelor's Degree | $82,083 | $59,521 |
| Graduate Degree | $81,024 | $49,344 |
| Total | $60,302 | $46,076 |
Family Income in Saco
Family Income Brackets in Saco
According to the Saco family income data, there are 1,249 families falling into the $100,000 to $149,999 income range, which is the most common income bracket and makes up 23.3% of all families. Conversely, the less than $10,000 income bracket is the least frequent group with only 43 families (0.8%) belonging to this category.
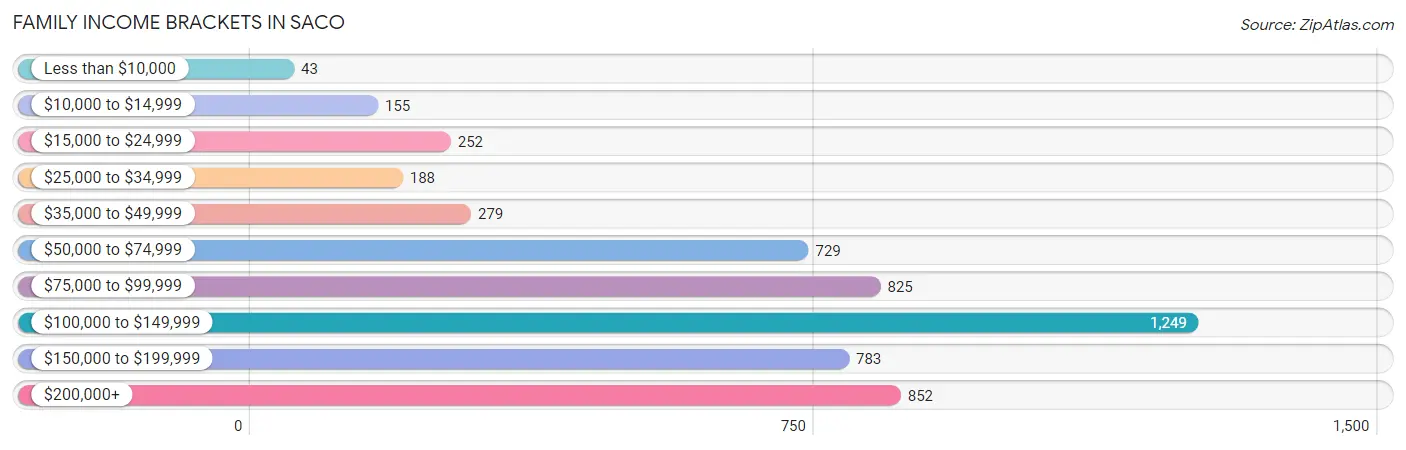
| Income Bracket | # Families | % Families |
| Less than $10,000 | 43 | 0.8% |
| $10,000 to $14,999 | 155 | 2.9% |
| $15,000 to $24,999 | 252 | 4.7% |
| $25,000 to $34,999 | 188 | 3.5% |
| $35,000 to $49,999 | 279 | 5.2% |
| $50,000 to $74,999 | 729 | 13.6% |
| $75,000 to $99,999 | 825 | 15.4% |
| $100,000 to $149,999 | 1,249 | 23.3% |
| $150,000 to $199,999 | 783 | 14.6% |
| $200,000+ | 852 | 15.9% |
Family Income by Famaliy Size in Saco
6-person families (123 | 2.3%) account for the highest median family income in Saco with $192,218 per family, while 2-person families (2,562 | 47.8%) have the highest median income of $45,334 per family member.
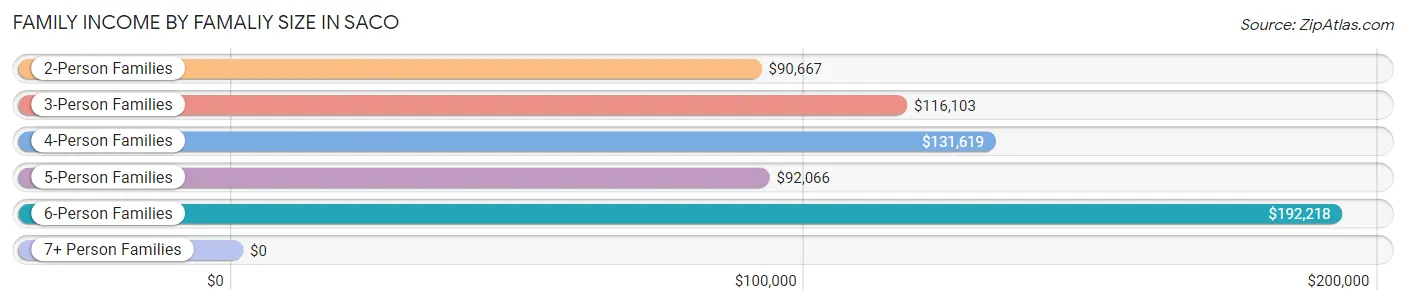
| Income Bracket | # Families | Median Income |
| 2-Person Families | 2,562 (47.8%) | $90,667 |
| 3-Person Families | 1,319 (24.6%) | $116,103 |
| 4-Person Families | 1,049 (19.6%) | $131,619 |
| 5-Person Families | 276 (5.1%) | $92,066 |
| 6-Person Families | 123 (2.3%) | $192,218 |
| 7+ Person Families | 31 (0.6%) | $0 |
| Total | 5,360 (100.0%) | $108,489 |
Family Income by Number of Earners in Saco
The median family income in Saco is $108,489, with families comprising 3+ earners (853) having the highest median family income of $158,487, while families with no earners (538) have the lowest median family income of $52,330, accounting for 15.9% and 10.0% of families, respectively.
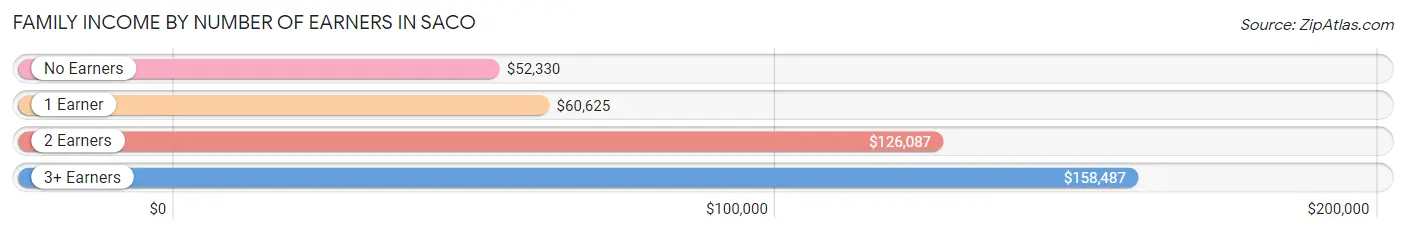
| Number of Earners | # Families | Median Income |
| No Earners | 538 (10.0%) | $52,330 |
| 1 Earner | 1,251 (23.3%) | $60,625 |
| 2 Earners | 2,718 (50.7%) | $126,087 |
| 3+ Earners | 853 (15.9%) | $158,487 |
| Total | 5,360 (100.0%) | $108,489 |
Household Income in Saco
Household Income Brackets in Saco
With 1,792 households falling in the category, the $50,000 to $74,999 income range is the most frequent in Saco, accounting for 20.2% of all households. In contrast, only 284 households (3.2%) fall into the $10,000 to $14,999 income bracket, making it the least populous group.
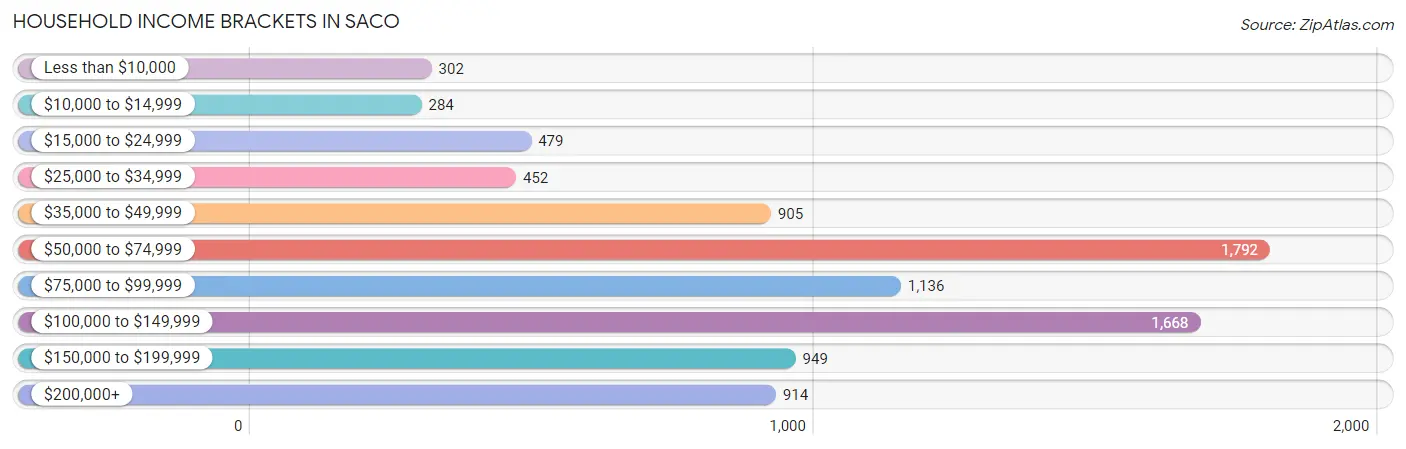
| Income Bracket | # Households | % Households |
| Less than $10,000 | 302 | 3.4% |
| $10,000 to $14,999 | 284 | 3.2% |
| $15,000 to $24,999 | 479 | 5.4% |
| $25,000 to $34,999 | 452 | 5.1% |
| $35,000 to $49,999 | 905 | 10.2% |
| $50,000 to $74,999 | 1,792 | 20.2% |
| $75,000 to $99,999 | 1,136 | 12.8% |
| $100,000 to $149,999 | 1,668 | 18.8% |
| $150,000 to $199,999 | 949 | 10.7% |
| $200,000+ | 914 | 10.3% |
Household Income by Householder Age in Saco
The median household income in Saco is $81,326, with the highest median household income of $99,688 found in the 25 to 44 years age bracket for the primary householder. A total of 2,697 households (30.4%) fall into this category. Meanwhile, the 65+ years age bracket for the primary householder has the lowest median household income of $60,485, with 2,117 households (23.9%) in this group.
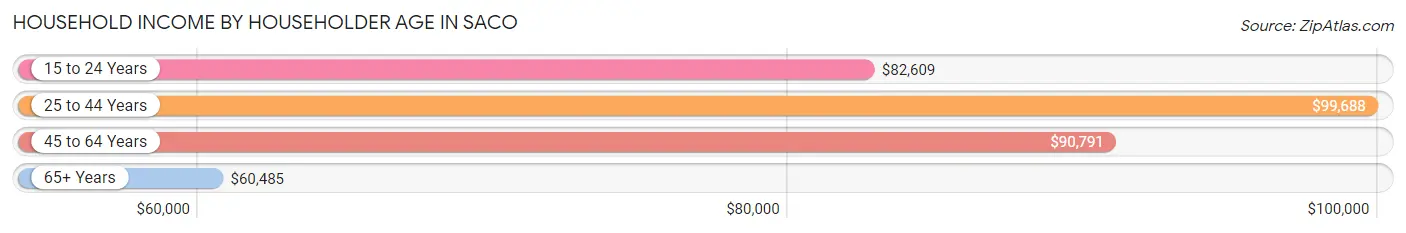
| Income Bracket | # Households | Median Income |
| 15 to 24 Years | 222 (2.5%) | $82,609 |
| 25 to 44 Years | 2,697 (30.4%) | $99,688 |
| 45 to 64 Years | 3,836 (43.2%) | $90,791 |
| 65+ Years | 2,117 (23.9%) | $60,485 |
| Total | 8,872 (100.0%) | $81,326 |
Poverty in Saco
Income Below Poverty by Sex and Age in Saco
With 6.5% poverty level for males and 9.5% for females among the residents of Saco, 15 year old males and 16 and 17 year old females are the most vulnerable to poverty, with 43 males (29.2%) and 48 females (22.0%) in their respective age groups living below the poverty level.
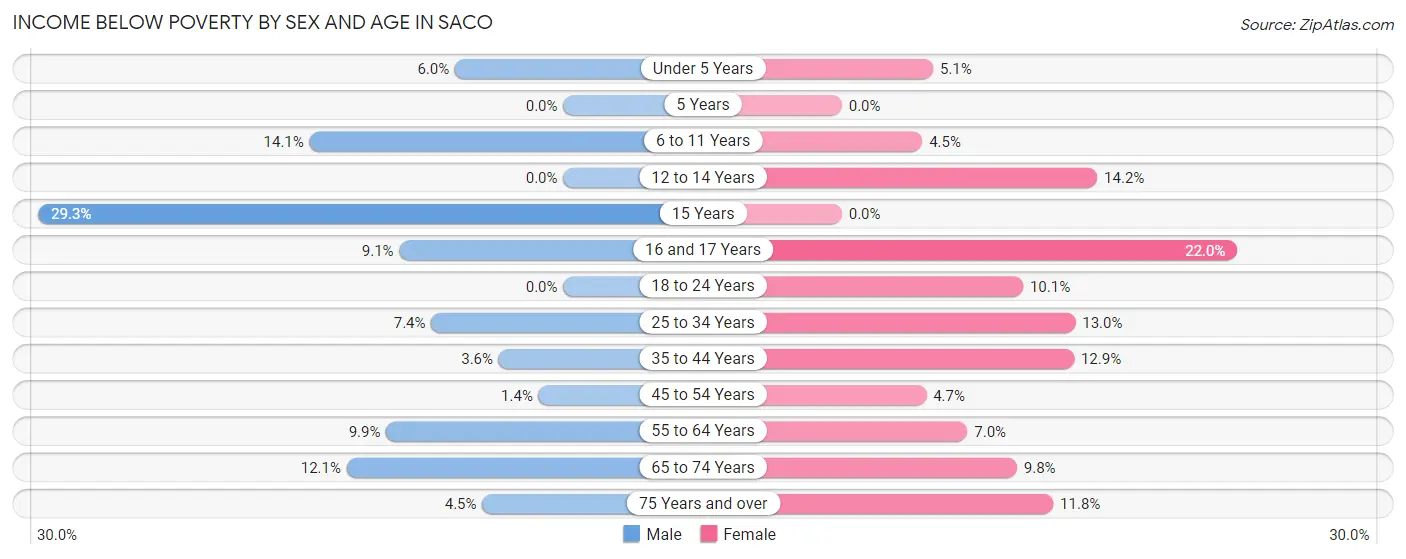
| Age Bracket | Male | Female |
| Under 5 Years | 27 (6.0%) | 21 (5.1%) |
| 5 Years | 0 (0.0%) | 0 (0.0%) |
| 6 to 11 Years | 80 (14.1%) | 29 (4.5%) |
| 12 to 14 Years | 0 (0.0%) | 32 (14.2%) |
| 15 Years | 43 (29.2%) | 0 (0.0%) |
| 16 and 17 Years | 20 (9.1%) | 48 (22.0%) |
| 18 to 24 Years | 0 (0.0%) | 78 (10.1%) |
| 25 to 34 Years | 109 (7.3%) | 206 (13.0%) |
| 35 to 44 Years | 36 (3.6%) | 190 (12.9%) |
| 45 to 54 Years | 22 (1.4%) | 71 (4.7%) |
| 55 to 64 Years | 150 (9.9%) | 107 (7.0%) |
| 65 to 74 Years | 129 (12.1%) | 101 (9.8%) |
| 75 Years and over | 23 (4.5%) | 93 (11.8%) |
| Total | 639 (6.5%) | 976 (9.5%) |
Income Above Poverty by Sex and Age in Saco
According to the poverty statistics in Saco, males aged 5 years and females aged 5 years are the age groups that are most secure financially, with 100.0% of males and 100.0% of females in these age groups living above the poverty line.
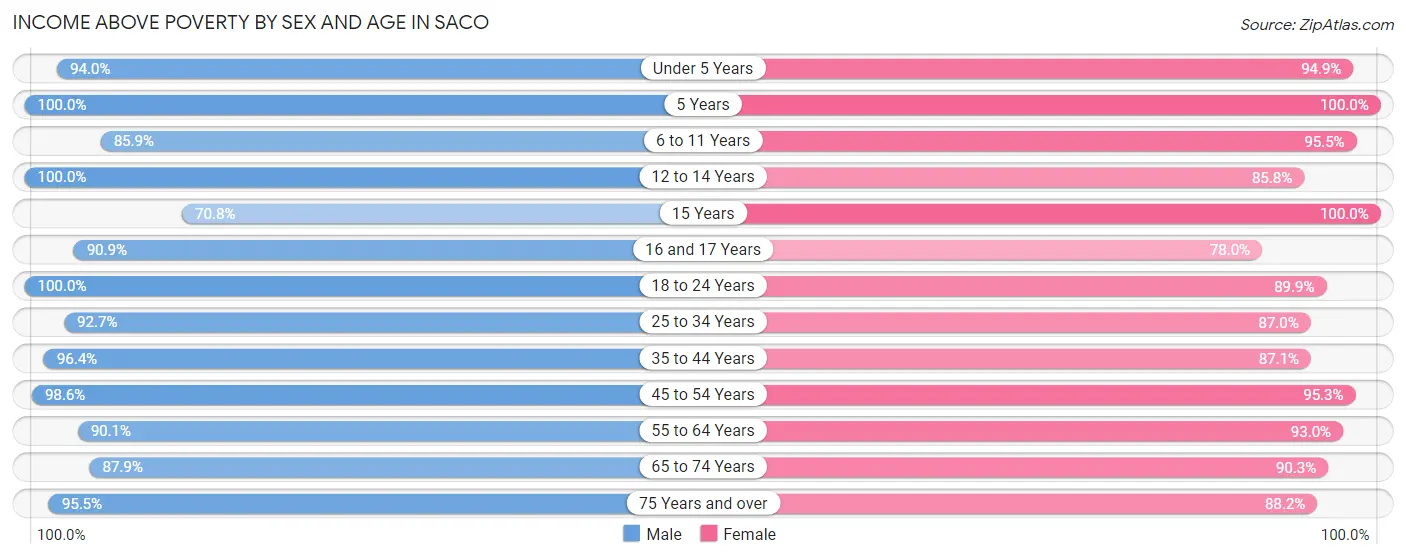
| Age Bracket | Male | Female |
| Under 5 Years | 421 (94.0%) | 392 (94.9%) |
| 5 Years | 87 (100.0%) | 47 (100.0%) |
| 6 to 11 Years | 486 (85.9%) | 618 (95.5%) |
| 12 to 14 Years | 368 (100.0%) | 193 (85.8%) |
| 15 Years | 104 (70.8%) | 67 (100.0%) |
| 16 and 17 Years | 199 (90.9%) | 170 (78.0%) |
| 18 to 24 Years | 791 (100.0%) | 695 (89.9%) |
| 25 to 34 Years | 1,375 (92.6%) | 1,379 (87.0%) |
| 35 to 44 Years | 966 (96.4%) | 1,279 (87.1%) |
| 45 to 54 Years | 1,587 (98.6%) | 1,439 (95.3%) |
| 55 to 64 Years | 1,371 (90.1%) | 1,423 (93.0%) |
| 65 to 74 Years | 941 (87.9%) | 935 (90.2%) |
| 75 Years and over | 487 (95.5%) | 697 (88.2%) |
| Total | 9,183 (93.5%) | 9,334 (90.5%) |
Income Below Poverty Among Married-Couple Families in Saco
The poverty statistics for married-couple families in Saco show that 2.4% or 100 of the total 4,241 families live below the poverty line. Families with no children have the highest poverty rate of 2.9%, comprising of 72 families. On the other hand, families with 3 or 4 children have the lowest poverty rate of 0.0%, which includes 0 families.
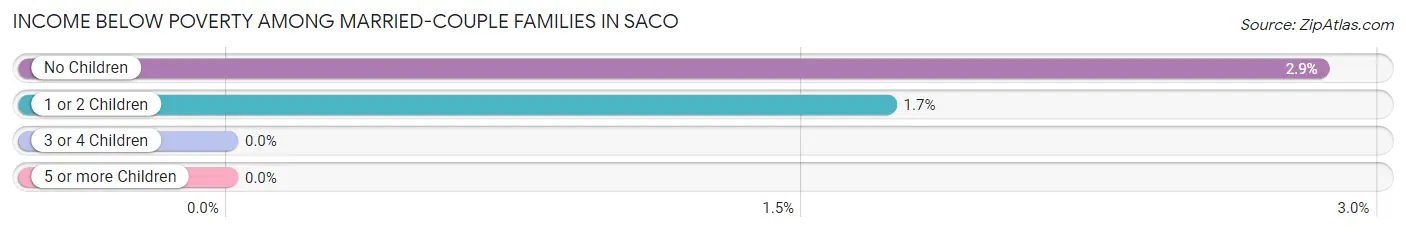
| Children | Above Poverty | Below Poverty |
| No Children | 2,450 (97.2%) | 72 (2.9%) |
| 1 or 2 Children | 1,596 (98.3%) | 28 (1.7%) |
| 3 or 4 Children | 95 (100.0%) | 0 (0.0%) |
| 5 or more Children | 0 (0.0%) | 0 (0.0%) |
| Total | 4,141 (97.6%) | 100 (2.4%) |
Income Below Poverty Among Single-Parent Households in Saco
According to the poverty data in Saco, 6.5% or 16 single-father households and 30.9% or 269 single-mother households are living below the poverty line. Among single-father households, those with no children have the highest poverty rate, with 16 households (9.6%) experiencing poverty. Likewise, among single-mother households, those with 1 or 2 children have the highest poverty rate, with 266 households (41.3%) falling below the poverty line.
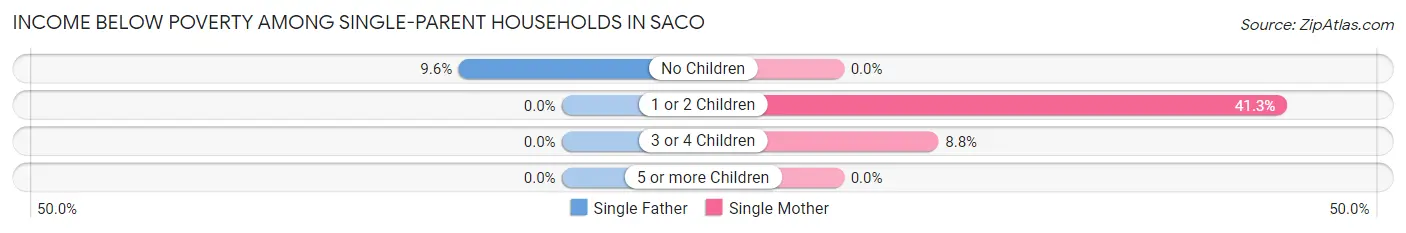
| Children | Single Father | Single Mother |
| No Children | 16 (9.6%) | 0 (0.0%) |
| 1 or 2 Children | 0 (0.0%) | 266 (41.3%) |
| 3 or 4 Children | 0 (0.0%) | 3 (8.8%) |
| 5 or more Children | 0 (0.0%) | 0 (0.0%) |
| Total | 16 (6.5%) | 269 (30.9%) |
Income Below Poverty Among Married-Couple vs Single-Parent Households in Saco
The poverty data for Saco shows that 100 of the married-couple family households (2.4%) and 285 of the single-parent households (25.5%) are living below the poverty level. Within the married-couple family households, those with no children have the highest poverty rate, with 72 households (2.9%) falling below the poverty line. Among the single-parent households, those with 1 or 2 children have the highest poverty rate, with 266 household (36.6%) living below poverty.
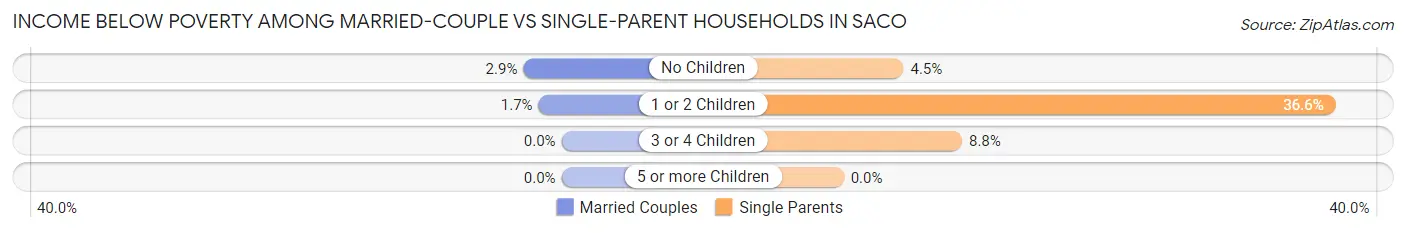
| Children | Married-Couple Families | Single-Parent Households |
| No Children | 72 (2.9%) | 16 (4.5%) |
| 1 or 2 Children | 28 (1.7%) | 266 (36.6%) |
| 3 or 4 Children | 0 (0.0%) | 3 (8.8%) |
| 5 or more Children | 0 (0.0%) | 0 (0.0%) |
| Total | 100 (2.4%) | 285 (25.5%) |
Race in Saco
The most populous races in Saco are White / Caucasian (18,582 | 90.9%), Two or more Races (984 | 4.8%), and Black / African American (422 | 2.1%).
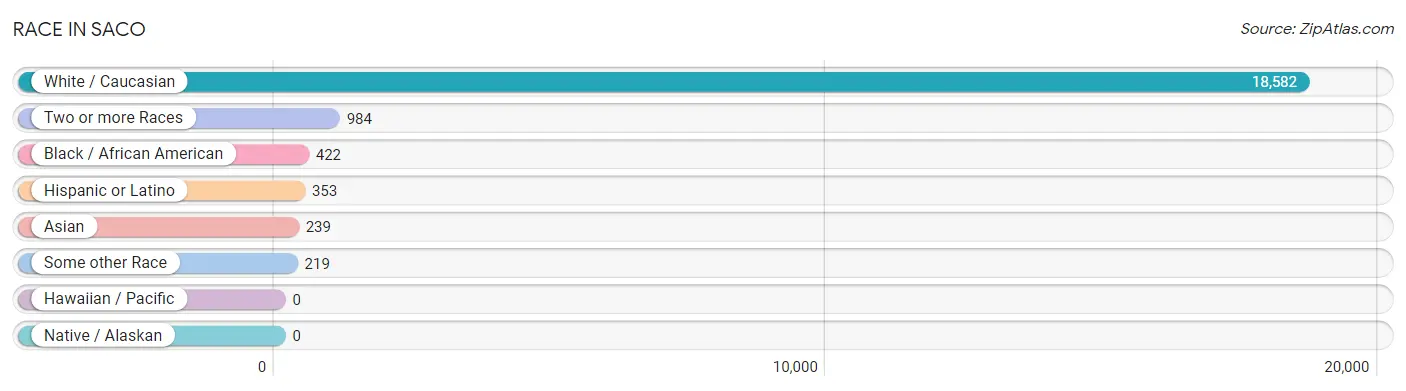
| Race | # Population | % Population |
| Asian | 239 | 1.2% |
| Black / African American | 422 | 2.1% |
| Hawaiian / Pacific | 0 | 0.0% |
| Hispanic or Latino | 353 | 1.7% |
| Native / Alaskan | 0 | 0.0% |
| White / Caucasian | 18,582 | 90.9% |
| Two or more Races | 984 | 4.8% |
| Some other Race | 219 | 1.1% |
| Total | 20,446 | 100.0% |
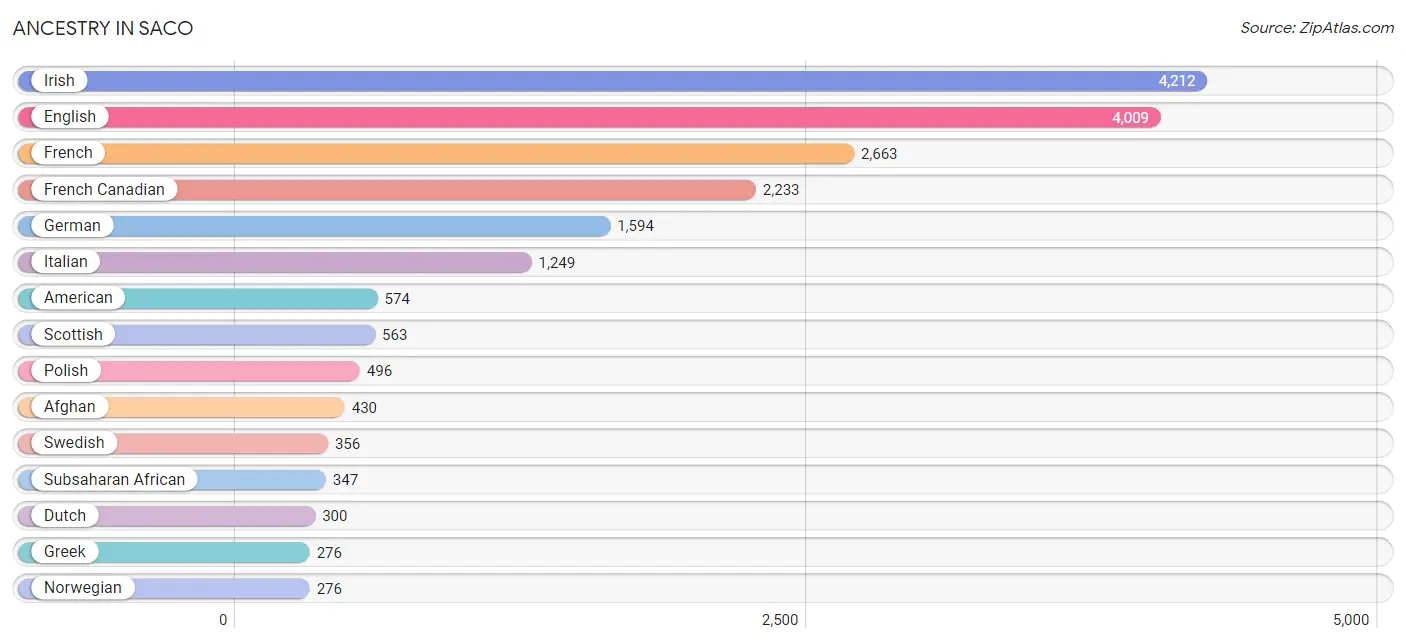
Ancestry in Saco
The most populous ancestries reported in Saco are Irish (4,212 | 20.6%), English (4,009 | 19.6%), French (2,663 | 13.0%), French Canadian (2,233 | 10.9%), and German (1,594 | 7.8%), together accounting for 71.9% of all Saco residents.
| Ancestry | # Population | % Population |
| Afghan | 430 | 2.1% |
| African | 5 | 0.0% |
| Alaskan Athabascan | 12 | 0.1% |
| Albanian | 35 | 0.2% |
| American | 574 | 2.8% |
| Arab | 54 | 0.3% |
| Australian | 48 | 0.2% |
| Austrian | 69 | 0.3% |
| Belgian | 8 | 0.0% |
| Bhutanese | 64 | 0.3% |
| Brazilian | 23 | 0.1% |
| British | 123 | 0.6% |
| Cambodian | 18 | 0.1% |
| Canadian | 184 | 0.9% |
| Central American | 93 | 0.4% |
| Croatian | 11 | 0.1% |
| Cuban | 3 | 0.0% |
| Czech | 273 | 1.3% |
| Czechoslovakian | 46 | 0.2% |
| Danish | 112 | 0.5% |
| Dutch | 300 | 1.5% |
| Eastern European | 31 | 0.2% |
| English | 4,009 | 19.6% |
| Ethiopian | 15 | 0.1% |
| European | 262 | 1.3% |
| Finnish | 65 | 0.3% |
| French | 2,663 | 13.0% |
| French American Indian | 6 | 0.0% |
| French Canadian | 2,233 | 10.9% |
| German | 1,594 | 7.8% |
| Greek | 276 | 1.3% |
| Guatemalan | 34 | 0.2% |
| Hungarian | 30 | 0.2% |
| Indian (Asian) | 133 | 0.6% |
| Iranian | 12 | 0.1% |
| Irish | 4,212 | 20.6% |
| Italian | 1,249 | 6.1% |
| Korean | 35 | 0.2% |
| Laotian | 37 | 0.2% |
| Lithuanian | 20 | 0.1% |
| Mexican | 117 | 0.6% |
| Nicaraguan | 11 | 0.1% |
| Northern European | 140 | 0.7% |
| Norwegian | 276 | 1.3% |
| Polish | 496 | 2.4% |
| Portuguese | 141 | 0.7% |
| Puerto Rican | 65 | 0.3% |
| Romanian | 3 | 0.0% |
| Russian | 168 | 0.8% |
| Salvadoran | 48 | 0.2% |
| Scandinavian | 60 | 0.3% |
| Scotch-Irish | 156 | 0.8% |
| Scottish | 563 | 2.8% |
| Serbian | 33 | 0.2% |
| Slovak | 44 | 0.2% |
| Slovene | 40 | 0.2% |
| Somali | 62 | 0.3% |
| South American | 54 | 0.3% |
| Spaniard | 21 | 0.1% |
| Subsaharan African | 347 | 1.7% |
| Swedish | 356 | 1.7% |
| Swiss | 57 | 0.3% |
| Thai | 5 | 0.0% |
| Turkish | 12 | 0.1% |
| Ukrainian | 46 | 0.2% |
| Venezuelan | 54 | 0.3% |
| Welsh | 60 | 0.3% |
| Yugoslavian | 33 | 0.2% | View All 68 Rows |
Immigrants in Saco
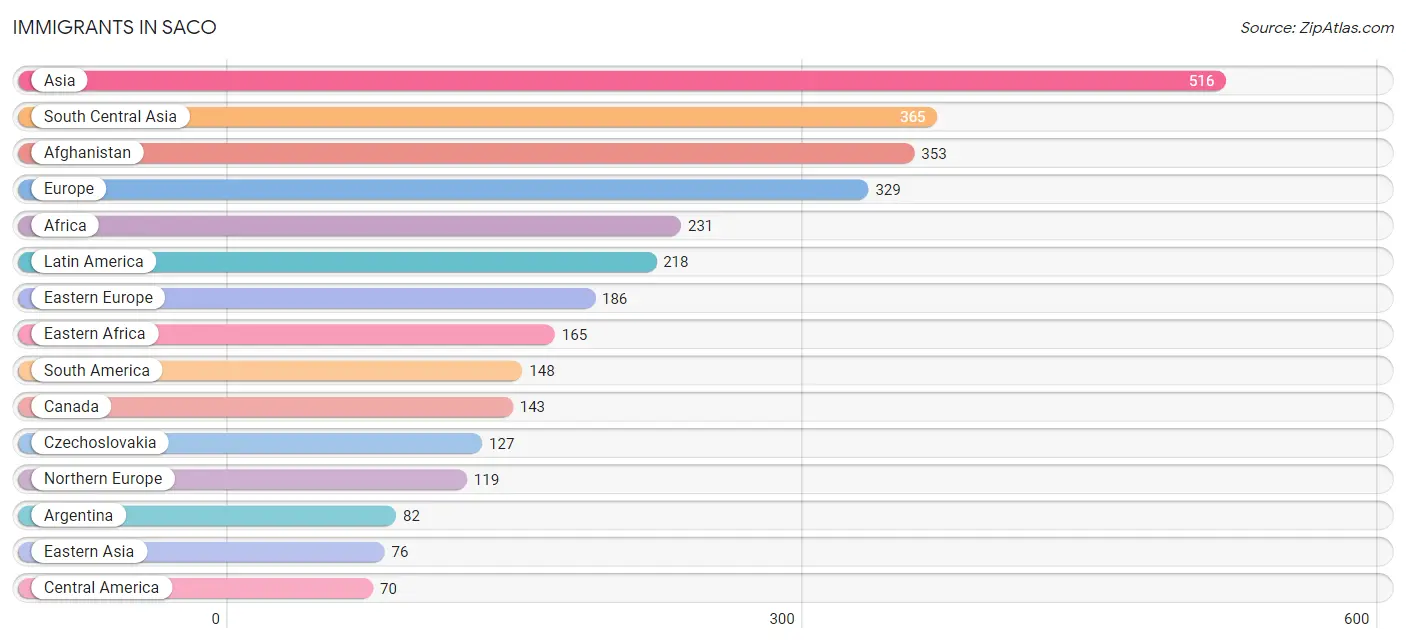
The most numerous immigrant groups reported in Saco came from Asia (516 | 2.5%), South Central Asia (365 | 1.8%), Afghanistan (353 | 1.7%), Europe (329 | 1.6%), and Africa (231 | 1.1%), together accounting for 8.8% of all Saco residents.
| Immigration Origin | # Population | % Population |
| Afghanistan | 353 | 1.7% |
| Africa | 231 | 1.1% |
| Argentina | 82 | 0.4% |
| Asia | 516 | 2.5% |
| Bosnia and Herzegovina | 33 | 0.2% |
| Brazil | 12 | 0.1% |
| Canada | 143 | 0.7% |
| Central America | 70 | 0.3% |
| China | 58 | 0.3% |
| Czechoslovakia | 127 | 0.6% |
| Denmark | 21 | 0.1% |
| Eastern Africa | 165 | 0.8% |
| Eastern Asia | 76 | 0.4% |
| Eastern Europe | 186 | 0.9% |
| El Salvador | 37 | 0.2% |
| England | 62 | 0.3% |
| Eritrea | 8 | 0.0% |
| Ethiopia | 15 | 0.1% |
| Europe | 329 | 1.6% |
| Germany | 7 | 0.0% |
| Greece | 10 | 0.1% |
| Guatemala | 22 | 0.1% |
| Indonesia | 16 | 0.1% |
| Iran | 12 | 0.1% |
| Kenya | 31 | 0.2% |
| Latin America | 218 | 1.1% |
| Netherlands | 7 | 0.0% |
| Nicaragua | 11 | 0.1% |
| Northern Africa | 25 | 0.1% |
| Northern Europe | 119 | 0.6% |
| Philippines | 26 | 0.1% |
| Romania | 3 | 0.0% |
| Russia | 23 | 0.1% |
| South Africa | 41 | 0.2% |
| South America | 148 | 0.7% |
| South Central Asia | 365 | 1.8% |
| South Eastern Asia | 42 | 0.2% |
| Southern Europe | 10 | 0.1% |
| Turkey | 10 | 0.1% |
| Venezuela | 54 | 0.3% |
| Western Asia | 33 | 0.2% |
| Western Europe | 14 | 0.1% |
| Zimbabwe | 5 | 0.0% | View All 43 Rows |
Sex and Age in Saco
Sex and Age in Saco
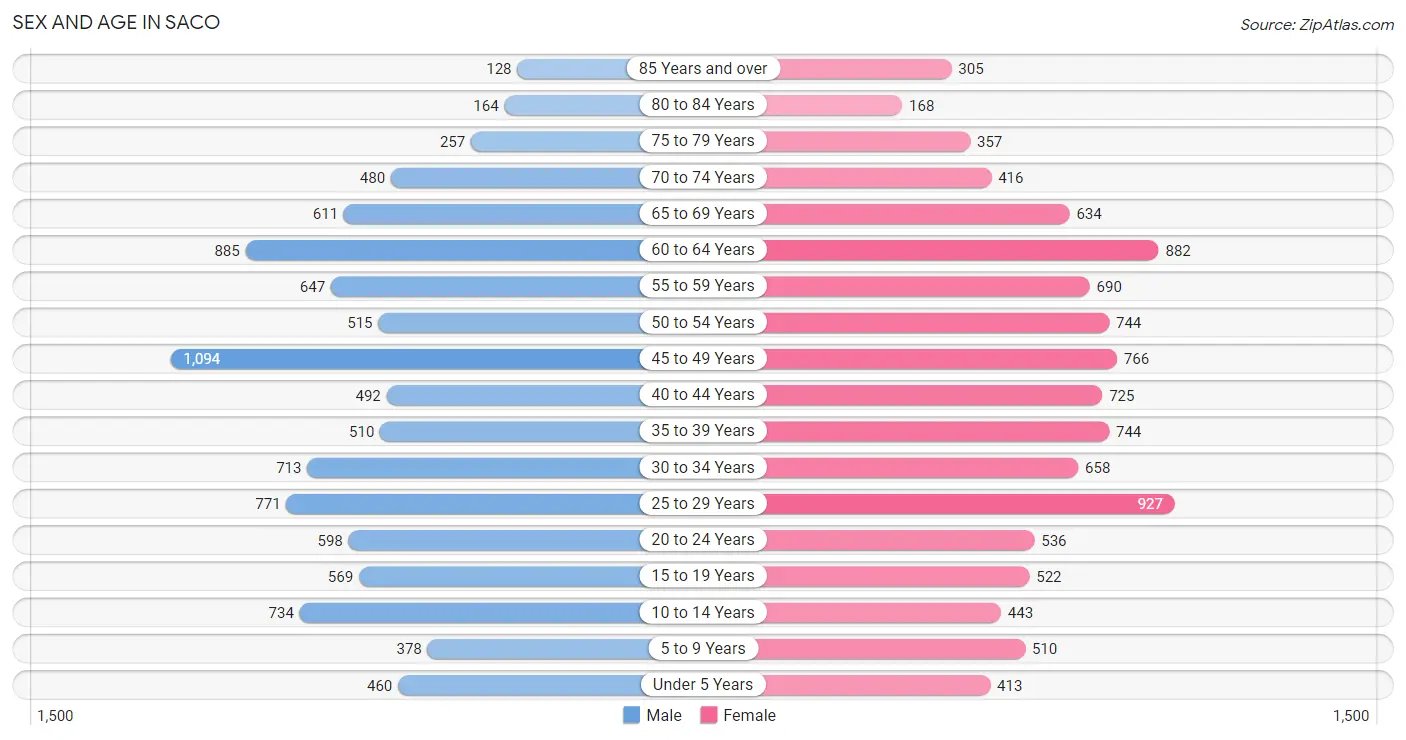
The most populous age groups in Saco are 45 to 49 Years (1,094 | 10.9%) for men and 25 to 29 Years (927 | 8.9%) for women.
| Age Bracket | Male | Female |
| Under 5 Years | 460 (4.6%) | 413 (4.0%) |
| 5 to 9 Years | 378 (3.8%) | 510 (4.9%) |
| 10 to 14 Years | 734 (7.3%) | 443 (4.2%) |
| 15 to 19 Years | 569 (5.7%) | 522 (5.0%) |
| 20 to 24 Years | 598 (6.0%) | 536 (5.1%) |
| 25 to 29 Years | 771 (7.7%) | 927 (8.9%) |
| 30 to 34 Years | 713 (7.1%) | 658 (6.3%) |
| 35 to 39 Years | 510 (5.1%) | 744 (7.1%) |
| 40 to 44 Years | 492 (4.9%) | 725 (6.9%) |
| 45 to 49 Years | 1,094 (10.9%) | 766 (7.3%) |
| 50 to 54 Years | 515 (5.1%) | 744 (7.1%) |
| 55 to 59 Years | 647 (6.5%) | 690 (6.6%) |
| 60 to 64 Years | 885 (8.8%) | 882 (8.5%) |
| 65 to 69 Years | 611 (6.1%) | 634 (6.1%) |
| 70 to 74 Years | 480 (4.8%) | 416 (4.0%) |
| 75 to 79 Years | 257 (2.6%) | 357 (3.4%) |
| 80 to 84 Years | 164 (1.6%) | 168 (1.6%) |
| 85 Years and over | 128 (1.3%) | 305 (2.9%) |
| Total | 10,006 (100.0%) | 10,440 (100.0%) |
Families and Households in Saco
Median Family Size in Saco
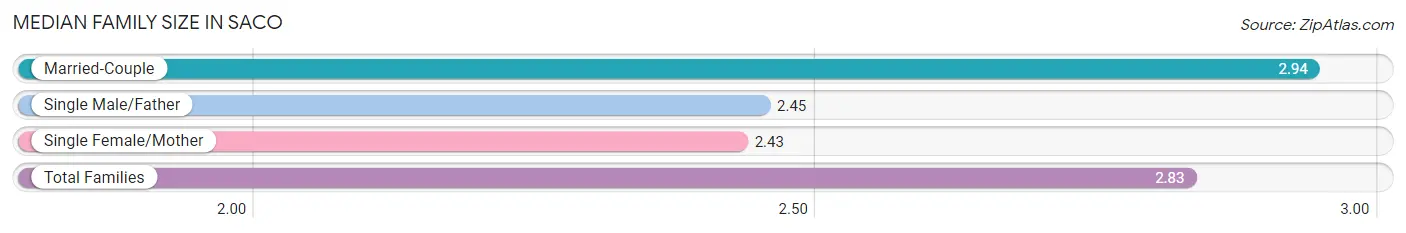
The median family size in Saco is 2.83 persons per family, with married-couple families (4,241 | 79.1%) accounting for the largest median family size of 2.94 persons per family. On the other hand, single female/mother families (871 | 16.3%) represent the smallest median family size with 2.43 persons per family.
| Family Type | # Families | Family Size |
| Married-Couple | 4,241 (79.1%) | 2.94 |
| Single Male/Father | 248 (4.6%) | 2.45 |
| Single Female/Mother | 871 (16.3%) | 2.43 |
| Total Families | 5,360 (100.0%) | 2.83 |
Median Household Size in Saco
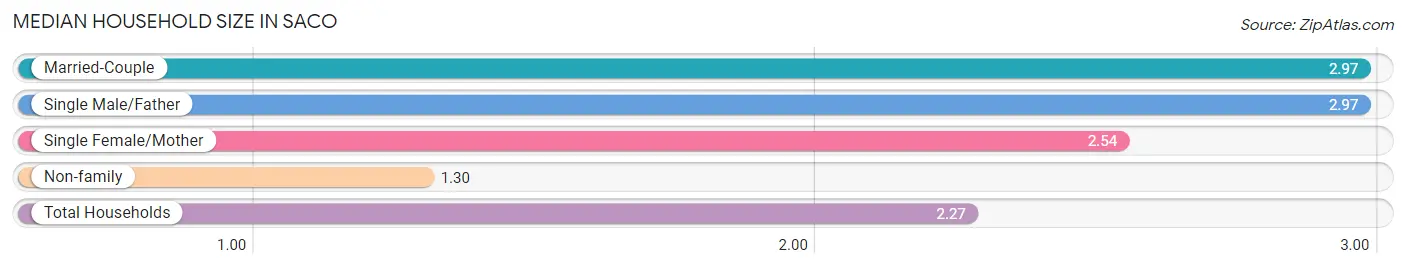
The median household size in Saco is 2.27 persons per household, with married-couple households (4,241 | 47.8%) accounting for the largest median household size of 2.97 persons per household. non-family households (3,512 | 39.6%) represent the smallest median household size with 1.30 persons per household.
| Household Type | # Households | Household Size |
| Married-Couple | 4,241 (47.8%) | 2.97 |
| Single Male/Father | 248 (2.8%) | 2.97 |
| Single Female/Mother | 871 (9.8%) | 2.54 |
| Non-family | 3,512 (39.6%) | 1.30 |
| Total Households | 8,872 (100.0%) | 2.27 |
Household Size by Marriage Status in Saco
Out of a total of 8,872 households in Saco, 5,360 (60.4%) are family households, while 3,512 (39.6%) are nonfamily households. The most numerous type of family households are 2-person households, comprising 2,422, and the most common type of nonfamily households are 1-person households, comprising 2,706.
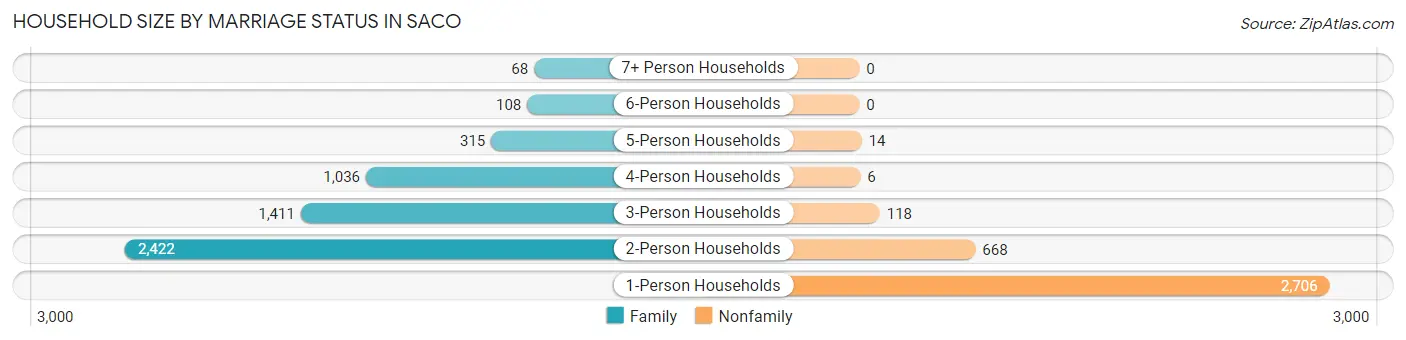
| Household Size | Family Households | Nonfamily Households |
| 1-Person Households | - | 2,706 (30.5%) |
| 2-Person Households | 2,422 (27.3%) | 668 (7.5%) |
| 3-Person Households | 1,411 (15.9%) | 118 (1.3%) |
| 4-Person Households | 1,036 (11.7%) | 6 (0.1%) |
| 5-Person Households | 315 (3.5%) | 14 (0.2%) |
| 6-Person Households | 108 (1.2%) | 0 (0.0%) |
| 7+ Person Households | 68 (0.8%) | 0 (0.0%) |
| Total | 5,360 (60.4%) | 3,512 (39.6%) |
Female Fertility in Saco
Fertility by Age in Saco
Average fertility rate in Saco is 41.0 births per 1,000 women. Women in the age bracket of 20 to 34 years have the highest fertility rate with 86.0 births per 1,000 women. Women in the age bracket of 20 to 34 years acount for 87.6% of all women with births.
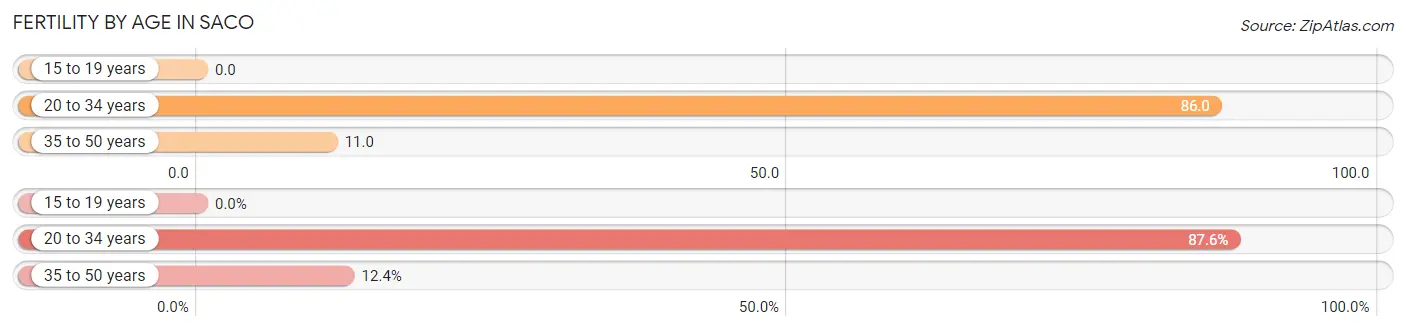
| Age Bracket | Women with Births | Births / 1,000 Women |
| 15 to 19 years | 0 (0.0%) | 0.0 |
| 20 to 34 years | 183 (87.6%) | 86.0 |
| 35 to 50 years | 26 (12.4%) | 11.0 |
| Total | 209 (100.0%) | 41.0 |
Fertility by Age by Marriage Status in Saco
89.0% of women with births (209) in Saco are married. The highest percentage of unmarried women with births falls into 20 to 34 years age bracket with 12.6% of them unmarried at the time of birth, while the lowest percentage of unmarried women with births belong to 35 to 50 years age bracket with 0.0% of them unmarried.
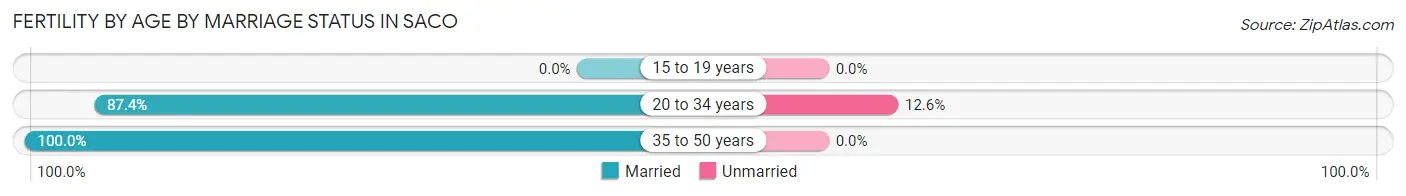
| Age Bracket | Married | Unmarried |
| 15 to 19 years | 0 (0.0%) | 0 (0.0%) |
| 20 to 34 years | 160 (87.4%) | 23 (12.6%) |
| 35 to 50 years | 26 (100.0%) | 0 (0.0%) |
| Total | 186 (89.0%) | 23 (11.0%) |
Fertility by Education in Saco
Average fertility rate in Saco is 41.0 births per 1,000 women. Women with the education attainment of college or associate's degree have the highest fertility rate of 60.0 births per 1,000 women, while women with the education attainment of less than high school have the lowest fertility at 16.0 births per 1,000 women. Women with the education attainment of college or associate's degree represent 40.7% of all women with births.
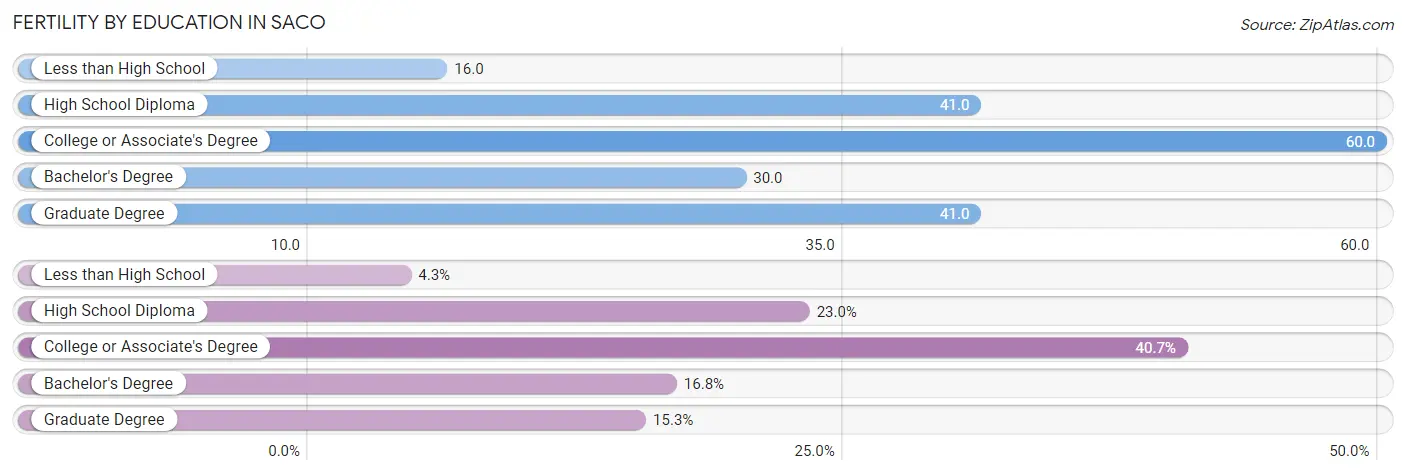
| Educational Attainment | Women with Births | Births / 1,000 Women |
| Less than High School | 9 (4.3%) | 16.0 |
| High School Diploma | 48 (23.0%) | 41.0 |
| College or Associate's Degree | 85 (40.7%) | 60.0 |
| Bachelor's Degree | 35 (16.8%) | 30.0 |
| Graduate Degree | 32 (15.3%) | 41.0 |
| Total | 209 (100.0%) | 41.0 |
Fertility by Education by Marriage Status in Saco
11.0% of women with births in Saco are unmarried. Women with the educational attainment of less than high school are most likely to be married with 100.0% of them married at childbirth, while women with the educational attainment of college or associate's degree are least likely to be married with 27.1% of them unmarried at childbirth.
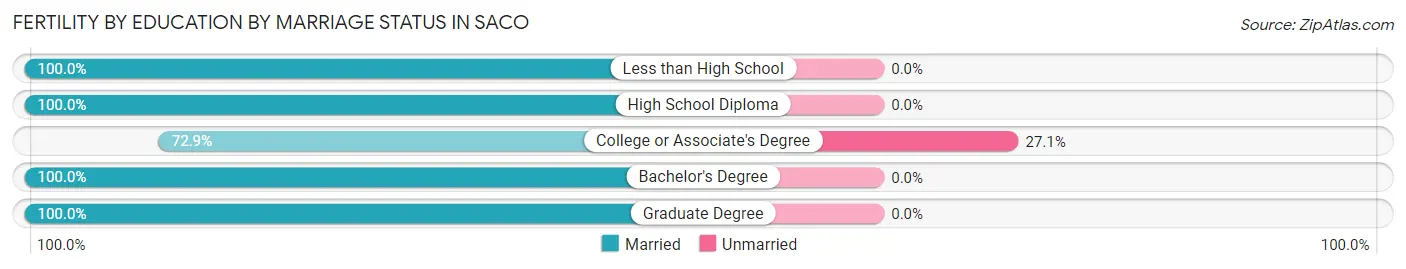
| Educational Attainment | Married | Unmarried |
| Less than High School | 9 (100.0%) | 0 (0.0%) |
| High School Diploma | 48 (100.0%) | 0 (0.0%) |
| College or Associate's Degree | 62 (72.9%) | 23 (27.1%) |
| Bachelor's Degree | 35 (100.0%) | 0 (0.0%) |
| Graduate Degree | 32 (100.0%) | 0 (0.0%) |
| Total | 186 (89.0%) | 23 (11.0%) |
Employment Characteristics in Saco
Employment by Class of Employer in Saco
Among the 12,031 employed individuals in Saco, private company employees (8,437 | 70.1%), not-for-profit organizations (1,147 | 9.5%), and self-employed (not incorporated) (807 | 6.7%) make up the most common classes of employment.
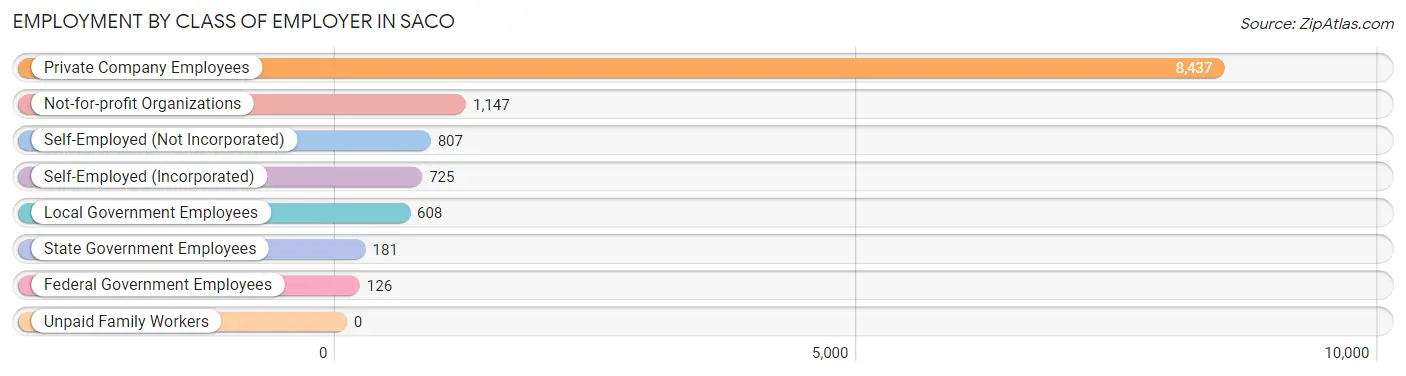
| Employer Class | # Employees | % Employees |
| Private Company Employees | 8,437 | 70.1% |
| Self-Employed (Incorporated) | 725 | 6.0% |
| Self-Employed (Not Incorporated) | 807 | 6.7% |
| Not-for-profit Organizations | 1,147 | 9.5% |
| Local Government Employees | 608 | 5.1% |
| State Government Employees | 181 | 1.5% |
| Federal Government Employees | 126 | 1.1% |
| Unpaid Family Workers | 0 | 0.0% |
| Total | 12,031 | 100.0% |
Employment Status by Age in Saco
According to the labor force statistics for Saco, out of the total population over 16 years of age (17,291), 72.2% or 12,484 individuals are in the labor force, with 1.1% or 137 of them unemployed. The age group with the highest labor force participation rate is 30 to 34 years, with 94.1% or 1,290 individuals in the labor force. Within the labor force, the 75 years and over age range has the highest percentage of unemployed individuals, with 35.6% or 42 of them being unemployed.
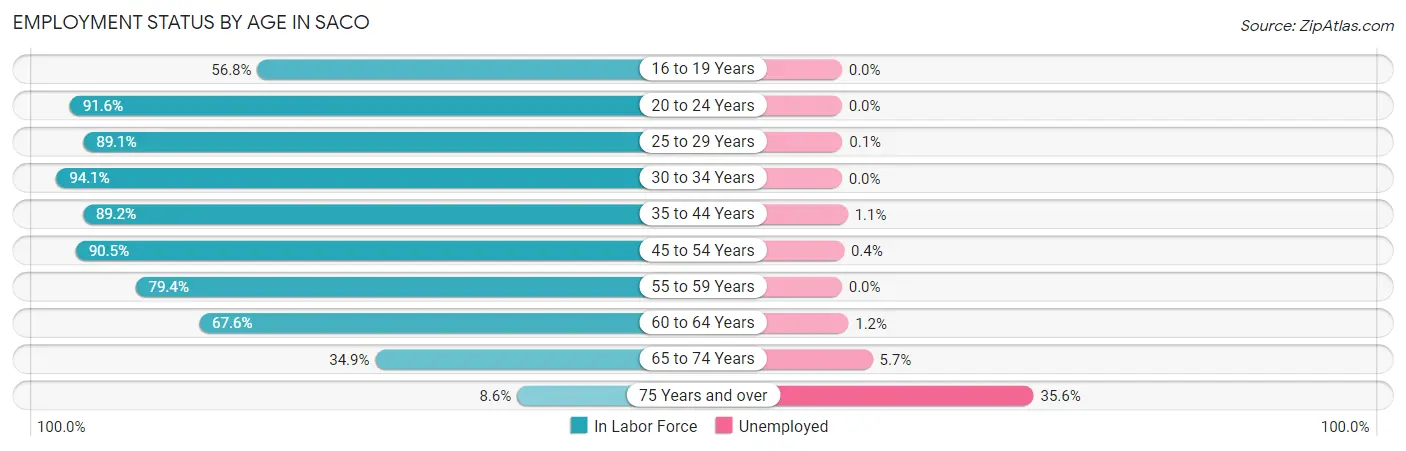
| Age Bracket | In Labor Force | Unemployed |
| 16 to 19 Years | 496 (56.8%) | 0 (0.0%) |
| 20 to 24 Years | 1,039 (91.6%) | 0 (0.0%) |
| 25 to 29 Years | 1,513 (89.1%) | 2 (0.1%) |
| 30 to 34 Years | 1,290 (94.1%) | 0 (0.0%) |
| 35 to 44 Years | 2,204 (89.2%) | 24 (1.1%) |
| 45 to 54 Years | 2,823 (90.5%) | 11 (0.4%) |
| 55 to 59 Years | 1,062 (79.4%) | 0 (0.0%) |
| 60 to 64 Years | 1,194 (67.6%) | 14 (1.2%) |
| 65 to 74 Years | 747 (34.9%) | 43 (5.7%) |
| 75 Years and over | 119 (8.6%) | 42 (35.6%) |
| Total | 12,484 (72.2%) | 137 (1.1%) |
Employment Status by Educational Attainment in Saco
According to labor force statistics for Saco, 85.8% of individuals (10,093) out of the total population between 25 and 64 years of age (11,763) are in the labor force, with 0.5% or 50 of them being unemployed. The group with the highest labor force participation rate are those with the educational attainment of bachelor's degree or higher, with 90.3% or 4,234 individuals in the labor force. Within the labor force, individuals with high school diploma education have the highest percentage of unemployment, with 1.0% or 26 of them being unemployed.
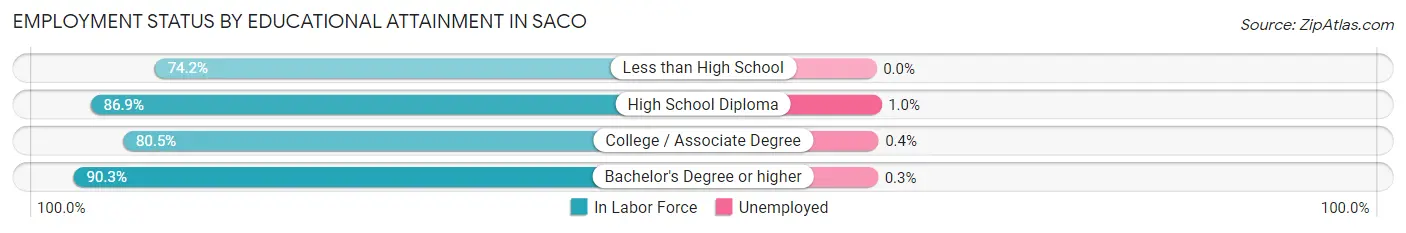
| Educational Attainment | In Labor Force | Unemployed |
| Less than High School | 374 (74.2%) | 0 (0.0%) |
| High School Diploma | 2,607 (86.9%) | 30 (1.0%) |
| College / Associate Degree | 2,874 (80.5%) | 14 (0.4%) |
| Bachelor's Degree or higher | 4,234 (90.3%) | 14 (0.3%) |
| Total | 10,093 (85.8%) | 59 (0.5%) |
Employment Occupations by Sex in Saco
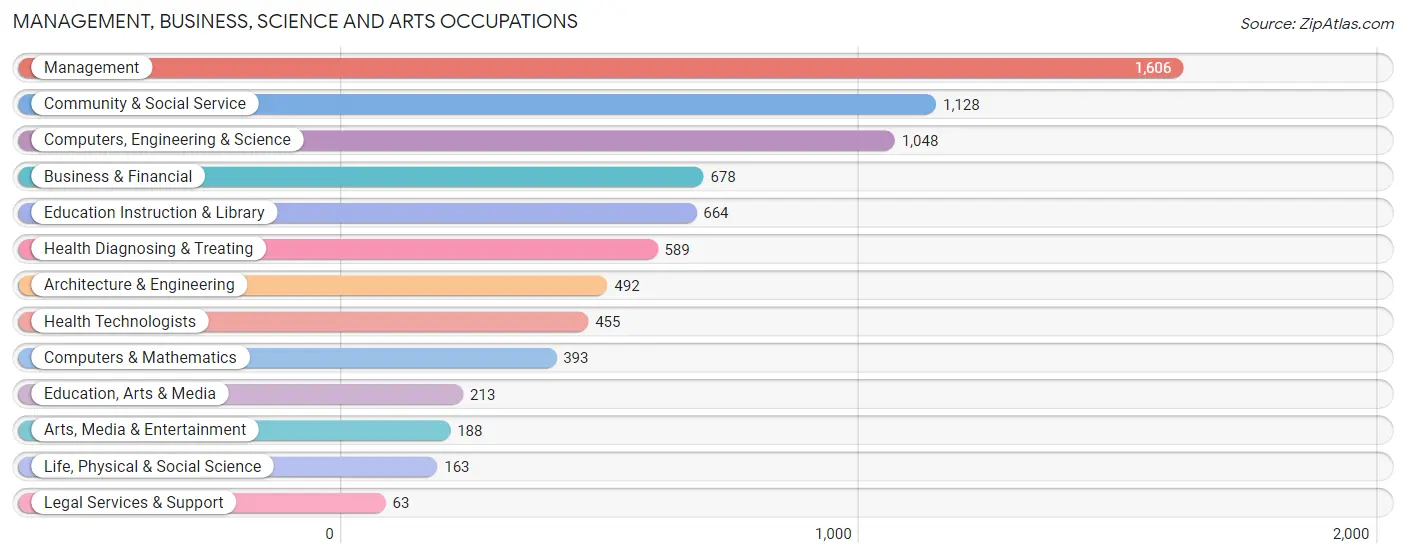
Management, Business, Science and Arts Occupations
The most common Management, Business, Science and Arts occupations in Saco are Management (1,606 | 13.0%), Community & Social Service (1,128 | 9.1%), Computers, Engineering & Science (1,048 | 8.5%), Business & Financial (678 | 5.5%), and Education Instruction & Library (664 | 5.4%).
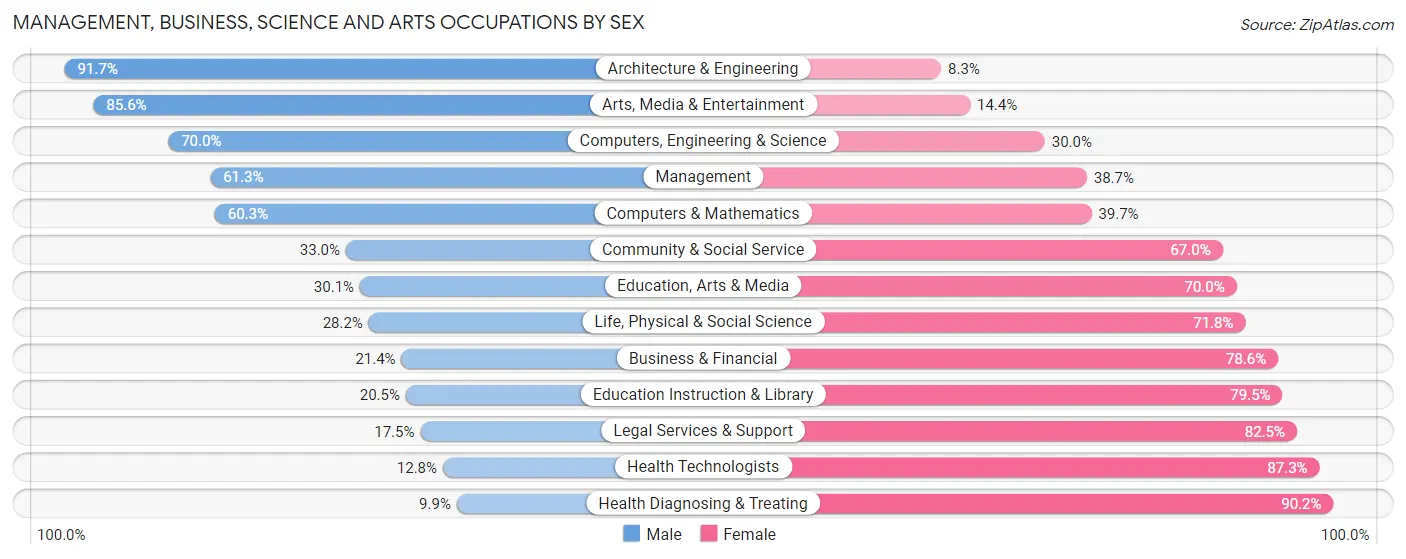
Management, Business, Science and Arts Occupations by Sex
Within the Management, Business, Science and Arts occupations in Saco, the most male-oriented occupations are Architecture & Engineering (91.7%), Arts, Media & Entertainment (85.6%), and Computers, Engineering & Science (70.0%), while the most female-oriented occupations are Health Diagnosing & Treating (90.1%), Health Technologists (87.3%), and Legal Services & Support (82.5%).
| Occupation | Male | Female |
| Management | 984 (61.3%) | 622 (38.7%) |
| Business & Financial | 145 (21.4%) | 533 (78.6%) |
| Computers, Engineering & Science | 734 (70.0%) | 314 (30.0%) |
| Computers & Mathematics | 237 (60.3%) | 156 (39.7%) |
| Architecture & Engineering | 451 (91.7%) | 41 (8.3%) |
| Life, Physical & Social Science | 46 (28.2%) | 117 (71.8%) |
| Community & Social Service | 372 (33.0%) | 756 (67.0%) |
| Education, Arts & Media | 64 (30.0%) | 149 (70.0%) |
| Legal Services & Support | 11 (17.5%) | 52 (82.5%) |
| Education Instruction & Library | 136 (20.5%) | 528 (79.5%) |
| Arts, Media & Entertainment | 161 (85.6%) | 27 (14.4%) |
| Health Diagnosing & Treating | 58 (9.9%) | 531 (90.1%) |
| Health Technologists | 58 (12.8%) | 397 (87.3%) |
| Total (Category) | 2,293 (45.4%) | 2,756 (54.6%) |
| Total (Overall) | 6,272 (50.8%) | 6,080 (49.2%) |
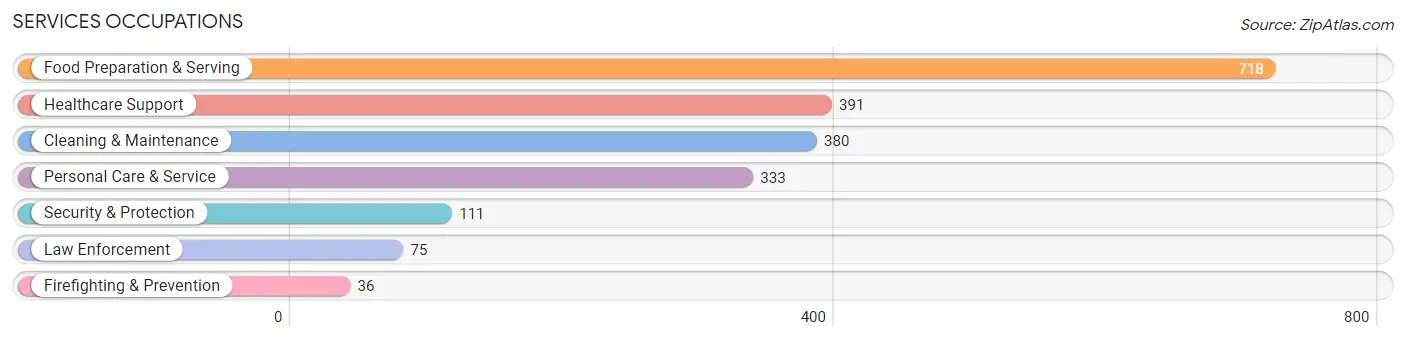
Services Occupations
The most common Services occupations in Saco are Food Preparation & Serving (718 | 5.8%), Healthcare Support (391 | 3.2%), Cleaning & Maintenance (380 | 3.1%), Personal Care & Service (333 | 2.7%), and Security & Protection (111 | 0.9%).
Services Occupations by Sex
Within the Services occupations in Saco, the most male-oriented occupations are Firefighting & Prevention (61.1%), Security & Protection (52.2%), and Cleaning & Maintenance (48.9%), while the most female-oriented occupations are Personal Care & Service (89.8%), Healthcare Support (83.1%), and Food Preparation & Serving (59.6%).

| Occupation | Male | Female |
| Healthcare Support | 66 (16.9%) | 325 (83.1%) |
| Security & Protection | 58 (52.2%) | 53 (47.7%) |
| Firefighting & Prevention | 22 (61.1%) | 14 (38.9%) |
| Law Enforcement | 36 (48.0%) | 39 (52.0%) |
| Food Preparation & Serving | 290 (40.4%) | 428 (59.6%) |
| Cleaning & Maintenance | 186 (48.9%) | 194 (51.0%) |
| Personal Care & Service | 34 (10.2%) | 299 (89.8%) |
| Total (Category) | 634 (32.8%) | 1,299 (67.2%) |
| Total (Overall) | 6,272 (50.8%) | 6,080 (49.2%) |
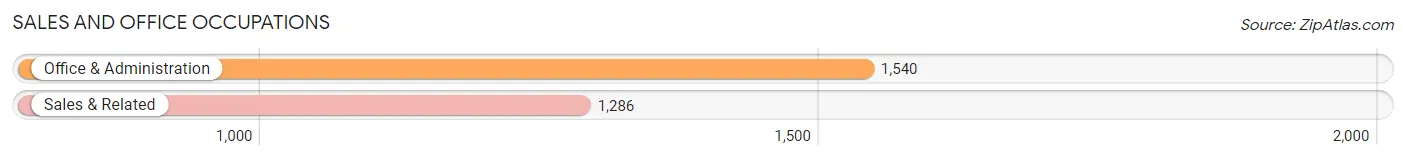
Sales and Office Occupations
The most common Sales and Office occupations in Saco are Office & Administration (1,540 | 12.5%), and Sales & Related (1,286 | 10.4%).
Sales and Office Occupations by Sex
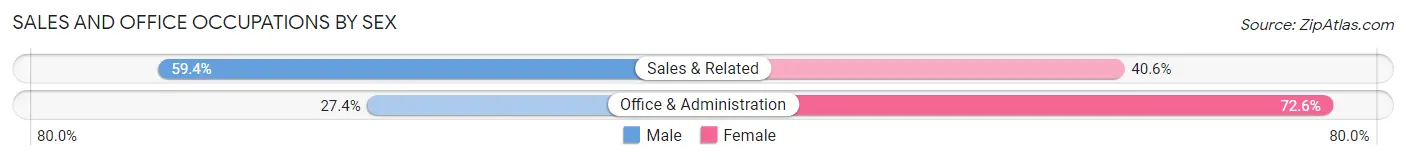
| Occupation | Male | Female |
| Sales & Related | 764 (59.4%) | 522 (40.6%) |
| Office & Administration | 422 (27.4%) | 1,118 (72.6%) |
| Total (Category) | 1,186 (42.0%) | 1,640 (58.0%) |
| Total (Overall) | 6,272 (50.8%) | 6,080 (49.2%) |
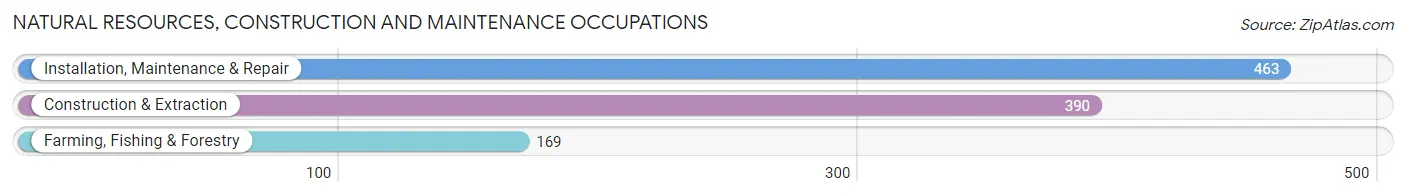
Natural Resources, Construction and Maintenance Occupations
The most common Natural Resources, Construction and Maintenance occupations in Saco are Installation, Maintenance & Repair (463 | 3.7%), Construction & Extraction (390 | 3.2%), and Farming, Fishing & Forestry (169 | 1.4%).
Natural Resources, Construction and Maintenance Occupations by Sex
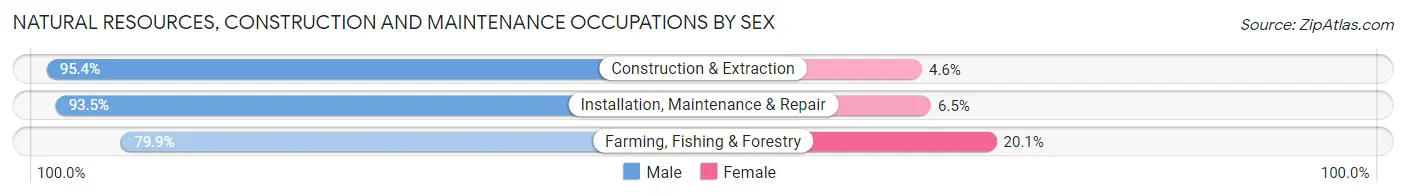
| Occupation | Male | Female |
| Farming, Fishing & Forestry | 135 (79.9%) | 34 (20.1%) |
| Construction & Extraction | 372 (95.4%) | 18 (4.6%) |
| Installation, Maintenance & Repair | 433 (93.5%) | 30 (6.5%) |
| Total (Category) | 940 (92.0%) | 82 (8.0%) |
| Total (Overall) | 6,272 (50.8%) | 6,080 (49.2%) |
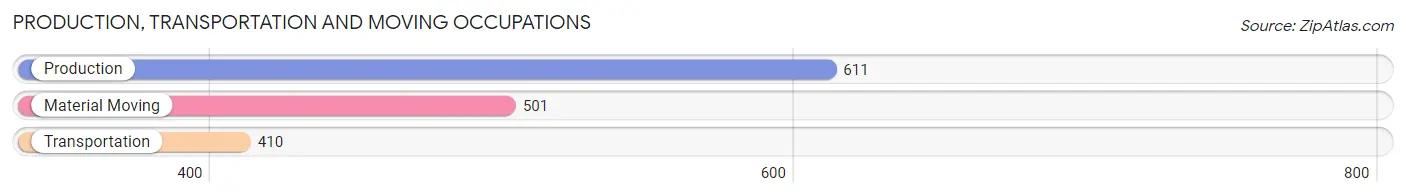
Production, Transportation and Moving Occupations
The most common Production, Transportation and Moving occupations in Saco are Production (611 | 5.0%), Material Moving (501 | 4.1%), and Transportation (410 | 3.3%).
Production, Transportation and Moving Occupations by Sex
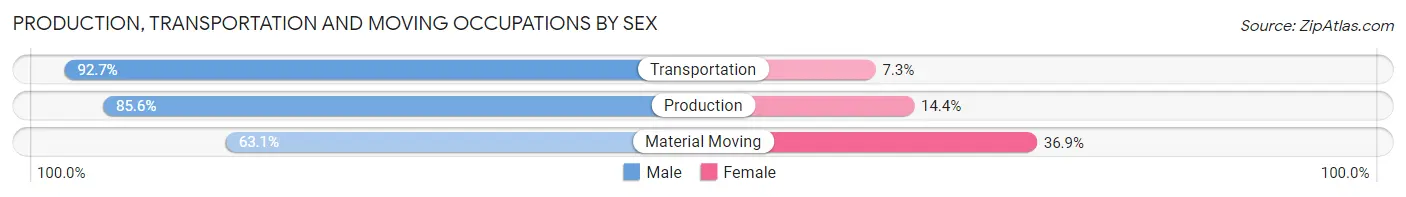
| Occupation | Male | Female |
| Production | 523 (85.6%) | 88 (14.4%) |
| Transportation | 380 (92.7%) | 30 (7.3%) |
| Material Moving | 316 (63.1%) | 185 (36.9%) |
| Total (Category) | 1,219 (80.1%) | 303 (19.9%) |
| Total (Overall) | 6,272 (50.8%) | 6,080 (49.2%) |
Employment Industries by Sex in Saco
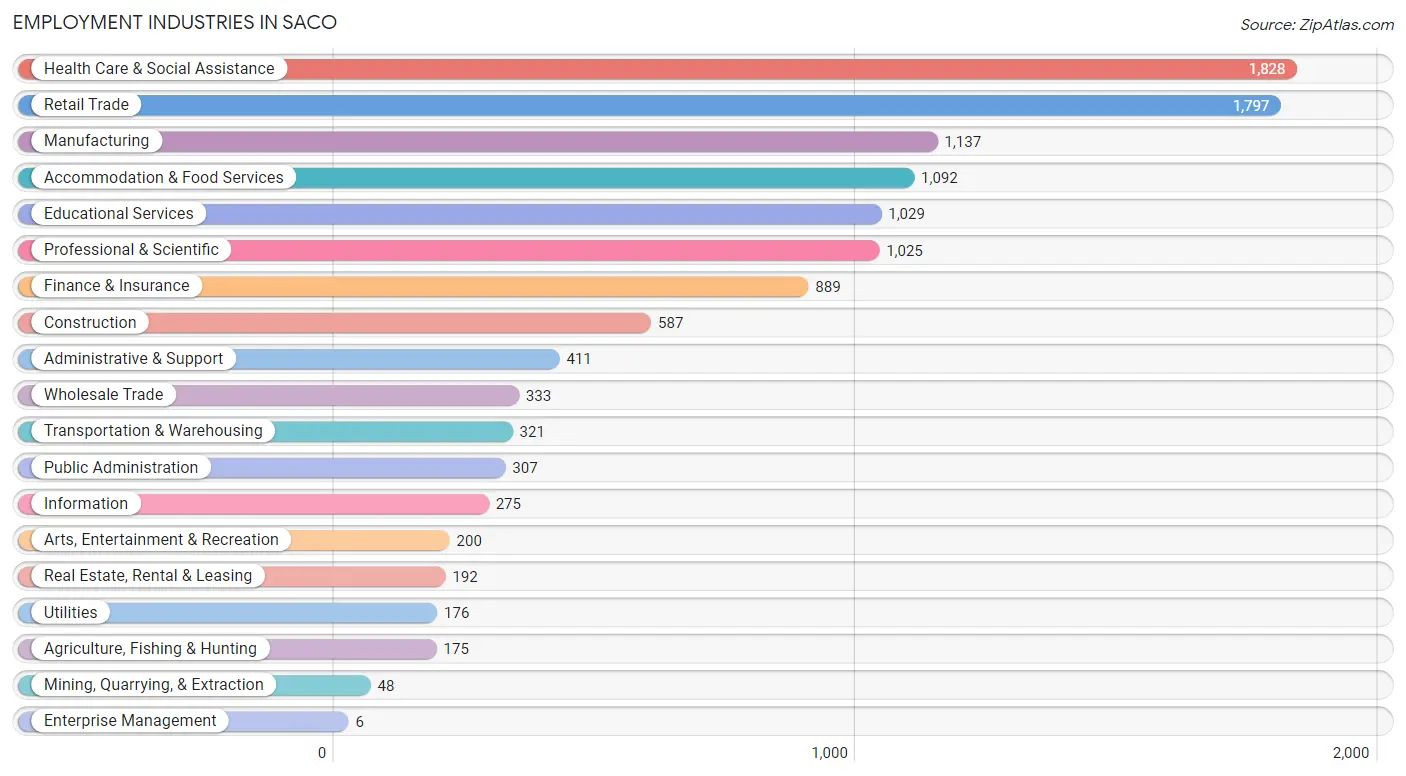
Employment Industries in Saco
The major employment industries in Saco include Health Care & Social Assistance (1,828 | 14.8%), Retail Trade (1,797 | 14.5%), Manufacturing (1,137 | 9.2%), Accommodation & Food Services (1,092 | 8.8%), and Educational Services (1,029 | 8.3%).
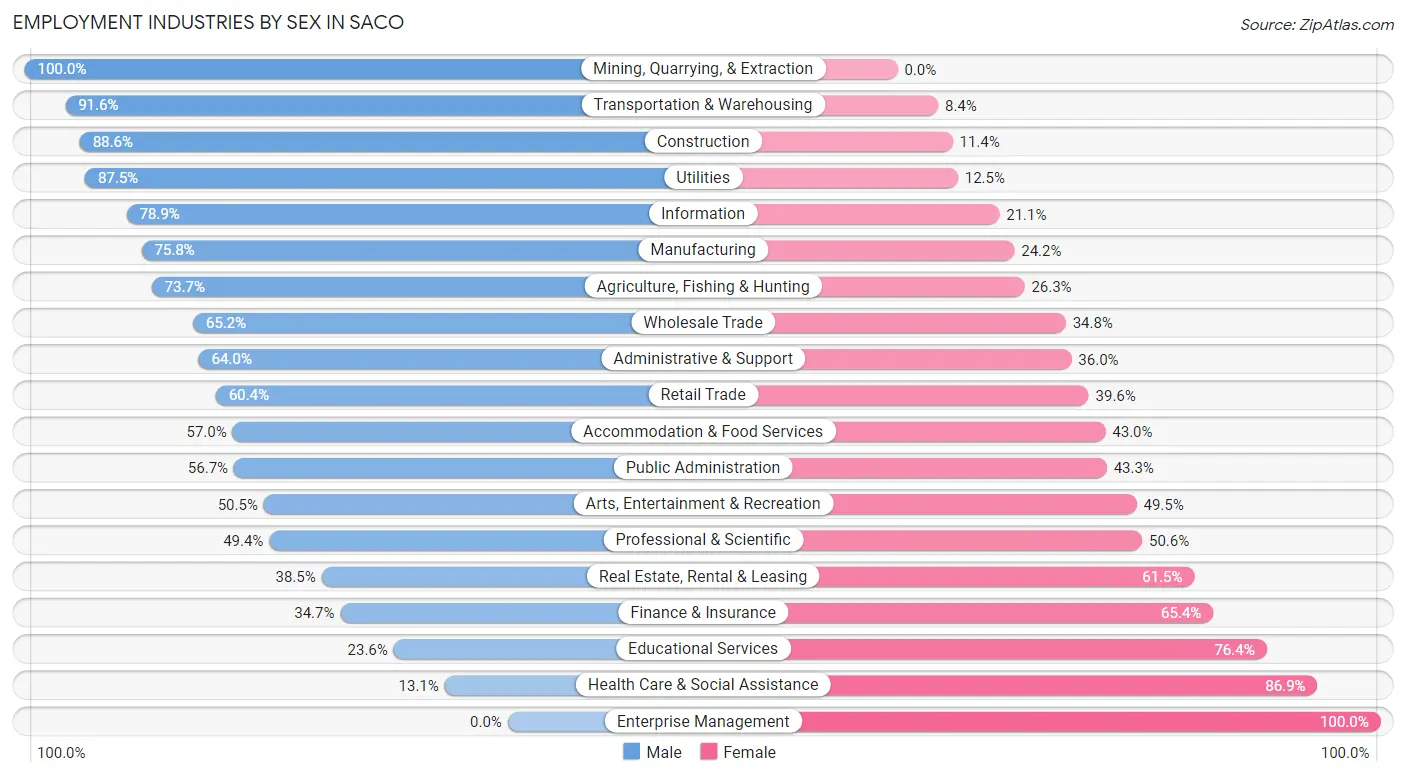
Employment Industries by Sex in Saco
The Saco industries that see more men than women are Mining, Quarrying, & Extraction (100.0%), Transportation & Warehousing (91.6%), and Construction (88.6%), whereas the industries that tend to have a higher number of women are Enterprise Management (100.0%), Health Care & Social Assistance (86.9%), and Educational Services (76.4%).
| Industry | Male | Female |
| Agriculture, Fishing & Hunting | 129 (73.7%) | 46 (26.3%) |
| Mining, Quarrying, & Extraction | 48 (100.0%) | 0 (0.0%) |
| Construction | 520 (88.6%) | 67 (11.4%) |
| Manufacturing | 862 (75.8%) | 275 (24.2%) |
| Wholesale Trade | 217 (65.2%) | 116 (34.8%) |
| Retail Trade | 1,086 (60.4%) | 711 (39.6%) |
| Transportation & Warehousing | 294 (91.6%) | 27 (8.4%) |
| Utilities | 154 (87.5%) | 22 (12.5%) |
| Information | 217 (78.9%) | 58 (21.1%) |
| Finance & Insurance | 308 (34.6%) | 581 (65.3%) |
| Real Estate, Rental & Leasing | 74 (38.5%) | 118 (61.5%) |
| Professional & Scientific | 506 (49.4%) | 519 (50.6%) |
| Enterprise Management | 0 (0.0%) | 6 (100.0%) |
| Administrative & Support | 263 (64.0%) | 148 (36.0%) |
| Educational Services | 243 (23.6%) | 786 (76.4%) |
| Health Care & Social Assistance | 239 (13.1%) | 1,589 (86.9%) |
| Arts, Entertainment & Recreation | 101 (50.5%) | 99 (49.5%) |
| Accommodation & Food Services | 622 (57.0%) | 470 (43.0%) |
| Public Administration | 174 (56.7%) | 133 (43.3%) |
| Total | 6,272 (50.8%) | 6,080 (49.2%) |
Education in Saco
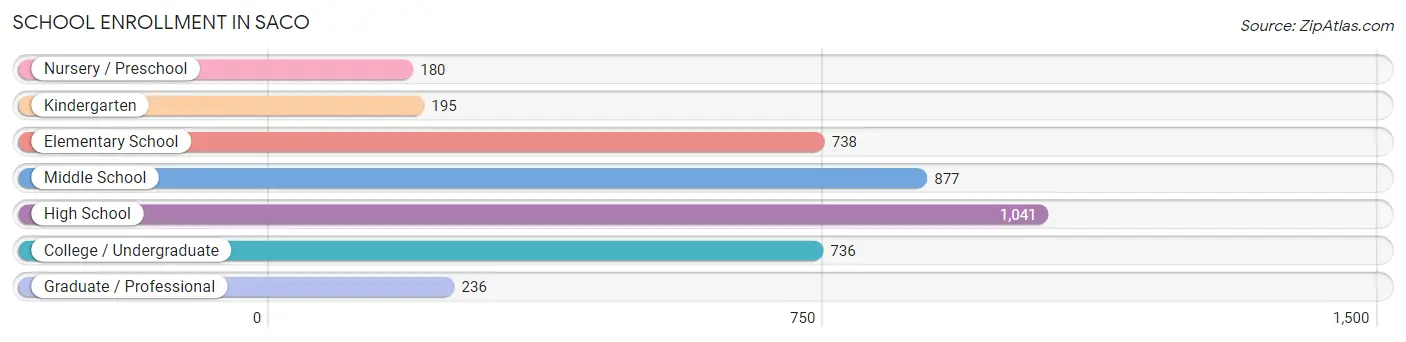
School Enrollment in Saco
The most common levels of schooling among the 4,003 students in Saco are high school (1,041 | 26.0%), middle school (877 | 21.9%), and elementary school (738 | 18.4%).
| School Level | # Students | % Students |
| Nursery / Preschool | 180 | 4.5% |
| Kindergarten | 195 | 4.9% |
| Elementary School | 738 | 18.4% |
| Middle School | 877 | 21.9% |
| High School | 1,041 | 26.0% |
| College / Undergraduate | 736 | 18.4% |
| Graduate / Professional | 236 | 5.9% |
| Total | 4,003 | 100.0% |
School Enrollment by Age by Funding Source in Saco
Out of a total of 4,003 students who are enrolled in schools in Saco, 809 (20.2%) attend a private institution, while the remaining 3,194 (79.8%) are enrolled in public schools. The age group of 3 to 4 year olds has the highest likelihood of being enrolled in private schools, with 109 (78.4% in the age bracket) enrolled. Conversely, the age group of 5 to 9 year old has the lowest likelihood of being enrolled in a private school, with 767 (89.5% in the age bracket) attending a public institution.
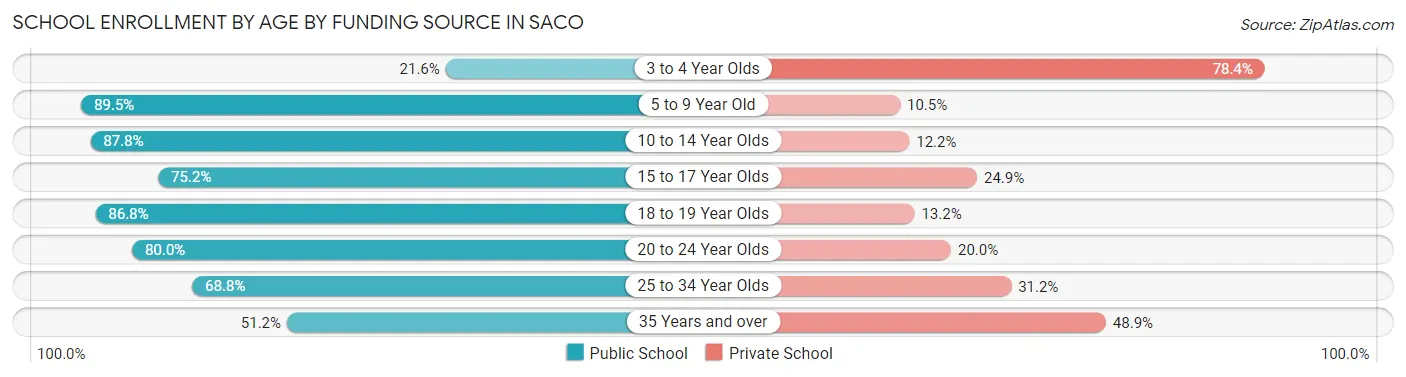
| Age Bracket | Public School | Private School |
| 3 to 4 Year Olds | 30 (21.6%) | 109 (78.4%) |
| 5 to 9 Year Old | 767 (89.5%) | 90 (10.5%) |
| 10 to 14 Year Olds | 1,026 (87.8%) | 143 (12.2%) |
| 15 to 17 Year Olds | 496 (75.1%) | 164 (24.8%) |
| 18 to 19 Year Olds | 283 (86.8%) | 43 (13.2%) |
| 20 to 24 Year Olds | 308 (80.0%) | 77 (20.0%) |
| 25 to 34 Year Olds | 172 (68.8%) | 78 (31.2%) |
| 35 Years and over | 111 (51.1%) | 106 (48.8%) |
| Total | 3,194 (79.8%) | 809 (20.2%) |
Educational Attainment by Field of Study in Saco
Business (1,088 | 16.3%), education (953 | 14.3%), social sciences (684 | 10.2%), science & technology (682 | 10.2%), and psychology (493 | 7.4%) are the most common fields of study among 6,683 individuals in Saco who have obtained a bachelor's degree or higher.
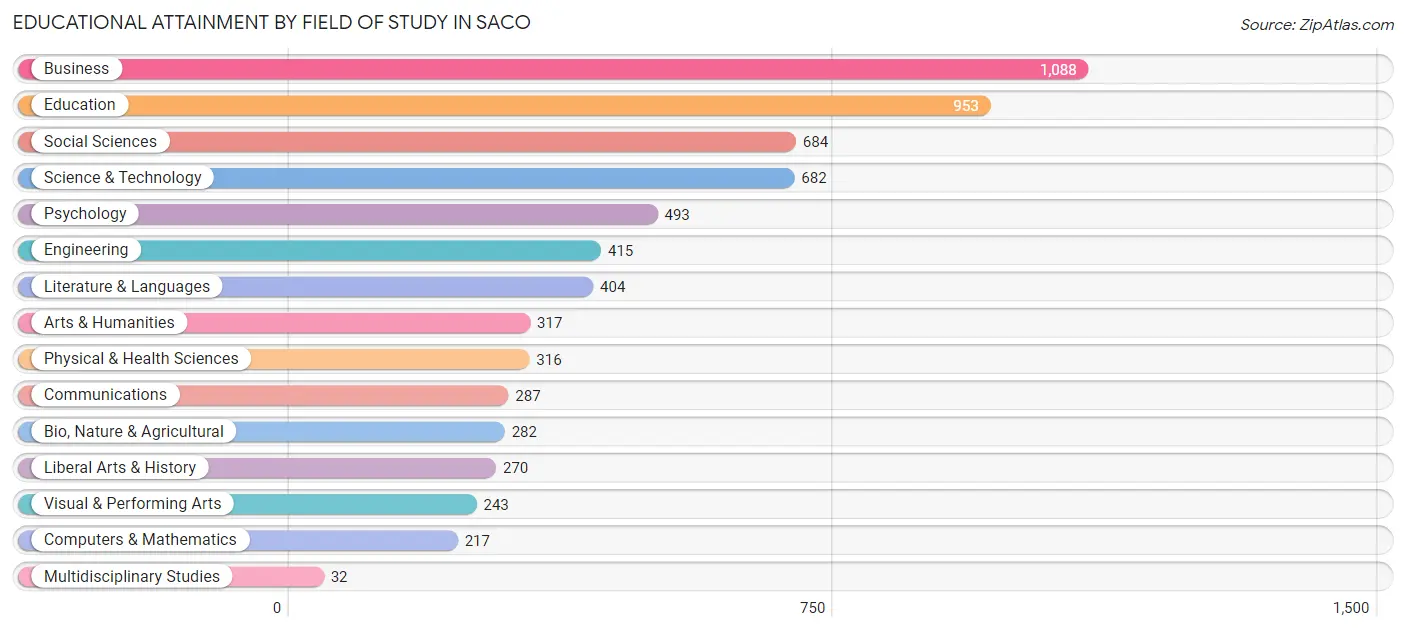
| Field of Study | # Graduates | % Graduates |
| Computers & Mathematics | 217 | 3.3% |
| Bio, Nature & Agricultural | 282 | 4.2% |
| Physical & Health Sciences | 316 | 4.7% |
| Psychology | 493 | 7.4% |
| Social Sciences | 684 | 10.2% |
| Engineering | 415 | 6.2% |
| Multidisciplinary Studies | 32 | 0.5% |
| Science & Technology | 682 | 10.2% |
| Business | 1,088 | 16.3% |
| Education | 953 | 14.3% |
| Literature & Languages | 404 | 6.0% |
| Liberal Arts & History | 270 | 4.0% |
| Visual & Performing Arts | 243 | 3.6% |
| Communications | 287 | 4.3% |
| Arts & Humanities | 317 | 4.7% |
| Total | 6,683 | 100.0% |
Transportation & Commute in Saco
Vehicle Availability by Sex in Saco
The most prevalent vehicle ownership categories in Saco are males with 2 vehicles (3,224, accounting for 52.7%) and females with 2 vehicles (2,543, making up 55.0%).
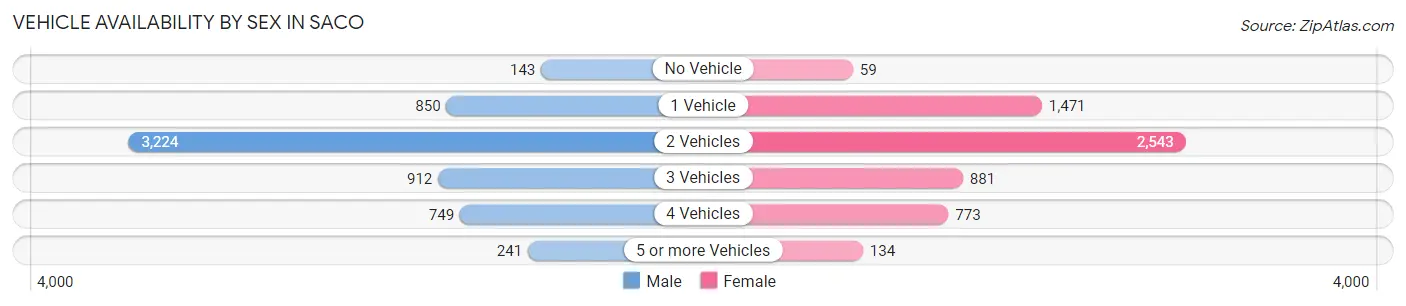
| Vehicles Available | Male | Female |
| No Vehicle | 143 (2.3%) | 59 (1.0%) |
| 1 Vehicle | 850 (13.9%) | 1,471 (25.1%) |
| 2 Vehicles | 3,224 (52.7%) | 2,543 (43.4%) |
| 3 Vehicles | 912 (14.9%) | 881 (15.0%) |
| 4 Vehicles | 749 (12.2%) | 773 (13.2%) |
| 5 or more Vehicles | 241 (3.9%) | 134 (2.3%) |
| Total | 6,119 (100.0%) | 5,861 (100.0%) |
Commute Time in Saco
The most frequently occuring commute durations in Saco are 20 to 24 minutes (2,151 commuters, 20.2%), 30 to 34 minutes (1,654 commuters, 15.5%), and 15 to 19 minutes (1,559 commuters, 14.7%).
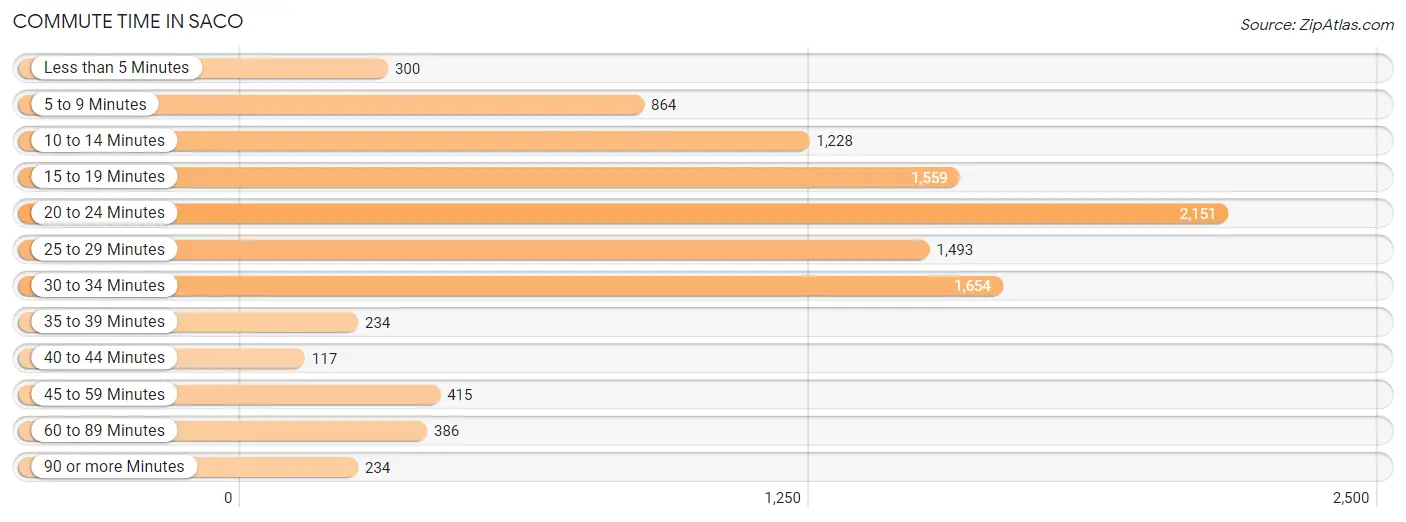
| Commute Time | # Commuters | % Commuters |
| Less than 5 Minutes | 300 | 2.8% |
| 5 to 9 Minutes | 864 | 8.1% |
| 10 to 14 Minutes | 1,228 | 11.6% |
| 15 to 19 Minutes | 1,559 | 14.7% |
| 20 to 24 Minutes | 2,151 | 20.2% |
| 25 to 29 Minutes | 1,493 | 14.0% |
| 30 to 34 Minutes | 1,654 | 15.5% |
| 35 to 39 Minutes | 234 | 2.2% |
| 40 to 44 Minutes | 117 | 1.1% |
| 45 to 59 Minutes | 415 | 3.9% |
| 60 to 89 Minutes | 386 | 3.6% |
| 90 or more Minutes | 234 | 2.2% |
Commute Time by Sex in Saco
The most common commute times in Saco are 20 to 24 minutes (1,191 commuters, 22.3%) for males and 20 to 24 minutes (960 commuters, 18.1%) for females.
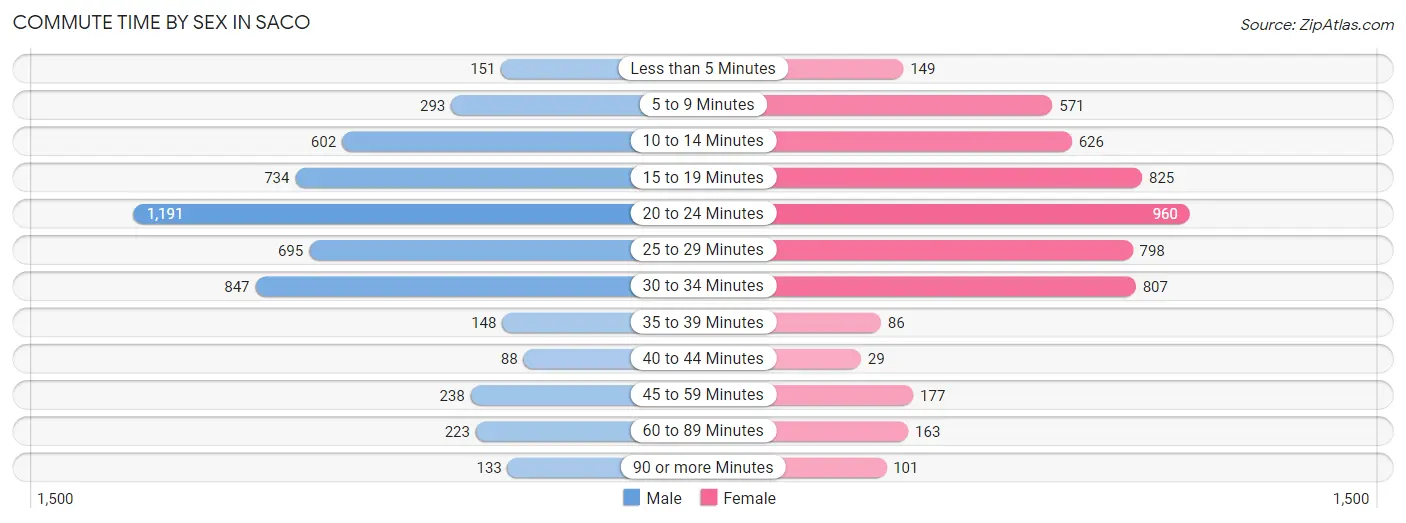
| Commute Time | Male | Female |
| Less than 5 Minutes | 151 (2.8%) | 149 (2.8%) |
| 5 to 9 Minutes | 293 (5.5%) | 571 (10.8%) |
| 10 to 14 Minutes | 602 (11.3%) | 626 (11.8%) |
| 15 to 19 Minutes | 734 (13.7%) | 825 (15.6%) |
| 20 to 24 Minutes | 1,191 (22.3%) | 960 (18.1%) |
| 25 to 29 Minutes | 695 (13.0%) | 798 (15.1%) |
| 30 to 34 Minutes | 847 (15.9%) | 807 (15.2%) |
| 35 to 39 Minutes | 148 (2.8%) | 86 (1.6%) |
| 40 to 44 Minutes | 88 (1.7%) | 29 (0.5%) |
| 45 to 59 Minutes | 238 (4.4%) | 177 (3.3%) |
| 60 to 89 Minutes | 223 (4.2%) | 163 (3.1%) |
| 90 or more Minutes | 133 (2.5%) | 101 (1.9%) |
Time of Departure to Work by Sex in Saco
The most frequent times of departure to work in Saco are 6:30 AM to 6:59 AM (899, 16.8%) for males and 7:00 AM to 7:29 AM (1,048, 19.8%) for females.
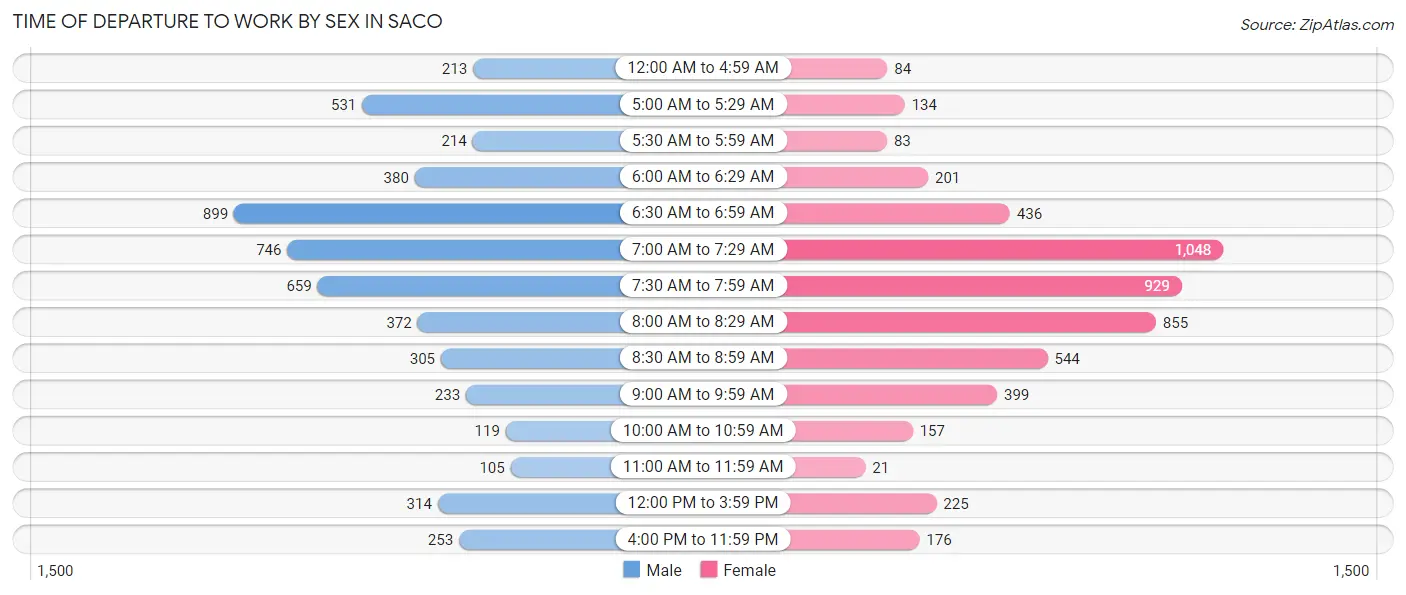
| Time of Departure | Male | Female |
| 12:00 AM to 4:59 AM | 213 (4.0%) | 84 (1.6%) |
| 5:00 AM to 5:29 AM | 531 (9.9%) | 134 (2.5%) |
| 5:30 AM to 5:59 AM | 214 (4.0%) | 83 (1.6%) |
| 6:00 AM to 6:29 AM | 380 (7.1%) | 201 (3.8%) |
| 6:30 AM to 6:59 AM | 899 (16.8%) | 436 (8.2%) |
| 7:00 AM to 7:29 AM | 746 (14.0%) | 1,048 (19.8%) |
| 7:30 AM to 7:59 AM | 659 (12.3%) | 929 (17.5%) |
| 8:00 AM to 8:29 AM | 372 (7.0%) | 855 (16.2%) |
| 8:30 AM to 8:59 AM | 305 (5.7%) | 544 (10.3%) |
| 9:00 AM to 9:59 AM | 233 (4.4%) | 399 (7.5%) |
| 10:00 AM to 10:59 AM | 119 (2.2%) | 157 (3.0%) |
| 11:00 AM to 11:59 AM | 105 (2.0%) | 21 (0.4%) |
| 12:00 PM to 3:59 PM | 314 (5.9%) | 225 (4.3%) |
| 4:00 PM to 11:59 PM | 253 (4.7%) | 176 (3.3%) |
| Total | 5,343 (100.0%) | 5,292 (100.0%) |
Housing Occupancy in Saco
Occupancy by Ownership in Saco
Of the total 8,872 dwellings in Saco, owner-occupied units account for 6,073 (68.4%), while renter-occupied units make up 2,799 (31.6%).
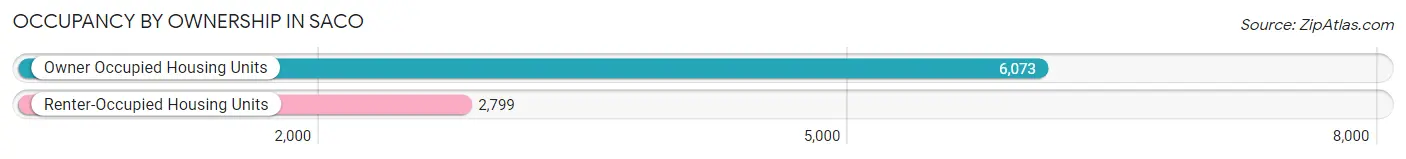
| Occupancy | # Housing Units | % Housing Units |
| Owner Occupied Housing Units | 6,073 | 68.4% |
| Renter-Occupied Housing Units | 2,799 | 31.6% |
| Total Occupied Housing Units | 8,872 | 100.0% |
Occupancy by Household Size in Saco
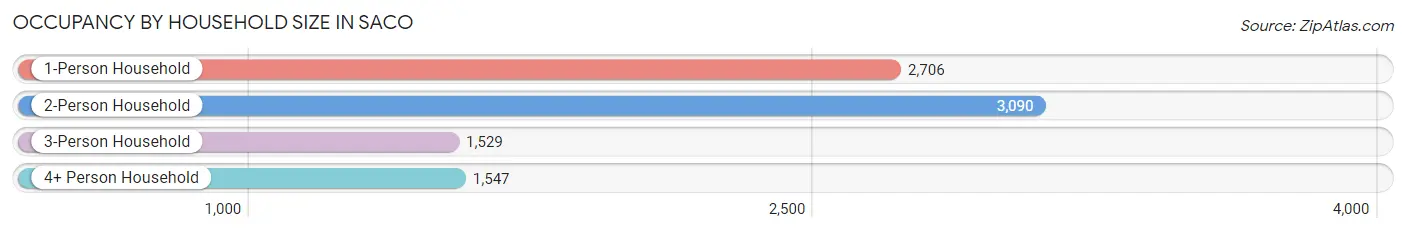
| Household Size | # Housing Units | % Housing Units |
| 1-Person Household | 2,706 | 30.5% |
| 2-Person Household | 3,090 | 34.8% |
| 3-Person Household | 1,529 | 17.2% |
| 4+ Person Household | 1,547 | 17.4% |
| Total Housing Units | 8,872 | 100.0% |
Occupancy by Ownership by Household Size in Saco
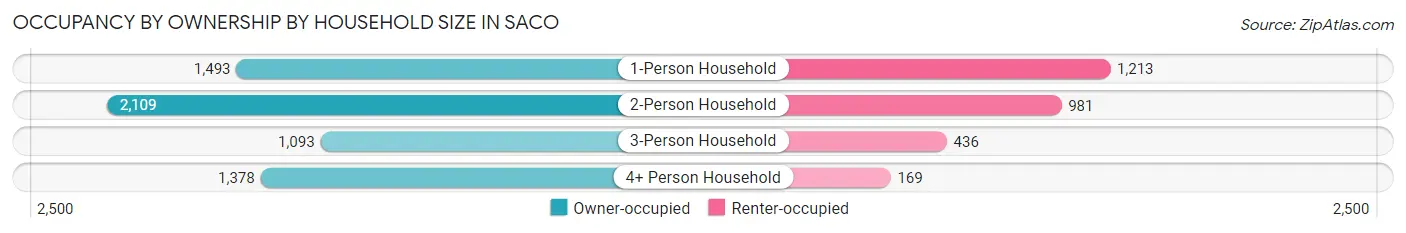
| Household Size | Owner-occupied | Renter-occupied |
| 1-Person Household | 1,493 (55.2%) | 1,213 (44.8%) |
| 2-Person Household | 2,109 (68.2%) | 981 (31.8%) |
| 3-Person Household | 1,093 (71.5%) | 436 (28.5%) |
| 4+ Person Household | 1,378 (89.1%) | 169 (10.9%) |
| Total Housing Units | 6,073 (68.4%) | 2,799 (31.6%) |
Occupancy by Educational Attainment in Saco
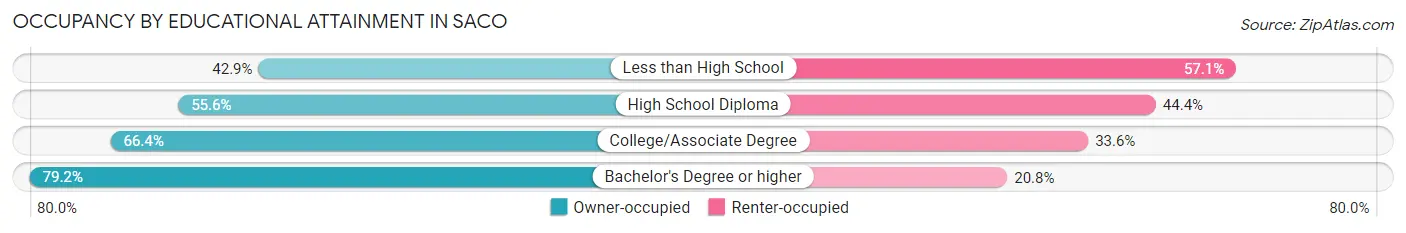
| Household Size | Owner-occupied | Renter-occupied |
| Less than High School | 103 (42.9%) | 137 (57.1%) |
| High School Diploma | 1,304 (55.6%) | 1,040 (44.4%) |
| College/Associate Degree | 1,624 (66.4%) | 823 (33.6%) |
| Bachelor's Degree or higher | 3,042 (79.2%) | 799 (20.8%) |
Occupancy by Age of Householder in Saco
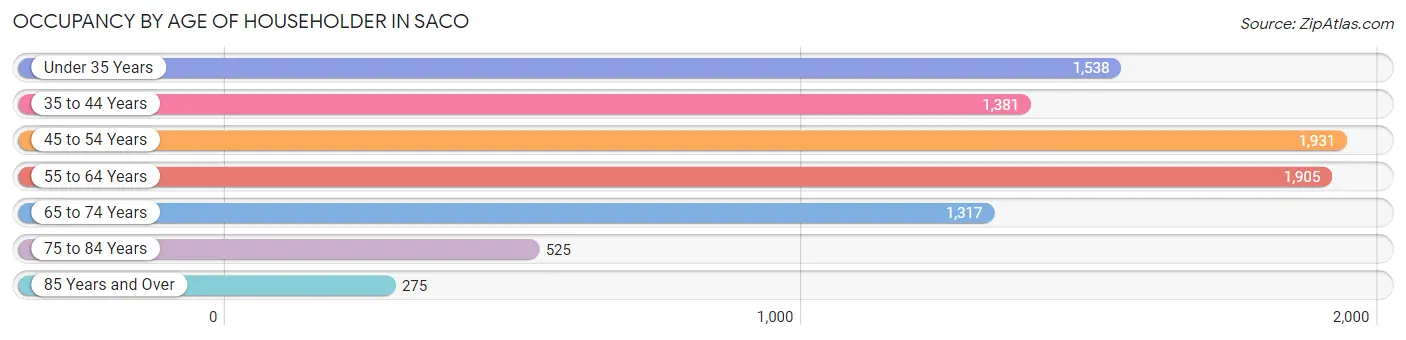
| Age Bracket | # Households | % Households |
| Under 35 Years | 1,538 | 17.3% |
| 35 to 44 Years | 1,381 | 15.6% |
| 45 to 54 Years | 1,931 | 21.8% |
| 55 to 64 Years | 1,905 | 21.5% |
| 65 to 74 Years | 1,317 | 14.8% |
| 75 to 84 Years | 525 | 5.9% |
| 85 Years and Over | 275 | 3.1% |
| Total | 8,872 | 100.0% |
Housing Finances in Saco
Median Income by Occupancy in Saco
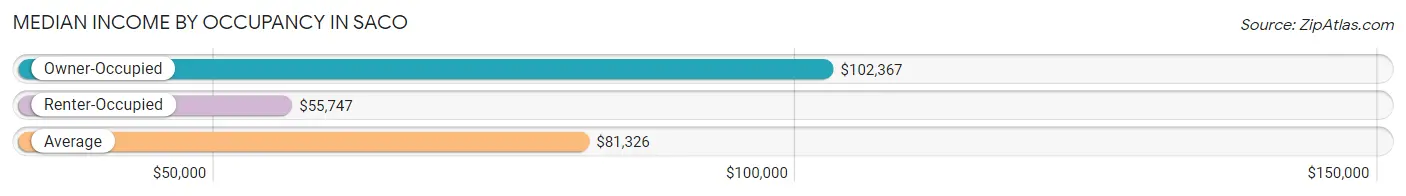
| Occupancy Type | # Households | Median Income |
| Owner-Occupied | 6,073 (68.4%) | $102,367 |
| Renter-Occupied | 2,799 (31.6%) | $55,747 |
| Average | 8,872 (100.0%) | $81,326 |
Occupancy by Householder Income Bracket in Saco
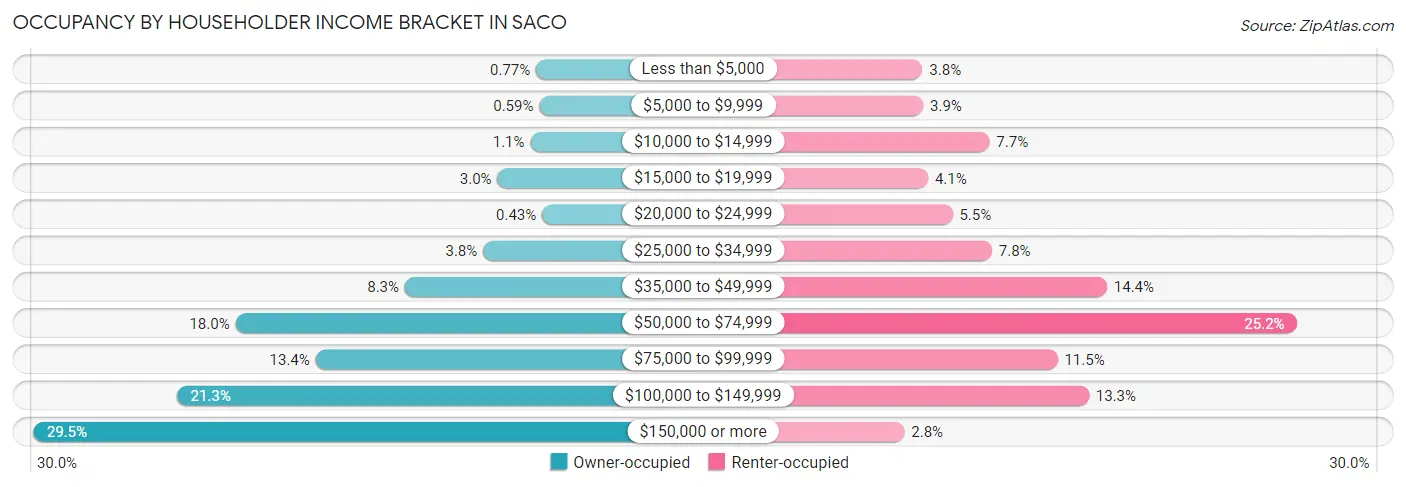
| Income Bracket | Owner-occupied | Renter-occupied |
| Less than $5,000 | 47 (0.8%) | 107 (3.8%) |
| $5,000 to $9,999 | 36 (0.6%) | 108 (3.9%) |
| $10,000 to $14,999 | 67 (1.1%) | 214 (7.6%) |
| $15,000 to $19,999 | 181 (3.0%) | 116 (4.1%) |
| $20,000 to $24,999 | 26 (0.4%) | 155 (5.5%) |
| $25,000 to $34,999 | 231 (3.8%) | 218 (7.8%) |
| $35,000 to $49,999 | 502 (8.3%) | 402 (14.4%) |
| $50,000 to $74,999 | 1,090 (17.9%) | 705 (25.2%) |
| $75,000 to $99,999 | 812 (13.4%) | 323 (11.5%) |
| $100,000 to $149,999 | 1,291 (21.3%) | 373 (13.3%) |
| $150,000 or more | 1,790 (29.5%) | 78 (2.8%) |
| Total | 6,073 (100.0%) | 2,799 (100.0%) |
Monthly Housing Cost Tiers in Saco
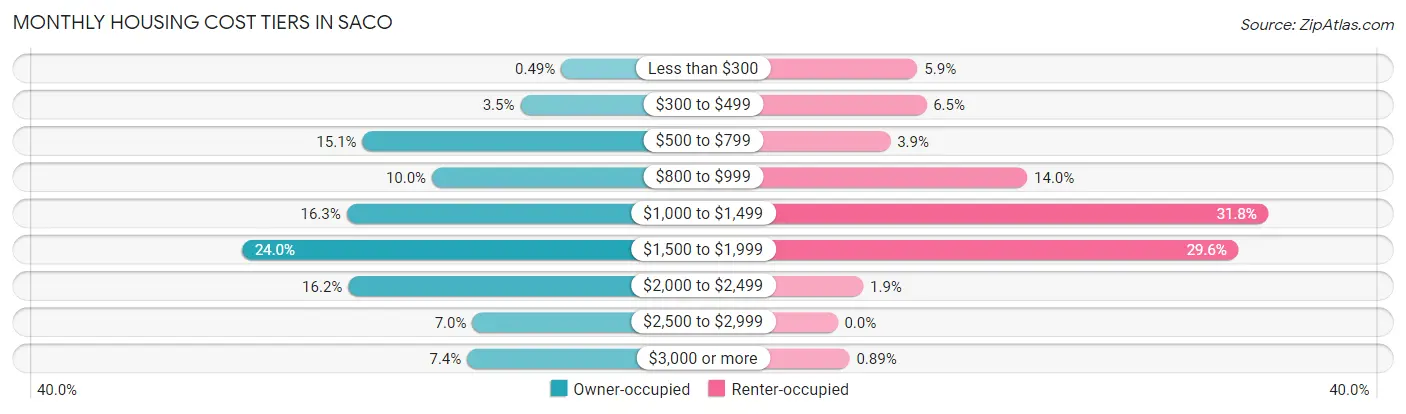
| Monthly Cost | Owner-occupied | Renter-occupied |
| Less than $300 | 30 (0.5%) | 165 (5.9%) |
| $300 to $499 | 212 (3.5%) | 183 (6.5%) |
| $500 to $799 | 918 (15.1%) | 109 (3.9%) |
| $800 to $999 | 607 (10.0%) | 391 (14.0%) |
| $1,000 to $1,499 | 989 (16.3%) | 889 (31.8%) |
| $1,500 to $1,999 | 1,458 (24.0%) | 827 (29.5%) |
| $2,000 to $2,499 | 982 (16.2%) | 53 (1.9%) |
| $2,500 to $2,999 | 427 (7.0%) | 0 (0.0%) |
| $3,000 or more | 450 (7.4%) | 25 (0.9%) |
| Total | 6,073 (100.0%) | 2,799 (100.0%) |
Physical Housing Characteristics in Saco
Housing Structures in Saco
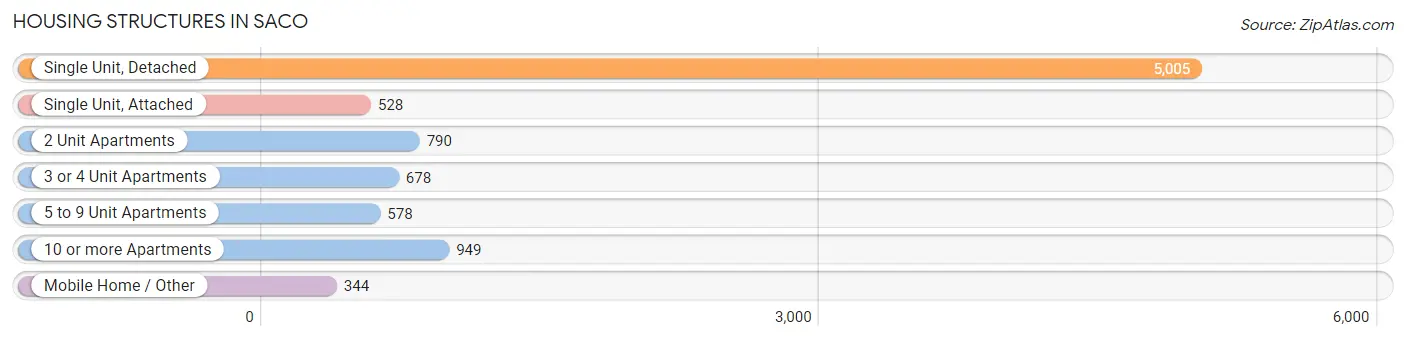
| Structure Type | # Housing Units | % Housing Units |
| Single Unit, Detached | 5,005 | 56.4% |
| Single Unit, Attached | 528 | 5.9% |
| 2 Unit Apartments | 790 | 8.9% |
| 3 or 4 Unit Apartments | 678 | 7.6% |
| 5 to 9 Unit Apartments | 578 | 6.5% |
| 10 or more Apartments | 949 | 10.7% |
| Mobile Home / Other | 344 | 3.9% |
| Total | 8,872 | 100.0% |
Housing Structures by Occupancy in Saco
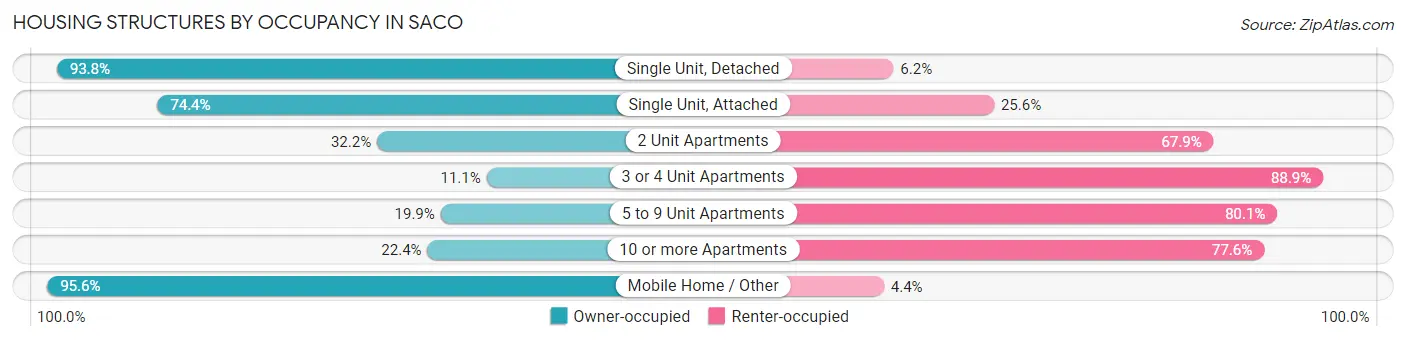
| Structure Type | Owner-occupied | Renter-occupied |
| Single Unit, Detached | 4,694 (93.8%) | 311 (6.2%) |
| Single Unit, Attached | 393 (74.4%) | 135 (25.6%) |
| 2 Unit Apartments | 254 (32.2%) | 536 (67.8%) |
| 3 or 4 Unit Apartments | 75 (11.1%) | 603 (88.9%) |
| 5 to 9 Unit Apartments | 115 (19.9%) | 463 (80.1%) |
| 10 or more Apartments | 213 (22.4%) | 736 (77.6%) |
| Mobile Home / Other | 329 (95.6%) | 15 (4.4%) |
| Total | 6,073 (68.4%) | 2,799 (31.6%) |
Housing Structures by Number of Rooms in Saco
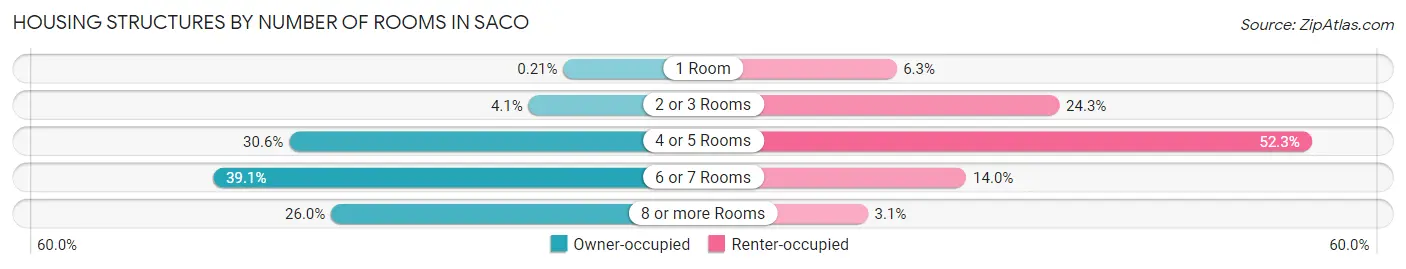
| Number of Rooms | Owner-occupied | Renter-occupied |
| 1 Room | 13 (0.2%) | 175 (6.2%) |
| 2 or 3 Rooms | 247 (4.1%) | 681 (24.3%) |
| 4 or 5 Rooms | 1,861 (30.6%) | 1,465 (52.3%) |
| 6 or 7 Rooms | 2,374 (39.1%) | 392 (14.0%) |
| 8 or more Rooms | 1,578 (26.0%) | 86 (3.1%) |
| Total | 6,073 (100.0%) | 2,799 (100.0%) |
Housing Structure by Heating Type in Saco
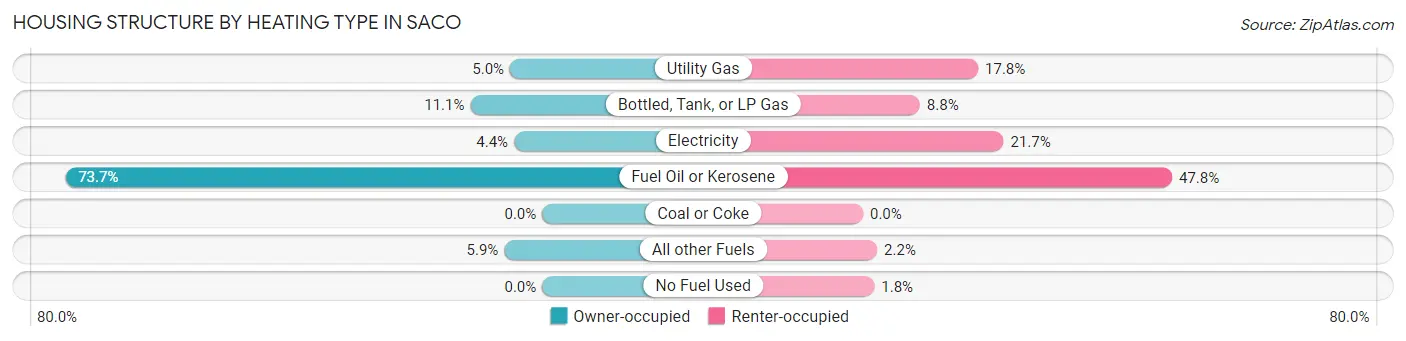
| Heating Type | Owner-occupied | Renter-occupied |
| Utility Gas | 302 (5.0%) | 498 (17.8%) |
| Bottled, Tank, or LP Gas | 674 (11.1%) | 246 (8.8%) |
| Electricity | 264 (4.3%) | 608 (21.7%) |
| Fuel Oil or Kerosene | 4,477 (73.7%) | 1,337 (47.8%) |
| Coal or Coke | 0 (0.0%) | 0 (0.0%) |
| All other Fuels | 356 (5.9%) | 61 (2.2%) |
| No Fuel Used | 0 (0.0%) | 49 (1.8%) |
| Total | 6,073 (100.0%) | 2,799 (100.0%) |
Household Vehicle Usage in Saco
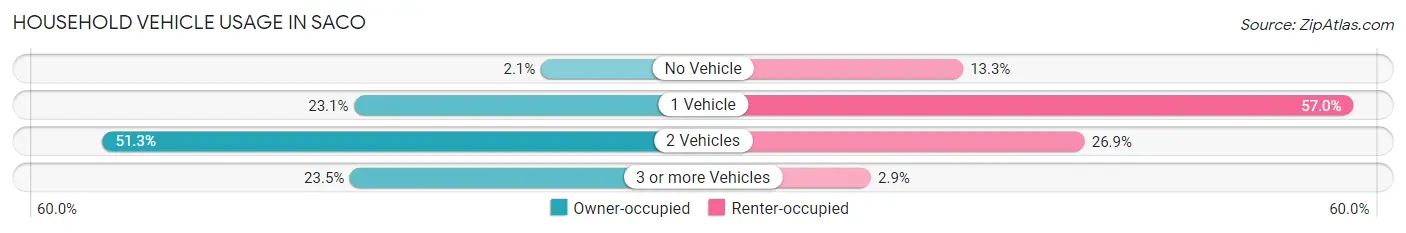
| Vehicles per Household | Owner-occupied | Renter-occupied |
| No Vehicle | 130 (2.1%) | 371 (13.3%) |
| 1 Vehicle | 1,401 (23.1%) | 1,594 (57.0%) |
| 2 Vehicles | 3,113 (51.3%) | 752 (26.9%) |
| 3 or more Vehicles | 1,429 (23.5%) | 82 (2.9%) |
| Total | 6,073 (100.0%) | 2,799 (100.0%) |
Real Estate & Mortgages in Saco
Real Estate and Mortgage Overview in Saco
| Characteristic | Without Mortgage | With Mortgage |
| Housing Units | 1,920 | 4,153 |
| Median Property Value | $332,200 | $350,800 |
| Median Household Income | $79,844 | $1,461 |
| Monthly Housing Costs | $774 | $450 |
| Real Estate Taxes | $4,356 | $12 |
Property Value by Mortgage Status in Saco
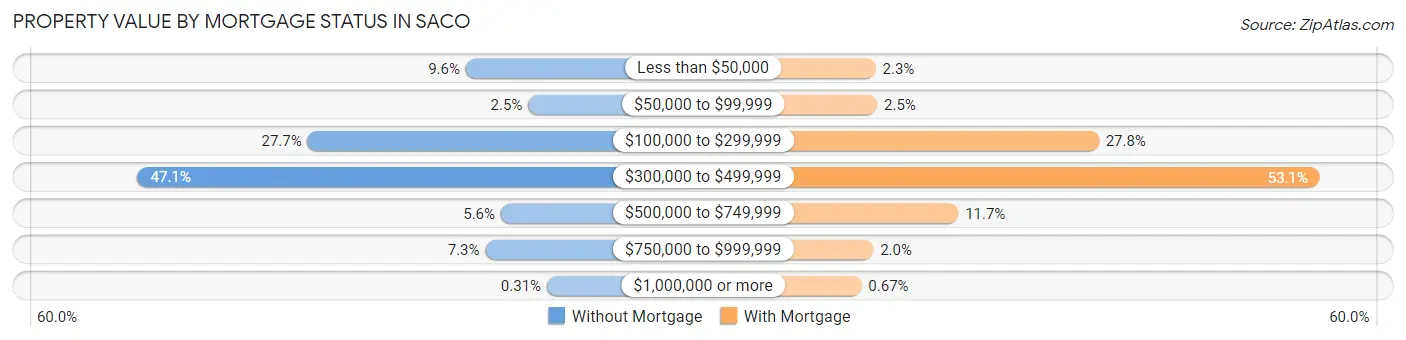
| Property Value | Without Mortgage | With Mortgage |
| Less than $50,000 | 184 (9.6%) | 95 (2.3%) |
| $50,000 to $99,999 | 47 (2.5%) | 102 (2.5%) |
| $100,000 to $299,999 | 531 (27.7%) | 1,154 (27.8%) |
| $300,000 to $499,999 | 904 (47.1%) | 2,203 (53.0%) |
| $500,000 to $749,999 | 107 (5.6%) | 487 (11.7%) |
| $750,000 to $999,999 | 141 (7.3%) | 84 (2.0%) |
| $1,000,000 or more | 6 (0.3%) | 28 (0.7%) |
| Total | 1,920 (100.0%) | 4,153 (100.0%) |
Household Income by Mortgage Status in Saco
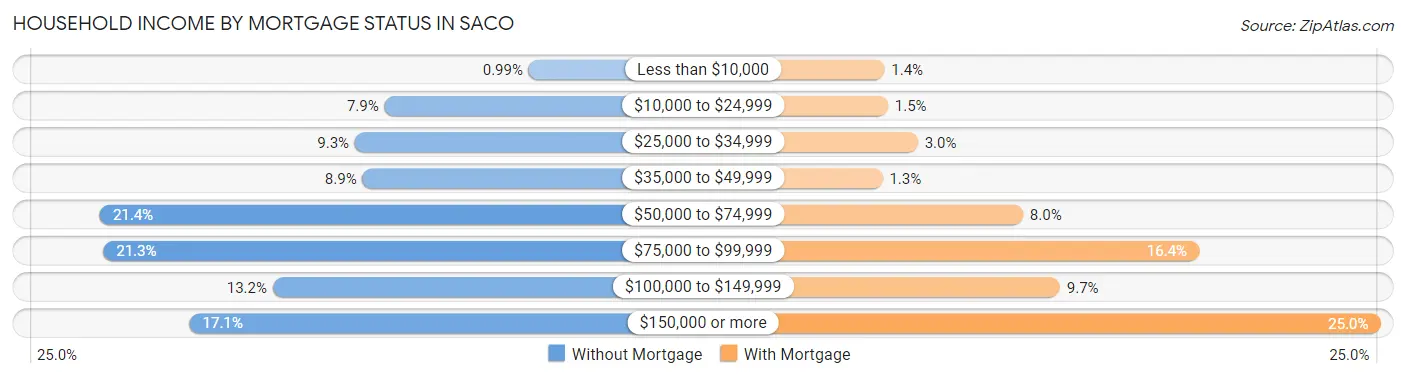
| Household Income | Without Mortgage | With Mortgage |
| Less than $10,000 | 19 (1.0%) | 57 (1.4%) |
| $10,000 to $24,999 | 151 (7.9%) | 64 (1.5%) |
| $25,000 to $34,999 | 178 (9.3%) | 123 (3.0%) |
| $35,000 to $49,999 | 171 (8.9%) | 53 (1.3%) |
| $50,000 to $74,999 | 411 (21.4%) | 331 (8.0%) |
| $75,000 to $99,999 | 408 (21.2%) | 679 (16.4%) |
| $100,000 to $149,999 | 253 (13.2%) | 404 (9.7%) |
| $150,000 or more | 329 (17.1%) | 1,038 (25.0%) |
| Total | 1,920 (100.0%) | 4,153 (100.0%) |
Property Value to Household Income Ratio in Saco
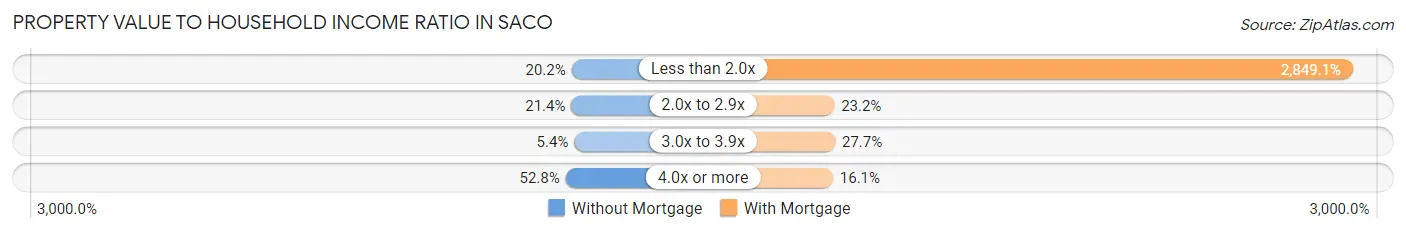
| Value-to-Income Ratio | Without Mortgage | With Mortgage |
| Less than 2.0x | 388 (20.2%) | 118,324 (2,849.1%) |
| 2.0x to 2.9x | 410 (21.3%) | 965 (23.2%) |
| 3.0x to 3.9x | 103 (5.4%) | 1,149 (27.7%) |
| 4.0x or more | 1,014 (52.8%) | 668 (16.1%) |
| Total | 1,920 (100.0%) | 4,153 (100.0%) |
Real Estate Taxes by Mortgage Status in Saco
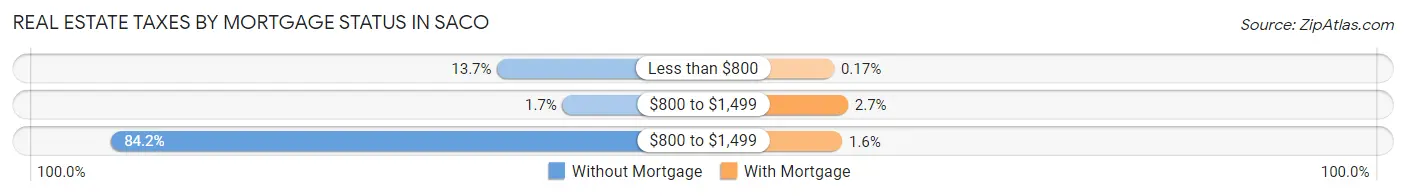
| Property Taxes | Without Mortgage | With Mortgage |
| Less than $800 | 262 (13.7%) | 7 (0.2%) |
| $800 to $1,499 | 33 (1.7%) | 112 (2.7%) |
| $800 to $1,499 | 1,616 (84.2%) | 68 (1.6%) |
| Total | 1,920 (100.0%) | 4,153 (100.0%) |
Health & Disability in Saco
Health Insurance Coverage by Age in Saco
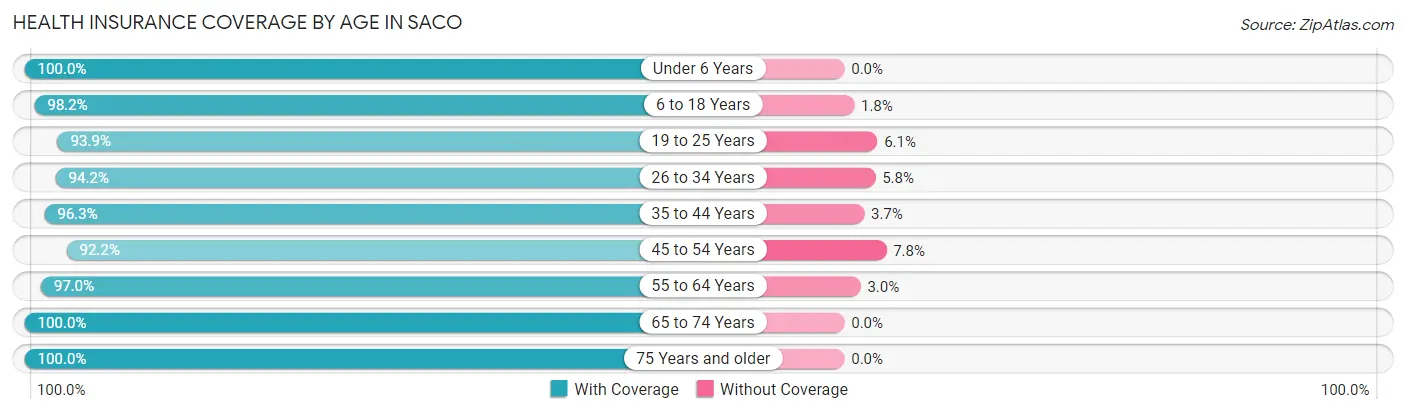
| Age Bracket | With Coverage | Without Coverage |
| Under 6 Years | 1,030 (100.0%) | 0 (0.0%) |
| 6 to 18 Years | 2,800 (98.2%) | 52 (1.8%) |
| 19 to 25 Years | 1,498 (93.9%) | 98 (6.1%) |
| 26 to 34 Years | 2,579 (94.2%) | 158 (5.8%) |
| 35 to 44 Years | 2,380 (96.3%) | 91 (3.7%) |
| 45 to 54 Years | 2,875 (92.2%) | 244 (7.8%) |
| 55 to 64 Years | 2,959 (97.0%) | 92 (3.0%) |
| 65 to 74 Years | 2,106 (100.0%) | 0 (0.0%) |
| 75 Years and older | 1,300 (100.0%) | 0 (0.0%) |
| Total | 19,527 (96.4%) | 735 (3.6%) |
Health Insurance Coverage by Citizenship Status in Saco
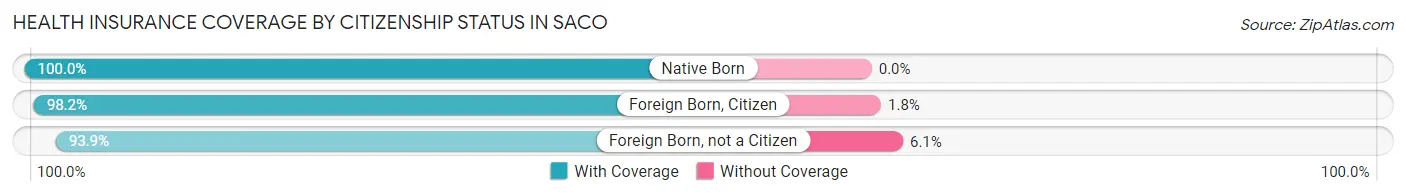
| Citizenship Status | With Coverage | Without Coverage |
| Native Born | 1,030 (100.0%) | 0 (0.0%) |
| Foreign Born, Citizen | 2,800 (98.2%) | 52 (1.8%) |
| Foreign Born, not a Citizen | 1,498 (93.9%) | 98 (6.1%) |
Health Insurance Coverage by Household Income in Saco
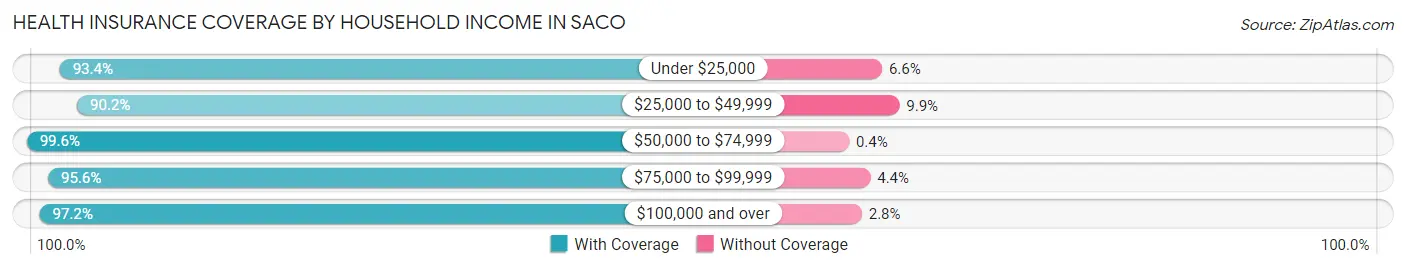
| Household Income | With Coverage | Without Coverage |
| Under $25,000 | 1,489 (93.4%) | 105 (6.6%) |
| $25,000 to $49,999 | 1,867 (90.1%) | 204 (9.9%) |
| $50,000 to $74,999 | 3,251 (99.6%) | 13 (0.4%) |
| $75,000 to $99,999 | 2,498 (95.6%) | 115 (4.4%) |
| $100,000 and over | 10,290 (97.2%) | 298 (2.8%) |
Public vs Private Health Insurance Coverage by Age in Saco
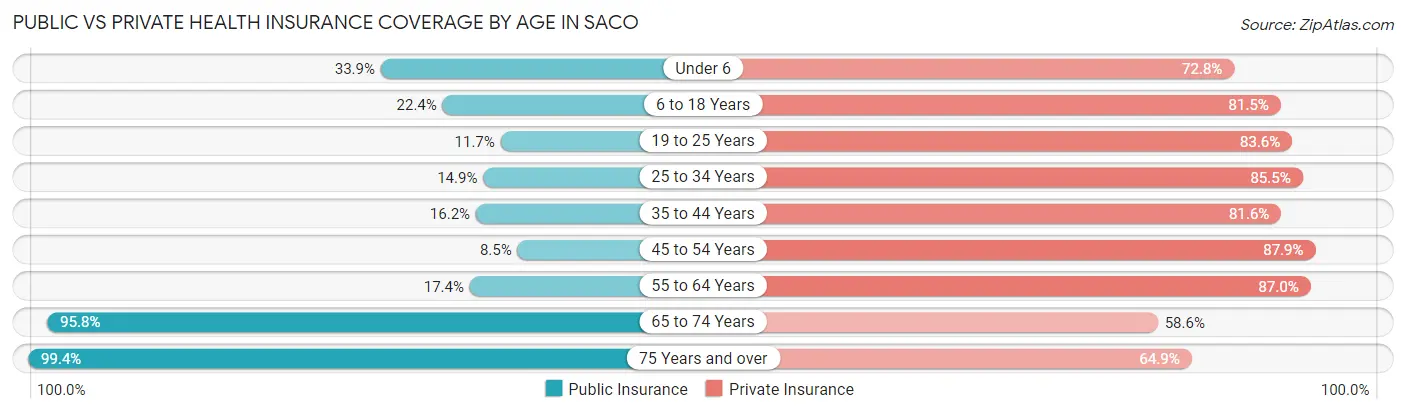
| Age Bracket | Public Insurance | Private Insurance |
| Under 6 | 349 (33.9%) | 750 (72.8%) |
| 6 to 18 Years | 639 (22.4%) | 2,323 (81.5%) |
| 19 to 25 Years | 186 (11.7%) | 1,334 (83.6%) |
| 25 to 34 Years | 407 (14.9%) | 2,340 (85.5%) |
| 35 to 44 Years | 401 (16.2%) | 2,015 (81.6%) |
| 45 to 54 Years | 265 (8.5%) | 2,741 (87.9%) |
| 55 to 64 Years | 530 (17.4%) | 2,655 (87.0%) |
| 65 to 74 Years | 2,018 (95.8%) | 1,235 (58.6%) |
| 75 Years and over | 1,292 (99.4%) | 844 (64.9%) |
| Total | 6,087 (30.0%) | 16,237 (80.1%) |
Disability Status by Sex by Age in Saco

| Age Bracket | Male | Female |
| Under 5 Years | 0 (0.0%) | 0 (0.0%) |
| 5 to 17 Years | 89 (6.0%) | 45 (3.6%) |
| 18 to 34 Years | 144 (6.3%) | 258 (10.9%) |
| 35 to 64 Years | 622 (15.0%) | 465 (10.3%) |
| 65 to 74 Years | 356 (33.3%) | 168 (16.2%) |
| 75 Years and over | 222 (43.5%) | 340 (43.0%) |
Disability Class by Sex by Age in Saco
Disability Class: Hearing Difficulty
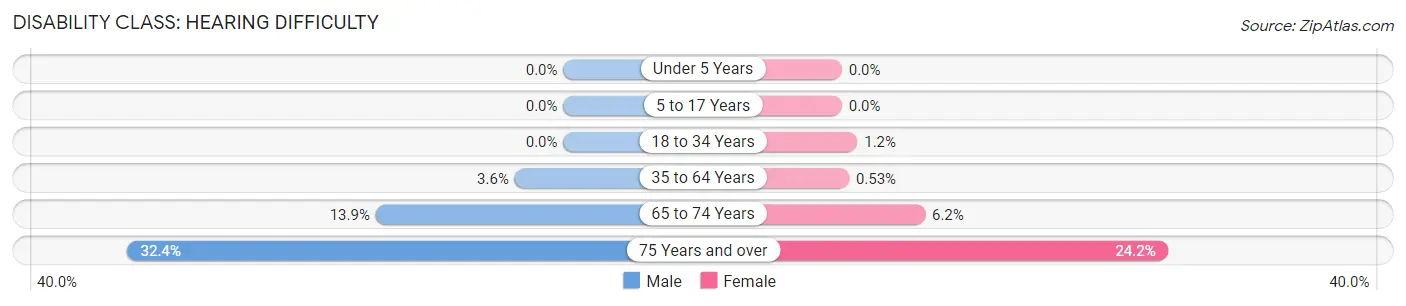
| Age Bracket | Male | Female |
| Under 5 Years | 0 (0.0%) | 0 (0.0%) |
| 5 to 17 Years | 0 (0.0%) | 0 (0.0%) |
| 18 to 34 Years | 0 (0.0%) | 27 (1.1%) |
| 35 to 64 Years | 149 (3.6%) | 24 (0.5%) |
| 65 to 74 Years | 149 (13.9%) | 64 (6.2%) |
| 75 Years and over | 165 (32.4%) | 191 (24.2%) |
Disability Class: Vision Difficulty
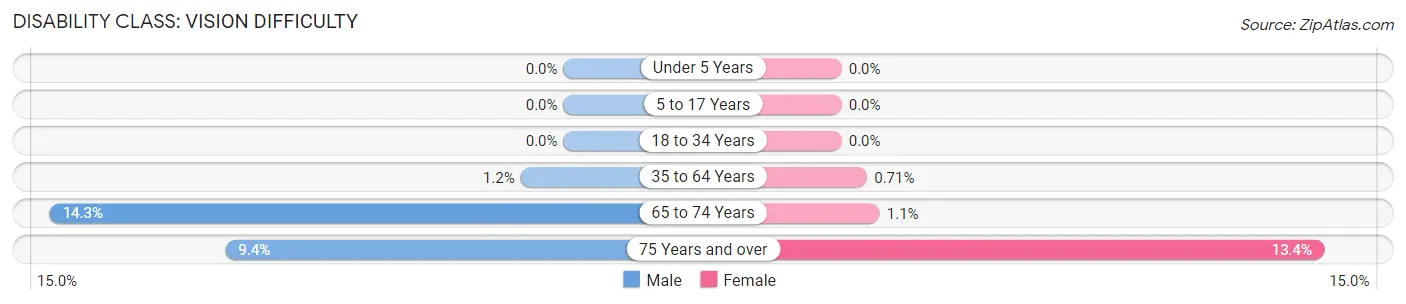
| Age Bracket | Male | Female |
| Under 5 Years | 0 (0.0%) | 0 (0.0%) |
| 5 to 17 Years | 0 (0.0%) | 0 (0.0%) |
| 18 to 34 Years | 0 (0.0%) | 0 (0.0%) |
| 35 to 64 Years | 49 (1.2%) | 32 (0.7%) |
| 65 to 74 Years | 153 (14.3%) | 11 (1.1%) |
| 75 Years and over | 48 (9.4%) | 106 (13.4%) |
Disability Class: Cognitive Difficulty
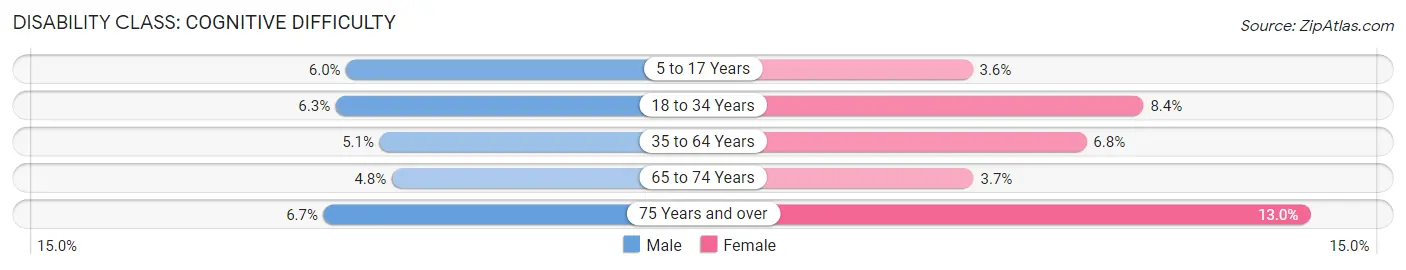
| Age Bracket | Male | Female |
| 5 to 17 Years | 89 (6.0%) | 45 (3.6%) |
| 18 to 34 Years | 144 (6.3%) | 198 (8.4%) |
| 35 to 64 Years | 211 (5.1%) | 307 (6.8%) |
| 65 to 74 Years | 51 (4.8%) | 38 (3.7%) |
| 75 Years and over | 34 (6.7%) | 103 (13.0%) |
Disability Class: Ambulatory Difficulty
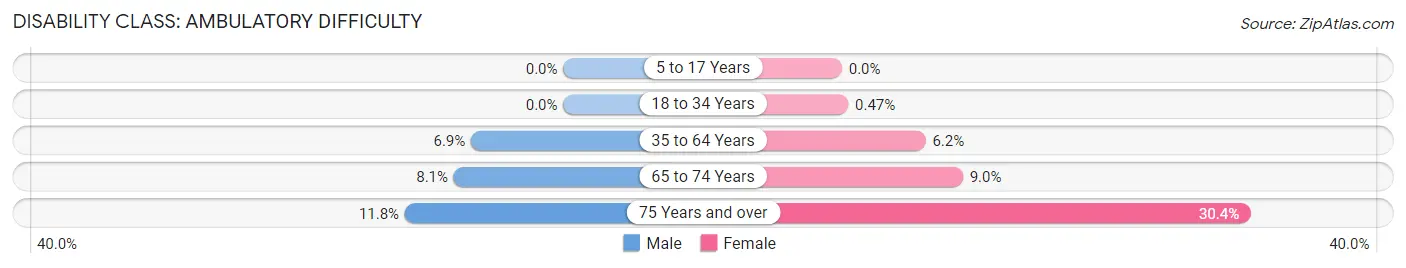
| Age Bracket | Male | Female |
| 5 to 17 Years | 0 (0.0%) | 0 (0.0%) |
| 18 to 34 Years | 0 (0.0%) | 11 (0.5%) |
| 35 to 64 Years | 283 (6.9%) | 280 (6.2%) |
| 65 to 74 Years | 87 (8.1%) | 93 (9.0%) |
| 75 Years and over | 60 (11.8%) | 240 (30.4%) |
Disability Class: Self-Care Difficulty
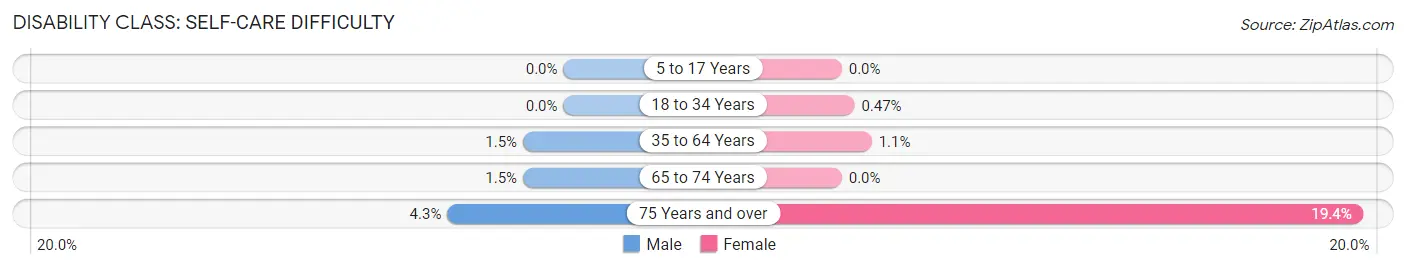
| Age Bracket | Male | Female |
| 5 to 17 Years | 0 (0.0%) | 0 (0.0%) |
| 18 to 34 Years | 0 (0.0%) | 11 (0.5%) |
| 35 to 64 Years | 62 (1.5%) | 50 (1.1%) |
| 65 to 74 Years | 16 (1.5%) | 0 (0.0%) |
| 75 Years and over | 22 (4.3%) | 153 (19.4%) |
Technology Access in Saco
Computing Device Access in Saco
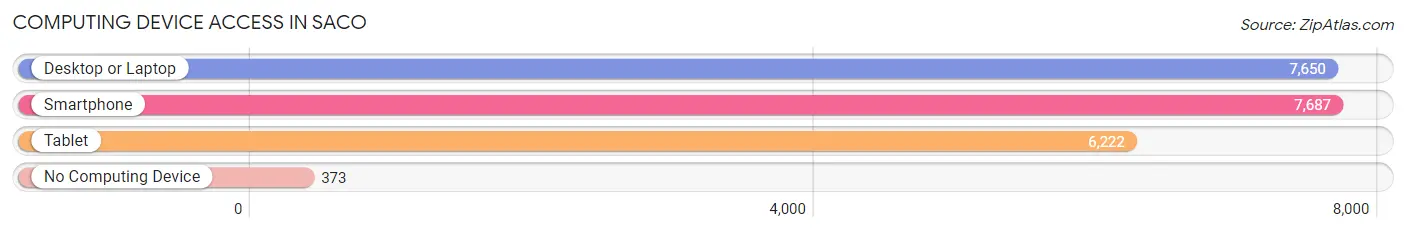
| Device Type | # Households | % Households |
| Desktop or Laptop | 7,650 | 86.2% |
| Smartphone | 7,687 | 86.6% |
| Tablet | 6,222 | 70.1% |
| No Computing Device | 373 | 4.2% |
| Total | 8,872 | 100.0% |
Internet Access in Saco
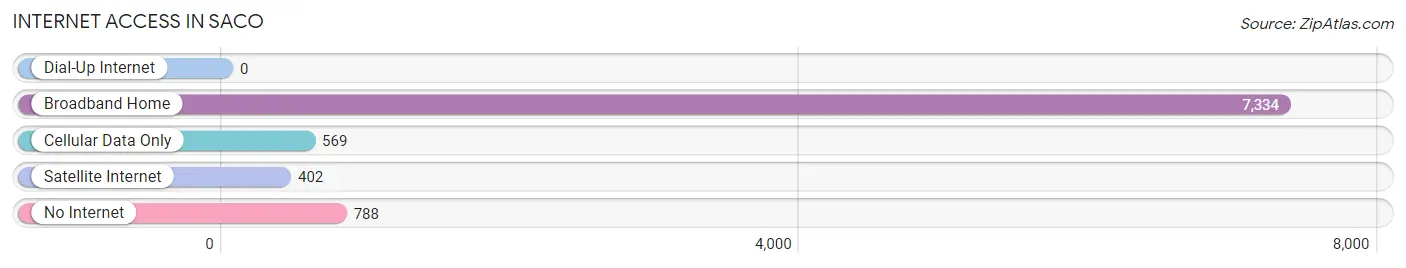
| Internet Type | # Households | % Households |
| Dial-Up Internet | 0 | 0.0% |
| Broadband Home | 7,334 | 82.7% |
| Cellular Data Only | 569 | 6.4% |
| Satellite Internet | 402 | 4.5% |
| No Internet | 788 | 8.9% |
| Total | 8,872 | 100.0% |
Saco Summary
Saco, Maine is a city located in York County, Maine, United States. It is situated on the Saco River, which forms the border between York and Cumberland counties. The city is part of the Portland–South Portland–Biddeford metropolitan statistical area. As of the 2010 census, the city had a population of 18,482.
History
Saco was first settled in 1631 by Thomas Lewis and Richard Bonython, who were sent by the Plymouth Company to establish a trading post. The area was part of the Pejepscot Purchase, which was made in 1668. The town was incorporated in 1762 and named after the river.
In the 19th century, Saco became a center for shipbuilding and textile manufacturing. The Saco Iron Works was established in 1811 and was one of the largest iron foundries in the country. The Saco Manufacturing Company was established in 1825 and was one of the first cotton mills in the United States. The city was also home to several other mills, including the Saco-Lowell Shops, which produced textile machinery.
Geography
Saco is located at 43°30′N 70°25′W (43.50, -70.42). According to the United States Census Bureau, the city has a total area of 24.2 square miles (62.7 km2), of which 23.2 square miles (60.1 km2) is land and 1.0 square mile (2.6 km2) is water.
The city is situated on the Saco River, which forms the border between York and Cumberland counties. The city is bordered by the towns of Biddeford to the south, Old Orchard Beach to the east, and Scarborough to the west.
Economy
Saco is a regional center for commerce and industry. The city is home to several large employers, including the Saco & Biddeford Savings Institution, the Saco & Biddeford Hospital, and the Maine Mall. The city is also home to several manufacturing companies, including the Saco Iron Works, the Saco Manufacturing Company, and the Saco-Lowell Shops.
Demographics
As of the 2010 census, there were 18,482 people, 7,845 households, and 4,845 families residing in the city. The population density was 790.3 people per square mile (305.7/km2). There were 8,541 housing units at an average density of 366.7 per square mile (141.7/km2). The racial makeup of the city was 94.2% White, 1.3% African American, 0.4% Native American, 1.3% Asian, 0.2% Pacific Islander, 0.7% from other races, and 1.9% from two or more races. Hispanic or Latino of any race were 2.3% of the population.
There were 7,845 households, out of which 28.2% had children under the age of 18 living with them, 43.2% were married couples living together, 12.7% had a female householder with no husband present, and 39.3% were non-families. 32.2% of all households were made up of individuals, and 12.3% had someone living alone who was 65 years of age or older. The average household size was 2.32 and the average family size was 2.93.
In the city, the population was spread out, with 23.2% under the age of 18, 8.2% from 18 to 24, 30.2% from 25 to 44, 22.3% from 45 to 64, and 16.1% who were 65 years of age or older. The median age was 38 years. For every 100 females, there were 91.2 males. For every 100 females age 18 and over, there were 87.7 males.
The median income for a household in the city was $41,945, and the median income for a family was $51,945. Males had a median income of $37,945 versus $30,945 for females. The per capita income for the city was $22,945. About 8.2% of families and 10.2% of the population were below the poverty line, including 14.2% of those under age 18 and 8.2% of those age 65 or over.
Common Questions
What is Per Capita Income in Saco?
Per Capita income in Saco is $45,129.
What is the Median Family Income in Saco?
Median Family Income in Saco is $108,489.
What is the Median Household income in Saco?
Median Household Income in Saco is $81,326.
What is Income or Wage Gap in Saco?
Income or Wage Gap in Saco is 18.9%.
Women in Saco earn 81.1 cents for every dollar earned by a man.
What is Inequality or Gini Index in Saco?
Inequality or Gini Index in Saco is 0.41.
What is the Total Population of Saco?
Total Population of Saco is 20,446.
What is the Total Male Population of Saco?
Total Male Population of Saco is 10,006.
What is the Total Female Population of Saco?
Total Female Population of Saco is 10,440.
What is the Ratio of Males per 100 Females in Saco?
There are 95.84 Males per 100 Females in Saco.
What is the Ratio of Females per 100 Males in Saco?
There are 104.34 Females per 100 Males in Saco.
What is the Median Population Age in Saco?
Median Population Age in Saco is 43.2 Years.
What is the Average Family Size in Saco
Average Family Size in Saco is 2.8 People.
What is the Average Household Size in Saco
Average Household Size in Saco is 2.3 People.
How Large is the Labor Force in Saco?
There are 12,484 People in the Labor Forcein in Saco.
What is the Percentage of People in the Labor Force in Saco?
72.2% of People are in the Labor Force in Saco.
What is the Unemployment Rate in Saco?
Unemployment Rate in Saco is 1.1%.