Southwest Harbor, ME Map & Demographics
Southwest Harbor Map
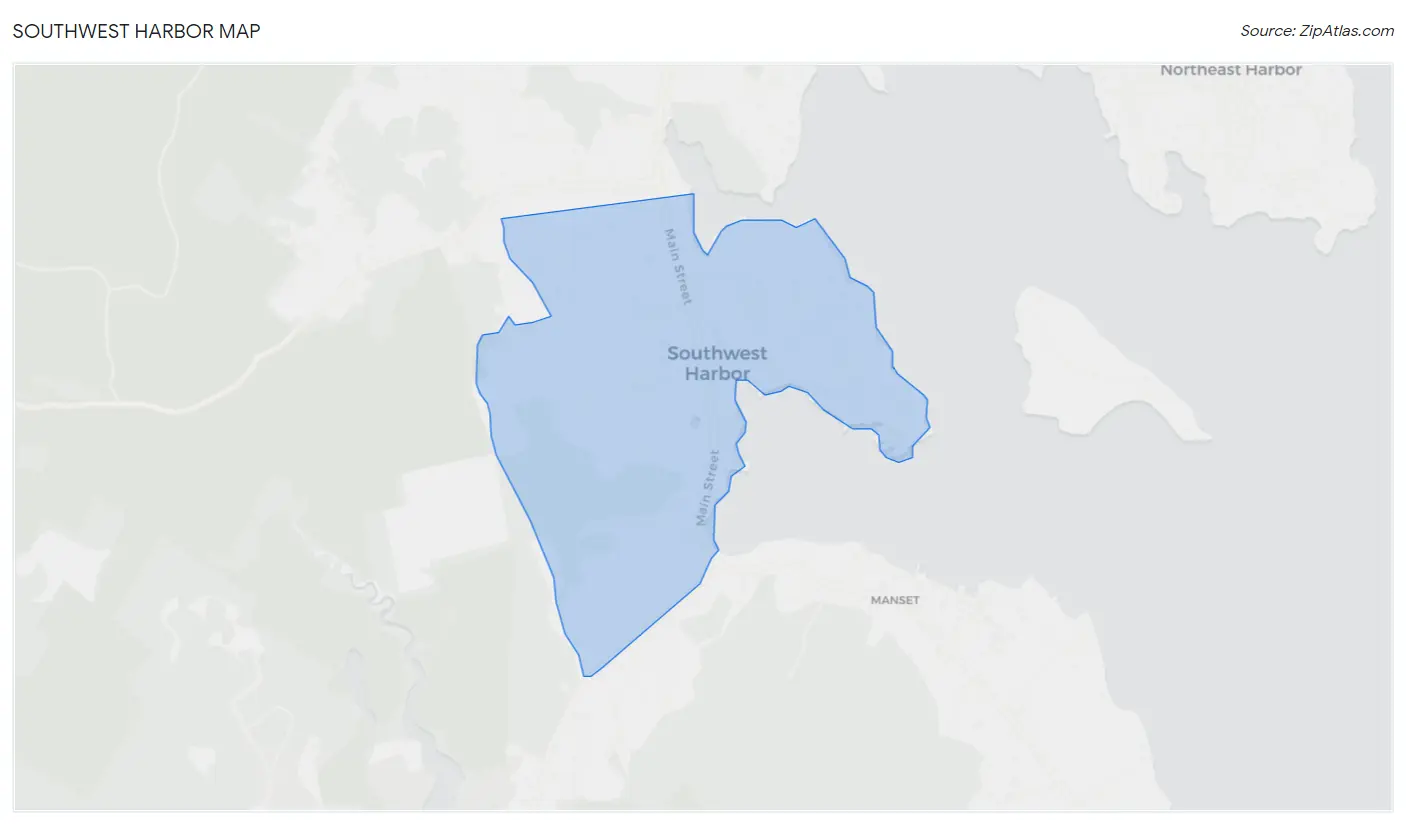
Southwest Harbor Overview
$26,437
PER CAPITA INCOME
$59,333
AVG FAMILY INCOME
$30,625
AVG HOUSEHOLD INCOME
57.6%
WAGE / INCOME GAP [ % ]
42.4¢/ $1
WAGE / INCOME GAP [ $ ]
0.45
INEQUALITY / GINI INDEX
526
TOTAL POPULATION
225
MALE POPULATION
301
FEMALE POPULATION
74.75
MALES / 100 FEMALES
133.78
FEMALES / 100 MALES
48.7
MEDIAN AGE
3.2
AVG FAMILY SIZE
1.7
AVG HOUSEHOLD SIZE
166
LABOR FORCE [ PEOPLE ]
40.2%
PERCENT IN LABOR FORCE
20.6%
UNEMPLOYMENT RATE
Southwest Harbor Zip Codes
Southwest Harbor Area Codes
Income in Southwest Harbor
Income Overview in Southwest Harbor
Per Capita Income in Southwest Harbor is $26,437, while median incomes of families and households are $59,333 and $30,625 respectively.
| Characteristic | Number | Measure |
| Per Capita Income | 526 | $26,437 |
| Median Family Income | 90 | $59,333 |
| Mean Family Income | 90 | $65,632 |
| Median Household Income | 306 | $30,625 |
| Mean Household Income | 306 | $43,443 |
| Income Deficit | 90 | $0 |
| Wage / Income Gap (%) | 526 | 57.58% |
| Wage / Income Gap ($) | 526 | 42.42¢ per $1 |
| Gini / Inequality Index | 526 | 0.45 |
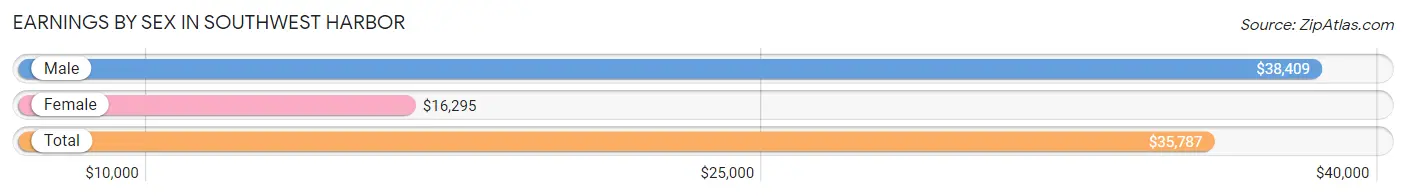
Earnings by Sex in Southwest Harbor
Average Earnings in Southwest Harbor are $35,787, $38,409 for men and $16,295 for women, a difference of 57.6%.
| Sex | Number | Average Earnings |
| Male | 80 (46.8%) | $38,409 |
| Female | 91 (53.2%) | $16,295 |
| Total | 171 (100.0%) | $35,787 |
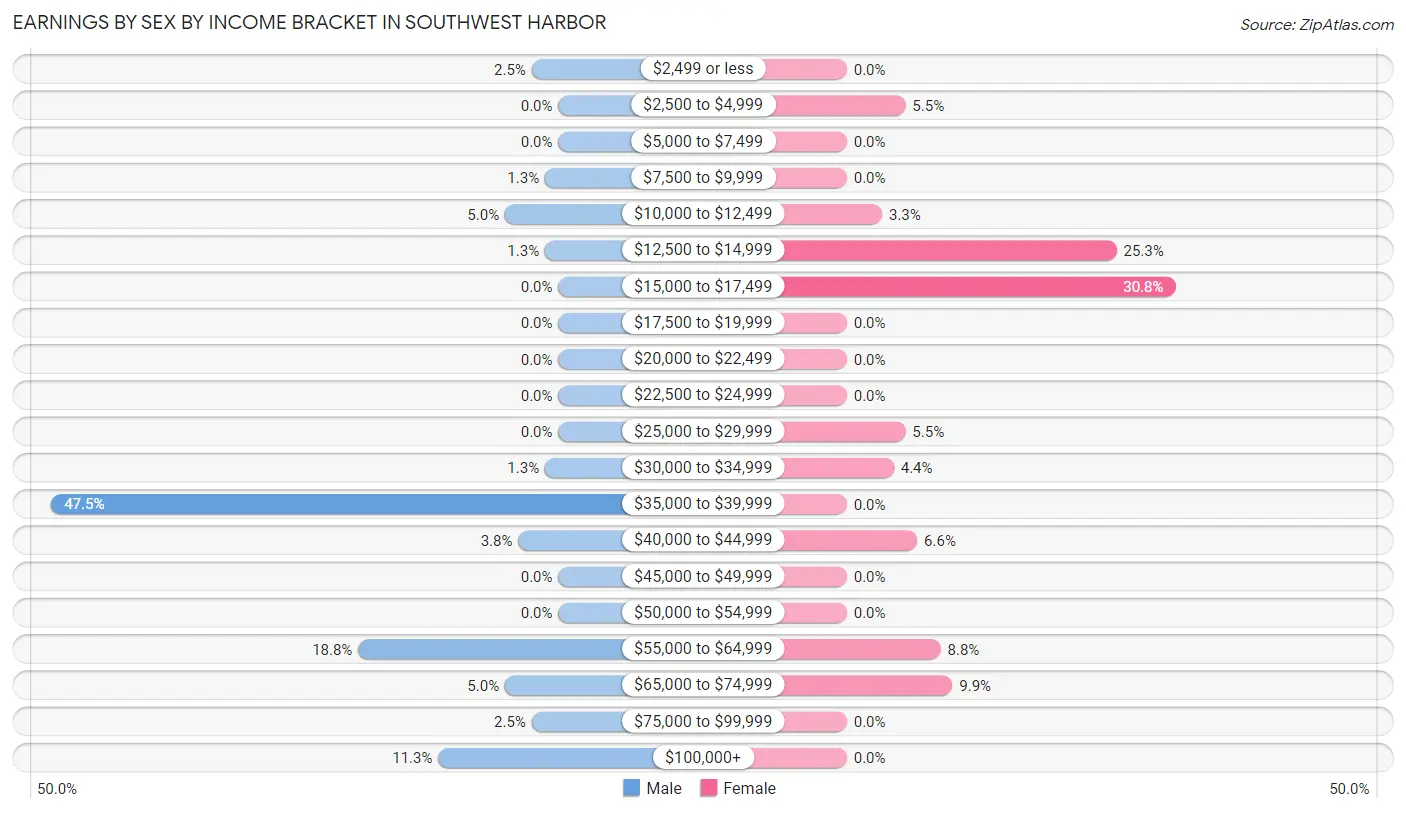
Earnings by Sex by Income Bracket in Southwest Harbor
The most common earnings brackets in Southwest Harbor are $35,000 to $39,999 for men (38 | 47.5%) and $15,000 to $17,499 for women (28 | 30.8%).
| Income | Male | Female |
| $2,499 or less | 2 (2.5%) | 0 (0.0%) |
| $2,500 to $4,999 | 0 (0.0%) | 5 (5.5%) |
| $5,000 to $7,499 | 0 (0.0%) | 0 (0.0%) |
| $7,500 to $9,999 | 1 (1.3%) | 0 (0.0%) |
| $10,000 to $12,499 | 4 (5.0%) | 3 (3.3%) |
| $12,500 to $14,999 | 1 (1.3%) | 23 (25.3%) |
| $15,000 to $17,499 | 0 (0.0%) | 28 (30.8%) |
| $17,500 to $19,999 | 0 (0.0%) | 0 (0.0%) |
| $20,000 to $22,499 | 0 (0.0%) | 0 (0.0%) |
| $22,500 to $24,999 | 0 (0.0%) | 0 (0.0%) |
| $25,000 to $29,999 | 0 (0.0%) | 5 (5.5%) |
| $30,000 to $34,999 | 1 (1.3%) | 4 (4.4%) |
| $35,000 to $39,999 | 38 (47.5%) | 0 (0.0%) |
| $40,000 to $44,999 | 3 (3.7%) | 6 (6.6%) |
| $45,000 to $49,999 | 0 (0.0%) | 0 (0.0%) |
| $50,000 to $54,999 | 0 (0.0%) | 0 (0.0%) |
| $55,000 to $64,999 | 15 (18.8%) | 8 (8.8%) |
| $65,000 to $74,999 | 4 (5.0%) | 9 (9.9%) |
| $75,000 to $99,999 | 2 (2.5%) | 0 (0.0%) |
| $100,000+ | 9 (11.3%) | 0 (0.0%) |
| Total | 80 (100.0%) | 91 (100.0%) |
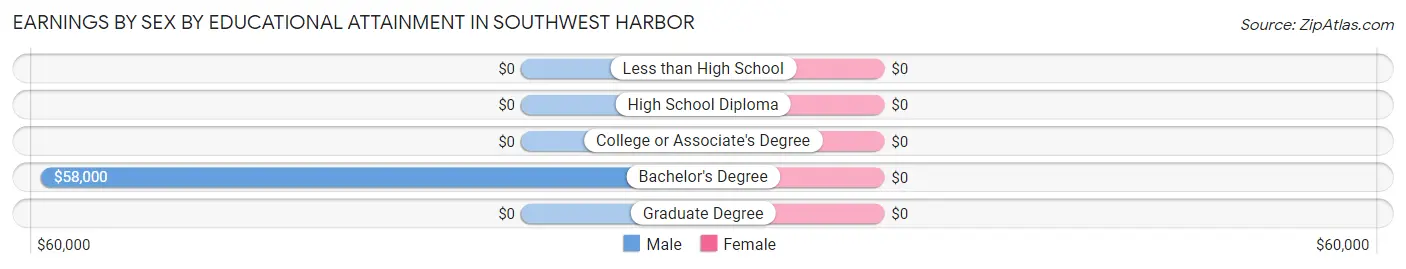
Earnings by Sex by Educational Attainment in Southwest Harbor
| Educational Attainment | Male Income | Female Income |
| Less than High School | - | - |
| High School Diploma | - | - |
| College or Associate's Degree | - | - |
| Bachelor's Degree | $58,000 | $0 |
| Graduate Degree | - | - |
| Total | $38,977 | $16,429 |
Family Income in Southwest Harbor
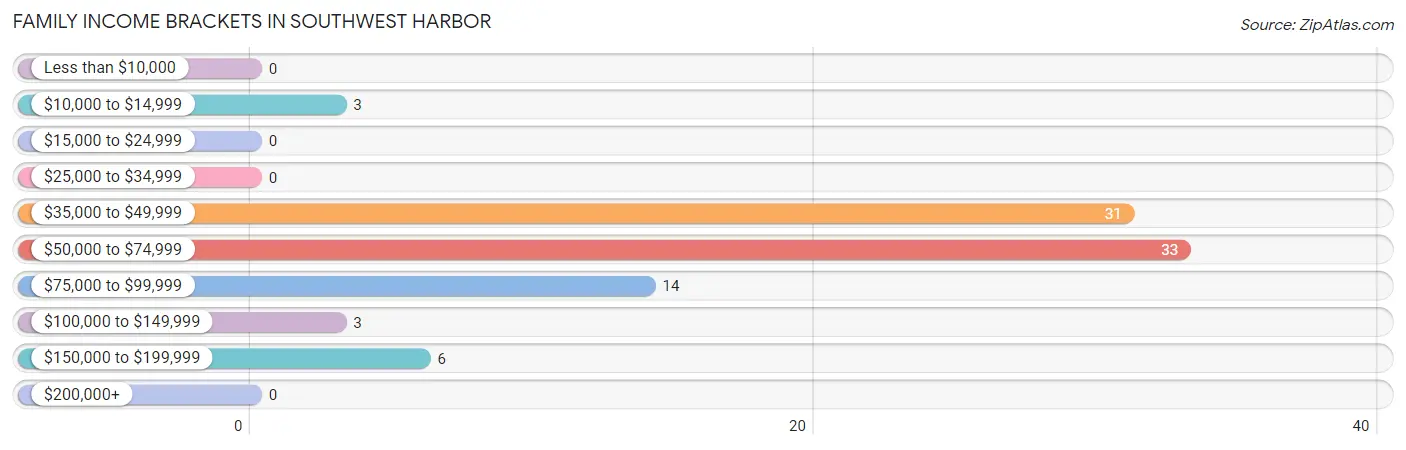
Family Income Brackets in Southwest Harbor
According to the Southwest Harbor family income data, there are 33 families falling into the $50,000 to $74,999 income range, which is the most common income bracket and makes up 36.7% of all families.
| Income Bracket | # Families | % Families |
| Less than $10,000 | 0 | 0.0% |
| $10,000 to $14,999 | 3 | 3.3% |
| $15,000 to $24,999 | 0 | 0.0% |
| $25,000 to $34,999 | 0 | 0.0% |
| $35,000 to $49,999 | 31 | 34.4% |
| $50,000 to $74,999 | 33 | 36.7% |
| $75,000 to $99,999 | 14 | 15.6% |
| $100,000 to $149,999 | 3 | 3.3% |
| $150,000 to $199,999 | 6 | 6.7% |
| $200,000+ | 0 | 0.0% |
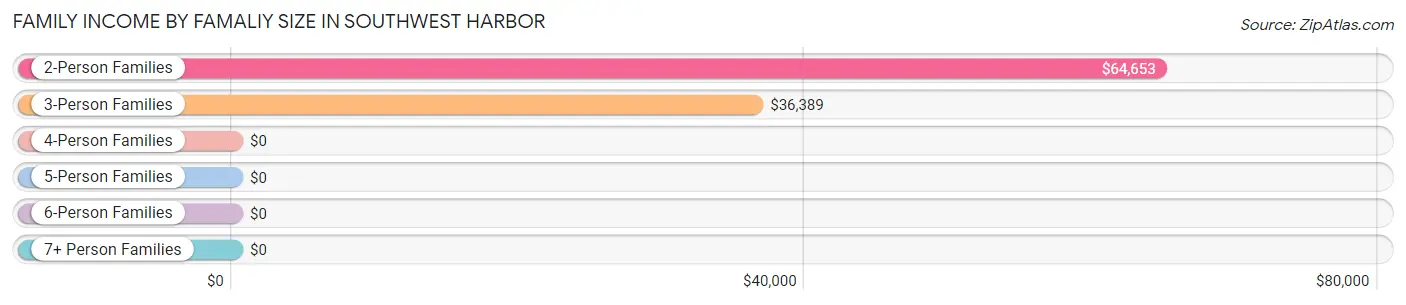
Family Income by Famaliy Size in Southwest Harbor
2-person families (39 | 43.3%) account for the highest median family income in Southwest Harbor with $64,653 per family, while 2-person families (39 | 43.3%) have the highest median income of $32,326 per family member.
| Income Bracket | # Families | Median Income |
| 2-Person Families | 39 (43.3%) | $64,653 |
| 3-Person Families | 36 (40.0%) | $36,389 |
| 4-Person Families | 0 (0.0%) | $0 |
| 5-Person Families | 15 (16.7%) | $0 |
| 6-Person Families | 0 (0.0%) | $0 |
| 7+ Person Families | 0 (0.0%) | $0 |
| Total | 90 (100.0%) | $59,333 |
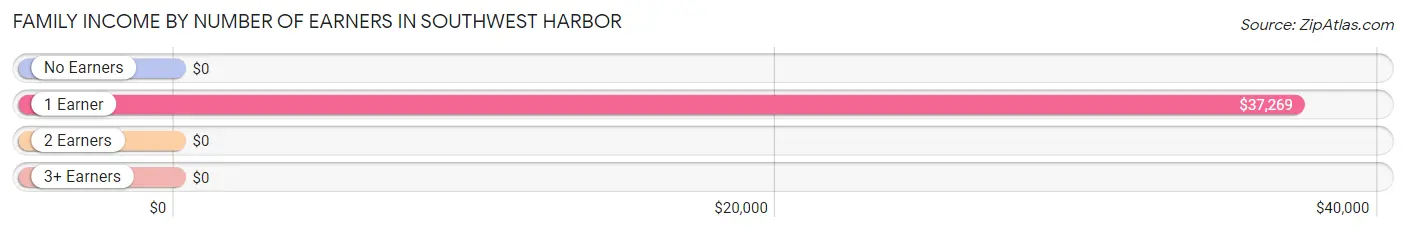
Family Income by Number of Earners in Southwest Harbor
| Number of Earners | # Families | Median Income |
| No Earners | 32 (35.6%) | $0 |
| 1 Earner | 55 (61.1%) | $37,269 |
| 2 Earners | 3 (3.3%) | $0 |
| 3+ Earners | 0 (0.0%) | $0 |
| Total | 90 (100.0%) | $59,333 |
Household Income in Southwest Harbor
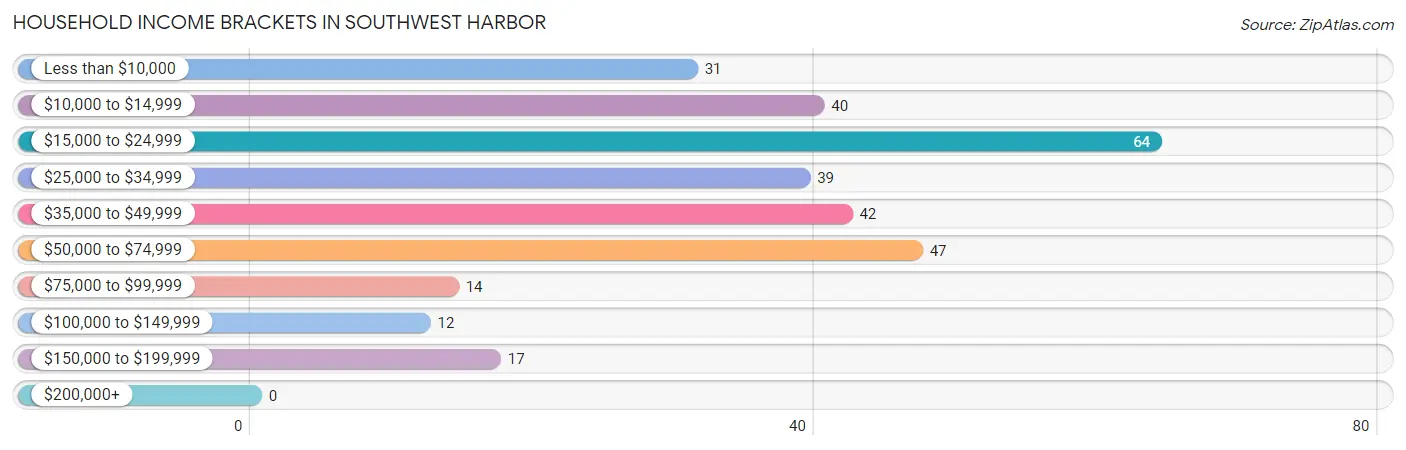
Household Income Brackets in Southwest Harbor
With 64 households falling in the category, the $15,000 to $24,999 income range is the most frequent in Southwest Harbor, accounting for 20.9% of all households.
| Income Bracket | # Households | % Households |
| Less than $10,000 | 31 | 10.1% |
| $10,000 to $14,999 | 40 | 13.1% |
| $15,000 to $24,999 | 64 | 20.9% |
| $25,000 to $34,999 | 39 | 12.7% |
| $35,000 to $49,999 | 42 | 13.7% |
| $50,000 to $74,999 | 47 | 15.4% |
| $75,000 to $99,999 | 14 | 4.6% |
| $100,000 to $149,999 | 12 | 3.9% |
| $150,000 to $199,999 | 17 | 5.6% |
| $200,000+ | 0 | 0.0% |
Household Income by Householder Age in Southwest Harbor
The median household income in Southwest Harbor is $30,625, with the highest median household income of $23,750 found in the 65+ years age bracket for the primary householder. A total of 152 households (49.7%) fall into this category. Meanwhile, the 15 to 24 years age bracket for the primary householder has the lowest median household income of $0, with 3 households (1.0%) in this group.
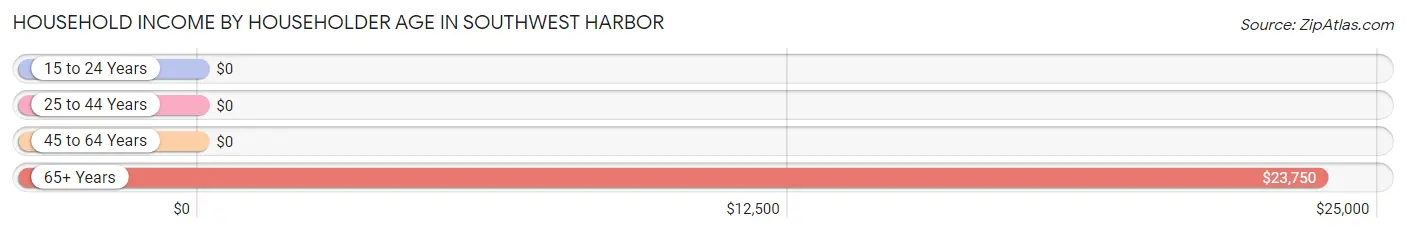
| Income Bracket | # Households | Median Income |
| 15 to 24 Years | 3 (1.0%) | $0 |
| 25 to 44 Years | 62 (20.3%) | $0 |
| 45 to 64 Years | 89 (29.1%) | $0 |
| 65+ Years | 152 (49.7%) | $23,750 |
| Total | 306 (100.0%) | $30,625 |
Poverty in Southwest Harbor
Income Below Poverty by Sex and Age in Southwest Harbor
With 8.4% poverty level for males and 18.2% for females among the residents of Southwest Harbor, 5 year old males and 18 to 24 year old females are the most vulnerable to poverty, with 4 males (100.0%) and 3 females (100.0%) in their respective age groups living below the poverty level.

| Age Bracket | Male | Female |
| Under 5 Years | 4 (12.9%) | 0 (0.0%) |
| 5 Years | 4 (100.0%) | 0 (0.0%) |
| 6 to 11 Years | 0 (0.0%) | 0 (0.0%) |
| 12 to 14 Years | 0 (0.0%) | 0 (0.0%) |
| 15 Years | 0 (0.0%) | 0 (0.0%) |
| 16 and 17 Years | 0 (0.0%) | 0 (0.0%) |
| 18 to 24 Years | 0 (0.0%) | 3 (100.0%) |
| 25 to 34 Years | 4 (23.5%) | 23 (45.1%) |
| 35 to 44 Years | 0 (0.0%) | 0 (0.0%) |
| 45 to 54 Years | 0 (0.0%) | 0 (0.0%) |
| 55 to 64 Years | 0 (0.0%) | 0 (0.0%) |
| 65 to 74 Years | 0 (0.0%) | 3 (5.3%) |
| 75 Years and over | 6 (30.0%) | 25 (31.7%) |
| Total | 18 (8.4%) | 54 (18.2%) |
Income Above Poverty by Sex and Age in Southwest Harbor
According to the poverty statistics in Southwest Harbor, males aged 6 to 11 years and females aged 6 to 11 years are the age groups that are most secure financially, with 100.0% of males and 100.0% of females in these age groups living above the poverty line.
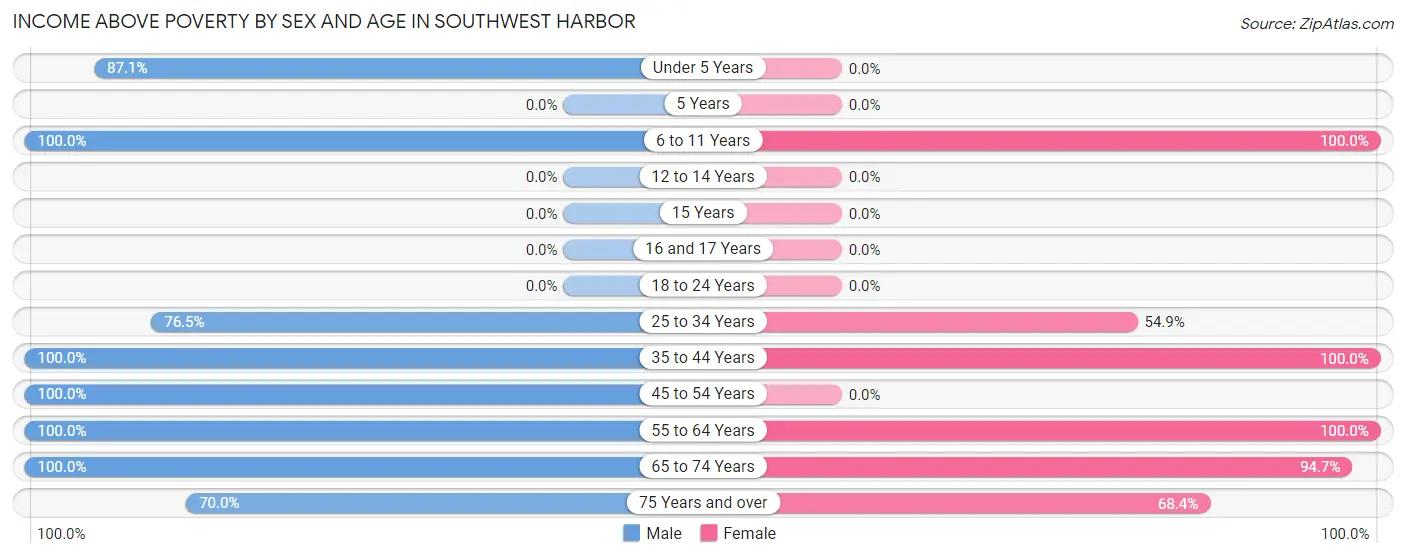
| Age Bracket | Male | Female |
| Under 5 Years | 27 (87.1%) | 0 (0.0%) |
| 5 Years | 0 (0.0%) | 0 (0.0%) |
| 6 to 11 Years | 30 (100.0%) | 48 (100.0%) |
| 12 to 14 Years | 0 (0.0%) | 0 (0.0%) |
| 15 Years | 0 (0.0%) | 0 (0.0%) |
| 16 and 17 Years | 0 (0.0%) | 0 (0.0%) |
| 18 to 24 Years | 0 (0.0%) | 0 (0.0%) |
| 25 to 34 Years | 13 (76.5%) | 28 (54.9%) |
| 35 to 44 Years | 26 (100.0%) | 19 (100.0%) |
| 45 to 54 Years | 27 (100.0%) | 0 (0.0%) |
| 55 to 64 Years | 32 (100.0%) | 39 (100.0%) |
| 65 to 74 Years | 27 (100.0%) | 54 (94.7%) |
| 75 Years and over | 14 (70.0%) | 54 (68.3%) |
| Total | 196 (91.6%) | 242 (81.8%) |
Income Below Poverty Among Married-Couple Families in Southwest Harbor
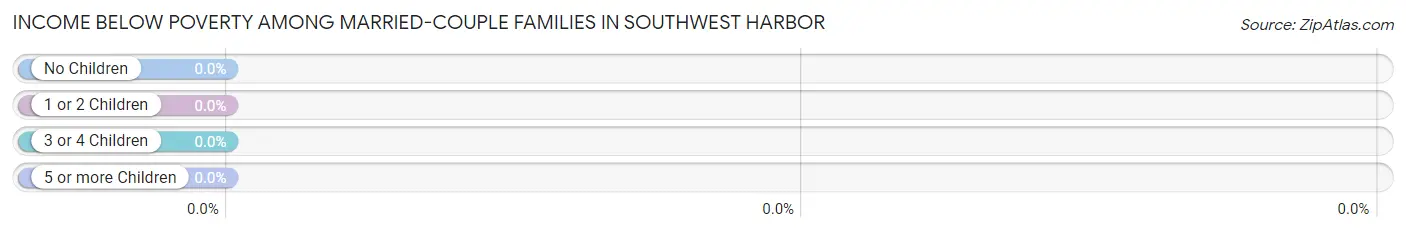
| Children | Above Poverty | Below Poverty |
| No Children | 39 (100.0%) | 0 (0.0%) |
| 1 or 2 Children | 33 (100.0%) | 0 (0.0%) |
| 3 or 4 Children | 15 (100.0%) | 0 (0.0%) |
| 5 or more Children | 0 (0.0%) | 0 (0.0%) |
| Total | 87 (100.0%) | 0 (0.0%) |
Income Below Poverty Among Single-Parent Households in Southwest Harbor
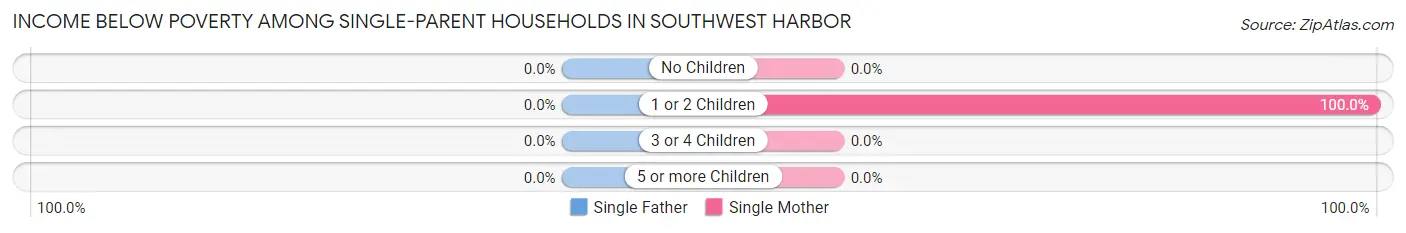
| Children | Single Father | Single Mother |
| No Children | 0 (0.0%) | 0 (0.0%) |
| 1 or 2 Children | 0 (0.0%) | 3 (100.0%) |
| 3 or 4 Children | 0 (0.0%) | 0 (0.0%) |
| 5 or more Children | 0 (0.0%) | 0 (0.0%) |
| Total | 0 (0.0%) | 3 (100.0%) |
Income Below Poverty Among Married-Couple vs Single-Parent Households in Southwest Harbor
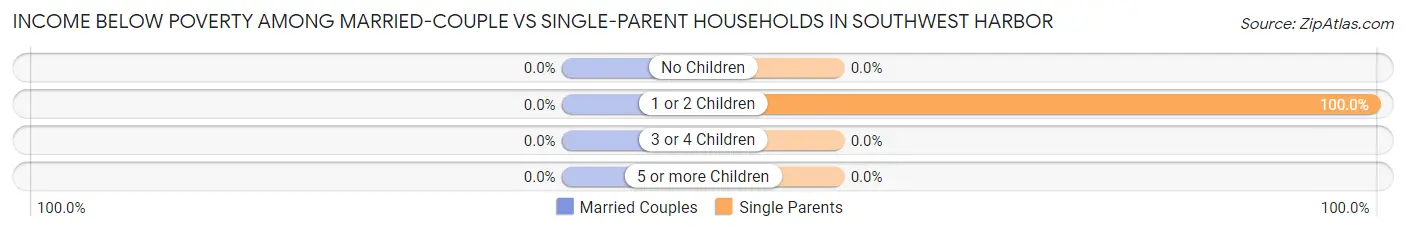
| Children | Married-Couple Families | Single-Parent Households |
| No Children | 0 (0.0%) | 0 (0.0%) |
| 1 or 2 Children | 0 (0.0%) | 3 (100.0%) |
| 3 or 4 Children | 0 (0.0%) | 0 (0.0%) |
| 5 or more Children | 0 (0.0%) | 0 (0.0%) |
| Total | 0 (0.0%) | 3 (100.0%) |
Race in Southwest Harbor
The most populous races in Southwest Harbor are White / Caucasian (508 | 96.6%), Black / African American (11 | 2.1%), and Two or more Races (7 | 1.3%).
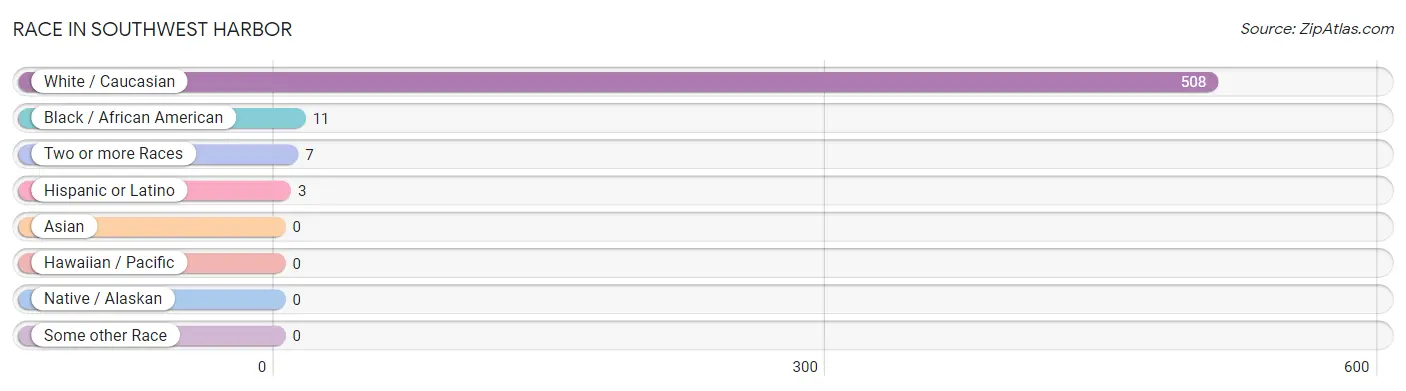
| Race | # Population | % Population |
| Asian | 0 | 0.0% |
| Black / African American | 11 | 2.1% |
| Hawaiian / Pacific | 0 | 0.0% |
| Hispanic or Latino | 3 | 0.6% |
| Native / Alaskan | 0 | 0.0% |
| White / Caucasian | 508 | 96.6% |
| Two or more Races | 7 | 1.3% |
| Some other Race | 0 | 0.0% |
| Total | 526 | 100.0% |
Ancestry in Southwest Harbor
The most populous ancestries reported in Southwest Harbor are English (247 | 47.0%), Irish (131 | 24.9%), Ukrainian (86 | 16.4%), French (65 | 12.4%), and Polish (18 | 3.4%), together accounting for 104.0% of all Southwest Harbor residents.
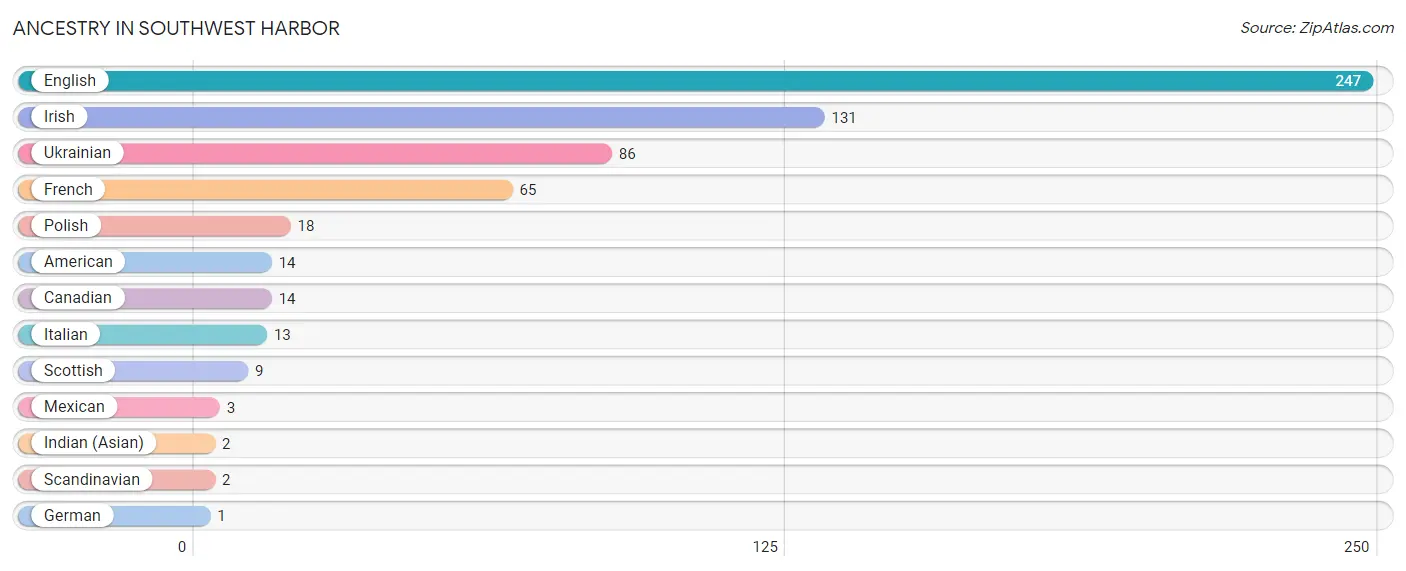
| Ancestry | # Population | % Population |
| American | 14 | 2.7% |
| Canadian | 14 | 2.7% |
| English | 247 | 47.0% |
| French | 65 | 12.4% |
| German | 1 | 0.2% |
| Indian (Asian) | 2 | 0.4% |
| Irish | 131 | 24.9% |
| Italian | 13 | 2.5% |
| Mexican | 3 | 0.6% |
| Polish | 18 | 3.4% |
| Scandinavian | 2 | 0.4% |
| Scottish | 9 | 1.7% |
| Ukrainian | 86 | 16.4% | View All 13 Rows |
Immigrants in Southwest Harbor
The most numerous immigrant groups reported in Southwest Harbor came from England (18 | 3.4%), Europe (18 | 3.4%), and Northern Europe (18 | 3.4%), together accounting for 10.3% of all Southwest Harbor residents.
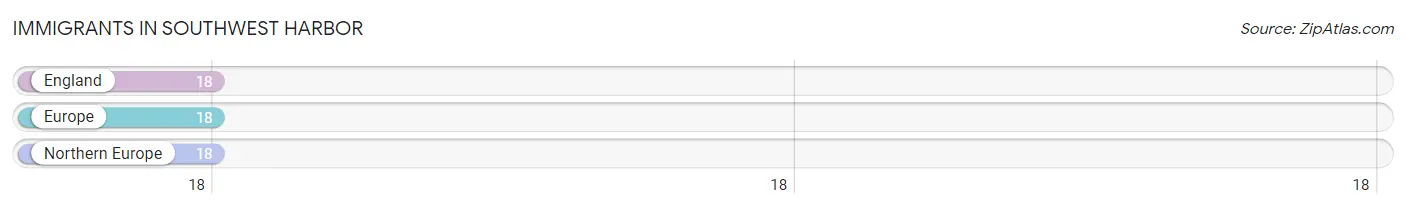
| Immigration Origin | # Population | % Population |
| England | 18 | 3.4% |
| Europe | 18 | 3.4% |
| Northern Europe | 18 | 3.4% | View All 3 Rows |
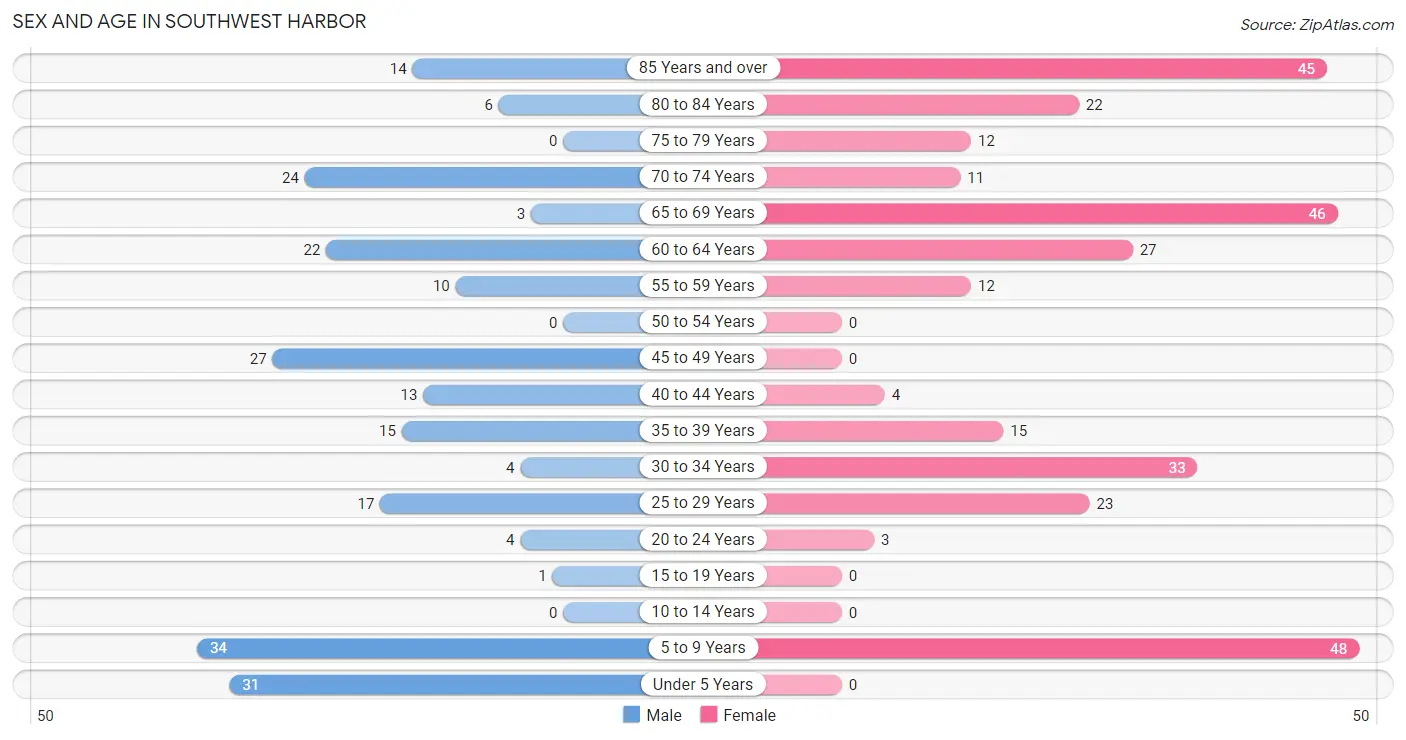
Sex and Age in Southwest Harbor
Sex and Age in Southwest Harbor
The most populous age groups in Southwest Harbor are 5 to 9 Years (34 | 15.1%) for men and 5 to 9 Years (48 | 16.0%) for women.
| Age Bracket | Male | Female |
| Under 5 Years | 31 (13.8%) | 0 (0.0%) |
| 5 to 9 Years | 34 (15.1%) | 48 (16.0%) |
| 10 to 14 Years | 0 (0.0%) | 0 (0.0%) |
| 15 to 19 Years | 1 (0.4%) | 0 (0.0%) |
| 20 to 24 Years | 4 (1.8%) | 3 (1.0%) |
| 25 to 29 Years | 17 (7.6%) | 23 (7.6%) |
| 30 to 34 Years | 4 (1.8%) | 33 (11.0%) |
| 35 to 39 Years | 15 (6.7%) | 15 (5.0%) |
| 40 to 44 Years | 13 (5.8%) | 4 (1.3%) |
| 45 to 49 Years | 27 (12.0%) | 0 (0.0%) |
| 50 to 54 Years | 0 (0.0%) | 0 (0.0%) |
| 55 to 59 Years | 10 (4.4%) | 12 (4.0%) |
| 60 to 64 Years | 22 (9.8%) | 27 (9.0%) |
| 65 to 69 Years | 3 (1.3%) | 46 (15.3%) |
| 70 to 74 Years | 24 (10.7%) | 11 (3.6%) |
| 75 to 79 Years | 0 (0.0%) | 12 (4.0%) |
| 80 to 84 Years | 6 (2.7%) | 22 (7.3%) |
| 85 Years and over | 14 (6.2%) | 45 (14.9%) |
| Total | 225 (100.0%) | 301 (100.0%) |
Families and Households in Southwest Harbor
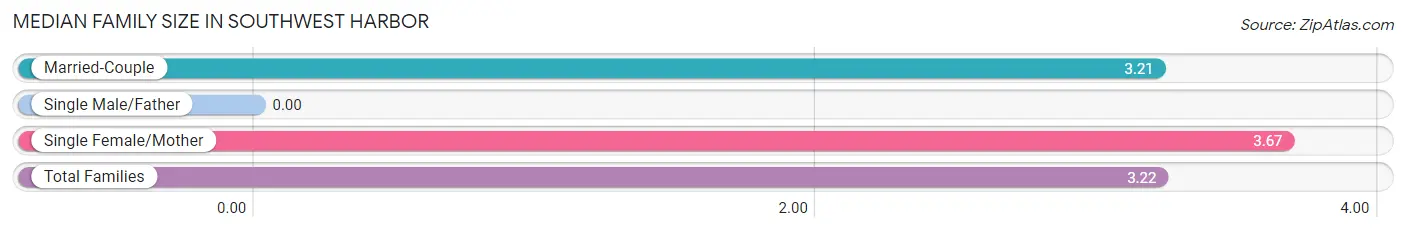
Median Family Size in Southwest Harbor
| Family Type | # Families | Family Size |
| Married-Couple | 87 (96.7%) | 3.21 |
| Single Male/Father | 0 (0.0%) | - |
| Single Female/Mother | 3 (3.3%) | 3.67 |
| Total Families | 90 (100.0%) | 3.22 |
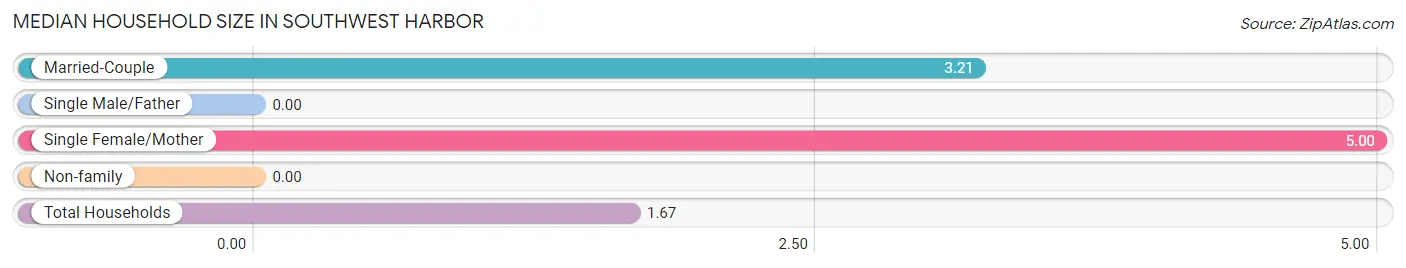
Median Household Size in Southwest Harbor
| Household Type | # Households | Household Size |
| Married-Couple | 87 (28.4%) | 3.21 |
| Single Male/Father | 0 (0.0%) | - |
| Single Female/Mother | 3 (1.0%) | 5.00 |
| Non-family | 216 (70.6%) | - |
| Total Households | 306 (100.0%) | 1.67 |
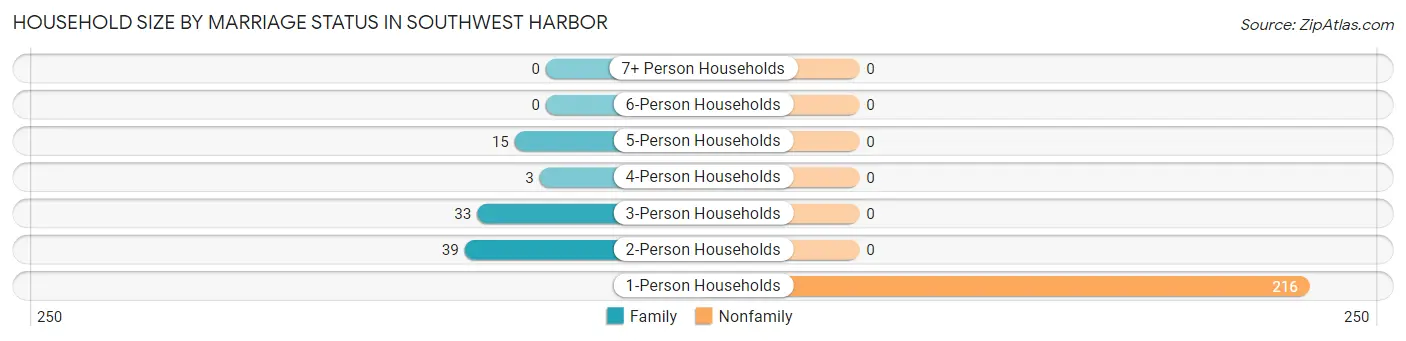
Household Size by Marriage Status in Southwest Harbor
Out of a total of 306 households in Southwest Harbor, 90 (29.4%) are family households, while 216 (70.6%) are nonfamily households. The most numerous type of family households are 2-person households, comprising 39, and the most common type of nonfamily households are 1-person households, comprising 216.
| Household Size | Family Households | Nonfamily Households |
| 1-Person Households | - | 216 (70.6%) |
| 2-Person Households | 39 (12.8%) | 0 (0.0%) |
| 3-Person Households | 33 (10.8%) | 0 (0.0%) |
| 4-Person Households | 3 (1.0%) | 0 (0.0%) |
| 5-Person Households | 15 (4.9%) | 0 (0.0%) |
| 6-Person Households | 0 (0.0%) | 0 (0.0%) |
| 7+ Person Households | 0 (0.0%) | 0 (0.0%) |
| Total | 90 (29.4%) | 216 (70.6%) |
Female Fertility in Southwest Harbor
Fertility by Age in Southwest Harbor
| Age Bracket | Women with Births | Births / 1,000 Women |
| 15 to 19 years | 0 (0.0%) | 0.0 |
| 20 to 34 years | 0 (0.0%) | 0.0 |
| 35 to 50 years | 0 (0.0%) | 0.0 |
| Total | 0 (0.0%) | 0.0 |
Fertility by Age by Marriage Status in Southwest Harbor
| Age Bracket | Married | Unmarried |
| 15 to 19 years | 0 (0.0%) | 0 (0.0%) |
| 20 to 34 years | 0 (0.0%) | 0 (0.0%) |
| 35 to 50 years | 0 (0.0%) | 0 (0.0%) |
| Total | 0 (0.0%) | 0 (0.0%) |
Fertility by Education in Southwest Harbor
| Educational Attainment | Women with Births | Births / 1,000 Women |
| Less than High School | 0 (0.0%) | 0.0 |
| High School Diploma | 0 (0.0%) | 0.0 |
| College or Associate's Degree | 0 (0.0%) | 0.0 |
| Bachelor's Degree | 0 (0.0%) | 0.0 |
| Graduate Degree | 0 (0.0%) | 0.0 |
| Total | 0 (0.0%) | 0.0 |
Fertility by Education by Marriage Status in Southwest Harbor
| Educational Attainment | Married | Unmarried |
| Less than High School | 0 (0.0%) | 0 (0.0%) |
| High School Diploma | 0 (0.0%) | 0 (0.0%) |
| College or Associate's Degree | 0 (0.0%) | 0 (0.0%) |
| Bachelor's Degree | 0 (0.0%) | 0 (0.0%) |
| Graduate Degree | 0 (0.0%) | 0 (0.0%) |
| Total | 0 (0.0%) | 0 (0.0%) |
Employment Characteristics in Southwest Harbor
Employment by Class of Employer in Southwest Harbor
Among the 138 employed individuals in Southwest Harbor, private company employees (70 | 50.7%), federal government employees (30 | 21.7%), and self-employed (incorporated) (15 | 10.9%) make up the most common classes of employment.
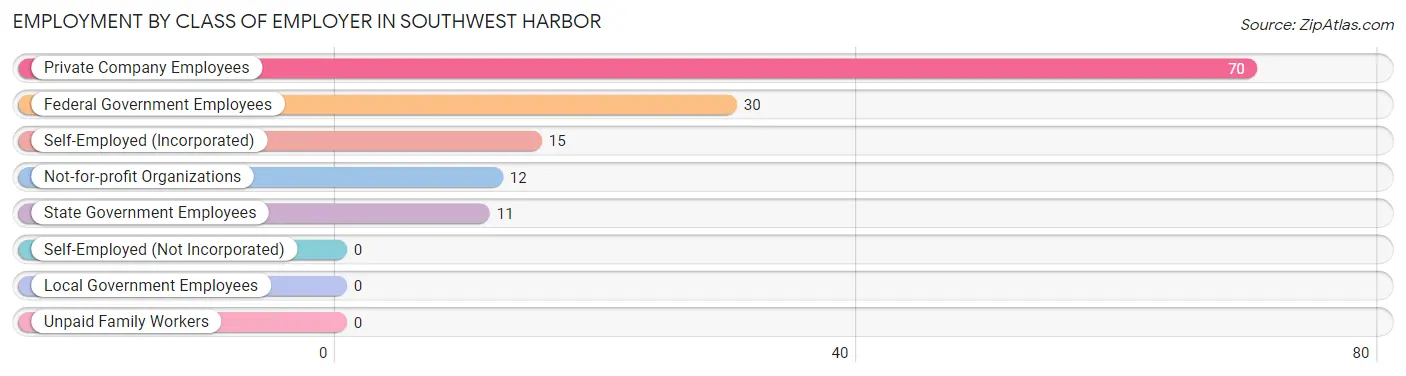
| Employer Class | # Employees | % Employees |
| Private Company Employees | 70 | 50.7% |
| Self-Employed (Incorporated) | 15 | 10.9% |
| Self-Employed (Not Incorporated) | 0 | 0.0% |
| Not-for-profit Organizations | 12 | 8.7% |
| Local Government Employees | 0 | 0.0% |
| State Government Employees | 11 | 8.0% |
| Federal Government Employees | 30 | 21.7% |
| Unpaid Family Workers | 0 | 0.0% |
| Total | 138 | 100.0% |
Employment Status by Age in Southwest Harbor
According to the labor force statistics for Southwest Harbor, out of the total population over 16 years of age (413), 40.2% or 166 individuals are in the labor force, with 20.6% or 34 of them unemployed. The age group with the highest labor force participation rate is 16 to 19 years, with 100.0% or 1 individuals in the labor force. Within the labor force, the 65 to 74 years age range has the highest percentage of unemployed individuals, with 90.3% or 28 of them being unemployed.
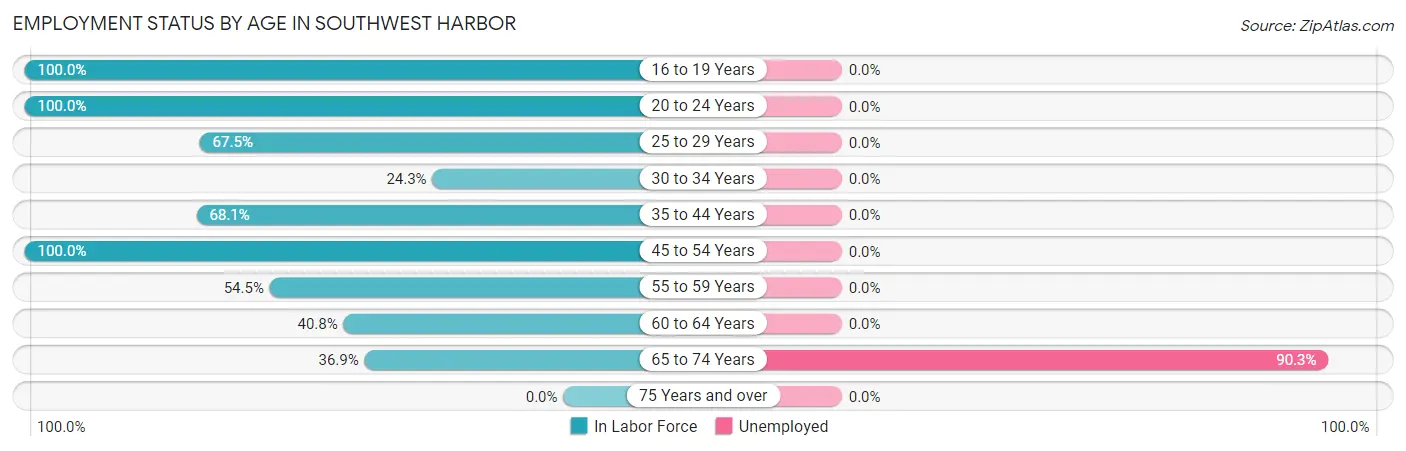
| Age Bracket | In Labor Force | Unemployed |
| 16 to 19 Years | 1 (100.0%) | 0 (0.0%) |
| 20 to 24 Years | 7 (100.0%) | 0 (0.0%) |
| 25 to 29 Years | 27 (67.5%) | 0 (0.0%) |
| 30 to 34 Years | 9 (24.3%) | 0 (0.0%) |
| 35 to 44 Years | 32 (68.1%) | 0 (0.0%) |
| 45 to 54 Years | 27 (100.0%) | 0 (0.0%) |
| 55 to 59 Years | 12 (54.5%) | 0 (0.0%) |
| 60 to 64 Years | 20 (40.8%) | 0 (0.0%) |
| 65 to 74 Years | 31 (36.9%) | 28 (90.3%) |
| 75 Years and over | 0 (0.0%) | 0 (0.0%) |
| Total | 166 (40.2%) | 34 (20.6%) |
Employment Status by Educational Attainment in Southwest Harbor
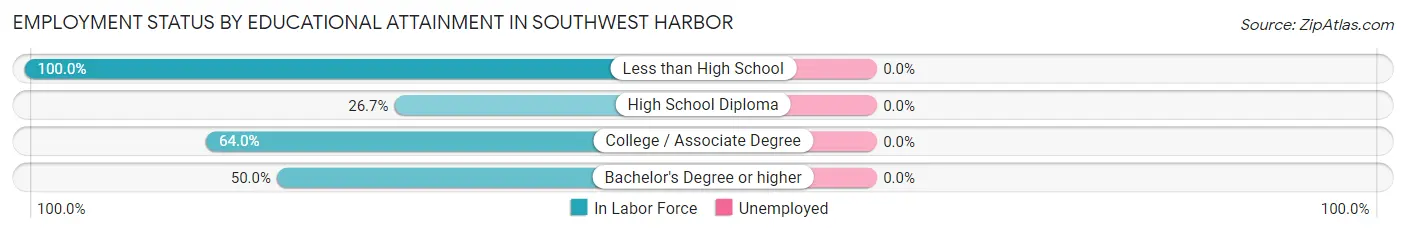
| Educational Attainment | In Labor Force | Unemployed |
| Less than High School | 4 (100.0%) | 0 (0.0%) |
| High School Diploma | 4 (26.7%) | 0 (0.0%) |
| College / Associate Degree | 80 (64.0%) | 0 (0.0%) |
| Bachelor's Degree or higher | 39 (50.0%) | 0 (0.0%) |
| Total | 127 (57.2%) | 0 (0.0%) |
Employment Occupations by Sex in Southwest Harbor
Management, Business, Science and Arts Occupations
The most common Management, Business, Science and Arts occupations in Southwest Harbor are , and Management (20 | 18.5%).
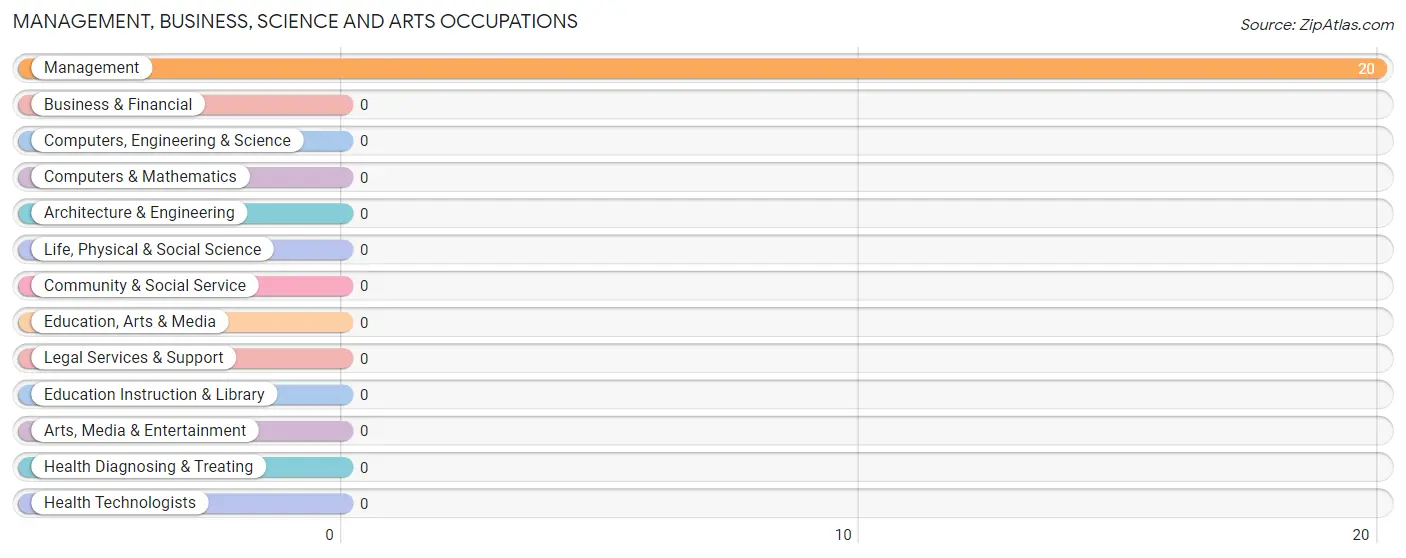
Management, Business, Science and Arts Occupations by Sex
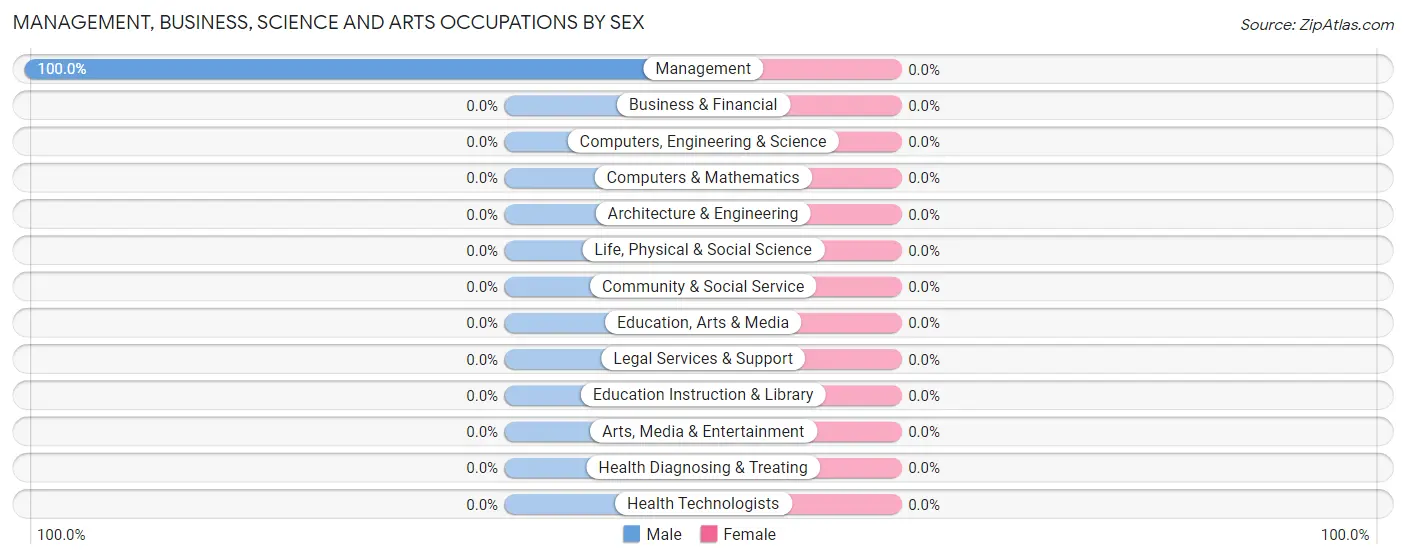
| Occupation | Male | Female |
| Management | 20 (100.0%) | 0 (0.0%) |
| Business & Financial | 0 (0.0%) | 0 (0.0%) |
| Computers, Engineering & Science | 0 (0.0%) | 0 (0.0%) |
| Computers & Mathematics | 0 (0.0%) | 0 (0.0%) |
| Architecture & Engineering | 0 (0.0%) | 0 (0.0%) |
| Life, Physical & Social Science | 0 (0.0%) | 0 (0.0%) |
| Community & Social Service | 0 (0.0%) | 0 (0.0%) |
| Education, Arts & Media | 0 (0.0%) | 0 (0.0%) |
| Legal Services & Support | 0 (0.0%) | 0 (0.0%) |
| Education Instruction & Library | 0 (0.0%) | 0 (0.0%) |
| Arts, Media & Entertainment | 0 (0.0%) | 0 (0.0%) |
| Health Diagnosing & Treating | 0 (0.0%) | 0 (0.0%) |
| Health Technologists | 0 (0.0%) | 0 (0.0%) |
| Total (Category) | 20 (100.0%) | 0 (0.0%) |
| Total (Overall) | 55 (50.9%) | 53 (49.1%) |
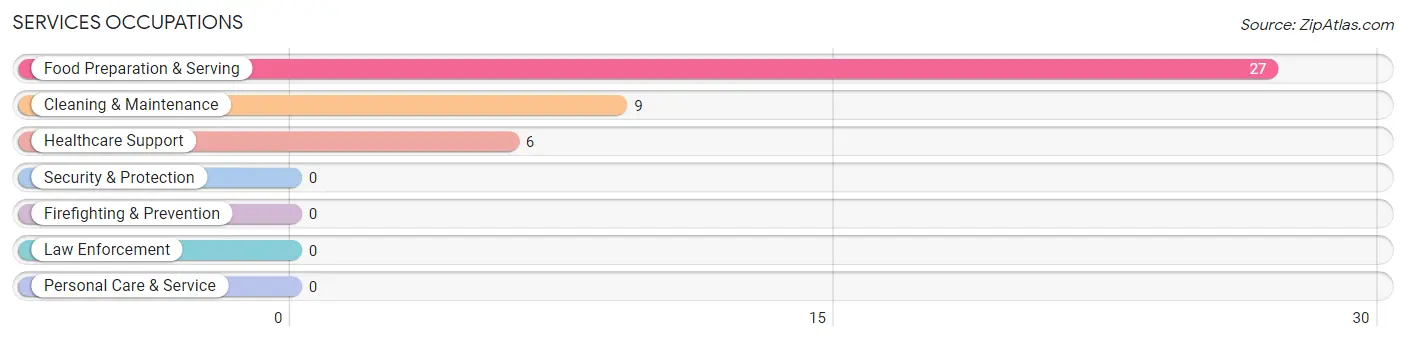
Services Occupations
The most common Services occupations in Southwest Harbor are Food Preparation & Serving (27 | 25.0%), Cleaning & Maintenance (9 | 8.3%), and Healthcare Support (6 | 5.6%).
Services Occupations by Sex
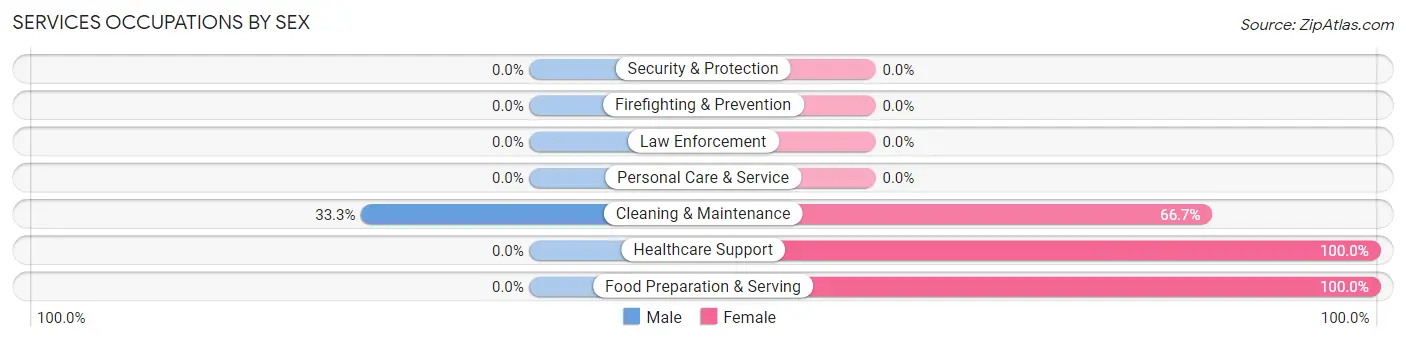
| Occupation | Male | Female |
| Healthcare Support | 0 (0.0%) | 6 (100.0%) |
| Security & Protection | 0 (0.0%) | 0 (0.0%) |
| Firefighting & Prevention | 0 (0.0%) | 0 (0.0%) |
| Law Enforcement | 0 (0.0%) | 0 (0.0%) |
| Food Preparation & Serving | 0 (0.0%) | 27 (100.0%) |
| Cleaning & Maintenance | 3 (33.3%) | 6 (66.7%) |
| Personal Care & Service | 0 (0.0%) | 0 (0.0%) |
| Total (Category) | 3 (7.1%) | 39 (92.9%) |
| Total (Overall) | 55 (50.9%) | 53 (49.1%) |
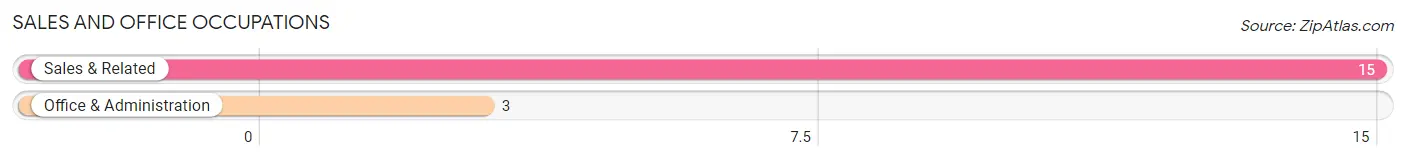
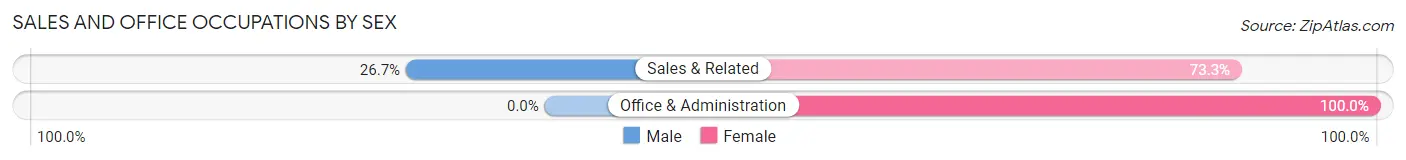
Sales and Office Occupations
The most common Sales and Office occupations in Southwest Harbor are Sales & Related (15 | 13.9%), and Office & Administration (3 | 2.8%).
Sales and Office Occupations by Sex
| Occupation | Male | Female |
| Sales & Related | 4 (26.7%) | 11 (73.3%) |
| Office & Administration | 0 (0.0%) | 3 (100.0%) |
| Total (Category) | 4 (22.2%) | 14 (77.8%) |
| Total (Overall) | 55 (50.9%) | 53 (49.1%) |
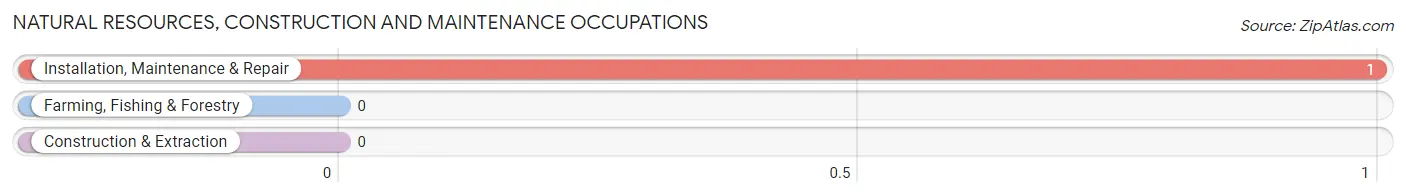
Natural Resources, Construction and Maintenance Occupations
The most common Natural Resources, Construction and Maintenance occupations in Southwest Harbor are , and Installation, Maintenance & Repair (1 | 0.9%).
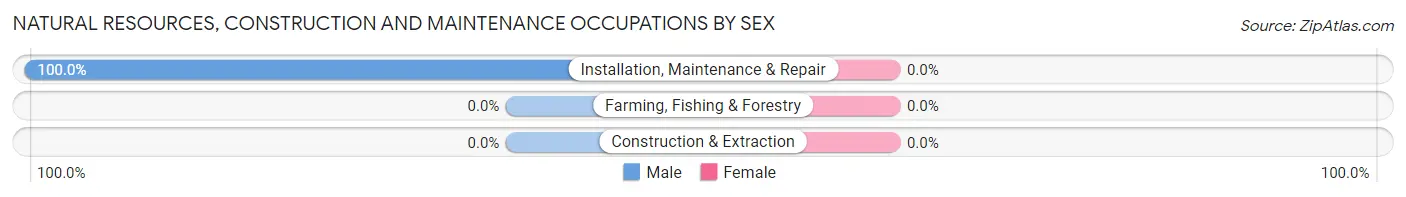
Natural Resources, Construction and Maintenance Occupations by Sex
| Occupation | Male | Female |
| Farming, Fishing & Forestry | 0 (0.0%) | 0 (0.0%) |
| Construction & Extraction | 0 (0.0%) | 0 (0.0%) |
| Installation, Maintenance & Repair | 1 (100.0%) | 0 (0.0%) |
| Total (Category) | 1 (100.0%) | 0 (0.0%) |
| Total (Overall) | 55 (50.9%) | 53 (49.1%) |
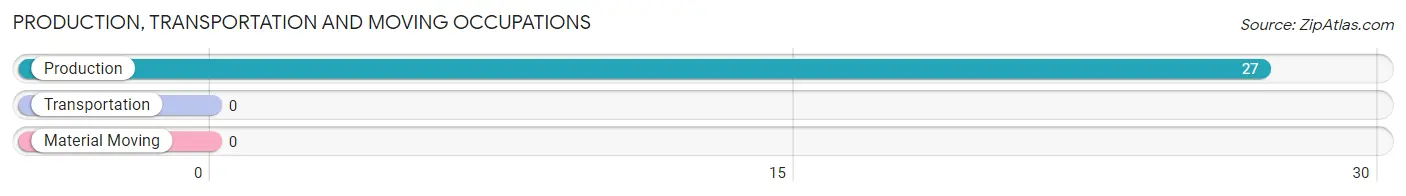
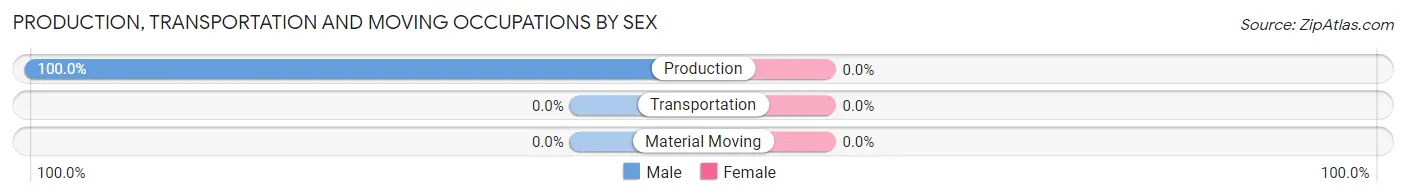
Production, Transportation and Moving Occupations
The most common Production, Transportation and Moving occupations in Southwest Harbor are , and Production (27 | 25.0%).
Production, Transportation and Moving Occupations by Sex
| Occupation | Male | Female |
| Production | 27 (100.0%) | 0 (0.0%) |
| Transportation | 0 (0.0%) | 0 (0.0%) |
| Material Moving | 0 (0.0%) | 0 (0.0%) |
| Total (Category) | 27 (100.0%) | 0 (0.0%) |
| Total (Overall) | 55 (50.9%) | 53 (49.1%) |
Employment Industries by Sex in Southwest Harbor
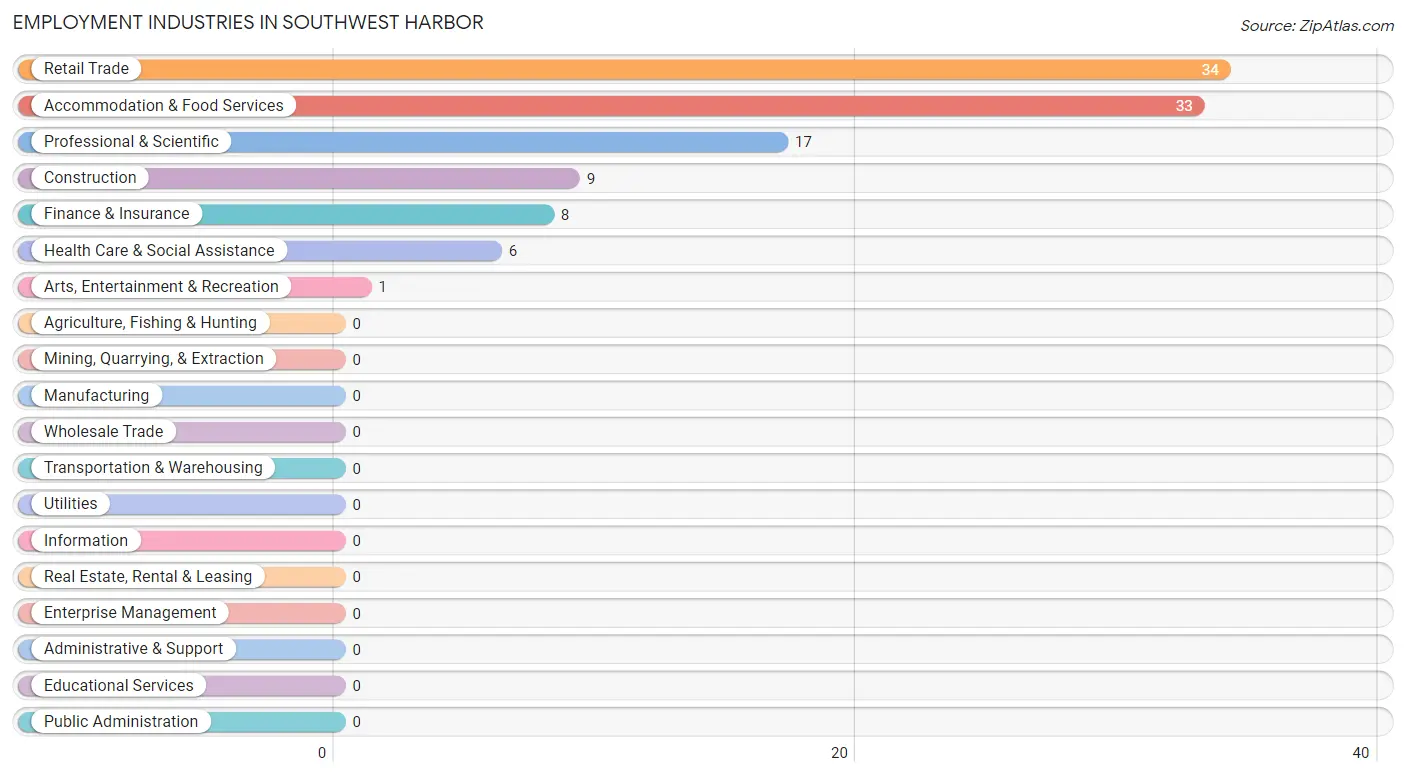
Employment Industries in Southwest Harbor
The major employment industries in Southwest Harbor include Retail Trade (34 | 31.5%), Accommodation & Food Services (33 | 30.6%), Professional & Scientific (17 | 15.7%), Construction (9 | 8.3%), and Finance & Insurance (8 | 7.4%).
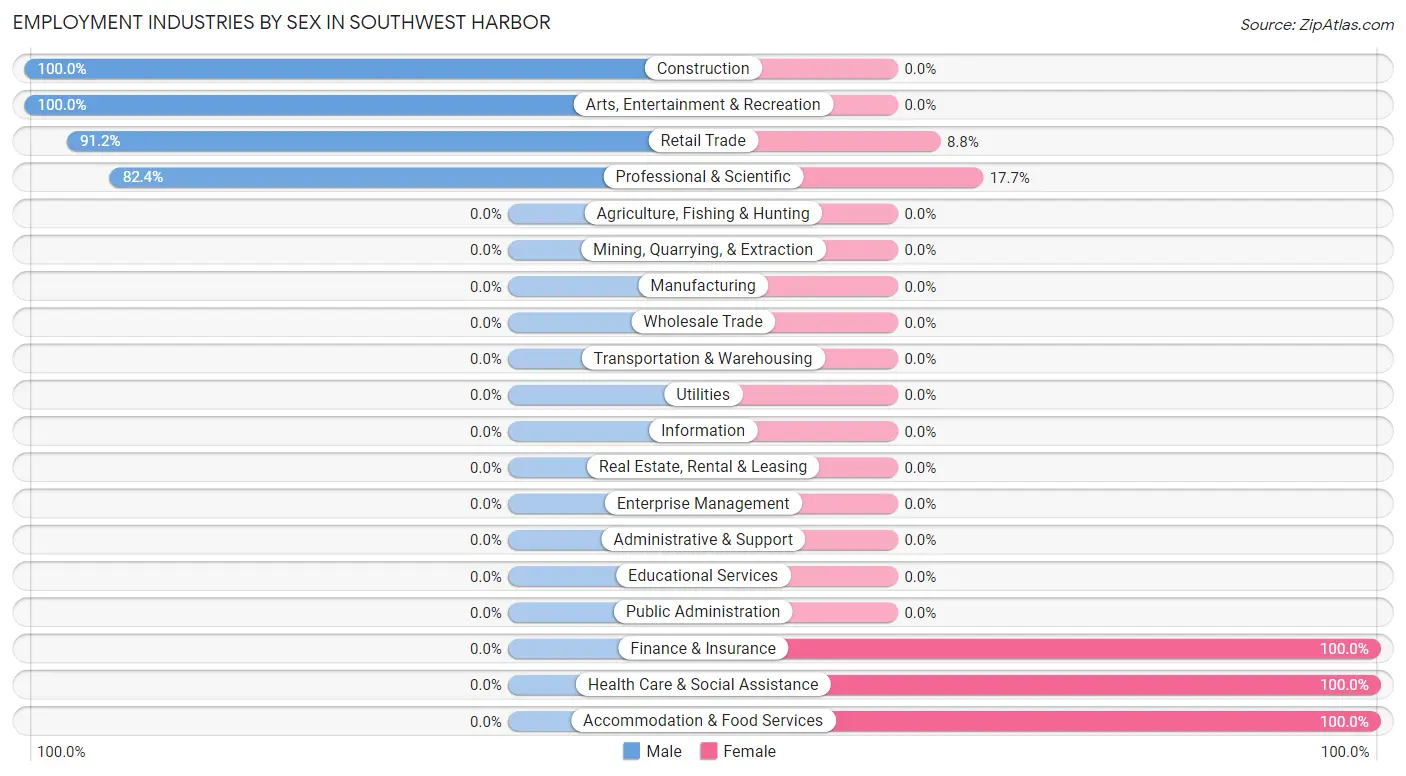
Employment Industries by Sex in Southwest Harbor
The Southwest Harbor industries that see more men than women are Construction (100.0%), Arts, Entertainment & Recreation (100.0%), and Retail Trade (91.2%), whereas the industries that tend to have a higher number of women are Finance & Insurance (100.0%), Health Care & Social Assistance (100.0%), and Accommodation & Food Services (100.0%).
| Industry | Male | Female |
| Agriculture, Fishing & Hunting | 0 (0.0%) | 0 (0.0%) |
| Mining, Quarrying, & Extraction | 0 (0.0%) | 0 (0.0%) |
| Construction | 9 (100.0%) | 0 (0.0%) |
| Manufacturing | 0 (0.0%) | 0 (0.0%) |
| Wholesale Trade | 0 (0.0%) | 0 (0.0%) |
| Retail Trade | 31 (91.2%) | 3 (8.8%) |
| Transportation & Warehousing | 0 (0.0%) | 0 (0.0%) |
| Utilities | 0 (0.0%) | 0 (0.0%) |
| Information | 0 (0.0%) | 0 (0.0%) |
| Finance & Insurance | 0 (0.0%) | 8 (100.0%) |
| Real Estate, Rental & Leasing | 0 (0.0%) | 0 (0.0%) |
| Professional & Scientific | 14 (82.4%) | 3 (17.6%) |
| Enterprise Management | 0 (0.0%) | 0 (0.0%) |
| Administrative & Support | 0 (0.0%) | 0 (0.0%) |
| Educational Services | 0 (0.0%) | 0 (0.0%) |
| Health Care & Social Assistance | 0 (0.0%) | 6 (100.0%) |
| Arts, Entertainment & Recreation | 1 (100.0%) | 0 (0.0%) |
| Accommodation & Food Services | 0 (0.0%) | 33 (100.0%) |
| Public Administration | 0 (0.0%) | 0 (0.0%) |
| Total | 55 (50.9%) | 53 (49.1%) |
Education in Southwest Harbor
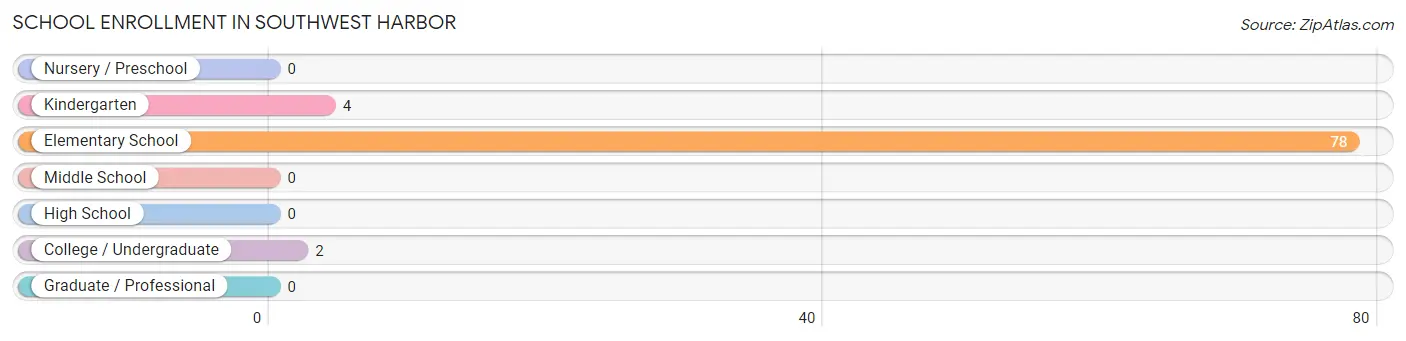
School Enrollment in Southwest Harbor
The most common levels of schooling among the 84 students in Southwest Harbor are elementary school (78 | 92.9%), kindergarten (4 | 4.8%), and college / undergraduate (2 | 2.4%).
| School Level | # Students | % Students |
| Nursery / Preschool | 0 | 0.0% |
| Kindergarten | 4 | 4.8% |
| Elementary School | 78 | 92.9% |
| Middle School | 0 | 0.0% |
| High School | 0 | 0.0% |
| College / Undergraduate | 2 | 2.4% |
| Graduate / Professional | 0 | 0.0% |
| Total | 84 | 100.0% |
School Enrollment by Age by Funding Source in Southwest Harbor
Out of a total of 84 students who are enrolled in schools in Southwest Harbor, 7 (8.3%) attend a private institution, while the remaining 77 (91.7%) are enrolled in public schools. The age group of 5 to 9 year old has the highest likelihood of being enrolled in private schools, with 7 (8.5% in the age bracket) enrolled. Conversely, the age group of 20 to 24 year olds has the lowest likelihood of being enrolled in a private school, with 2 (100.0% in the age bracket) attending a public institution.
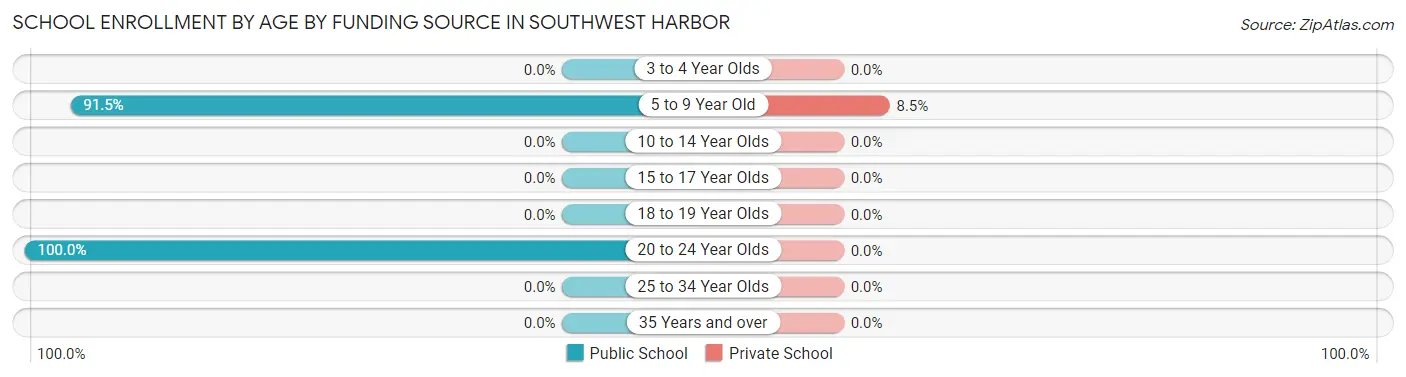
| Age Bracket | Public School | Private School |
| 3 to 4 Year Olds | 0 (0.0%) | 0 (0.0%) |
| 5 to 9 Year Old | 75 (91.5%) | 7 (8.5%) |
| 10 to 14 Year Olds | 0 (0.0%) | 0 (0.0%) |
| 15 to 17 Year Olds | 0 (0.0%) | 0 (0.0%) |
| 18 to 19 Year Olds | 0 (0.0%) | 0 (0.0%) |
| 20 to 24 Year Olds | 2 (100.0%) | 0 (0.0%) |
| 25 to 34 Year Olds | 0 (0.0%) | 0 (0.0%) |
| 35 Years and over | 0 (0.0%) | 0 (0.0%) |
| Total | 77 (91.7%) | 7 (8.3%) |
Educational Attainment by Field of Study in Southwest Harbor
Business (26 | 21.5%), science & technology (25 | 20.7%), bio, nature & agricultural (18 | 14.9%), liberal arts & history (15 | 12.4%), and arts & humanities (13 | 10.7%) are the most common fields of study among 121 individuals in Southwest Harbor who have obtained a bachelor's degree or higher.
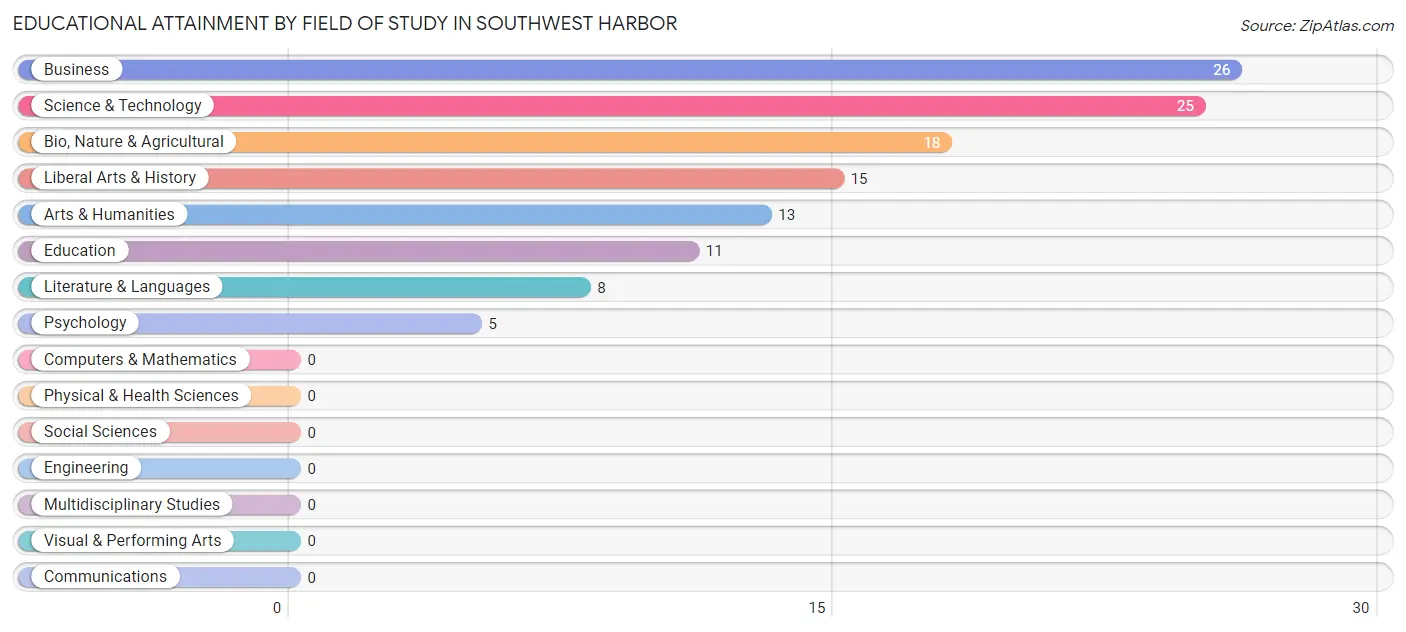
| Field of Study | # Graduates | % Graduates |
| Computers & Mathematics | 0 | 0.0% |
| Bio, Nature & Agricultural | 18 | 14.9% |
| Physical & Health Sciences | 0 | 0.0% |
| Psychology | 5 | 4.1% |
| Social Sciences | 0 | 0.0% |
| Engineering | 0 | 0.0% |
| Multidisciplinary Studies | 0 | 0.0% |
| Science & Technology | 25 | 20.7% |
| Business | 26 | 21.5% |
| Education | 11 | 9.1% |
| Literature & Languages | 8 | 6.6% |
| Liberal Arts & History | 15 | 12.4% |
| Visual & Performing Arts | 0 | 0.0% |
| Communications | 0 | 0.0% |
| Arts & Humanities | 13 | 10.7% |
| Total | 121 | 100.0% |
Transportation & Commute in Southwest Harbor
Vehicle Availability by Sex in Southwest Harbor
The most prevalent vehicle ownership categories in Southwest Harbor are males with 1 vehicle (38, accounting for 55.1%) and females with 1 vehicle (39, making up 71.7%).
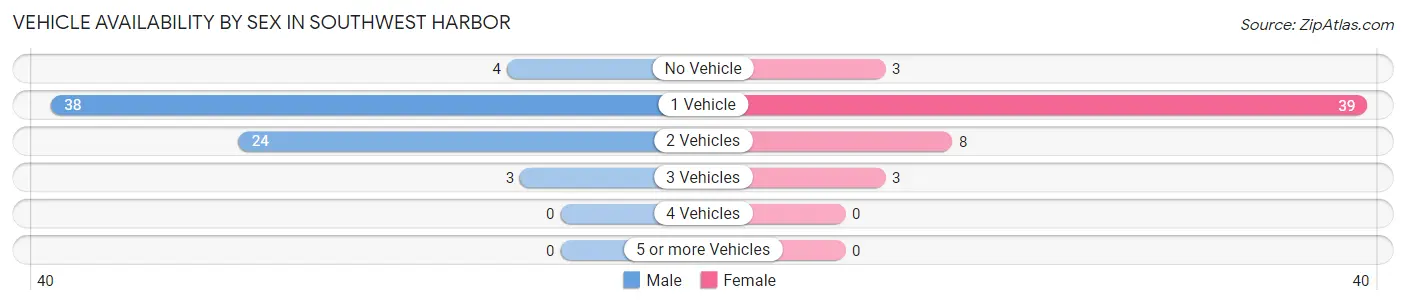
| Vehicles Available | Male | Female |
| No Vehicle | 4 (5.8%) | 3 (5.7%) |
| 1 Vehicle | 38 (55.1%) | 39 (73.6%) |
| 2 Vehicles | 24 (34.8%) | 8 (15.1%) |
| 3 Vehicles | 3 (4.3%) | 3 (5.7%) |
| 4 Vehicles | 0 (0.0%) | 0 (0.0%) |
| 5 or more Vehicles | 0 (0.0%) | 0 (0.0%) |
| Total | 69 (100.0%) | 53 (100.0%) |
Commute Time in Southwest Harbor
The most frequently occuring commute durations in Southwest Harbor are less than 5 minutes (48 commuters, 38.4%), 5 to 9 minutes (40 commuters, 32.0%), and 15 to 19 minutes (16 commuters, 12.8%).
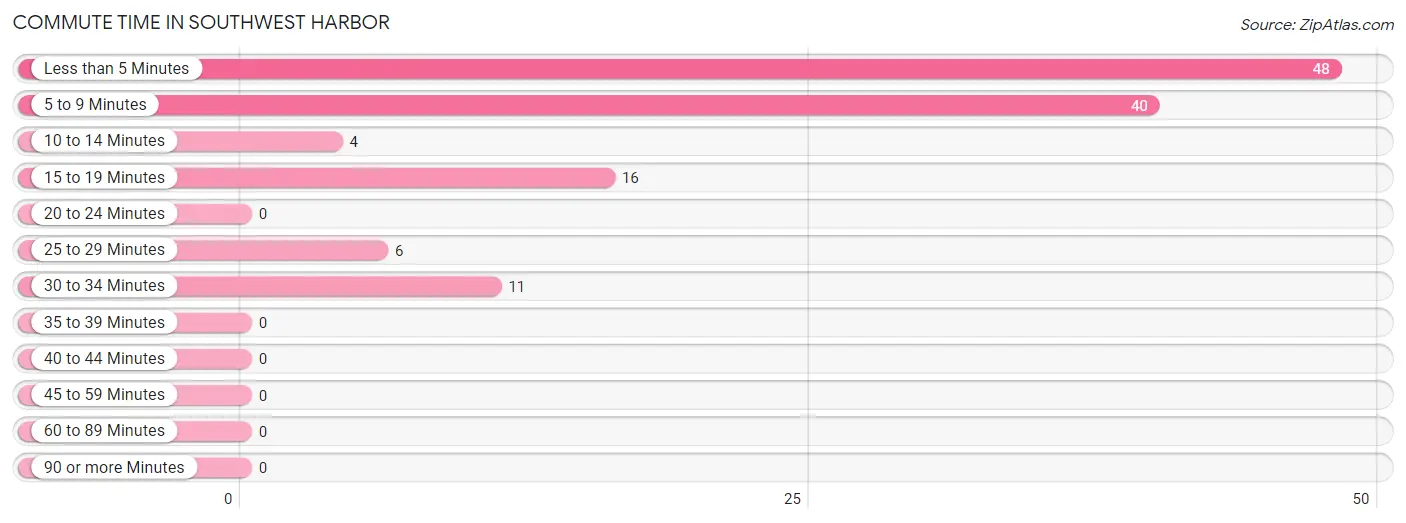
| Commute Time | # Commuters | % Commuters |
| Less than 5 Minutes | 48 | 38.4% |
| 5 to 9 Minutes | 40 | 32.0% |
| 10 to 14 Minutes | 4 | 3.2% |
| 15 to 19 Minutes | 16 | 12.8% |
| 20 to 24 Minutes | 0 | 0.0% |
| 25 to 29 Minutes | 6 | 4.8% |
| 30 to 34 Minutes | 11 | 8.8% |
| 35 to 39 Minutes | 0 | 0.0% |
| 40 to 44 Minutes | 0 | 0.0% |
| 45 to 59 Minutes | 0 | 0.0% |
| 60 to 89 Minutes | 0 | 0.0% |
| 90 or more Minutes | 0 | 0.0% |
Commute Time by Sex in Southwest Harbor
The most common commute times in Southwest Harbor are less than 5 minutes (44 commuters, 60.3%) for males and 5 to 9 minutes (31 commuters, 59.6%) for females.
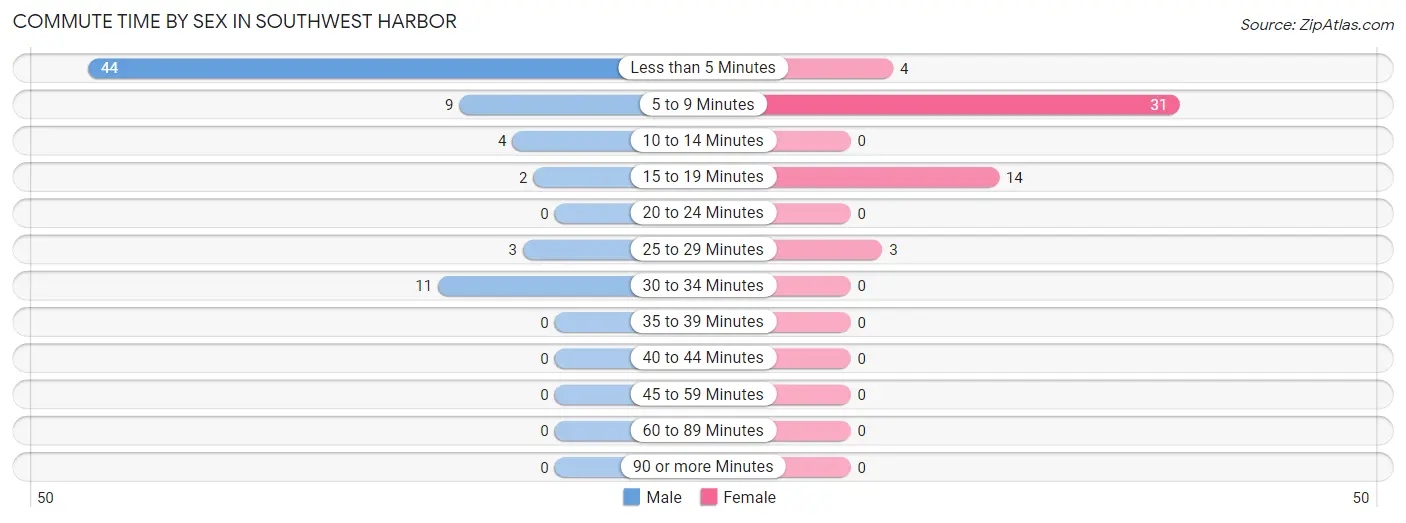
| Commute Time | Male | Female |
| Less than 5 Minutes | 44 (60.3%) | 4 (7.7%) |
| 5 to 9 Minutes | 9 (12.3%) | 31 (59.6%) |
| 10 to 14 Minutes | 4 (5.5%) | 0 (0.0%) |
| 15 to 19 Minutes | 2 (2.7%) | 14 (26.9%) |
| 20 to 24 Minutes | 0 (0.0%) | 0 (0.0%) |
| 25 to 29 Minutes | 3 (4.1%) | 3 (5.8%) |
| 30 to 34 Minutes | 11 (15.1%) | 0 (0.0%) |
| 35 to 39 Minutes | 0 (0.0%) | 0 (0.0%) |
| 40 to 44 Minutes | 0 (0.0%) | 0 (0.0%) |
| 45 to 59 Minutes | 0 (0.0%) | 0 (0.0%) |
| 60 to 89 Minutes | 0 (0.0%) | 0 (0.0%) |
| 90 or more Minutes | 0 (0.0%) | 0 (0.0%) |
Time of Departure to Work by Sex in Southwest Harbor
The most frequent times of departure to work in Southwest Harbor are 6:30 AM to 6:59 AM (27, 37.0%) for males and 12:00 PM to 3:59 PM (28, 53.8%) for females.
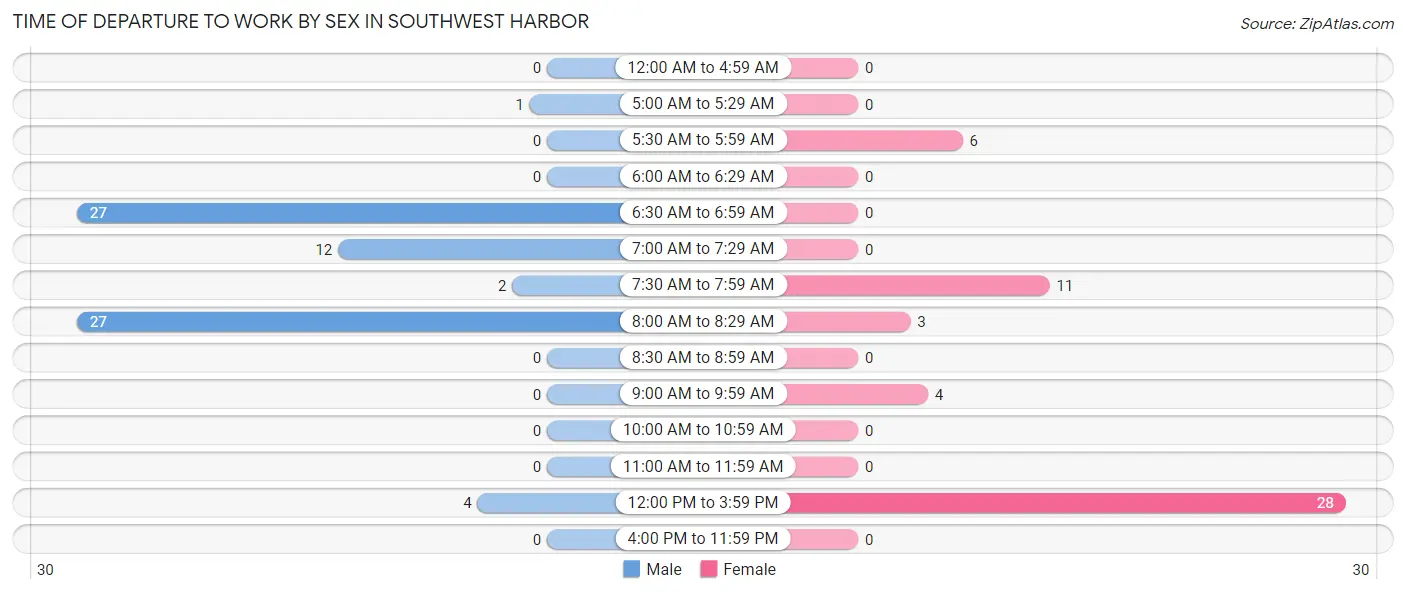
| Time of Departure | Male | Female |
| 12:00 AM to 4:59 AM | 0 (0.0%) | 0 (0.0%) |
| 5:00 AM to 5:29 AM | 1 (1.4%) | 0 (0.0%) |
| 5:30 AM to 5:59 AM | 0 (0.0%) | 6 (11.5%) |
| 6:00 AM to 6:29 AM | 0 (0.0%) | 0 (0.0%) |
| 6:30 AM to 6:59 AM | 27 (37.0%) | 0 (0.0%) |
| 7:00 AM to 7:29 AM | 12 (16.4%) | 0 (0.0%) |
| 7:30 AM to 7:59 AM | 2 (2.7%) | 11 (21.1%) |
| 8:00 AM to 8:29 AM | 27 (37.0%) | 3 (5.8%) |
| 8:30 AM to 8:59 AM | 0 (0.0%) | 0 (0.0%) |
| 9:00 AM to 9:59 AM | 0 (0.0%) | 4 (7.7%) |
| 10:00 AM to 10:59 AM | 0 (0.0%) | 0 (0.0%) |
| 11:00 AM to 11:59 AM | 0 (0.0%) | 0 (0.0%) |
| 12:00 PM to 3:59 PM | 4 (5.5%) | 28 (53.8%) |
| 4:00 PM to 11:59 PM | 0 (0.0%) | 0 (0.0%) |
| Total | 73 (100.0%) | 52 (100.0%) |
Housing Occupancy in Southwest Harbor
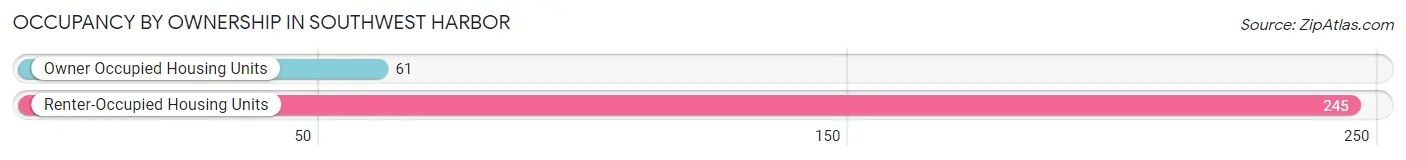
Occupancy by Ownership in Southwest Harbor
Of the total 306 dwellings in Southwest Harbor, owner-occupied units account for 61 (19.9%), while renter-occupied units make up 245 (80.1%).
| Occupancy | # Housing Units | % Housing Units |
| Owner Occupied Housing Units | 61 | 19.9% |
| Renter-Occupied Housing Units | 245 | 80.1% |
| Total Occupied Housing Units | 306 | 100.0% |
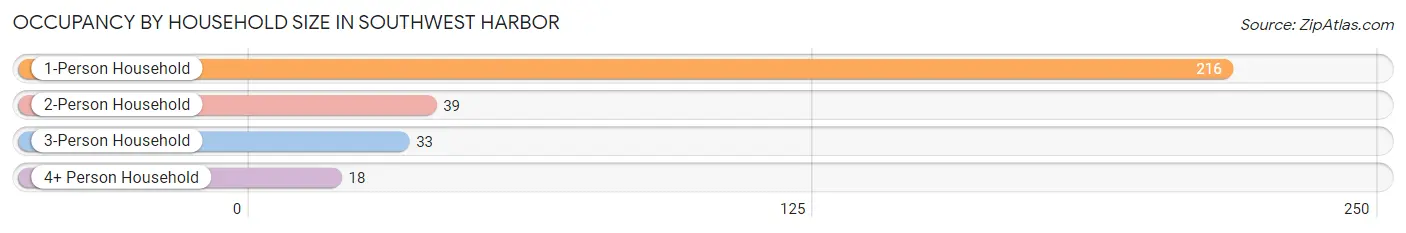
Occupancy by Household Size in Southwest Harbor
| Household Size | # Housing Units | % Housing Units |
| 1-Person Household | 216 | 70.6% |
| 2-Person Household | 39 | 12.8% |
| 3-Person Household | 33 | 10.8% |
| 4+ Person Household | 18 | 5.9% |
| Total Housing Units | 306 | 100.0% |
Occupancy by Ownership by Household Size in Southwest Harbor
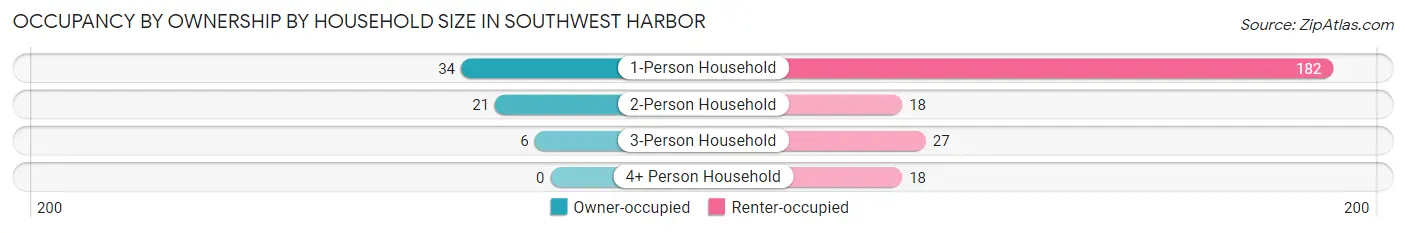
| Household Size | Owner-occupied | Renter-occupied |
| 1-Person Household | 34 (15.7%) | 182 (84.3%) |
| 2-Person Household | 21 (53.8%) | 18 (46.2%) |
| 3-Person Household | 6 (18.2%) | 27 (81.8%) |
| 4+ Person Household | 0 (0.0%) | 18 (100.0%) |
| Total Housing Units | 61 (19.9%) | 245 (80.1%) |
Occupancy by Educational Attainment in Southwest Harbor
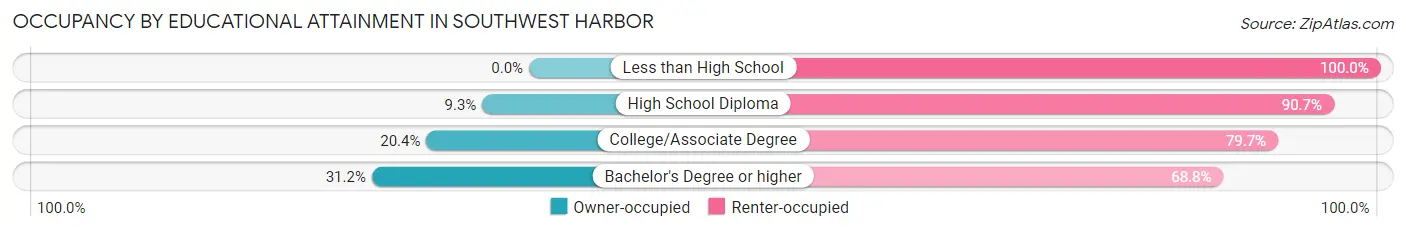
| Household Size | Owner-occupied | Renter-occupied |
| Less than High School | 0 (0.0%) | 3 (100.0%) |
| High School Diploma | 9 (9.3%) | 88 (90.7%) |
| College/Associate Degree | 23 (20.3%) | 90 (79.6%) |
| Bachelor's Degree or higher | 29 (31.2%) | 64 (68.8%) |
Occupancy by Age of Householder in Southwest Harbor
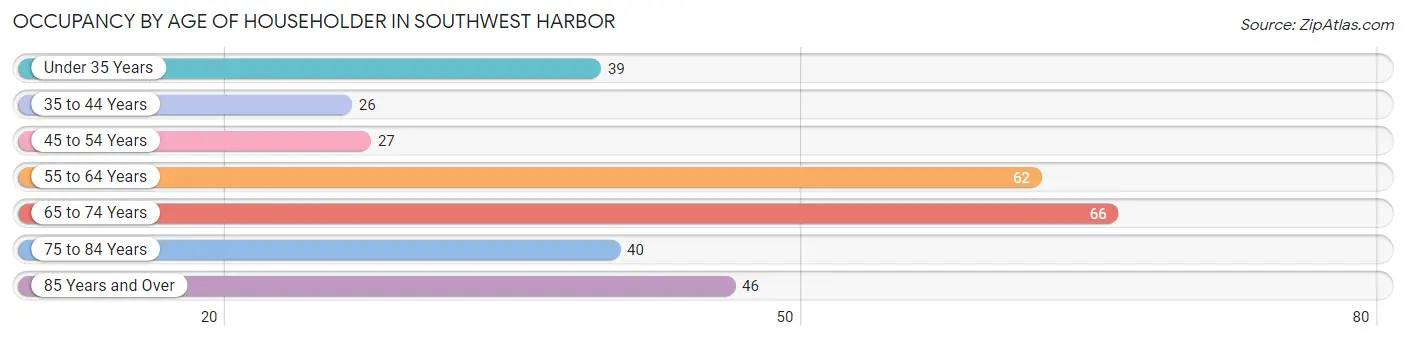
| Age Bracket | # Households | % Households |
| Under 35 Years | 39 | 12.8% |
| 35 to 44 Years | 26 | 8.5% |
| 45 to 54 Years | 27 | 8.8% |
| 55 to 64 Years | 62 | 20.3% |
| 65 to 74 Years | 66 | 21.6% |
| 75 to 84 Years | 40 | 13.1% |
| 85 Years and Over | 46 | 15.0% |
| Total | 306 | 100.0% |
Housing Finances in Southwest Harbor
Median Income by Occupancy in Southwest Harbor
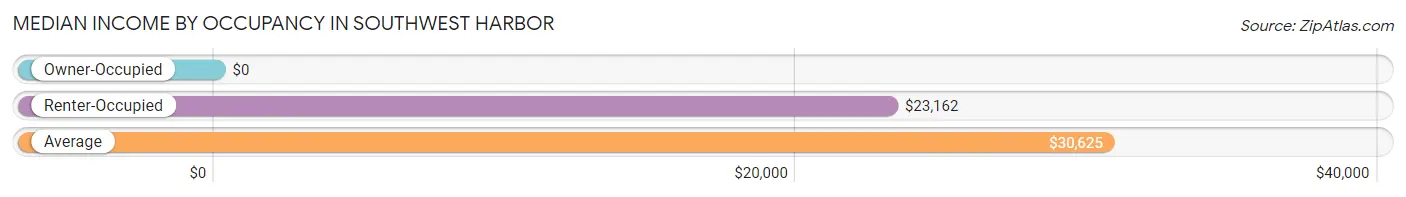
| Occupancy Type | # Households | Median Income |
| Owner-Occupied | 61 (19.9%) | $0 |
| Renter-Occupied | 245 (80.1%) | $23,162 |
| Average | 306 (100.0%) | $30,625 |
Occupancy by Householder Income Bracket in Southwest Harbor
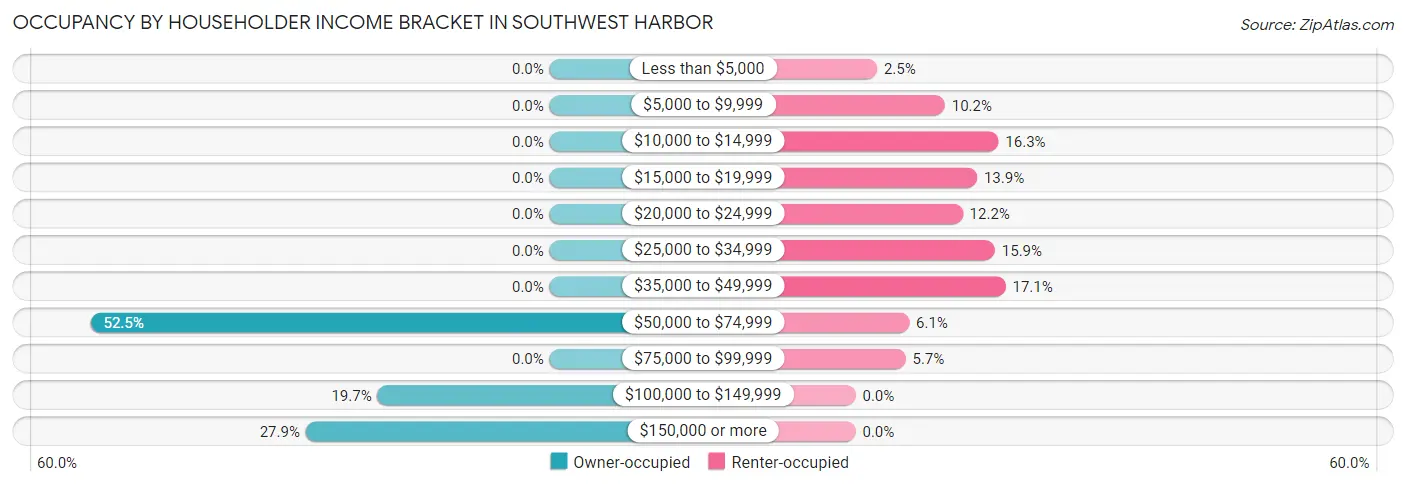
| Income Bracket | Owner-occupied | Renter-occupied |
| Less than $5,000 | 0 (0.0%) | 6 (2.5%) |
| $5,000 to $9,999 | 0 (0.0%) | 25 (10.2%) |
| $10,000 to $14,999 | 0 (0.0%) | 40 (16.3%) |
| $15,000 to $19,999 | 0 (0.0%) | 34 (13.9%) |
| $20,000 to $24,999 | 0 (0.0%) | 30 (12.2%) |
| $25,000 to $34,999 | 0 (0.0%) | 39 (15.9%) |
| $35,000 to $49,999 | 0 (0.0%) | 42 (17.1%) |
| $50,000 to $74,999 | 32 (52.5%) | 15 (6.1%) |
| $75,000 to $99,999 | 0 (0.0%) | 14 (5.7%) |
| $100,000 to $149,999 | 12 (19.7%) | 0 (0.0%) |
| $150,000 or more | 17 (27.9%) | 0 (0.0%) |
| Total | 61 (100.0%) | 245 (100.0%) |
Monthly Housing Cost Tiers in Southwest Harbor
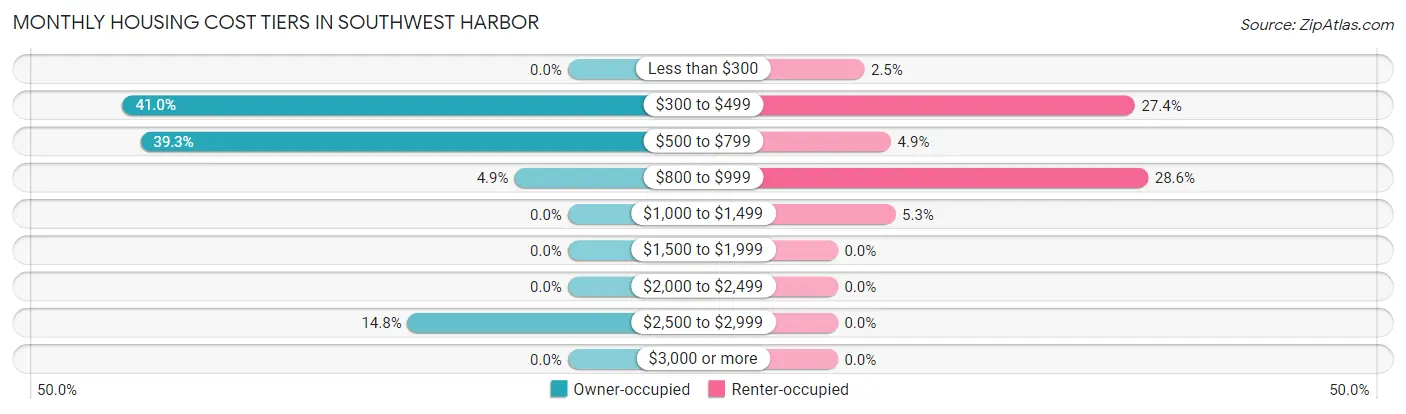
| Monthly Cost | Owner-occupied | Renter-occupied |
| Less than $300 | 0 (0.0%) | 6 (2.5%) |
| $300 to $499 | 25 (41.0%) | 67 (27.4%) |
| $500 to $799 | 24 (39.3%) | 12 (4.9%) |
| $800 to $999 | 3 (4.9%) | 70 (28.6%) |
| $1,000 to $1,499 | 0 (0.0%) | 13 (5.3%) |
| $1,500 to $1,999 | 0 (0.0%) | 0 (0.0%) |
| $2,000 to $2,499 | 0 (0.0%) | 0 (0.0%) |
| $2,500 to $2,999 | 9 (14.7%) | 0 (0.0%) |
| $3,000 or more | 0 (0.0%) | 0 (0.0%) |
| Total | 61 (100.0%) | 245 (100.0%) |
Physical Housing Characteristics in Southwest Harbor
Housing Structures in Southwest Harbor
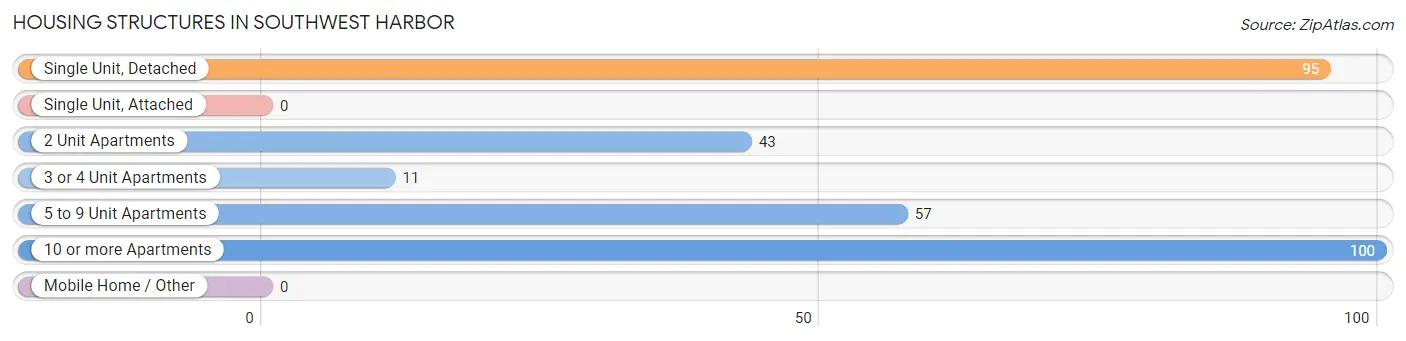
| Structure Type | # Housing Units | % Housing Units |
| Single Unit, Detached | 95 | 31.0% |
| Single Unit, Attached | 0 | 0.0% |
| 2 Unit Apartments | 43 | 14.1% |
| 3 or 4 Unit Apartments | 11 | 3.6% |
| 5 to 9 Unit Apartments | 57 | 18.6% |
| 10 or more Apartments | 100 | 32.7% |
| Mobile Home / Other | 0 | 0.0% |
| Total | 306 | 100.0% |
Housing Structures by Occupancy in Southwest Harbor
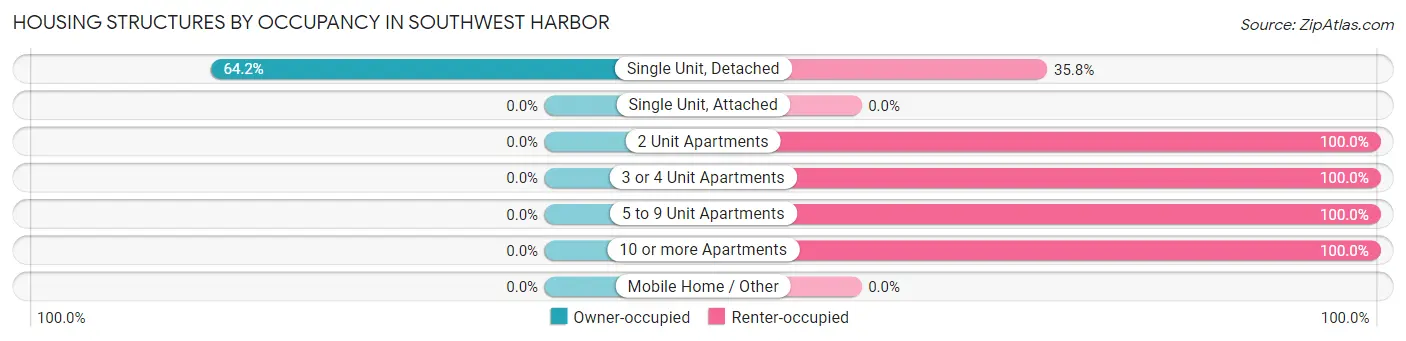
| Structure Type | Owner-occupied | Renter-occupied |
| Single Unit, Detached | 61 (64.2%) | 34 (35.8%) |
| Single Unit, Attached | 0 (0.0%) | 0 (0.0%) |
| 2 Unit Apartments | 0 (0.0%) | 43 (100.0%) |
| 3 or 4 Unit Apartments | 0 (0.0%) | 11 (100.0%) |
| 5 to 9 Unit Apartments | 0 (0.0%) | 57 (100.0%) |
| 10 or more Apartments | 0 (0.0%) | 100 (100.0%) |
| Mobile Home / Other | 0 (0.0%) | 0 (0.0%) |
| Total | 61 (19.9%) | 245 (80.1%) |
Housing Structures by Number of Rooms in Southwest Harbor
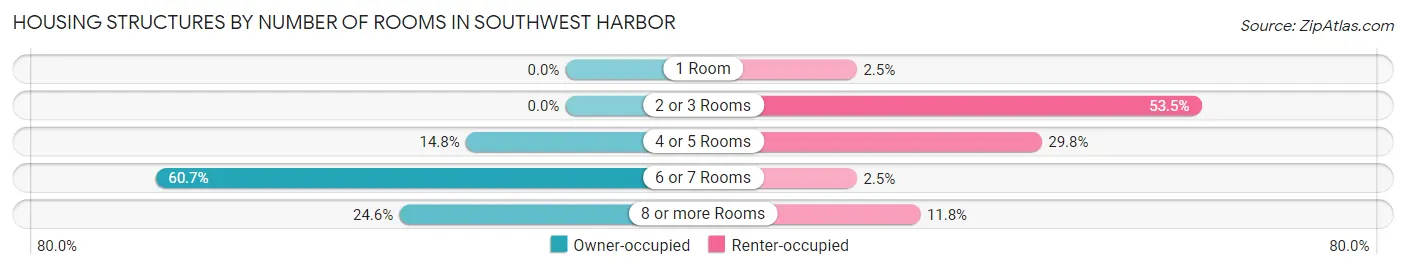
| Number of Rooms | Owner-occupied | Renter-occupied |
| 1 Room | 0 (0.0%) | 6 (2.5%) |
| 2 or 3 Rooms | 0 (0.0%) | 131 (53.5%) |
| 4 or 5 Rooms | 9 (14.7%) | 73 (29.8%) |
| 6 or 7 Rooms | 37 (60.7%) | 6 (2.5%) |
| 8 or more Rooms | 15 (24.6%) | 29 (11.8%) |
| Total | 61 (100.0%) | 245 (100.0%) |
Housing Structure by Heating Type in Southwest Harbor
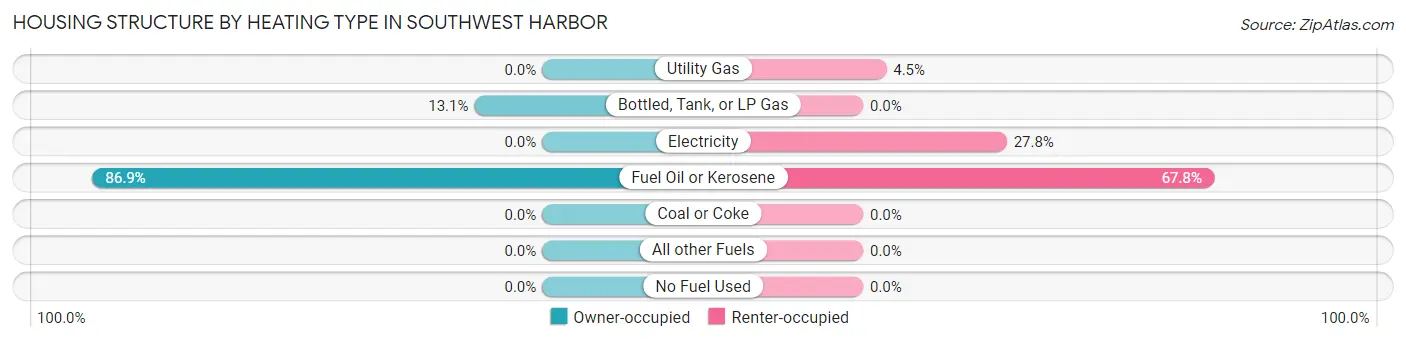
| Heating Type | Owner-occupied | Renter-occupied |
| Utility Gas | 0 (0.0%) | 11 (4.5%) |
| Bottled, Tank, or LP Gas | 8 (13.1%) | 0 (0.0%) |
| Electricity | 0 (0.0%) | 68 (27.8%) |
| Fuel Oil or Kerosene | 53 (86.9%) | 166 (67.8%) |
| Coal or Coke | 0 (0.0%) | 0 (0.0%) |
| All other Fuels | 0 (0.0%) | 0 (0.0%) |
| No Fuel Used | 0 (0.0%) | 0 (0.0%) |
| Total | 61 (100.0%) | 245 (100.0%) |
Household Vehicle Usage in Southwest Harbor
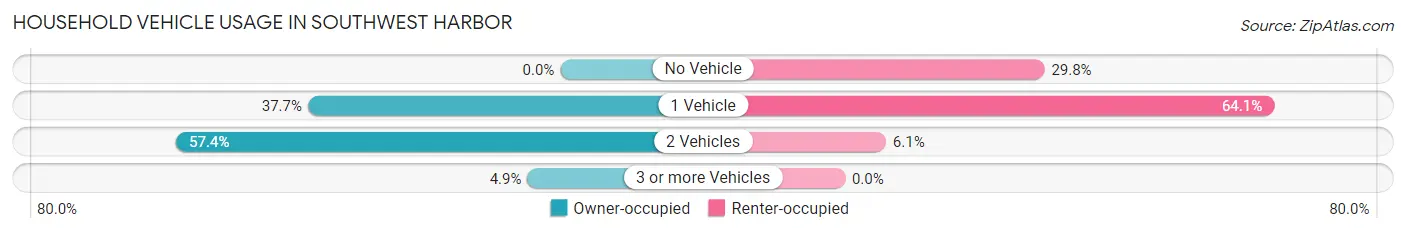
| Vehicles per Household | Owner-occupied | Renter-occupied |
| No Vehicle | 0 (0.0%) | 73 (29.8%) |
| 1 Vehicle | 23 (37.7%) | 157 (64.1%) |
| 2 Vehicles | 35 (57.4%) | 15 (6.1%) |
| 3 or more Vehicles | 3 (4.9%) | 0 (0.0%) |
| Total | 61 (100.0%) | 245 (100.0%) |
Real Estate & Mortgages in Southwest Harbor
Real Estate and Mortgage Overview in Southwest Harbor
| Characteristic | Without Mortgage | With Mortgage |
| Housing Units | 52 | 9 |
| Median Property Value | $420,700 | $0 |
| Median Household Income | - | - |
| Monthly Housing Costs | $517 | $0 |
| Real Estate Taxes | $2,500 | $0 |
Property Value by Mortgage Status in Southwest Harbor
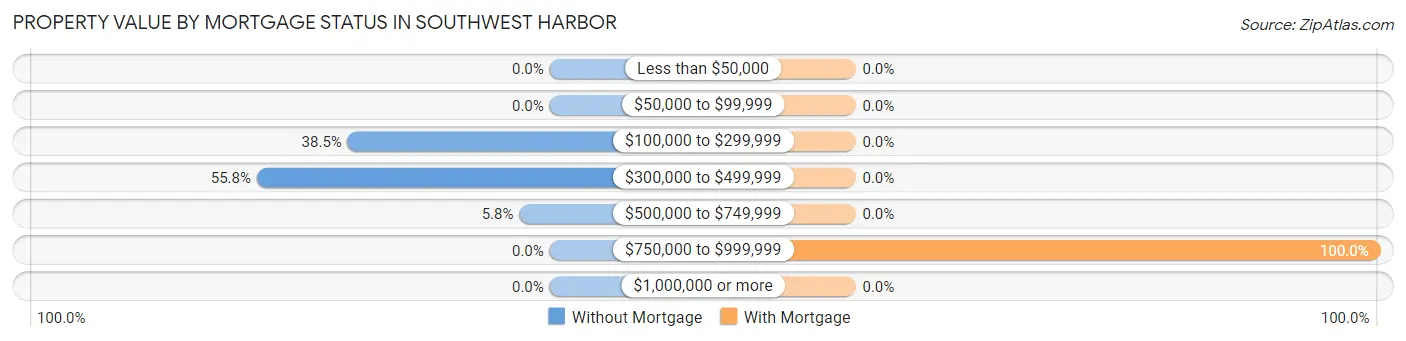
| Property Value | Without Mortgage | With Mortgage |
| Less than $50,000 | 0 (0.0%) | 0 (0.0%) |
| $50,000 to $99,999 | 0 (0.0%) | 0 (0.0%) |
| $100,000 to $299,999 | 20 (38.5%) | 0 (0.0%) |
| $300,000 to $499,999 | 29 (55.8%) | 0 (0.0%) |
| $500,000 to $749,999 | 3 (5.8%) | 0 (0.0%) |
| $750,000 to $999,999 | 0 (0.0%) | 9 (100.0%) |
| $1,000,000 or more | 0 (0.0%) | 0 (0.0%) |
| Total | 52 (100.0%) | 9 (100.0%) |
Household Income by Mortgage Status in Southwest Harbor
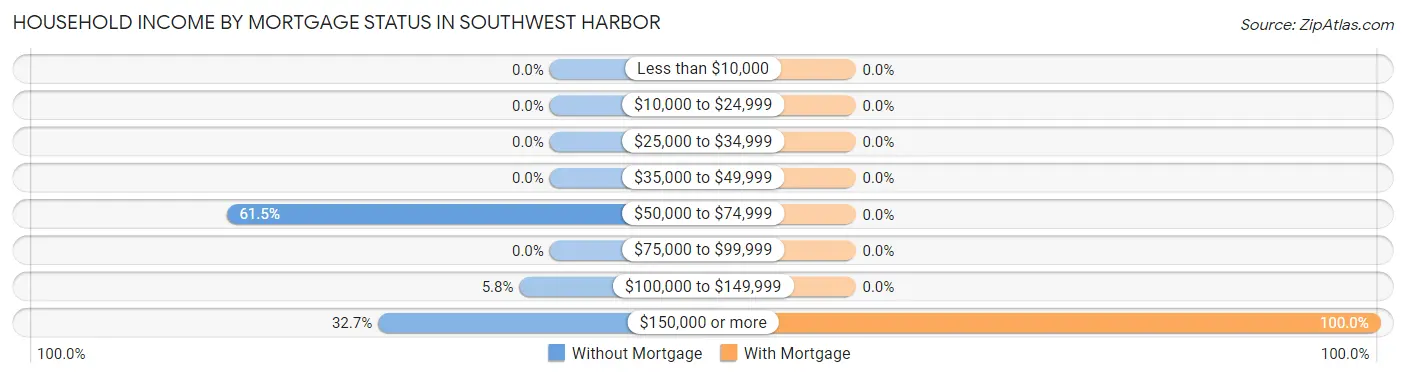
| Household Income | Without Mortgage | With Mortgage |
| Less than $10,000 | 0 (0.0%) | 0 (0.0%) |
| $10,000 to $24,999 | 0 (0.0%) | 0 (0.0%) |
| $25,000 to $34,999 | 0 (0.0%) | 0 (0.0%) |
| $35,000 to $49,999 | 0 (0.0%) | 0 (0.0%) |
| $50,000 to $74,999 | 32 (61.5%) | 0 (0.0%) |
| $75,000 to $99,999 | 0 (0.0%) | 0 (0.0%) |
| $100,000 to $149,999 | 3 (5.8%) | 0 (0.0%) |
| $150,000 or more | 17 (32.7%) | 9 (100.0%) |
| Total | 52 (100.0%) | 9 (100.0%) |
Property Value to Household Income Ratio in Southwest Harbor
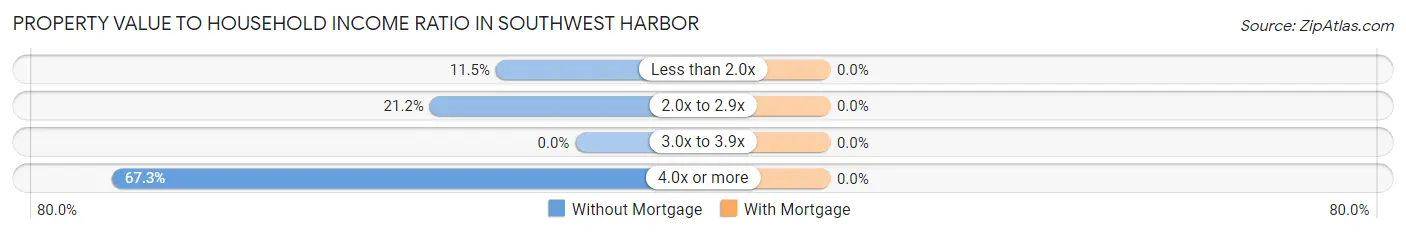
| Value-to-Income Ratio | Without Mortgage | With Mortgage |
| Less than 2.0x | 6 (11.5%) | 0 (0.0%) |
| 2.0x to 2.9x | 11 (21.1%) | 0 (0.0%) |
| 3.0x to 3.9x | 0 (0.0%) | 0 (0.0%) |
| 4.0x or more | 35 (67.3%) | 0 (0.0%) |
| Total | 52 (100.0%) | 9 (100.0%) |
Real Estate Taxes by Mortgage Status in Southwest Harbor
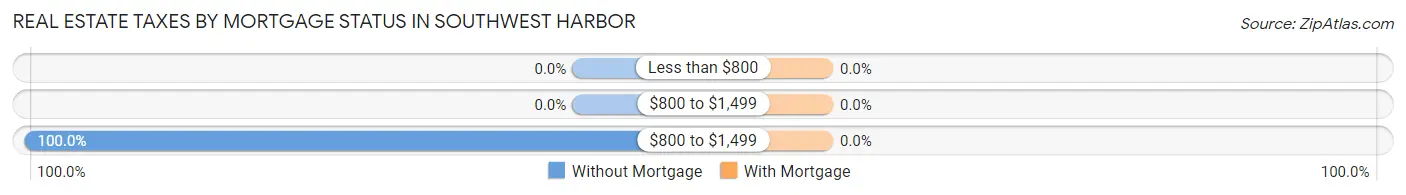
| Property Taxes | Without Mortgage | With Mortgage |
| Less than $800 | 0 (0.0%) | 0 (0.0%) |
| $800 to $1,499 | 0 (0.0%) | 0 (0.0%) |
| $800 to $1,499 | 52 (100.0%) | 0 (0.0%) |
| Total | 52 (100.0%) | 9 (100.0%) |
Health & Disability in Southwest Harbor
Health Insurance Coverage by Age in Southwest Harbor
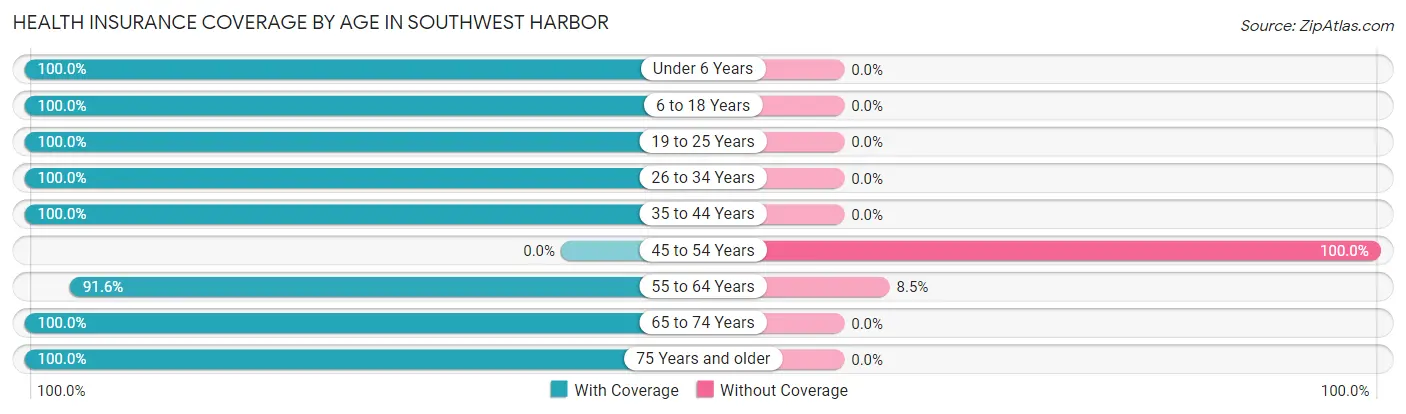
| Age Bracket | With Coverage | Without Coverage |
| Under 6 Years | 35 (100.0%) | 0 (0.0%) |
| 6 to 18 Years | 78 (100.0%) | 0 (0.0%) |
| 19 to 25 Years | 7 (100.0%) | 0 (0.0%) |
| 26 to 34 Years | 64 (100.0%) | 0 (0.0%) |
| 35 to 44 Years | 30 (100.0%) | 0 (0.0%) |
| 45 to 54 Years | 0 (0.0%) | 27 (100.0%) |
| 55 to 64 Years | 65 (91.5%) | 6 (8.5%) |
| 65 to 74 Years | 84 (100.0%) | 0 (0.0%) |
| 75 Years and older | 99 (100.0%) | 0 (0.0%) |
| Total | 462 (93.3%) | 33 (6.7%) |
Health Insurance Coverage by Citizenship Status in Southwest Harbor
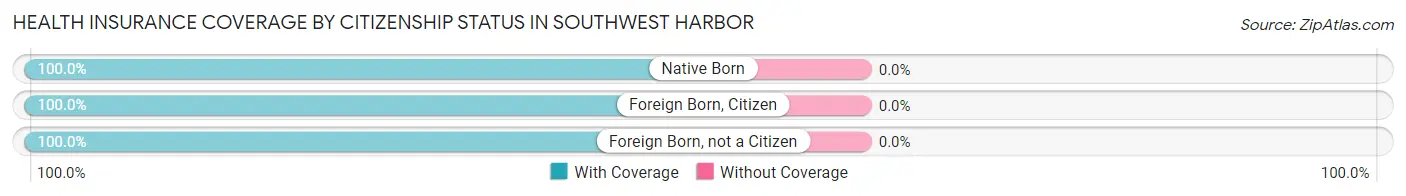
| Citizenship Status | With Coverage | Without Coverage |
| Native Born | 35 (100.0%) | 0 (0.0%) |
| Foreign Born, Citizen | 78 (100.0%) | 0 (0.0%) |
| Foreign Born, not a Citizen | 7 (100.0%) | 0 (0.0%) |
Health Insurance Coverage by Household Income in Southwest Harbor
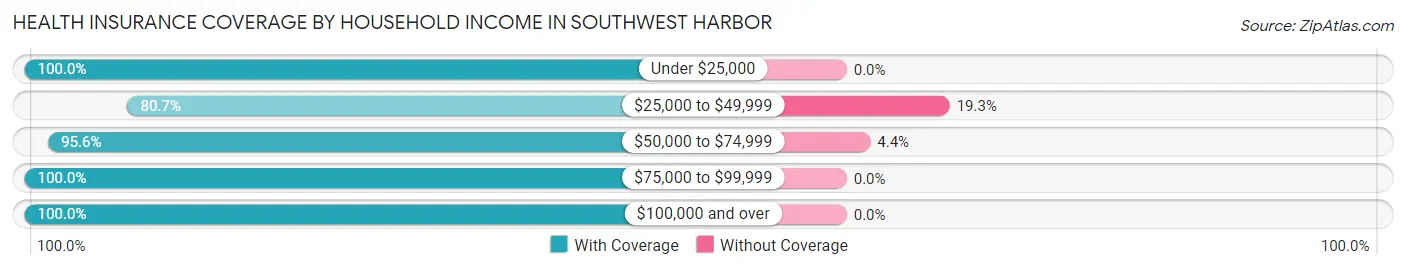
| Household Income | With Coverage | Without Coverage |
| Under $25,000 | 147 (100.0%) | 0 (0.0%) |
| $25,000 to $49,999 | 113 (80.7%) | 27 (19.3%) |
| $50,000 to $74,999 | 130 (95.6%) | 6 (4.4%) |
| $75,000 to $99,999 | 27 (100.0%) | 0 (0.0%) |
| $100,000 and over | 45 (100.0%) | 0 (0.0%) |
Public vs Private Health Insurance Coverage by Age in Southwest Harbor
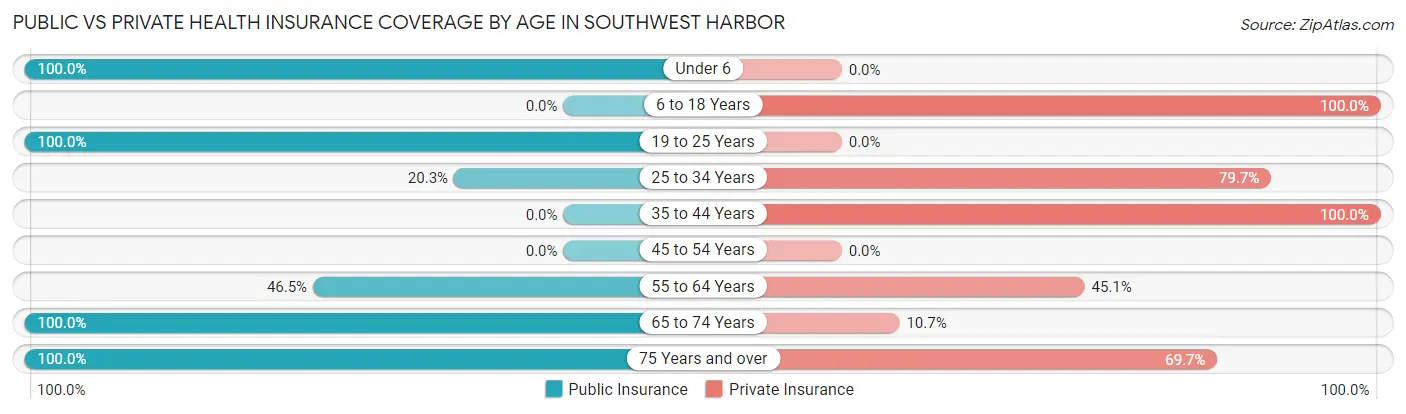
| Age Bracket | Public Insurance | Private Insurance |
| Under 6 | 35 (100.0%) | 0 (0.0%) |
| 6 to 18 Years | 0 (0.0%) | 78 (100.0%) |
| 19 to 25 Years | 7 (100.0%) | 0 (0.0%) |
| 25 to 34 Years | 13 (20.3%) | 51 (79.7%) |
| 35 to 44 Years | 0 (0.0%) | 30 (100.0%) |
| 45 to 54 Years | 0 (0.0%) | 0 (0.0%) |
| 55 to 64 Years | 33 (46.5%) | 32 (45.1%) |
| 65 to 74 Years | 84 (100.0%) | 9 (10.7%) |
| 75 Years and over | 99 (100.0%) | 69 (69.7%) |
| Total | 271 (54.7%) | 269 (54.3%) |
Disability Status by Sex by Age in Southwest Harbor
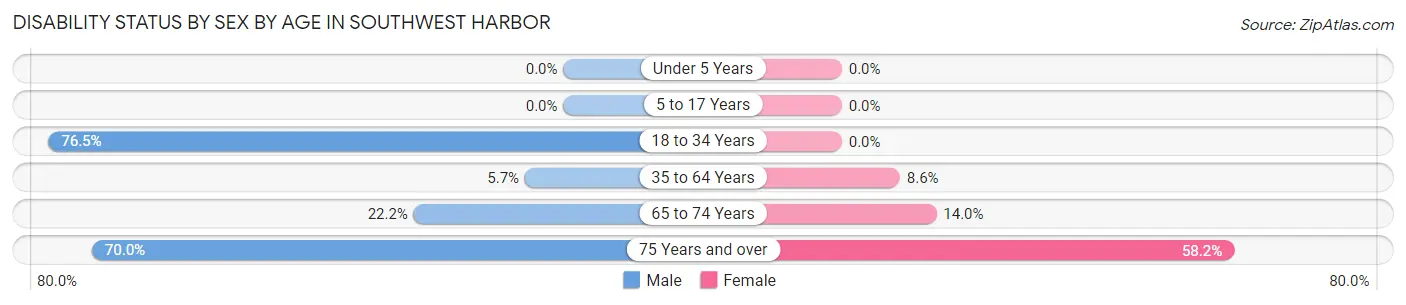
| Age Bracket | Male | Female |
| Under 5 Years | 0 (0.0%) | 0 (0.0%) |
| 5 to 17 Years | 0 (0.0%) | 0 (0.0%) |
| 18 to 34 Years | 13 (76.5%) | 0 (0.0%) |
| 35 to 64 Years | 4 (5.7%) | 5 (8.6%) |
| 65 to 74 Years | 6 (22.2%) | 8 (14.0%) |
| 75 Years and over | 14 (70.0%) | 46 (58.2%) |
Disability Class by Sex by Age in Southwest Harbor
Disability Class: Hearing Difficulty
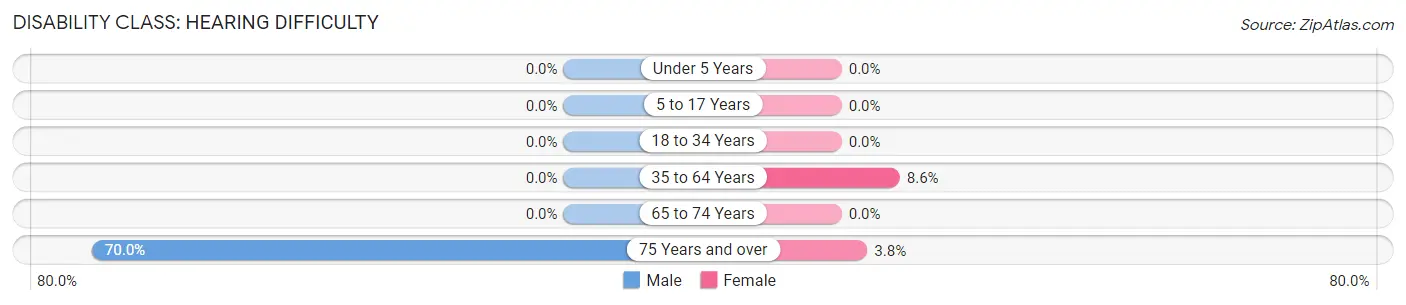
| Age Bracket | Male | Female |
| Under 5 Years | 0 (0.0%) | 0 (0.0%) |
| 5 to 17 Years | 0 (0.0%) | 0 (0.0%) |
| 18 to 34 Years | 0 (0.0%) | 0 (0.0%) |
| 35 to 64 Years | 0 (0.0%) | 5 (8.6%) |
| 65 to 74 Years | 0 (0.0%) | 0 (0.0%) |
| 75 Years and over | 14 (70.0%) | 3 (3.8%) |
Disability Class: Vision Difficulty
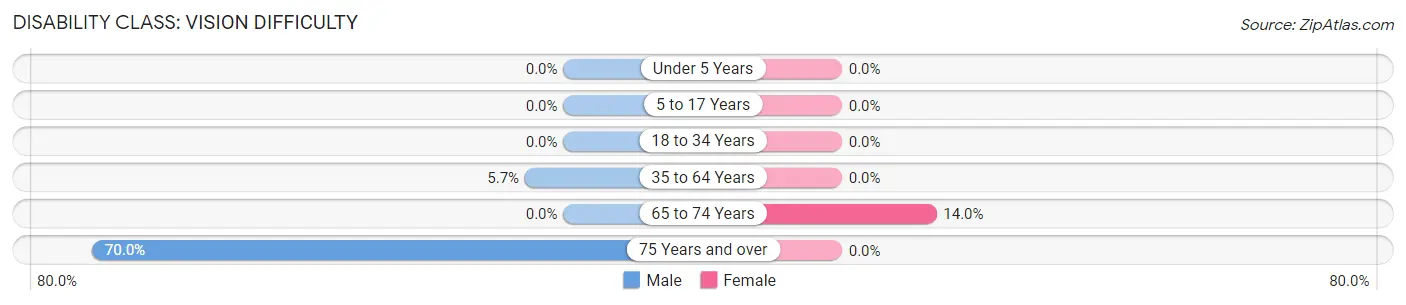
| Age Bracket | Male | Female |
| Under 5 Years | 0 (0.0%) | 0 (0.0%) |
| 5 to 17 Years | 0 (0.0%) | 0 (0.0%) |
| 18 to 34 Years | 0 (0.0%) | 0 (0.0%) |
| 35 to 64 Years | 4 (5.7%) | 0 (0.0%) |
| 65 to 74 Years | 0 (0.0%) | 8 (14.0%) |
| 75 Years and over | 14 (70.0%) | 0 (0.0%) |
Disability Class: Cognitive Difficulty
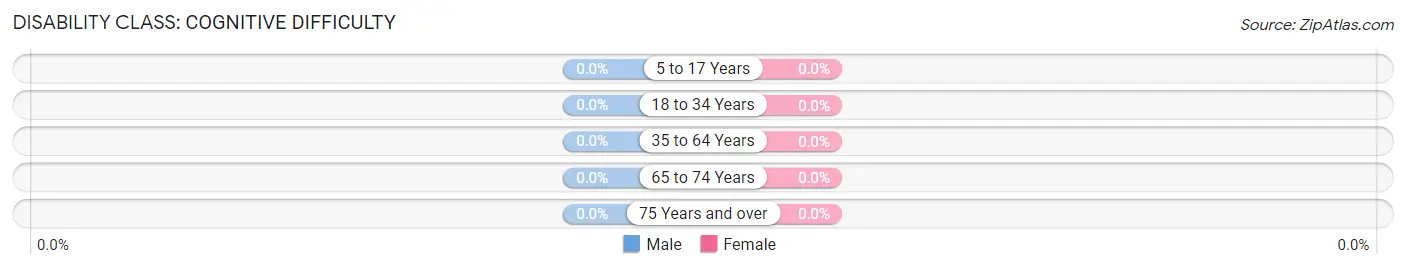
| Age Bracket | Male | Female |
| 5 to 17 Years | 0 (0.0%) | 0 (0.0%) |
| 18 to 34 Years | 0 (0.0%) | 0 (0.0%) |
| 35 to 64 Years | 0 (0.0%) | 0 (0.0%) |
| 65 to 74 Years | 0 (0.0%) | 0 (0.0%) |
| 75 Years and over | 0 (0.0%) | 0 (0.0%) |
Disability Class: Ambulatory Difficulty
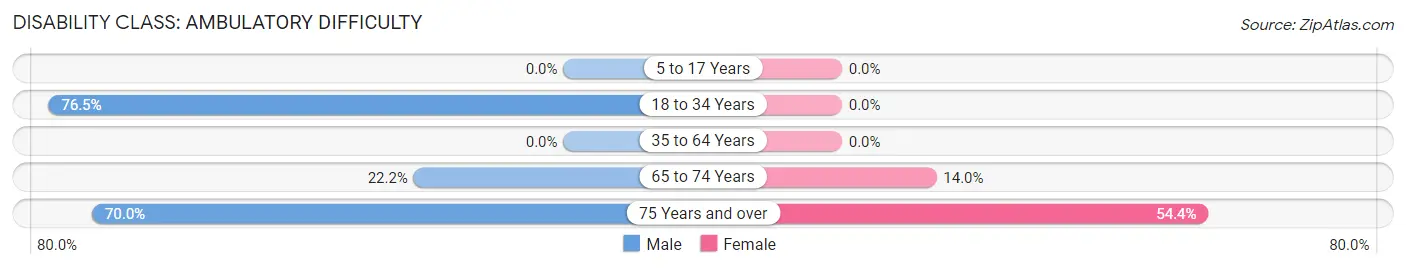
| Age Bracket | Male | Female |
| 5 to 17 Years | 0 (0.0%) | 0 (0.0%) |
| 18 to 34 Years | 13 (76.5%) | 0 (0.0%) |
| 35 to 64 Years | 0 (0.0%) | 0 (0.0%) |
| 65 to 74 Years | 6 (22.2%) | 8 (14.0%) |
| 75 Years and over | 14 (70.0%) | 43 (54.4%) |
Disability Class: Self-Care Difficulty
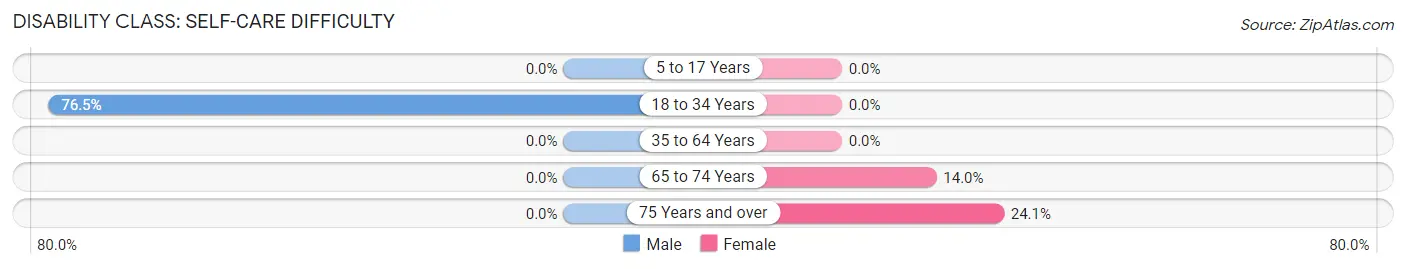
| Age Bracket | Male | Female |
| 5 to 17 Years | 0 (0.0%) | 0 (0.0%) |
| 18 to 34 Years | 13 (76.5%) | 0 (0.0%) |
| 35 to 64 Years | 0 (0.0%) | 0 (0.0%) |
| 65 to 74 Years | 0 (0.0%) | 8 (14.0%) |
| 75 Years and over | 0 (0.0%) | 19 (24.0%) |
Technology Access in Southwest Harbor
Computing Device Access in Southwest Harbor
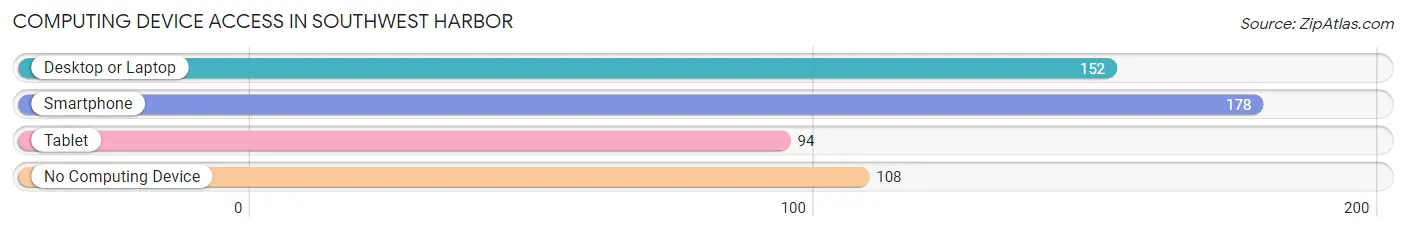
| Device Type | # Households | % Households |
| Desktop or Laptop | 152 | 49.7% |
| Smartphone | 178 | 58.2% |
| Tablet | 94 | 30.7% |
| No Computing Device | 108 | 35.3% |
| Total | 306 | 100.0% |
Internet Access in Southwest Harbor
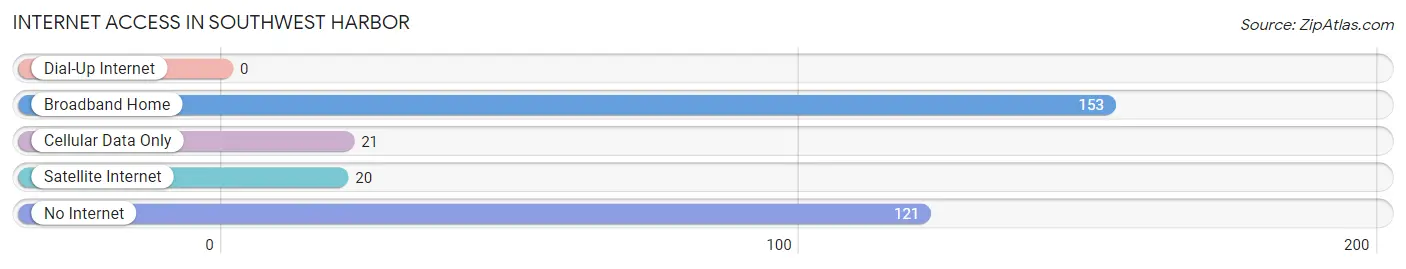
| Internet Type | # Households | % Households |
| Dial-Up Internet | 0 | 0.0% |
| Broadband Home | 153 | 50.0% |
| Cellular Data Only | 21 | 6.9% |
| Satellite Internet | 20 | 6.5% |
| No Internet | 121 | 39.5% |
| Total | 306 | 100.0% |
Southwest Harbor Summary
Southwest Harbor is a town located on the southwestern side of Mount Desert Island in Hancock County, Maine, United States. It is part of the Bar Harbor, Maine Micropolitan Statistical Area. The population was 1,764 at the 2010 census.
History
The area that is now Southwest Harbor was first settled in 1763 by a group of settlers from Massachusetts. The town was incorporated in 1883 and was named after the harbor located on the southwestern side of Mount Desert Island.
The town was a major fishing and shipbuilding center in the 19th century. The harbor was home to a number of schooners and other vessels, and the town was a major supplier of lumber and granite.
Geography
Southwest Harbor is located on the southwestern side of Mount Desert Island, which is the largest island off the coast of Maine. The town is bordered by the towns of Tremont to the north, Bar Harbor to the east, and Cranberry Isles to the south.
The town is situated on the western side of Somes Sound, a fjord-like body of water that separates Mount Desert Island from the mainland. The town is also home to several small islands, including Baker Island, Bear Island, and Long Island.
The town has a total area of 24.2 square miles, of which 21.2 square miles is land and 3.0 square miles is water.
Economy
The economy of Southwest Harbor is largely based on tourism. The town is home to several marinas, which attract visitors from all over the world. The town is also home to several restaurants, shops, and galleries.
The town is also home to several boatyards, which provide services such as boat repair and maintenance. The town is also home to several lobster fishing operations, which provide fresh seafood to local restaurants and markets.
Demographics
As of the 2010 census, there were 1,764 people, 817 households, and 486 families residing in the town. The population density was 83.2 people per square mile. There were 1,039 housing units at an average density of 48.9 per square mile.
The racial makeup of the town was 97.2% White, 0.3% African American, 0.3% Native American, 0.6% Asian, 0.1% Pacific Islander, 0.2% from other races, and 1.3% from two or more races. Hispanic or Latino of any race were 0.9% of the population.
There were 817 households, out of which 22.2% had children under the age of 18 living with them, 48.2% were married couples living together, 8.7% had a female householder with no husband present, and 39.2% were non-families. 33.2% of all households were made up of individuals, and 14.2% had someone living alone who was 65 years of age or older. The average household size was 2.17 and the average family size was 2.72.
In the town, the population was spread out, with 19.2% under the age of 18, 5.2% from 18 to 24, 22.2% from 25 to 44, 33.2% from 45 to 64, and 20.2% who were 65 years of age or older. The median age was 46 years. For every 100 females, there were 94.2 males. For every 100 females age 18 and over, there were 91.2 males.
The median income for a household in the town was $41,964, and the median income for a family was $50,000. Males had a median income of $35,000 versus $27,500 for females. The per capita income for the town was $25,945. About 6.2% of families and 9.2% of the population were below the poverty line, including 11.2% of those under age 18 and 8.2% of those age 65 or over.
Common Questions
What is Per Capita Income in Southwest Harbor?
Per Capita income in Southwest Harbor is $26,437.
What is the Median Family Income in Southwest Harbor?
Median Family Income in Southwest Harbor is $59,333.
What is the Median Household income in Southwest Harbor?
Median Household Income in Southwest Harbor is $30,625.
What is Income or Wage Gap in Southwest Harbor?
Income or Wage Gap in Southwest Harbor is 57.6%.
Women in Southwest Harbor earn 42.4 cents for every dollar earned by a man.
What is Inequality or Gini Index in Southwest Harbor?
Inequality or Gini Index in Southwest Harbor is 0.45.
What is the Total Population of Southwest Harbor?
Total Population of Southwest Harbor is 526.
What is the Total Male Population of Southwest Harbor?
Total Male Population of Southwest Harbor is 225.
What is the Total Female Population of Southwest Harbor?
Total Female Population of Southwest Harbor is 301.
What is the Ratio of Males per 100 Females in Southwest Harbor?
There are 74.75 Males per 100 Females in Southwest Harbor.
What is the Ratio of Females per 100 Males in Southwest Harbor?
There are 133.78 Females per 100 Males in Southwest Harbor.
What is the Median Population Age in Southwest Harbor?
Median Population Age in Southwest Harbor is 48.7 Years.
What is the Average Family Size in Southwest Harbor
Average Family Size in Southwest Harbor is 3.2 People.
What is the Average Household Size in Southwest Harbor
Average Household Size in Southwest Harbor is 1.7 People.
How Large is the Labor Force in Southwest Harbor?
There are 166 People in the Labor Forcein in Southwest Harbor.
What is the Percentage of People in the Labor Force in Southwest Harbor?
40.2% of People are in the Labor Force in Southwest Harbor.
What is the Unemployment Rate in Southwest Harbor?
Unemployment Rate in Southwest Harbor is 20.6%.