Rockland, ME Map & Demographics
Rockland Map
Rockland Overview
$30,507
PER CAPITA INCOME
$74,577
AVG FAMILY INCOME
$52,212
AVG HOUSEHOLD INCOME
35.3%
WAGE / INCOME GAP [ % ]
64.7¢/ $1
WAGE / INCOME GAP [ $ ]
$15,650
FAMILY INCOME DEFICIT
0.44
INEQUALITY / GINI INDEX
6,986
TOTAL POPULATION
3,142
MALE POPULATION
3,844
FEMALE POPULATION
81.74
MALES / 100 FEMALES
122.34
FEMALES / 100 MALES
45.3
MEDIAN AGE
2.8
AVG FAMILY SIZE
2.0
AVG HOUSEHOLD SIZE
3,633
LABOR FORCE [ PEOPLE ]
60.8%
PERCENT IN LABOR FORCE
6.5%
UNEMPLOYMENT RATE
Rockland Zip Codes
Rockland Area Codes
Income in Rockland
Income Overview in Rockland
Per Capita Income in Rockland is $30,507, while median incomes of families and households are $74,577 and $52,212 respectively.
| Characteristic | Number | Measure |
| Per Capita Income | 6,986 | $30,507 |
| Median Family Income | 1,502 | $74,577 |
| Mean Family Income | 1,502 | $87,104 |
| Median Household Income | 3,371 | $52,212 |
| Mean Household Income | 3,371 | $63,256 |
| Income Deficit | 1,502 | $15,650 |
| Wage / Income Gap (%) | 6,986 | 35.33% |
| Wage / Income Gap ($) | 6,986 | 64.67¢ per $1 |
| Gini / Inequality Index | 6,986 | 0.44 |
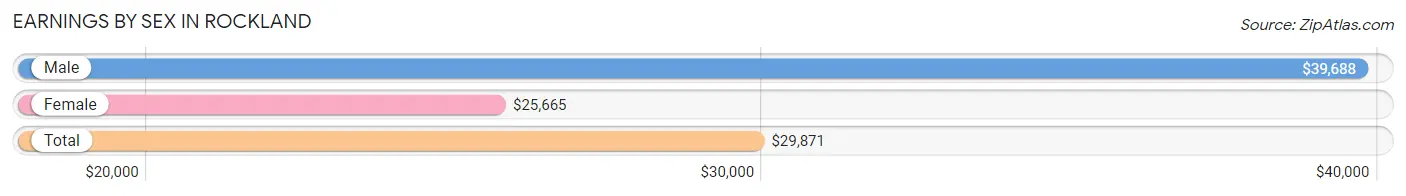
Earnings by Sex in Rockland
Average Earnings in Rockland are $29,871, $39,688 for men and $25,665 for women, a difference of 35.3%.
| Sex | Number | Average Earnings |
| Male | 1,813 (45.3%) | $39,688 |
| Female | 2,187 (54.7%) | $25,665 |
| Total | 4,000 (100.0%) | $29,871 |
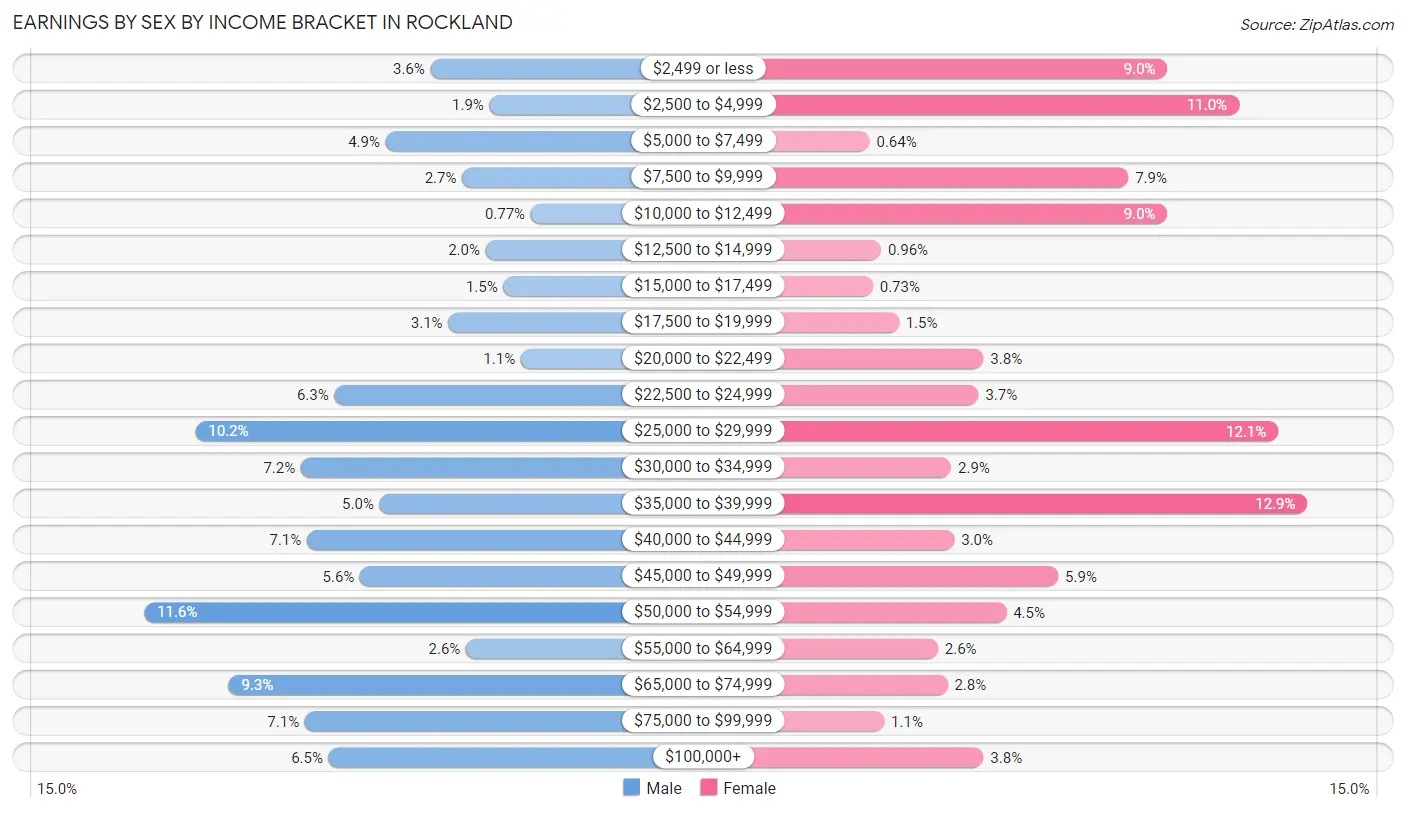
Earnings by Sex by Income Bracket in Rockland
The most common earnings brackets in Rockland are $50,000 to $54,999 for men (211 | 11.6%) and $35,000 to $39,999 for women (283 | 12.9%).
| Income | Male | Female |
| $2,499 or less | 65 (3.6%) | 197 (9.0%) |
| $2,500 to $4,999 | 35 (1.9%) | 241 (11.0%) |
| $5,000 to $7,499 | 88 (4.9%) | 14 (0.6%) |
| $7,500 to $9,999 | 49 (2.7%) | 173 (7.9%) |
| $10,000 to $12,499 | 14 (0.8%) | 197 (9.0%) |
| $12,500 to $14,999 | 37 (2.0%) | 21 (1.0%) |
| $15,000 to $17,499 | 28 (1.5%) | 16 (0.7%) |
| $17,500 to $19,999 | 56 (3.1%) | 32 (1.5%) |
| $20,000 to $22,499 | 19 (1.1%) | 84 (3.8%) |
| $22,500 to $24,999 | 114 (6.3%) | 81 (3.7%) |
| $25,000 to $29,999 | 185 (10.2%) | 265 (12.1%) |
| $30,000 to $34,999 | 131 (7.2%) | 64 (2.9%) |
| $35,000 to $39,999 | 91 (5.0%) | 283 (12.9%) |
| $40,000 to $44,999 | 128 (7.1%) | 66 (3.0%) |
| $45,000 to $49,999 | 101 (5.6%) | 130 (5.9%) |
| $50,000 to $54,999 | 211 (11.6%) | 98 (4.5%) |
| $55,000 to $64,999 | 47 (2.6%) | 56 (2.6%) |
| $65,000 to $74,999 | 168 (9.3%) | 62 (2.8%) |
| $75,000 to $99,999 | 129 (7.1%) | 23 (1.1%) |
| $100,000+ | 117 (6.5%) | 84 (3.8%) |
| Total | 1,813 (100.0%) | 2,187 (100.0%) |
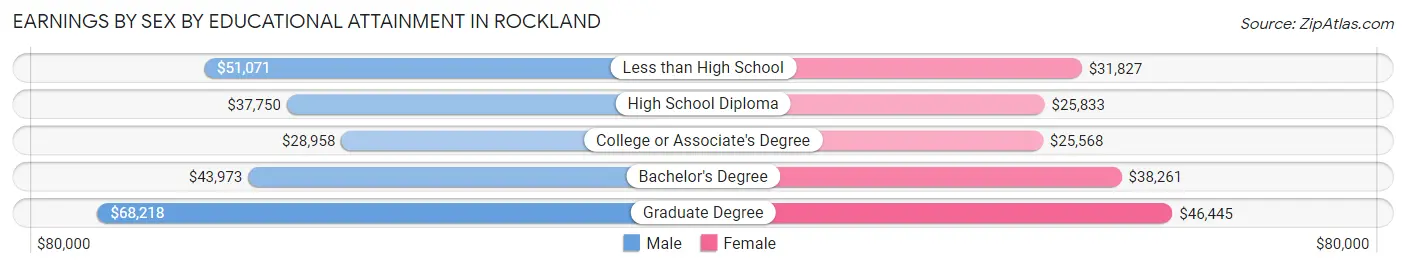
Earnings by Sex by Educational Attainment in Rockland
Average earnings in Rockland are $41,412 for men and $28,185 for women, a difference of 31.9%. Men with an educational attainment of graduate degree enjoy the highest average annual earnings of $68,218, while those with college or associate's degree education earn the least with $28,958. Women with an educational attainment of graduate degree earn the most with the average annual earnings of $46,445, while those with college or associate's degree education have the smallest earnings of $25,568.
| Educational Attainment | Male Income | Female Income |
| Less than High School | $51,071 | $31,827 |
| High School Diploma | $37,750 | $25,833 |
| College or Associate's Degree | $28,958 | $25,568 |
| Bachelor's Degree | $43,973 | $38,261 |
| Graduate Degree | $68,218 | $46,445 |
| Total | $41,412 | $28,185 |
Family Income in Rockland
Family Income Brackets in Rockland
According to the Rockland family income data, there are 315 families falling into the $50,000 to $74,999 income range, which is the most common income bracket and makes up 21.0% of all families. Conversely, the $10,000 to $14,999 income bracket is the least frequent group with only 17 families (1.1%) belonging to this category.
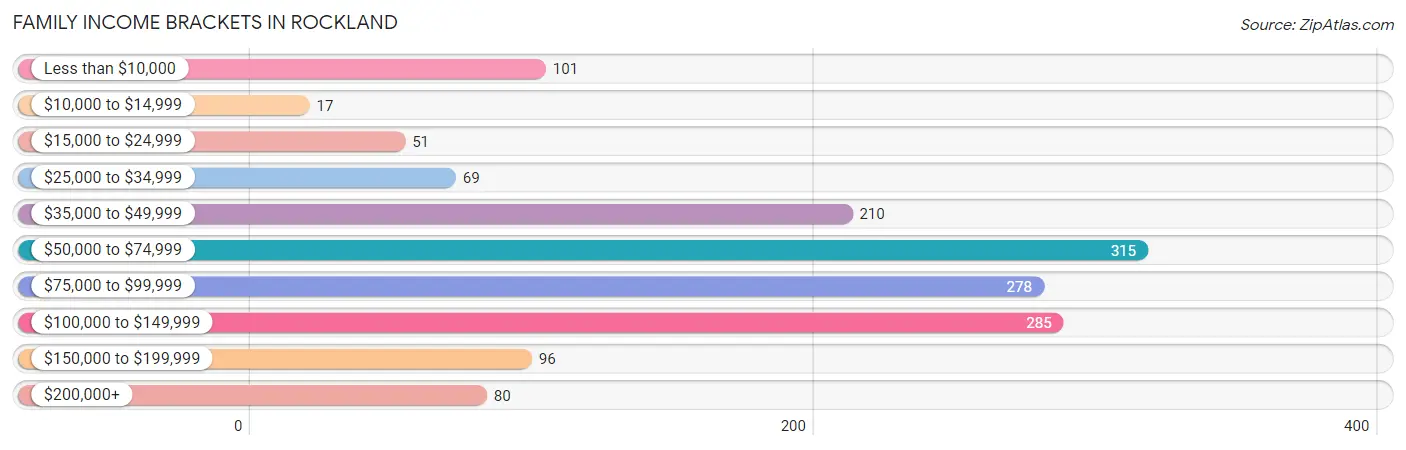
| Income Bracket | # Families | % Families |
| Less than $10,000 | 101 | 6.7% |
| $10,000 to $14,999 | 17 | 1.1% |
| $15,000 to $24,999 | 51 | 3.4% |
| $25,000 to $34,999 | 69 | 4.6% |
| $35,000 to $49,999 | 210 | 14.0% |
| $50,000 to $74,999 | 315 | 21.0% |
| $75,000 to $99,999 | 278 | 18.5% |
| $100,000 to $149,999 | 285 | 19.0% |
| $150,000 to $199,999 | 96 | 6.4% |
| $200,000+ | 80 | 5.3% |
Family Income by Famaliy Size in Rockland
4-person families (215 | 14.3%) account for the highest median family income in Rockland with $92,063 per family, while 2-person families (823 | 54.8%) have the highest median income of $40,712 per family member.
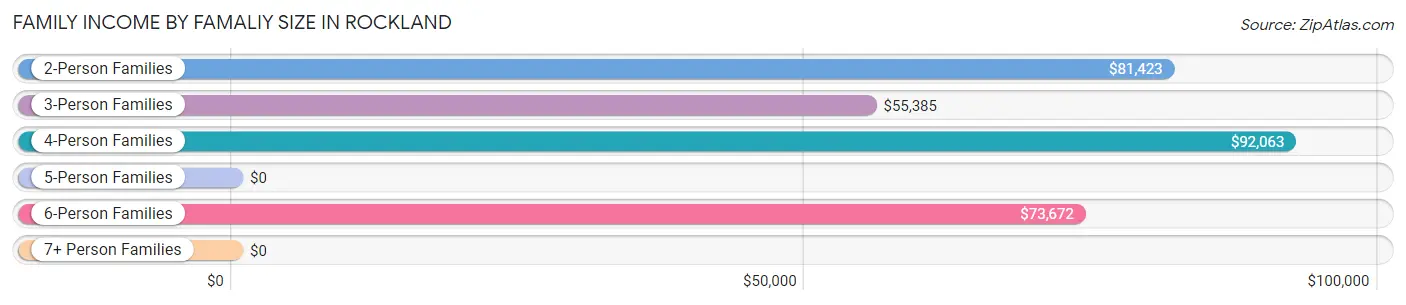
| Income Bracket | # Families | Median Income |
| 2-Person Families | 823 (54.8%) | $81,423 |
| 3-Person Families | 334 (22.2%) | $55,385 |
| 4-Person Families | 215 (14.3%) | $92,063 |
| 5-Person Families | 64 (4.3%) | $0 |
| 6-Person Families | 66 (4.4%) | $73,672 |
| 7+ Person Families | 0 (0.0%) | $0 |
| Total | 1,502 (100.0%) | $74,577 |
Family Income by Number of Earners in Rockland
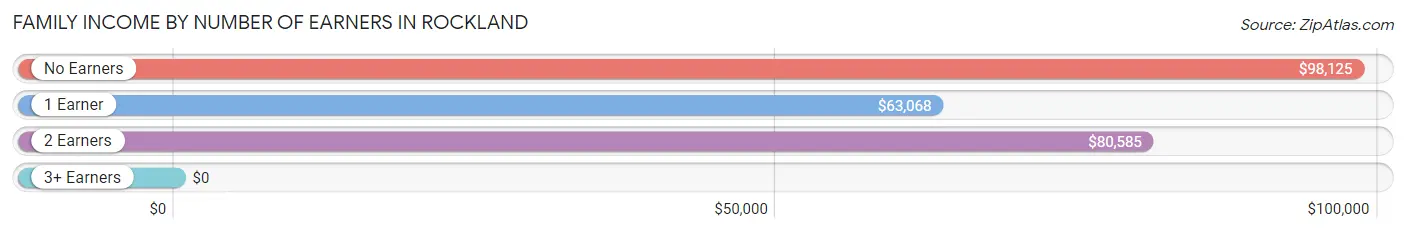
| Number of Earners | # Families | Median Income |
| No Earners | 195 (13.0%) | $98,125 |
| 1 Earner | 418 (27.8%) | $63,068 |
| 2 Earners | 828 (55.1%) | $80,585 |
| 3+ Earners | 61 (4.1%) | $0 |
| Total | 1,502 (100.0%) | $74,577 |
Household Income in Rockland
Household Income Brackets in Rockland
With 681 households falling in the category, the $50,000 to $74,999 income range is the most frequent in Rockland, accounting for 20.2% of all households. In contrast, only 78 households (2.3%) fall into the $200,000+ income bracket, making it the least populous group.
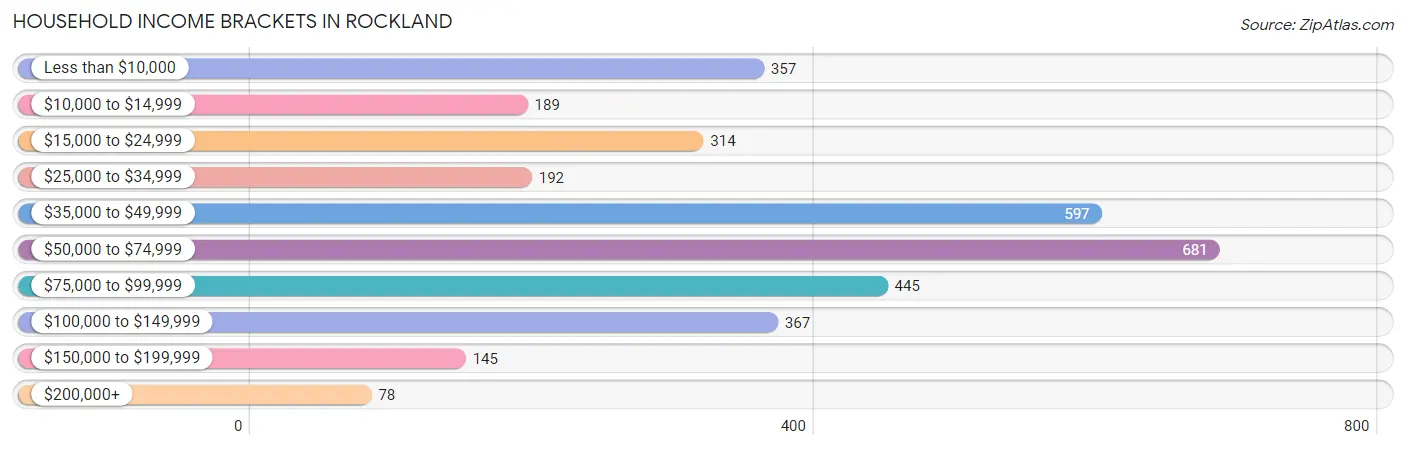
| Income Bracket | # Households | % Households |
| Less than $10,000 | 357 | 10.6% |
| $10,000 to $14,999 | 189 | 5.6% |
| $15,000 to $24,999 | 314 | 9.3% |
| $25,000 to $34,999 | 192 | 5.7% |
| $35,000 to $49,999 | 597 | 17.7% |
| $50,000 to $74,999 | 681 | 20.2% |
| $75,000 to $99,999 | 445 | 13.2% |
| $100,000 to $149,999 | 367 | 10.9% |
| $150,000 to $199,999 | 145 | 4.3% |
| $200,000+ | 78 | 2.3% |
Household Income by Householder Age in Rockland
The median household income in Rockland is $52,212, with the highest median household income of $55,481 found in the 45 to 64 years age bracket for the primary householder. A total of 1,171 households (34.7%) fall into this category. Meanwhile, the 25 to 44 years age bracket for the primary householder has the lowest median household income of $49,096, with 1,005 households (29.8%) in this group.
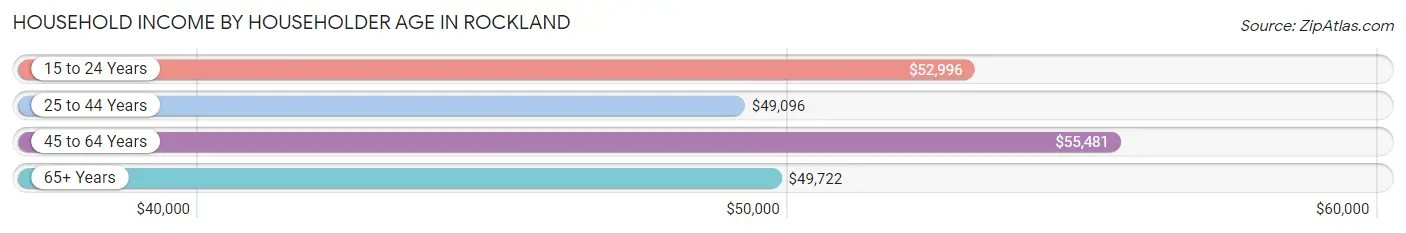
| Income Bracket | # Households | Median Income |
| 15 to 24 Years | 153 (4.5%) | $52,996 |
| 25 to 44 Years | 1,005 (29.8%) | $49,096 |
| 45 to 64 Years | 1,171 (34.7%) | $55,481 |
| 65+ Years | 1,042 (30.9%) | $49,722 |
| Total | 3,371 (100.0%) | $52,212 |
Poverty in Rockland
Income Below Poverty by Sex and Age in Rockland
With 12.7% poverty level for males and 18.9% for females among the residents of Rockland, 16 and 17 year old males and 6 to 11 year old females are the most vulnerable to poverty, with 21 males (44.7%) and 120 females (72.3%) in their respective age groups living below the poverty level.
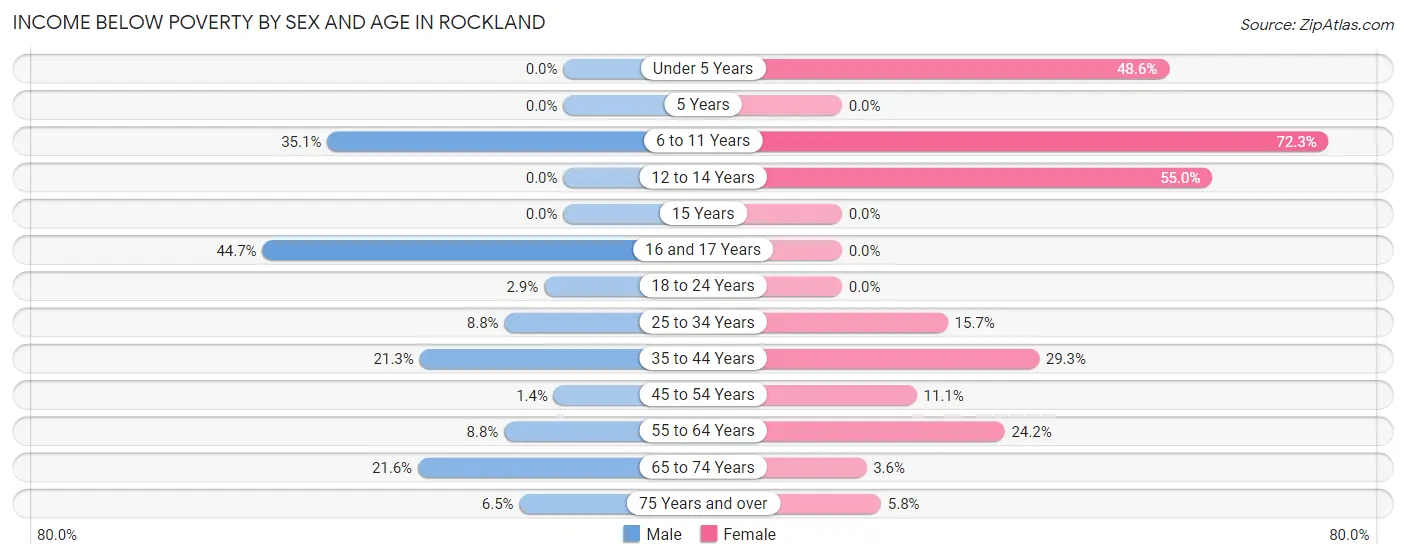
| Age Bracket | Male | Female |
| Under 5 Years | 0 (0.0%) | 35 (48.6%) |
| 5 Years | 0 (0.0%) | 0 (0.0%) |
| 6 to 11 Years | 81 (35.1%) | 120 (72.3%) |
| 12 to 14 Years | 0 (0.0%) | 88 (55.0%) |
| 15 Years | 0 (0.0%) | 0 (0.0%) |
| 16 and 17 Years | 21 (44.7%) | 0 (0.0%) |
| 18 to 24 Years | 7 (2.9%) | 0 (0.0%) |
| 25 to 34 Years | 40 (8.7%) | 97 (15.7%) |
| 35 to 44 Years | 51 (21.3%) | 124 (29.2%) |
| 45 to 54 Years | 3 (1.4%) | 39 (11.1%) |
| 55 to 64 Years | 53 (8.8%) | 166 (24.2%) |
| 65 to 74 Years | 106 (21.6%) | 16 (3.6%) |
| 75 Years and over | 15 (6.5%) | 20 (5.8%) |
| Total | 377 (12.7%) | 705 (18.9%) |
Income Above Poverty by Sex and Age in Rockland
According to the poverty statistics in Rockland, males aged under 5 years and females aged 5 years are the age groups that are most secure financially, with 100.0% of males and 100.0% of females in these age groups living above the poverty line.
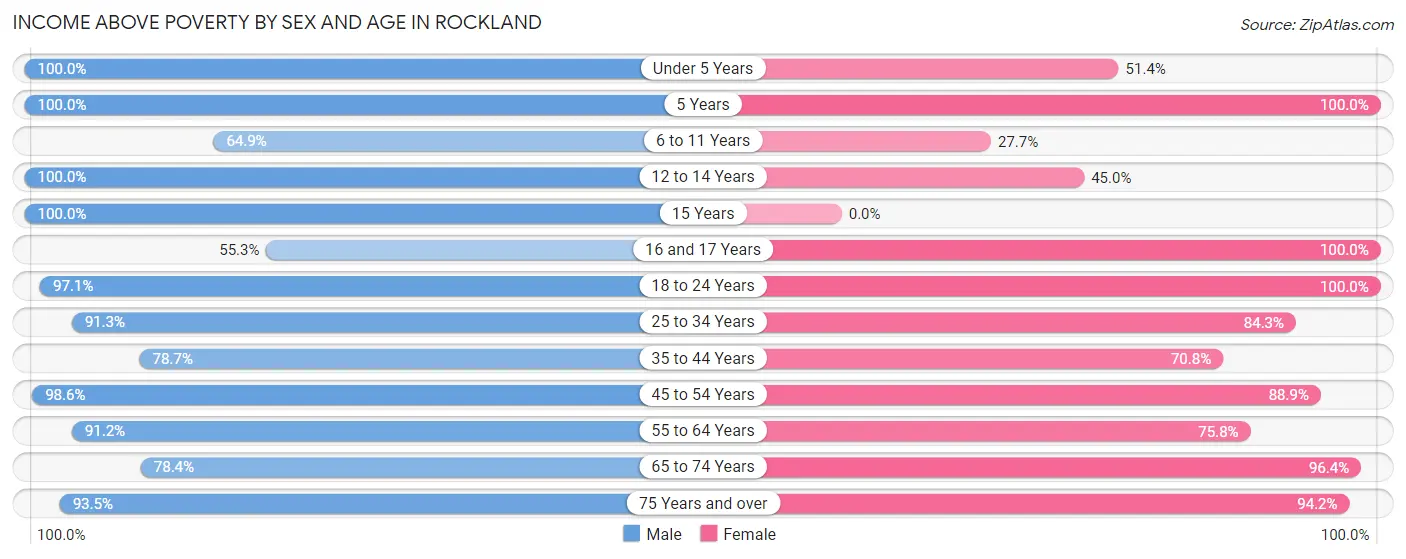
| Age Bracket | Male | Female |
| Under 5 Years | 98 (100.0%) | 37 (51.4%) |
| 5 Years | 46 (100.0%) | 85 (100.0%) |
| 6 to 11 Years | 150 (64.9%) | 46 (27.7%) |
| 12 to 14 Years | 38 (100.0%) | 72 (45.0%) |
| 15 Years | 26 (100.0%) | 0 (0.0%) |
| 16 and 17 Years | 26 (55.3%) | 123 (100.0%) |
| 18 to 24 Years | 237 (97.1%) | 252 (100.0%) |
| 25 to 34 Years | 417 (91.2%) | 520 (84.3%) |
| 35 to 44 Years | 188 (78.7%) | 300 (70.8%) |
| 45 to 54 Years | 208 (98.6%) | 312 (88.9%) |
| 55 to 64 Years | 550 (91.2%) | 521 (75.8%) |
| 65 to 74 Years | 385 (78.4%) | 425 (96.4%) |
| 75 Years and over | 215 (93.5%) | 325 (94.2%) |
| Total | 2,584 (87.3%) | 3,018 (81.1%) |
Income Below Poverty Among Married-Couple Families in Rockland
The poverty statistics for married-couple families in Rockland show that 4.1% or 48 of the total 1,166 families live below the poverty line. Families with no children have the highest poverty rate of 5.3%, comprising of 48 families. On the other hand, families with 1 or 2 children have the lowest poverty rate of 0.0%, which includes 0 families.
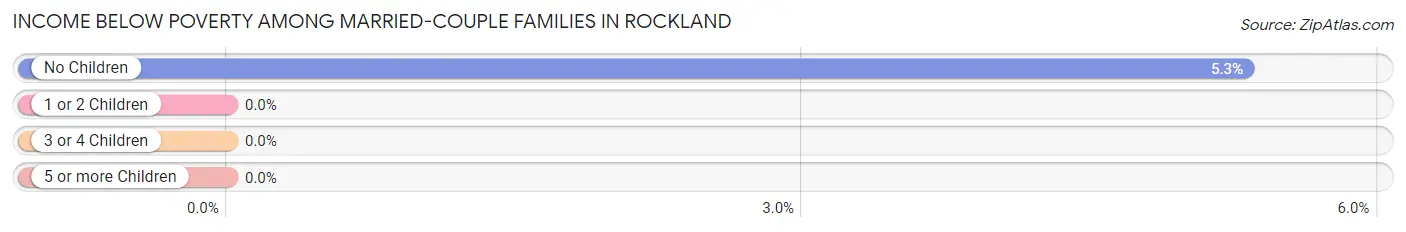
| Children | Above Poverty | Below Poverty |
| No Children | 856 (94.7%) | 48 (5.3%) |
| 1 or 2 Children | 214 (100.0%) | 0 (0.0%) |
| 3 or 4 Children | 48 (100.0%) | 0 (0.0%) |
| 5 or more Children | 0 (0.0%) | 0 (0.0%) |
| Total | 1,118 (95.9%) | 48 (4.1%) |
Income Below Poverty Among Single-Parent Households in Rockland
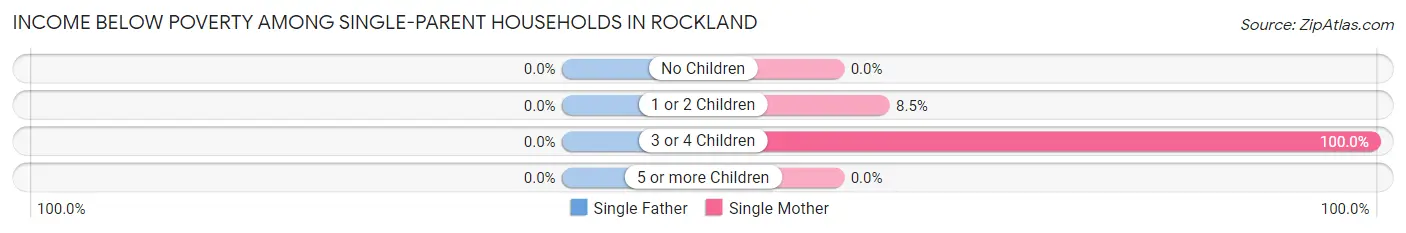
| Children | Single Father | Single Mother |
| No Children | 0 (0.0%) | 0 (0.0%) |
| 1 or 2 Children | 0 (0.0%) | 11 (8.5%) |
| 3 or 4 Children | 0 (0.0%) | 84 (100.0%) |
| 5 or more Children | 0 (0.0%) | 0 (0.0%) |
| Total | 0 (0.0%) | 95 (40.8%) |
Income Below Poverty Among Married-Couple vs Single-Parent Households in Rockland
The poverty data for Rockland shows that 48 of the married-couple family households (4.1%) and 95 of the single-parent households (28.3%) are living below the poverty level. Within the married-couple family households, those with no children have the highest poverty rate, with 48 households (5.3%) falling below the poverty line. Among the single-parent households, those with 3 or 4 children have the highest poverty rate, with 84 household (100.0%) living below poverty.
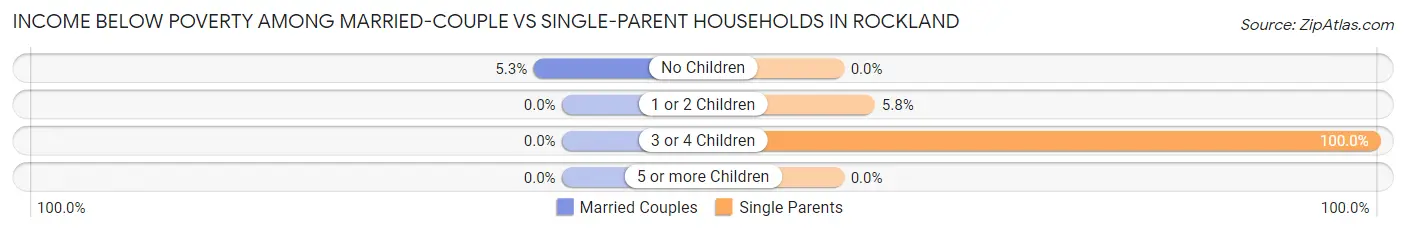
| Children | Married-Couple Families | Single-Parent Households |
| No Children | 48 (5.3%) | 0 (0.0%) |
| 1 or 2 Children | 0 (0.0%) | 11 (5.8%) |
| 3 or 4 Children | 0 (0.0%) | 84 (100.0%) |
| 5 or more Children | 0 (0.0%) | 0 (0.0%) |
| Total | 48 (4.1%) | 95 (28.3%) |
Race in Rockland
The most populous races in Rockland are White / Caucasian (6,741 | 96.5%), Two or more Races (186 | 2.7%), and Asian (51 | 0.7%).
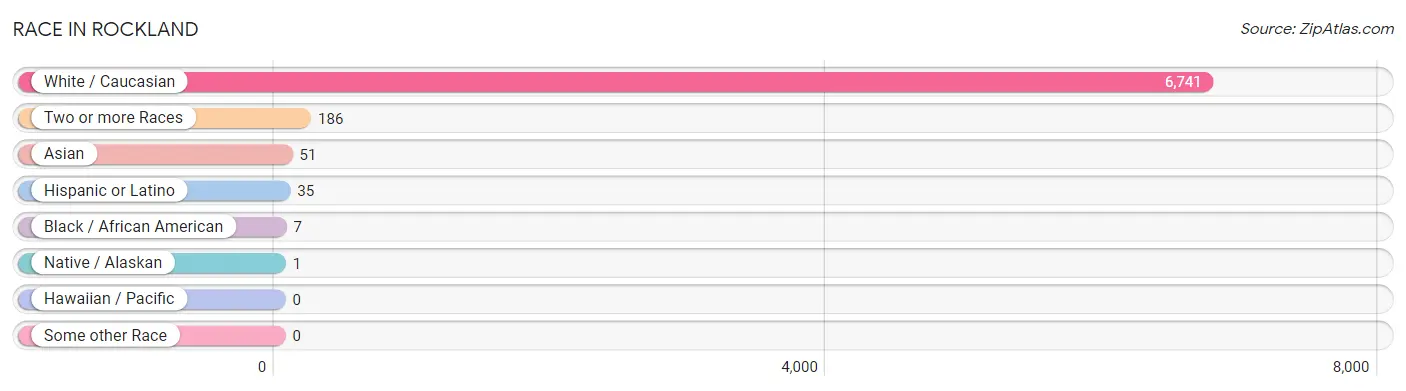
| Race | # Population | % Population |
| Asian | 51 | 0.7% |
| Black / African American | 7 | 0.1% |
| Hawaiian / Pacific | 0 | 0.0% |
| Hispanic or Latino | 35 | 0.5% |
| Native / Alaskan | 1 | 0.0% |
| White / Caucasian | 6,741 | 96.5% |
| Two or more Races | 186 | 2.7% |
| Some other Race | 0 | 0.0% |
| Total | 6,986 | 100.0% |
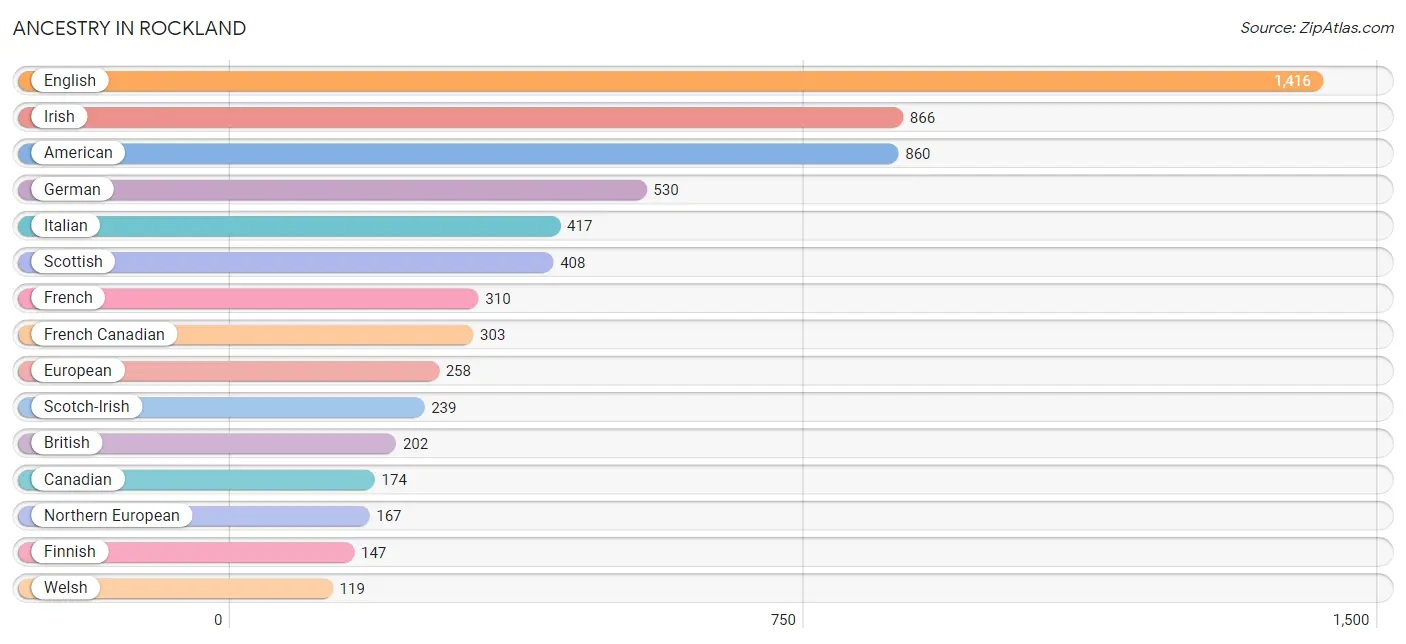
Ancestry in Rockland
The most populous ancestries reported in Rockland are English (1,416 | 20.3%), Irish (866 | 12.4%), American (860 | 12.3%), German (530 | 7.6%), and Italian (417 | 6.0%), together accounting for 58.5% of all Rockland residents.
| Ancestry | # Population | % Population |
| African | 7 | 0.1% |
| American | 860 | 12.3% |
| Arab | 17 | 0.2% |
| Austrian | 10 | 0.1% |
| Bhutanese | 63 | 0.9% |
| British | 202 | 2.9% |
| Canadian | 174 | 2.5% |
| Central American | 1 | 0.0% |
| Central American Indian | 1 | 0.0% |
| Costa Rican | 1 | 0.0% |
| Cuban | 17 | 0.2% |
| Czech | 29 | 0.4% |
| Dutch | 103 | 1.5% |
| Eastern European | 56 | 0.8% |
| Egyptian | 1 | 0.0% |
| English | 1,416 | 20.3% |
| European | 258 | 3.7% |
| Finnish | 147 | 2.1% |
| French | 310 | 4.4% |
| French Canadian | 303 | 4.3% |
| German | 530 | 7.6% |
| Greek | 65 | 0.9% |
| Hungarian | 24 | 0.3% |
| Iranian | 15 | 0.2% |
| Irish | 866 | 12.4% |
| Italian | 417 | 6.0% |
| Korean | 5 | 0.1% |
| Mexican | 14 | 0.2% |
| Mexican American Indian | 1 | 0.0% |
| Northern European | 167 | 2.4% |
| Norwegian | 70 | 1.0% |
| Polish | 98 | 1.4% |
| Portuguese | 17 | 0.2% |
| Romanian | 43 | 0.6% |
| Russian | 103 | 1.5% |
| Scandinavian | 12 | 0.2% |
| Scotch-Irish | 239 | 3.4% |
| Scottish | 408 | 5.8% |
| Slavic | 5 | 0.1% |
| Subsaharan African | 7 | 0.1% |
| Swedish | 59 | 0.8% |
| Swiss | 11 | 0.2% |
| Ukrainian | 39 | 0.6% |
| Welsh | 119 | 1.7% | View All 44 Rows |
Immigrants in Rockland
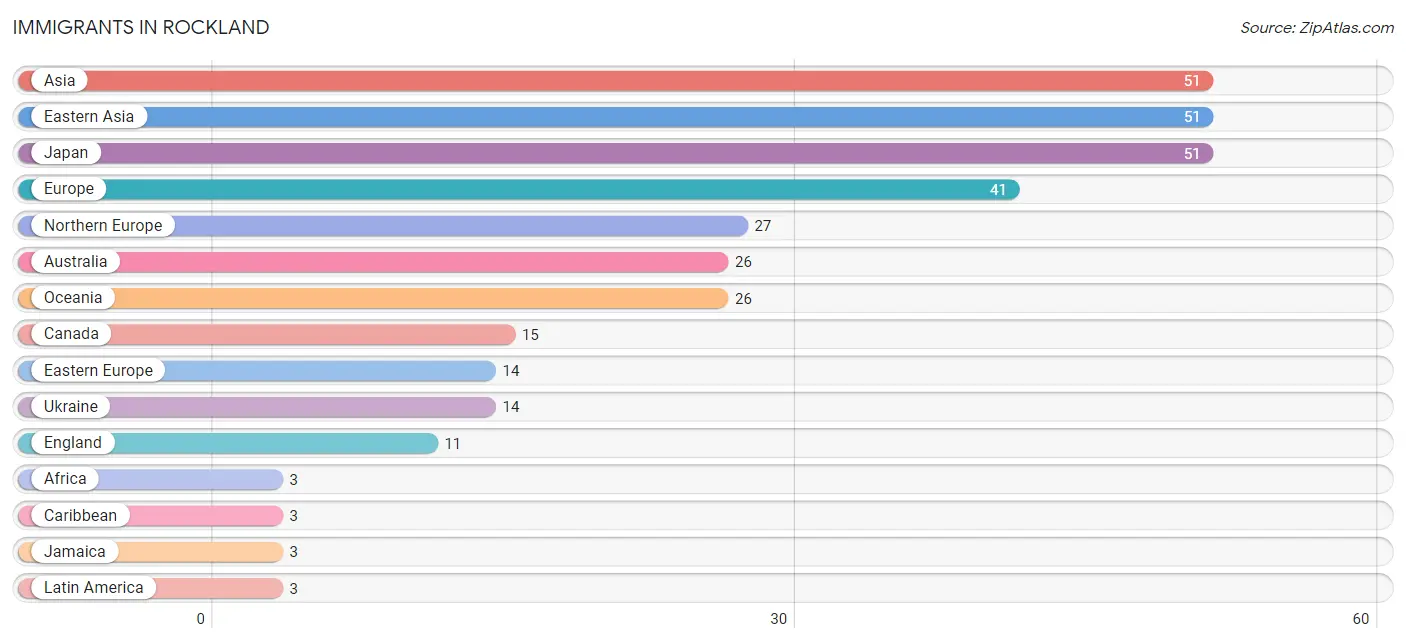
The most numerous immigrant groups reported in Rockland came from Asia (51 | 0.7%), Eastern Asia (51 | 0.7%), Japan (51 | 0.7%), Europe (41 | 0.6%), and Northern Europe (27 | 0.4%), together accounting for 3.2% of all Rockland residents.
| Immigration Origin | # Population | % Population |
| Africa | 3 | 0.0% |
| Asia | 51 | 0.7% |
| Australia | 26 | 0.4% |
| Canada | 15 | 0.2% |
| Caribbean | 3 | 0.0% |
| Eastern Asia | 51 | 0.7% |
| Eastern Europe | 14 | 0.2% |
| England | 11 | 0.2% |
| Europe | 41 | 0.6% |
| Jamaica | 3 | 0.0% |
| Japan | 51 | 0.7% |
| Latin America | 3 | 0.0% |
| Northern Europe | 27 | 0.4% |
| Oceania | 26 | 0.4% |
| Ukraine | 14 | 0.2% | View All 15 Rows |
Sex and Age in Rockland
Sex and Age in Rockland
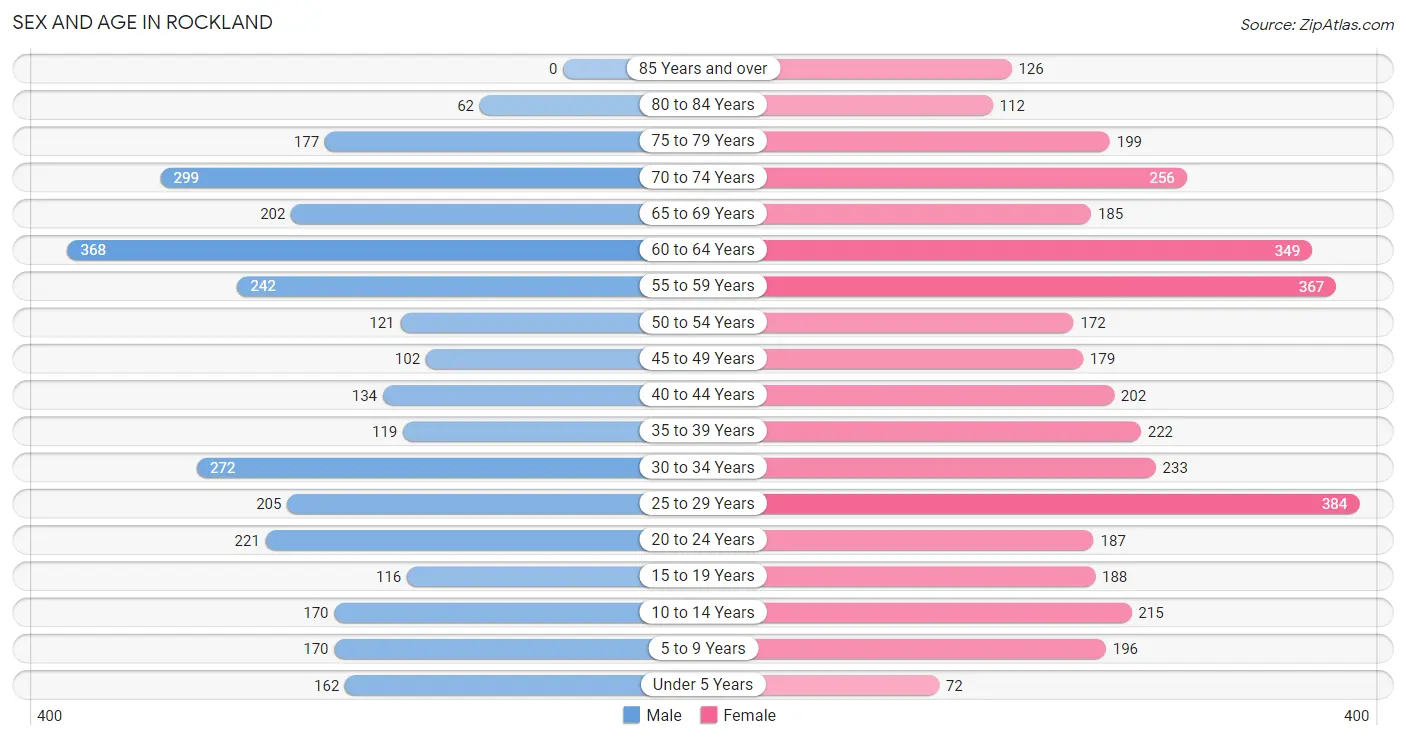
The most populous age groups in Rockland are 60 to 64 Years (368 | 11.7%) for men and 25 to 29 Years (384 | 10.0%) for women.
| Age Bracket | Male | Female |
| Under 5 Years | 162 (5.2%) | 72 (1.9%) |
| 5 to 9 Years | 170 (5.4%) | 196 (5.1%) |
| 10 to 14 Years | 170 (5.4%) | 215 (5.6%) |
| 15 to 19 Years | 116 (3.7%) | 188 (4.9%) |
| 20 to 24 Years | 221 (7.0%) | 187 (4.9%) |
| 25 to 29 Years | 205 (6.5%) | 384 (10.0%) |
| 30 to 34 Years | 272 (8.7%) | 233 (6.1%) |
| 35 to 39 Years | 119 (3.8%) | 222 (5.8%) |
| 40 to 44 Years | 134 (4.3%) | 202 (5.2%) |
| 45 to 49 Years | 102 (3.3%) | 179 (4.7%) |
| 50 to 54 Years | 121 (3.8%) | 172 (4.5%) |
| 55 to 59 Years | 242 (7.7%) | 367 (9.6%) |
| 60 to 64 Years | 368 (11.7%) | 349 (9.1%) |
| 65 to 69 Years | 202 (6.4%) | 185 (4.8%) |
| 70 to 74 Years | 299 (9.5%) | 256 (6.7%) |
| 75 to 79 Years | 177 (5.6%) | 199 (5.2%) |
| 80 to 84 Years | 62 (2.0%) | 112 (2.9%) |
| 85 Years and over | 0 (0.0%) | 126 (3.3%) |
| Total | 3,142 (100.0%) | 3,844 (100.0%) |
Families and Households in Rockland
Median Family Size in Rockland
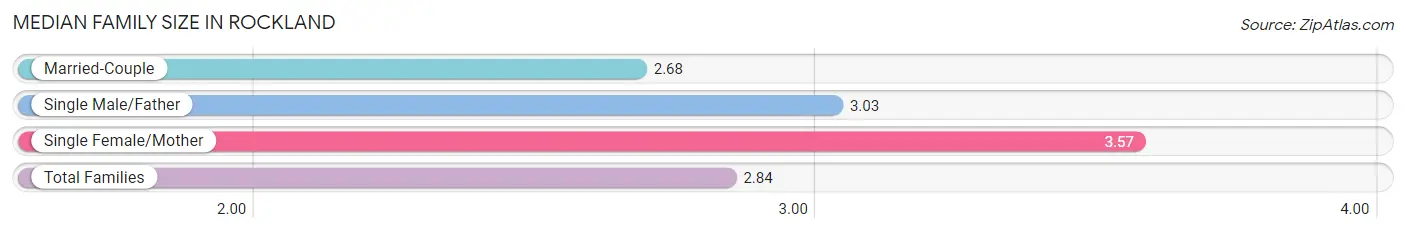
The median family size in Rockland is 2.84 persons per family, with single female/mother families (233 | 15.5%) accounting for the largest median family size of 3.57 persons per family. On the other hand, married-couple families (1,166 | 77.6%) represent the smallest median family size with 2.68 persons per family.
| Family Type | # Families | Family Size |
| Married-Couple | 1,166 (77.6%) | 2.68 |
| Single Male/Father | 103 (6.9%) | 3.03 |
| Single Female/Mother | 233 (15.5%) | 3.57 |
| Total Families | 1,502 (100.0%) | 2.84 |
Median Household Size in Rockland
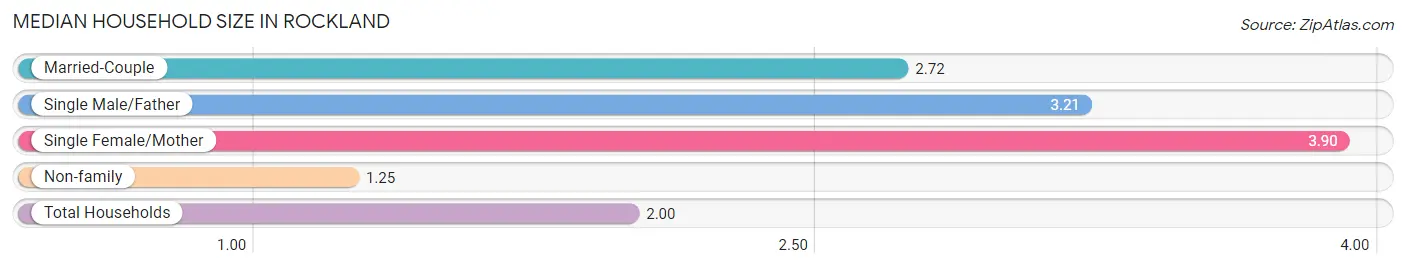
The median household size in Rockland is 2.00 persons per household, with single female/mother households (233 | 6.9%) accounting for the largest median household size of 3.9 persons per household. non-family households (1,869 | 55.4%) represent the smallest median household size with 1.25 persons per household.
| Household Type | # Households | Household Size |
| Married-Couple | 1,166 (34.6%) | 2.72 |
| Single Male/Father | 103 (3.1%) | 3.21 |
| Single Female/Mother | 233 (6.9%) | 3.90 |
| Non-family | 1,869 (55.4%) | 1.25 |
| Total Households | 3,371 (100.0%) | 2.00 |
Household Size by Marriage Status in Rockland
Out of a total of 3,371 households in Rockland, 1,502 (44.6%) are family households, while 1,869 (55.4%) are nonfamily households. The most numerous type of family households are 2-person households, comprising 797, and the most common type of nonfamily households are 1-person households, comprising 1,467.
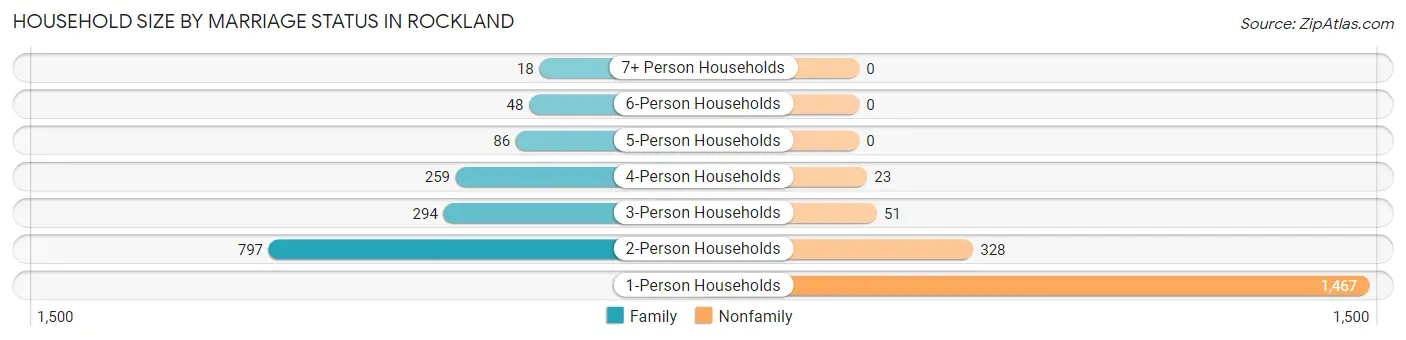
| Household Size | Family Households | Nonfamily Households |
| 1-Person Households | - | 1,467 (43.5%) |
| 2-Person Households | 797 (23.6%) | 328 (9.7%) |
| 3-Person Households | 294 (8.7%) | 51 (1.5%) |
| 4-Person Households | 259 (7.7%) | 23 (0.7%) |
| 5-Person Households | 86 (2.5%) | 0 (0.0%) |
| 6-Person Households | 48 (1.4%) | 0 (0.0%) |
| 7+ Person Households | 18 (0.5%) | 0 (0.0%) |
| Total | 1,502 (44.6%) | 1,869 (55.4%) |
Female Fertility in Rockland
Fertility by Age in Rockland
Average fertility rate in Rockland is 27.0 births per 1,000 women. Women in the age bracket of 20 to 34 years have the highest fertility rate with 55.0 births per 1,000 women. Women in the age bracket of 20 to 34 years acount for 100.0% of all women with births.
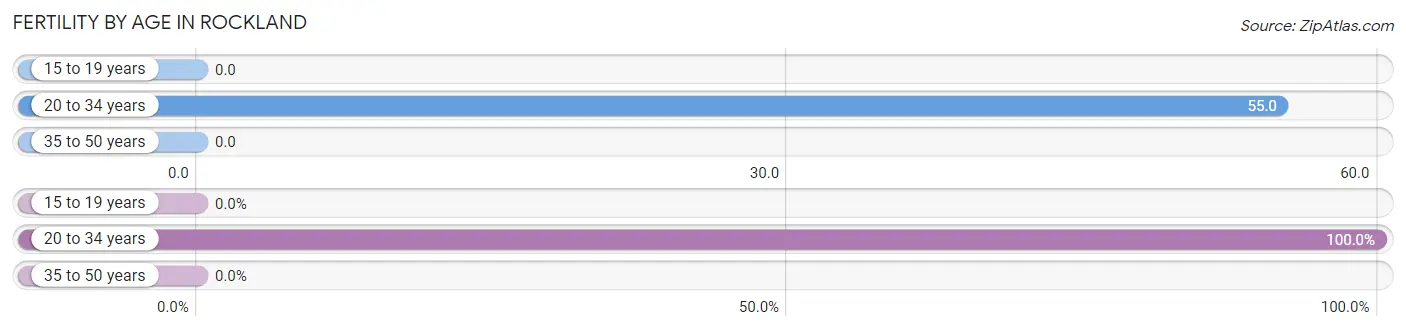
| Age Bracket | Women with Births | Births / 1,000 Women |
| 15 to 19 years | 0 (0.0%) | 0.0 |
| 20 to 34 years | 44 (100.0%) | 55.0 |
| 35 to 50 years | 0 (0.0%) | 0.0 |
| Total | 44 (100.0%) | 27.0 |
Fertility by Age by Marriage Status in Rockland
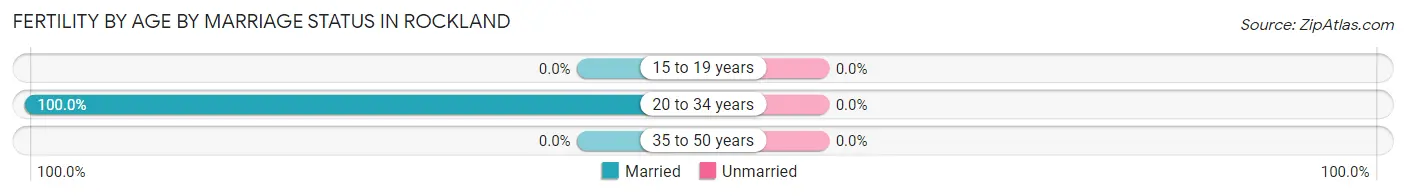
| Age Bracket | Married | Unmarried |
| 15 to 19 years | 0 (0.0%) | 0 (0.0%) |
| 20 to 34 years | 44 (100.0%) | 0 (0.0%) |
| 35 to 50 years | 0 (0.0%) | 0 (0.0%) |
| Total | 44 (100.0%) | 0 (0.0%) |
Fertility by Education in Rockland
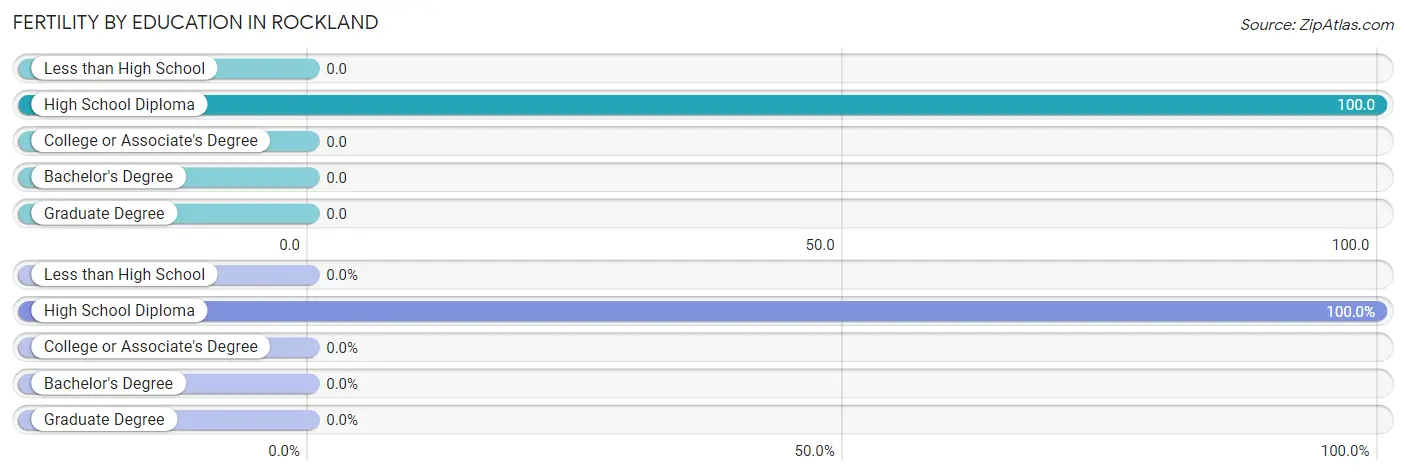
| Educational Attainment | Women with Births | Births / 1,000 Women |
| Less than High School | 0 (0.0%) | 0.0 |
| High School Diploma | 44 (100.0%) | 100.0 |
| College or Associate's Degree | 0 (0.0%) | 0.0 |
| Bachelor's Degree | 0 (0.0%) | 0.0 |
| Graduate Degree | 0 (0.0%) | 0.0 |
| Total | 44 (100.0%) | 27.0 |
Fertility by Education by Marriage Status in Rockland
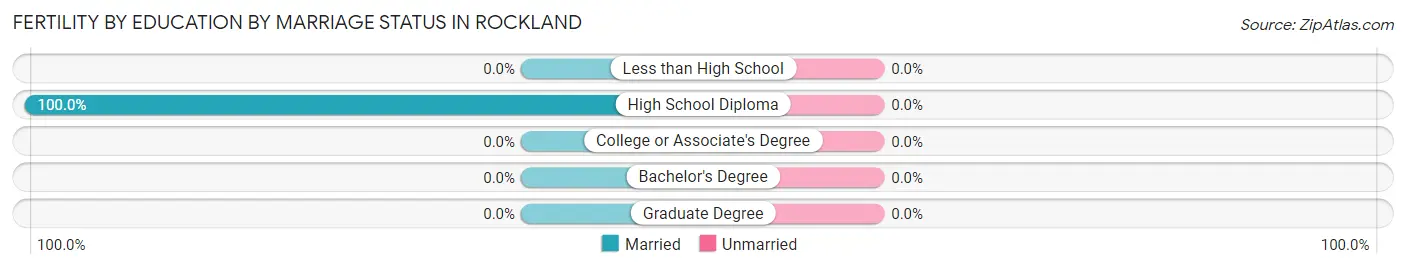
| Educational Attainment | Married | Unmarried |
| Less than High School | 0 (0.0%) | 0 (0.0%) |
| High School Diploma | 44 (100.0%) | 0 (0.0%) |
| College or Associate's Degree | 0 (0.0%) | 0 (0.0%) |
| Bachelor's Degree | 0 (0.0%) | 0 (0.0%) |
| Graduate Degree | 0 (0.0%) | 0 (0.0%) |
| Total | 44 (100.0%) | 0 (0.0%) |
Employment Characteristics in Rockland
Employment by Class of Employer in Rockland
Among the 3,297 employed individuals in Rockland, private company employees (1,850 | 56.1%), not-for-profit organizations (517 | 15.7%), and self-employed (not incorporated) (427 | 13.0%) make up the most common classes of employment.
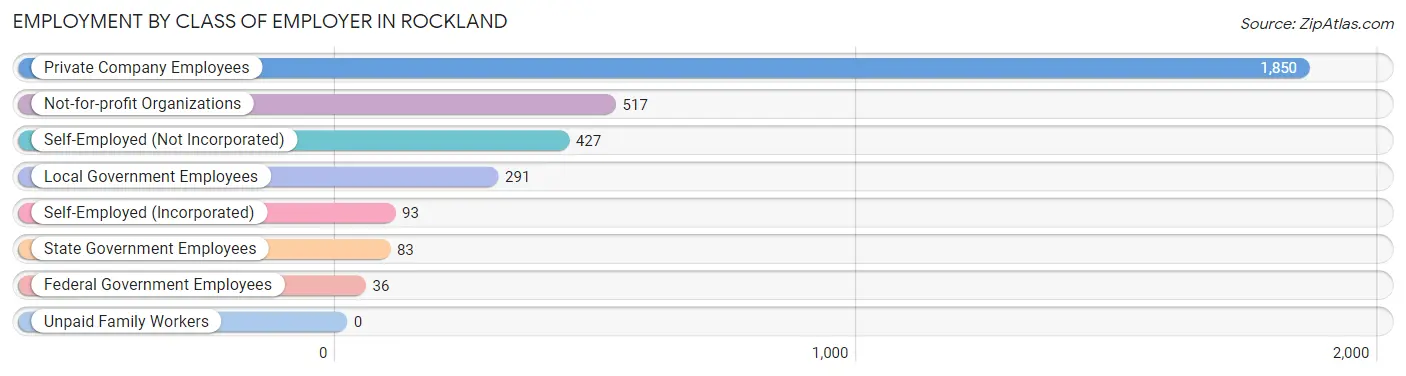
| Employer Class | # Employees | % Employees |
| Private Company Employees | 1,850 | 56.1% |
| Self-Employed (Incorporated) | 93 | 2.8% |
| Self-Employed (Not Incorporated) | 427 | 13.0% |
| Not-for-profit Organizations | 517 | 15.7% |
| Local Government Employees | 291 | 8.8% |
| State Government Employees | 83 | 2.5% |
| Federal Government Employees | 36 | 1.1% |
| Unpaid Family Workers | 0 | 0.0% |
| Total | 3,297 | 100.0% |
Employment Status by Age in Rockland
According to the labor force statistics for Rockland, out of the total population over 16 years of age (5,975), 60.8% or 3,633 individuals are in the labor force, with 6.5% or 236 of them unemployed. The age group with the highest labor force participation rate is 20 to 24 years, with 90.7% or 370 individuals in the labor force. Within the labor force, the 16 to 19 years age range has the highest percentage of unemployed individuals, with 32.1% or 27 of them being unemployed.
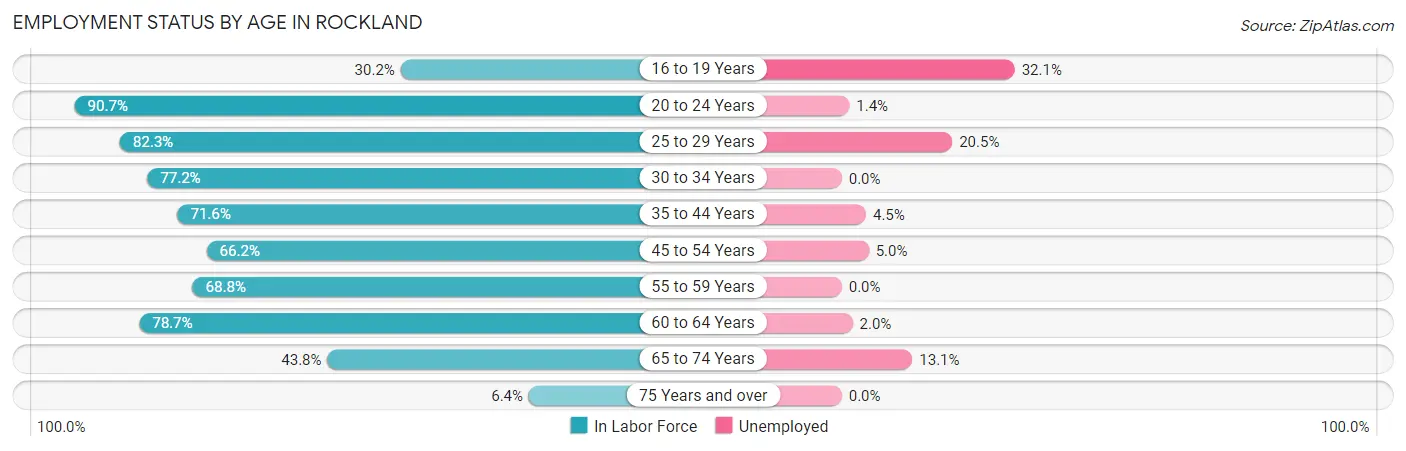
| Age Bracket | In Labor Force | Unemployed |
| 16 to 19 Years | 84 (30.2%) | 27 (32.1%) |
| 20 to 24 Years | 370 (90.7%) | 5 (1.4%) |
| 25 to 29 Years | 485 (82.3%) | 99 (20.5%) |
| 30 to 34 Years | 390 (77.2%) | 0 (0.0%) |
| 35 to 44 Years | 485 (71.6%) | 22 (4.5%) |
| 45 to 54 Years | 380 (66.2%) | 19 (5.0%) |
| 55 to 59 Years | 419 (68.8%) | 0 (0.0%) |
| 60 to 64 Years | 564 (78.7%) | 11 (2.0%) |
| 65 to 74 Years | 413 (43.8%) | 54 (13.1%) |
| 75 Years and over | 43 (6.4%) | 0 (0.0%) |
| Total | 3,633 (60.8%) | 236 (6.5%) |
Employment Status by Educational Attainment in Rockland
According to labor force statistics for Rockland, 74.2% of individuals (2,724) out of the total population between 25 and 64 years of age (3,671) are in the labor force, with 5.6% or 153 of them being unemployed. The group with the highest labor force participation rate are those with the educational attainment of bachelor's degree or higher, with 93.1% or 1,249 individuals in the labor force. Within the labor force, individuals with less than high school education have the highest percentage of unemployment, with 18.0% or 22 of them being unemployed.
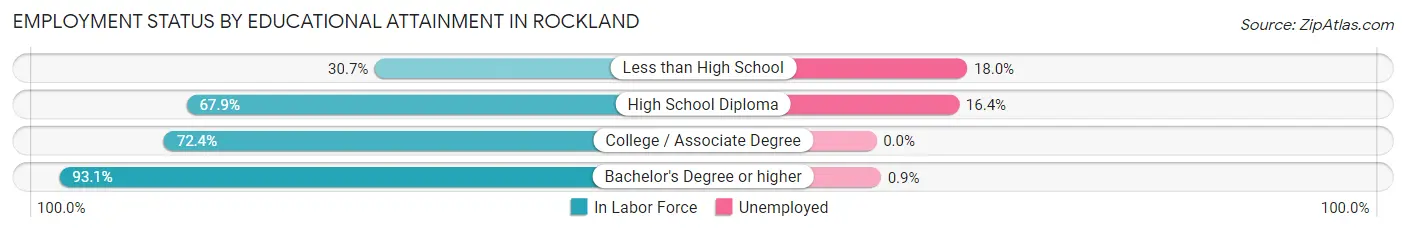
| Educational Attainment | In Labor Force | Unemployed |
| Less than High School | 122 (30.7%) | 71 (18.0%) |
| High School Diploma | 724 (67.9%) | 175 (16.4%) |
| College / Associate Degree | 626 (72.4%) | 0 (0.0%) |
| Bachelor's Degree or higher | 1,249 (93.1%) | 12 (0.9%) |
| Total | 2,724 (74.2%) | 206 (5.6%) |
Employment Occupations by Sex in Rockland
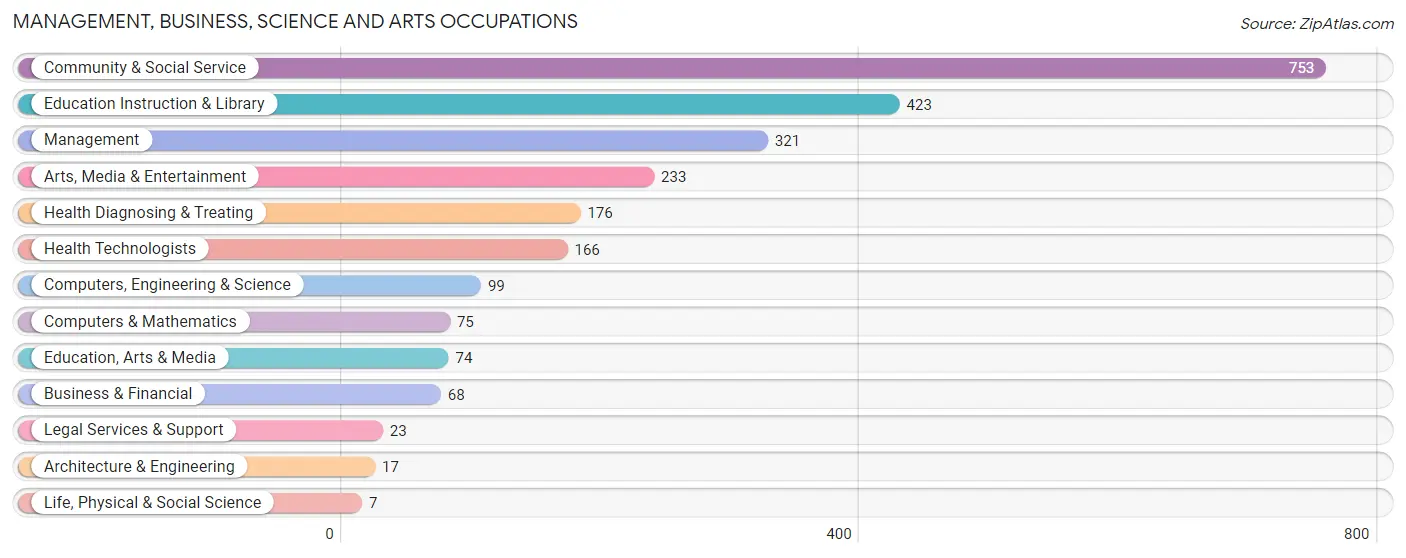
Management, Business, Science and Arts Occupations
The most common Management, Business, Science and Arts occupations in Rockland are Community & Social Service (753 | 22.3%), Education Instruction & Library (423 | 12.5%), Management (321 | 9.5%), Arts, Media & Entertainment (233 | 6.9%), and Health Diagnosing & Treating (176 | 5.2%).
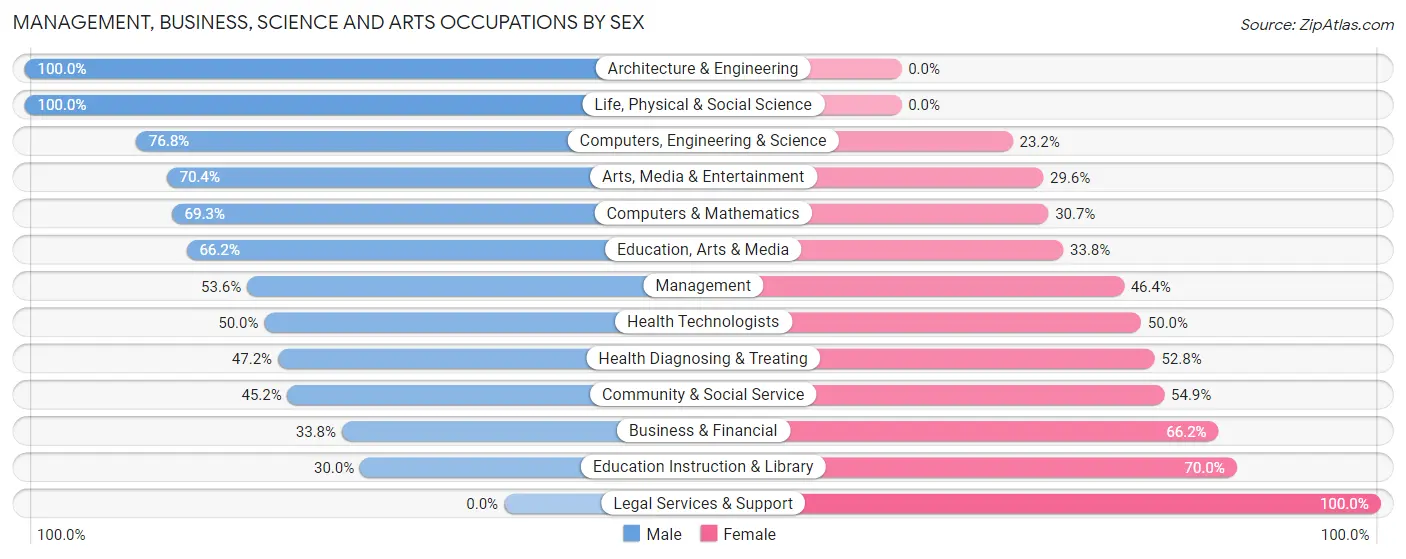
Management, Business, Science and Arts Occupations by Sex
Within the Management, Business, Science and Arts occupations in Rockland, the most male-oriented occupations are Architecture & Engineering (100.0%), Life, Physical & Social Science (100.0%), and Computers, Engineering & Science (76.8%), while the most female-oriented occupations are Legal Services & Support (100.0%), Education Instruction & Library (70.0%), and Business & Financial (66.2%).
| Occupation | Male | Female |
| Management | 172 (53.6%) | 149 (46.4%) |
| Business & Financial | 23 (33.8%) | 45 (66.2%) |
| Computers, Engineering & Science | 76 (76.8%) | 23 (23.2%) |
| Computers & Mathematics | 52 (69.3%) | 23 (30.7%) |
| Architecture & Engineering | 17 (100.0%) | 0 (0.0%) |
| Life, Physical & Social Science | 7 (100.0%) | 0 (0.0%) |
| Community & Social Service | 340 (45.2%) | 413 (54.8%) |
| Education, Arts & Media | 49 (66.2%) | 25 (33.8%) |
| Legal Services & Support | 0 (0.0%) | 23 (100.0%) |
| Education Instruction & Library | 127 (30.0%) | 296 (70.0%) |
| Arts, Media & Entertainment | 164 (70.4%) | 69 (29.6%) |
| Health Diagnosing & Treating | 83 (47.2%) | 93 (52.8%) |
| Health Technologists | 83 (50.0%) | 83 (50.0%) |
| Total (Category) | 694 (49.0%) | 723 (51.0%) |
| Total (Overall) | 1,572 (46.5%) | 1,811 (53.5%) |
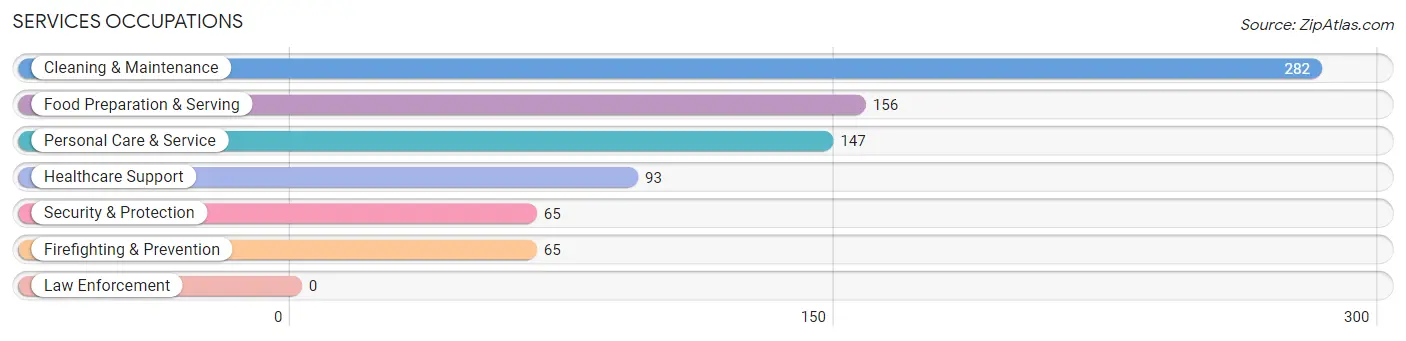
Services Occupations
The most common Services occupations in Rockland are Cleaning & Maintenance (282 | 8.3%), Food Preparation & Serving (156 | 4.6%), Personal Care & Service (147 | 4.3%), Healthcare Support (93 | 2.8%), and Security & Protection (65 | 1.9%).
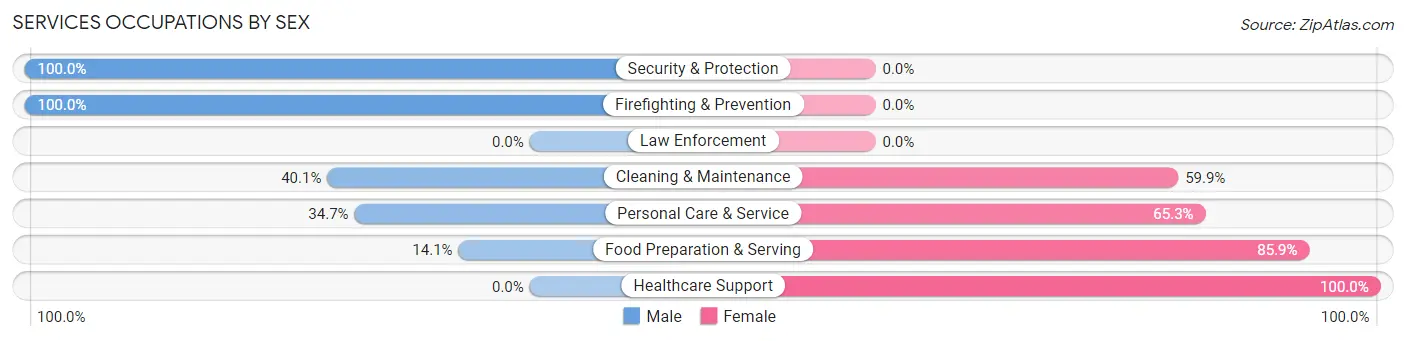
Services Occupations by Sex
Within the Services occupations in Rockland, the most male-oriented occupations are Security & Protection (100.0%), Firefighting & Prevention (100.0%), and Cleaning & Maintenance (40.1%), while the most female-oriented occupations are Healthcare Support (100.0%), Food Preparation & Serving (85.9%), and Personal Care & Service (65.3%).
| Occupation | Male | Female |
| Healthcare Support | 0 (0.0%) | 93 (100.0%) |
| Security & Protection | 65 (100.0%) | 0 (0.0%) |
| Firefighting & Prevention | 65 (100.0%) | 0 (0.0%) |
| Law Enforcement | 0 (0.0%) | 0 (0.0%) |
| Food Preparation & Serving | 22 (14.1%) | 134 (85.9%) |
| Cleaning & Maintenance | 113 (40.1%) | 169 (59.9%) |
| Personal Care & Service | 51 (34.7%) | 96 (65.3%) |
| Total (Category) | 251 (33.8%) | 492 (66.2%) |
| Total (Overall) | 1,572 (46.5%) | 1,811 (53.5%) |
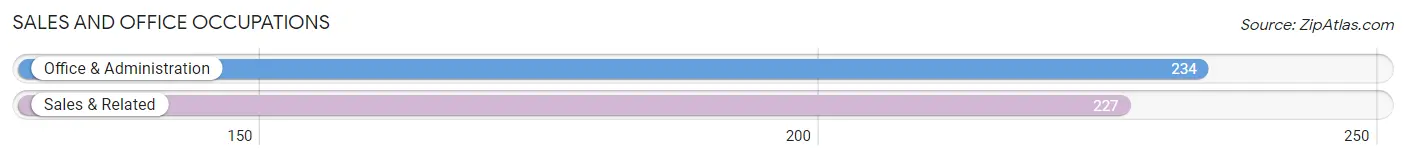
Sales and Office Occupations
The most common Sales and Office occupations in Rockland are Office & Administration (234 | 6.9%), and Sales & Related (227 | 6.7%).
Sales and Office Occupations by Sex
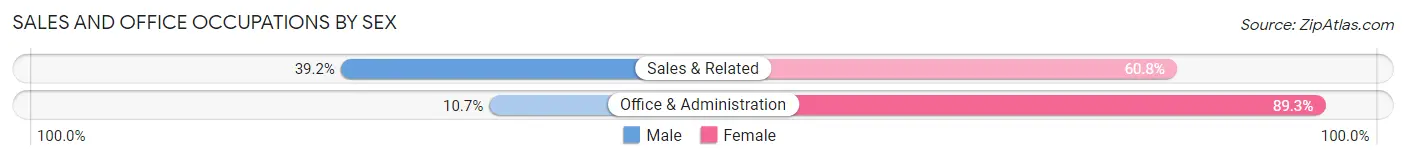
| Occupation | Male | Female |
| Sales & Related | 89 (39.2%) | 138 (60.8%) |
| Office & Administration | 25 (10.7%) | 209 (89.3%) |
| Total (Category) | 114 (24.7%) | 347 (75.3%) |
| Total (Overall) | 1,572 (46.5%) | 1,811 (53.5%) |
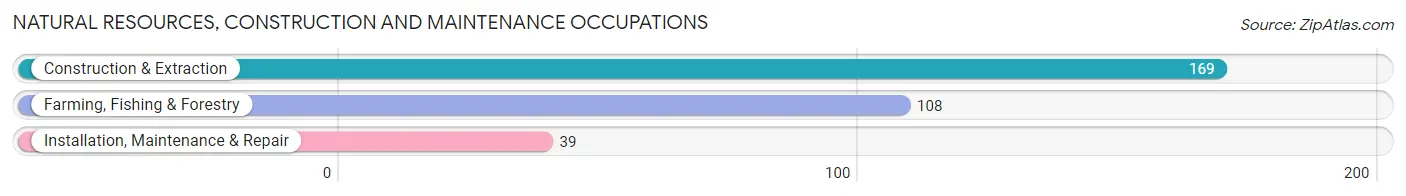
Natural Resources, Construction and Maintenance Occupations
The most common Natural Resources, Construction and Maintenance occupations in Rockland are Construction & Extraction (169 | 5.0%), Farming, Fishing & Forestry (108 | 3.2%), and Installation, Maintenance & Repair (39 | 1.1%).
Natural Resources, Construction and Maintenance Occupations by Sex
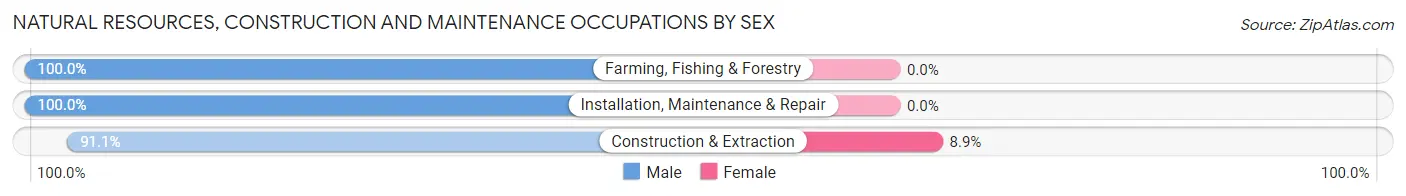
| Occupation | Male | Female |
| Farming, Fishing & Forestry | 108 (100.0%) | 0 (0.0%) |
| Construction & Extraction | 154 (91.1%) | 15 (8.9%) |
| Installation, Maintenance & Repair | 39 (100.0%) | 0 (0.0%) |
| Total (Category) | 301 (95.3%) | 15 (4.8%) |
| Total (Overall) | 1,572 (46.5%) | 1,811 (53.5%) |
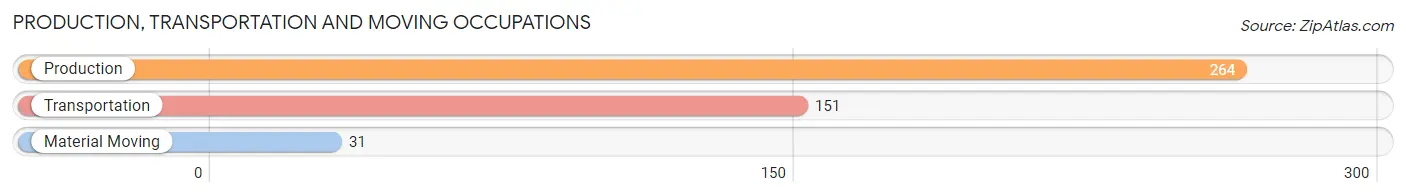
Production, Transportation and Moving Occupations
The most common Production, Transportation and Moving occupations in Rockland are Production (264 | 7.8%), Transportation (151 | 4.5%), and Material Moving (31 | 0.9%).
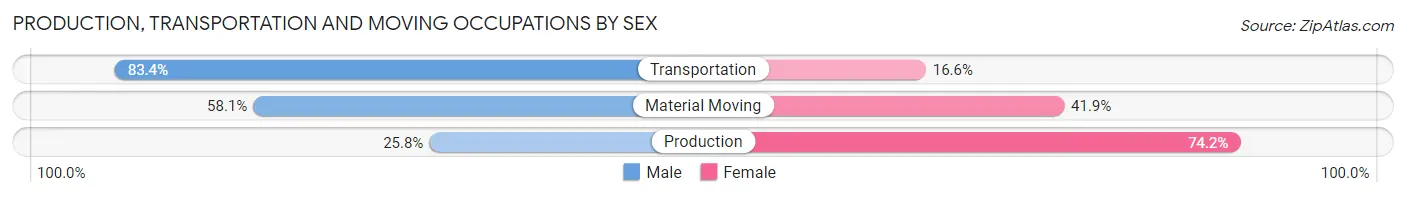
Production, Transportation and Moving Occupations by Sex
| Occupation | Male | Female |
| Production | 68 (25.8%) | 196 (74.2%) |
| Transportation | 126 (83.4%) | 25 (16.6%) |
| Material Moving | 18 (58.1%) | 13 (41.9%) |
| Total (Category) | 212 (47.5%) | 234 (52.5%) |
| Total (Overall) | 1,572 (46.5%) | 1,811 (53.5%) |
Employment Industries by Sex in Rockland
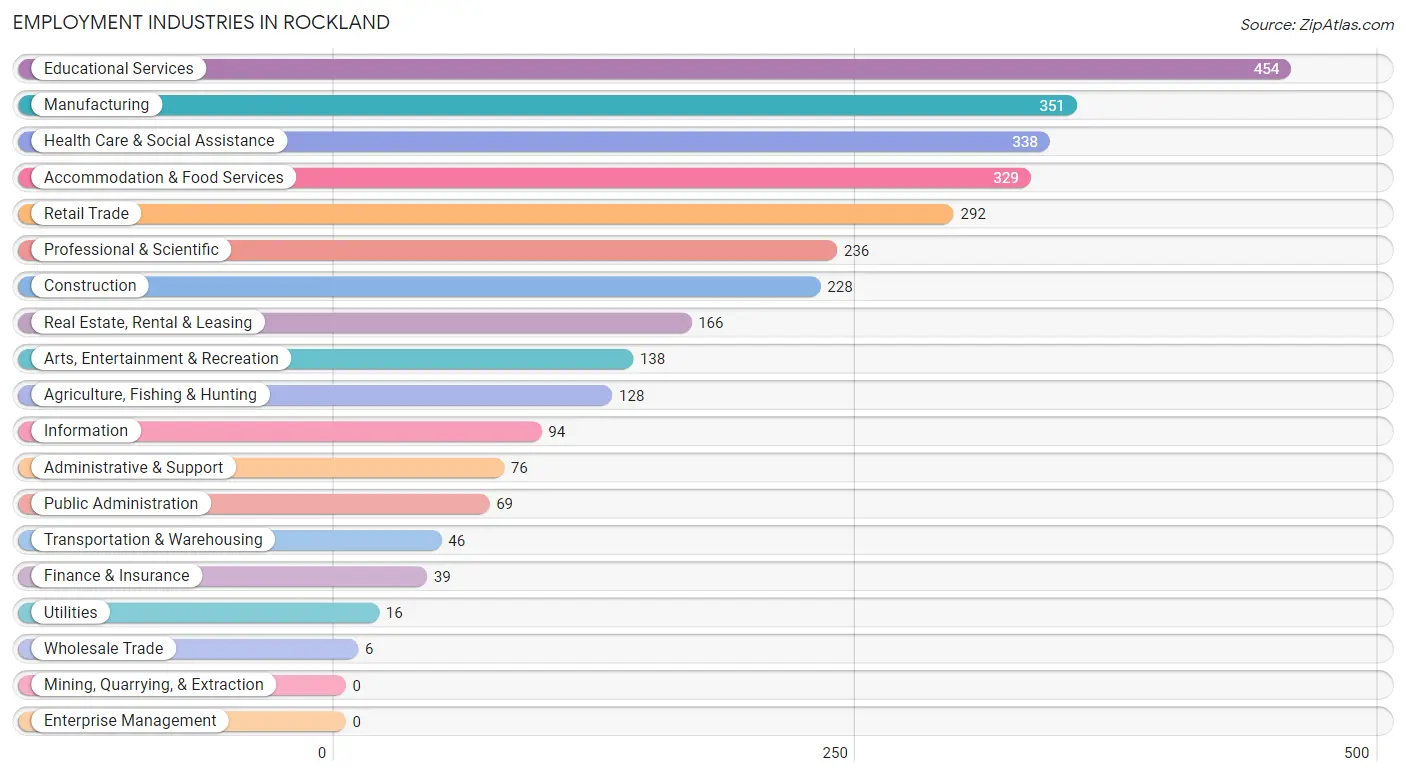
Employment Industries in Rockland
The major employment industries in Rockland include Educational Services (454 | 13.4%), Manufacturing (351 | 10.4%), Health Care & Social Assistance (338 | 10.0%), Accommodation & Food Services (329 | 9.7%), and Retail Trade (292 | 8.6%).
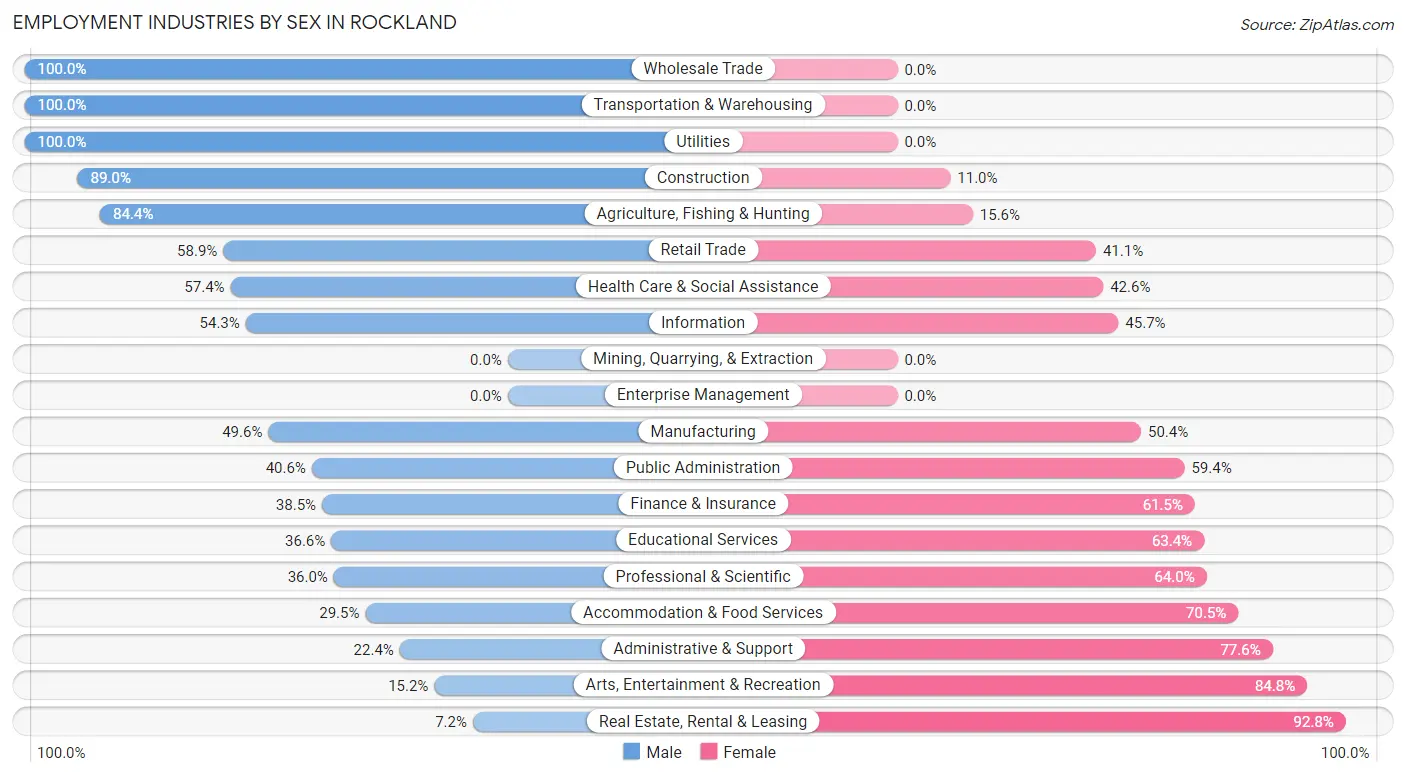
Employment Industries by Sex in Rockland
The Rockland industries that see more men than women are Wholesale Trade (100.0%), Transportation & Warehousing (100.0%), and Utilities (100.0%), whereas the industries that tend to have a higher number of women are Real Estate, Rental & Leasing (92.8%), Arts, Entertainment & Recreation (84.8%), and Administrative & Support (77.6%).
| Industry | Male | Female |
| Agriculture, Fishing & Hunting | 108 (84.4%) | 20 (15.6%) |
| Mining, Quarrying, & Extraction | 0 (0.0%) | 0 (0.0%) |
| Construction | 203 (89.0%) | 25 (11.0%) |
| Manufacturing | 174 (49.6%) | 177 (50.4%) |
| Wholesale Trade | 6 (100.0%) | 0 (0.0%) |
| Retail Trade | 172 (58.9%) | 120 (41.1%) |
| Transportation & Warehousing | 46 (100.0%) | 0 (0.0%) |
| Utilities | 16 (100.0%) | 0 (0.0%) |
| Information | 51 (54.3%) | 43 (45.7%) |
| Finance & Insurance | 15 (38.5%) | 24 (61.5%) |
| Real Estate, Rental & Leasing | 12 (7.2%) | 154 (92.8%) |
| Professional & Scientific | 85 (36.0%) | 151 (64.0%) |
| Enterprise Management | 0 (0.0%) | 0 (0.0%) |
| Administrative & Support | 17 (22.4%) | 59 (77.6%) |
| Educational Services | 166 (36.6%) | 288 (63.4%) |
| Health Care & Social Assistance | 194 (57.4%) | 144 (42.6%) |
| Arts, Entertainment & Recreation | 21 (15.2%) | 117 (84.8%) |
| Accommodation & Food Services | 97 (29.5%) | 232 (70.5%) |
| Public Administration | 28 (40.6%) | 41 (59.4%) |
| Total | 1,572 (46.5%) | 1,811 (53.5%) |
Education in Rockland
School Enrollment in Rockland
The most common levels of schooling among the 1,160 students in Rockland are middle school (360 | 31.0%), elementary school (235 | 20.3%), and high school (228 | 19.7%).
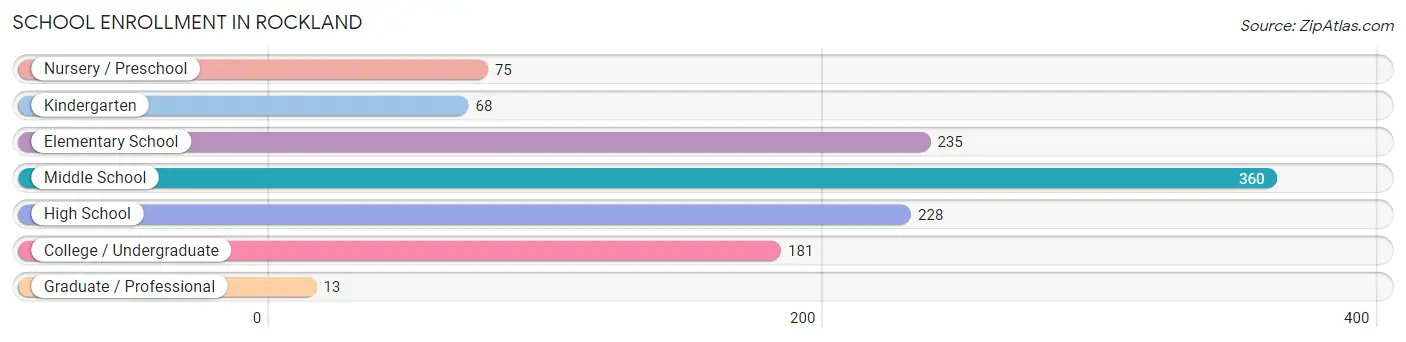
| School Level | # Students | % Students |
| Nursery / Preschool | 75 | 6.5% |
| Kindergarten | 68 | 5.9% |
| Elementary School | 235 | 20.3% |
| Middle School | 360 | 31.0% |
| High School | 228 | 19.7% |
| College / Undergraduate | 181 | 15.6% |
| Graduate / Professional | 13 | 1.1% |
| Total | 1,160 | 100.0% |
School Enrollment by Age by Funding Source in Rockland
Out of a total of 1,160 students who are enrolled in schools in Rockland, 303 (26.1%) attend a private institution, while the remaining 857 (73.9%) are enrolled in public schools. The age group of 18 to 19 year olds has the highest likelihood of being enrolled in private schools, with 98 (92.4% in the age bracket) enrolled. Conversely, the age group of 25 to 34 year olds has the lowest likelihood of being enrolled in a private school, with 29 (100.0% in the age bracket) attending a public institution.
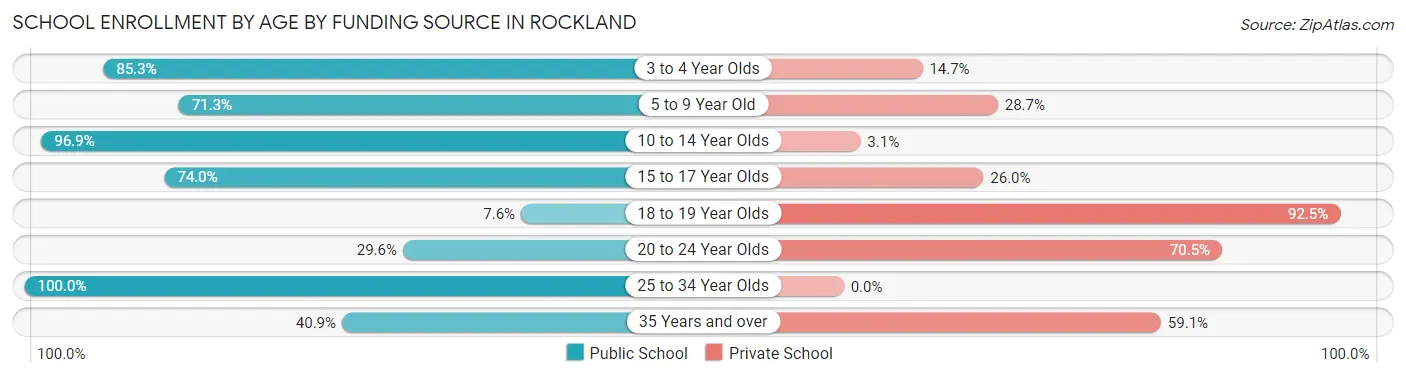
| Age Bracket | Public School | Private School |
| 3 to 4 Year Olds | 64 (85.3%) | 11 (14.7%) |
| 5 to 9 Year Old | 216 (71.3%) | 87 (28.7%) |
| 10 to 14 Year Olds | 373 (96.9%) | 12 (3.1%) |
| 15 to 17 Year Olds | 145 (74.0%) | 51 (26.0%) |
| 18 to 19 Year Olds | 8 (7.5%) | 98 (92.4%) |
| 20 to 24 Year Olds | 13 (29.5%) | 31 (70.5%) |
| 25 to 34 Year Olds | 29 (100.0%) | 0 (0.0%) |
| 35 Years and over | 9 (40.9%) | 13 (59.1%) |
| Total | 857 (73.9%) | 303 (26.1%) |
Educational Attainment by Field of Study in Rockland
Education (238 | 11.5%), visual & performing arts (226 | 10.9%), social sciences (202 | 9.8%), literature & languages (195 | 9.4%), and bio, nature & agricultural (179 | 8.6%) are the most common fields of study among 2,071 individuals in Rockland who have obtained a bachelor's degree or higher.
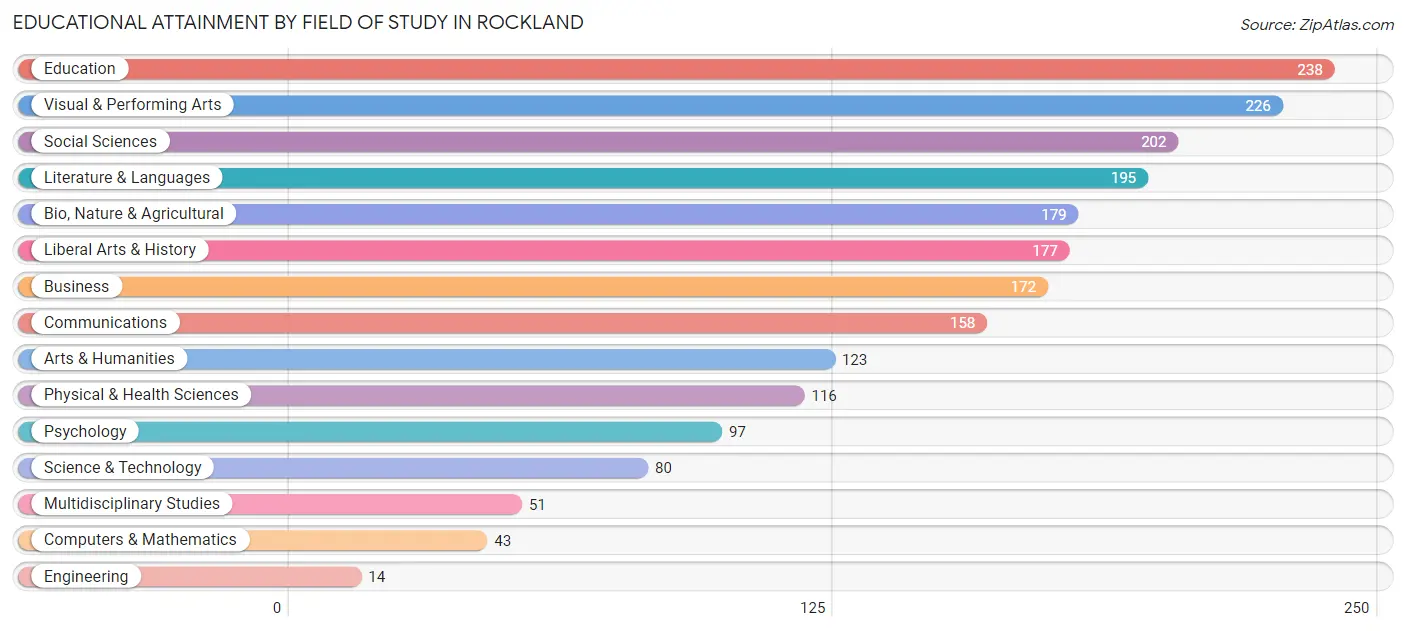
| Field of Study | # Graduates | % Graduates |
| Computers & Mathematics | 43 | 2.1% |
| Bio, Nature & Agricultural | 179 | 8.6% |
| Physical & Health Sciences | 116 | 5.6% |
| Psychology | 97 | 4.7% |
| Social Sciences | 202 | 9.8% |
| Engineering | 14 | 0.7% |
| Multidisciplinary Studies | 51 | 2.5% |
| Science & Technology | 80 | 3.9% |
| Business | 172 | 8.3% |
| Education | 238 | 11.5% |
| Literature & Languages | 195 | 9.4% |
| Liberal Arts & History | 177 | 8.6% |
| Visual & Performing Arts | 226 | 10.9% |
| Communications | 158 | 7.6% |
| Arts & Humanities | 123 | 5.9% |
| Total | 2,071 | 100.0% |
Transportation & Commute in Rockland
Vehicle Availability by Sex in Rockland
The most prevalent vehicle ownership categories in Rockland are males with 2 vehicles (694, accounting for 46.9%) and females with 2 vehicles (966, making up 38.8%).
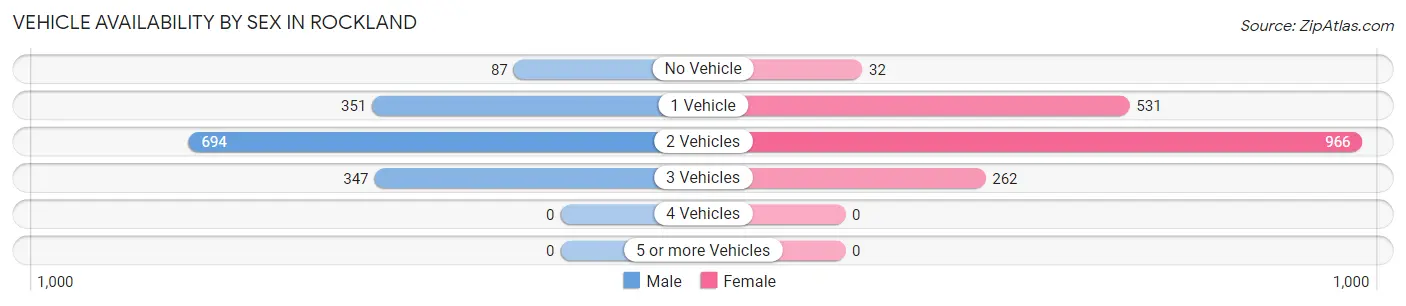
| Vehicles Available | Male | Female |
| No Vehicle | 87 (5.9%) | 32 (1.8%) |
| 1 Vehicle | 351 (23.7%) | 531 (29.6%) |
| 2 Vehicles | 694 (46.9%) | 966 (53.9%) |
| 3 Vehicles | 347 (23.5%) | 262 (14.6%) |
| 4 Vehicles | 0 (0.0%) | 0 (0.0%) |
| 5 or more Vehicles | 0 (0.0%) | 0 (0.0%) |
| Total | 1,479 (100.0%) | 1,791 (100.0%) |
Commute Time in Rockland
The most frequently occuring commute durations in Rockland are 5 to 9 minutes (910 commuters, 33.1%), 10 to 14 minutes (767 commuters, 27.9%), and 15 to 19 minutes (349 commuters, 12.7%).
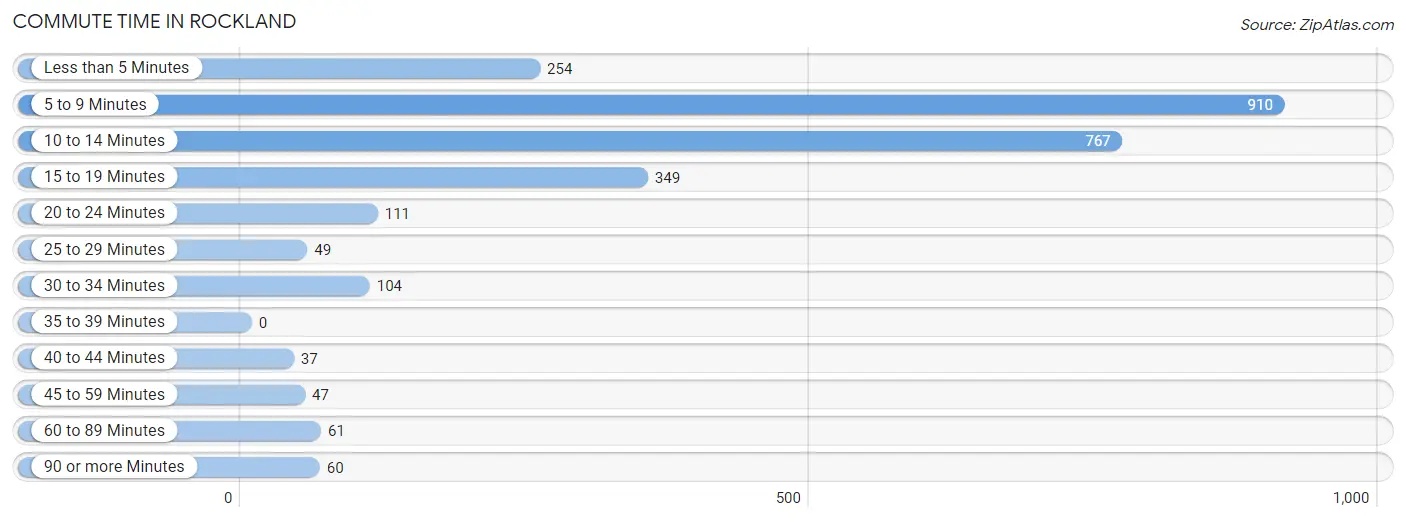
| Commute Time | # Commuters | % Commuters |
| Less than 5 Minutes | 254 | 9.2% |
| 5 to 9 Minutes | 910 | 33.1% |
| 10 to 14 Minutes | 767 | 27.9% |
| 15 to 19 Minutes | 349 | 12.7% |
| 20 to 24 Minutes | 111 | 4.0% |
| 25 to 29 Minutes | 49 | 1.8% |
| 30 to 34 Minutes | 104 | 3.8% |
| 35 to 39 Minutes | 0 | 0.0% |
| 40 to 44 Minutes | 37 | 1.3% |
| 45 to 59 Minutes | 47 | 1.7% |
| 60 to 89 Minutes | 61 | 2.2% |
| 90 or more Minutes | 60 | 2.2% |
Commute Time by Sex in Rockland
The most common commute times in Rockland are 5 to 9 minutes (520 commuters, 39.3%) for males and 10 to 14 minutes (431 commuters, 30.2%) for females.
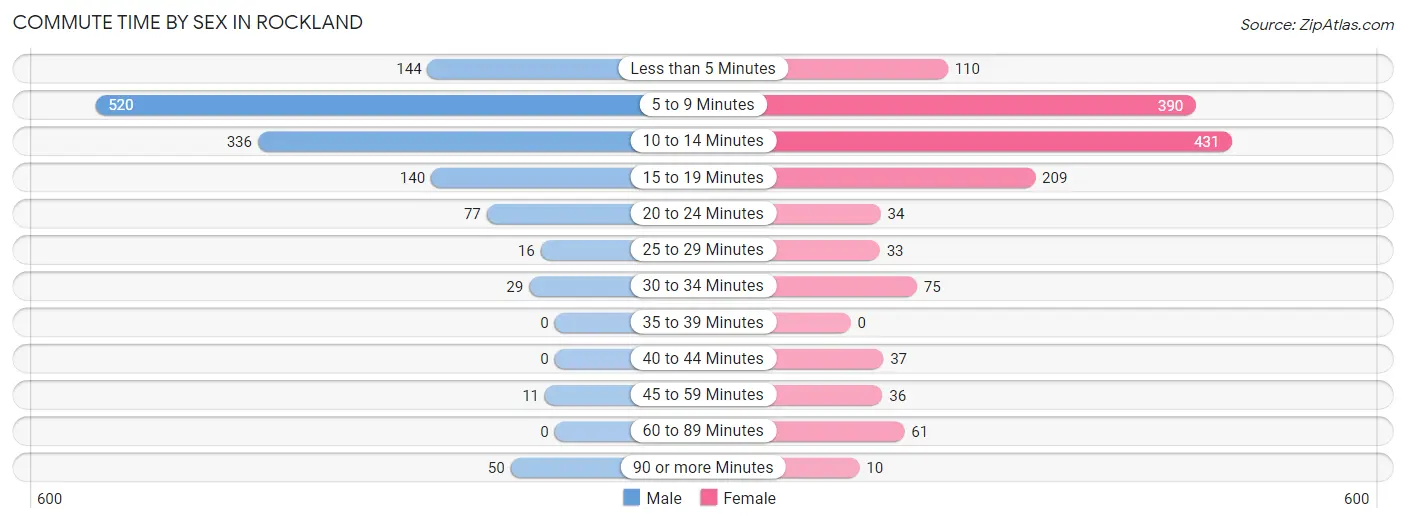
| Commute Time | Male | Female |
| Less than 5 Minutes | 144 (10.9%) | 110 (7.7%) |
| 5 to 9 Minutes | 520 (39.3%) | 390 (27.4%) |
| 10 to 14 Minutes | 336 (25.4%) | 431 (30.2%) |
| 15 to 19 Minutes | 140 (10.6%) | 209 (14.7%) |
| 20 to 24 Minutes | 77 (5.8%) | 34 (2.4%) |
| 25 to 29 Minutes | 16 (1.2%) | 33 (2.3%) |
| 30 to 34 Minutes | 29 (2.2%) | 75 (5.3%) |
| 35 to 39 Minutes | 0 (0.0%) | 0 (0.0%) |
| 40 to 44 Minutes | 0 (0.0%) | 37 (2.6%) |
| 45 to 59 Minutes | 11 (0.8%) | 36 (2.5%) |
| 60 to 89 Minutes | 0 (0.0%) | 61 (4.3%) |
| 90 or more Minutes | 50 (3.8%) | 10 (0.7%) |
Time of Departure to Work by Sex in Rockland
The most frequent times of departure to work in Rockland are 7:00 AM to 7:29 AM (224, 16.9%) for males and 7:30 AM to 7:59 AM (308, 21.6%) for females.
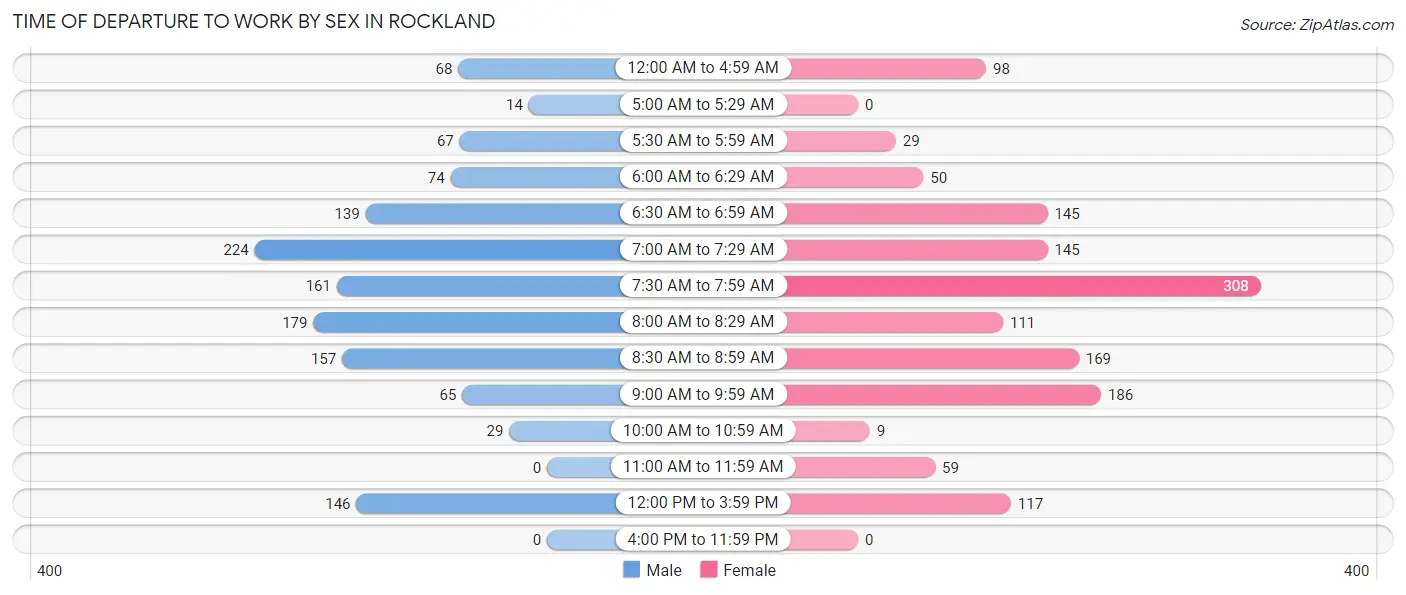
| Time of Departure | Male | Female |
| 12:00 AM to 4:59 AM | 68 (5.1%) | 98 (6.9%) |
| 5:00 AM to 5:29 AM | 14 (1.1%) | 0 (0.0%) |
| 5:30 AM to 5:59 AM | 67 (5.1%) | 29 (2.0%) |
| 6:00 AM to 6:29 AM | 74 (5.6%) | 50 (3.5%) |
| 6:30 AM to 6:59 AM | 139 (10.5%) | 145 (10.2%) |
| 7:00 AM to 7:29 AM | 224 (16.9%) | 145 (10.2%) |
| 7:30 AM to 7:59 AM | 161 (12.2%) | 308 (21.6%) |
| 8:00 AM to 8:29 AM | 179 (13.5%) | 111 (7.8%) |
| 8:30 AM to 8:59 AM | 157 (11.9%) | 169 (11.8%) |
| 9:00 AM to 9:59 AM | 65 (4.9%) | 186 (13.0%) |
| 10:00 AM to 10:59 AM | 29 (2.2%) | 9 (0.6%) |
| 11:00 AM to 11:59 AM | 0 (0.0%) | 59 (4.1%) |
| 12:00 PM to 3:59 PM | 146 (11.0%) | 117 (8.2%) |
| 4:00 PM to 11:59 PM | 0 (0.0%) | 0 (0.0%) |
| Total | 1,323 (100.0%) | 1,426 (100.0%) |
Housing Occupancy in Rockland
Occupancy by Ownership in Rockland
Of the total 3,371 dwellings in Rockland, owner-occupied units account for 2,153 (63.9%), while renter-occupied units make up 1,218 (36.1%).
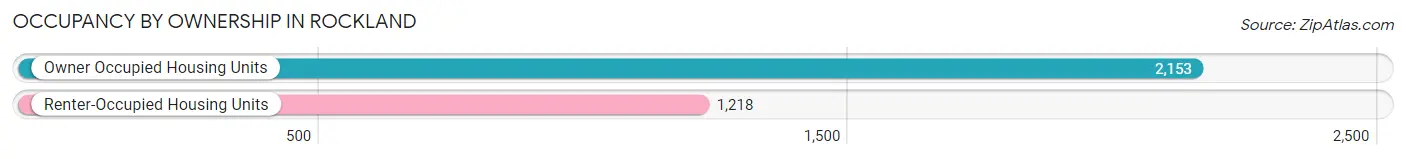
| Occupancy | # Housing Units | % Housing Units |
| Owner Occupied Housing Units | 2,153 | 63.9% |
| Renter-Occupied Housing Units | 1,218 | 36.1% |
| Total Occupied Housing Units | 3,371 | 100.0% |
Occupancy by Household Size in Rockland
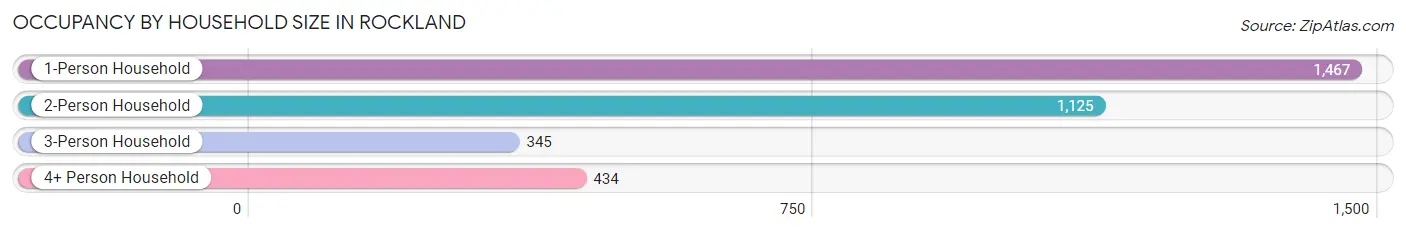
| Household Size | # Housing Units | % Housing Units |
| 1-Person Household | 1,467 | 43.5% |
| 2-Person Household | 1,125 | 33.4% |
| 3-Person Household | 345 | 10.2% |
| 4+ Person Household | 434 | 12.9% |
| Total Housing Units | 3,371 | 100.0% |
Occupancy by Ownership by Household Size in Rockland
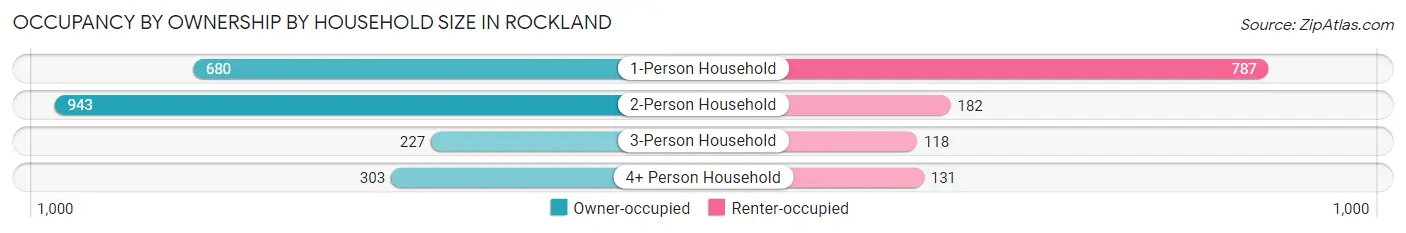
| Household Size | Owner-occupied | Renter-occupied |
| 1-Person Household | 680 (46.4%) | 787 (53.6%) |
| 2-Person Household | 943 (83.8%) | 182 (16.2%) |
| 3-Person Household | 227 (65.8%) | 118 (34.2%) |
| 4+ Person Household | 303 (69.8%) | 131 (30.2%) |
| Total Housing Units | 2,153 (63.9%) | 1,218 (36.1%) |
Occupancy by Educational Attainment in Rockland
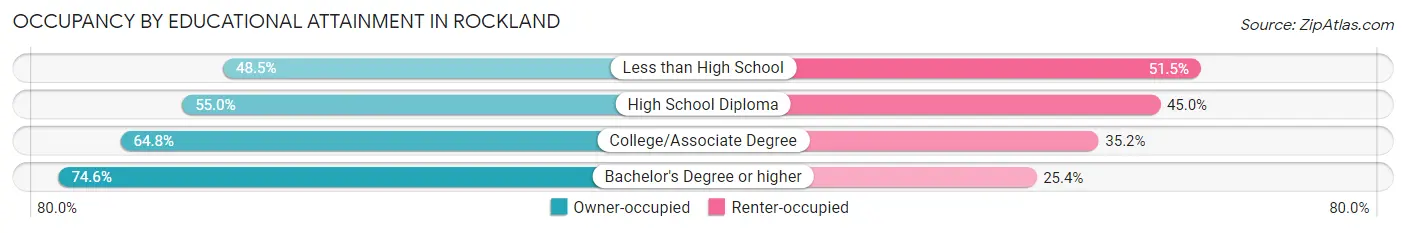
| Household Size | Owner-occupied | Renter-occupied |
| Less than High School | 163 (48.5%) | 173 (51.5%) |
| High School Diploma | 562 (55.0%) | 460 (45.0%) |
| College/Associate Degree | 487 (64.8%) | 265 (35.2%) |
| Bachelor's Degree or higher | 941 (74.6%) | 320 (25.4%) |
Occupancy by Age of Householder in Rockland
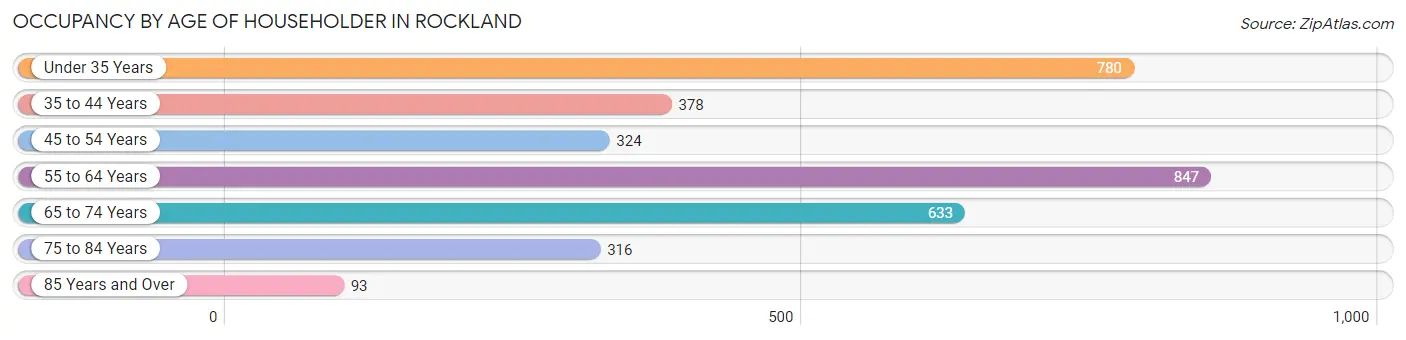
| Age Bracket | # Households | % Households |
| Under 35 Years | 780 | 23.1% |
| 35 to 44 Years | 378 | 11.2% |
| 45 to 54 Years | 324 | 9.6% |
| 55 to 64 Years | 847 | 25.1% |
| 65 to 74 Years | 633 | 18.8% |
| 75 to 84 Years | 316 | 9.4% |
| 85 Years and Over | 93 | 2.8% |
| Total | 3,371 | 100.0% |
Housing Finances in Rockland
Median Income by Occupancy in Rockland
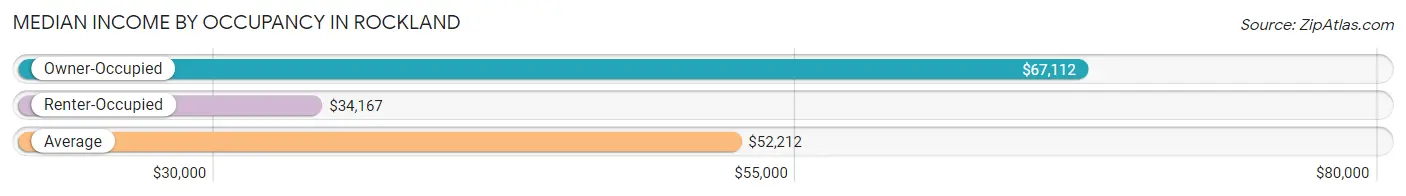
| Occupancy Type | # Households | Median Income |
| Owner-Occupied | 2,153 (63.9%) | $67,112 |
| Renter-Occupied | 1,218 (36.1%) | $34,167 |
| Average | 3,371 (100.0%) | $52,212 |
Occupancy by Householder Income Bracket in Rockland
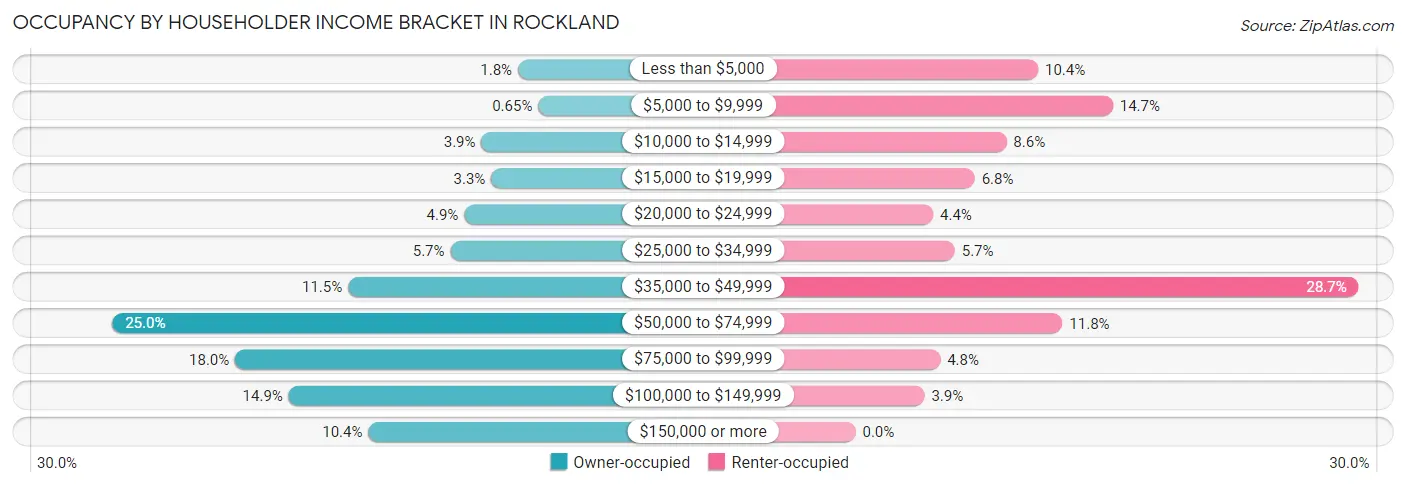
| Income Bracket | Owner-occupied | Renter-occupied |
| Less than $5,000 | 39 (1.8%) | 127 (10.4%) |
| $5,000 to $9,999 | 14 (0.6%) | 179 (14.7%) |
| $10,000 to $14,999 | 84 (3.9%) | 105 (8.6%) |
| $15,000 to $19,999 | 72 (3.3%) | 83 (6.8%) |
| $20,000 to $24,999 | 105 (4.9%) | 54 (4.4%) |
| $25,000 to $34,999 | 122 (5.7%) | 69 (5.7%) |
| $35,000 to $49,999 | 248 (11.5%) | 350 (28.7%) |
| $50,000 to $74,999 | 538 (25.0%) | 144 (11.8%) |
| $75,000 to $99,999 | 387 (18.0%) | 59 (4.8%) |
| $100,000 to $149,999 | 321 (14.9%) | 48 (3.9%) |
| $150,000 or more | 223 (10.4%) | 0 (0.0%) |
| Total | 2,153 (100.0%) | 1,218 (100.0%) |
Monthly Housing Cost Tiers in Rockland
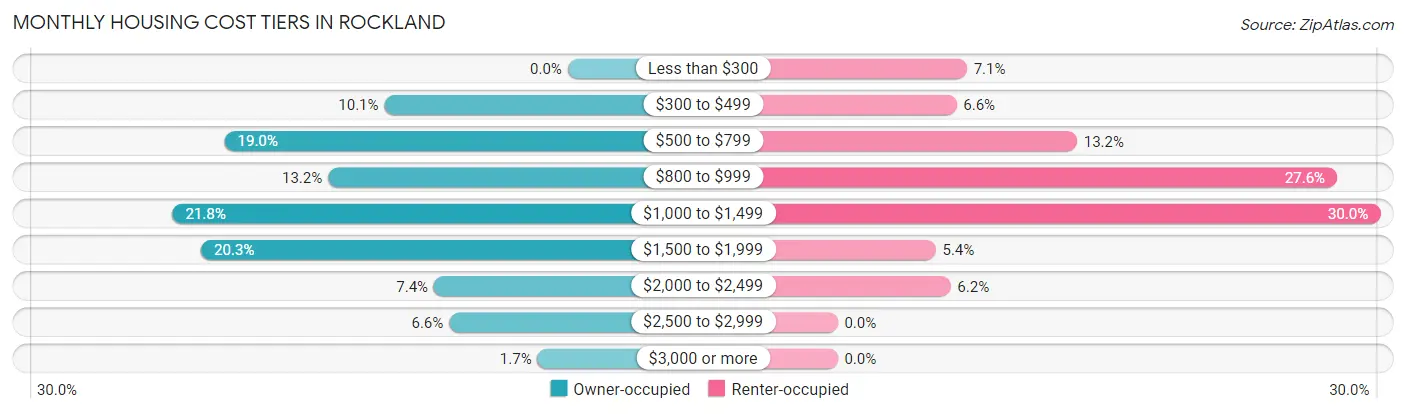
| Monthly Cost | Owner-occupied | Renter-occupied |
| Less than $300 | 0 (0.0%) | 87 (7.1%) |
| $300 to $499 | 218 (10.1%) | 80 (6.6%) |
| $500 to $799 | 408 (19.0%) | 161 (13.2%) |
| $800 to $999 | 285 (13.2%) | 336 (27.6%) |
| $1,000 to $1,499 | 470 (21.8%) | 365 (30.0%) |
| $1,500 to $1,999 | 436 (20.3%) | 66 (5.4%) |
| $2,000 to $2,499 | 159 (7.4%) | 76 (6.2%) |
| $2,500 to $2,999 | 141 (6.6%) | 0 (0.0%) |
| $3,000 or more | 36 (1.7%) | 0 (0.0%) |
| Total | 2,153 (100.0%) | 1,218 (100.0%) |
Physical Housing Characteristics in Rockland
Housing Structures in Rockland
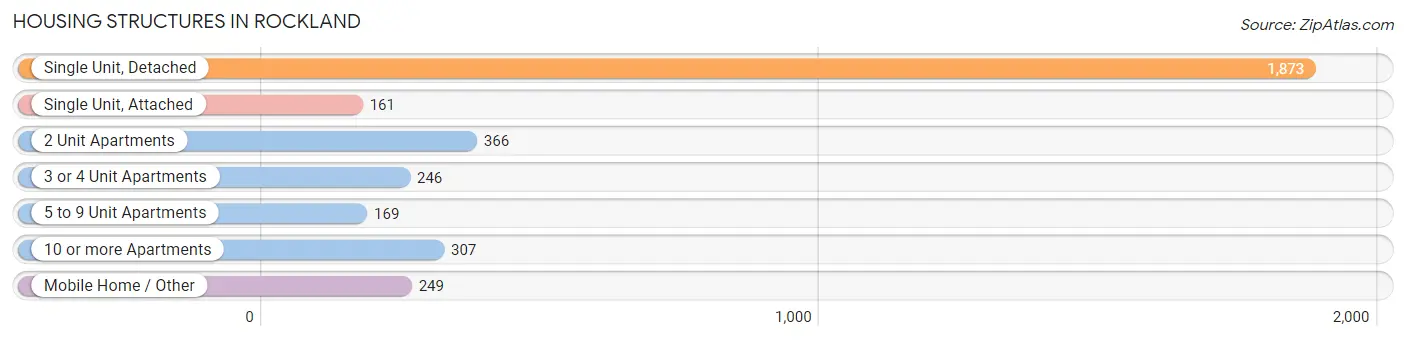
| Structure Type | # Housing Units | % Housing Units |
| Single Unit, Detached | 1,873 | 55.6% |
| Single Unit, Attached | 161 | 4.8% |
| 2 Unit Apartments | 366 | 10.9% |
| 3 or 4 Unit Apartments | 246 | 7.3% |
| 5 to 9 Unit Apartments | 169 | 5.0% |
| 10 or more Apartments | 307 | 9.1% |
| Mobile Home / Other | 249 | 7.4% |
| Total | 3,371 | 100.0% |
Housing Structures by Occupancy in Rockland
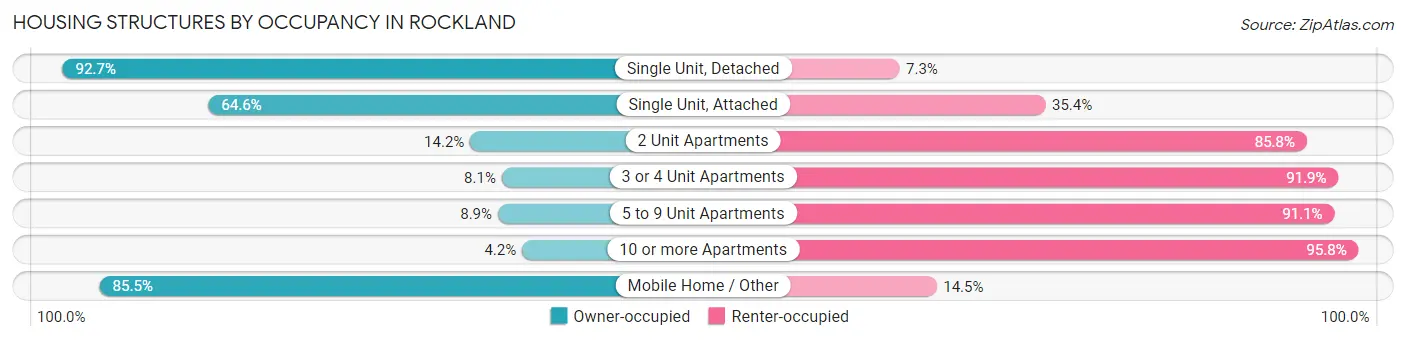
| Structure Type | Owner-occupied | Renter-occupied |
| Single Unit, Detached | 1,736 (92.7%) | 137 (7.3%) |
| Single Unit, Attached | 104 (64.6%) | 57 (35.4%) |
| 2 Unit Apartments | 52 (14.2%) | 314 (85.8%) |
| 3 or 4 Unit Apartments | 20 (8.1%) | 226 (91.9%) |
| 5 to 9 Unit Apartments | 15 (8.9%) | 154 (91.1%) |
| 10 or more Apartments | 13 (4.2%) | 294 (95.8%) |
| Mobile Home / Other | 213 (85.5%) | 36 (14.5%) |
| Total | 2,153 (63.9%) | 1,218 (36.1%) |
Housing Structures by Number of Rooms in Rockland
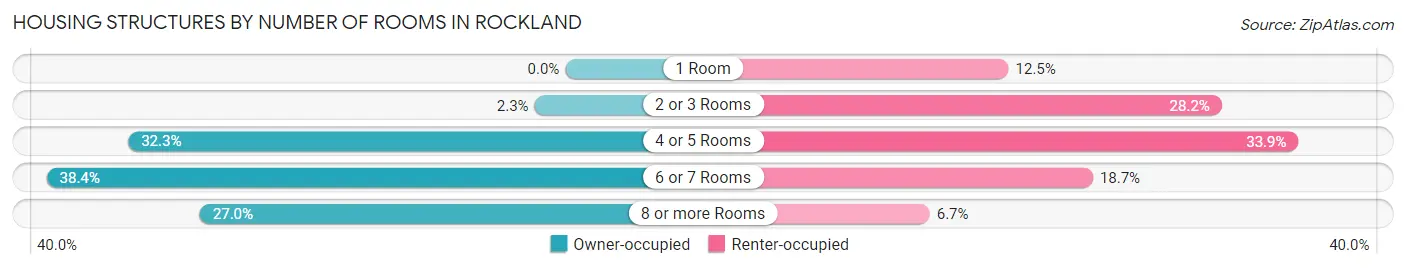
| Number of Rooms | Owner-occupied | Renter-occupied |
| 1 Room | 0 (0.0%) | 152 (12.5%) |
| 2 or 3 Rooms | 49 (2.3%) | 344 (28.2%) |
| 4 or 5 Rooms | 696 (32.3%) | 413 (33.9%) |
| 6 or 7 Rooms | 826 (38.4%) | 228 (18.7%) |
| 8 or more Rooms | 582 (27.0%) | 81 (6.7%) |
| Total | 2,153 (100.0%) | 1,218 (100.0%) |
Housing Structure by Heating Type in Rockland
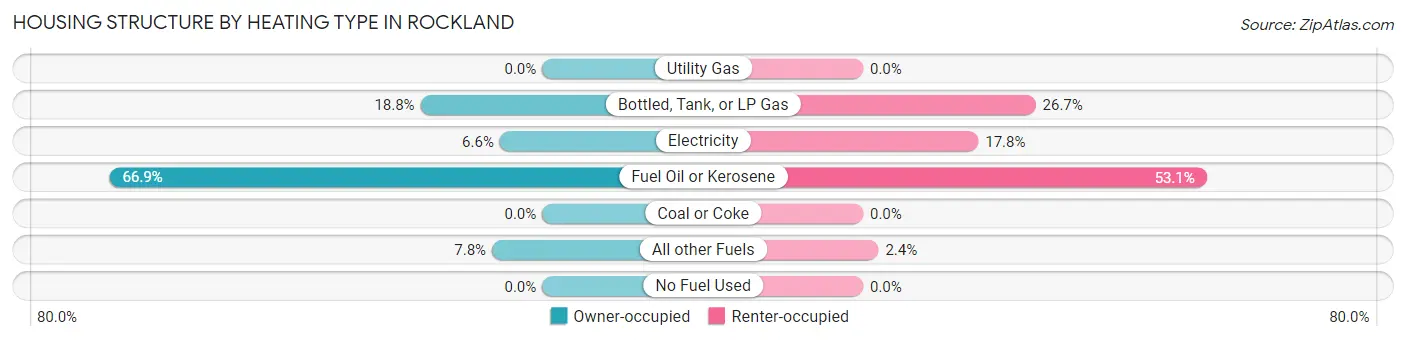
| Heating Type | Owner-occupied | Renter-occupied |
| Utility Gas | 0 (0.0%) | 0 (0.0%) |
| Bottled, Tank, or LP Gas | 405 (18.8%) | 325 (26.7%) |
| Electricity | 141 (6.6%) | 217 (17.8%) |
| Fuel Oil or Kerosene | 1,440 (66.9%) | 647 (53.1%) |
| Coal or Coke | 0 (0.0%) | 0 (0.0%) |
| All other Fuels | 167 (7.8%) | 29 (2.4%) |
| No Fuel Used | 0 (0.0%) | 0 (0.0%) |
| Total | 2,153 (100.0%) | 1,218 (100.0%) |
Household Vehicle Usage in Rockland
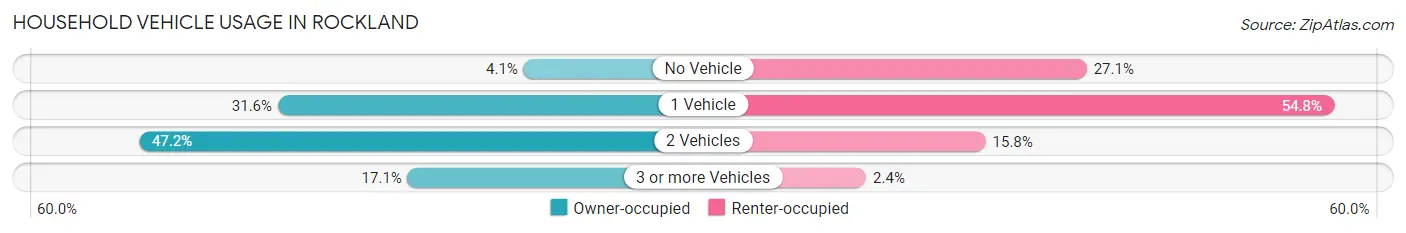
| Vehicles per Household | Owner-occupied | Renter-occupied |
| No Vehicle | 88 (4.1%) | 330 (27.1%) |
| 1 Vehicle | 681 (31.6%) | 667 (54.8%) |
| 2 Vehicles | 1,016 (47.2%) | 192 (15.8%) |
| 3 or more Vehicles | 368 (17.1%) | 29 (2.4%) |
| Total | 2,153 (100.0%) | 1,218 (100.0%) |
Real Estate & Mortgages in Rockland
Real Estate and Mortgage Overview in Rockland
| Characteristic | Without Mortgage | With Mortgage |
| Housing Units | 795 | 1,358 |
| Median Property Value | $187,200 | $207,400 |
| Median Household Income | $45,353 | $139 |
| Monthly Housing Costs | $674 | $36 |
| Real Estate Taxes | $3,563 | $0 |
Property Value by Mortgage Status in Rockland
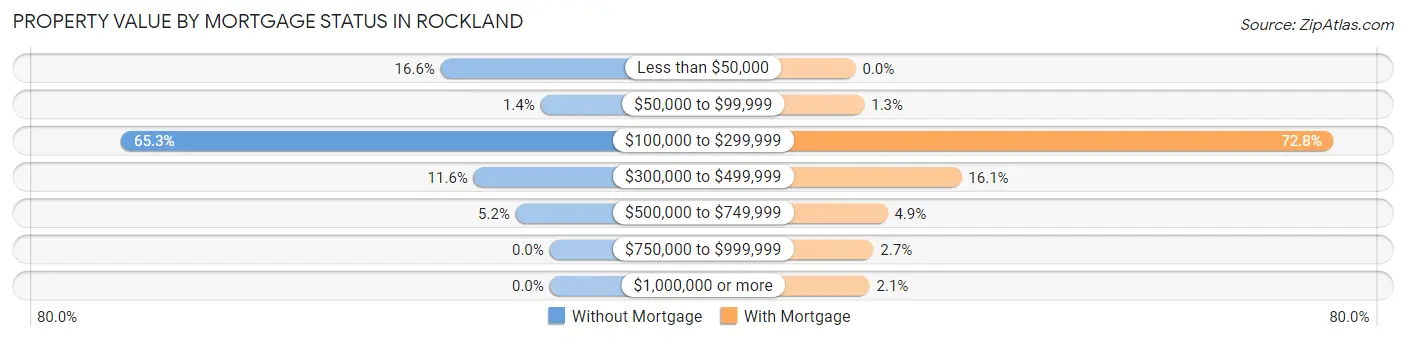
| Property Value | Without Mortgage | With Mortgage |
| Less than $50,000 | 132 (16.6%) | 0 (0.0%) |
| $50,000 to $99,999 | 11 (1.4%) | 18 (1.3%) |
| $100,000 to $299,999 | 519 (65.3%) | 989 (72.8%) |
| $300,000 to $499,999 | 92 (11.6%) | 219 (16.1%) |
| $500,000 to $749,999 | 41 (5.2%) | 66 (4.9%) |
| $750,000 to $999,999 | 0 (0.0%) | 37 (2.7%) |
| $1,000,000 or more | 0 (0.0%) | 29 (2.1%) |
| Total | 795 (100.0%) | 1,358 (100.0%) |
Household Income by Mortgage Status in Rockland
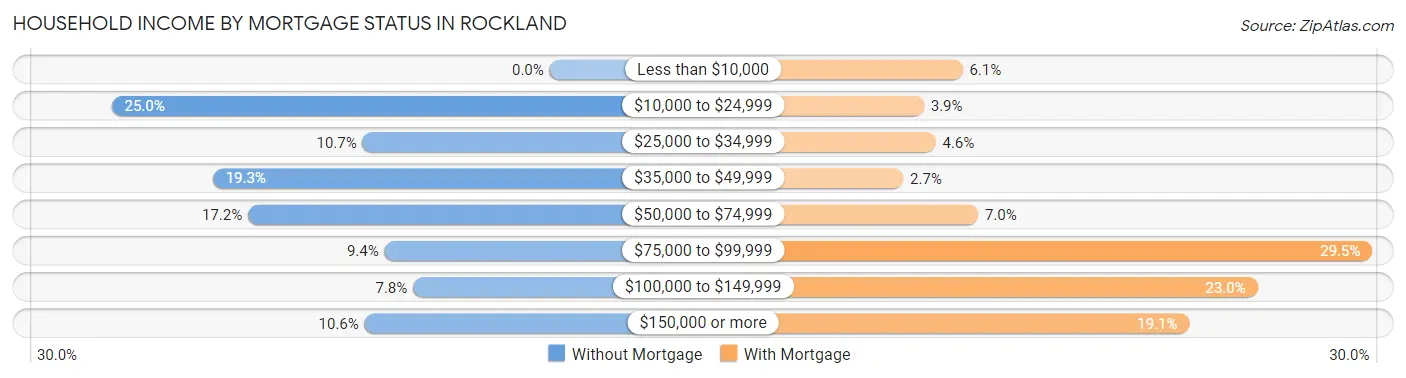
| Household Income | Without Mortgage | With Mortgage |
| Less than $10,000 | 0 (0.0%) | 83 (6.1%) |
| $10,000 to $24,999 | 199 (25.0%) | 53 (3.9%) |
| $25,000 to $34,999 | 85 (10.7%) | 62 (4.6%) |
| $35,000 to $49,999 | 153 (19.3%) | 37 (2.7%) |
| $50,000 to $74,999 | 137 (17.2%) | 95 (7.0%) |
| $75,000 to $99,999 | 75 (9.4%) | 401 (29.5%) |
| $100,000 to $149,999 | 62 (7.8%) | 312 (23.0%) |
| $150,000 or more | 84 (10.6%) | 259 (19.1%) |
| Total | 795 (100.0%) | 1,358 (100.0%) |
Property Value to Household Income Ratio in Rockland
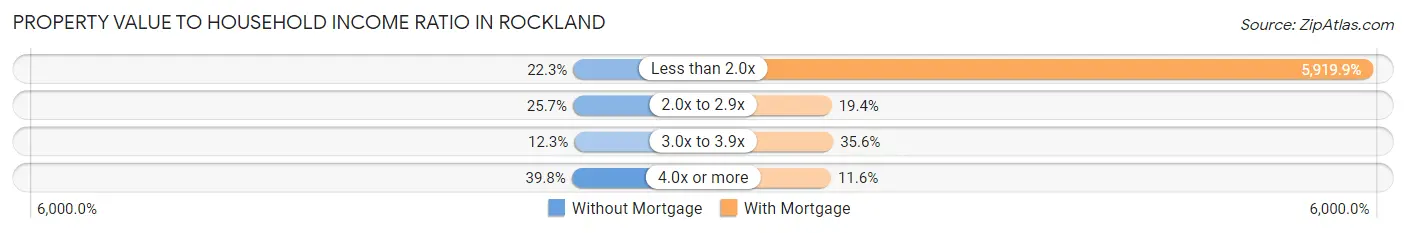
| Value-to-Income Ratio | Without Mortgage | With Mortgage |
| Less than 2.0x | 177 (22.3%) | 80,392 (5,919.9%) |
| 2.0x to 2.9x | 204 (25.7%) | 264 (19.4%) |
| 3.0x to 3.9x | 98 (12.3%) | 484 (35.6%) |
| 4.0x or more | 316 (39.8%) | 157 (11.6%) |
| Total | 795 (100.0%) | 1,358 (100.0%) |
Real Estate Taxes by Mortgage Status in Rockland
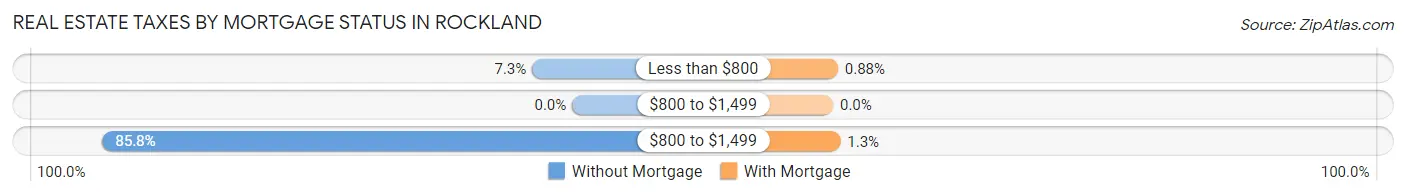
| Property Taxes | Without Mortgage | With Mortgage |
| Less than $800 | 58 (7.3%) | 12 (0.9%) |
| $800 to $1,499 | 0 (0.0%) | 0 (0.0%) |
| $800 to $1,499 | 682 (85.8%) | 18 (1.3%) |
| Total | 795 (100.0%) | 1,358 (100.0%) |
Health & Disability in Rockland
Health Insurance Coverage by Age in Rockland
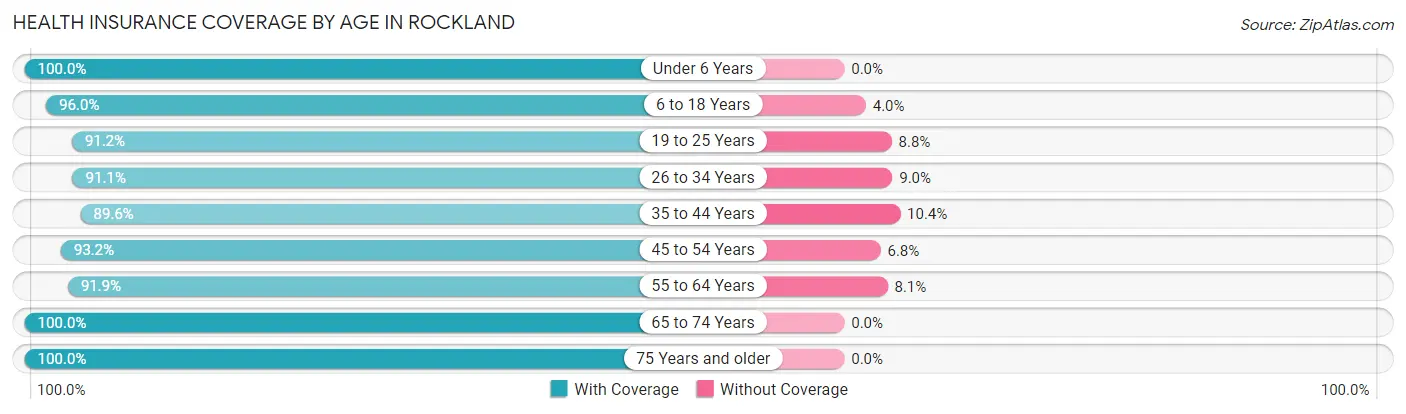
| Age Bracket | With Coverage | Without Coverage |
| Under 6 Years | 365 (100.0%) | 0 (0.0%) |
| 6 to 18 Years | 790 (96.0%) | 33 (4.0%) |
| 19 to 25 Years | 662 (91.2%) | 64 (8.8%) |
| 26 to 34 Years | 773 (91.0%) | 76 (8.9%) |
| 35 to 44 Years | 594 (89.6%) | 69 (10.4%) |
| 45 to 54 Years | 524 (93.2%) | 38 (6.8%) |
| 55 to 64 Years | 1,186 (91.9%) | 104 (8.1%) |
| 65 to 74 Years | 932 (100.0%) | 0 (0.0%) |
| 75 Years and older | 575 (100.0%) | 0 (0.0%) |
| Total | 6,401 (94.3%) | 384 (5.7%) |
Health Insurance Coverage by Citizenship Status in Rockland
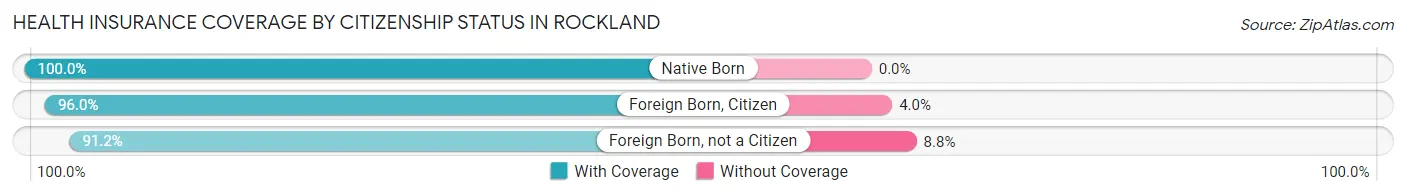
| Citizenship Status | With Coverage | Without Coverage |
| Native Born | 365 (100.0%) | 0 (0.0%) |
| Foreign Born, Citizen | 790 (96.0%) | 33 (4.0%) |
| Foreign Born, not a Citizen | 662 (91.2%) | 64 (8.8%) |
Health Insurance Coverage by Household Income in Rockland
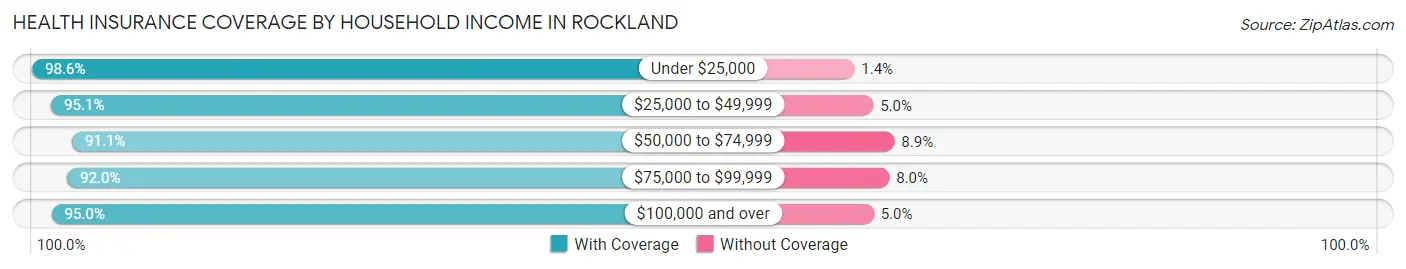
| Household Income | With Coverage | Without Coverage |
| Under $25,000 | 1,255 (98.6%) | 18 (1.4%) |
| $25,000 to $49,999 | 1,228 (95.1%) | 64 (5.0%) |
| $50,000 to $74,999 | 1,420 (91.1%) | 139 (8.9%) |
| $75,000 to $99,999 | 971 (92.0%) | 84 (8.0%) |
| $100,000 and over | 1,489 (95.0%) | 79 (5.0%) |
Public vs Private Health Insurance Coverage by Age in Rockland
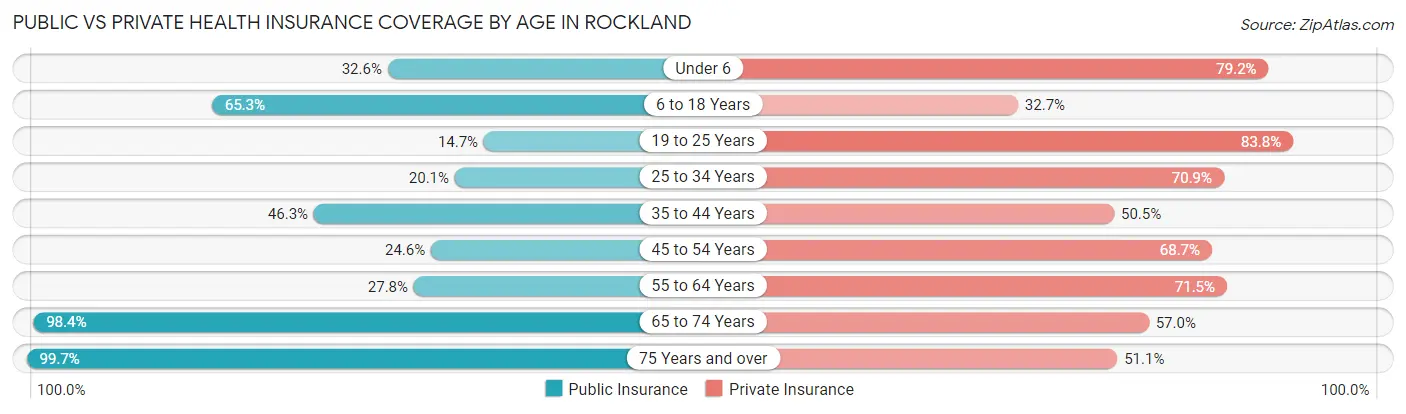
| Age Bracket | Public Insurance | Private Insurance |
| Under 6 | 119 (32.6%) | 289 (79.2%) |
| 6 to 18 Years | 537 (65.2%) | 269 (32.7%) |
| 19 to 25 Years | 107 (14.7%) | 608 (83.8%) |
| 25 to 34 Years | 171 (20.1%) | 602 (70.9%) |
| 35 to 44 Years | 307 (46.3%) | 335 (50.5%) |
| 45 to 54 Years | 138 (24.6%) | 386 (68.7%) |
| 55 to 64 Years | 358 (27.8%) | 922 (71.5%) |
| 65 to 74 Years | 917 (98.4%) | 531 (57.0%) |
| 75 Years and over | 573 (99.7%) | 294 (51.1%) |
| Total | 3,227 (47.6%) | 4,236 (62.4%) |
Disability Status by Sex by Age in Rockland
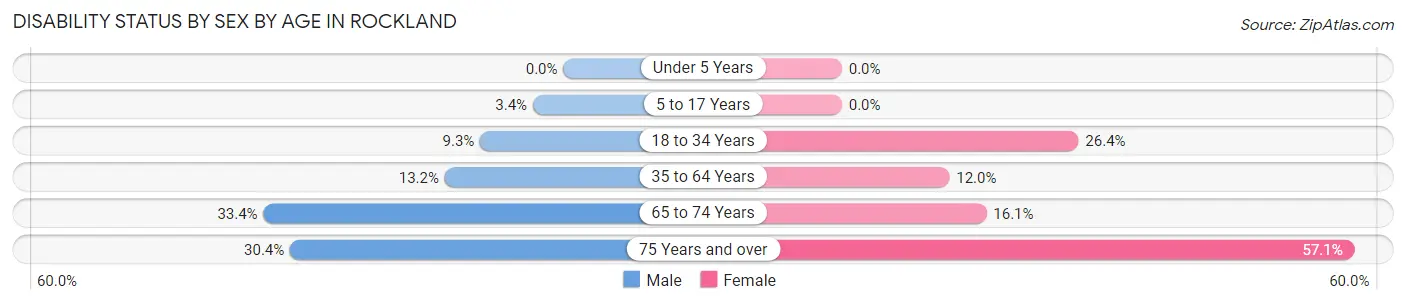
| Age Bracket | Male | Female |
| Under 5 Years | 0 (0.0%) | 0 (0.0%) |
| 5 to 17 Years | 14 (3.4%) | 0 (0.0%) |
| 18 to 34 Years | 66 (9.3%) | 229 (26.4%) |
| 35 to 64 Years | 139 (13.2%) | 175 (12.0%) |
| 65 to 74 Years | 164 (33.4%) | 71 (16.1%) |
| 75 Years and over | 70 (30.4%) | 197 (57.1%) |
Disability Class by Sex by Age in Rockland
Disability Class: Hearing Difficulty
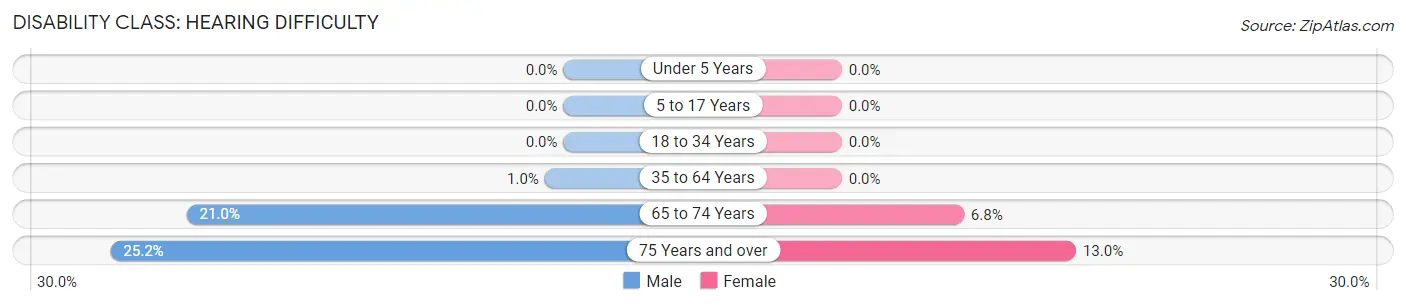
| Age Bracket | Male | Female |
| Under 5 Years | 0 (0.0%) | 0 (0.0%) |
| 5 to 17 Years | 0 (0.0%) | 0 (0.0%) |
| 18 to 34 Years | 0 (0.0%) | 0 (0.0%) |
| 35 to 64 Years | 11 (1.0%) | 0 (0.0%) |
| 65 to 74 Years | 103 (21.0%) | 30 (6.8%) |
| 75 Years and over | 58 (25.2%) | 45 (13.0%) |
Disability Class: Vision Difficulty
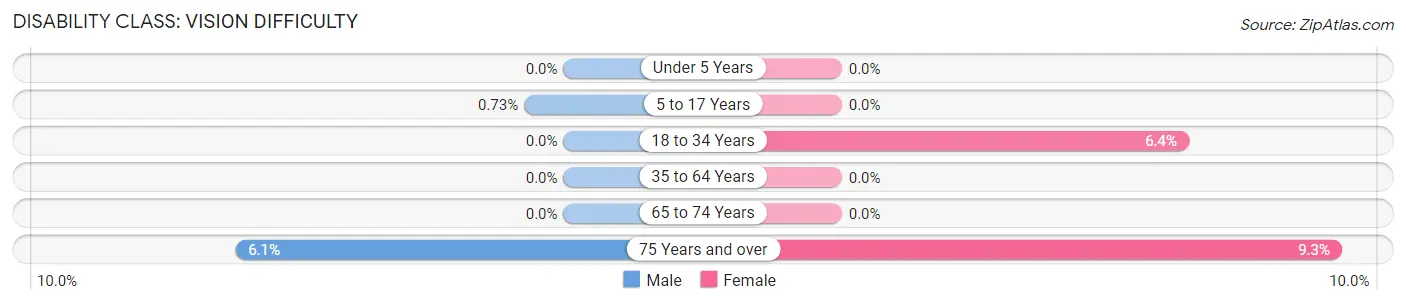
| Age Bracket | Male | Female |
| Under 5 Years | 0 (0.0%) | 0 (0.0%) |
| 5 to 17 Years | 3 (0.7%) | 0 (0.0%) |
| 18 to 34 Years | 0 (0.0%) | 56 (6.4%) |
| 35 to 64 Years | 0 (0.0%) | 0 (0.0%) |
| 65 to 74 Years | 0 (0.0%) | 0 (0.0%) |
| 75 Years and over | 14 (6.1%) | 32 (9.3%) |
Disability Class: Cognitive Difficulty
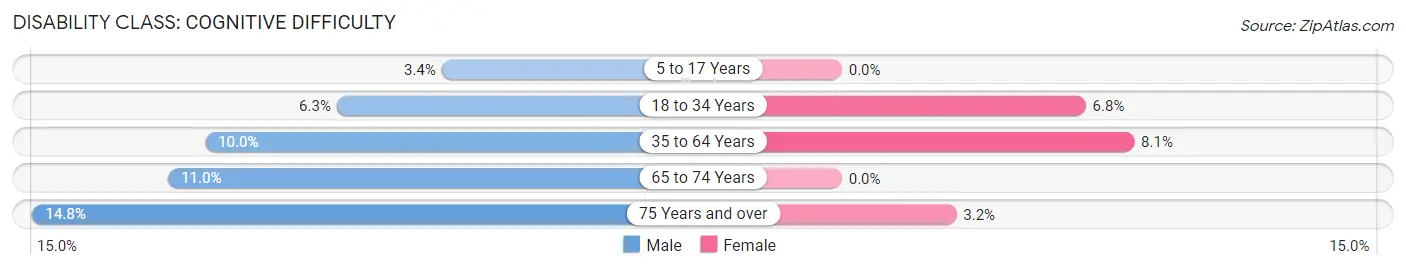
| Age Bracket | Male | Female |
| 5 to 17 Years | 14 (3.4%) | 0 (0.0%) |
| 18 to 34 Years | 45 (6.3%) | 59 (6.8%) |
| 35 to 64 Years | 105 (10.0%) | 119 (8.1%) |
| 65 to 74 Years | 54 (11.0%) | 0 (0.0%) |
| 75 Years and over | 34 (14.8%) | 11 (3.2%) |
Disability Class: Ambulatory Difficulty
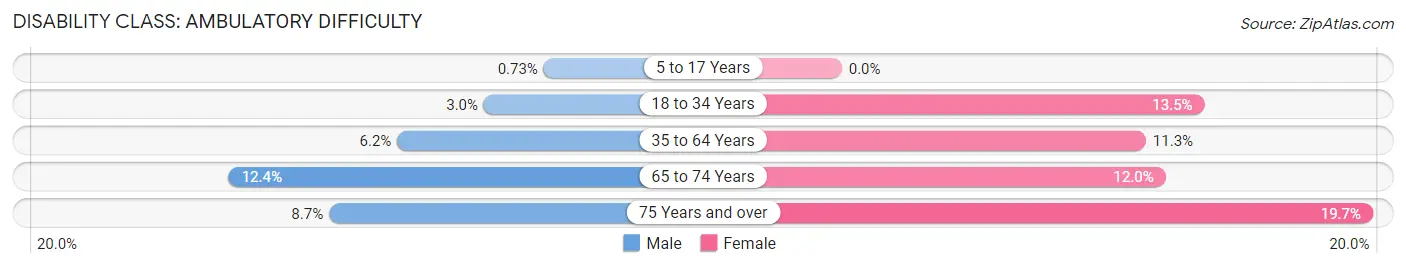
| Age Bracket | Male | Female |
| 5 to 17 Years | 3 (0.7%) | 0 (0.0%) |
| 18 to 34 Years | 21 (2.9%) | 117 (13.5%) |
| 35 to 64 Years | 65 (6.2%) | 165 (11.3%) |
| 65 to 74 Years | 61 (12.4%) | 53 (12.0%) |
| 75 Years and over | 20 (8.7%) | 68 (19.7%) |
Disability Class: Self-Care Difficulty
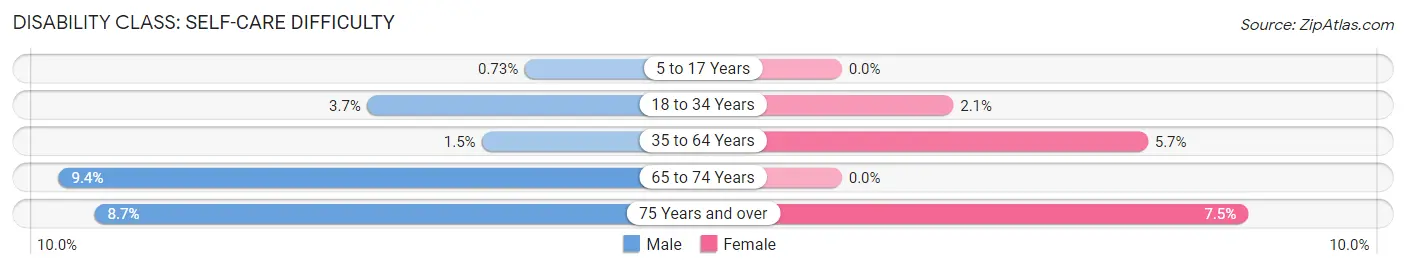
| Age Bracket | Male | Female |
| 5 to 17 Years | 3 (0.7%) | 0 (0.0%) |
| 18 to 34 Years | 26 (3.6%) | 18 (2.1%) |
| 35 to 64 Years | 16 (1.5%) | 83 (5.7%) |
| 65 to 74 Years | 46 (9.4%) | 0 (0.0%) |
| 75 Years and over | 20 (8.7%) | 26 (7.5%) |
Technology Access in Rockland
Computing Device Access in Rockland
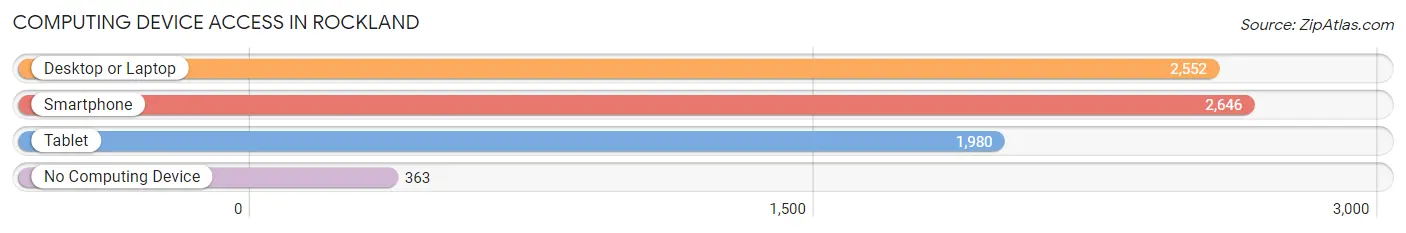
| Device Type | # Households | % Households |
| Desktop or Laptop | 2,552 | 75.7% |
| Smartphone | 2,646 | 78.5% |
| Tablet | 1,980 | 58.7% |
| No Computing Device | 363 | 10.8% |
| Total | 3,371 | 100.0% |
Internet Access in Rockland
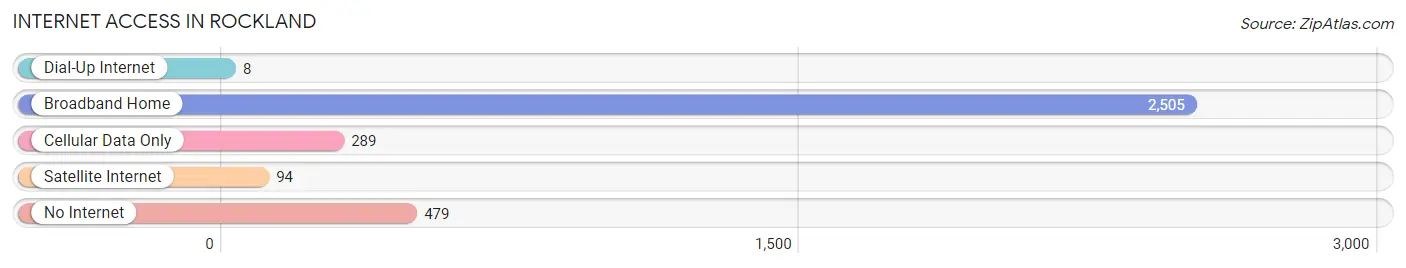
| Internet Type | # Households | % Households |
| Dial-Up Internet | 8 | 0.2% |
| Broadband Home | 2,505 | 74.3% |
| Cellular Data Only | 289 | 8.6% |
| Satellite Internet | 94 | 2.8% |
| No Internet | 479 | 14.2% |
| Total | 3,371 | 100.0% |
Rockland Summary
Rockland, Maine is a city located in Knox County, Maine, United States. It is the county seat of Knox County and is located on the coast of Penobscot Bay. The city has a population of 7,297 as of the 2010 census.
History
Rockland was first settled in 1771 by John Lermond and his family. The town was originally called “East Thomaston” and was incorporated in 1848. The name was changed to Rockland in 1850. The city was a major port for the granite industry, which began in the late 19th century. The city was also a major center for the shipbuilding industry, with several large shipyards located in the city.
Geography
Rockland is located at the head of Penobscot Bay, which is part of the Gulf of Maine. The city is situated on a peninsula, with the city center located on the east side of the peninsula. The city is bordered by the towns of Thomaston to the north, Owls Head to the east, South Thomaston to the south, and Rockport to the west. The city is located approximately 40 miles south of Bangor and 60 miles north of Portland.
Economy
Rockland’s economy is largely based on the fishing and seafood industries. The city is home to several seafood processing plants, as well as a number of fishing fleets. The city is also home to several boatbuilding companies, which produce recreational and commercial vessels. The city is also home to several retail stores, restaurants, and other businesses.
Demographics
As of the 2010 census, Rockland had a population of 7,297. The racial makeup of the city was 94.3% White, 1.2% African American, 0.4% Native American, 0.9% Asian, 0.1% Pacific Islander, 0.7% from other races, and 2.4% from two or more races. Hispanic or Latino of any race were 1.7% of the population.
The median income for a household in the city was $37,945, and the median income for a family was $45,945. The per capita income for the city was $20,945. About 11.3% of families and 14.2% of the population were below the poverty line, including 18.2% of those under age 18 and 8.2% of those age 65 or over.
Rockland is served by the Rockland School District, which includes four elementary schools, one middle school, and one high school. The city is also home to the Maine State Ferry Service, which provides service to the islands of Vinalhaven and North Haven. The city is also home to the Farnsworth Art Museum, which houses a large collection of works by American artists.
Common Questions
What is Per Capita Income in Rockland?
Per Capita income in Rockland is $30,507.
What is the Median Family Income in Rockland?
Median Family Income in Rockland is $74,577.
What is the Median Household income in Rockland?
Median Household Income in Rockland is $52,212.
What is Income or Wage Gap in Rockland?
Income or Wage Gap in Rockland is 35.3%.
Women in Rockland earn 64.7 cents for every dollar earned by a man.
What is Family Income Deficit in Rockland?
Family Income Deficit in Rockland is $15,650.
Families that are below poverty line in Rockland earn $15,650 less on average than the poverty threshold level.
What is Inequality or Gini Index in Rockland?
Inequality or Gini Index in Rockland is 0.44.
What is the Total Population of Rockland?
Total Population of Rockland is 6,986.
What is the Total Male Population of Rockland?
Total Male Population of Rockland is 3,142.
What is the Total Female Population of Rockland?
Total Female Population of Rockland is 3,844.
What is the Ratio of Males per 100 Females in Rockland?
There are 81.74 Males per 100 Females in Rockland.
What is the Ratio of Females per 100 Males in Rockland?
There are 122.34 Females per 100 Males in Rockland.
What is the Median Population Age in Rockland?
Median Population Age in Rockland is 45.3 Years.
What is the Average Family Size in Rockland
Average Family Size in Rockland is 2.8 People.
What is the Average Household Size in Rockland
Average Household Size in Rockland is 2.0 People.
How Large is the Labor Force in Rockland?
There are 3,633 People in the Labor Forcein in Rockland.
What is the Percentage of People in the Labor Force in Rockland?
60.8% of People are in the Labor Force in Rockland.
What is the Unemployment Rate in Rockland?
Unemployment Rate in Rockland is 6.5%.