Camden, ME Map & Demographics
Camden Map
Camden Overview
$48,439
PER CAPITA INCOME
$129,239
AVG FAMILY INCOME
$92,857
AVG HOUSEHOLD INCOME
0.42
INEQUALITY / GINI INDEX
3,644
TOTAL POPULATION
1,816
MALE POPULATION
1,828
FEMALE POPULATION
99.34
MALES / 100 FEMALES
100.66
FEMALES / 100 MALES
50.5
MEDIAN AGE
3.1
AVG FAMILY SIZE
2.2
AVG HOUSEHOLD SIZE
1,595
LABOR FORCE [ PEOPLE ]
53.2%
PERCENT IN LABOR FORCE
5.2%
UNEMPLOYMENT RATE
Camden Zip Codes
Camden Area Codes
Income in Camden
Income Overview in Camden
Per Capita Income in Camden is $48,439, while median incomes of families and households are $129,239 and $92,857 respectively.
| Characteristic | Number | Measure |
| Per Capita Income | 3,644 | $48,439 |
| Median Family Income | 752 | $129,239 |
| Mean Family Income | 752 | $147,088 |
| Median Household Income | 1,638 | $92,857 |
| Mean Household Income | 1,638 | $106,647 |
| Income Deficit | 752 | $0 |
| Wage / Income Gap (%) | 3,644 | 0.00% |
| Wage / Income Gap ($) | 3,644 | 100.00¢ per $1 |
| Gini / Inequality Index | 3,644 | 0.42 |
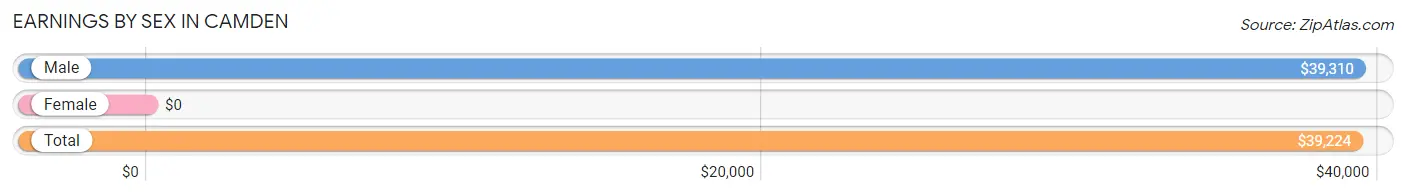
Earnings by Sex in Camden
| Sex | Number | Average Earnings |
| Male | 824 (52.1%) | $39,310 |
| Female | 758 (47.9%) | $0 |
| Total | 1,582 (100.0%) | $39,224 |
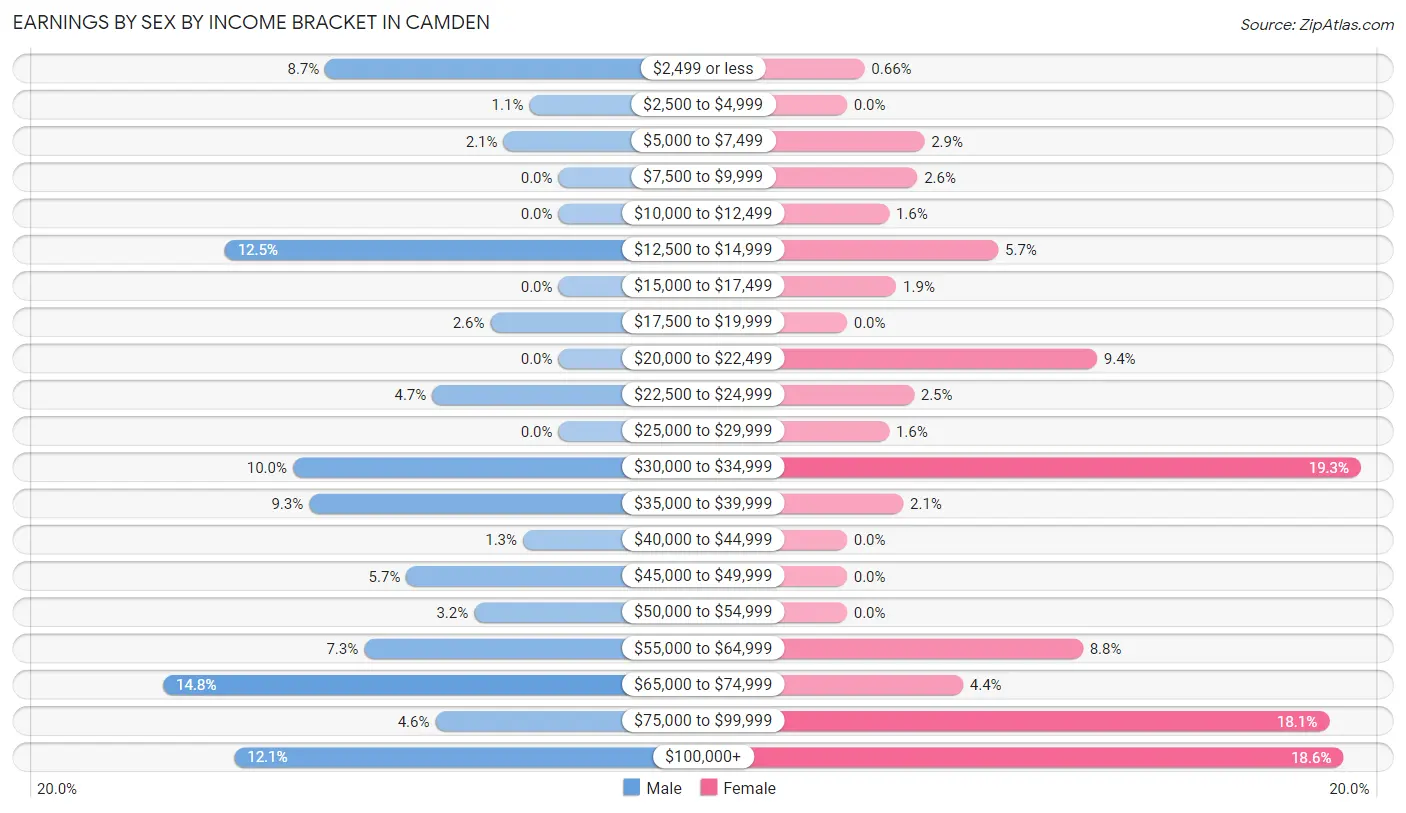
Earnings by Sex by Income Bracket in Camden
The most common earnings brackets in Camden are $65,000 to $74,999 for men (122 | 14.8%) and $30,000 to $34,999 for women (146 | 19.3%).
| Income | Male | Female |
| $2,499 or less | 72 (8.7%) | 5 (0.7%) |
| $2,500 to $4,999 | 9 (1.1%) | 0 (0.0%) |
| $5,000 to $7,499 | 17 (2.1%) | 22 (2.9%) |
| $7,500 to $9,999 | 0 (0.0%) | 20 (2.6%) |
| $10,000 to $12,499 | 0 (0.0%) | 12 (1.6%) |
| $12,500 to $14,999 | 103 (12.5%) | 43 (5.7%) |
| $15,000 to $17,499 | 0 (0.0%) | 14 (1.8%) |
| $17,500 to $19,999 | 21 (2.5%) | 0 (0.0%) |
| $20,000 to $22,499 | 0 (0.0%) | 71 (9.4%) |
| $22,500 to $24,999 | 39 (4.7%) | 19 (2.5%) |
| $25,000 to $29,999 | 0 (0.0%) | 12 (1.6%) |
| $30,000 to $34,999 | 82 (10.0%) | 146 (19.3%) |
| $35,000 to $39,999 | 77 (9.3%) | 16 (2.1%) |
| $40,000 to $44,999 | 11 (1.3%) | 0 (0.0%) |
| $45,000 to $49,999 | 47 (5.7%) | 0 (0.0%) |
| $50,000 to $54,999 | 26 (3.2%) | 0 (0.0%) |
| $55,000 to $64,999 | 60 (7.3%) | 67 (8.8%) |
| $65,000 to $74,999 | 122 (14.8%) | 33 (4.3%) |
| $75,000 to $99,999 | 38 (4.6%) | 137 (18.1%) |
| $100,000+ | 100 (12.1%) | 141 (18.6%) |
| Total | 824 (100.0%) | 758 (100.0%) |
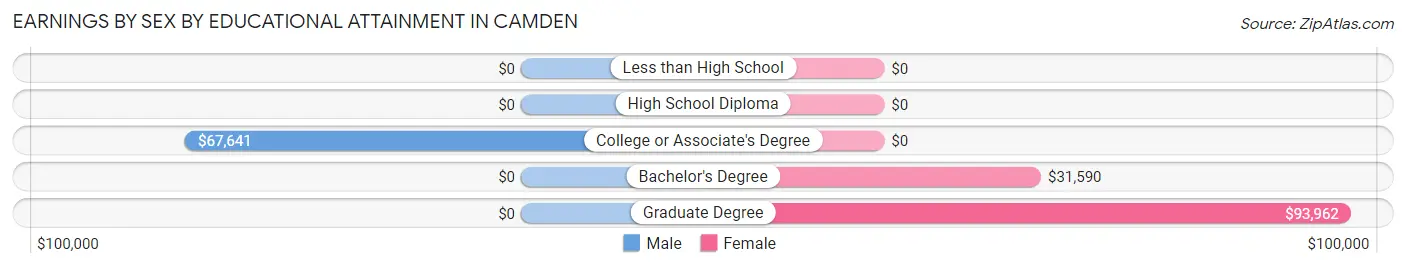
Earnings by Sex by Educational Attainment in Camden
Average earnings in Camden are $46,356 for men and $62,910 for women, a difference of 26.3%. Men with an educational attainment of college or associate's degree enjoy the highest average annual earnings of $67,641, while those with college or associate's degree education earn the least with $67,641. Women with an educational attainment of graduate degree earn the most with the average annual earnings of $93,962, while those with bachelor's degree education have the smallest earnings of $31,590.
| Educational Attainment | Male Income | Female Income |
| Less than High School | - | - |
| High School Diploma | - | - |
| College or Associate's Degree | $67,641 | $0 |
| Bachelor's Degree | - | - |
| Graduate Degree | - | - |
| Total | $46,356 | $62,910 |
Family Income in Camden
Family Income Brackets in Camden
According to the Camden family income data, there are 190 families falling into the $100,000 to $149,999 income range, which is the most common income bracket and makes up 25.3% of all families.
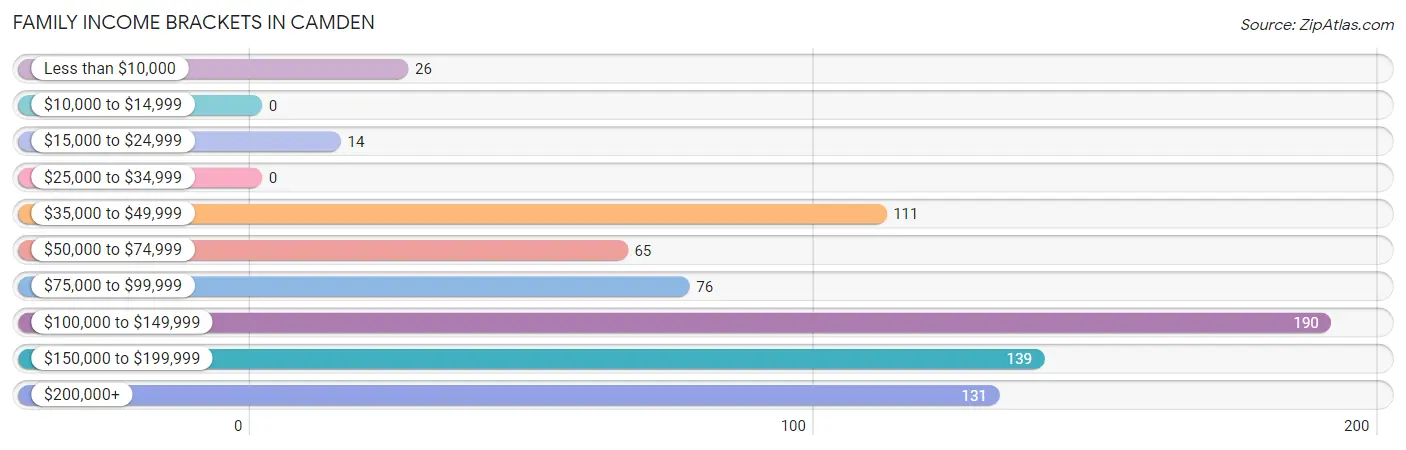
| Income Bracket | # Families | % Families |
| Less than $10,000 | 26 | 3.5% |
| $10,000 to $14,999 | 0 | 0.0% |
| $15,000 to $24,999 | 14 | 1.9% |
| $25,000 to $34,999 | 0 | 0.0% |
| $35,000 to $49,999 | 111 | 14.8% |
| $50,000 to $74,999 | 65 | 8.6% |
| $75,000 to $99,999 | 76 | 10.1% |
| $100,000 to $149,999 | 190 | 25.3% |
| $150,000 to $199,999 | 139 | 18.5% |
| $200,000+ | 131 | 17.4% |
Family Income by Famaliy Size in Camden
4-person families (85 | 11.3%) account for the highest median family income in Camden with $250,001 per family, while 2-person families (400 | 53.2%) have the highest median income of $65,000 per family member.
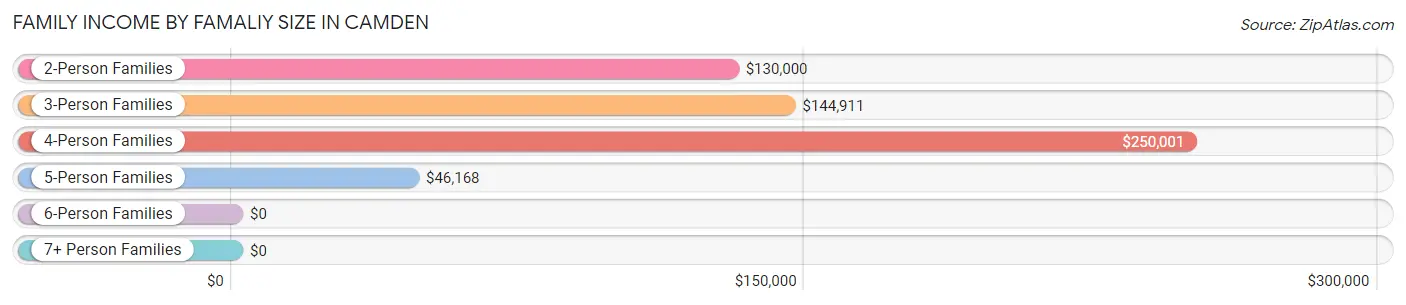
| Income Bracket | # Families | Median Income |
| 2-Person Families | 400 (53.2%) | $130,000 |
| 3-Person Families | 129 (17.2%) | $144,911 |
| 4-Person Families | 85 (11.3%) | $250,001 |
| 5-Person Families | 138 (18.3%) | $46,168 |
| 6-Person Families | 0 (0.0%) | $0 |
| 7+ Person Families | 0 (0.0%) | $0 |
| Total | 752 (100.0%) | $129,239 |
Family Income by Number of Earners in Camden
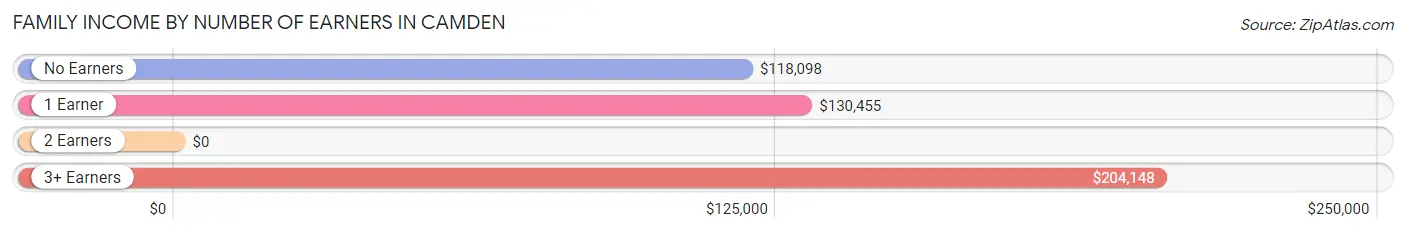
| Number of Earners | # Families | Median Income |
| No Earners | 235 (31.2%) | $118,098 |
| 1 Earner | 230 (30.6%) | $130,455 |
| 2 Earners | 234 (31.1%) | $0 |
| 3+ Earners | 53 (7.0%) | $204,148 |
| Total | 752 (100.0%) | $129,239 |
Household Income in Camden
Household Income Brackets in Camden
With 347 households falling in the category, the $100,000 to $149,999 income range is the most frequent in Camden, accounting for 21.2% of all households. In contrast, only 26 households (1.6%) fall into the less than $10,000 income bracket, making it the least populous group.
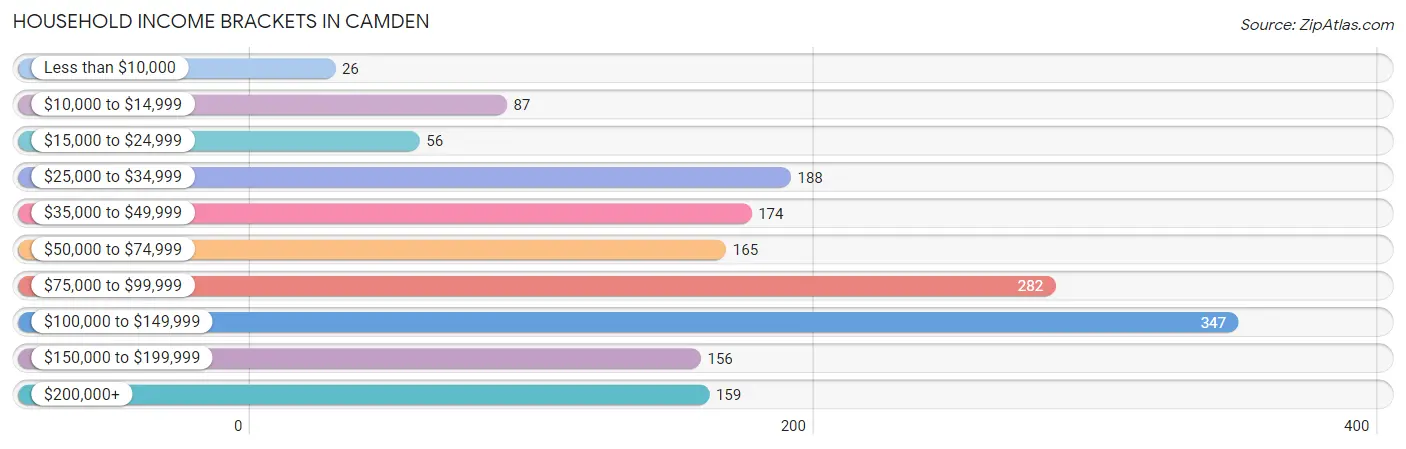
| Income Bracket | # Households | % Households |
| Less than $10,000 | 26 | 1.6% |
| $10,000 to $14,999 | 87 | 5.3% |
| $15,000 to $24,999 | 56 | 3.4% |
| $25,000 to $34,999 | 188 | 11.5% |
| $35,000 to $49,999 | 174 | 10.6% |
| $50,000 to $74,999 | 165 | 10.1% |
| $75,000 to $99,999 | 282 | 17.2% |
| $100,000 to $149,999 | 347 | 21.2% |
| $150,000 to $199,999 | 156 | 9.5% |
| $200,000+ | 159 | 9.7% |
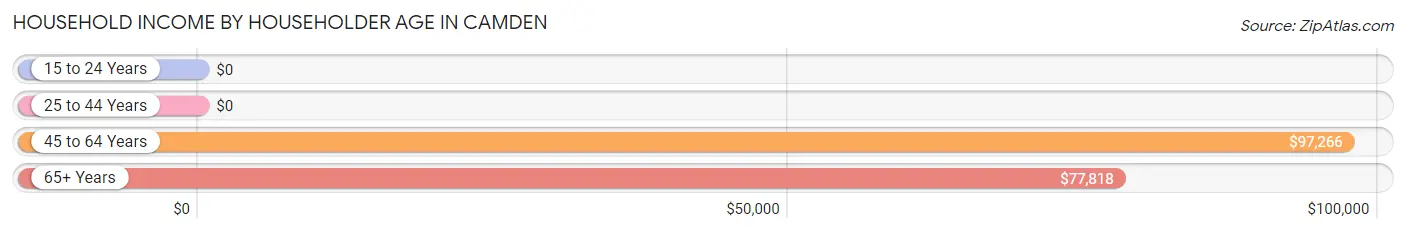
Household Income by Householder Age in Camden
The median household income in Camden is $92,857, with the highest median household income of $97,266 found in the 45 to 64 years age bracket for the primary householder. A total of 589 households (36.0%) fall into this category. Meanwhile, the 15 to 24 years age bracket for the primary householder has the lowest median household income of $0, with 24 households (1.5%) in this group.
| Income Bracket | # Households | Median Income |
| 15 to 24 Years | 24 (1.5%) | $0 |
| 25 to 44 Years | 169 (10.3%) | $0 |
| 45 to 64 Years | 589 (36.0%) | $97,266 |
| 65+ Years | 856 (52.3%) | $77,818 |
| Total | 1,638 (100.0%) | $92,857 |
Poverty in Camden
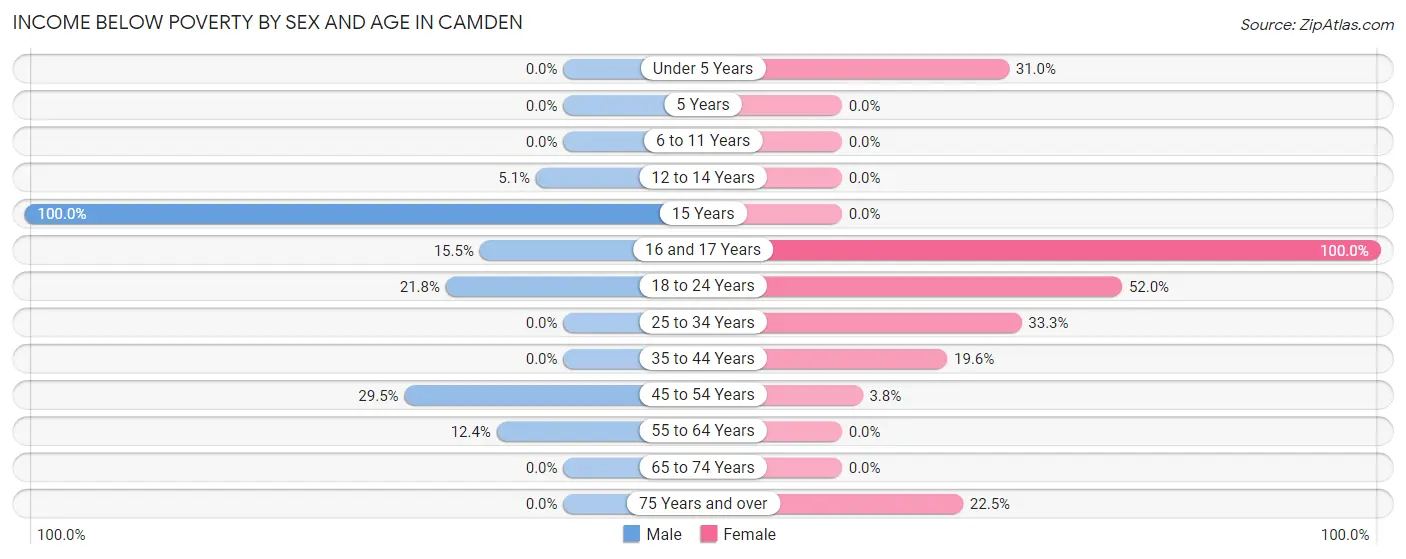
Income Below Poverty by Sex and Age in Camden
With 9.6% poverty level for males and 11.9% for females among the residents of Camden, 15 year old males and 16 and 17 year old females are the most vulnerable to poverty, with 11 males (100.0%) and 17 females (100.0%) in their respective age groups living below the poverty level.
| Age Bracket | Male | Female |
| Under 5 Years | 0 (0.0%) | 22 (31.0%) |
| 5 Years | 0 (0.0%) | 0 (0.0%) |
| 6 to 11 Years | 0 (0.0%) | 0 (0.0%) |
| 12 to 14 Years | 11 (5.1%) | 0 (0.0%) |
| 15 Years | 11 (100.0%) | 0 (0.0%) |
| 16 and 17 Years | 18 (15.5%) | 17 (100.0%) |
| 18 to 24 Years | 24 (21.8%) | 26 (52.0%) |
| 25 to 34 Years | 0 (0.0%) | 22 (33.3%) |
| 35 to 44 Years | 0 (0.0%) | 26 (19.6%) |
| 45 to 54 Years | 82 (29.5%) | 14 (3.8%) |
| 55 to 64 Years | 24 (12.4%) | 0 (0.0%) |
| 65 to 74 Years | 0 (0.0%) | 0 (0.0%) |
| 75 Years and over | 0 (0.0%) | 87 (22.5%) |
| Total | 170 (9.6%) | 214 (11.9%) |
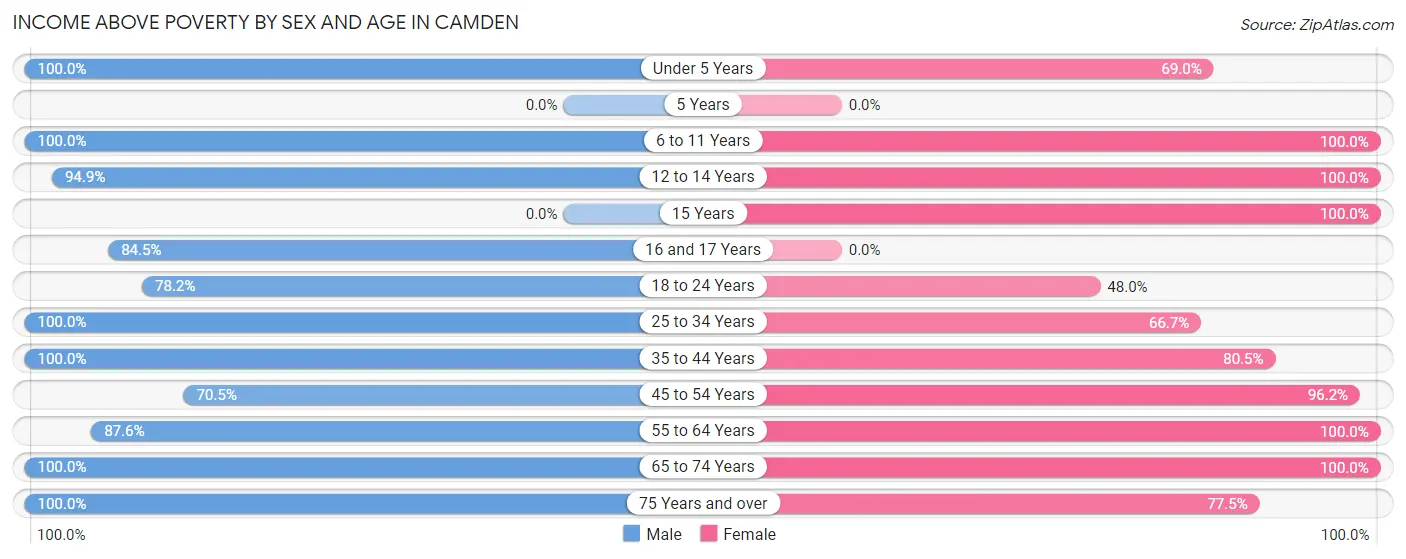
Income Above Poverty by Sex and Age in Camden
According to the poverty statistics in Camden, males aged under 5 years and females aged 6 to 11 years are the age groups that are most secure financially, with 100.0% of males and 100.0% of females in these age groups living above the poverty line.
| Age Bracket | Male | Female |
| Under 5 Years | 26 (100.0%) | 49 (69.0%) |
| 5 Years | 0 (0.0%) | 0 (0.0%) |
| 6 to 11 Years | 85 (100.0%) | 195 (100.0%) |
| 12 to 14 Years | 205 (94.9%) | 17 (100.0%) |
| 15 Years | 0 (0.0%) | 24 (100.0%) |
| 16 and 17 Years | 98 (84.5%) | 0 (0.0%) |
| 18 to 24 Years | 86 (78.2%) | 24 (48.0%) |
| 25 to 34 Years | 86 (100.0%) | 44 (66.7%) |
| 35 to 44 Years | 181 (100.0%) | 107 (80.4%) |
| 45 to 54 Years | 196 (70.5%) | 352 (96.2%) |
| 55 to 64 Years | 170 (87.6%) | 155 (100.0%) |
| 65 to 74 Years | 199 (100.0%) | 311 (100.0%) |
| 75 Years and over | 273 (100.0%) | 300 (77.5%) |
| Total | 1,605 (90.4%) | 1,578 (88.1%) |
Income Below Poverty Among Married-Couple Families in Camden
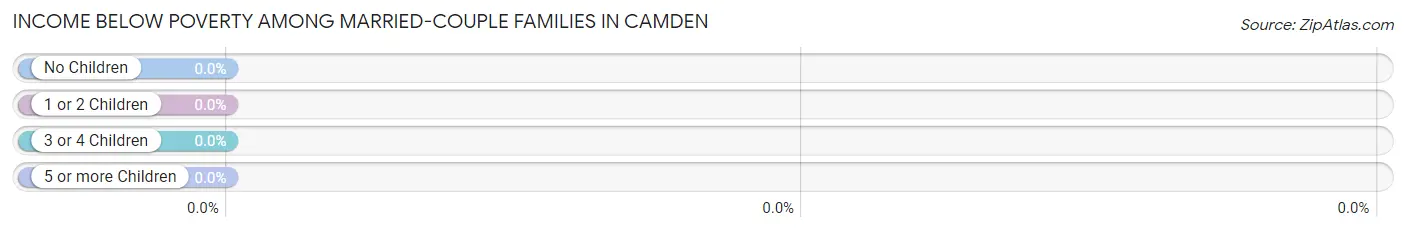
| Children | Above Poverty | Below Poverty |
| No Children | 381 (100.0%) | 0 (0.0%) |
| 1 or 2 Children | 106 (100.0%) | 0 (0.0%) |
| 3 or 4 Children | 20 (100.0%) | 0 (0.0%) |
| 5 or more Children | 0 (0.0%) | 0 (0.0%) |
| Total | 507 (100.0%) | 0 (0.0%) |
Income Below Poverty Among Single-Parent Households in Camden
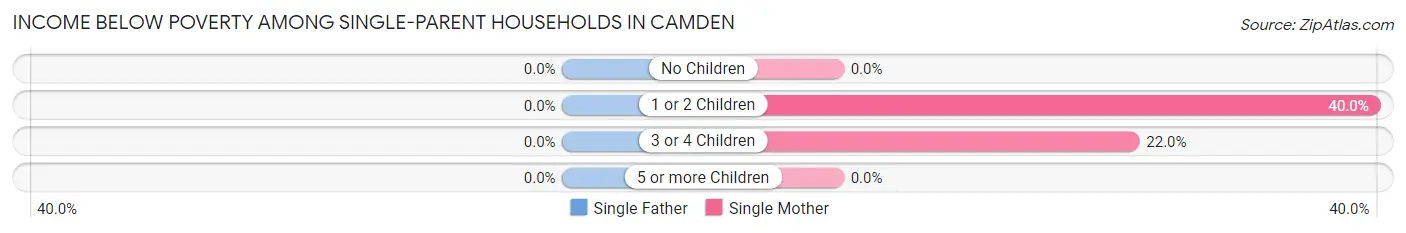
| Children | Single Father | Single Mother |
| No Children | 0 (0.0%) | 0 (0.0%) |
| 1 or 2 Children | 0 (0.0%) | 14 (40.0%) |
| 3 or 4 Children | 0 (0.0%) | 26 (22.0%) |
| 5 or more Children | 0 (0.0%) | 0 (0.0%) |
| Total | 0 (0.0%) | 40 (19.4%) |
Income Below Poverty Among Married-Couple vs Single-Parent Households in Camden
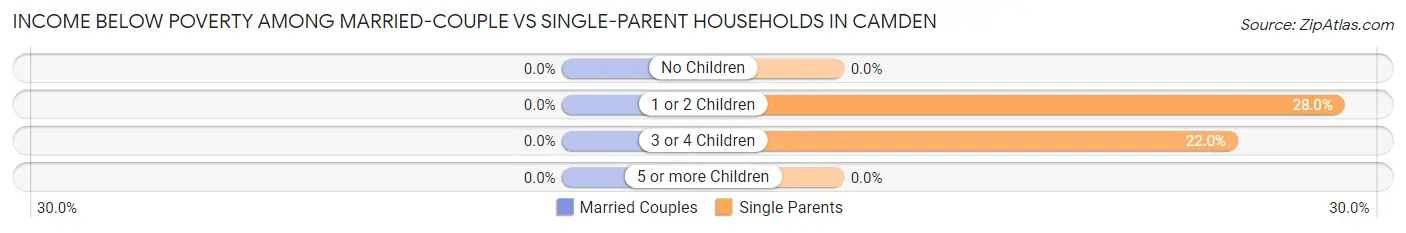
| Children | Married-Couple Families | Single-Parent Households |
| No Children | 0 (0.0%) | 0 (0.0%) |
| 1 or 2 Children | 0 (0.0%) | 14 (28.0%) |
| 3 or 4 Children | 0 (0.0%) | 26 (22.0%) |
| 5 or more Children | 0 (0.0%) | 0 (0.0%) |
| Total | 0 (0.0%) | 40 (16.3%) |
Race in Camden
The most populous races in Camden are White / Caucasian (3,463 | 95.0%), Two or more Races (181 | 5.0%), and Hispanic or Latino (92 | 2.5%).
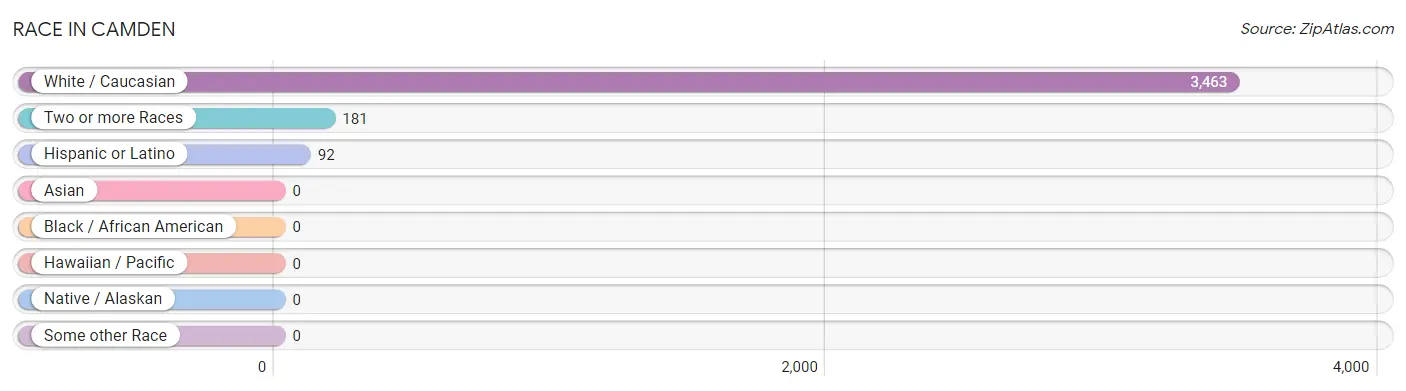
| Race | # Population | % Population |
| Asian | 0 | 0.0% |
| Black / African American | 0 | 0.0% |
| Hawaiian / Pacific | 0 | 0.0% |
| Hispanic or Latino | 92 | 2.5% |
| Native / Alaskan | 0 | 0.0% |
| White / Caucasian | 3,463 | 95.0% |
| Two or more Races | 181 | 5.0% |
| Some other Race | 0 | 0.0% |
| Total | 3,644 | 100.0% |
Ancestry in Camden
The most populous ancestries reported in Camden are English (895 | 24.6%), Irish (650 | 17.8%), German (410 | 11.3%), Italian (328 | 9.0%), and American (197 | 5.4%), together accounting for 68.1% of all Camden residents.
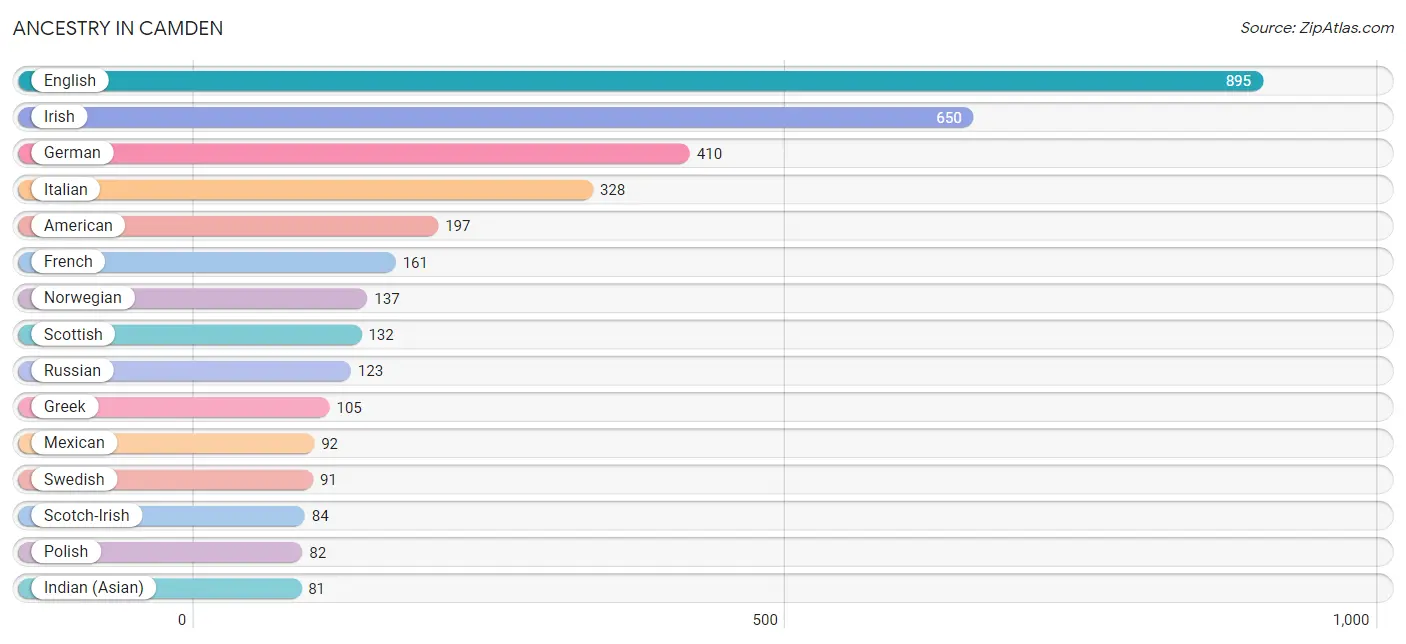
| Ancestry | # Population | % Population |
| American | 197 | 5.4% |
| Arab | 55 | 1.5% |
| Austrian | 77 | 2.1% |
| British | 59 | 1.6% |
| Canadian | 38 | 1.0% |
| Czech | 14 | 0.4% |
| Danish | 11 | 0.3% |
| Dutch | 19 | 0.5% |
| Eastern European | 22 | 0.6% |
| English | 895 | 24.6% |
| European | 77 | 2.1% |
| French | 161 | 4.4% |
| French Canadian | 64 | 1.8% |
| German | 410 | 11.3% |
| Greek | 105 | 2.9% |
| Indian (Asian) | 81 | 2.2% |
| Irish | 650 | 17.8% |
| Italian | 328 | 9.0% |
| Lebanese | 55 | 1.5% |
| Mexican | 92 | 2.5% |
| Norwegian | 137 | 3.8% |
| Polish | 82 | 2.2% |
| Russian | 123 | 3.4% |
| Scotch-Irish | 84 | 2.3% |
| Scottish | 132 | 3.6% |
| Swedish | 91 | 2.5% |
| Welsh | 73 | 2.0% | View All 27 Rows |
Immigrants in Camden
The most numerous immigrant groups reported in Camden came from Europe (161 | 4.4%), Eastern Europe (80 | 2.2%), Russia (80 | 2.2%), Asia (67 | 1.8%), and China (67 | 1.8%), together accounting for 12.5% of all Camden residents.
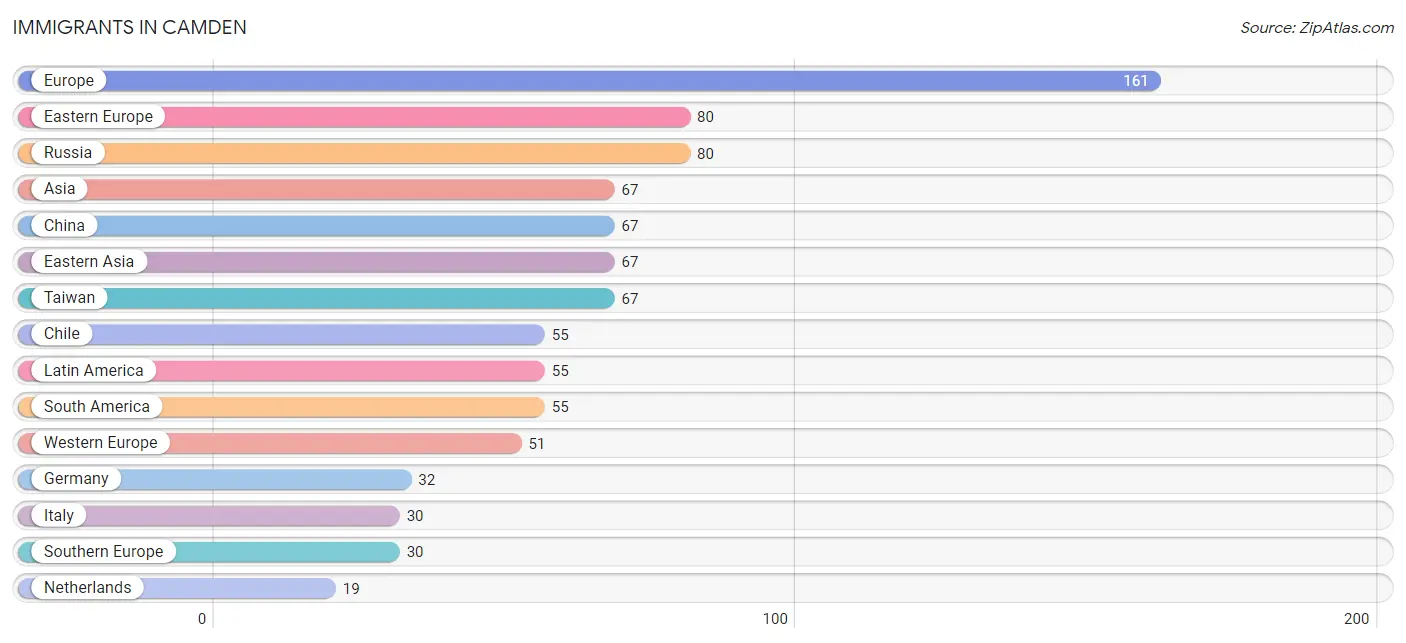
| Immigration Origin | # Population | % Population |
| Asia | 67 | 1.8% |
| Chile | 55 | 1.5% |
| China | 67 | 1.8% |
| Eastern Asia | 67 | 1.8% |
| Eastern Europe | 80 | 2.2% |
| Europe | 161 | 4.4% |
| Germany | 32 | 0.9% |
| Italy | 30 | 0.8% |
| Latin America | 55 | 1.5% |
| Netherlands | 19 | 0.5% |
| Russia | 80 | 2.2% |
| South America | 55 | 1.5% |
| Southern Europe | 30 | 0.8% |
| Taiwan | 67 | 1.8% |
| Western Europe | 51 | 1.4% | View All 15 Rows |
Sex and Age in Camden
Sex and Age in Camden
The most populous age groups in Camden are 15 to 19 Years (237 | 13.1%) for men and 75 to 79 Years (259 | 14.2%) for women.
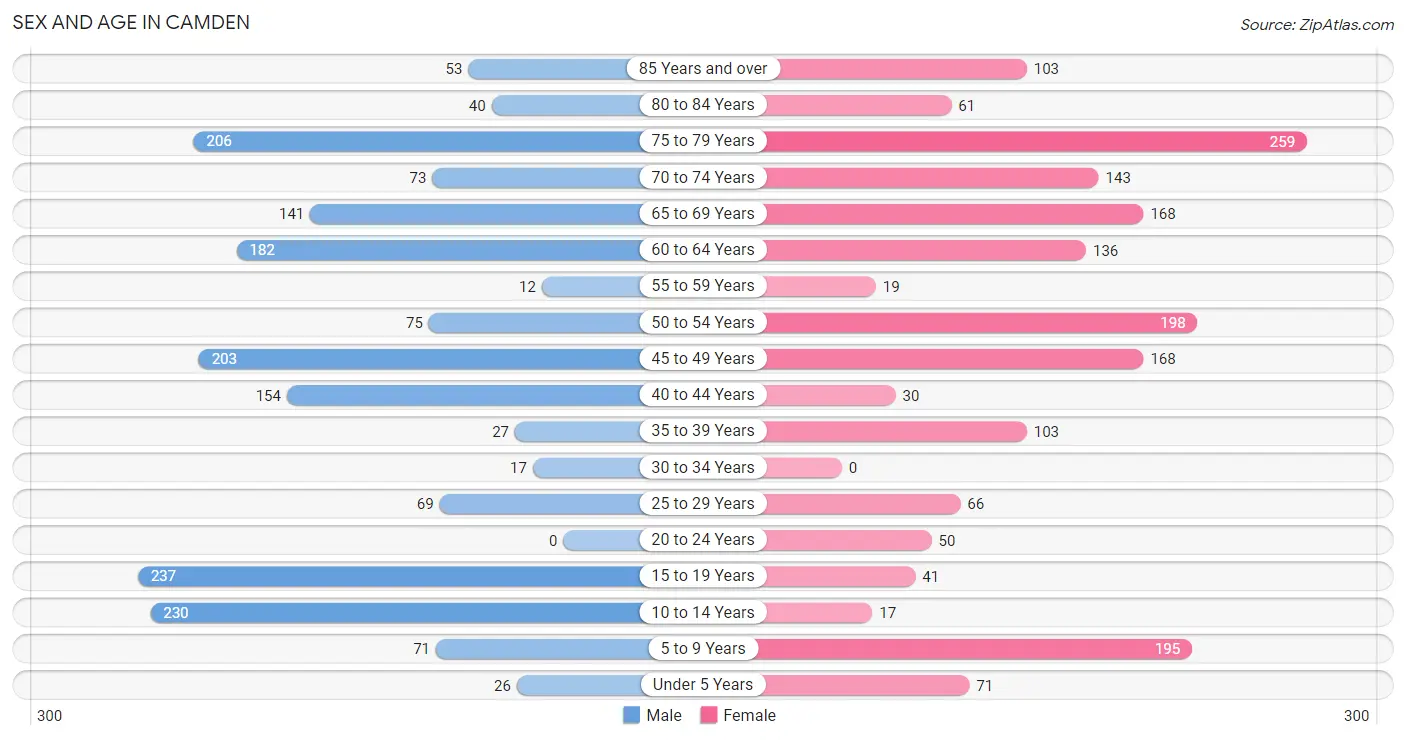
| Age Bracket | Male | Female |
| Under 5 Years | 26 (1.4%) | 71 (3.9%) |
| 5 to 9 Years | 71 (3.9%) | 195 (10.7%) |
| 10 to 14 Years | 230 (12.7%) | 17 (0.9%) |
| 15 to 19 Years | 237 (13.1%) | 41 (2.2%) |
| 20 to 24 Years | 0 (0.0%) | 50 (2.7%) |
| 25 to 29 Years | 69 (3.8%) | 66 (3.6%) |
| 30 to 34 Years | 17 (0.9%) | 0 (0.0%) |
| 35 to 39 Years | 27 (1.5%) | 103 (5.6%) |
| 40 to 44 Years | 154 (8.5%) | 30 (1.6%) |
| 45 to 49 Years | 203 (11.2%) | 168 (9.2%) |
| 50 to 54 Years | 75 (4.1%) | 198 (10.8%) |
| 55 to 59 Years | 12 (0.7%) | 19 (1.0%) |
| 60 to 64 Years | 182 (10.0%) | 136 (7.4%) |
| 65 to 69 Years | 141 (7.8%) | 168 (9.2%) |
| 70 to 74 Years | 73 (4.0%) | 143 (7.8%) |
| 75 to 79 Years | 206 (11.3%) | 259 (14.2%) |
| 80 to 84 Years | 40 (2.2%) | 61 (3.3%) |
| 85 Years and over | 53 (2.9%) | 103 (5.6%) |
| Total | 1,816 (100.0%) | 1,828 (100.0%) |
Families and Households in Camden
Median Family Size in Camden
The median family size in Camden is 3.14 persons per family, with single female/mother families (206 | 27.4%) accounting for the largest median family size of 4.37 persons per family. On the other hand, married-couple families (507 | 67.4%) represent the smallest median family size with 2.63 persons per family.
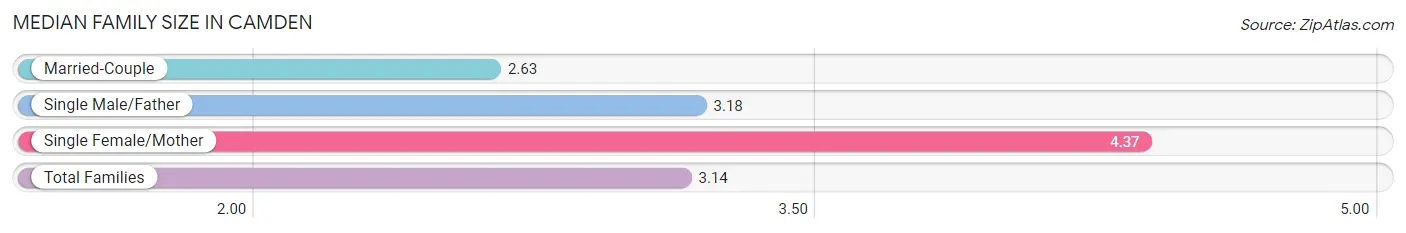
| Family Type | # Families | Family Size |
| Married-Couple | 507 (67.4%) | 2.63 |
| Single Male/Father | 39 (5.2%) | 3.18 |
| Single Female/Mother | 206 (27.4%) | 4.37 |
| Total Families | 752 (100.0%) | 3.14 |
Median Household Size in Camden
The median household size in Camden is 2.17 persons per household, with single female/mother households (206 | 12.6%) accounting for the largest median household size of 4.92 persons per household. non-family households (886 | 54.1%) represent the smallest median household size with 1.18 persons per household.
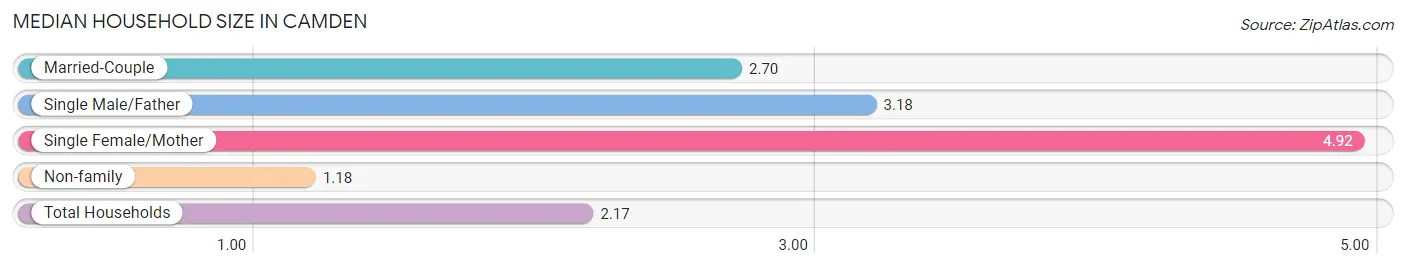
| Household Type | # Households | Household Size |
| Married-Couple | 507 (30.9%) | 2.70 |
| Single Male/Father | 39 (2.4%) | 3.18 |
| Single Female/Mother | 206 (12.6%) | 4.92 |
| Non-family | 886 (54.1%) | 1.18 |
| Total Households | 1,638 (100.0%) | 2.17 |
Household Size by Marriage Status in Camden
Out of a total of 1,638 households in Camden, 752 (45.9%) are family households, while 886 (54.1%) are nonfamily households. The most numerous type of family households are 2-person households, comprising 336, and the most common type of nonfamily households are 1-person households, comprising 740.
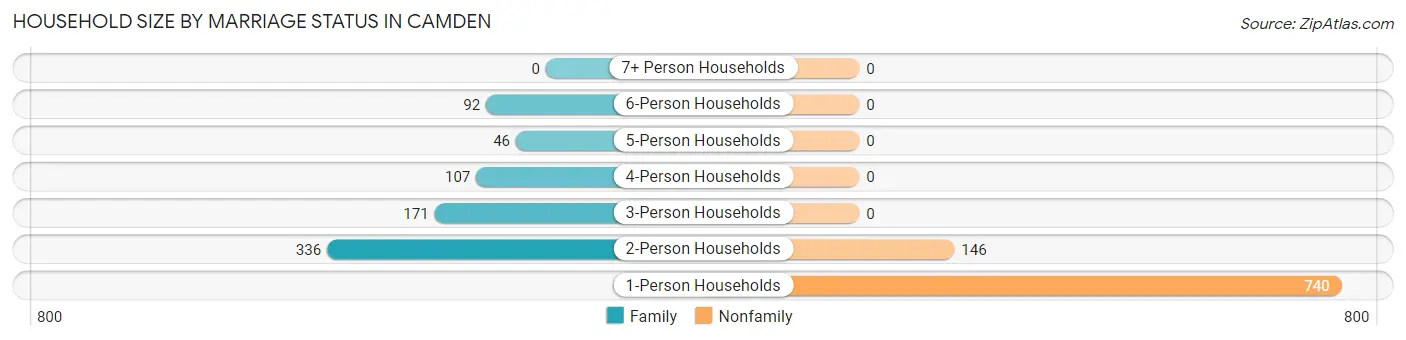
| Household Size | Family Households | Nonfamily Households |
| 1-Person Households | - | 740 (45.2%) |
| 2-Person Households | 336 (20.5%) | 146 (8.9%) |
| 3-Person Households | 171 (10.4%) | 0 (0.0%) |
| 4-Person Households | 107 (6.5%) | 0 (0.0%) |
| 5-Person Households | 46 (2.8%) | 0 (0.0%) |
| 6-Person Households | 92 (5.6%) | 0 (0.0%) |
| 7+ Person Households | 0 (0.0%) | 0 (0.0%) |
| Total | 752 (45.9%) | 886 (54.1%) |
Female Fertility in Camden
Fertility by Age in Camden
Average fertility rate in Camden is 83.0 births per 1,000 women. Women in the age bracket of 35 to 50 years have the highest fertility rate with 116.0 births per 1,000 women. Women in the age bracket of 35 to 50 years acount for 100.0% of all women with births.
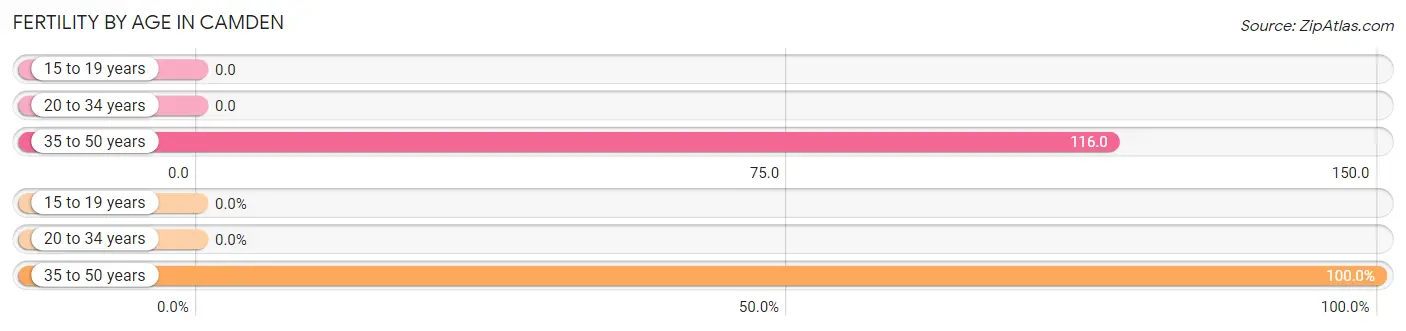
| Age Bracket | Women with Births | Births / 1,000 Women |
| 15 to 19 years | 0 (0.0%) | 0.0 |
| 20 to 34 years | 0 (0.0%) | 0.0 |
| 35 to 50 years | 46 (100.0%) | 116.0 |
| Total | 46 (100.0%) | 83.0 |
Fertility by Age by Marriage Status in Camden
43.5% of women with births (46) in Camden are married. The highest percentage of unmarried women with births falls into 35 to 50 years age bracket with 56.5% of them unmarried at the time of birth, while the lowest percentage of unmarried women with births belong to 35 to 50 years age bracket with 56.5% of them unmarried.
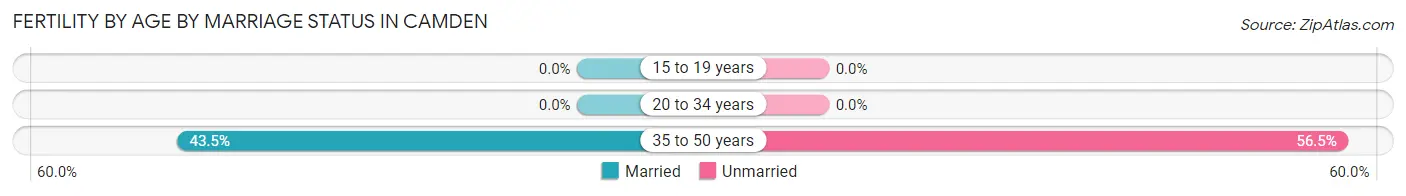
| Age Bracket | Married | Unmarried |
| 15 to 19 years | 0 (0.0%) | 0 (0.0%) |
| 20 to 34 years | 0 (0.0%) | 0 (0.0%) |
| 35 to 50 years | 20 (43.5%) | 26 (56.5%) |
| Total | 20 (43.5%) | 26 (56.5%) |
Fertility by Education in Camden
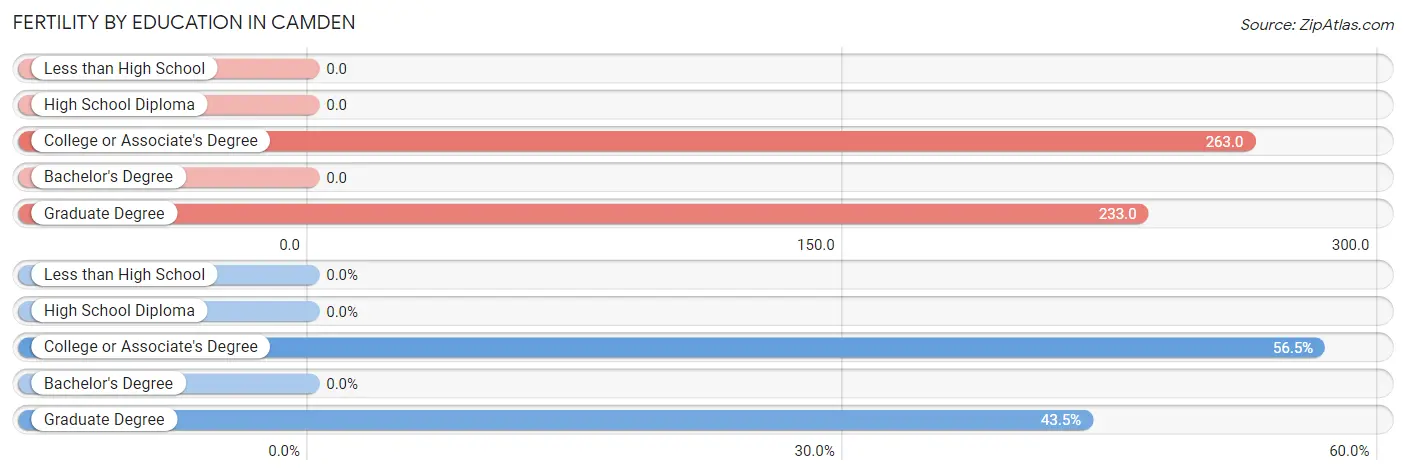
| Educational Attainment | Women with Births | Births / 1,000 Women |
| Less than High School | 0 (0.0%) | 0.0 |
| High School Diploma | 0 (0.0%) | 0.0 |
| College or Associate's Degree | 26 (56.5%) | 263.0 |
| Bachelor's Degree | 0 (0.0%) | 0.0 |
| Graduate Degree | 20 (43.5%) | 233.0 |
| Total | 46 (100.0%) | 83.0 |
Fertility by Education by Marriage Status in Camden
56.5% of women with births in Camden are unmarried. Women with the educational attainment of graduate degree are most likely to be married with 100.0% of them married at childbirth, while women with the educational attainment of college or associate's degree are least likely to be married with 100.0% of them unmarried at childbirth.
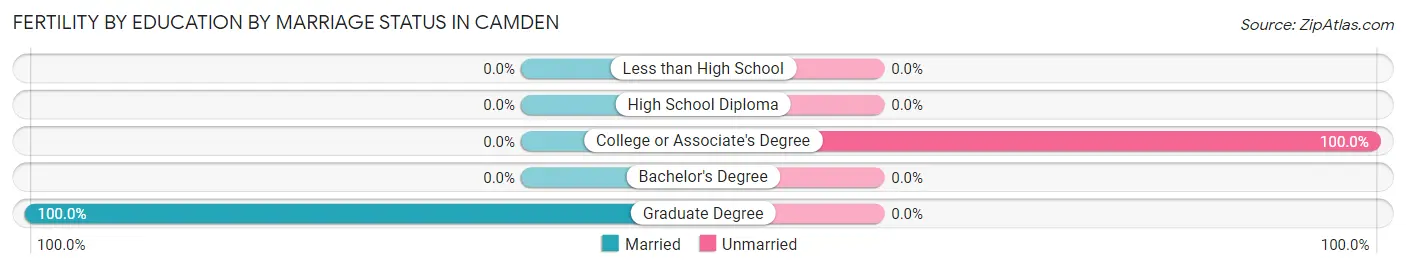
| Educational Attainment | Married | Unmarried |
| Less than High School | 0 (0.0%) | 0 (0.0%) |
| High School Diploma | 0 (0.0%) | 0 (0.0%) |
| College or Associate's Degree | 0 (0.0%) | 26 (100.0%) |
| Bachelor's Degree | 0 (0.0%) | 0 (0.0%) |
| Graduate Degree | 20 (100.0%) | 0 (0.0%) |
| Total | 20 (43.5%) | 26 (56.5%) |
Employment Characteristics in Camden
Employment by Class of Employer in Camden
Among the 1,441 employed individuals in Camden, private company employees (810 | 56.2%), not-for-profit organizations (240 | 16.7%), and self-employed (not incorporated) (121 | 8.4%) make up the most common classes of employment.
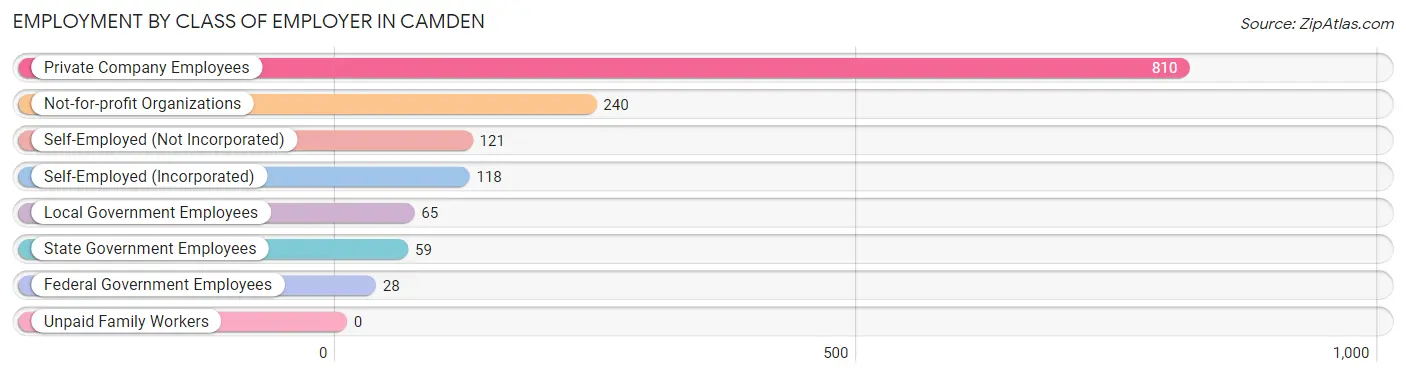
| Employer Class | # Employees | % Employees |
| Private Company Employees | 810 | 56.2% |
| Self-Employed (Incorporated) | 118 | 8.2% |
| Self-Employed (Not Incorporated) | 121 | 8.4% |
| Not-for-profit Organizations | 240 | 16.7% |
| Local Government Employees | 65 | 4.5% |
| State Government Employees | 59 | 4.1% |
| Federal Government Employees | 28 | 1.9% |
| Unpaid Family Workers | 0 | 0.0% |
| Total | 1,441 | 100.0% |
Employment Status by Age in Camden
According to the labor force statistics for Camden, out of the total population over 16 years of age (2,999), 53.2% or 1,595 individuals are in the labor force, with 5.2% or 83 of them unemployed. The age group with the highest labor force participation rate is 30 to 34 years, with 100.0% or 17 individuals in the labor force. Within the labor force, the 16 to 19 years age range has the highest percentage of unemployed individuals, with 49.0% or 77 of them being unemployed.
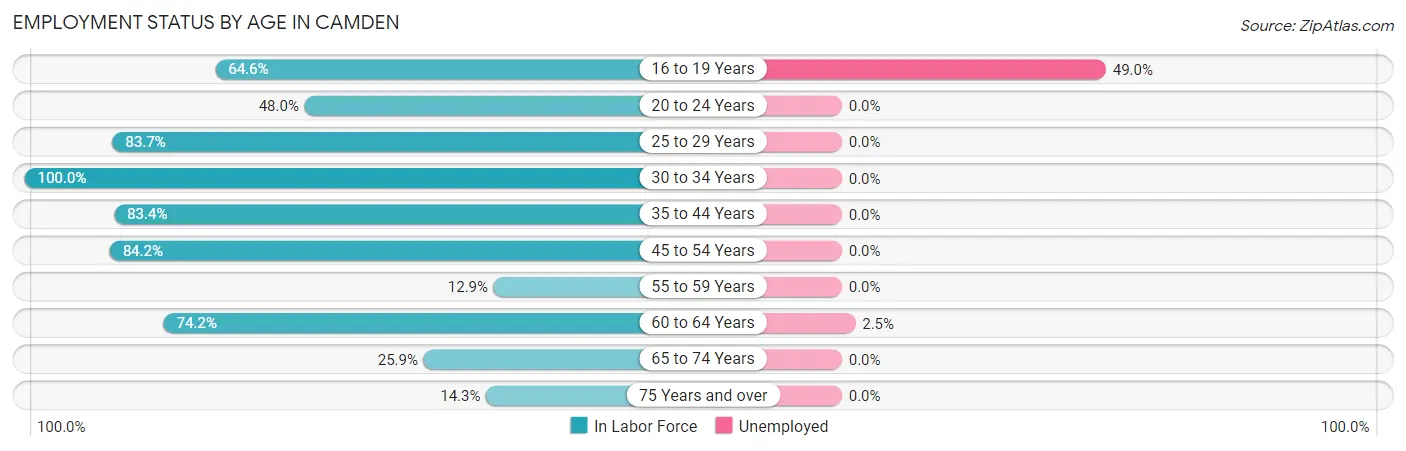
| Age Bracket | In Labor Force | Unemployed |
| 16 to 19 Years | 157 (64.6%) | 77 (49.0%) |
| 20 to 24 Years | 24 (48.0%) | 0 (0.0%) |
| 25 to 29 Years | 113 (83.7%) | 0 (0.0%) |
| 30 to 34 Years | 17 (100.0%) | 0 (0.0%) |
| 35 to 44 Years | 262 (83.4%) | 0 (0.0%) |
| 45 to 54 Years | 542 (84.2%) | 0 (0.0%) |
| 55 to 59 Years | 4 (12.9%) | 0 (0.0%) |
| 60 to 64 Years | 236 (74.2%) | 6 (2.5%) |
| 65 to 74 Years | 136 (25.9%) | 0 (0.0%) |
| 75 Years and over | 103 (14.3%) | 0 (0.0%) |
| Total | 1,595 (53.2%) | 83 (5.2%) |
Employment Status by Educational Attainment in Camden
According to labor force statistics for Camden, 80.5% of individuals (1,174) out of the total population between 25 and 64 years of age (1,459) are in the labor force, with 0.5% or 6 of them being unemployed. The group with the highest labor force participation rate are those with the educational attainment of bachelor's degree or higher, with 86.5% or 789 individuals in the labor force. Within the labor force, individuals with bachelor's degree or higher education have the highest percentage of unemployment, with 0.8% or 6 of them being unemployed.
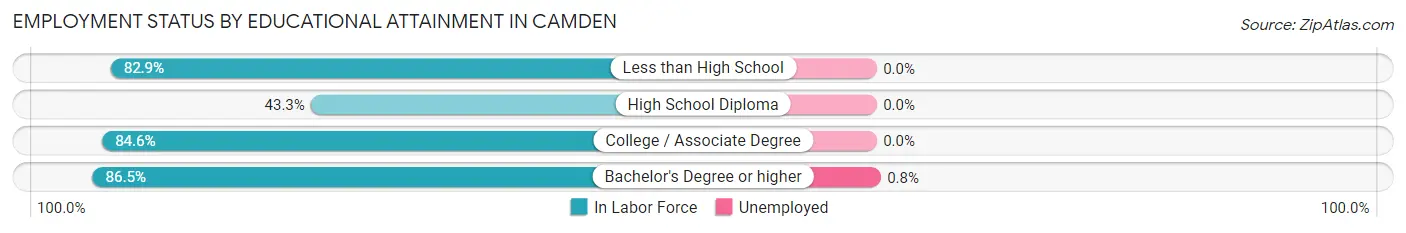
| Educational Attainment | In Labor Force | Unemployed |
| Less than High School | 29 (82.9%) | 0 (0.0%) |
| High School Diploma | 81 (43.3%) | 0 (0.0%) |
| College / Associate Degree | 275 (84.6%) | 0 (0.0%) |
| Bachelor's Degree or higher | 789 (86.5%) | 7 (0.8%) |
| Total | 1,174 (80.5%) | 7 (0.5%) |
Employment Occupations by Sex in Camden
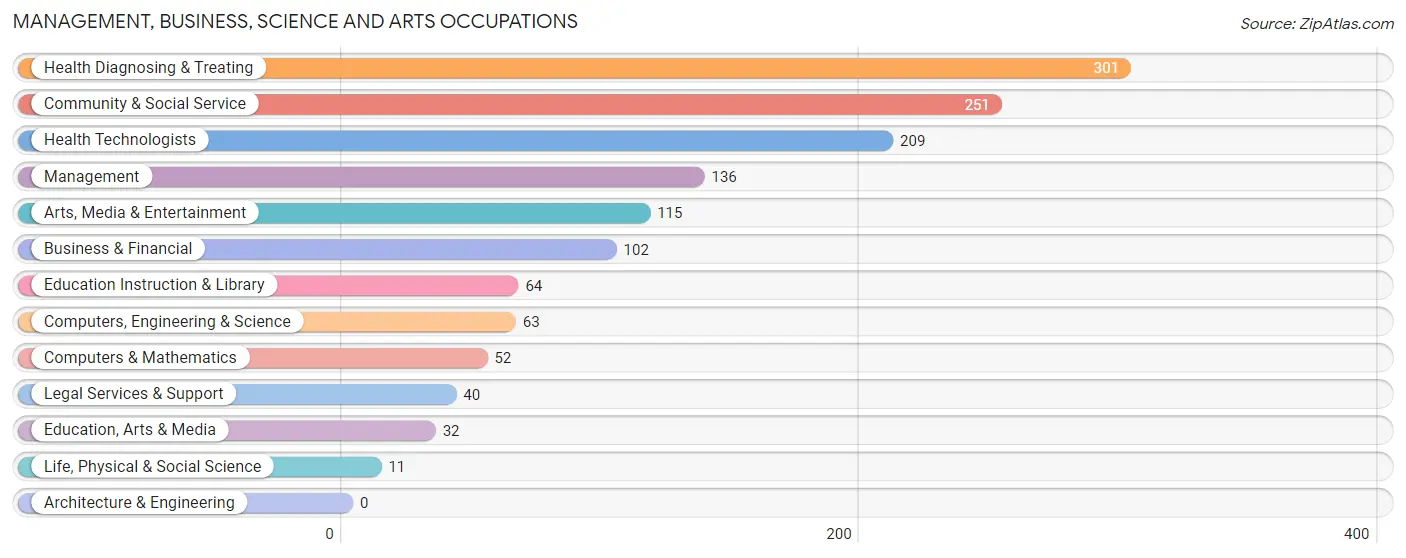
Management, Business, Science and Arts Occupations
The most common Management, Business, Science and Arts occupations in Camden are Health Diagnosing & Treating (301 | 19.9%), Community & Social Service (251 | 16.6%), Health Technologists (209 | 13.8%), Management (136 | 9.0%), and Arts, Media & Entertainment (115 | 7.6%).
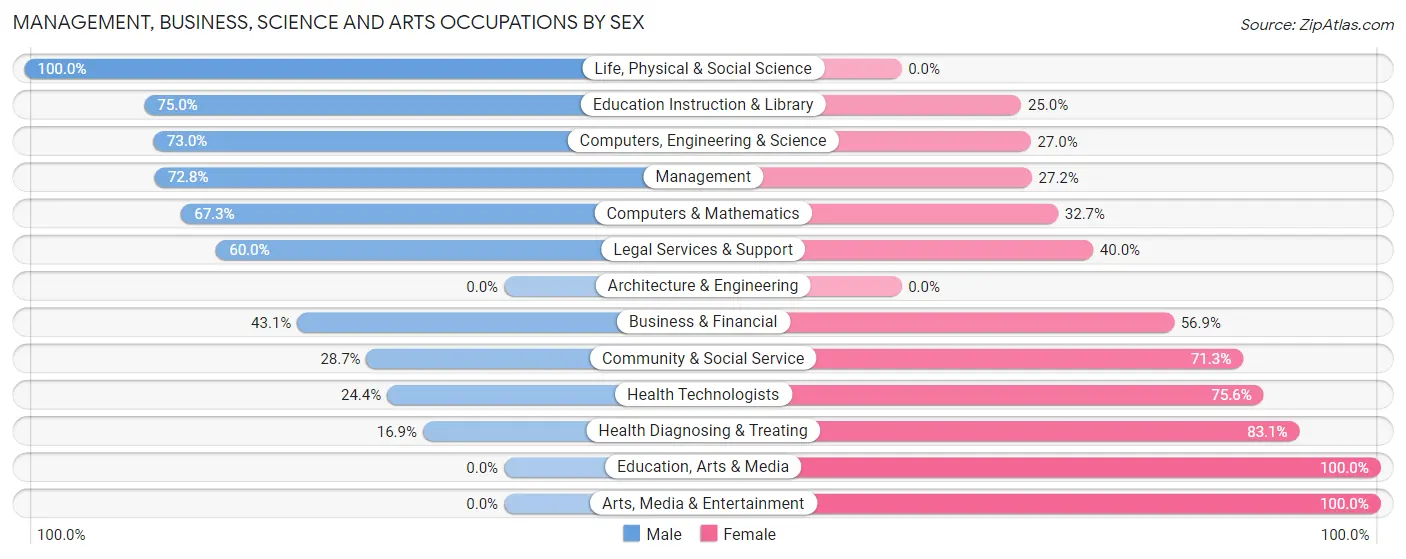
Management, Business, Science and Arts Occupations by Sex
Within the Management, Business, Science and Arts occupations in Camden, the most male-oriented occupations are Life, Physical & Social Science (100.0%), Education Instruction & Library (75.0%), and Computers, Engineering & Science (73.0%), while the most female-oriented occupations are Education, Arts & Media (100.0%), Arts, Media & Entertainment (100.0%), and Health Diagnosing & Treating (83.1%).
| Occupation | Male | Female |
| Management | 99 (72.8%) | 37 (27.2%) |
| Business & Financial | 44 (43.1%) | 58 (56.9%) |
| Computers, Engineering & Science | 46 (73.0%) | 17 (27.0%) |
| Computers & Mathematics | 35 (67.3%) | 17 (32.7%) |
| Architecture & Engineering | 0 (0.0%) | 0 (0.0%) |
| Life, Physical & Social Science | 11 (100.0%) | 0 (0.0%) |
| Community & Social Service | 72 (28.7%) | 179 (71.3%) |
| Education, Arts & Media | 0 (0.0%) | 32 (100.0%) |
| Legal Services & Support | 24 (60.0%) | 16 (40.0%) |
| Education Instruction & Library | 48 (75.0%) | 16 (25.0%) |
| Arts, Media & Entertainment | 0 (0.0%) | 115 (100.0%) |
| Health Diagnosing & Treating | 51 (16.9%) | 250 (83.1%) |
| Health Technologists | 51 (24.4%) | 158 (75.6%) |
| Total (Category) | 312 (36.6%) | 541 (63.4%) |
| Total (Overall) | 780 (51.6%) | 731 (48.4%) |
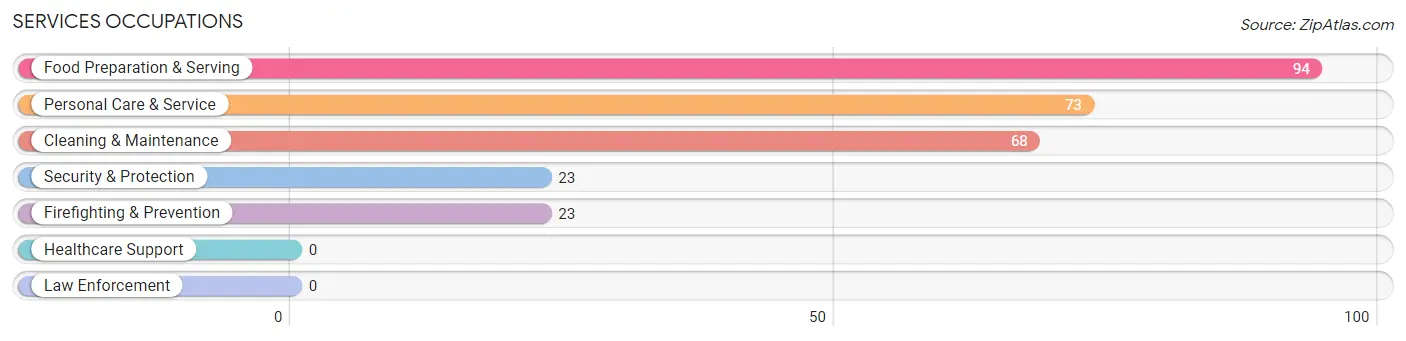
Services Occupations
The most common Services occupations in Camden are Food Preparation & Serving (94 | 6.2%), Personal Care & Service (73 | 4.8%), Cleaning & Maintenance (68 | 4.5%), Security & Protection (23 | 1.5%), and Firefighting & Prevention (23 | 1.5%).
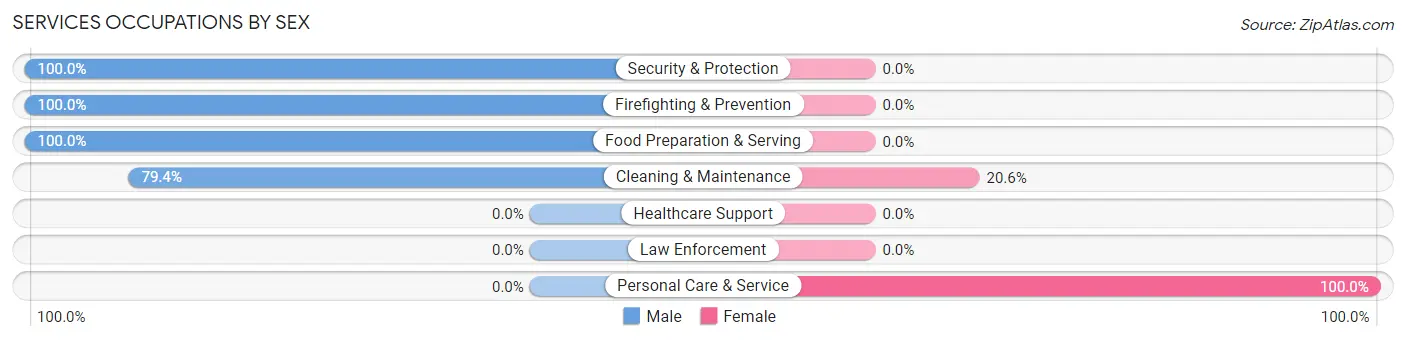
Services Occupations by Sex
Within the Services occupations in Camden, the most male-oriented occupations are Security & Protection (100.0%), Firefighting & Prevention (100.0%), and Food Preparation & Serving (100.0%), while the most female-oriented occupations are Personal Care & Service (100.0%), and Cleaning & Maintenance (20.6%).
| Occupation | Male | Female |
| Healthcare Support | 0 (0.0%) | 0 (0.0%) |
| Security & Protection | 23 (100.0%) | 0 (0.0%) |
| Firefighting & Prevention | 23 (100.0%) | 0 (0.0%) |
| Law Enforcement | 0 (0.0%) | 0 (0.0%) |
| Food Preparation & Serving | 94 (100.0%) | 0 (0.0%) |
| Cleaning & Maintenance | 54 (79.4%) | 14 (20.6%) |
| Personal Care & Service | 0 (0.0%) | 73 (100.0%) |
| Total (Category) | 171 (66.3%) | 87 (33.7%) |
| Total (Overall) | 780 (51.6%) | 731 (48.4%) |
Sales and Office Occupations
The most common Sales and Office occupations in Camden are Sales & Related (114 | 7.5%), and Office & Administration (62 | 4.1%).
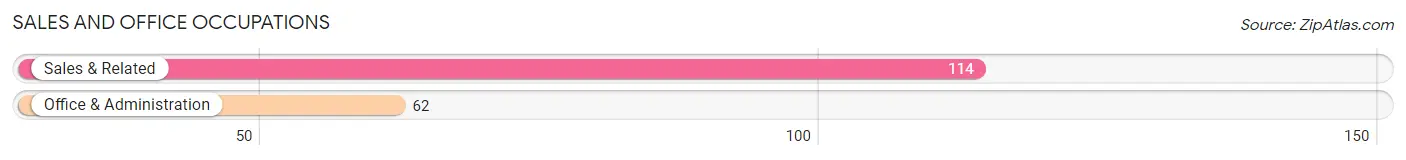
Sales and Office Occupations by Sex

| Occupation | Male | Female |
| Sales & Related | 85 (74.6%) | 29 (25.4%) |
| Office & Administration | 0 (0.0%) | 62 (100.0%) |
| Total (Category) | 85 (48.3%) | 91 (51.7%) |
| Total (Overall) | 780 (51.6%) | 731 (48.4%) |
Natural Resources, Construction and Maintenance Occupations
The most common Natural Resources, Construction and Maintenance occupations in Camden are Construction & Extraction (103 | 6.8%), and Farming, Fishing & Forestry (80 | 5.3%).
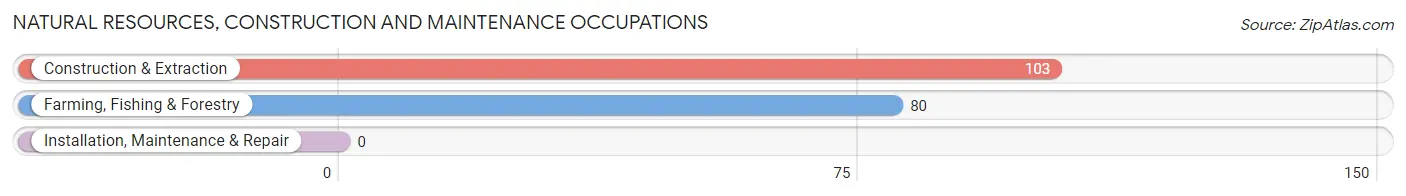
Natural Resources, Construction and Maintenance Occupations by Sex
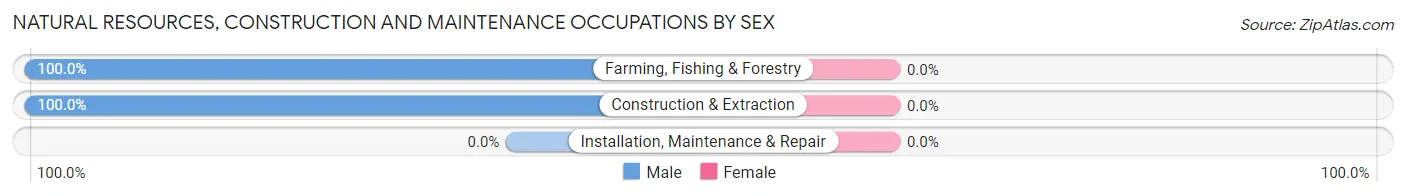
| Occupation | Male | Female |
| Farming, Fishing & Forestry | 80 (100.0%) | 0 (0.0%) |
| Construction & Extraction | 103 (100.0%) | 0 (0.0%) |
| Installation, Maintenance & Repair | 0 (0.0%) | 0 (0.0%) |
| Total (Category) | 183 (100.0%) | 0 (0.0%) |
| Total (Overall) | 780 (51.6%) | 731 (48.4%) |
Production, Transportation and Moving Occupations
The most common Production, Transportation and Moving occupations in Camden are Transportation (29 | 1.9%), and Material Moving (12 | 0.8%).
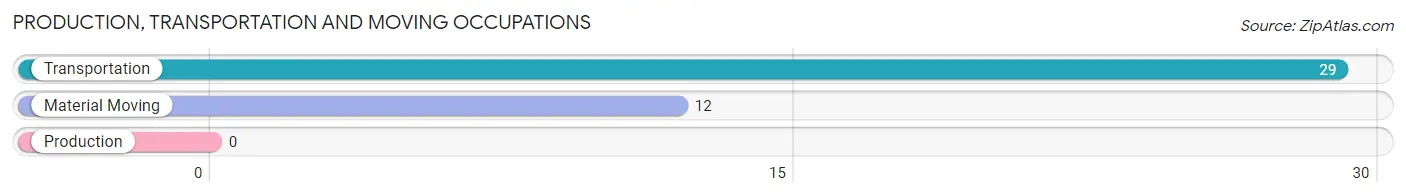
Production, Transportation and Moving Occupations by Sex
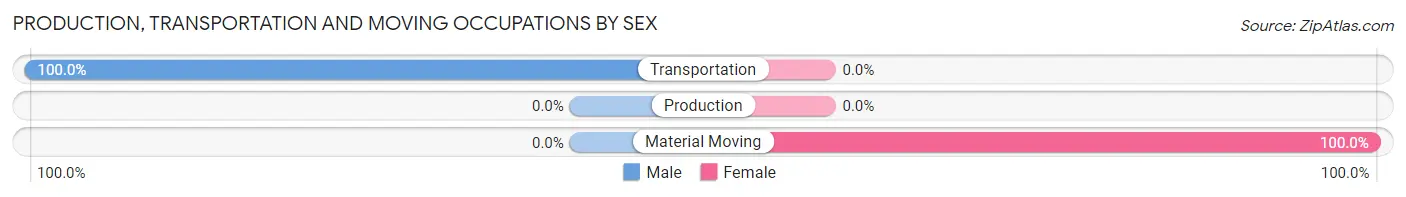
| Occupation | Male | Female |
| Production | 0 (0.0%) | 0 (0.0%) |
| Transportation | 29 (100.0%) | 0 (0.0%) |
| Material Moving | 0 (0.0%) | 12 (100.0%) |
| Total (Category) | 29 (70.7%) | 12 (29.3%) |
| Total (Overall) | 780 (51.6%) | 731 (48.4%) |
Employment Industries by Sex in Camden
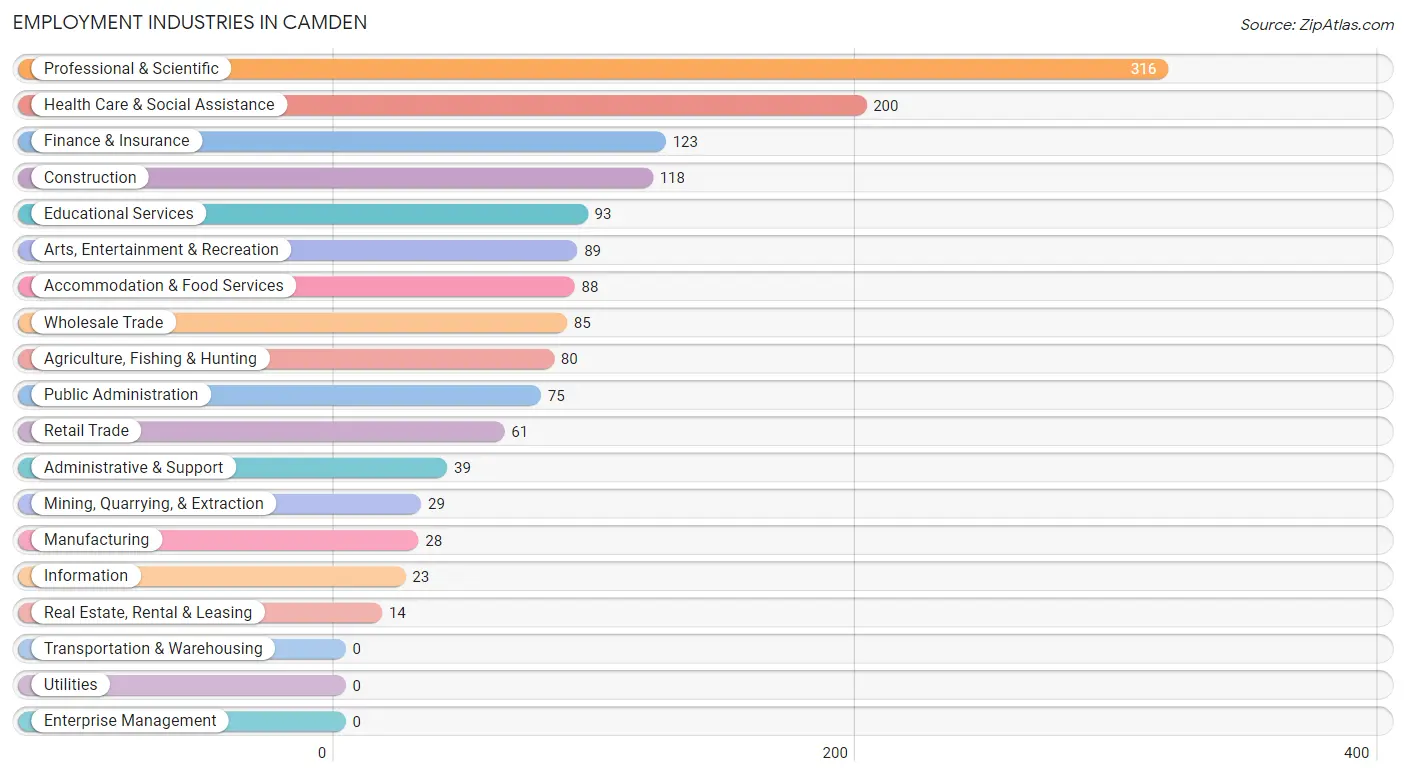
Employment Industries in Camden
The major employment industries in Camden include Professional & Scientific (316 | 20.9%), Health Care & Social Assistance (200 | 13.2%), Finance & Insurance (123 | 8.1%), Construction (118 | 7.8%), and Educational Services (93 | 6.1%).
Employment Industries by Sex in Camden
The Camden industries that see more men than women are Agriculture, Fishing & Hunting (100.0%), Mining, Quarrying, & Extraction (100.0%), and Construction (100.0%), whereas the industries that tend to have a higher number of women are Retail Trade (100.0%), Information (100.0%), and Real Estate, Rental & Leasing (100.0%).
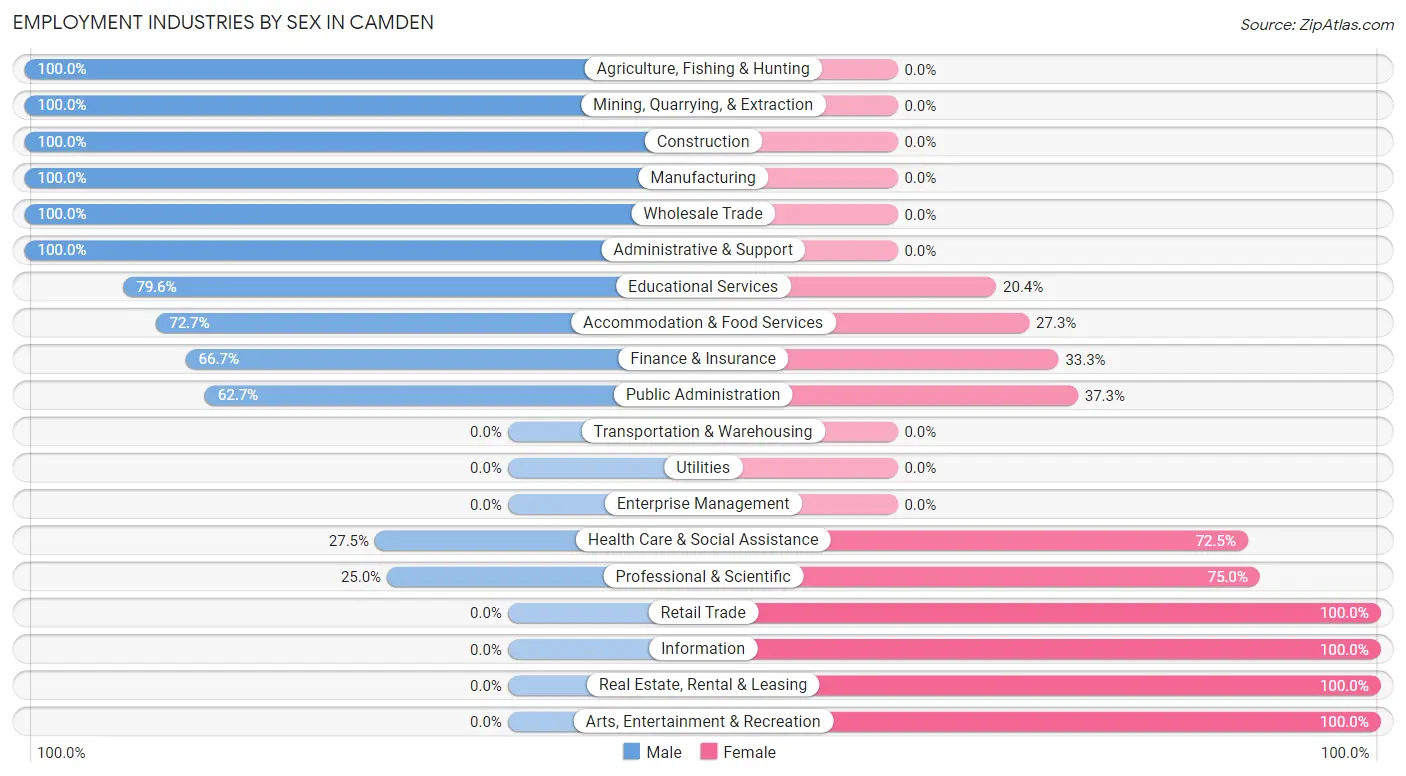
| Industry | Male | Female |
| Agriculture, Fishing & Hunting | 80 (100.0%) | 0 (0.0%) |
| Mining, Quarrying, & Extraction | 29 (100.0%) | 0 (0.0%) |
| Construction | 118 (100.0%) | 0 (0.0%) |
| Manufacturing | 28 (100.0%) | 0 (0.0%) |
| Wholesale Trade | 85 (100.0%) | 0 (0.0%) |
| Retail Trade | 0 (0.0%) | 61 (100.0%) |
| Transportation & Warehousing | 0 (0.0%) | 0 (0.0%) |
| Utilities | 0 (0.0%) | 0 (0.0%) |
| Information | 0 (0.0%) | 23 (100.0%) |
| Finance & Insurance | 82 (66.7%) | 41 (33.3%) |
| Real Estate, Rental & Leasing | 0 (0.0%) | 14 (100.0%) |
| Professional & Scientific | 79 (25.0%) | 237 (75.0%) |
| Enterprise Management | 0 (0.0%) | 0 (0.0%) |
| Administrative & Support | 39 (100.0%) | 0 (0.0%) |
| Educational Services | 74 (79.6%) | 19 (20.4%) |
| Health Care & Social Assistance | 55 (27.5%) | 145 (72.5%) |
| Arts, Entertainment & Recreation | 0 (0.0%) | 89 (100.0%) |
| Accommodation & Food Services | 64 (72.7%) | 24 (27.3%) |
| Public Administration | 47 (62.7%) | 28 (37.3%) |
| Total | 780 (51.6%) | 731 (48.4%) |
Education in Camden
School Enrollment in Camden
The most common levels of schooling among the 466 students in Camden are high school (201 | 43.1%), elementary school (105 | 22.5%), and college / undergraduate (90 | 19.3%).
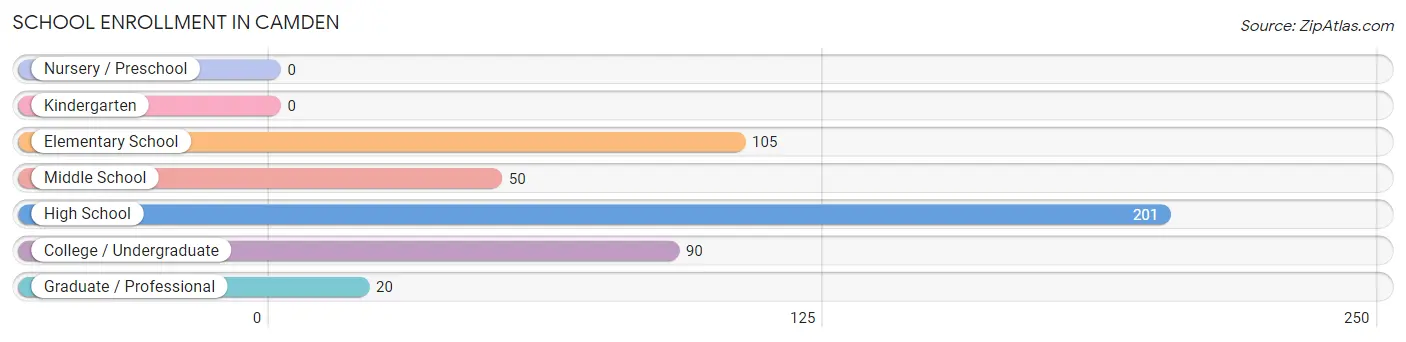
| School Level | # Students | % Students |
| Nursery / Preschool | 0 | 0.0% |
| Kindergarten | 0 | 0.0% |
| Elementary School | 105 | 22.5% |
| Middle School | 50 | 10.7% |
| High School | 201 | 43.1% |
| College / Undergraduate | 90 | 19.3% |
| Graduate / Professional | 20 | 4.3% |
| Total | 466 | 100.0% |
School Enrollment by Age by Funding Source in Camden
Out of a total of 466 students who are enrolled in schools in Camden, 49 (10.5%) attend a private institution, while the remaining 417 (89.5%) are enrolled in public schools. The age group of 25 to 34 year olds has the highest likelihood of being enrolled in private schools, with 22 (100.0% in the age bracket) enrolled. Conversely, the age group of 10 to 14 year olds has the lowest likelihood of being enrolled in a private school, with 64 (100.0% in the age bracket) attending a public institution.
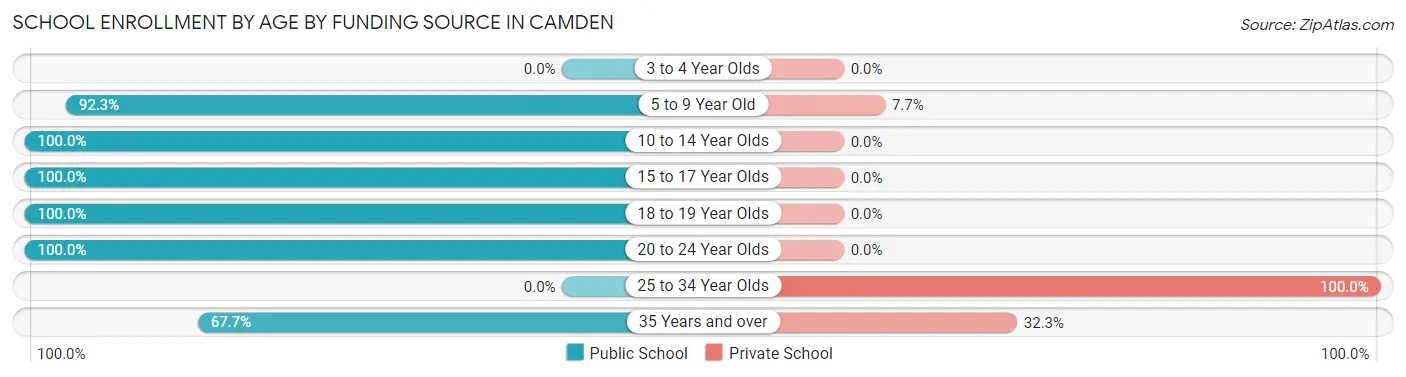
| Age Bracket | Public School | Private School |
| 3 to 4 Year Olds | 0 (0.0%) | 0 (0.0%) |
| 5 to 9 Year Old | 84 (92.3%) | 7 (7.7%) |
| 10 to 14 Year Olds | 64 (100.0%) | 0 (0.0%) |
| 15 to 17 Year Olds | 168 (100.0%) | 0 (0.0%) |
| 18 to 19 Year Olds | 33 (100.0%) | 0 (0.0%) |
| 20 to 24 Year Olds | 26 (100.0%) | 0 (0.0%) |
| 25 to 34 Year Olds | 0 (0.0%) | 22 (100.0%) |
| 35 Years and over | 42 (67.7%) | 20 (32.3%) |
| Total | 417 (89.5%) | 49 (10.5%) |
Educational Attainment by Field of Study in Camden
Science & technology (303 | 15.6%), social sciences (229 | 11.8%), bio, nature & agricultural (205 | 10.6%), business (193 | 9.9%), and liberal arts & history (173 | 8.9%) are the most common fields of study among 1,942 individuals in Camden who have obtained a bachelor's degree or higher.
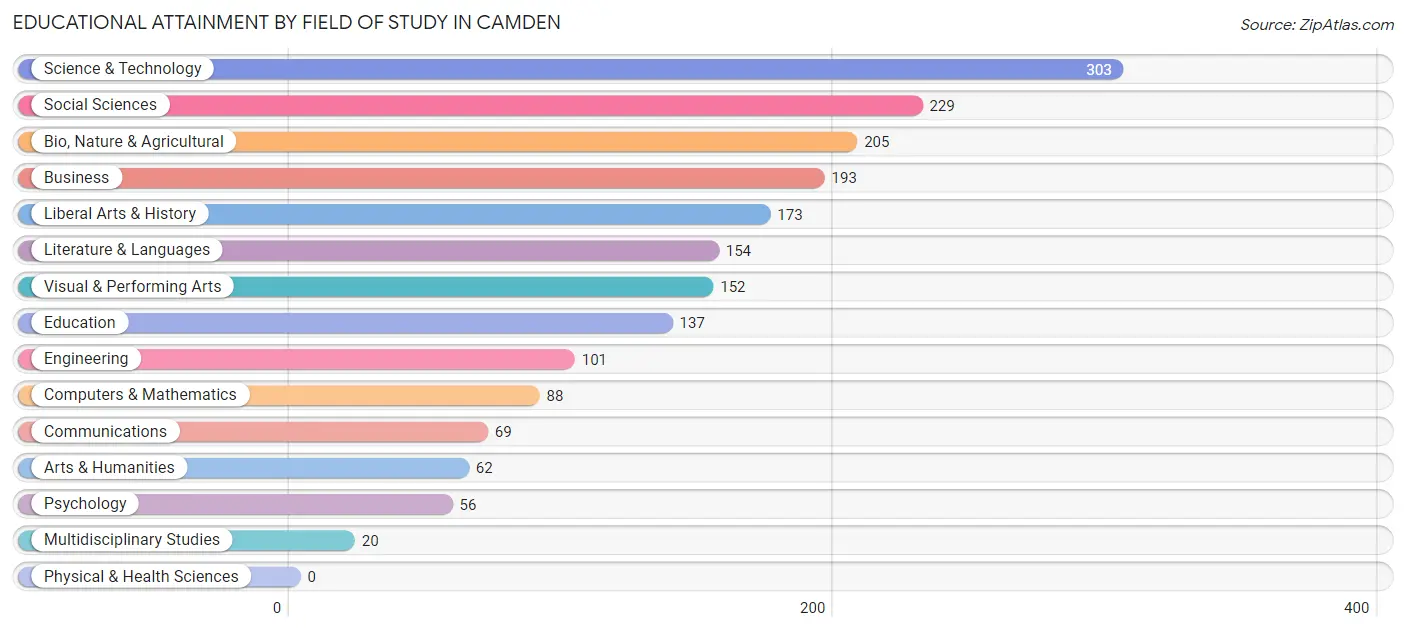
| Field of Study | # Graduates | % Graduates |
| Computers & Mathematics | 88 | 4.5% |
| Bio, Nature & Agricultural | 205 | 10.6% |
| Physical & Health Sciences | 0 | 0.0% |
| Psychology | 56 | 2.9% |
| Social Sciences | 229 | 11.8% |
| Engineering | 101 | 5.2% |
| Multidisciplinary Studies | 20 | 1.0% |
| Science & Technology | 303 | 15.6% |
| Business | 193 | 9.9% |
| Education | 137 | 7.0% |
| Literature & Languages | 154 | 7.9% |
| Liberal Arts & History | 173 | 8.9% |
| Visual & Performing Arts | 152 | 7.8% |
| Communications | 69 | 3.5% |
| Arts & Humanities | 62 | 3.2% |
| Total | 1,942 | 100.0% |
Transportation & Commute in Camden
Vehicle Availability by Sex in Camden
The most prevalent vehicle ownership categories in Camden are males with 2 vehicles (295, accounting for 37.8%) and females with 2 vehicles (226, making up 44.6%).
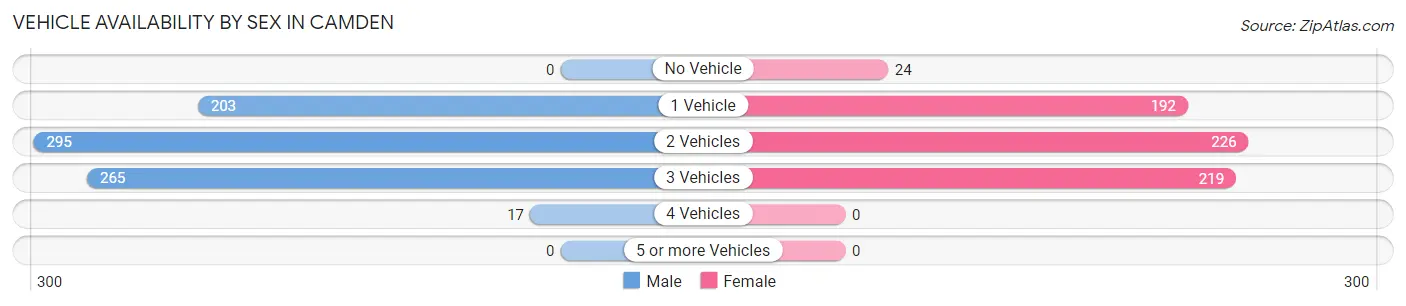
| Vehicles Available | Male | Female |
| No Vehicle | 0 (0.0%) | 24 (3.6%) |
| 1 Vehicle | 203 (26.0%) | 192 (29.0%) |
| 2 Vehicles | 295 (37.8%) | 226 (34.2%) |
| 3 Vehicles | 265 (34.0%) | 219 (33.1%) |
| 4 Vehicles | 17 (2.2%) | 0 (0.0%) |
| 5 or more Vehicles | 0 (0.0%) | 0 (0.0%) |
| Total | 780 (100.0%) | 661 (100.0%) |
Commute Time in Camden
The most frequently occuring commute durations in Camden are 30 to 34 minutes (255 commuters, 20.0%), 5 to 9 minutes (186 commuters, 14.6%), and 10 to 14 minutes (174 commuters, 13.7%).
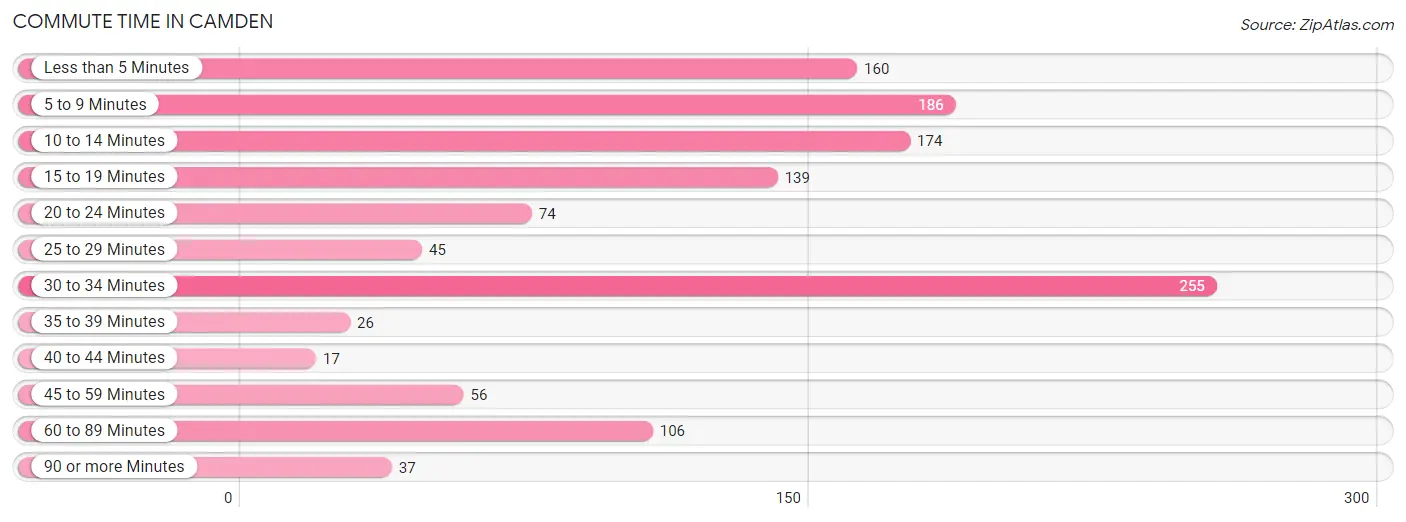
| Commute Time | # Commuters | % Commuters |
| Less than 5 Minutes | 160 | 12.6% |
| 5 to 9 Minutes | 186 | 14.6% |
| 10 to 14 Minutes | 174 | 13.7% |
| 15 to 19 Minutes | 139 | 10.9% |
| 20 to 24 Minutes | 74 | 5.8% |
| 25 to 29 Minutes | 45 | 3.5% |
| 30 to 34 Minutes | 255 | 20.0% |
| 35 to 39 Minutes | 26 | 2.0% |
| 40 to 44 Minutes | 17 | 1.3% |
| 45 to 59 Minutes | 56 | 4.4% |
| 60 to 89 Minutes | 106 | 8.3% |
| 90 or more Minutes | 37 | 2.9% |
Commute Time by Sex in Camden
The most common commute times in Camden are 30 to 34 minutes (131 commuters, 18.7%) for males and 10 to 14 minutes (126 commuters, 21.9%) for females.
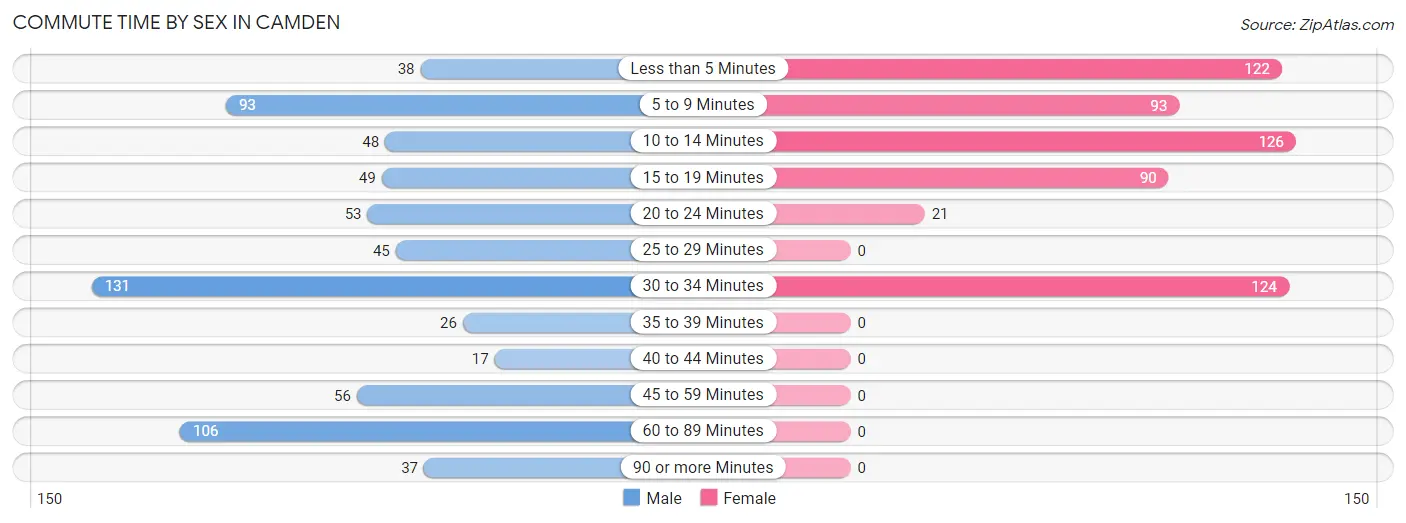
| Commute Time | Male | Female |
| Less than 5 Minutes | 38 (5.4%) | 122 (21.2%) |
| 5 to 9 Minutes | 93 (13.3%) | 93 (16.2%) |
| 10 to 14 Minutes | 48 (6.9%) | 126 (21.9%) |
| 15 to 19 Minutes | 49 (7.0%) | 90 (15.6%) |
| 20 to 24 Minutes | 53 (7.6%) | 21 (3.6%) |
| 25 to 29 Minutes | 45 (6.4%) | 0 (0.0%) |
| 30 to 34 Minutes | 131 (18.7%) | 124 (21.5%) |
| 35 to 39 Minutes | 26 (3.7%) | 0 (0.0%) |
| 40 to 44 Minutes | 17 (2.4%) | 0 (0.0%) |
| 45 to 59 Minutes | 56 (8.0%) | 0 (0.0%) |
| 60 to 89 Minutes | 106 (15.2%) | 0 (0.0%) |
| 90 or more Minutes | 37 (5.3%) | 0 (0.0%) |
Time of Departure to Work by Sex in Camden
The most frequent times of departure to work in Camden are 7:30 AM to 7:59 AM (178, 25.5%) for males and 7:00 AM to 7:29 AM (179, 31.1%) for females.
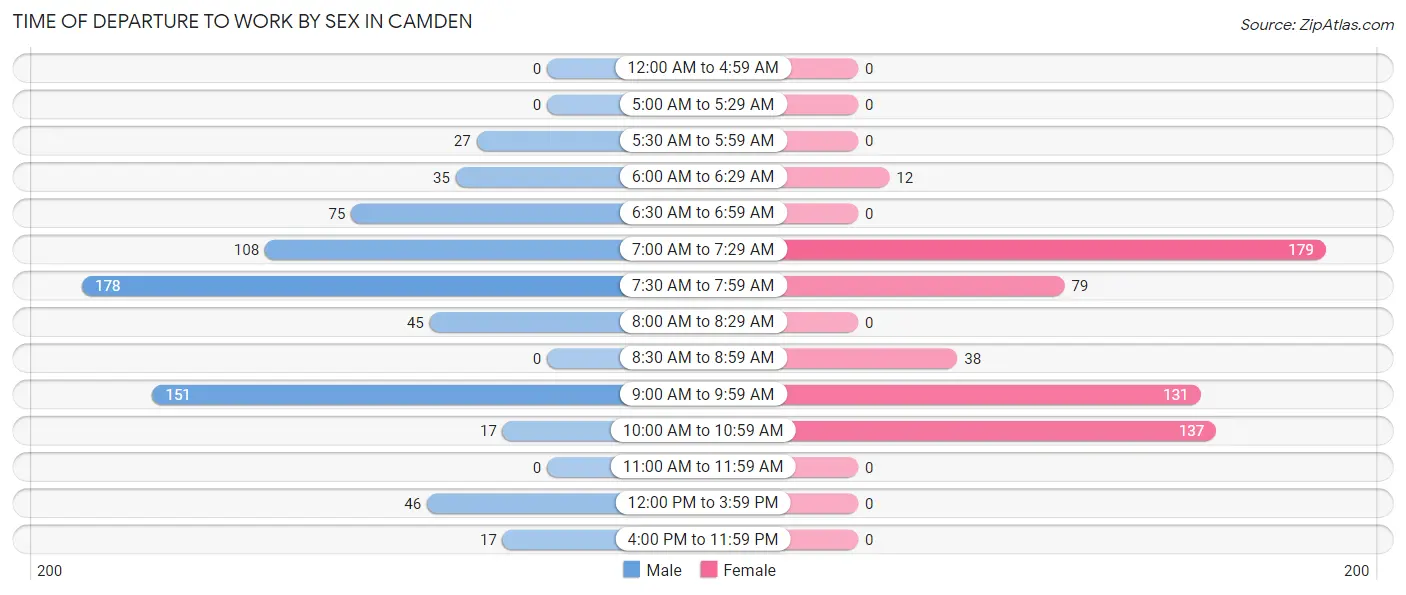
| Time of Departure | Male | Female |
| 12:00 AM to 4:59 AM | 0 (0.0%) | 0 (0.0%) |
| 5:00 AM to 5:29 AM | 0 (0.0%) | 0 (0.0%) |
| 5:30 AM to 5:59 AM | 27 (3.9%) | 0 (0.0%) |
| 6:00 AM to 6:29 AM | 35 (5.0%) | 12 (2.1%) |
| 6:30 AM to 6:59 AM | 75 (10.7%) | 0 (0.0%) |
| 7:00 AM to 7:29 AM | 108 (15.4%) | 179 (31.1%) |
| 7:30 AM to 7:59 AM | 178 (25.5%) | 79 (13.7%) |
| 8:00 AM to 8:29 AM | 45 (6.4%) | 0 (0.0%) |
| 8:30 AM to 8:59 AM | 0 (0.0%) | 38 (6.6%) |
| 9:00 AM to 9:59 AM | 151 (21.6%) | 131 (22.7%) |
| 10:00 AM to 10:59 AM | 17 (2.4%) | 137 (23.8%) |
| 11:00 AM to 11:59 AM | 0 (0.0%) | 0 (0.0%) |
| 12:00 PM to 3:59 PM | 46 (6.6%) | 0 (0.0%) |
| 4:00 PM to 11:59 PM | 17 (2.4%) | 0 (0.0%) |
| Total | 699 (100.0%) | 576 (100.0%) |
Housing Occupancy in Camden
Occupancy by Ownership in Camden
Of the total 1,638 dwellings in Camden, owner-occupied units account for 1,057 (64.5%), while renter-occupied units make up 581 (35.5%).
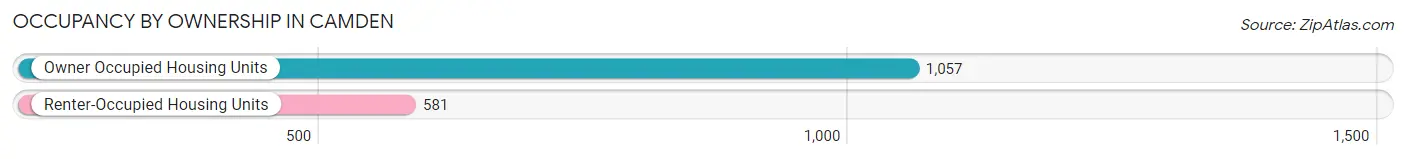
| Occupancy | # Housing Units | % Housing Units |
| Owner Occupied Housing Units | 1,057 | 64.5% |
| Renter-Occupied Housing Units | 581 | 35.5% |
| Total Occupied Housing Units | 1,638 | 100.0% |
Occupancy by Household Size in Camden
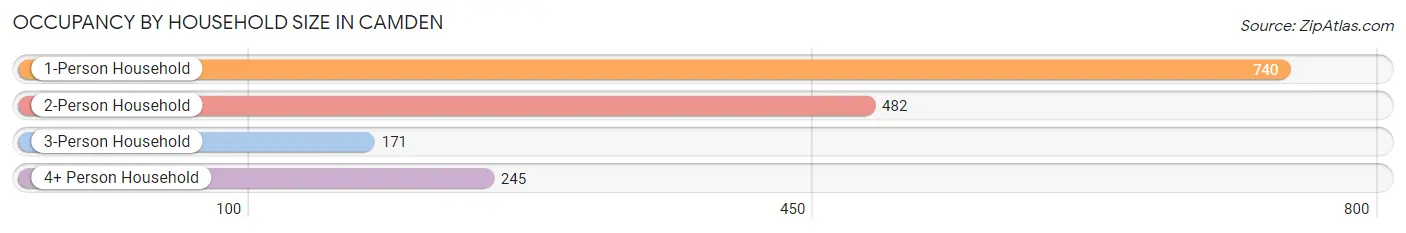
| Household Size | # Housing Units | % Housing Units |
| 1-Person Household | 740 | 45.2% |
| 2-Person Household | 482 | 29.4% |
| 3-Person Household | 171 | 10.4% |
| 4+ Person Household | 245 | 15.0% |
| Total Housing Units | 1,638 | 100.0% |
Occupancy by Ownership by Household Size in Camden
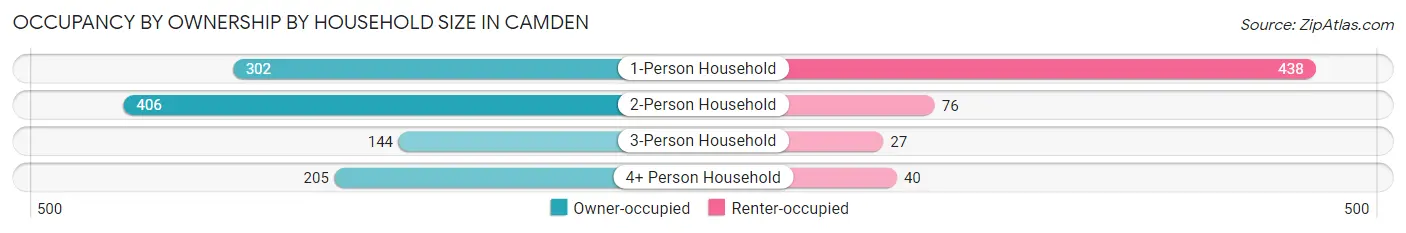
| Household Size | Owner-occupied | Renter-occupied |
| 1-Person Household | 302 (40.8%) | 438 (59.2%) |
| 2-Person Household | 406 (84.2%) | 76 (15.8%) |
| 3-Person Household | 144 (84.2%) | 27 (15.8%) |
| 4+ Person Household | 205 (83.7%) | 40 (16.3%) |
| Total Housing Units | 1,057 (64.5%) | 581 (35.5%) |
Occupancy by Educational Attainment in Camden
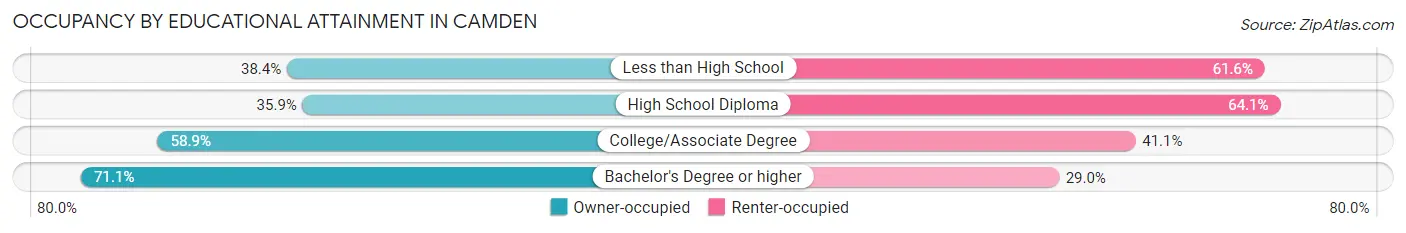
| Household Size | Owner-occupied | Renter-occupied |
| Less than High School | 33 (38.4%) | 53 (61.6%) |
| High School Diploma | 42 (35.9%) | 75 (64.1%) |
| College/Associate Degree | 182 (58.9%) | 127 (41.1%) |
| Bachelor's Degree or higher | 800 (71.1%) | 326 (28.9%) |
Occupancy by Age of Householder in Camden
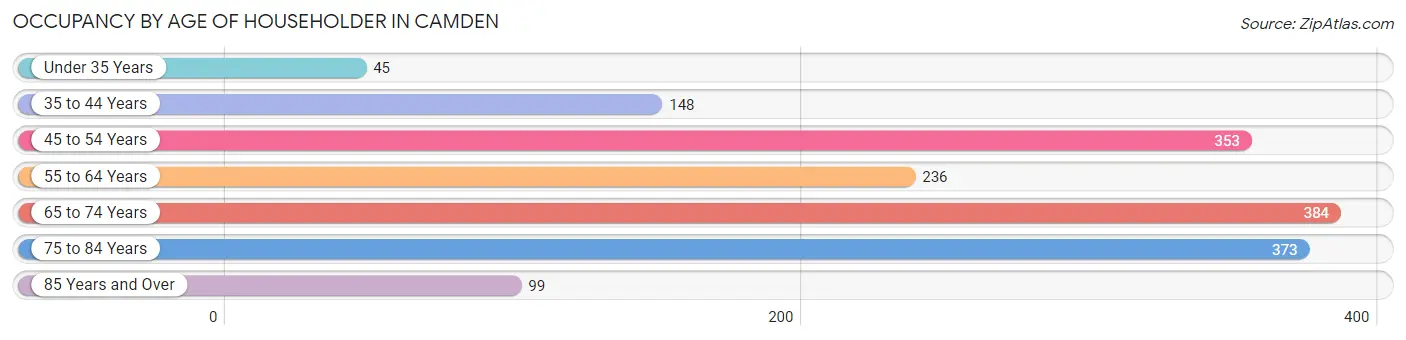
| Age Bracket | # Households | % Households |
| Under 35 Years | 45 | 2.8% |
| 35 to 44 Years | 148 | 9.0% |
| 45 to 54 Years | 353 | 21.5% |
| 55 to 64 Years | 236 | 14.4% |
| 65 to 74 Years | 384 | 23.4% |
| 75 to 84 Years | 373 | 22.8% |
| 85 Years and Over | 99 | 6.0% |
| Total | 1,638 | 100.0% |
Housing Finances in Camden
Median Income by Occupancy in Camden
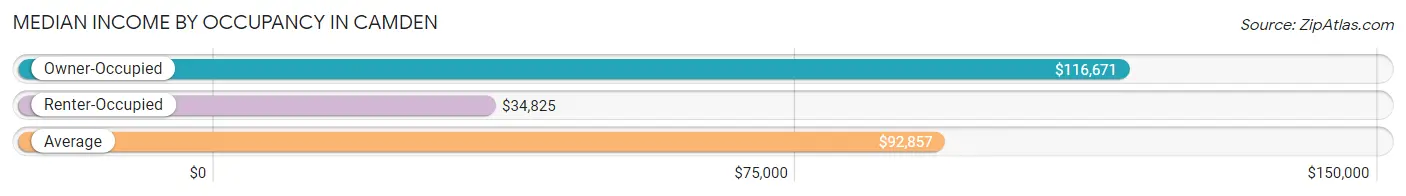
| Occupancy Type | # Households | Median Income |
| Owner-Occupied | 1,057 (64.5%) | $116,671 |
| Renter-Occupied | 581 (35.5%) | $34,825 |
| Average | 1,638 (100.0%) | $92,857 |
Occupancy by Householder Income Bracket in Camden
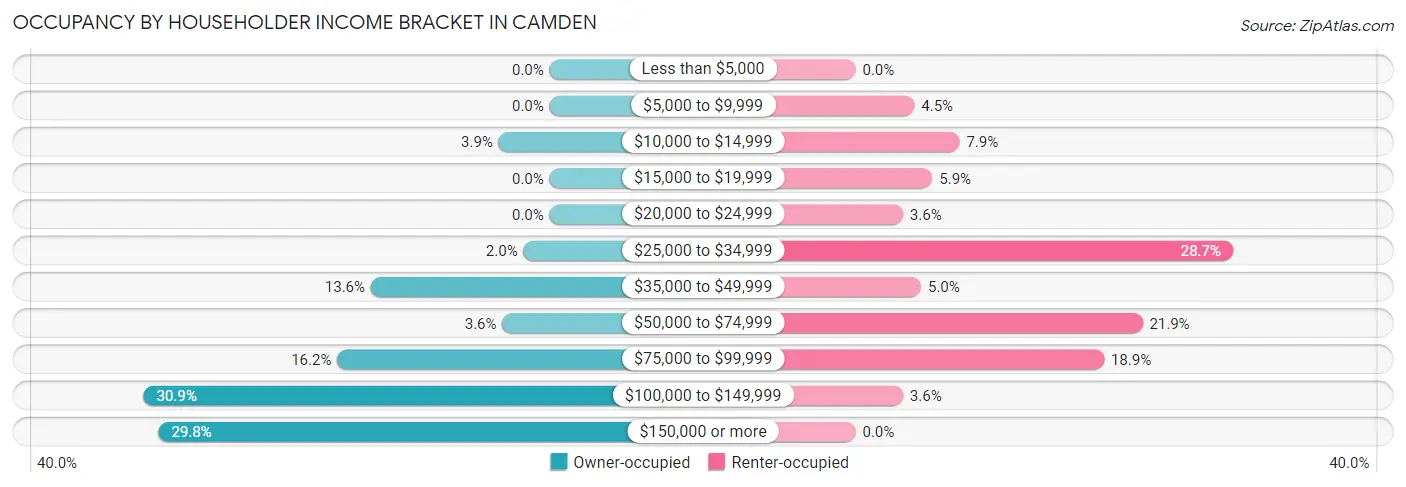
| Income Bracket | Owner-occupied | Renter-occupied |
| Less than $5,000 | 0 (0.0%) | 0 (0.0%) |
| $5,000 to $9,999 | 0 (0.0%) | 26 (4.5%) |
| $10,000 to $14,999 | 41 (3.9%) | 46 (7.9%) |
| $15,000 to $19,999 | 0 (0.0%) | 34 (5.9%) |
| $20,000 to $24,999 | 0 (0.0%) | 21 (3.6%) |
| $25,000 to $34,999 | 21 (2.0%) | 167 (28.7%) |
| $35,000 to $49,999 | 144 (13.6%) | 29 (5.0%) |
| $50,000 to $74,999 | 38 (3.6%) | 127 (21.9%) |
| $75,000 to $99,999 | 171 (16.2%) | 110 (18.9%) |
| $100,000 to $149,999 | 327 (30.9%) | 21 (3.6%) |
| $150,000 or more | 315 (29.8%) | 0 (0.0%) |
| Total | 1,057 (100.0%) | 581 (100.0%) |
Monthly Housing Cost Tiers in Camden
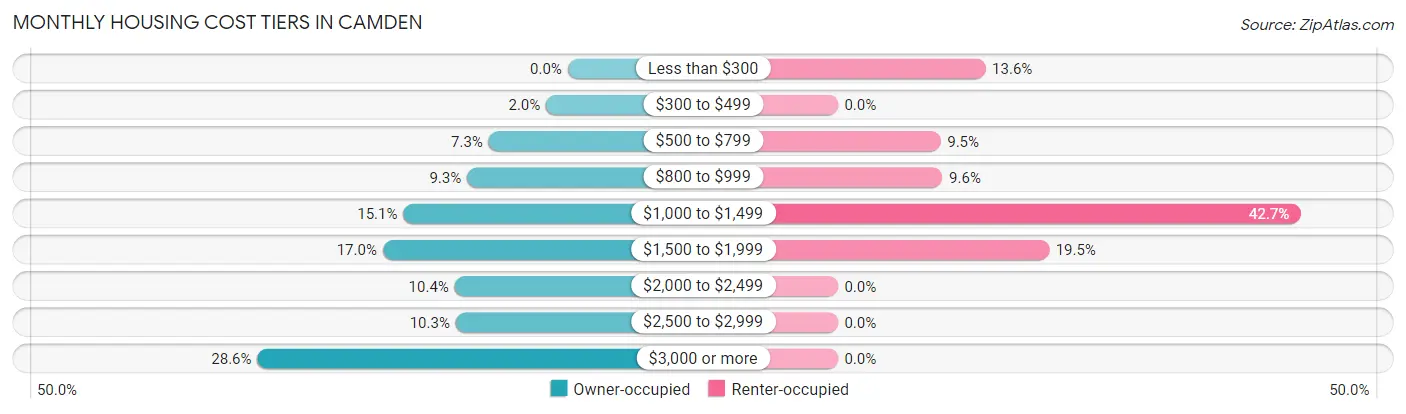
| Monthly Cost | Owner-occupied | Renter-occupied |
| Less than $300 | 0 (0.0%) | 79 (13.6%) |
| $300 to $499 | 21 (2.0%) | 0 (0.0%) |
| $500 to $799 | 77 (7.3%) | 55 (9.5%) |
| $800 to $999 | 98 (9.3%) | 56 (9.6%) |
| $1,000 to $1,499 | 160 (15.1%) | 248 (42.7%) |
| $1,500 to $1,999 | 180 (17.0%) | 113 (19.5%) |
| $2,000 to $2,499 | 110 (10.4%) | 0 (0.0%) |
| $2,500 to $2,999 | 109 (10.3%) | 0 (0.0%) |
| $3,000 or more | 302 (28.6%) | 0 (0.0%) |
| Total | 1,057 (100.0%) | 581 (100.0%) |
Physical Housing Characteristics in Camden
Housing Structures in Camden
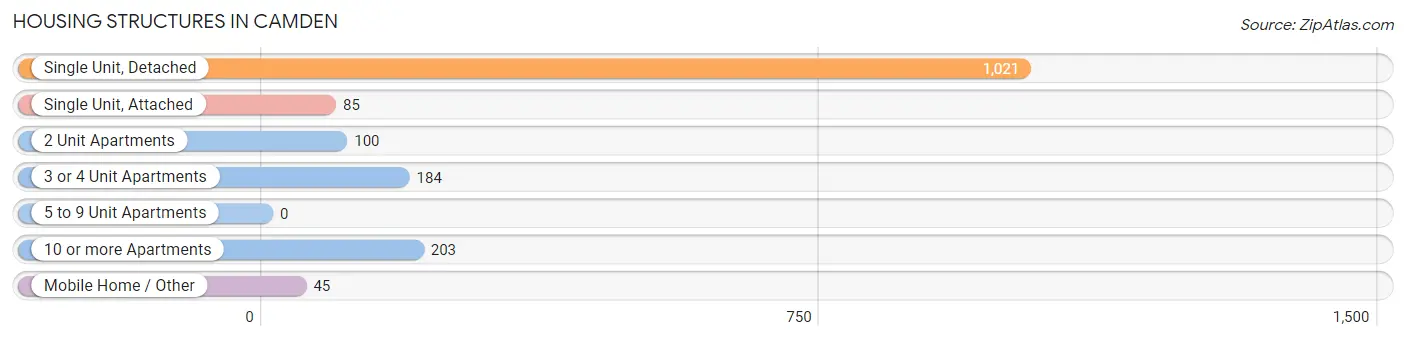
| Structure Type | # Housing Units | % Housing Units |
| Single Unit, Detached | 1,021 | 62.3% |
| Single Unit, Attached | 85 | 5.2% |
| 2 Unit Apartments | 100 | 6.1% |
| 3 or 4 Unit Apartments | 184 | 11.2% |
| 5 to 9 Unit Apartments | 0 | 0.0% |
| 10 or more Apartments | 203 | 12.4% |
| Mobile Home / Other | 45 | 2.8% |
| Total | 1,638 | 100.0% |
Housing Structures by Occupancy in Camden
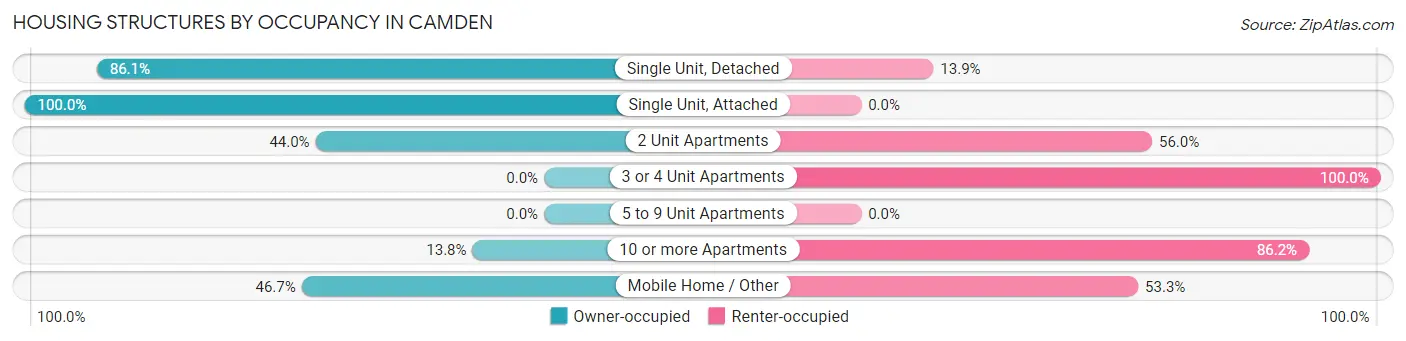
| Structure Type | Owner-occupied | Renter-occupied |
| Single Unit, Detached | 879 (86.1%) | 142 (13.9%) |
| Single Unit, Attached | 85 (100.0%) | 0 (0.0%) |
| 2 Unit Apartments | 44 (44.0%) | 56 (56.0%) |
| 3 or 4 Unit Apartments | 0 (0.0%) | 184 (100.0%) |
| 5 to 9 Unit Apartments | 0 (0.0%) | 0 (0.0%) |
| 10 or more Apartments | 28 (13.8%) | 175 (86.2%) |
| Mobile Home / Other | 21 (46.7%) | 24 (53.3%) |
| Total | 1,057 (64.5%) | 581 (35.5%) |
Housing Structures by Number of Rooms in Camden
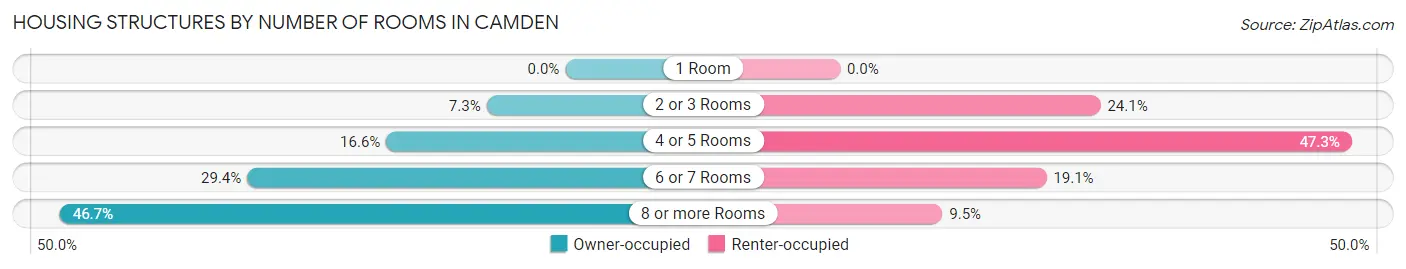
| Number of Rooms | Owner-occupied | Renter-occupied |
| 1 Room | 0 (0.0%) | 0 (0.0%) |
| 2 or 3 Rooms | 77 (7.3%) | 140 (24.1%) |
| 4 or 5 Rooms | 175 (16.6%) | 275 (47.3%) |
| 6 or 7 Rooms | 311 (29.4%) | 111 (19.1%) |
| 8 or more Rooms | 494 (46.7%) | 55 (9.5%) |
| Total | 1,057 (100.0%) | 581 (100.0%) |
Housing Structure by Heating Type in Camden
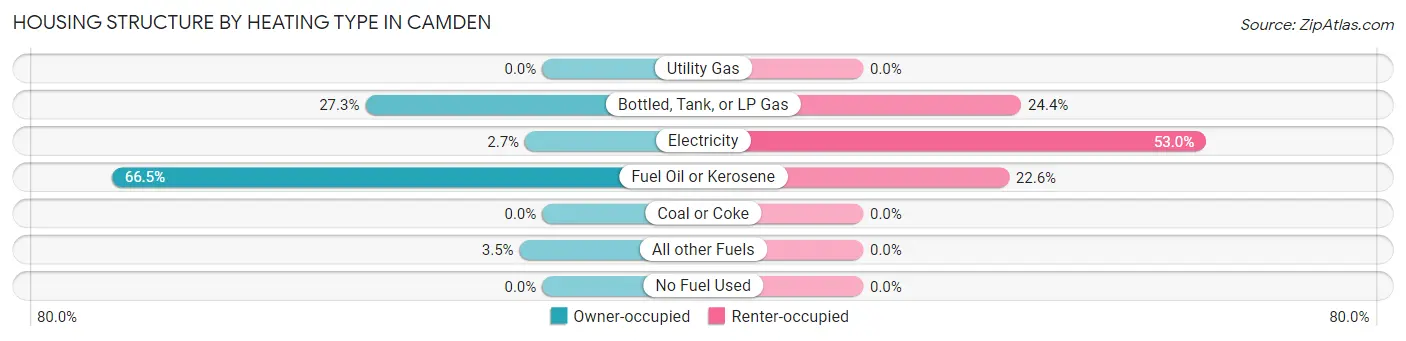
| Heating Type | Owner-occupied | Renter-occupied |
| Utility Gas | 0 (0.0%) | 0 (0.0%) |
| Bottled, Tank, or LP Gas | 289 (27.3%) | 142 (24.4%) |
| Electricity | 28 (2.6%) | 308 (53.0%) |
| Fuel Oil or Kerosene | 703 (66.5%) | 131 (22.6%) |
| Coal or Coke | 0 (0.0%) | 0 (0.0%) |
| All other Fuels | 37 (3.5%) | 0 (0.0%) |
| No Fuel Used | 0 (0.0%) | 0 (0.0%) |
| Total | 1,057 (100.0%) | 581 (100.0%) |
Household Vehicle Usage in Camden
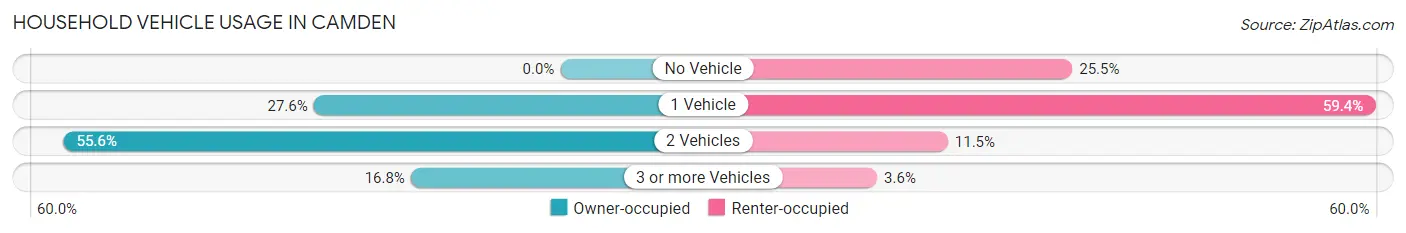
| Vehicles per Household | Owner-occupied | Renter-occupied |
| No Vehicle | 0 (0.0%) | 148 (25.5%) |
| 1 Vehicle | 292 (27.6%) | 345 (59.4%) |
| 2 Vehicles | 588 (55.6%) | 67 (11.5%) |
| 3 or more Vehicles | 177 (16.8%) | 21 (3.6%) |
| Total | 1,057 (100.0%) | 581 (100.0%) |
Real Estate & Mortgages in Camden
Real Estate and Mortgage Overview in Camden
| Characteristic | Without Mortgage | With Mortgage |
| Housing Units | 334 | 723 |
| Median Property Value | $470,000 | $424,600 |
| Median Household Income | $118,587 | $197 |
| Monthly Housing Costs | $967 | $280 |
| Real Estate Taxes | $6,091 | $0 |
Property Value by Mortgage Status in Camden
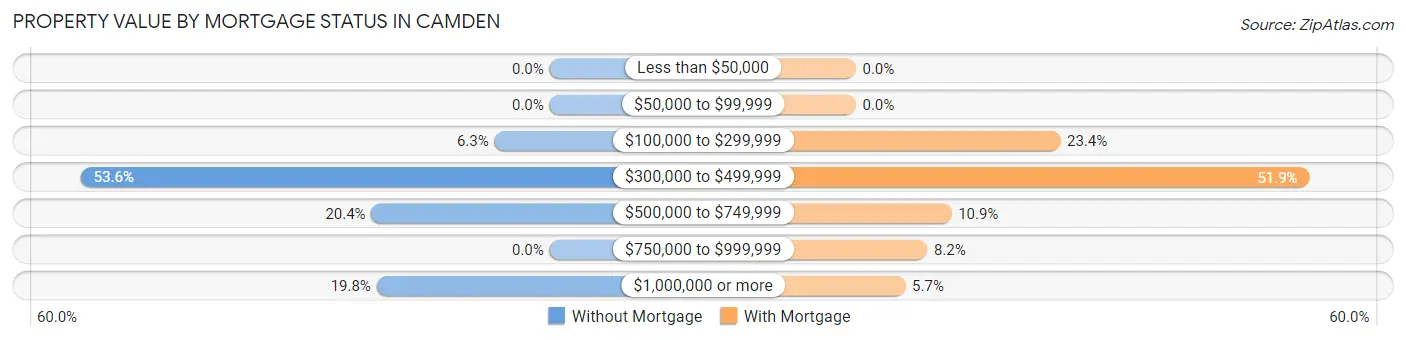
| Property Value | Without Mortgage | With Mortgage |
| Less than $50,000 | 0 (0.0%) | 0 (0.0%) |
| $50,000 to $99,999 | 0 (0.0%) | 0 (0.0%) |
| $100,000 to $299,999 | 21 (6.3%) | 169 (23.4%) |
| $300,000 to $499,999 | 179 (53.6%) | 375 (51.9%) |
| $500,000 to $749,999 | 68 (20.4%) | 79 (10.9%) |
| $750,000 to $999,999 | 0 (0.0%) | 59 (8.2%) |
| $1,000,000 or more | 66 (19.8%) | 41 (5.7%) |
| Total | 334 (100.0%) | 723 (100.0%) |
Household Income by Mortgage Status in Camden
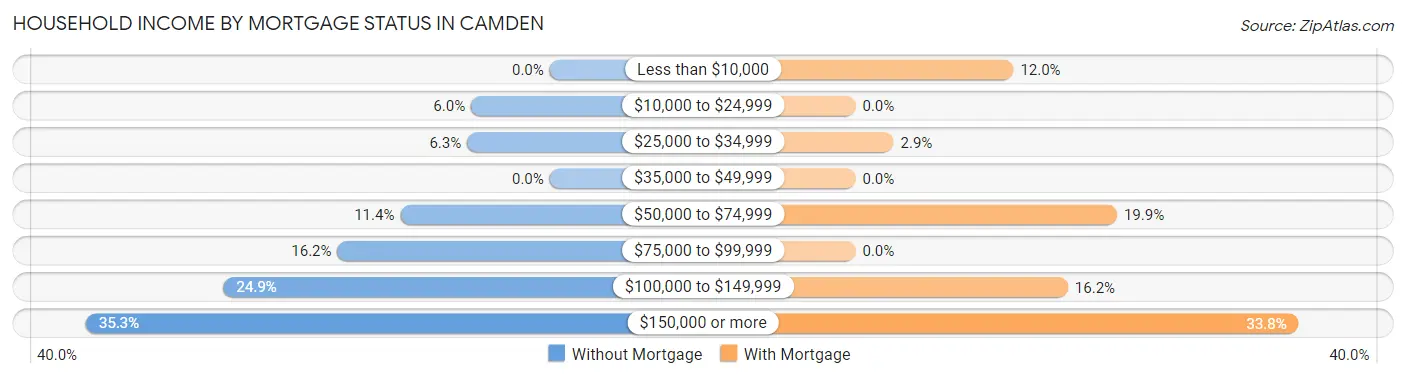
| Household Income | Without Mortgage | With Mortgage |
| Less than $10,000 | 0 (0.0%) | 87 (12.0%) |
| $10,000 to $24,999 | 20 (6.0%) | 0 (0.0%) |
| $25,000 to $34,999 | 21 (6.3%) | 21 (2.9%) |
| $35,000 to $49,999 | 0 (0.0%) | 0 (0.0%) |
| $50,000 to $74,999 | 38 (11.4%) | 144 (19.9%) |
| $75,000 to $99,999 | 54 (16.2%) | 0 (0.0%) |
| $100,000 to $149,999 | 83 (24.8%) | 117 (16.2%) |
| $150,000 or more | 118 (35.3%) | 244 (33.8%) |
| Total | 334 (100.0%) | 723 (100.0%) |
Property Value to Household Income Ratio in Camden
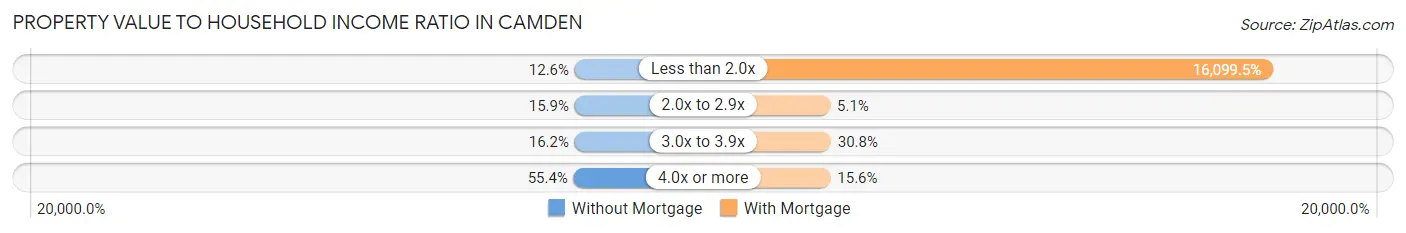
| Value-to-Income Ratio | Without Mortgage | With Mortgage |
| Less than 2.0x | 42 (12.6%) | 116,399 (16,099.4%) |
| 2.0x to 2.9x | 53 (15.9%) | 37 (5.1%) |
| 3.0x to 3.9x | 54 (16.2%) | 223 (30.8%) |
| 4.0x or more | 185 (55.4%) | 113 (15.6%) |
| Total | 334 (100.0%) | 723 (100.0%) |
Real Estate Taxes by Mortgage Status in Camden
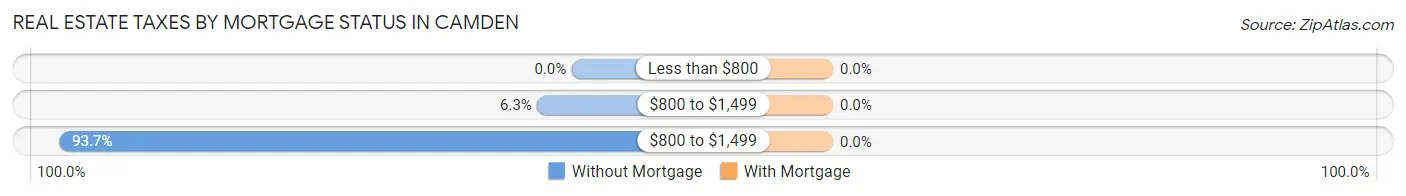
| Property Taxes | Without Mortgage | With Mortgage |
| Less than $800 | 0 (0.0%) | 0 (0.0%) |
| $800 to $1,499 | 21 (6.3%) | 0 (0.0%) |
| $800 to $1,499 | 313 (93.7%) | 0 (0.0%) |
| Total | 334 (100.0%) | 723 (100.0%) |
Health & Disability in Camden
Health Insurance Coverage by Age in Camden
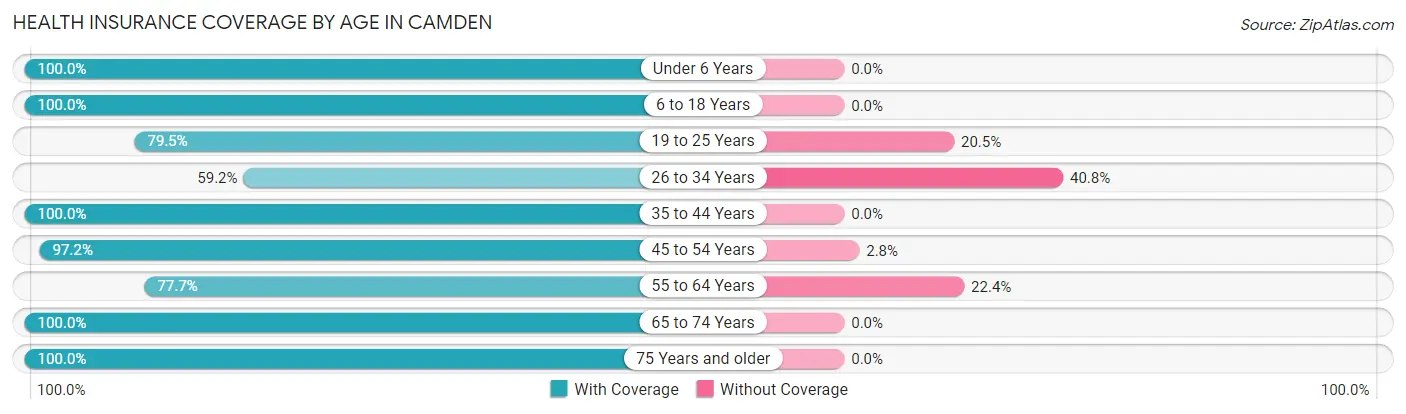
| Age Bracket | With Coverage | Without Coverage |
| Under 6 Years | 97 (100.0%) | 0 (0.0%) |
| 6 to 18 Years | 714 (100.0%) | 0 (0.0%) |
| 19 to 25 Years | 101 (79.5%) | 26 (20.5%) |
| 26 to 34 Years | 90 (59.2%) | 62 (40.8%) |
| 35 to 44 Years | 314 (100.0%) | 0 (0.0%) |
| 45 to 54 Years | 626 (97.2%) | 18 (2.8%) |
| 55 to 64 Years | 271 (77.6%) | 78 (22.4%) |
| 65 to 74 Years | 510 (100.0%) | 0 (0.0%) |
| 75 Years and older | 660 (100.0%) | 0 (0.0%) |
| Total | 3,383 (94.8%) | 184 (5.2%) |
Health Insurance Coverage by Citizenship Status in Camden
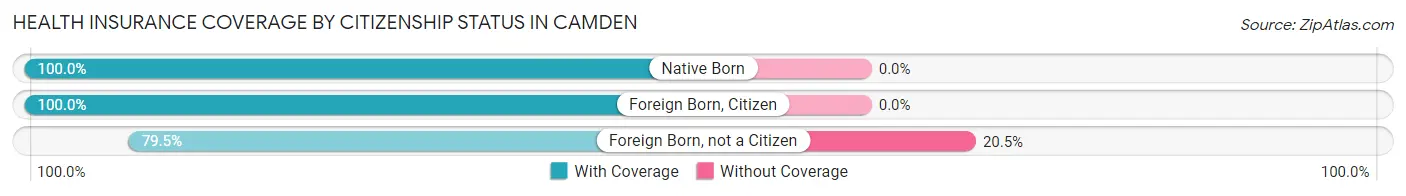
| Citizenship Status | With Coverage | Without Coverage |
| Native Born | 97 (100.0%) | 0 (0.0%) |
| Foreign Born, Citizen | 714 (100.0%) | 0 (0.0%) |
| Foreign Born, not a Citizen | 101 (79.5%) | 26 (20.5%) |
Health Insurance Coverage by Household Income in Camden
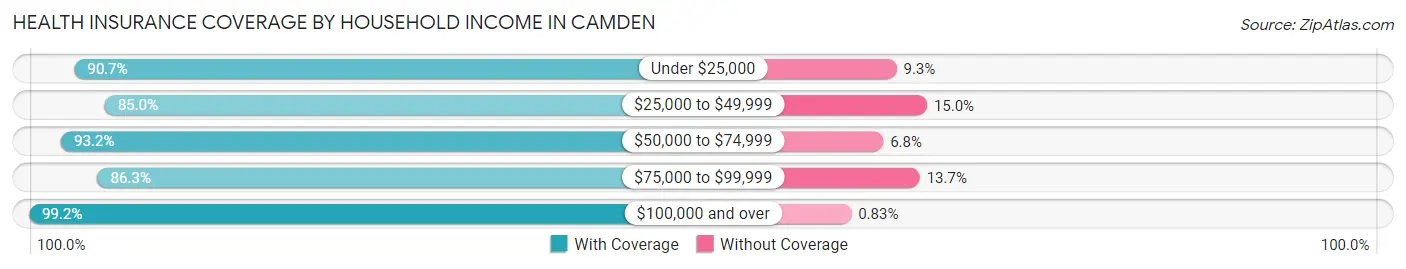
| Household Income | With Coverage | Without Coverage |
| Under $25,000 | 253 (90.7%) | 26 (9.3%) |
| $25,000 to $49,999 | 362 (85.0%) | 64 (15.0%) |
| $50,000 to $74,999 | 232 (93.2%) | 17 (6.8%) |
| $75,000 to $99,999 | 373 (86.3%) | 59 (13.7%) |
| $100,000 and over | 2,150 (99.2%) | 18 (0.8%) |
Public vs Private Health Insurance Coverage by Age in Camden
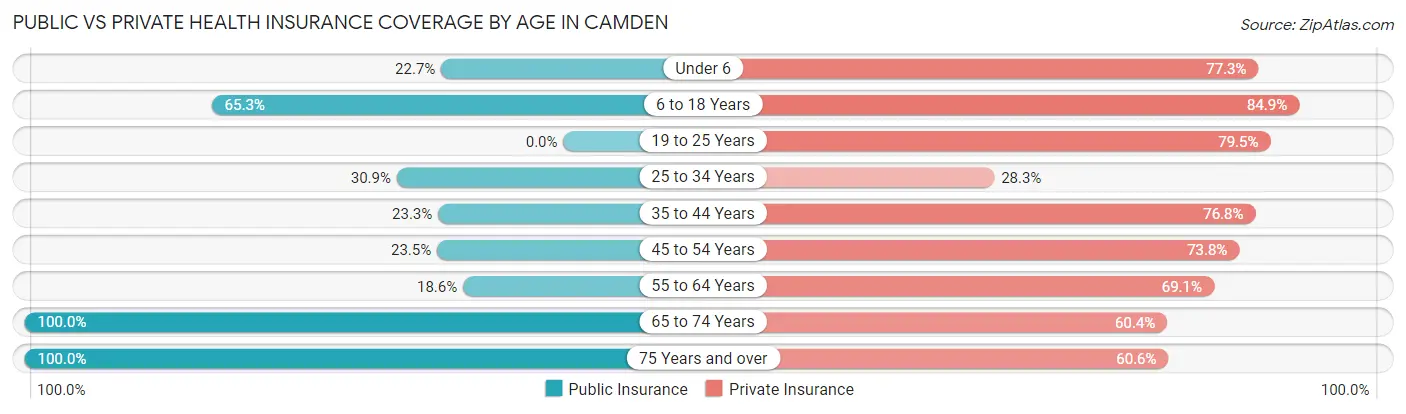
| Age Bracket | Public Insurance | Private Insurance |
| Under 6 | 22 (22.7%) | 75 (77.3%) |
| 6 to 18 Years | 466 (65.3%) | 606 (84.9%) |
| 19 to 25 Years | 0 (0.0%) | 101 (79.5%) |
| 25 to 34 Years | 47 (30.9%) | 43 (28.3%) |
| 35 to 44 Years | 73 (23.3%) | 241 (76.7%) |
| 45 to 54 Years | 151 (23.4%) | 475 (73.8%) |
| 55 to 64 Years | 65 (18.6%) | 241 (69.1%) |
| 65 to 74 Years | 510 (100.0%) | 308 (60.4%) |
| 75 Years and over | 660 (100.0%) | 400 (60.6%) |
| Total | 1,994 (55.9%) | 2,490 (69.8%) |
Disability Status by Sex by Age in Camden
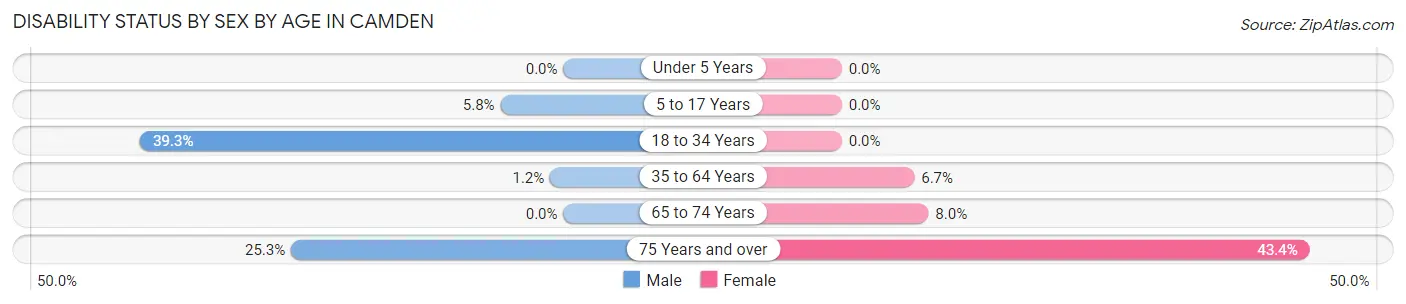
| Age Bracket | Male | Female |
| Under 5 Years | 0 (0.0%) | 0 (0.0%) |
| 5 to 17 Years | 25 (5.8%) | 0 (0.0%) |
| 18 to 34 Years | 77 (39.3%) | 0 (0.0%) |
| 35 to 64 Years | 8 (1.2%) | 44 (6.7%) |
| 65 to 74 Years | 0 (0.0%) | 25 (8.0%) |
| 75 Years and over | 69 (25.3%) | 168 (43.4%) |
Disability Class by Sex by Age in Camden
Disability Class: Hearing Difficulty
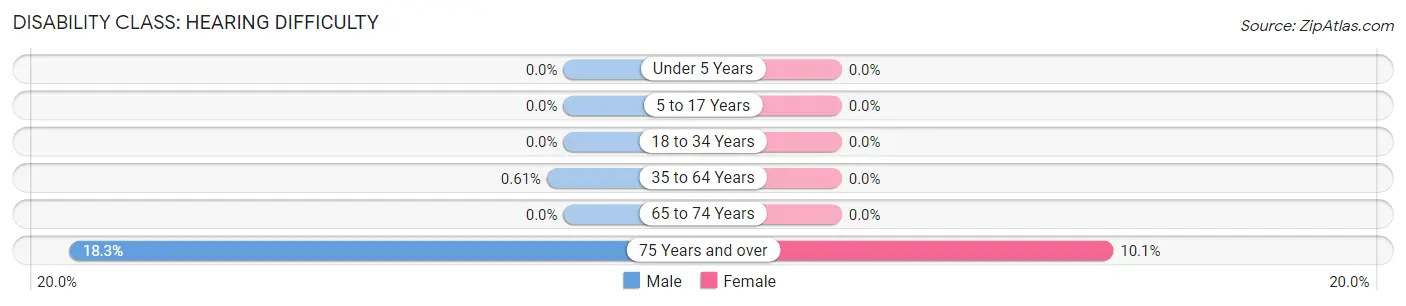
| Age Bracket | Male | Female |
| Under 5 Years | 0 (0.0%) | 0 (0.0%) |
| 5 to 17 Years | 0 (0.0%) | 0 (0.0%) |
| 18 to 34 Years | 0 (0.0%) | 0 (0.0%) |
| 35 to 64 Years | 4 (0.6%) | 0 (0.0%) |
| 65 to 74 Years | 0 (0.0%) | 0 (0.0%) |
| 75 Years and over | 50 (18.3%) | 39 (10.1%) |
Disability Class: Vision Difficulty
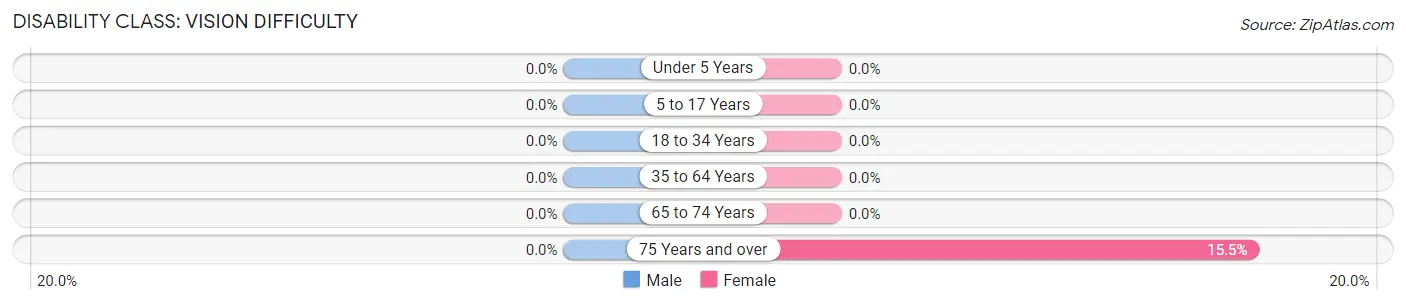
| Age Bracket | Male | Female |
| Under 5 Years | 0 (0.0%) | 0 (0.0%) |
| 5 to 17 Years | 0 (0.0%) | 0 (0.0%) |
| 18 to 34 Years | 0 (0.0%) | 0 (0.0%) |
| 35 to 64 Years | 0 (0.0%) | 0 (0.0%) |
| 65 to 74 Years | 0 (0.0%) | 0 (0.0%) |
| 75 Years and over | 0 (0.0%) | 60 (15.5%) |
Disability Class: Cognitive Difficulty
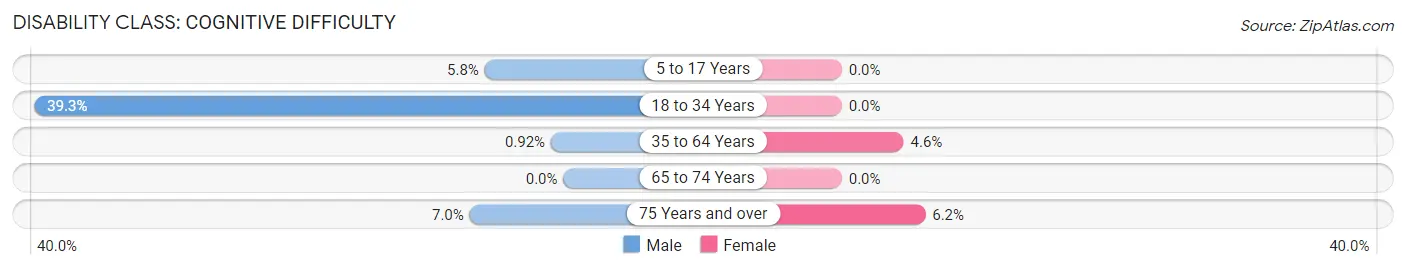
| Age Bracket | Male | Female |
| 5 to 17 Years | 25 (5.8%) | 0 (0.0%) |
| 18 to 34 Years | 77 (39.3%) | 0 (0.0%) |
| 35 to 64 Years | 6 (0.9%) | 30 (4.6%) |
| 65 to 74 Years | 0 (0.0%) | 0 (0.0%) |
| 75 Years and over | 19 (7.0%) | 24 (6.2%) |
Disability Class: Ambulatory Difficulty
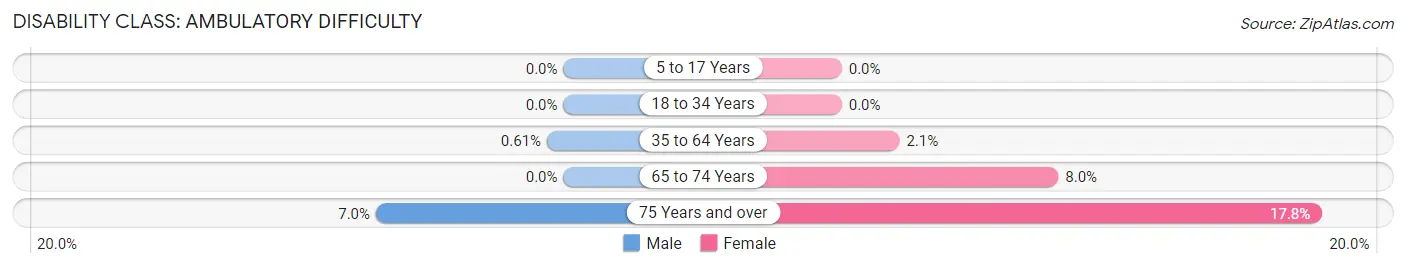
| Age Bracket | Male | Female |
| 5 to 17 Years | 0 (0.0%) | 0 (0.0%) |
| 18 to 34 Years | 0 (0.0%) | 0 (0.0%) |
| 35 to 64 Years | 4 (0.6%) | 14 (2.1%) |
| 65 to 74 Years | 0 (0.0%) | 25 (8.0%) |
| 75 Years and over | 19 (7.0%) | 69 (17.8%) |
Disability Class: Self-Care Difficulty
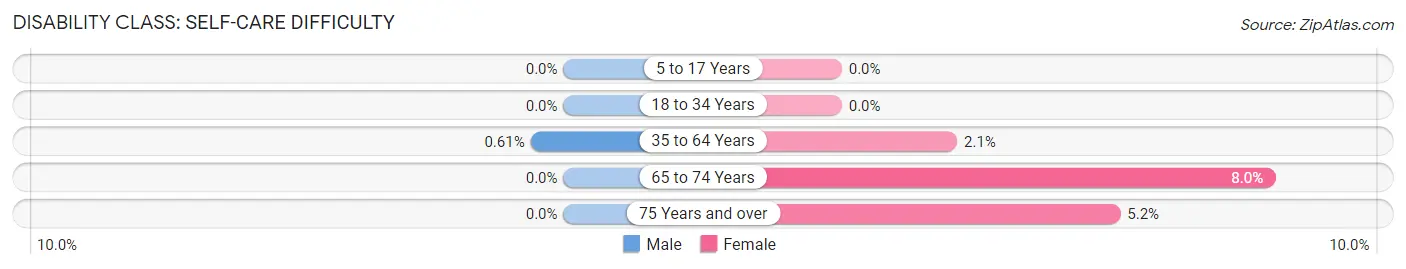
| Age Bracket | Male | Female |
| 5 to 17 Years | 0 (0.0%) | 0 (0.0%) |
| 18 to 34 Years | 0 (0.0%) | 0 (0.0%) |
| 35 to 64 Years | 4 (0.6%) | 14 (2.1%) |
| 65 to 74 Years | 0 (0.0%) | 25 (8.0%) |
| 75 Years and over | 0 (0.0%) | 20 (5.2%) |
Technology Access in Camden
Computing Device Access in Camden
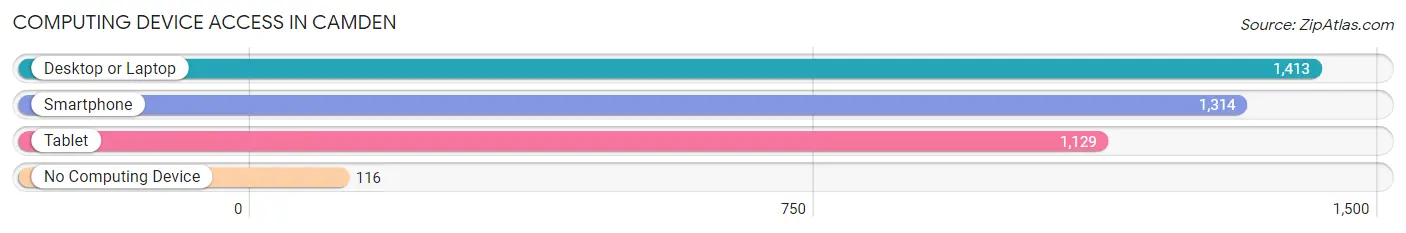
| Device Type | # Households | % Households |
| Desktop or Laptop | 1,413 | 86.3% |
| Smartphone | 1,314 | 80.2% |
| Tablet | 1,129 | 68.9% |
| No Computing Device | 116 | 7.1% |
| Total | 1,638 | 100.0% |
Internet Access in Camden
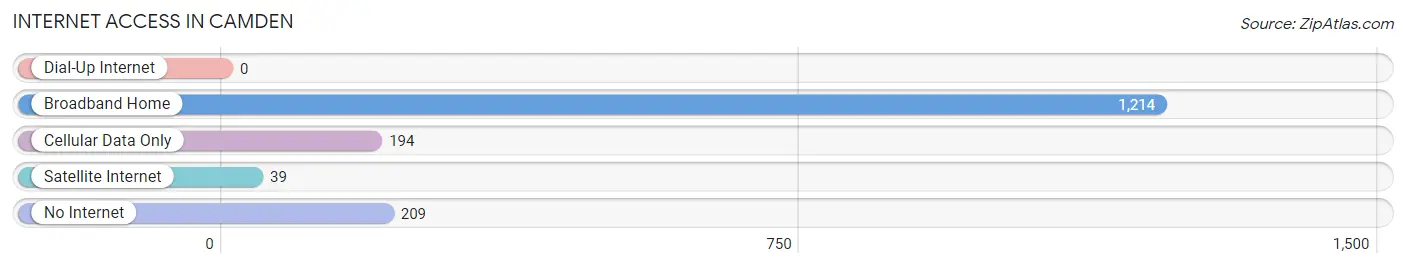
| Internet Type | # Households | % Households |
| Dial-Up Internet | 0 | 0.0% |
| Broadband Home | 1,214 | 74.1% |
| Cellular Data Only | 194 | 11.8% |
| Satellite Internet | 39 | 2.4% |
| No Internet | 209 | 12.8% |
| Total | 1,638 | 100.0% |
Camden Summary
Camden, Maine is a small town located in the Midcoast region of the state. It is situated on the western side of Penobscot Bay, approximately 25 miles northeast of the state capital of Augusta. The town has a population of approximately 4,850 people, according to the 2010 census.
History
The area that is now Camden was first settled in the late 1700s by Europeans. The town was incorporated in 1791 and named after Charles Pratt, the Earl of Camden. The town quickly became a popular destination for wealthy tourists, who built grand summer homes along the waterfront. The town was also home to a thriving shipbuilding industry, which produced many of the vessels used in the War of 1812.
In the late 1800s, Camden became a popular destination for wealthy tourists from the United States and Europe. The town was home to several grand hotels, including the Grand Hotel, which was built in 1883. The town also became a popular destination for artists, writers, and musicians, who were drawn to the area's natural beauty and peaceful atmosphere.
Geography
Camden is located in the Midcoast region of Maine, on the western side of Penobscot Bay. The town is bordered by the towns of Rockport to the north, Hope to the east, and Lincolnville to the south. The town is situated on a peninsula, with the harbor to the east and the Atlantic Ocean to the west. The town is home to several small islands, including Curtis Island, which is located in the harbor.
The town is home to several mountains, including Mount Battie, which rises to an elevation of 1,385 feet. The town is also home to several lakes, including Megunticook Lake, which is the largest lake in the area.
Economy
The economy of Camden is largely based on tourism. The town is home to several popular attractions, including the Camden Harbor, the Camden Opera House, and the Camden Snow Bowl. The town is also home to several museums, including the Farnsworth Art Museum and the Maine State Museum.
The town is also home to several businesses, including several restaurants, retail stores, and art galleries. The town is also home to several boatyards, which produce and repair boats for recreational and commercial use.
Demographics
According to the 2010 census, the population of Camden was 4,850 people. The racial makeup of the town was 94.3% White, 1.2% African American, 0.3% Native American, 1.2% Asian, 0.1% Pacific Islander, 0.7% from other races, and 2.3% from two or more races. The median household income was $45,938, and the median family income was $54,844.
The town is home to several churches, including the First Congregational Church, the Camden United Methodist Church, and the St. Thomas Episcopal Church. The town is also home to several schools, including the Camden-Rockport Elementary School, the Camden Hills Regional High School, and the Camden Hills Regional Technical Center.
Common Questions
What is Per Capita Income in Camden?
Per Capita income in Camden is $48,439.
What is the Median Family Income in Camden?
Median Family Income in Camden is $129,239.
What is the Median Household income in Camden?
Median Household Income in Camden is $92,857.
What is Inequality or Gini Index in Camden?
Inequality or Gini Index in Camden is 0.42.
What is the Total Population of Camden?
Total Population of Camden is 3,644.
What is the Total Male Population of Camden?
Total Male Population of Camden is 1,816.
What is the Total Female Population of Camden?
Total Female Population of Camden is 1,828.
What is the Ratio of Males per 100 Females in Camden?
There are 99.34 Males per 100 Females in Camden.
What is the Ratio of Females per 100 Males in Camden?
There are 100.66 Females per 100 Males in Camden.
What is the Median Population Age in Camden?
Median Population Age in Camden is 50.5 Years.
What is the Average Family Size in Camden
Average Family Size in Camden is 3.1 People.
What is the Average Household Size in Camden
Average Household Size in Camden is 2.2 People.
How Large is the Labor Force in Camden?
There are 1,595 People in the Labor Forcein in Camden.
What is the Percentage of People in the Labor Force in Camden?
53.2% of People are in the Labor Force in Camden.
What is the Unemployment Rate in Camden?
Unemployment Rate in Camden is 5.2%.