Mechanic Falls, ME Map & Demographics
Mechanic Falls Map
Mechanic Falls Overview
$22,986
PER CAPITA INCOME
$47,832
AVG FAMILY INCOME
$55,986
AVG HOUSEHOLD INCOME
38.6%
WAGE / INCOME GAP [ % ]
61.4¢/ $1
WAGE / INCOME GAP [ $ ]
0.34
INEQUALITY / GINI INDEX
2,286
TOTAL POPULATION
1,062
MALE POPULATION
1,224
FEMALE POPULATION
86.76
MALES / 100 FEMALES
115.25
FEMALES / 100 MALES
37.7
MEDIAN AGE
3.1
AVG FAMILY SIZE
2.7
AVG HOUSEHOLD SIZE
1,098
LABOR FORCE [ PEOPLE ]
66.4%
PERCENT IN LABOR FORCE
8.7%
UNEMPLOYMENT RATE
Mechanic Falls Zip Codes
Mechanic Falls Area Codes
Income in Mechanic Falls
Income Overview in Mechanic Falls
Per Capita Income in Mechanic Falls is $22,986, while median incomes of families and households are $47,832 and $55,986 respectively.
| Characteristic | Number | Measure |
| Per Capita Income | 2,286 | $22,986 |
| Median Family Income | 525 | $47,832 |
| Mean Family Income | 525 | $71,233 |
| Median Household Income | 816 | $55,986 |
| Mean Household Income | 816 | $64,158 |
| Income Deficit | 525 | $0 |
| Wage / Income Gap (%) | 2,286 | 38.57% |
| Wage / Income Gap ($) | 2,286 | 61.43¢ per $1 |
| Gini / Inequality Index | 2,286 | 0.34 |
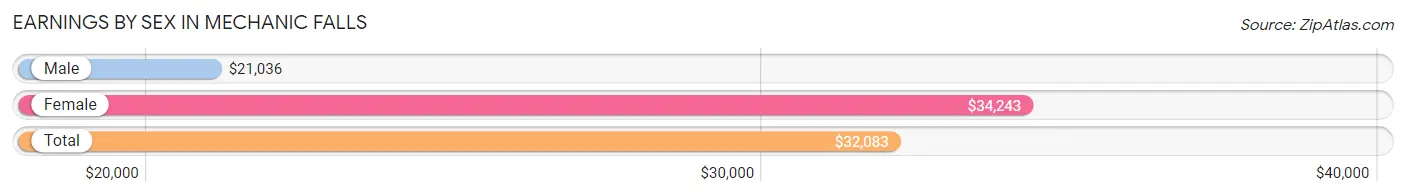
Earnings by Sex in Mechanic Falls
Average Earnings in Mechanic Falls are $32,083, $21,036 for men and $34,243 for women, a difference of 38.6%.
| Sex | Number | Average Earnings |
| Male | 637 (52.0%) | $21,036 |
| Female | 588 (48.0%) | $34,243 |
| Total | 1,225 (100.0%) | $32,083 |
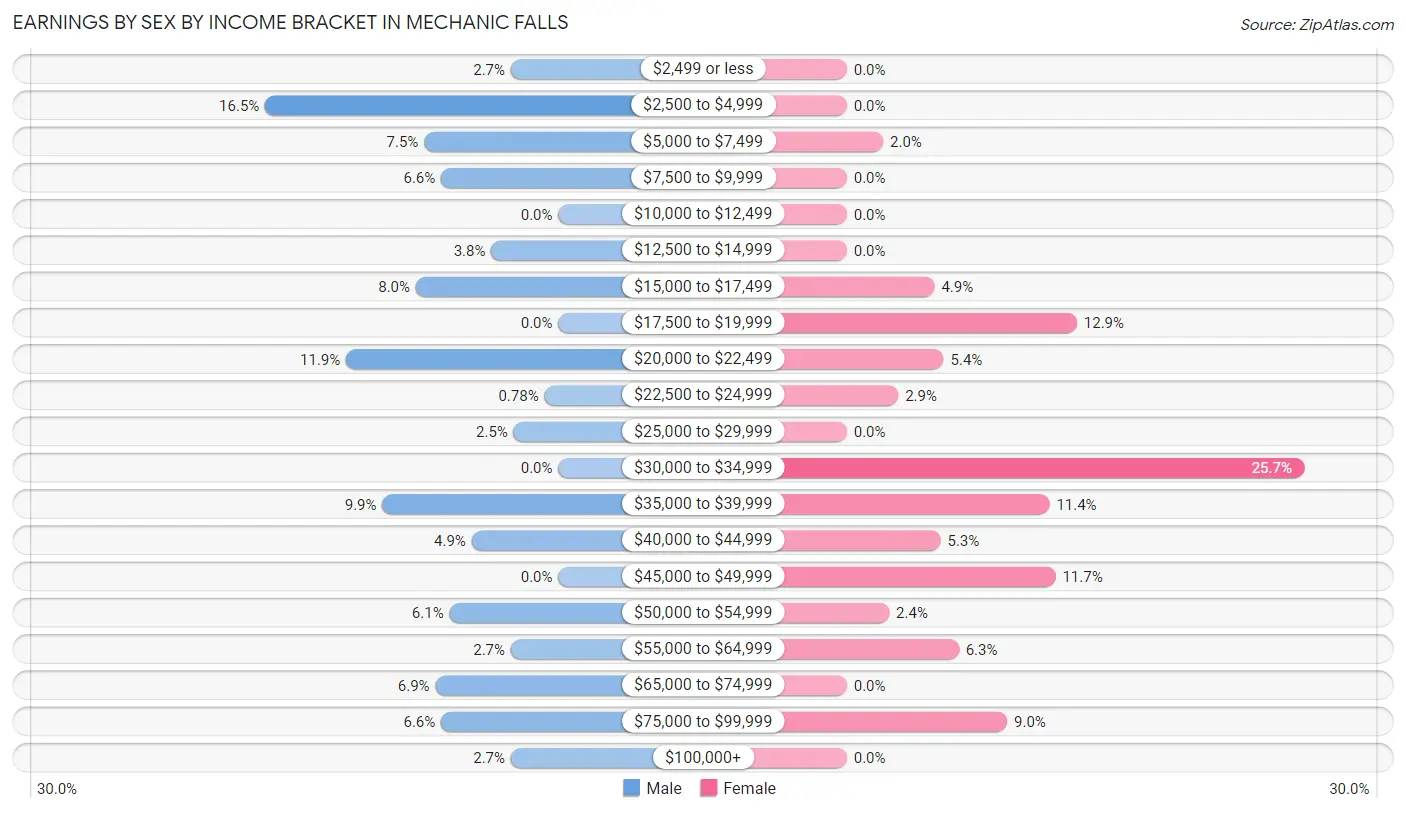
Earnings by Sex by Income Bracket in Mechanic Falls
The most common earnings brackets in Mechanic Falls are $2,500 to $4,999 for men (105 | 16.5%) and $30,000 to $34,999 for women (151 | 25.7%).
| Income | Male | Female |
| $2,499 or less | 17 (2.7%) | 0 (0.0%) |
| $2,500 to $4,999 | 105 (16.5%) | 0 (0.0%) |
| $5,000 to $7,499 | 48 (7.5%) | 12 (2.0%) |
| $7,500 to $9,999 | 42 (6.6%) | 0 (0.0%) |
| $10,000 to $12,499 | 0 (0.0%) | 0 (0.0%) |
| $12,500 to $14,999 | 24 (3.8%) | 0 (0.0%) |
| $15,000 to $17,499 | 51 (8.0%) | 29 (4.9%) |
| $17,500 to $19,999 | 0 (0.0%) | 76 (12.9%) |
| $20,000 to $22,499 | 76 (11.9%) | 32 (5.4%) |
| $22,500 to $24,999 | 5 (0.8%) | 17 (2.9%) |
| $25,000 to $29,999 | 16 (2.5%) | 0 (0.0%) |
| $30,000 to $34,999 | 0 (0.0%) | 151 (25.7%) |
| $35,000 to $39,999 | 63 (9.9%) | 67 (11.4%) |
| $40,000 to $44,999 | 31 (4.9%) | 31 (5.3%) |
| $45,000 to $49,999 | 0 (0.0%) | 69 (11.7%) |
| $50,000 to $54,999 | 39 (6.1%) | 14 (2.4%) |
| $55,000 to $64,999 | 17 (2.7%) | 37 (6.3%) |
| $65,000 to $74,999 | 44 (6.9%) | 0 (0.0%) |
| $75,000 to $99,999 | 42 (6.6%) | 53 (9.0%) |
| $100,000+ | 17 (2.7%) | 0 (0.0%) |
| Total | 637 (100.0%) | 588 (100.0%) |
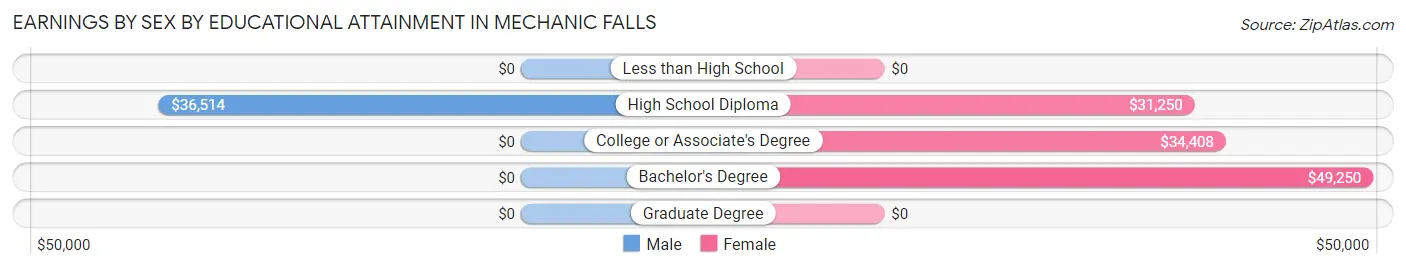
Earnings by Sex by Educational Attainment in Mechanic Falls
Average earnings in Mechanic Falls are $27,578 for men and $33,289 for women, a difference of 17.2%. Men with an educational attainment of high school diploma enjoy the highest average annual earnings of $36,514, while those with high school diploma education earn the least with $36,514. Women with an educational attainment of bachelor's degree earn the most with the average annual earnings of $49,250, while those with high school diploma education have the smallest earnings of $31,250.
| Educational Attainment | Male Income | Female Income |
| Less than High School | - | - |
| High School Diploma | $36,514 | $31,250 |
| College or Associate's Degree | - | - |
| Bachelor's Degree | - | - |
| Graduate Degree | - | - |
| Total | $27,578 | $33,289 |
Family Income in Mechanic Falls
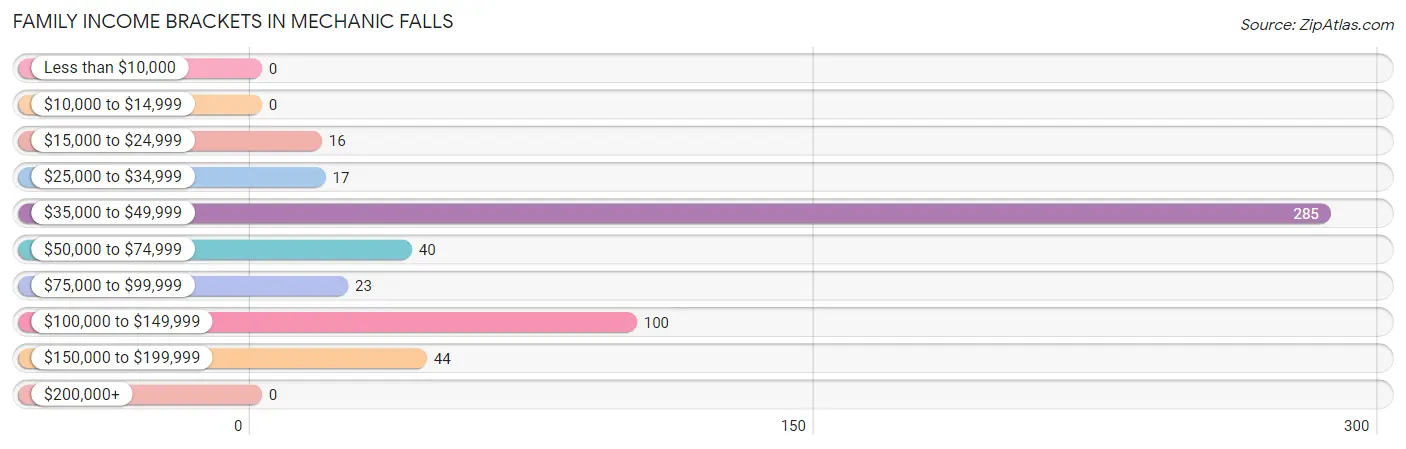
Family Income Brackets in Mechanic Falls
According to the Mechanic Falls family income data, there are 285 families falling into the $35,000 to $49,999 income range, which is the most common income bracket and makes up 54.3% of all families.
| Income Bracket | # Families | % Families |
| Less than $10,000 | 0 | 0.0% |
| $10,000 to $14,999 | 0 | 0.0% |
| $15,000 to $24,999 | 16 | 3.0% |
| $25,000 to $34,999 | 17 | 3.2% |
| $35,000 to $49,999 | 285 | 54.3% |
| $50,000 to $74,999 | 40 | 7.6% |
| $75,000 to $99,999 | 23 | 4.4% |
| $100,000 to $149,999 | 100 | 19.0% |
| $150,000 to $199,999 | 44 | 8.4% |
| $200,000+ | 0 | 0.0% |
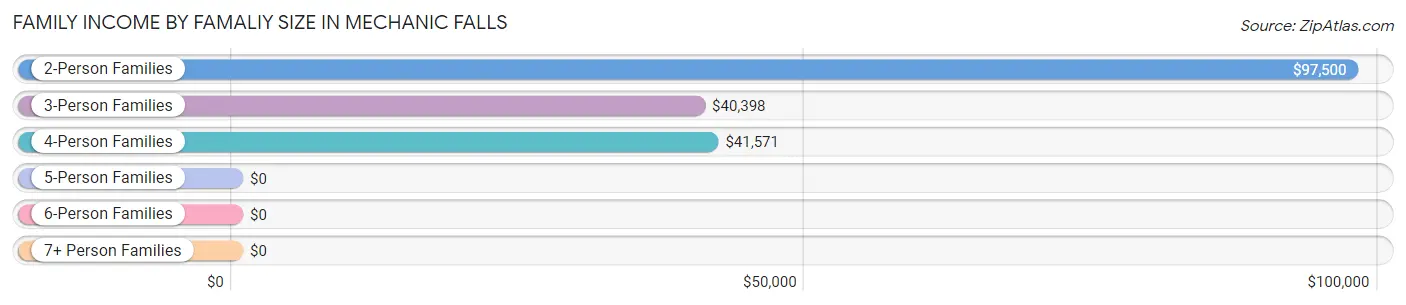
Family Income by Famaliy Size in Mechanic Falls
2-person families (190 | 36.2%) account for the highest median family income in Mechanic Falls with $97,500 per family, while 2-person families (190 | 36.2%) have the highest median income of $48,750 per family member.
| Income Bracket | # Families | Median Income |
| 2-Person Families | 190 (36.2%) | $97,500 |
| 3-Person Families | 103 (19.6%) | $40,398 |
| 4-Person Families | 201 (38.3%) | $41,571 |
| 5-Person Families | 31 (5.9%) | $0 |
| 6-Person Families | 0 (0.0%) | $0 |
| 7+ Person Families | 0 (0.0%) | $0 |
| Total | 525 (100.0%) | $47,832 |
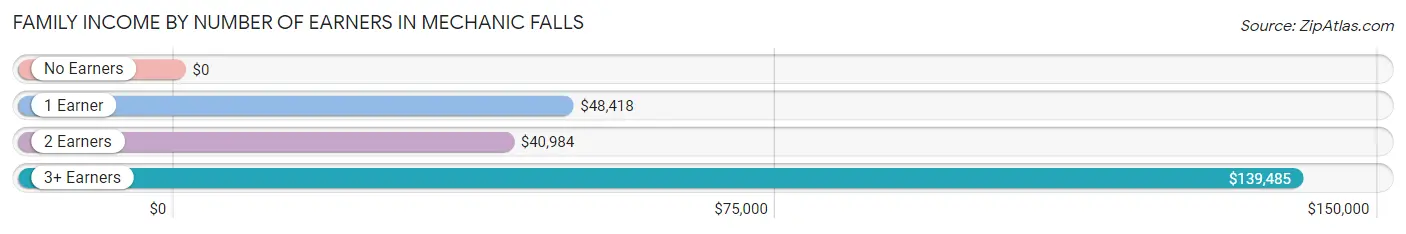
Family Income by Number of Earners in Mechanic Falls
| Number of Earners | # Families | Median Income |
| No Earners | 41 (7.8%) | $0 |
| 1 Earner | 151 (28.8%) | $48,418 |
| 2 Earners | 296 (56.4%) | $40,984 |
| 3+ Earners | 37 (7.0%) | $139,485 |
| Total | 525 (100.0%) | $47,832 |
Household Income in Mechanic Falls
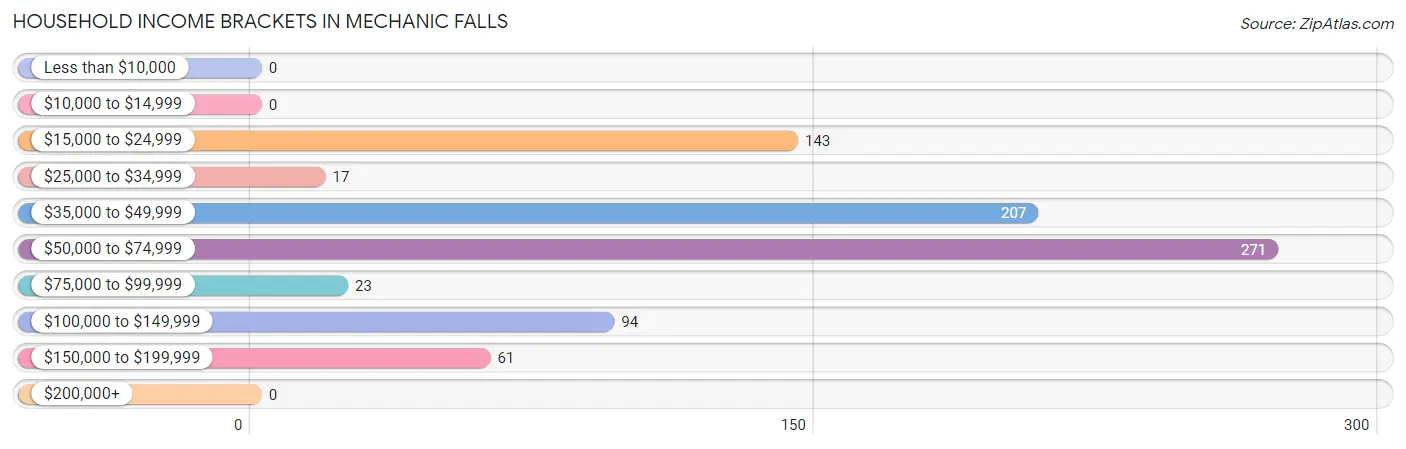
Household Income Brackets in Mechanic Falls
With 271 households falling in the category, the $50,000 to $74,999 income range is the most frequent in Mechanic Falls, accounting for 33.2% of all households.
| Income Bracket | # Households | % Households |
| Less than $10,000 | 0 | 0.0% |
| $10,000 to $14,999 | 0 | 0.0% |
| $15,000 to $24,999 | 143 | 17.5% |
| $25,000 to $34,999 | 17 | 2.1% |
| $35,000 to $49,999 | 207 | 25.4% |
| $50,000 to $74,999 | 271 | 33.2% |
| $75,000 to $99,999 | 23 | 2.8% |
| $100,000 to $149,999 | 94 | 11.5% |
| $150,000 to $199,999 | 61 | 7.5% |
| $200,000+ | 0 | 0.0% |
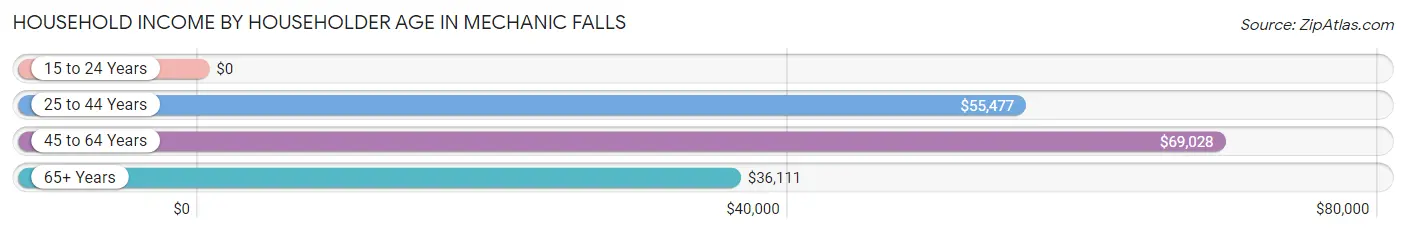
Household Income by Householder Age in Mechanic Falls
The median household income in Mechanic Falls is $55,986, with the highest median household income of $69,028 found in the 45 to 64 years age bracket for the primary householder. A total of 343 households (42.0%) fall into this category.
| Income Bracket | # Households | Median Income |
| 15 to 24 Years | 0 (0.0%) | $0 |
| 25 to 44 Years | 305 (37.4%) | $55,477 |
| 45 to 64 Years | 343 (42.0%) | $69,028 |
| 65+ Years | 168 (20.6%) | $36,111 |
| Total | 816 (100.0%) | $55,986 |
Poverty in Mechanic Falls
Income Below Poverty by Sex and Age in Mechanic Falls
With 12.3% poverty level for males and 4.2% for females among the residents of Mechanic Falls, 5 year old males and under 5 year old females are the most vulnerable to poverty, with 12 males (100.0%) and 18 females (100.0%) in their respective age groups living below the poverty level.
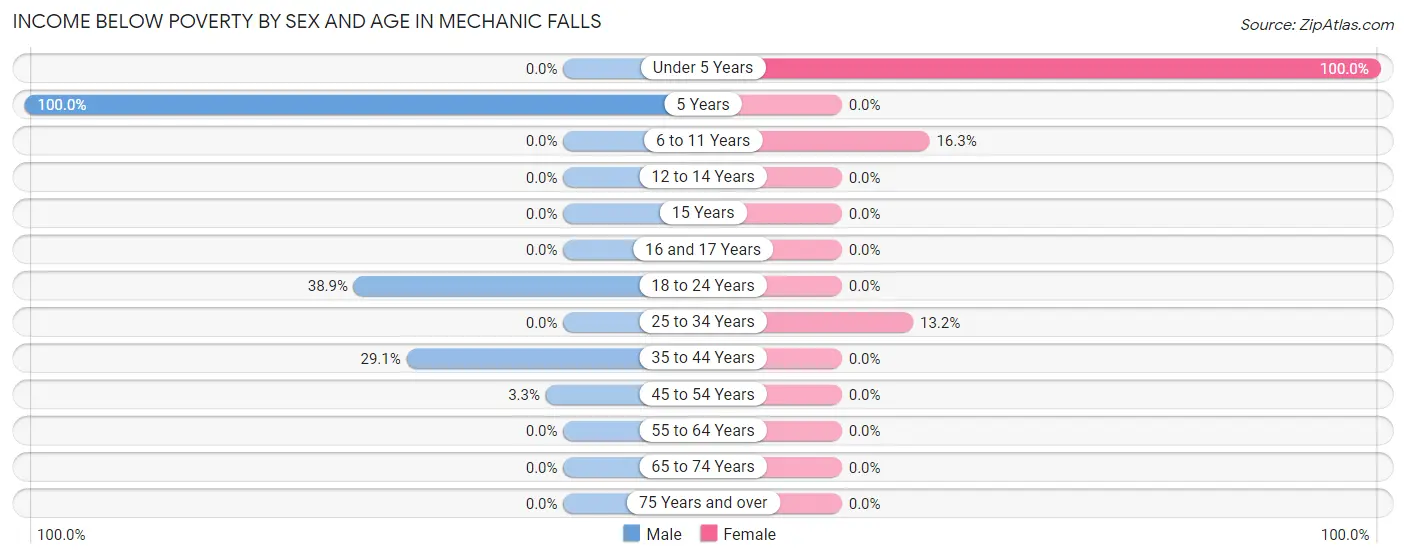
| Age Bracket | Male | Female |
| Under 5 Years | 0 (0.0%) | 18 (100.0%) |
| 5 Years | 12 (100.0%) | 0 (0.0%) |
| 6 to 11 Years | 0 (0.0%) | 14 (16.3%) |
| 12 to 14 Years | 0 (0.0%) | 0 (0.0%) |
| 15 Years | 0 (0.0%) | 0 (0.0%) |
| 16 and 17 Years | 0 (0.0%) | 0 (0.0%) |
| 18 to 24 Years | 42 (38.9%) | 0 (0.0%) |
| 25 to 34 Years | 0 (0.0%) | 16 (13.2%) |
| 35 to 44 Years | 62 (29.1%) | 0 (0.0%) |
| 45 to 54 Years | 3 (3.3%) | 0 (0.0%) |
| 55 to 64 Years | 0 (0.0%) | 0 (0.0%) |
| 65 to 74 Years | 0 (0.0%) | 0 (0.0%) |
| 75 Years and over | 0 (0.0%) | 0 (0.0%) |
| Total | 119 (12.3%) | 48 (4.2%) |
Income Above Poverty by Sex and Age in Mechanic Falls
According to the poverty statistics in Mechanic Falls, males aged under 5 years and females aged 5 years are the age groups that are most secure financially, with 100.0% of males and 100.0% of females in these age groups living above the poverty line.
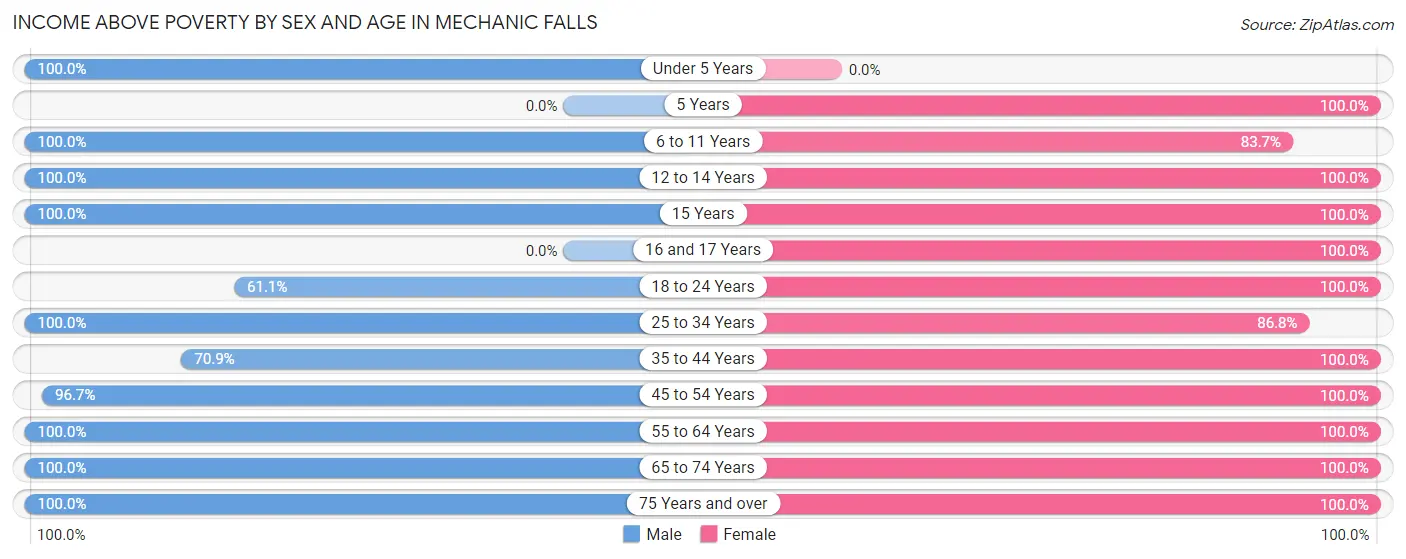
| Age Bracket | Male | Female |
| Under 5 Years | 27 (100.0%) | 0 (0.0%) |
| 5 Years | 0 (0.0%) | 56 (100.0%) |
| 6 to 11 Years | 14 (100.0%) | 72 (83.7%) |
| 12 to 14 Years | 152 (100.0%) | 91 (100.0%) |
| 15 Years | 14 (100.0%) | 35 (100.0%) |
| 16 and 17 Years | 0 (0.0%) | 79 (100.0%) |
| 18 to 24 Years | 66 (61.1%) | 76 (100.0%) |
| 25 to 34 Years | 64 (100.0%) | 105 (86.8%) |
| 35 to 44 Years | 151 (70.9%) | 225 (100.0%) |
| 45 to 54 Years | 89 (96.7%) | 123 (100.0%) |
| 55 to 64 Years | 128 (100.0%) | 80 (100.0%) |
| 65 to 74 Years | 123 (100.0%) | 121 (100.0%) |
| 75 Years and over | 23 (100.0%) | 29 (100.0%) |
| Total | 851 (87.7%) | 1,092 (95.8%) |
Income Below Poverty Among Married-Couple Families in Mechanic Falls
The poverty statistics for married-couple families in Mechanic Falls show that 5.7% or 16 of the total 279 families live below the poverty line. Families with 3 or 4 children have the highest poverty rate of 100.0%, comprising of 16 families. On the other hand, families with no children have the lowest poverty rate of 0.0%, which includes 0 families.
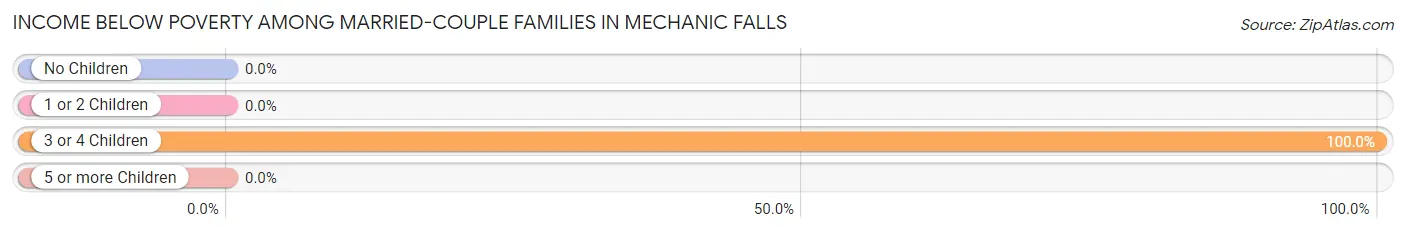
| Children | Above Poverty | Below Poverty |
| No Children | 188 (100.0%) | 0 (0.0%) |
| 1 or 2 Children | 75 (100.0%) | 0 (0.0%) |
| 3 or 4 Children | 0 (0.0%) | 16 (100.0%) |
| 5 or more Children | 0 (0.0%) | 0 (0.0%) |
| Total | 263 (94.3%) | 16 (5.7%) |
Income Below Poverty Among Single-Parent Households in Mechanic Falls
| Children | Single Father | Single Mother |
| No Children | 0 (0.0%) | 0 (0.0%) |
| 1 or 2 Children | 0 (0.0%) | 0 (0.0%) |
| 3 or 4 Children | 0 (0.0%) | 0 (0.0%) |
| 5 or more Children | 0 (0.0%) | 0 (0.0%) |
| Total | 0 (0.0%) | 0 (0.0%) |
Income Below Poverty Among Married-Couple vs Single-Parent Households in Mechanic Falls
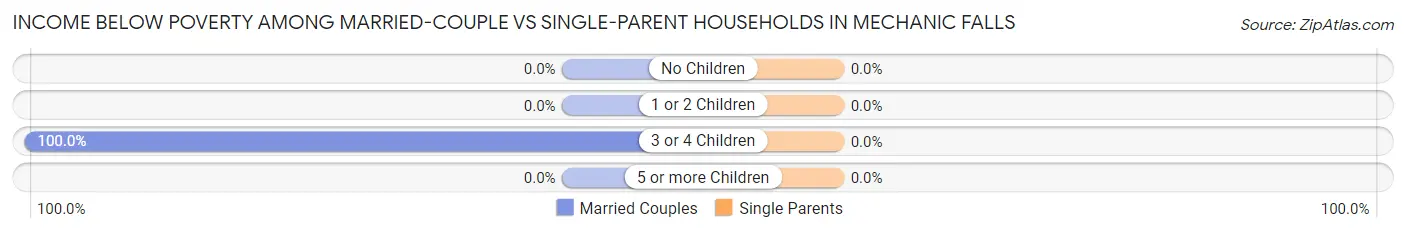
| Children | Married-Couple Families | Single-Parent Households |
| No Children | 0 (0.0%) | 0 (0.0%) |
| 1 or 2 Children | 0 (0.0%) | 0 (0.0%) |
| 3 or 4 Children | 16 (100.0%) | 0 (0.0%) |
| 5 or more Children | 0 (0.0%) | 0 (0.0%) |
| Total | 16 (5.7%) | 0 (0.0%) |
Race in Mechanic Falls
The most populous races in Mechanic Falls are White / Caucasian (1,861 | 81.4%), Two or more Races (284 | 12.4%), and Black / African American (90 | 3.9%).
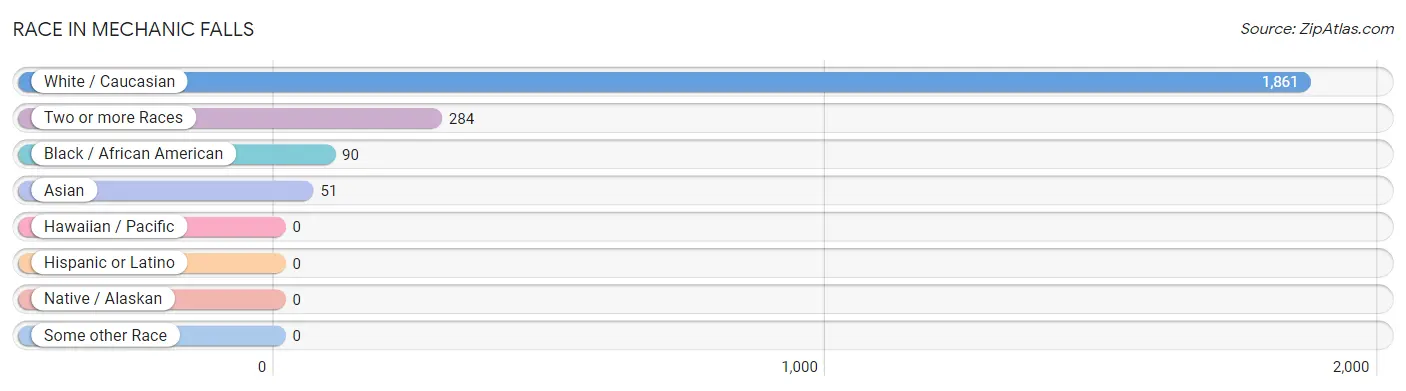
| Race | # Population | % Population |
| Asian | 51 | 2.2% |
| Black / African American | 90 | 3.9% |
| Hawaiian / Pacific | 0 | 0.0% |
| Hispanic or Latino | 0 | 0.0% |
| Native / Alaskan | 0 | 0.0% |
| White / Caucasian | 1,861 | 81.4% |
| Two or more Races | 284 | 12.4% |
| Some other Race | 0 | 0.0% |
| Total | 2,286 | 100.0% |
Ancestry in Mechanic Falls
The most populous ancestries reported in Mechanic Falls are English (866 | 37.9%), French Canadian (318 | 13.9%), German (272 | 11.9%), American (234 | 10.2%), and Irish (116 | 5.1%), together accounting for 79.0% of all Mechanic Falls residents.
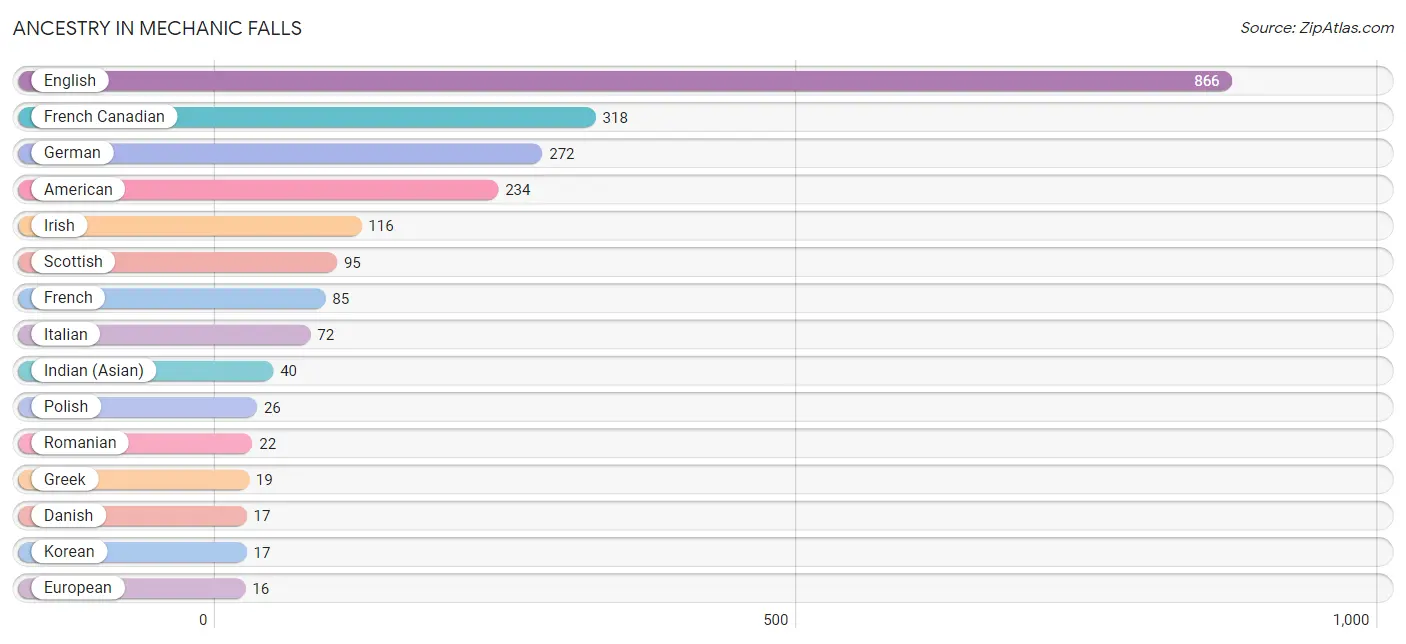
| Ancestry | # Population | % Population |
| American | 234 | 10.2% |
| Canadian | 4 | 0.2% |
| Danish | 17 | 0.7% |
| English | 866 | 37.9% |
| European | 16 | 0.7% |
| French | 85 | 3.7% |
| French Canadian | 318 | 13.9% |
| German | 272 | 11.9% |
| Greek | 19 | 0.8% |
| Indian (Asian) | 40 | 1.8% |
| Irish | 116 | 5.1% |
| Italian | 72 | 3.2% |
| Korean | 17 | 0.7% |
| Polish | 26 | 1.1% |
| Romanian | 22 | 1.0% |
| Scottish | 95 | 4.2% | View All 16 Rows |
Immigrants in Mechanic Falls
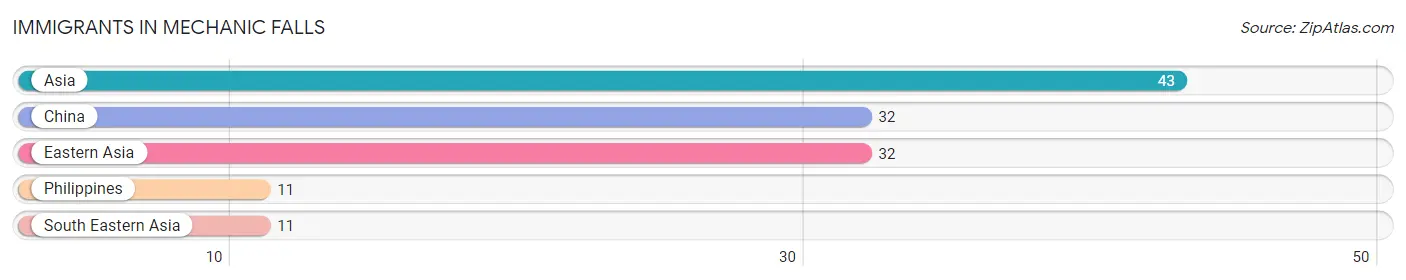
The most numerous immigrant groups reported in Mechanic Falls came from Asia (43 | 1.9%), China (32 | 1.4%), Eastern Asia (32 | 1.4%), Philippines (11 | 0.5%), and South Eastern Asia (11 | 0.5%), together accounting for 5.6% of all Mechanic Falls residents.
| Immigration Origin | # Population | % Population |
| Asia | 43 | 1.9% |
| China | 32 | 1.4% |
| Eastern Asia | 32 | 1.4% |
| Philippines | 11 | 0.5% |
| South Eastern Asia | 11 | 0.5% | View All 5 Rows |
Sex and Age in Mechanic Falls
Sex and Age in Mechanic Falls
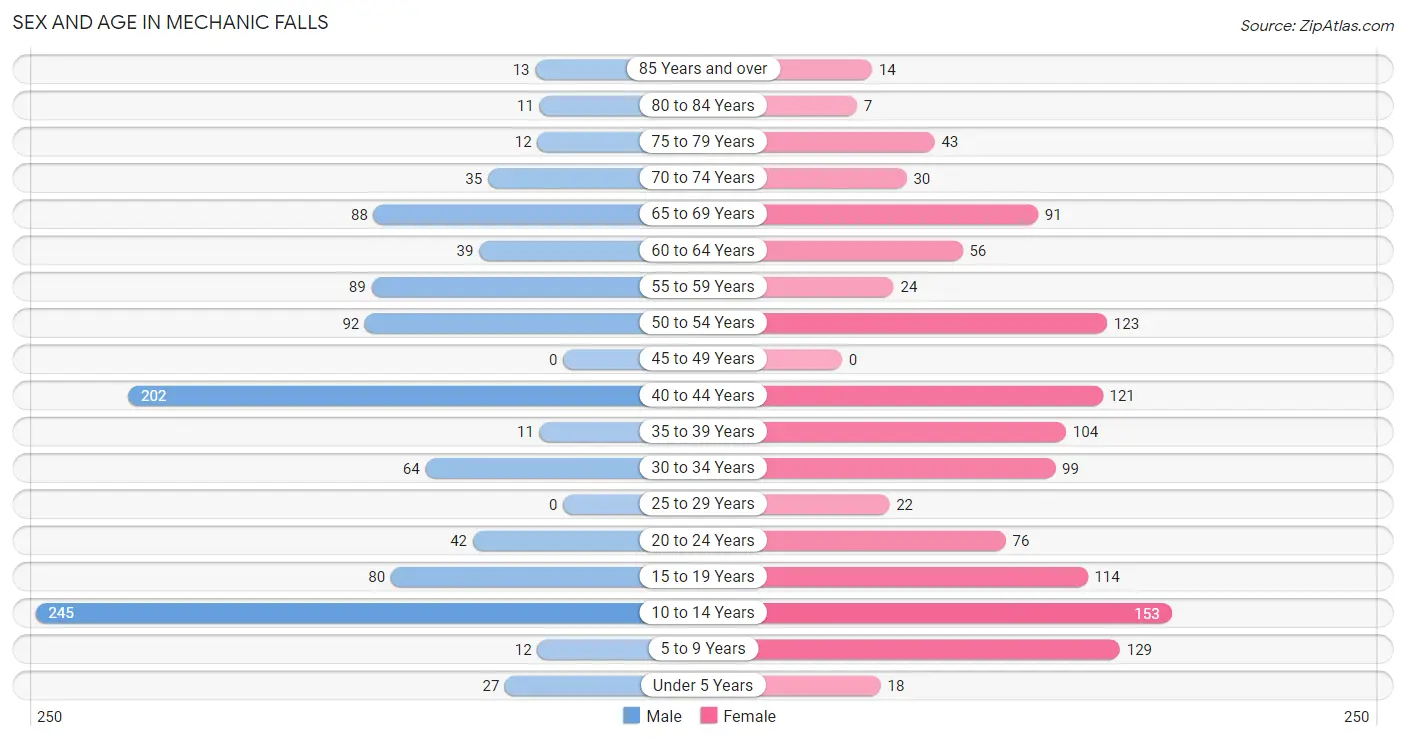
The most populous age groups in Mechanic Falls are 10 to 14 Years (245 | 23.1%) for men and 10 to 14 Years (153 | 12.5%) for women.
| Age Bracket | Male | Female |
| Under 5 Years | 27 (2.5%) | 18 (1.5%) |
| 5 to 9 Years | 12 (1.1%) | 129 (10.5%) |
| 10 to 14 Years | 245 (23.1%) | 153 (12.5%) |
| 15 to 19 Years | 80 (7.5%) | 114 (9.3%) |
| 20 to 24 Years | 42 (4.0%) | 76 (6.2%) |
| 25 to 29 Years | 0 (0.0%) | 22 (1.8%) |
| 30 to 34 Years | 64 (6.0%) | 99 (8.1%) |
| 35 to 39 Years | 11 (1.0%) | 104 (8.5%) |
| 40 to 44 Years | 202 (19.0%) | 121 (9.9%) |
| 45 to 49 Years | 0 (0.0%) | 0 (0.0%) |
| 50 to 54 Years | 92 (8.7%) | 123 (10.1%) |
| 55 to 59 Years | 89 (8.4%) | 24 (2.0%) |
| 60 to 64 Years | 39 (3.7%) | 56 (4.6%) |
| 65 to 69 Years | 88 (8.3%) | 91 (7.4%) |
| 70 to 74 Years | 35 (3.3%) | 30 (2.5%) |
| 75 to 79 Years | 12 (1.1%) | 43 (3.5%) |
| 80 to 84 Years | 11 (1.0%) | 7 (0.6%) |
| 85 Years and over | 13 (1.2%) | 14 (1.1%) |
| Total | 1,062 (100.0%) | 1,224 (100.0%) |
Families and Households in Mechanic Falls
Median Family Size in Mechanic Falls
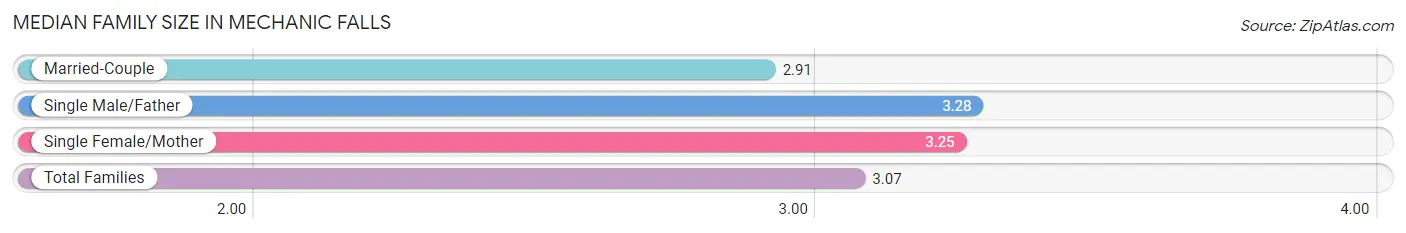
The median family size in Mechanic Falls is 3.07 persons per family, with single male/father families (36 | 6.9%) accounting for the largest median family size of 3.28 persons per family. On the other hand, married-couple families (279 | 53.1%) represent the smallest median family size with 2.91 persons per family.
| Family Type | # Families | Family Size |
| Married-Couple | 279 (53.1%) | 2.91 |
| Single Male/Father | 36 (6.9%) | 3.28 |
| Single Female/Mother | 210 (40.0%) | 3.25 |
| Total Families | 525 (100.0%) | 3.07 |
Median Household Size in Mechanic Falls
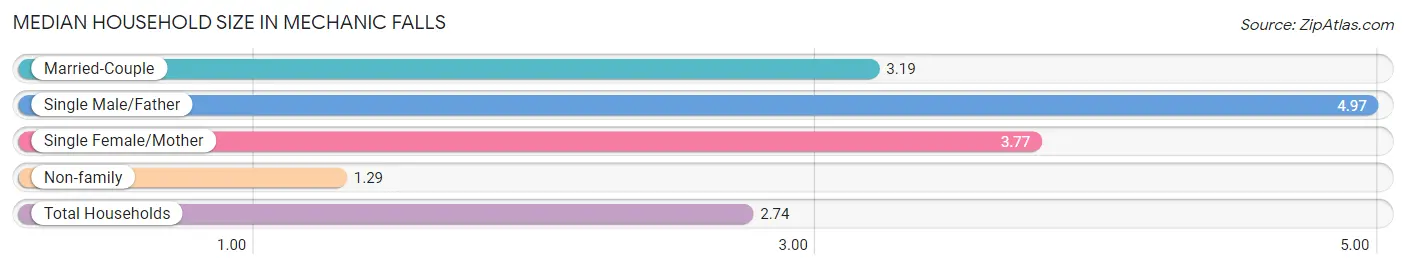
The median household size in Mechanic Falls is 2.74 persons per household, with single male/father households (36 | 4.4%) accounting for the largest median household size of 4.97 persons per household. non-family households (291 | 35.7%) represent the smallest median household size with 1.29 persons per household.
| Household Type | # Households | Household Size |
| Married-Couple | 279 (34.2%) | 3.19 |
| Single Male/Father | 36 (4.4%) | 4.97 |
| Single Female/Mother | 210 (25.7%) | 3.77 |
| Non-family | 291 (35.7%) | 1.29 |
| Total Households | 816 (100.0%) | 2.74 |
Household Size by Marriage Status in Mechanic Falls
Out of a total of 816 households in Mechanic Falls, 525 (64.3%) are family households, while 291 (35.7%) are nonfamily households. The most numerous type of family households are 2-person households, comprising 173, and the most common type of nonfamily households are 1-person households, comprising 228.
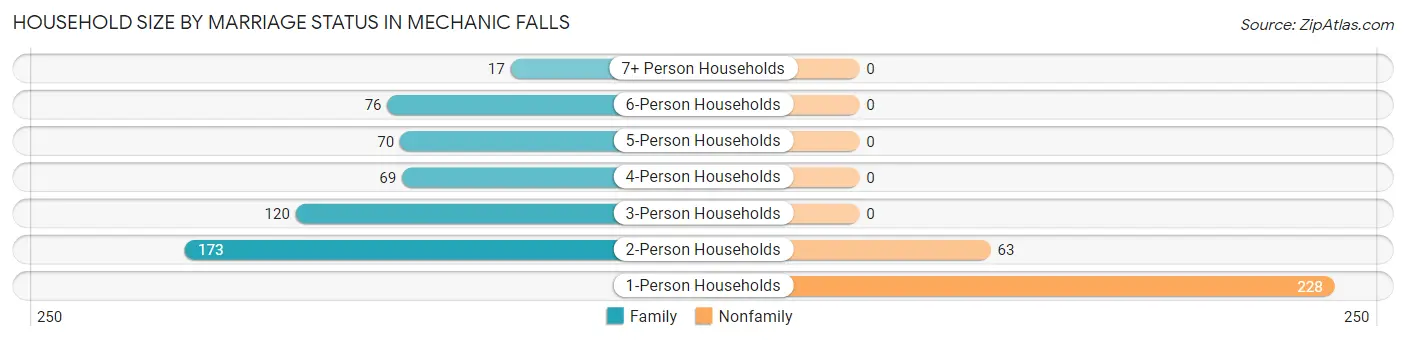
| Household Size | Family Households | Nonfamily Households |
| 1-Person Households | - | 228 (27.9%) |
| 2-Person Households | 173 (21.2%) | 63 (7.7%) |
| 3-Person Households | 120 (14.7%) | 0 (0.0%) |
| 4-Person Households | 69 (8.5%) | 0 (0.0%) |
| 5-Person Households | 70 (8.6%) | 0 (0.0%) |
| 6-Person Households | 76 (9.3%) | 0 (0.0%) |
| 7+ Person Households | 17 (2.1%) | 0 (0.0%) |
| Total | 525 (64.3%) | 291 (35.7%) |
Female Fertility in Mechanic Falls
Fertility by Age in Mechanic Falls
| Age Bracket | Women with Births | Births / 1,000 Women |
| 15 to 19 years | 0 (0.0%) | 0.0 |
| 20 to 34 years | 0 (0.0%) | 0.0 |
| 35 to 50 years | 0 (0.0%) | 0.0 |
| Total | 0 (0.0%) | 0.0 |
Fertility by Age by Marriage Status in Mechanic Falls
| Age Bracket | Married | Unmarried |
| 15 to 19 years | 0 (0.0%) | 0 (0.0%) |
| 20 to 34 years | 0 (0.0%) | 0 (0.0%) |
| 35 to 50 years | 0 (0.0%) | 0 (0.0%) |
| Total | 0 (0.0%) | 0 (0.0%) |
Fertility by Education in Mechanic Falls
| Educational Attainment | Women with Births | Births / 1,000 Women |
| Less than High School | 0 (0.0%) | 0.0 |
| High School Diploma | 0 (0.0%) | 0.0 |
| College or Associate's Degree | 0 (0.0%) | 0.0 |
| Bachelor's Degree | 0 (0.0%) | 0.0 |
| Graduate Degree | 0 (0.0%) | 0.0 |
| Total | 0 (0.0%) | 0.0 |
Fertility by Education by Marriage Status in Mechanic Falls
| Educational Attainment | Married | Unmarried |
| Less than High School | 0 (0.0%) | 0 (0.0%) |
| High School Diploma | 0 (0.0%) | 0 (0.0%) |
| College or Associate's Degree | 0 (0.0%) | 0 (0.0%) |
| Bachelor's Degree | 0 (0.0%) | 0 (0.0%) |
| Graduate Degree | 0 (0.0%) | 0 (0.0%) |
| Total | 0 (0.0%) | 0 (0.0%) |
Employment Characteristics in Mechanic Falls
Employment by Class of Employer in Mechanic Falls
Among the 1,002 employed individuals in Mechanic Falls, private company employees (747 | 74.6%), self-employed (not incorporated) (112 | 11.2%), and not-for-profit organizations (52 | 5.2%) make up the most common classes of employment.
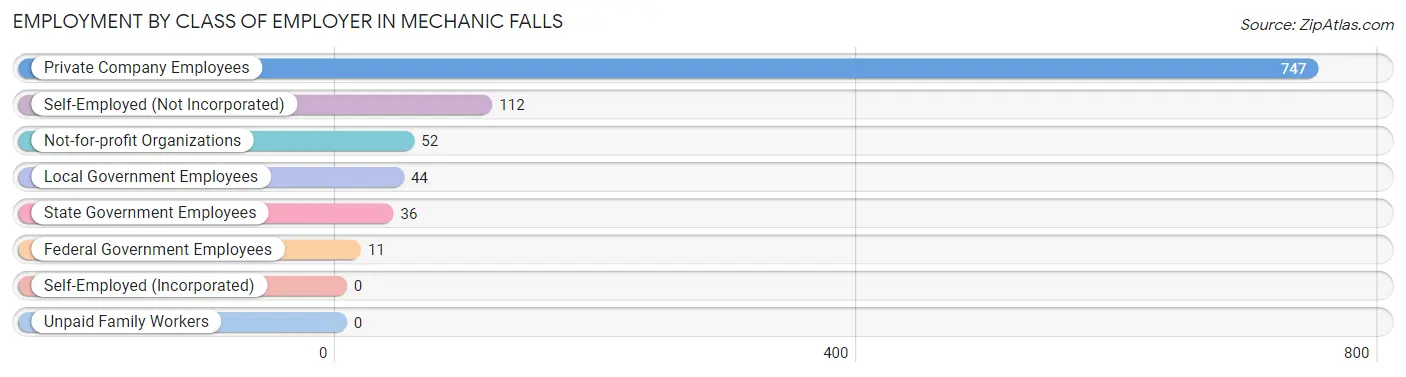
| Employer Class | # Employees | % Employees |
| Private Company Employees | 747 | 74.6% |
| Self-Employed (Incorporated) | 0 | 0.0% |
| Self-Employed (Not Incorporated) | 112 | 11.2% |
| Not-for-profit Organizations | 52 | 5.2% |
| Local Government Employees | 44 | 4.4% |
| State Government Employees | 36 | 3.6% |
| Federal Government Employees | 11 | 1.1% |
| Unpaid Family Workers | 0 | 0.0% |
| Total | 1,002 | 100.0% |
Employment Status by Age in Mechanic Falls
According to the labor force statistics for Mechanic Falls, out of the total population over 16 years of age (1,653), 66.4% or 1,098 individuals are in the labor force, with 8.7% or 96 of them unemployed. The age group with the highest labor force participation rate is 20 to 24 years, with 100.0% or 118 individuals in the labor force. Within the labor force, the 30 to 34 years age range has the highest percentage of unemployed individuals, with 22.9% or 19 of them being unemployed.
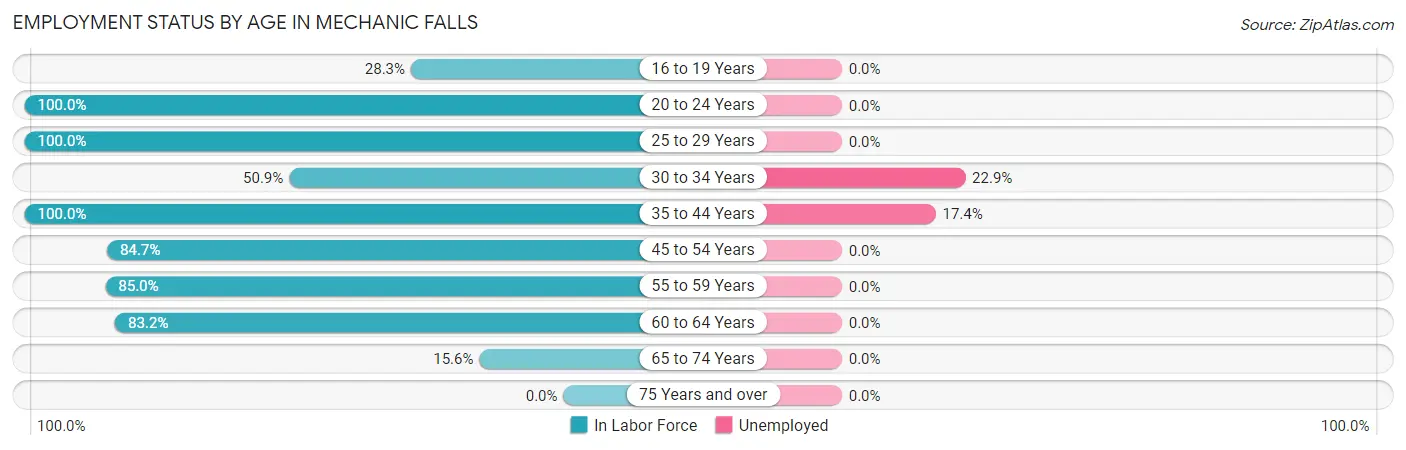
| Age Bracket | In Labor Force | Unemployed |
| 16 to 19 Years | 41 (28.3%) | 0 (0.0%) |
| 20 to 24 Years | 118 (100.0%) | 0 (0.0%) |
| 25 to 29 Years | 22 (100.0%) | 0 (0.0%) |
| 30 to 34 Years | 83 (50.9%) | 19 (22.9%) |
| 35 to 44 Years | 438 (100.0%) | 76 (17.4%) |
| 45 to 54 Years | 182 (84.7%) | 0 (0.0%) |
| 55 to 59 Years | 96 (85.0%) | 0 (0.0%) |
| 60 to 64 Years | 79 (83.2%) | 0 (0.0%) |
| 65 to 74 Years | 38 (15.6%) | 0 (0.0%) |
| 75 Years and over | 0 (0.0%) | 0 (0.0%) |
| Total | 1,098 (66.4%) | 96 (8.7%) |
Employment Status by Educational Attainment in Mechanic Falls
According to labor force statistics for Mechanic Falls, 86.0% of individuals (900) out of the total population between 25 and 64 years of age (1,046) are in the labor force, with 10.6% or 95 of them being unemployed. The group with the highest labor force participation rate are those with the educational attainment of college / associate degree, with 95.1% or 333 individuals in the labor force. Within the labor force, individuals with college / associate degree education have the highest percentage of unemployment, with 22.8% or 76 of them being unemployed.
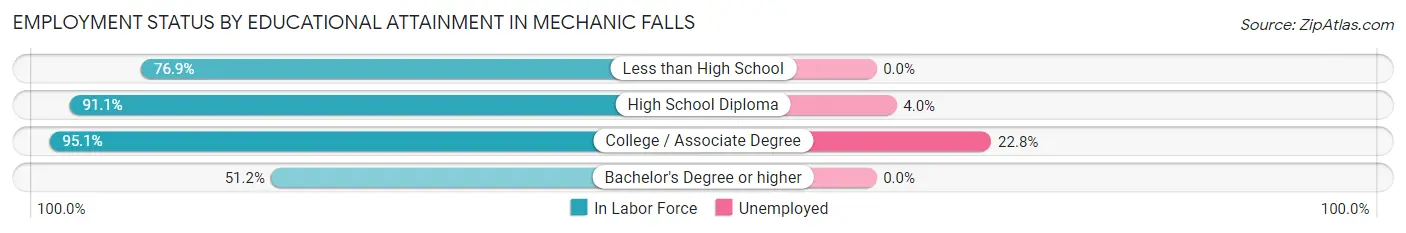
| Educational Attainment | In Labor Force | Unemployed |
| Less than High School | 10 (76.9%) | 0 (0.0%) |
| High School Diploma | 473 (91.1%) | 21 (4.0%) |
| College / Associate Degree | 333 (95.1%) | 80 (22.8%) |
| Bachelor's Degree or higher | 84 (51.2%) | 0 (0.0%) |
| Total | 900 (86.0%) | 111 (10.6%) |
Employment Occupations by Sex in Mechanic Falls
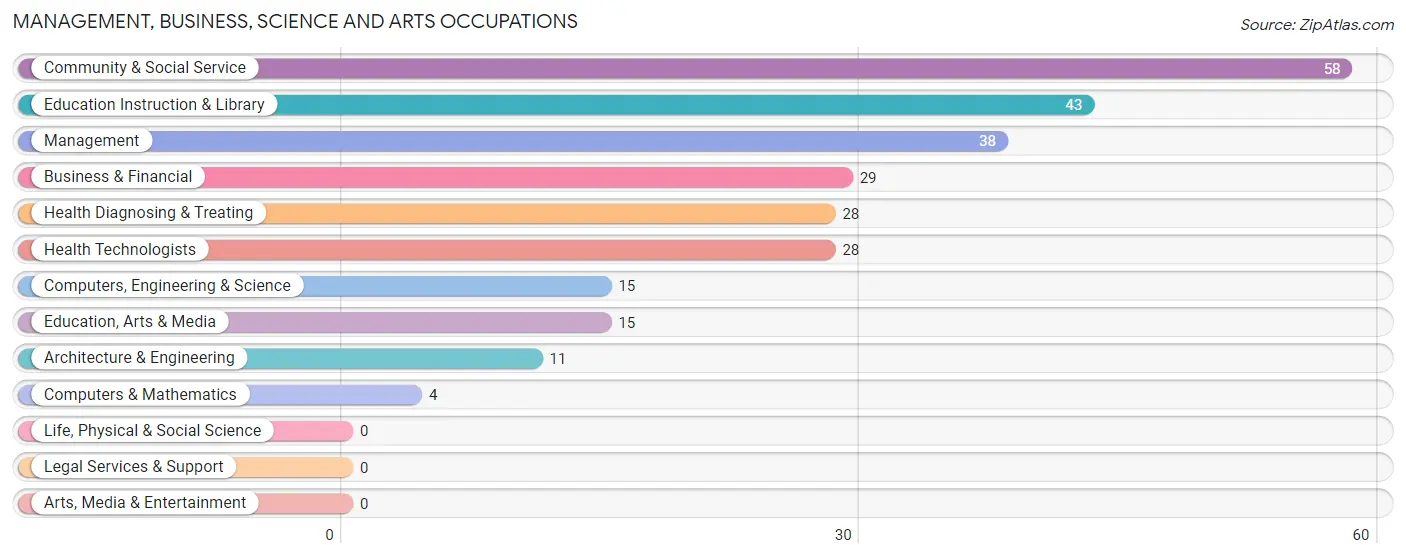
Management, Business, Science and Arts Occupations
The most common Management, Business, Science and Arts occupations in Mechanic Falls are Community & Social Service (58 | 5.8%), Education Instruction & Library (43 | 4.3%), Management (38 | 3.8%), Business & Financial (29 | 2.9%), and Health Diagnosing & Treating (28 | 2.8%).
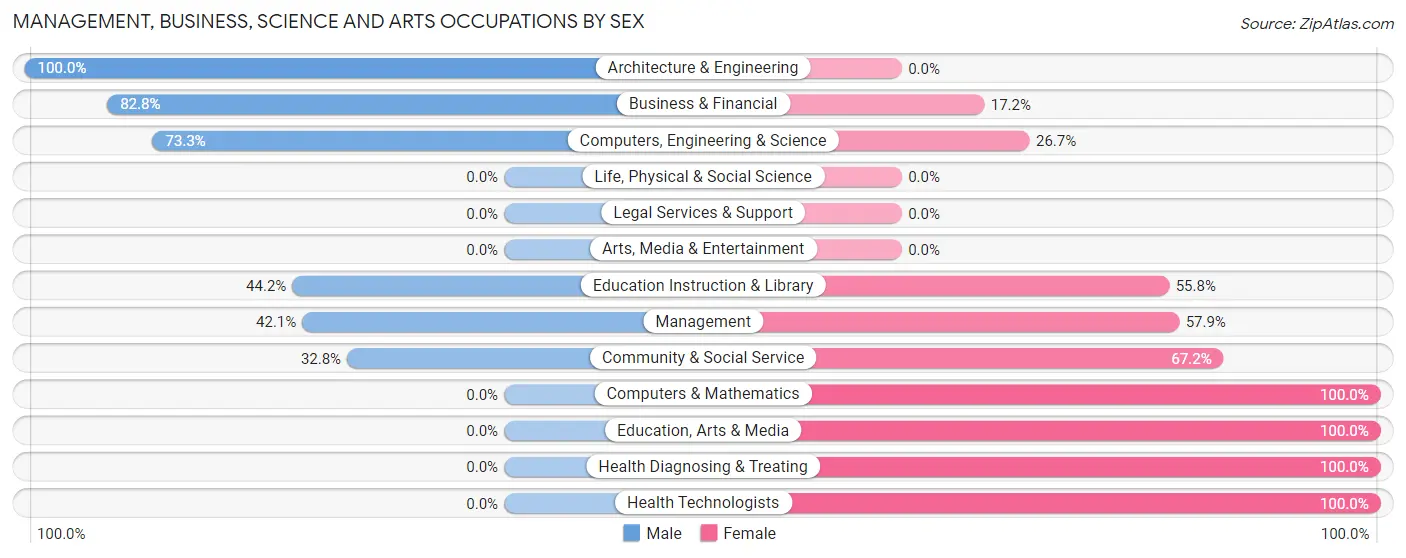
Management, Business, Science and Arts Occupations by Sex
Within the Management, Business, Science and Arts occupations in Mechanic Falls, the most male-oriented occupations are Architecture & Engineering (100.0%), Business & Financial (82.8%), and Computers, Engineering & Science (73.3%), while the most female-oriented occupations are Computers & Mathematics (100.0%), Education, Arts & Media (100.0%), and Health Diagnosing & Treating (100.0%).
| Occupation | Male | Female |
| Management | 16 (42.1%) | 22 (57.9%) |
| Business & Financial | 24 (82.8%) | 5 (17.2%) |
| Computers, Engineering & Science | 11 (73.3%) | 4 (26.7%) |
| Computers & Mathematics | 0 (0.0%) | 4 (100.0%) |
| Architecture & Engineering | 11 (100.0%) | 0 (0.0%) |
| Life, Physical & Social Science | 0 (0.0%) | 0 (0.0%) |
| Community & Social Service | 19 (32.8%) | 39 (67.2%) |
| Education, Arts & Media | 0 (0.0%) | 15 (100.0%) |
| Legal Services & Support | 0 (0.0%) | 0 (0.0%) |
| Education Instruction & Library | 19 (44.2%) | 24 (55.8%) |
| Arts, Media & Entertainment | 0 (0.0%) | 0 (0.0%) |
| Health Diagnosing & Treating | 0 (0.0%) | 28 (100.0%) |
| Health Technologists | 0 (0.0%) | 28 (100.0%) |
| Total (Category) | 70 (41.7%) | 98 (58.3%) |
| Total (Overall) | 509 (50.8%) | 493 (49.2%) |
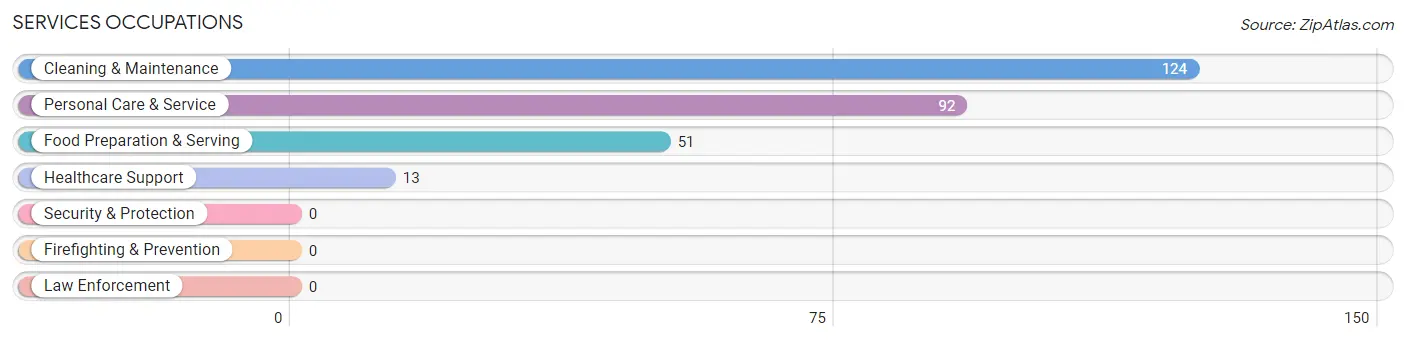
Services Occupations
The most common Services occupations in Mechanic Falls are Cleaning & Maintenance (124 | 12.4%), Personal Care & Service (92 | 9.2%), Food Preparation & Serving (51 | 5.1%), and Healthcare Support (13 | 1.3%).
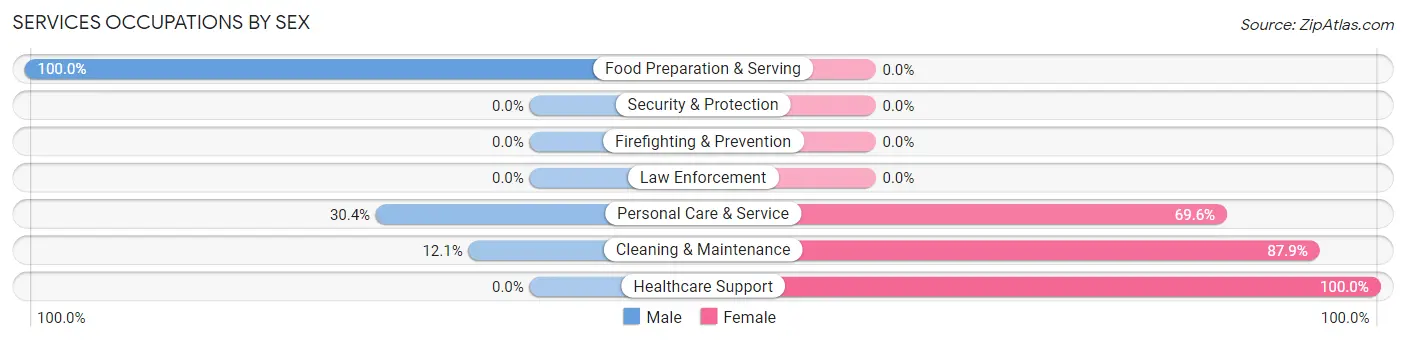
Services Occupations by Sex
Within the Services occupations in Mechanic Falls, the most male-oriented occupations are Food Preparation & Serving (100.0%), Personal Care & Service (30.4%), and Cleaning & Maintenance (12.1%), while the most female-oriented occupations are Healthcare Support (100.0%), Cleaning & Maintenance (87.9%), and Personal Care & Service (69.6%).
| Occupation | Male | Female |
| Healthcare Support | 0 (0.0%) | 13 (100.0%) |
| Security & Protection | 0 (0.0%) | 0 (0.0%) |
| Firefighting & Prevention | 0 (0.0%) | 0 (0.0%) |
| Law Enforcement | 0 (0.0%) | 0 (0.0%) |
| Food Preparation & Serving | 51 (100.0%) | 0 (0.0%) |
| Cleaning & Maintenance | 15 (12.1%) | 109 (87.9%) |
| Personal Care & Service | 28 (30.4%) | 64 (69.6%) |
| Total (Category) | 94 (33.6%) | 186 (66.4%) |
| Total (Overall) | 509 (50.8%) | 493 (49.2%) |
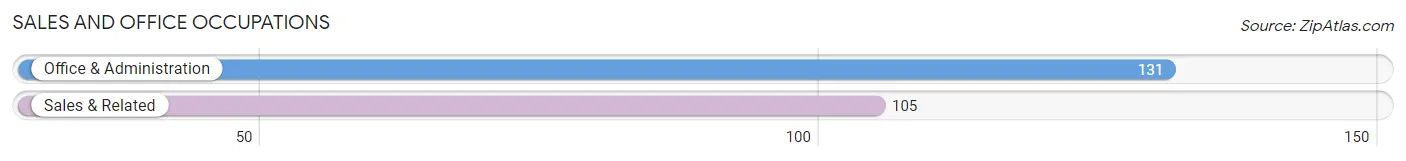
Sales and Office Occupations
The most common Sales and Office occupations in Mechanic Falls are Office & Administration (131 | 13.1%), and Sales & Related (105 | 10.5%).
Sales and Office Occupations by Sex
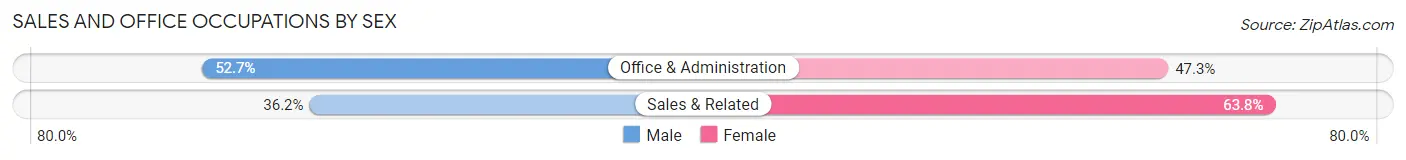
| Occupation | Male | Female |
| Sales & Related | 38 (36.2%) | 67 (63.8%) |
| Office & Administration | 69 (52.7%) | 62 (47.3%) |
| Total (Category) | 107 (45.3%) | 129 (54.7%) |
| Total (Overall) | 509 (50.8%) | 493 (49.2%) |
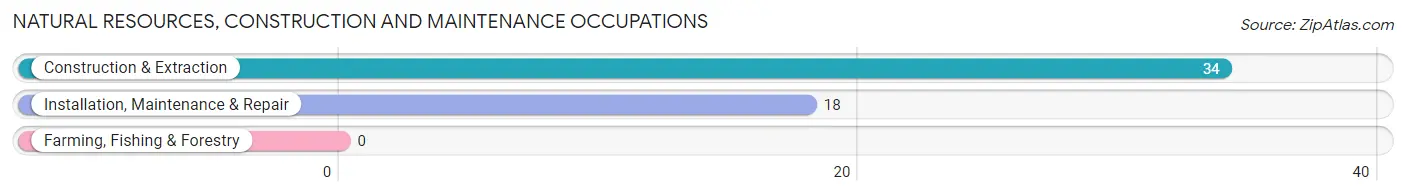
Natural Resources, Construction and Maintenance Occupations
The most common Natural Resources, Construction and Maintenance occupations in Mechanic Falls are Construction & Extraction (34 | 3.4%), and Installation, Maintenance & Repair (18 | 1.8%).
Natural Resources, Construction and Maintenance Occupations by Sex
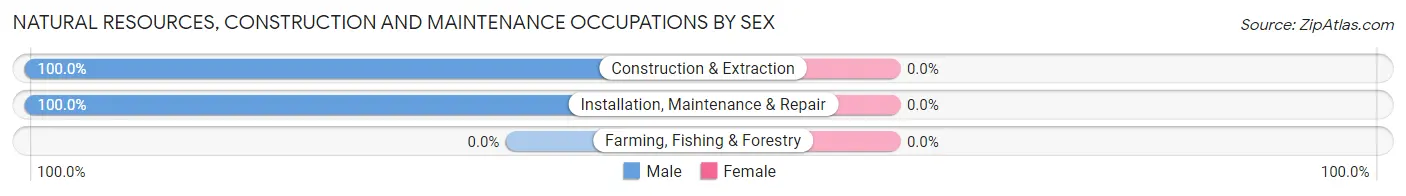
| Occupation | Male | Female |
| Farming, Fishing & Forestry | 0 (0.0%) | 0 (0.0%) |
| Construction & Extraction | 34 (100.0%) | 0 (0.0%) |
| Installation, Maintenance & Repair | 18 (100.0%) | 0 (0.0%) |
| Total (Category) | 52 (100.0%) | 0 (0.0%) |
| Total (Overall) | 509 (50.8%) | 493 (49.2%) |
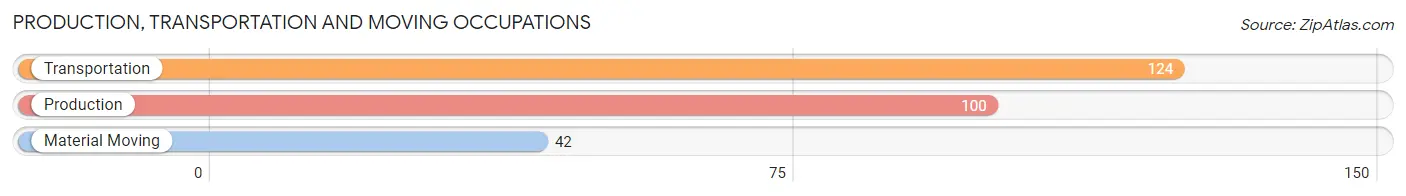
Production, Transportation and Moving Occupations
The most common Production, Transportation and Moving occupations in Mechanic Falls are Transportation (124 | 12.4%), Production (100 | 10.0%), and Material Moving (42 | 4.2%).
Production, Transportation and Moving Occupations by Sex
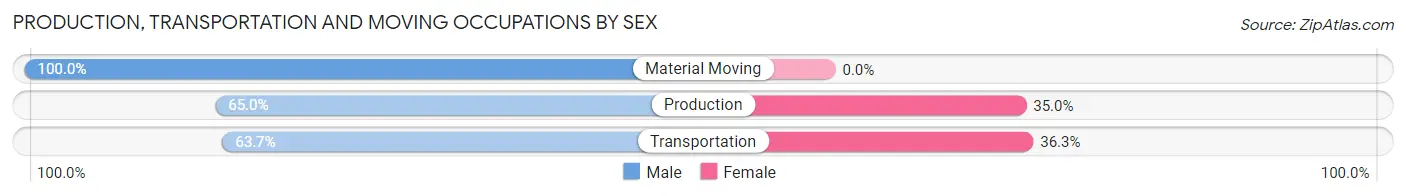
| Occupation | Male | Female |
| Production | 65 (65.0%) | 35 (35.0%) |
| Transportation | 79 (63.7%) | 45 (36.3%) |
| Material Moving | 42 (100.0%) | 0 (0.0%) |
| Total (Category) | 186 (69.9%) | 80 (30.1%) |
| Total (Overall) | 509 (50.8%) | 493 (49.2%) |
Employment Industries by Sex in Mechanic Falls
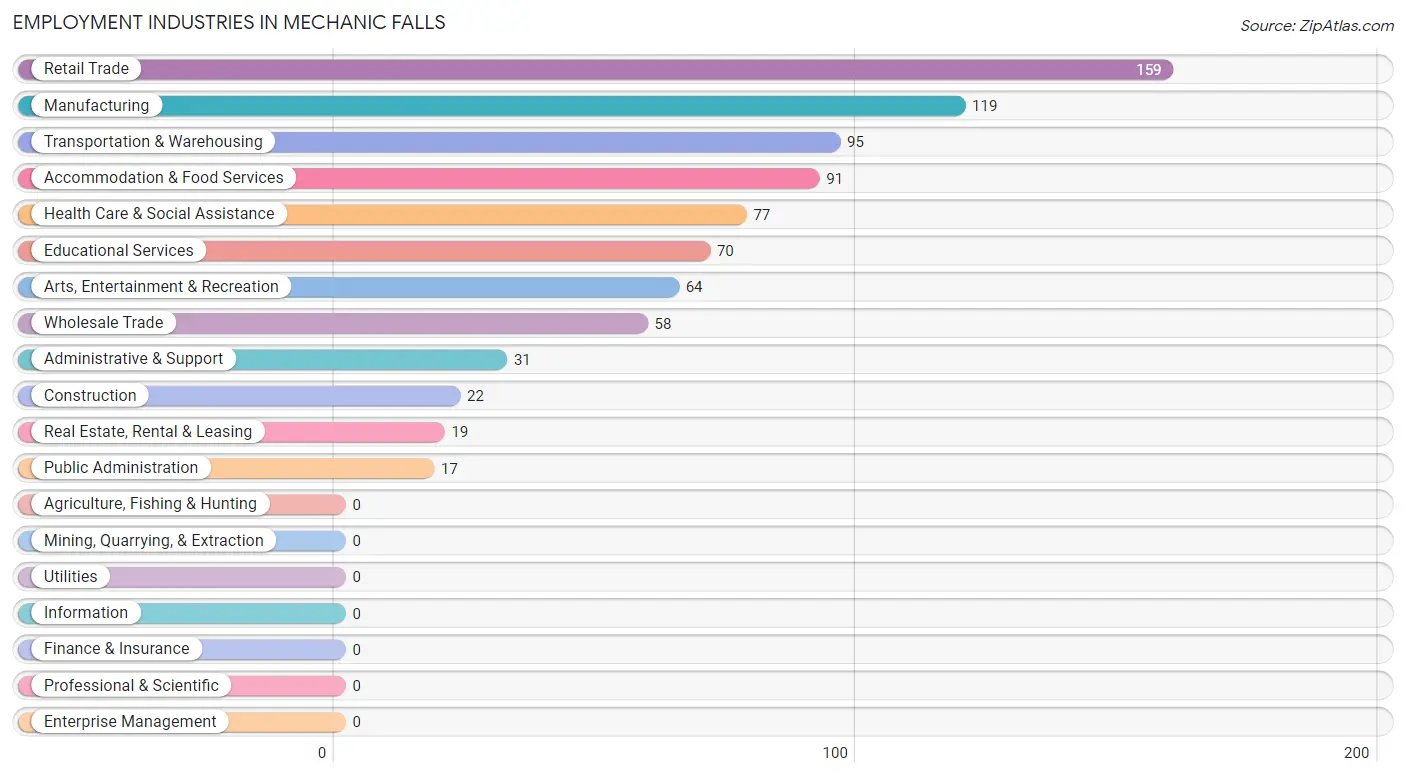
Employment Industries in Mechanic Falls
The major employment industries in Mechanic Falls include Retail Trade (159 | 15.9%), Manufacturing (119 | 11.9%), Transportation & Warehousing (95 | 9.5%), Accommodation & Food Services (91 | 9.1%), and Health Care & Social Assistance (77 | 7.7%).
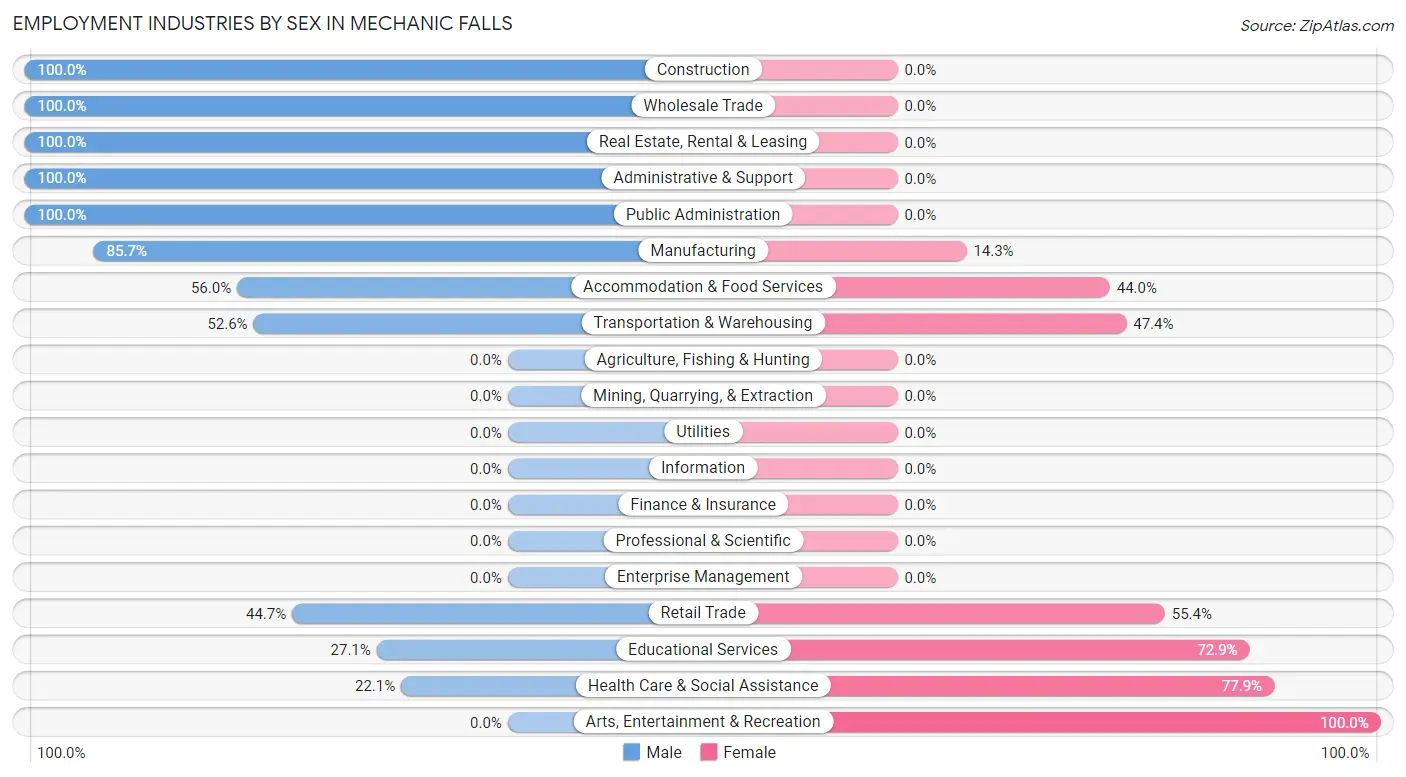
Employment Industries by Sex in Mechanic Falls
The Mechanic Falls industries that see more men than women are Construction (100.0%), Wholesale Trade (100.0%), and Real Estate, Rental & Leasing (100.0%), whereas the industries that tend to have a higher number of women are Arts, Entertainment & Recreation (100.0%), Health Care & Social Assistance (77.9%), and Educational Services (72.9%).
| Industry | Male | Female |
| Agriculture, Fishing & Hunting | 0 (0.0%) | 0 (0.0%) |
| Mining, Quarrying, & Extraction | 0 (0.0%) | 0 (0.0%) |
| Construction | 22 (100.0%) | 0 (0.0%) |
| Manufacturing | 102 (85.7%) | 17 (14.3%) |
| Wholesale Trade | 58 (100.0%) | 0 (0.0%) |
| Retail Trade | 71 (44.7%) | 88 (55.3%) |
| Transportation & Warehousing | 50 (52.6%) | 45 (47.4%) |
| Utilities | 0 (0.0%) | 0 (0.0%) |
| Information | 0 (0.0%) | 0 (0.0%) |
| Finance & Insurance | 0 (0.0%) | 0 (0.0%) |
| Real Estate, Rental & Leasing | 19 (100.0%) | 0 (0.0%) |
| Professional & Scientific | 0 (0.0%) | 0 (0.0%) |
| Enterprise Management | 0 (0.0%) | 0 (0.0%) |
| Administrative & Support | 31 (100.0%) | 0 (0.0%) |
| Educational Services | 19 (27.1%) | 51 (72.9%) |
| Health Care & Social Assistance | 17 (22.1%) | 60 (77.9%) |
| Arts, Entertainment & Recreation | 0 (0.0%) | 64 (100.0%) |
| Accommodation & Food Services | 51 (56.0%) | 40 (44.0%) |
| Public Administration | 17 (100.0%) | 0 (0.0%) |
| Total | 509 (50.8%) | 493 (49.2%) |
Education in Mechanic Falls
School Enrollment in Mechanic Falls
The most common levels of schooling among the 786 students in Mechanic Falls are high school (298 | 37.9%), middle school (281 | 35.7%), and elementary school (87 | 11.1%).
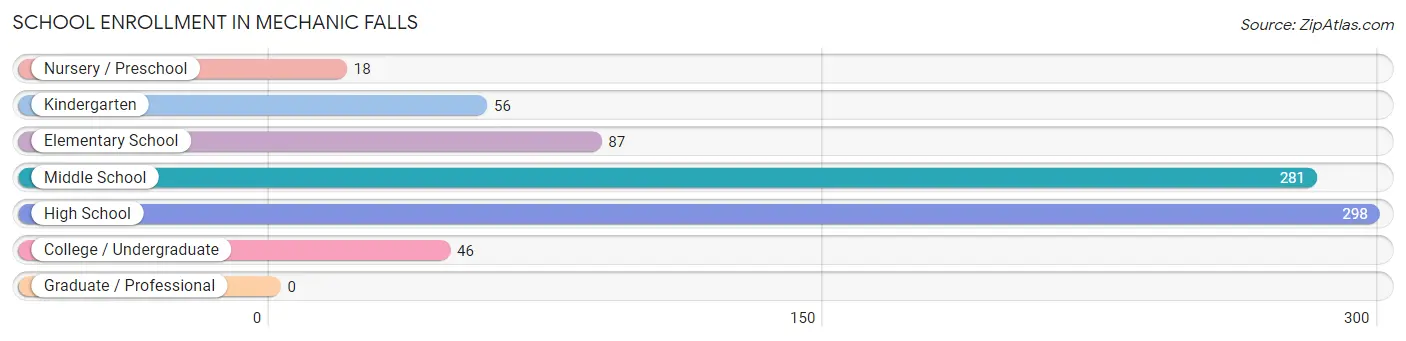
| School Level | # Students | % Students |
| Nursery / Preschool | 18 | 2.3% |
| Kindergarten | 56 | 7.1% |
| Elementary School | 87 | 11.1% |
| Middle School | 281 | 35.7% |
| High School | 298 | 37.9% |
| College / Undergraduate | 46 | 5.9% |
| Graduate / Professional | 0 | 0.0% |
| Total | 786 | 100.0% |
School Enrollment by Age by Funding Source in Mechanic Falls
Out of a total of 786 students who are enrolled in schools in Mechanic Falls, 33 (4.2%) attend a private institution, while the remaining 753 (95.8%) are enrolled in public schools. The age group of 35 years and over has the highest likelihood of being enrolled in private schools, with 5 (100.0% in the age bracket) enrolled. Conversely, the age group of 3 to 4 year olds has the lowest likelihood of being enrolled in a private school, with 6 (100.0% in the age bracket) attending a public institution.
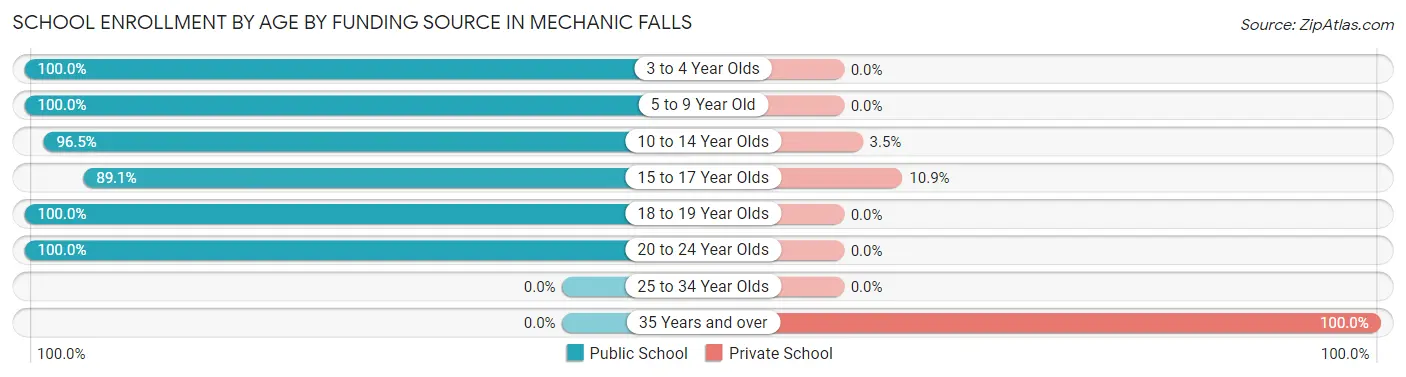
| Age Bracket | Public School | Private School |
| 3 to 4 Year Olds | 6 (100.0%) | 0 (0.0%) |
| 5 to 9 Year Old | 141 (100.0%) | 0 (0.0%) |
| 10 to 14 Year Olds | 384 (96.5%) | 14 (3.5%) |
| 15 to 17 Year Olds | 114 (89.1%) | 14 (10.9%) |
| 18 to 19 Year Olds | 66 (100.0%) | 0 (0.0%) |
| 20 to 24 Year Olds | 42 (100.0%) | 0 (0.0%) |
| 25 to 34 Year Olds | 0 (0.0%) | 0 (0.0%) |
| 35 Years and over | 0 (0.0%) | 5 (100.0%) |
| Total | 753 (95.8%) | 33 (4.2%) |
Educational Attainment by Field of Study in Mechanic Falls
Liberal arts & history (64 | 28.7%), business (41 | 18.4%), education (20 | 9.0%), social sciences (19 | 8.5%), and communications (16 | 7.2%) are the most common fields of study among 223 individuals in Mechanic Falls who have obtained a bachelor's degree or higher.
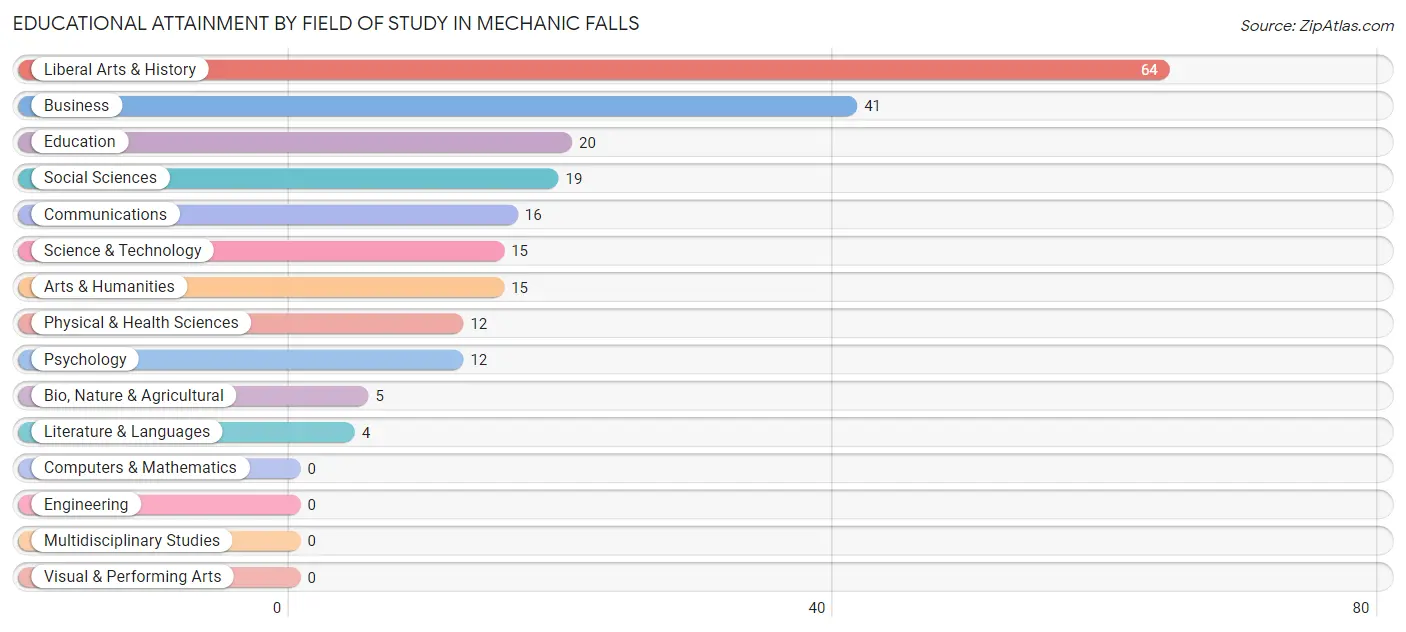
| Field of Study | # Graduates | % Graduates |
| Computers & Mathematics | 0 | 0.0% |
| Bio, Nature & Agricultural | 5 | 2.2% |
| Physical & Health Sciences | 12 | 5.4% |
| Psychology | 12 | 5.4% |
| Social Sciences | 19 | 8.5% |
| Engineering | 0 | 0.0% |
| Multidisciplinary Studies | 0 | 0.0% |
| Science & Technology | 15 | 6.7% |
| Business | 41 | 18.4% |
| Education | 20 | 9.0% |
| Literature & Languages | 4 | 1.8% |
| Liberal Arts & History | 64 | 28.7% |
| Visual & Performing Arts | 0 | 0.0% |
| Communications | 16 | 7.2% |
| Arts & Humanities | 15 | 6.7% |
| Total | 223 | 100.0% |
Transportation & Commute in Mechanic Falls
Vehicle Availability by Sex in Mechanic Falls
The most prevalent vehicle ownership categories in Mechanic Falls are males with 2 vehicles (212, accounting for 41.6%) and females with 2 vehicles (307, making up 43.0%).
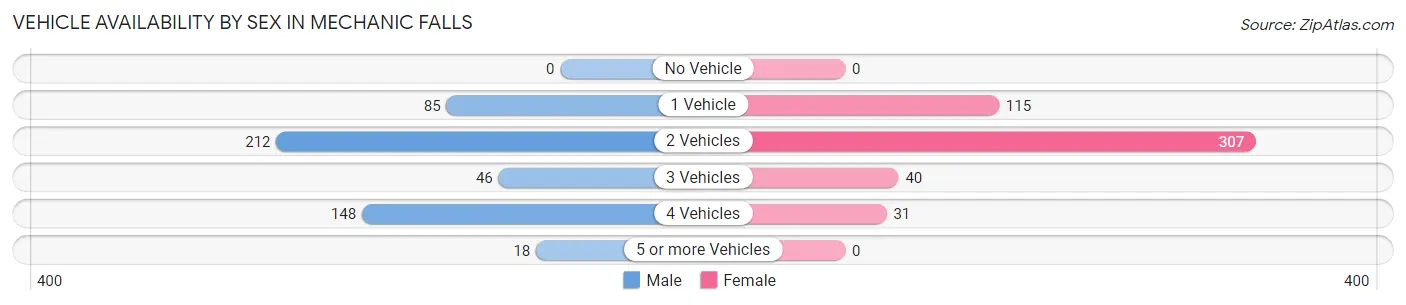
| Vehicles Available | Male | Female |
| No Vehicle | 0 (0.0%) | 0 (0.0%) |
| 1 Vehicle | 85 (16.7%) | 115 (23.3%) |
| 2 Vehicles | 212 (41.6%) | 307 (62.3%) |
| 3 Vehicles | 46 (9.0%) | 40 (8.1%) |
| 4 Vehicles | 148 (29.1%) | 31 (6.3%) |
| 5 or more Vehicles | 18 (3.5%) | 0 (0.0%) |
| Total | 509 (100.0%) | 493 (100.0%) |
Commute Time in Mechanic Falls
The most frequently occuring commute durations in Mechanic Falls are 10 to 14 minutes (193 commuters, 19.4%), 20 to 24 minutes (171 commuters, 17.2%), and 45 to 59 minutes (170 commuters, 17.1%).
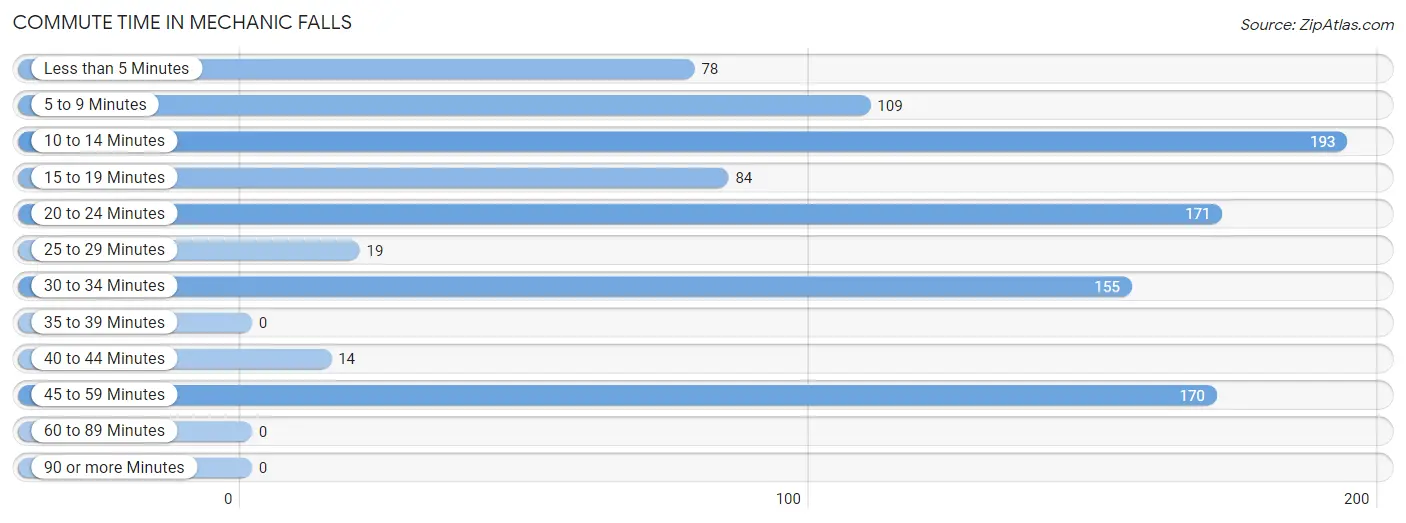
| Commute Time | # Commuters | % Commuters |
| Less than 5 Minutes | 78 | 7.9% |
| 5 to 9 Minutes | 109 | 11.0% |
| 10 to 14 Minutes | 193 | 19.4% |
| 15 to 19 Minutes | 84 | 8.5% |
| 20 to 24 Minutes | 171 | 17.2% |
| 25 to 29 Minutes | 19 | 1.9% |
| 30 to 34 Minutes | 155 | 15.6% |
| 35 to 39 Minutes | 0 | 0.0% |
| 40 to 44 Minutes | 14 | 1.4% |
| 45 to 59 Minutes | 170 | 17.1% |
| 60 to 89 Minutes | 0 | 0.0% |
| 90 or more Minutes | 0 | 0.0% |
Commute Time by Sex in Mechanic Falls
The most common commute times in Mechanic Falls are 10 to 14 minutes (117 commuters, 23.2%) for males and 45 to 59 minutes (97 commuters, 19.8%) for females.
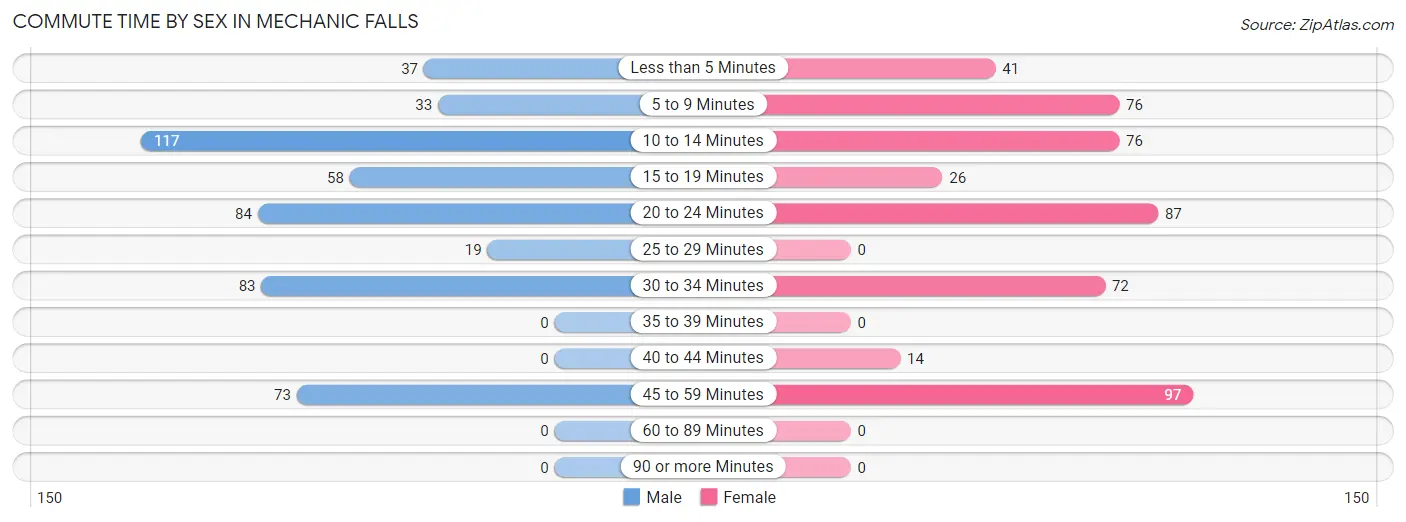
| Commute Time | Male | Female |
| Less than 5 Minutes | 37 (7.3%) | 41 (8.4%) |
| 5 to 9 Minutes | 33 (6.6%) | 76 (15.5%) |
| 10 to 14 Minutes | 117 (23.2%) | 76 (15.5%) |
| 15 to 19 Minutes | 58 (11.5%) | 26 (5.3%) |
| 20 to 24 Minutes | 84 (16.7%) | 87 (17.8%) |
| 25 to 29 Minutes | 19 (3.8%) | 0 (0.0%) |
| 30 to 34 Minutes | 83 (16.5%) | 72 (14.7%) |
| 35 to 39 Minutes | 0 (0.0%) | 0 (0.0%) |
| 40 to 44 Minutes | 0 (0.0%) | 14 (2.9%) |
| 45 to 59 Minutes | 73 (14.5%) | 97 (19.8%) |
| 60 to 89 Minutes | 0 (0.0%) | 0 (0.0%) |
| 90 or more Minutes | 0 (0.0%) | 0 (0.0%) |
Time of Departure to Work by Sex in Mechanic Falls
The most frequent times of departure to work in Mechanic Falls are 6:00 AM to 6:29 AM (156, 30.9%) for males and 9:00 AM to 9:59 AM (131, 26.8%) for females.
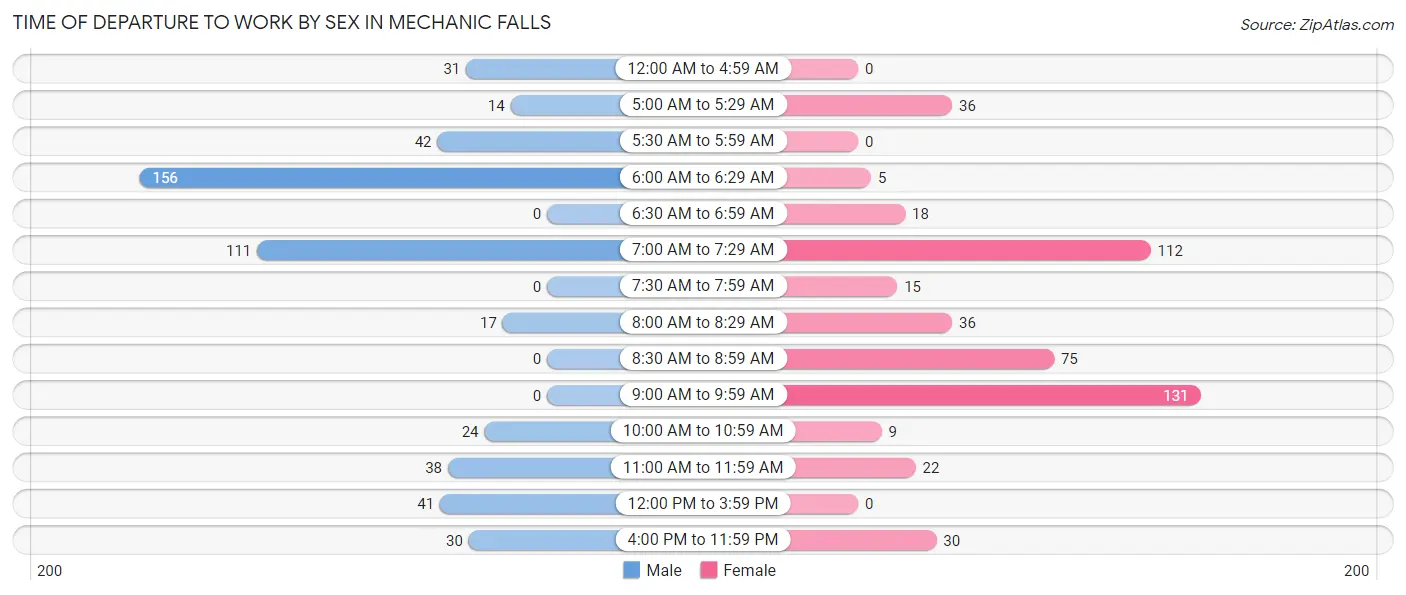
| Time of Departure | Male | Female |
| 12:00 AM to 4:59 AM | 31 (6.1%) | 0 (0.0%) |
| 5:00 AM to 5:29 AM | 14 (2.8%) | 36 (7.4%) |
| 5:30 AM to 5:59 AM | 42 (8.3%) | 0 (0.0%) |
| 6:00 AM to 6:29 AM | 156 (30.9%) | 5 (1.0%) |
| 6:30 AM to 6:59 AM | 0 (0.0%) | 18 (3.7%) |
| 7:00 AM to 7:29 AM | 111 (22.0%) | 112 (22.9%) |
| 7:30 AM to 7:59 AM | 0 (0.0%) | 15 (3.1%) |
| 8:00 AM to 8:29 AM | 17 (3.4%) | 36 (7.4%) |
| 8:30 AM to 8:59 AM | 0 (0.0%) | 75 (15.3%) |
| 9:00 AM to 9:59 AM | 0 (0.0%) | 131 (26.8%) |
| 10:00 AM to 10:59 AM | 24 (4.8%) | 9 (1.8%) |
| 11:00 AM to 11:59 AM | 38 (7.5%) | 22 (4.5%) |
| 12:00 PM to 3:59 PM | 41 (8.1%) | 0 (0.0%) |
| 4:00 PM to 11:59 PM | 30 (5.9%) | 30 (6.1%) |
| Total | 504 (100.0%) | 489 (100.0%) |
Housing Occupancy in Mechanic Falls
Occupancy by Ownership in Mechanic Falls
Of the total 816 dwellings in Mechanic Falls, owner-occupied units account for 486 (59.6%), while renter-occupied units make up 330 (40.4%).
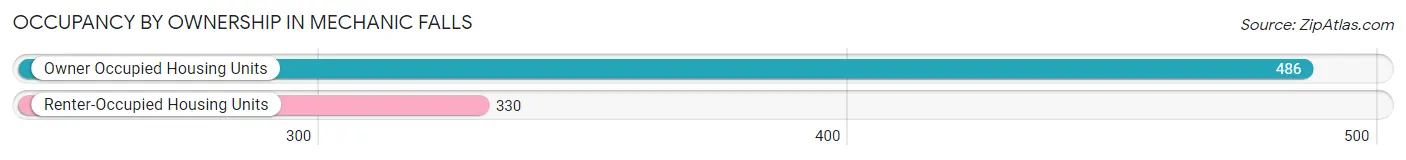
| Occupancy | # Housing Units | % Housing Units |
| Owner Occupied Housing Units | 486 | 59.6% |
| Renter-Occupied Housing Units | 330 | 40.4% |
| Total Occupied Housing Units | 816 | 100.0% |
Occupancy by Household Size in Mechanic Falls
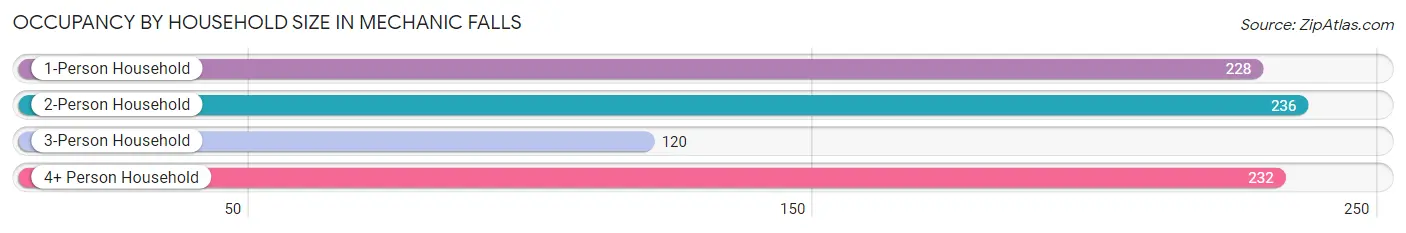
| Household Size | # Housing Units | % Housing Units |
| 1-Person Household | 228 | 27.9% |
| 2-Person Household | 236 | 28.9% |
| 3-Person Household | 120 | 14.7% |
| 4+ Person Household | 232 | 28.4% |
| Total Housing Units | 816 | 100.0% |
Occupancy by Ownership by Household Size in Mechanic Falls
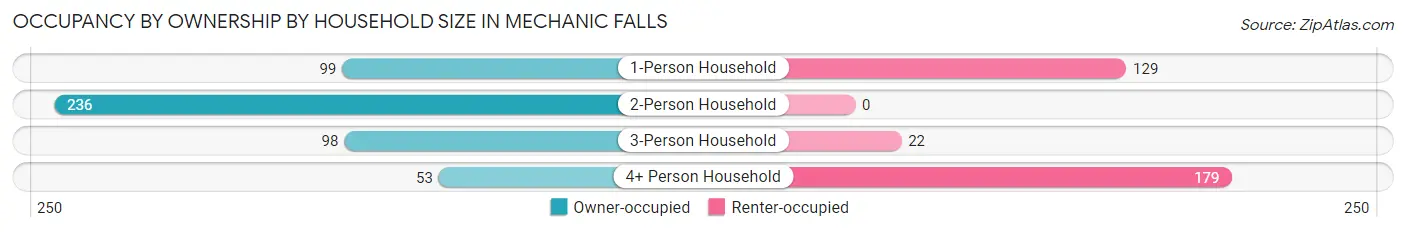
| Household Size | Owner-occupied | Renter-occupied |
| 1-Person Household | 99 (43.4%) | 129 (56.6%) |
| 2-Person Household | 236 (100.0%) | 0 (0.0%) |
| 3-Person Household | 98 (81.7%) | 22 (18.3%) |
| 4+ Person Household | 53 (22.8%) | 179 (77.2%) |
| Total Housing Units | 486 (59.6%) | 330 (40.4%) |
Occupancy by Educational Attainment in Mechanic Falls
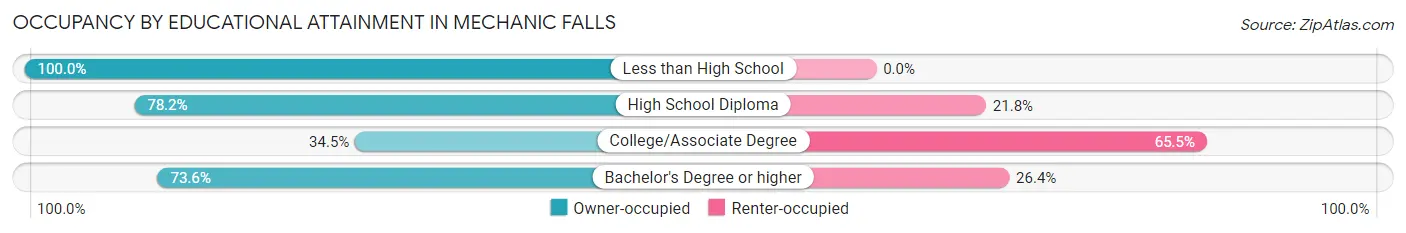
| Household Size | Owner-occupied | Renter-occupied |
| Less than High School | 31 (100.0%) | 0 (0.0%) |
| High School Diploma | 266 (78.2%) | 74 (21.8%) |
| College/Associate Degree | 122 (34.5%) | 232 (65.5%) |
| Bachelor's Degree or higher | 67 (73.6%) | 24 (26.4%) |
Occupancy by Age of Householder in Mechanic Falls
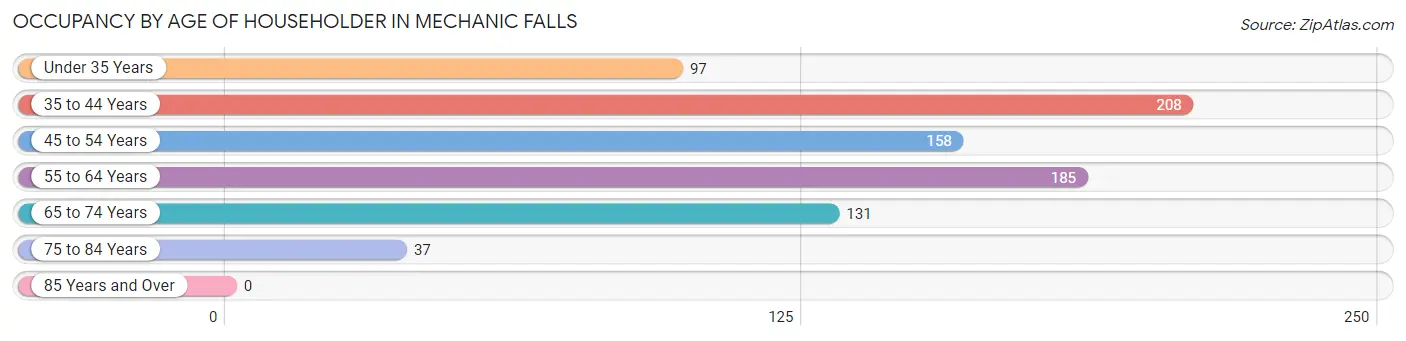
| Age Bracket | # Households | % Households |
| Under 35 Years | 97 | 11.9% |
| 35 to 44 Years | 208 | 25.5% |
| 45 to 54 Years | 158 | 19.4% |
| 55 to 64 Years | 185 | 22.7% |
| 65 to 74 Years | 131 | 16.1% |
| 75 to 84 Years | 37 | 4.5% |
| 85 Years and Over | 0 | 0.0% |
| Total | 816 | 100.0% |
Housing Finances in Mechanic Falls
Median Income by Occupancy in Mechanic Falls
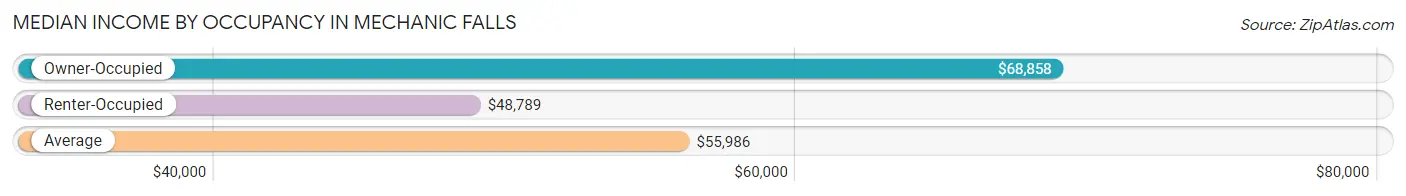
| Occupancy Type | # Households | Median Income |
| Owner-Occupied | 486 (59.6%) | $68,858 |
| Renter-Occupied | 330 (40.4%) | $48,789 |
| Average | 816 (100.0%) | $55,986 |
Occupancy by Householder Income Bracket in Mechanic Falls
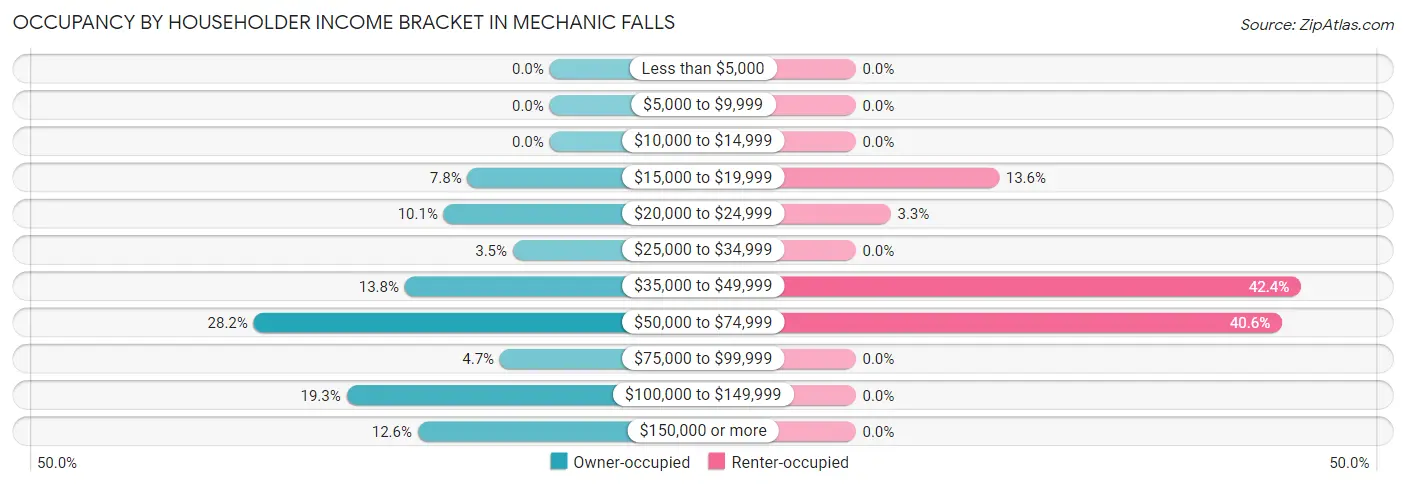
| Income Bracket | Owner-occupied | Renter-occupied |
| Less than $5,000 | 0 (0.0%) | 0 (0.0%) |
| $5,000 to $9,999 | 0 (0.0%) | 0 (0.0%) |
| $10,000 to $14,999 | 0 (0.0%) | 0 (0.0%) |
| $15,000 to $19,999 | 38 (7.8%) | 45 (13.6%) |
| $20,000 to $24,999 | 49 (10.1%) | 11 (3.3%) |
| $25,000 to $34,999 | 17 (3.5%) | 0 (0.0%) |
| $35,000 to $49,999 | 67 (13.8%) | 140 (42.4%) |
| $50,000 to $74,999 | 137 (28.2%) | 134 (40.6%) |
| $75,000 to $99,999 | 23 (4.7%) | 0 (0.0%) |
| $100,000 to $149,999 | 94 (19.3%) | 0 (0.0%) |
| $150,000 or more | 61 (12.6%) | 0 (0.0%) |
| Total | 486 (100.0%) | 330 (100.0%) |
Monthly Housing Cost Tiers in Mechanic Falls
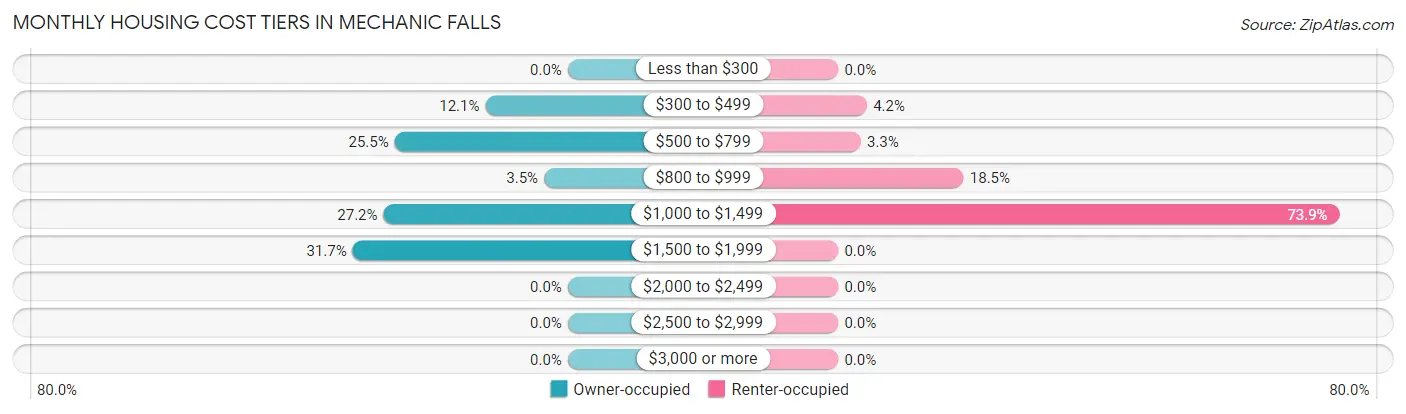
| Monthly Cost | Owner-occupied | Renter-occupied |
| Less than $300 | 0 (0.0%) | 0 (0.0%) |
| $300 to $499 | 59 (12.1%) | 14 (4.2%) |
| $500 to $799 | 124 (25.5%) | 11 (3.3%) |
| $800 to $999 | 17 (3.5%) | 61 (18.5%) |
| $1,000 to $1,499 | 132 (27.2%) | 244 (73.9%) |
| $1,500 to $1,999 | 154 (31.7%) | 0 (0.0%) |
| $2,000 to $2,499 | 0 (0.0%) | 0 (0.0%) |
| $2,500 to $2,999 | 0 (0.0%) | 0 (0.0%) |
| $3,000 or more | 0 (0.0%) | 0 (0.0%) |
| Total | 486 (100.0%) | 330 (100.0%) |
Physical Housing Characteristics in Mechanic Falls
Housing Structures in Mechanic Falls
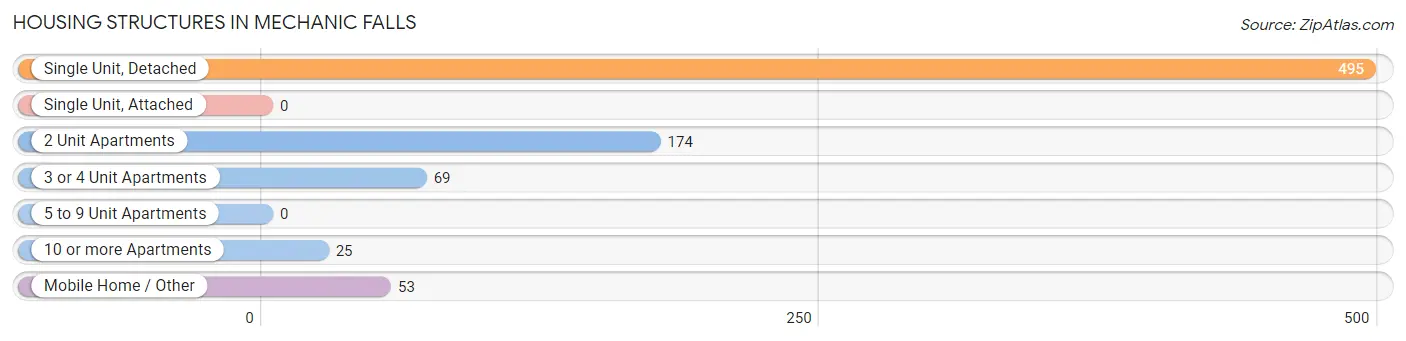
| Structure Type | # Housing Units | % Housing Units |
| Single Unit, Detached | 495 | 60.7% |
| Single Unit, Attached | 0 | 0.0% |
| 2 Unit Apartments | 174 | 21.3% |
| 3 or 4 Unit Apartments | 69 | 8.5% |
| 5 to 9 Unit Apartments | 0 | 0.0% |
| 10 or more Apartments | 25 | 3.1% |
| Mobile Home / Other | 53 | 6.5% |
| Total | 816 | 100.0% |
Housing Structures by Occupancy in Mechanic Falls
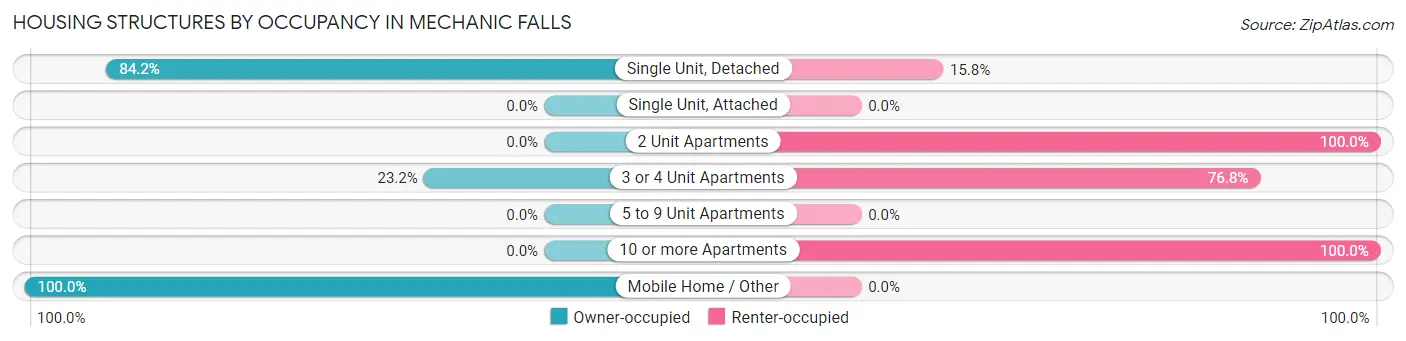
| Structure Type | Owner-occupied | Renter-occupied |
| Single Unit, Detached | 417 (84.2%) | 78 (15.8%) |
| Single Unit, Attached | 0 (0.0%) | 0 (0.0%) |
| 2 Unit Apartments | 0 (0.0%) | 174 (100.0%) |
| 3 or 4 Unit Apartments | 16 (23.2%) | 53 (76.8%) |
| 5 to 9 Unit Apartments | 0 (0.0%) | 0 (0.0%) |
| 10 or more Apartments | 0 (0.0%) | 25 (100.0%) |
| Mobile Home / Other | 53 (100.0%) | 0 (0.0%) |
| Total | 486 (59.6%) | 330 (40.4%) |
Housing Structures by Number of Rooms in Mechanic Falls
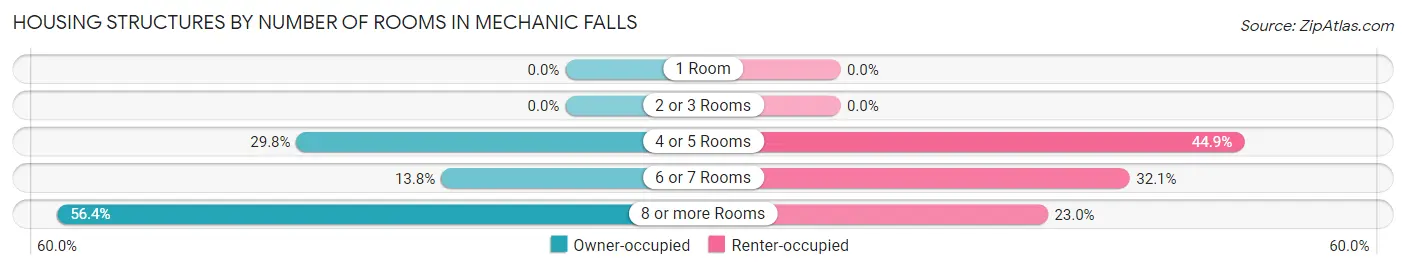
| Number of Rooms | Owner-occupied | Renter-occupied |
| 1 Room | 0 (0.0%) | 0 (0.0%) |
| 2 or 3 Rooms | 0 (0.0%) | 0 (0.0%) |
| 4 or 5 Rooms | 145 (29.8%) | 148 (44.9%) |
| 6 or 7 Rooms | 67 (13.8%) | 106 (32.1%) |
| 8 or more Rooms | 274 (56.4%) | 76 (23.0%) |
| Total | 486 (100.0%) | 330 (100.0%) |
Housing Structure by Heating Type in Mechanic Falls
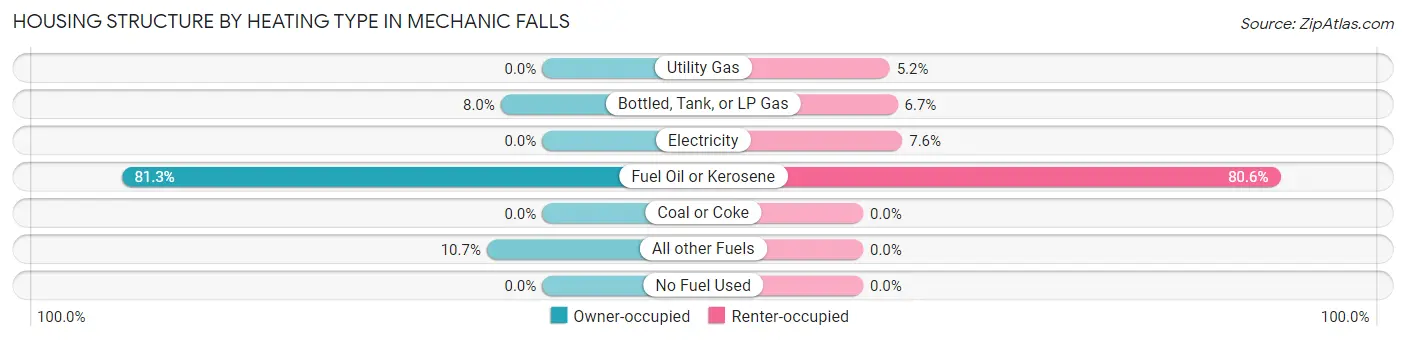
| Heating Type | Owner-occupied | Renter-occupied |
| Utility Gas | 0 (0.0%) | 17 (5.1%) |
| Bottled, Tank, or LP Gas | 39 (8.0%) | 22 (6.7%) |
| Electricity | 0 (0.0%) | 25 (7.6%) |
| Fuel Oil or Kerosene | 395 (81.3%) | 266 (80.6%) |
| Coal or Coke | 0 (0.0%) | 0 (0.0%) |
| All other Fuels | 52 (10.7%) | 0 (0.0%) |
| No Fuel Used | 0 (0.0%) | 0 (0.0%) |
| Total | 486 (100.0%) | 330 (100.0%) |
Household Vehicle Usage in Mechanic Falls
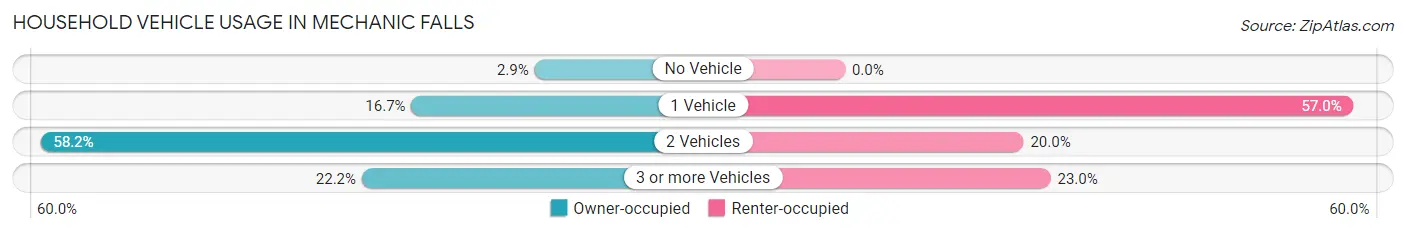
| Vehicles per Household | Owner-occupied | Renter-occupied |
| No Vehicle | 14 (2.9%) | 0 (0.0%) |
| 1 Vehicle | 81 (16.7%) | 188 (57.0%) |
| 2 Vehicles | 283 (58.2%) | 66 (20.0%) |
| 3 or more Vehicles | 108 (22.2%) | 76 (23.0%) |
| Total | 486 (100.0%) | 330 (100.0%) |
Real Estate & Mortgages in Mechanic Falls
Real Estate and Mortgage Overview in Mechanic Falls
| Characteristic | Without Mortgage | With Mortgage |
| Housing Units | 169 | 317 |
| Median Property Value | $225,000 | $165,700 |
| Median Household Income | $35,859 | $32 |
| Monthly Housing Costs | $628 | $0 |
| Real Estate Taxes | $2,208 | $0 |
Property Value by Mortgage Status in Mechanic Falls
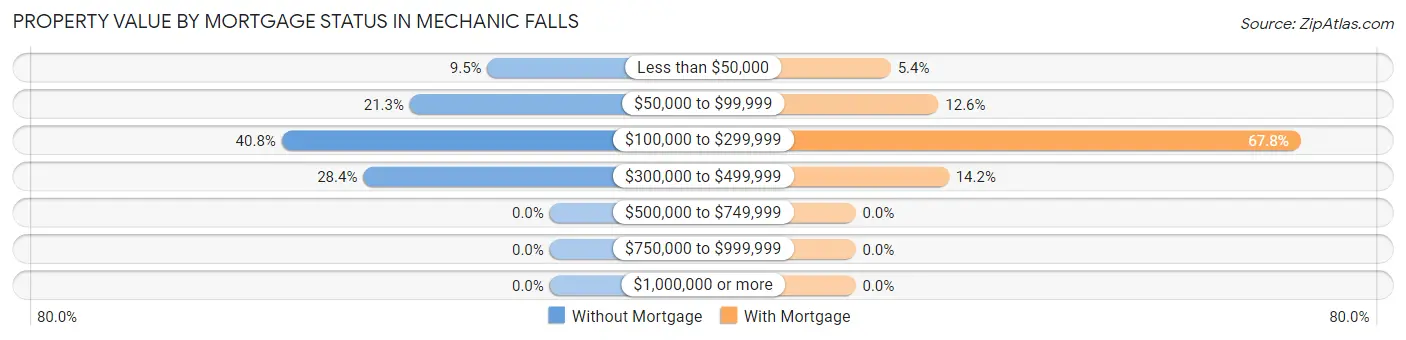
| Property Value | Without Mortgage | With Mortgage |
| Less than $50,000 | 16 (9.5%) | 17 (5.4%) |
| $50,000 to $99,999 | 36 (21.3%) | 40 (12.6%) |
| $100,000 to $299,999 | 69 (40.8%) | 215 (67.8%) |
| $300,000 to $499,999 | 48 (28.4%) | 45 (14.2%) |
| $500,000 to $749,999 | 0 (0.0%) | 0 (0.0%) |
| $750,000 to $999,999 | 0 (0.0%) | 0 (0.0%) |
| $1,000,000 or more | 0 (0.0%) | 0 (0.0%) |
| Total | 169 (100.0%) | 317 (100.0%) |
Household Income by Mortgage Status in Mechanic Falls
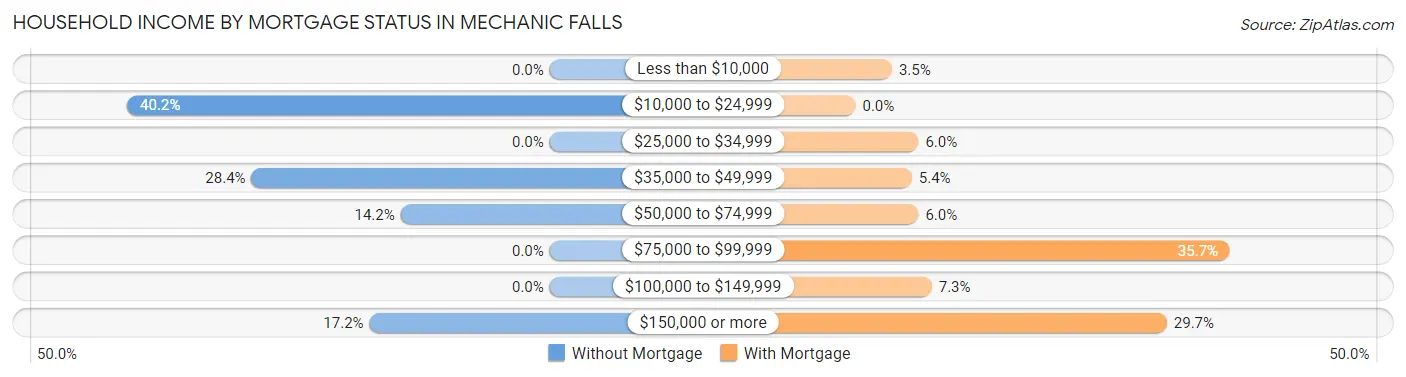
| Household Income | Without Mortgage | With Mortgage |
| Less than $10,000 | 0 (0.0%) | 11 (3.5%) |
| $10,000 to $24,999 | 68 (40.2%) | 0 (0.0%) |
| $25,000 to $34,999 | 0 (0.0%) | 19 (6.0%) |
| $35,000 to $49,999 | 48 (28.4%) | 17 (5.4%) |
| $50,000 to $74,999 | 24 (14.2%) | 19 (6.0%) |
| $75,000 to $99,999 | 0 (0.0%) | 113 (35.6%) |
| $100,000 to $149,999 | 0 (0.0%) | 23 (7.3%) |
| $150,000 or more | 29 (17.2%) | 94 (29.6%) |
| Total | 169 (100.0%) | 317 (100.0%) |
Property Value to Household Income Ratio in Mechanic Falls
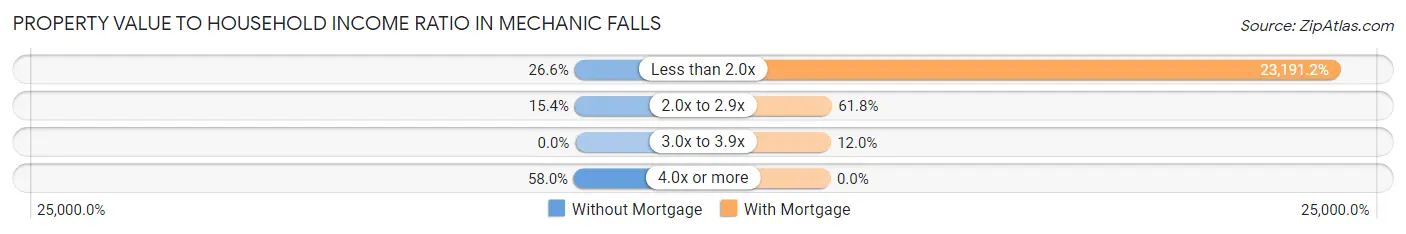
| Value-to-Income Ratio | Without Mortgage | With Mortgage |
| Less than 2.0x | 45 (26.6%) | 73,516 (23,191.2%) |
| 2.0x to 2.9x | 26 (15.4%) | 196 (61.8%) |
| 3.0x to 3.9x | 0 (0.0%) | 38 (12.0%) |
| 4.0x or more | 98 (58.0%) | 0 (0.0%) |
| Total | 169 (100.0%) | 317 (100.0%) |
Real Estate Taxes by Mortgage Status in Mechanic Falls
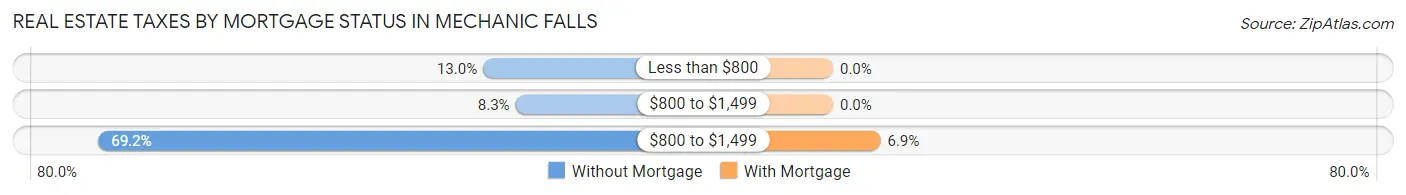
| Property Taxes | Without Mortgage | With Mortgage |
| Less than $800 | 22 (13.0%) | 0 (0.0%) |
| $800 to $1,499 | 14 (8.3%) | 0 (0.0%) |
| $800 to $1,499 | 117 (69.2%) | 22 (6.9%) |
| Total | 169 (100.0%) | 317 (100.0%) |
Health & Disability in Mechanic Falls
Health Insurance Coverage by Age in Mechanic Falls
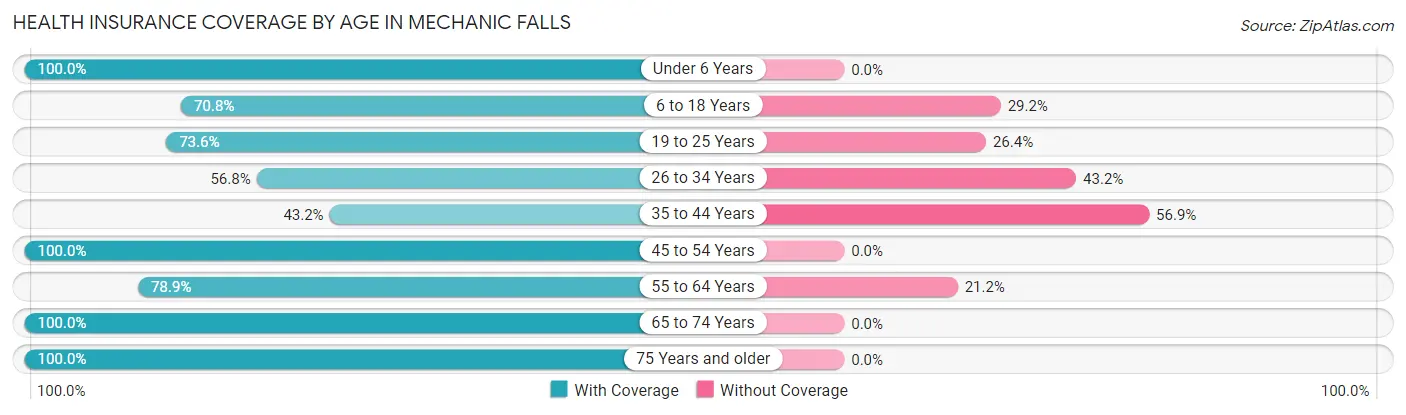
| Age Bracket | With Coverage | Without Coverage |
| Under 6 Years | 113 (100.0%) | 0 (0.0%) |
| 6 to 18 Years | 442 (70.8%) | 182 (29.2%) |
| 19 to 25 Years | 117 (73.6%) | 42 (26.4%) |
| 26 to 34 Years | 105 (56.8%) | 80 (43.2%) |
| 35 to 44 Years | 189 (43.1%) | 249 (56.9%) |
| 45 to 54 Years | 215 (100.0%) | 0 (0.0%) |
| 55 to 64 Years | 164 (78.8%) | 44 (21.1%) |
| 65 to 74 Years | 244 (100.0%) | 0 (0.0%) |
| 75 Years and older | 52 (100.0%) | 0 (0.0%) |
| Total | 1,641 (73.3%) | 597 (26.7%) |
Health Insurance Coverage by Citizenship Status in Mechanic Falls
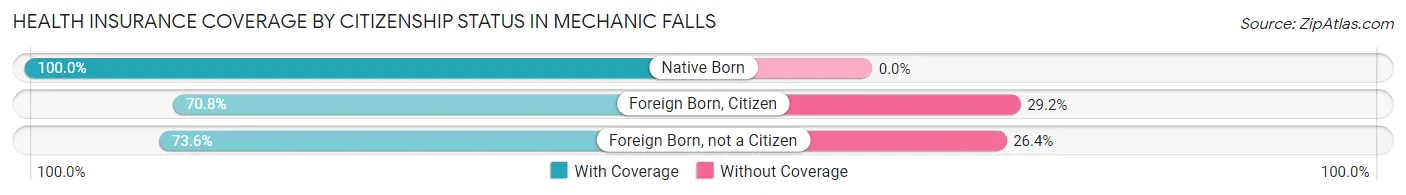
| Citizenship Status | With Coverage | Without Coverage |
| Native Born | 113 (100.0%) | 0 (0.0%) |
| Foreign Born, Citizen | 442 (70.8%) | 182 (29.2%) |
| Foreign Born, not a Citizen | 117 (73.6%) | 42 (26.4%) |
Health Insurance Coverage by Household Income in Mechanic Falls
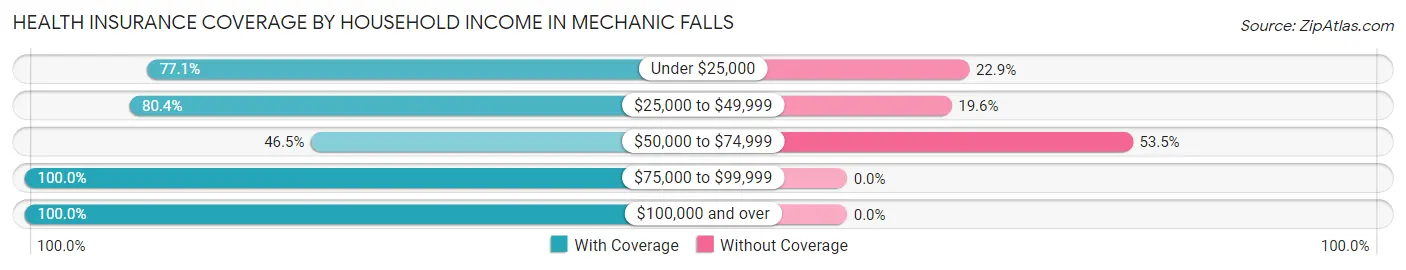
| Household Income | With Coverage | Without Coverage |
| Under $25,000 | 155 (77.1%) | 46 (22.9%) |
| $25,000 to $49,999 | 608 (80.4%) | 148 (19.6%) |
| $50,000 to $74,999 | 350 (46.5%) | 403 (53.5%) |
| $75,000 to $99,999 | 51 (100.0%) | 0 (0.0%) |
| $100,000 and over | 474 (100.0%) | 0 (0.0%) |
Public vs Private Health Insurance Coverage by Age in Mechanic Falls
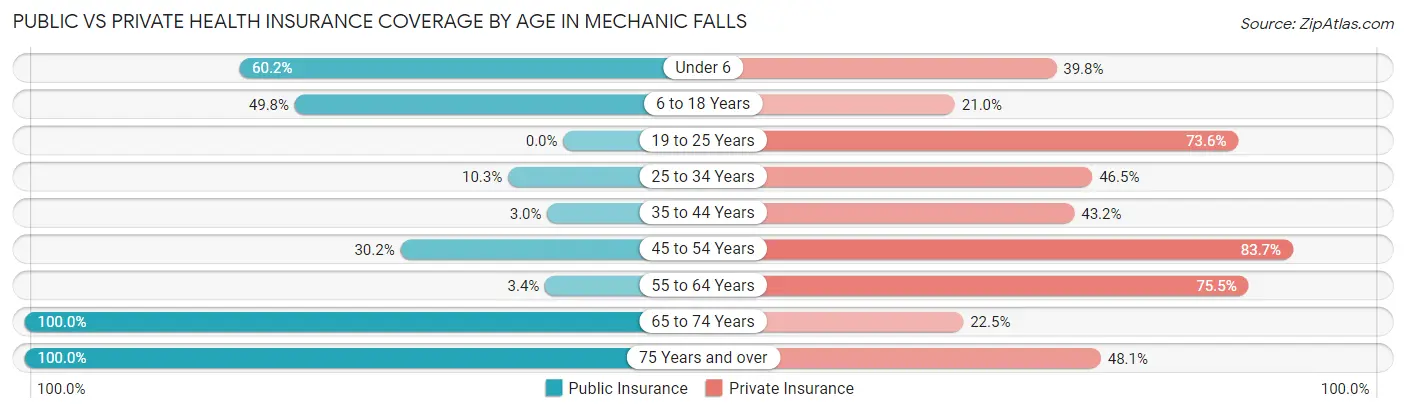
| Age Bracket | Public Insurance | Private Insurance |
| Under 6 | 68 (60.2%) | 45 (39.8%) |
| 6 to 18 Years | 311 (49.8%) | 131 (21.0%) |
| 19 to 25 Years | 0 (0.0%) | 117 (73.6%) |
| 25 to 34 Years | 19 (10.3%) | 86 (46.5%) |
| 35 to 44 Years | 13 (3.0%) | 189 (43.1%) |
| 45 to 54 Years | 65 (30.2%) | 180 (83.7%) |
| 55 to 64 Years | 7 (3.4%) | 157 (75.5%) |
| 65 to 74 Years | 244 (100.0%) | 55 (22.5%) |
| 75 Years and over | 52 (100.0%) | 25 (48.1%) |
| Total | 779 (34.8%) | 985 (44.0%) |
Disability Status by Sex by Age in Mechanic Falls
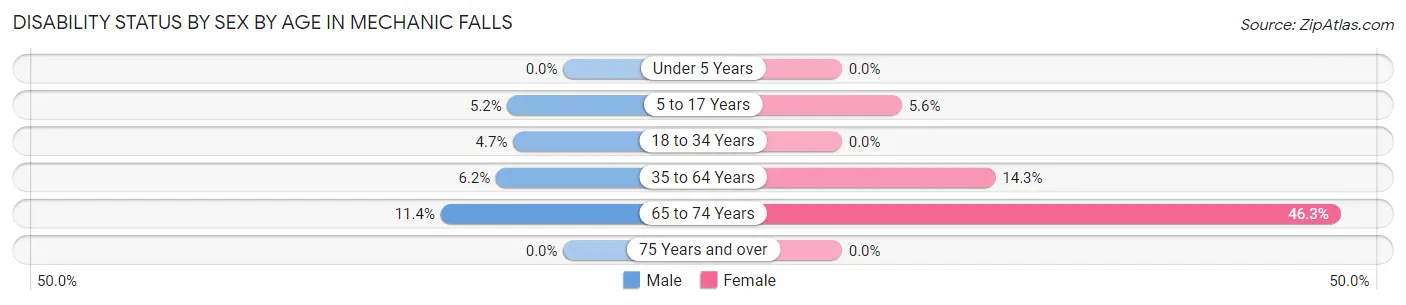
| Age Bracket | Male | Female |
| Under 5 Years | 0 (0.0%) | 0 (0.0%) |
| 5 to 17 Years | 14 (5.2%) | 22 (5.6%) |
| 18 to 34 Years | 8 (4.6%) | 0 (0.0%) |
| 35 to 64 Years | 27 (6.2%) | 61 (14.2%) |
| 65 to 74 Years | 14 (11.4%) | 56 (46.3%) |
| 75 Years and over | 0 (0.0%) | 0 (0.0%) |
Disability Class by Sex by Age in Mechanic Falls
Disability Class: Hearing Difficulty
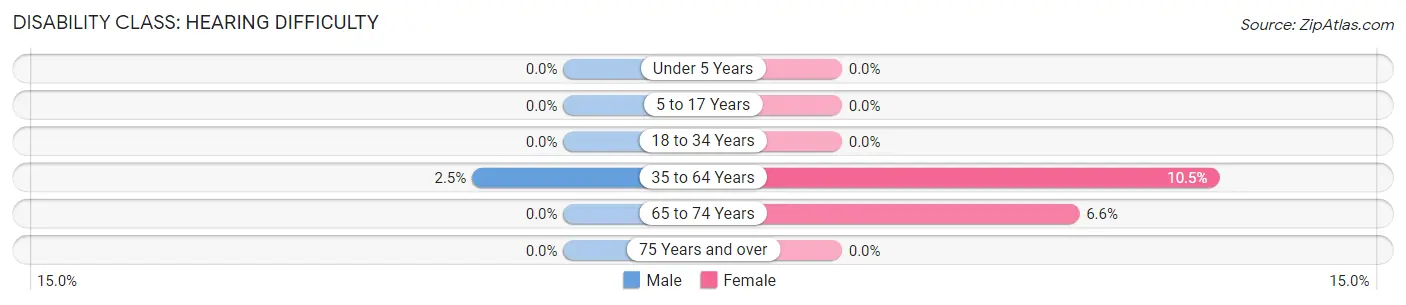
| Age Bracket | Male | Female |
| Under 5 Years | 0 (0.0%) | 0 (0.0%) |
| 5 to 17 Years | 0 (0.0%) | 0 (0.0%) |
| 18 to 34 Years | 0 (0.0%) | 0 (0.0%) |
| 35 to 64 Years | 11 (2.5%) | 45 (10.5%) |
| 65 to 74 Years | 0 (0.0%) | 8 (6.6%) |
| 75 Years and over | 0 (0.0%) | 0 (0.0%) |
Disability Class: Vision Difficulty
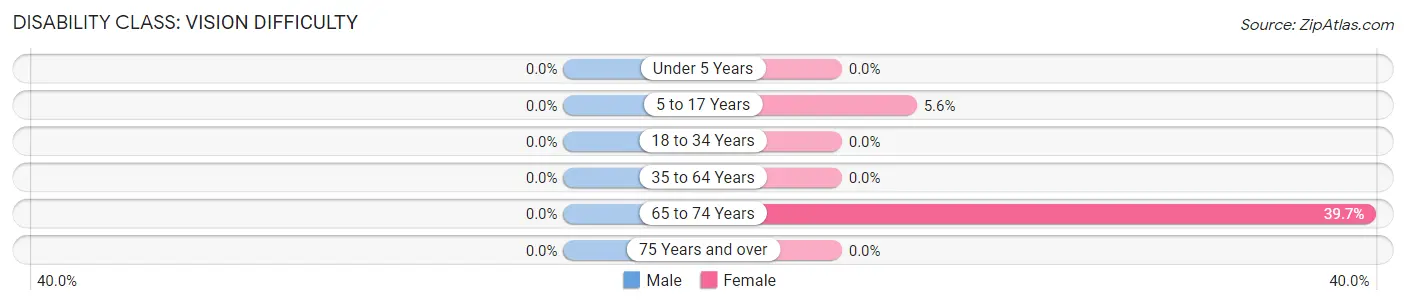
| Age Bracket | Male | Female |
| Under 5 Years | 0 (0.0%) | 0 (0.0%) |
| 5 to 17 Years | 0 (0.0%) | 22 (5.6%) |
| 18 to 34 Years | 0 (0.0%) | 0 (0.0%) |
| 35 to 64 Years | 0 (0.0%) | 0 (0.0%) |
| 65 to 74 Years | 0 (0.0%) | 48 (39.7%) |
| 75 Years and over | 0 (0.0%) | 0 (0.0%) |
Disability Class: Cognitive Difficulty
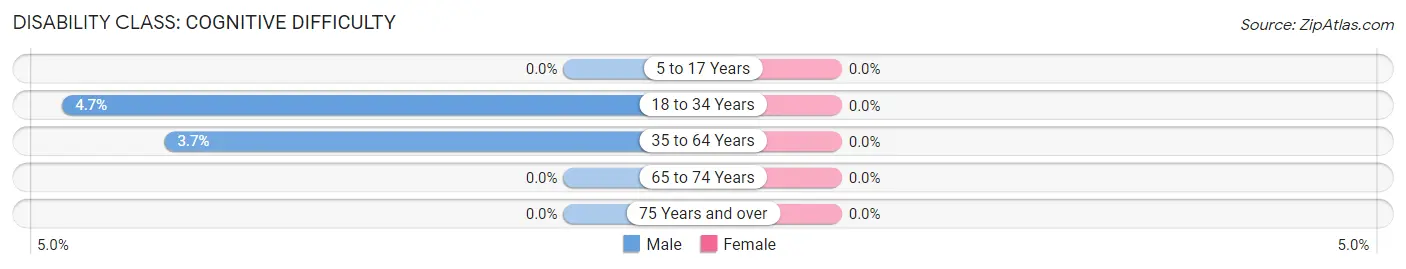
| Age Bracket | Male | Female |
| 5 to 17 Years | 0 (0.0%) | 0 (0.0%) |
| 18 to 34 Years | 8 (4.6%) | 0 (0.0%) |
| 35 to 64 Years | 16 (3.7%) | 0 (0.0%) |
| 65 to 74 Years | 0 (0.0%) | 0 (0.0%) |
| 75 Years and over | 0 (0.0%) | 0 (0.0%) |
Disability Class: Ambulatory Difficulty
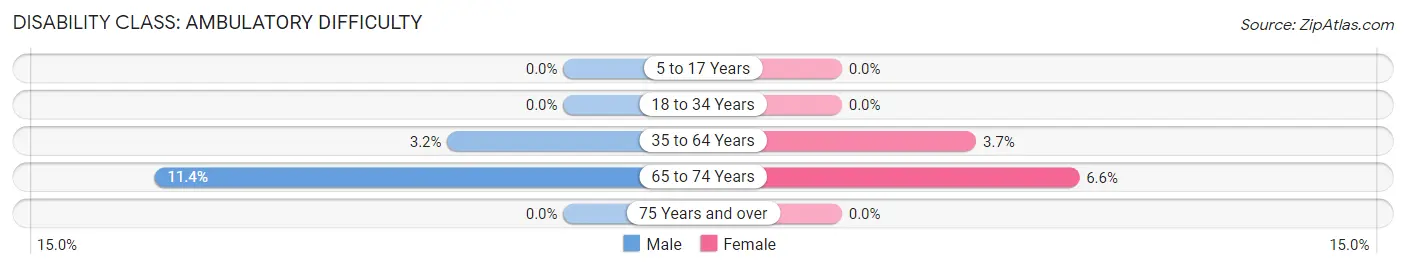
| Age Bracket | Male | Female |
| 5 to 17 Years | 0 (0.0%) | 0 (0.0%) |
| 18 to 34 Years | 0 (0.0%) | 0 (0.0%) |
| 35 to 64 Years | 14 (3.2%) | 16 (3.7%) |
| 65 to 74 Years | 14 (11.4%) | 8 (6.6%) |
| 75 Years and over | 0 (0.0%) | 0 (0.0%) |
Disability Class: Self-Care Difficulty
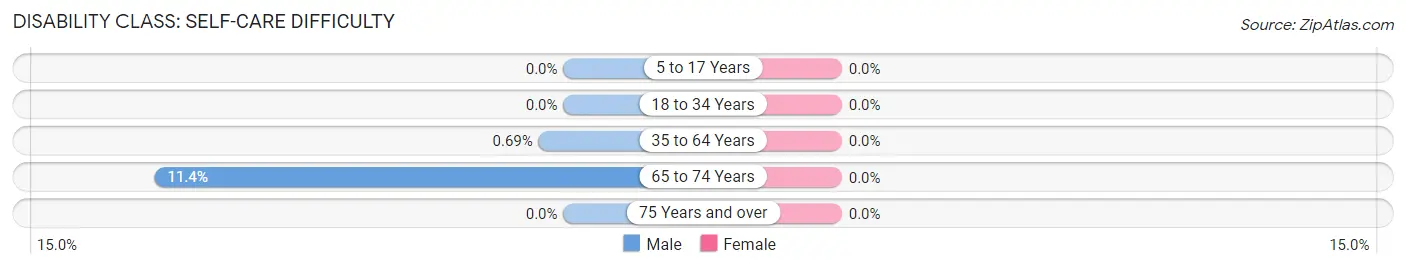
| Age Bracket | Male | Female |
| 5 to 17 Years | 0 (0.0%) | 0 (0.0%) |
| 18 to 34 Years | 0 (0.0%) | 0 (0.0%) |
| 35 to 64 Years | 3 (0.7%) | 0 (0.0%) |
| 65 to 74 Years | 14 (11.4%) | 0 (0.0%) |
| 75 Years and over | 0 (0.0%) | 0 (0.0%) |
Technology Access in Mechanic Falls
Computing Device Access in Mechanic Falls
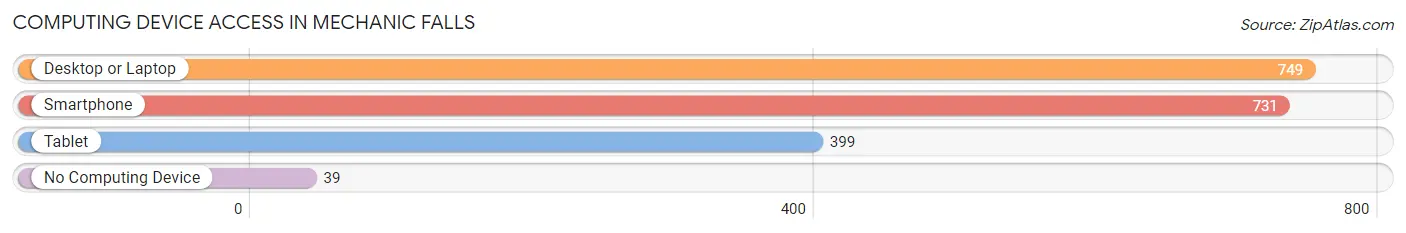
| Device Type | # Households | % Households |
| Desktop or Laptop | 749 | 91.8% |
| Smartphone | 731 | 89.6% |
| Tablet | 399 | 48.9% |
| No Computing Device | 39 | 4.8% |
| Total | 816 | 100.0% |
Internet Access in Mechanic Falls
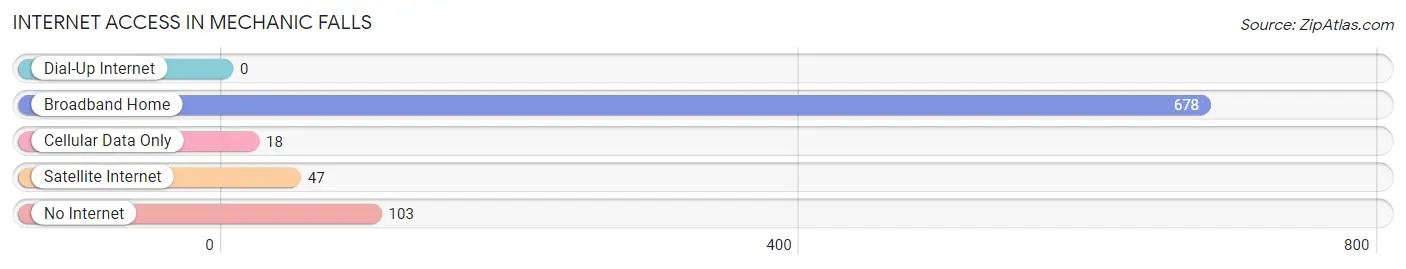
| Internet Type | # Households | % Households |
| Dial-Up Internet | 0 | 0.0% |
| Broadband Home | 678 | 83.1% |
| Cellular Data Only | 18 | 2.2% |
| Satellite Internet | 47 | 5.8% |
| No Internet | 103 | 12.6% |
| Total | 816 | 100.0% |
Mechanic Falls Summary
Mechanic Falls, Maine is a small town located in Androscoggin County, in the state of Maine. It is situated on the banks of the Little Androscoggin River, and is part of the Lewiston-Auburn metropolitan area. The town has a population of approximately 2,000 people, and is known for its small-town charm and rural atmosphere.
History
The area that is now Mechanic Falls was first settled in 1790 by a group of settlers from Massachusetts. The town was originally known as “Falls Plantation”, and was incorporated in 1802. The town was named after the falls on the Little Androscoggin River, which were used to power a sawmill and gristmill.
In the early 19th century, Mechanic Falls was a thriving industrial center, with several mills and factories located along the river. The town was also home to a number of shoe factories, which produced shoes for the Union Army during the Civil War.
In the late 19th century, Mechanic Falls began to decline as the mills and factories closed. The town’s population decreased, and the economy shifted to a more agricultural-based one.
Geography
Mechanic Falls is located in the western part of Androscoggin County, in the state of Maine. The town is situated on the banks of the Little Androscoggin River, and is part of the Lewiston-Auburn metropolitan area. The town is bordered by the towns of Poland, Minot, and Auburn.
The town has a total area of 8.2 square miles, of which 8.1 square miles is land and 0.1 square miles is water. The town is located in a hilly region, with elevations ranging from 200 to 500 feet above sea level.
Economy
The economy of Mechanic Falls is largely based on agriculture and tourism. The town is home to several farms, which produce a variety of crops, including potatoes, corn, and hay. The town is also home to several small businesses, including restaurants, shops, and a few manufacturing companies.
The town is also a popular tourist destination, with several attractions, including the Mechanic Falls Historical Society Museum, the Mechanic Falls Riverwalk, and the Mechanic Falls Covered Bridge.
Demographics
As of the 2010 census, the population of Mechanic Falls was 2,006. The racial makeup of the town was 97.3% White, 0.7% African American, 0.3% Native American, 0.3% Asian, 0.1% Pacific Islander, 0.2% from other races, and 1.2% from two or more races. Hispanic or Latino of any race were 0.9% of the population.
The median income for a household in the town was $41,250, and the median income for a family was $50,000. The per capita income for the town was $20,945. About 11.2% of families and 14.2% of the population were below the poverty line, including 18.2% of those under age 18 and 8.3% of those age 65 or over.
Common Questions
What is Per Capita Income in Mechanic Falls?
Per Capita income in Mechanic Falls is $22,986.
What is the Median Family Income in Mechanic Falls?
Median Family Income in Mechanic Falls is $47,832.
What is the Median Household income in Mechanic Falls?
Median Household Income in Mechanic Falls is $55,986.
What is Income or Wage Gap in Mechanic Falls?
Income or Wage Gap in Mechanic Falls is 38.6%.
Women in Mechanic Falls earn 61.4 cents for every dollar earned by a man.
What is Inequality or Gini Index in Mechanic Falls?
Inequality or Gini Index in Mechanic Falls is 0.34.
What is the Total Population of Mechanic Falls?
Total Population of Mechanic Falls is 2,286.
What is the Total Male Population of Mechanic Falls?
Total Male Population of Mechanic Falls is 1,062.
What is the Total Female Population of Mechanic Falls?
Total Female Population of Mechanic Falls is 1,224.
What is the Ratio of Males per 100 Females in Mechanic Falls?
There are 86.76 Males per 100 Females in Mechanic Falls.
What is the Ratio of Females per 100 Males in Mechanic Falls?
There are 115.25 Females per 100 Males in Mechanic Falls.
What is the Median Population Age in Mechanic Falls?
Median Population Age in Mechanic Falls is 37.7 Years.
What is the Average Family Size in Mechanic Falls
Average Family Size in Mechanic Falls is 3.1 People.
What is the Average Household Size in Mechanic Falls
Average Household Size in Mechanic Falls is 2.7 People.
How Large is the Labor Force in Mechanic Falls?
There are 1,098 People in the Labor Forcein in Mechanic Falls.
What is the Percentage of People in the Labor Force in Mechanic Falls?
66.4% of People are in the Labor Force in Mechanic Falls.
What is the Unemployment Rate in Mechanic Falls?
Unemployment Rate in Mechanic Falls is 8.7%.