Blaine, ME Map & Demographics
Blaine Map
Blaine Overview
$37,572
PER CAPITA INCOME
$140,109
AVG FAMILY INCOME
9.5%
WAGE / INCOME GAP [ % ]
90.5¢/ $1
WAGE / INCOME GAP [ $ ]
0.41
INEQUALITY / GINI INDEX
254
TOTAL POPULATION
117
MALE POPULATION
137
FEMALE POPULATION
85.40
MALES / 100 FEMALES
117.09
FEMALES / 100 MALES
50.7
MEDIAN AGE
3.0
AVG FAMILY SIZE
2.4
AVG HOUSEHOLD SIZE
181
LABOR FORCE [ PEOPLE ]
78.7%
PERCENT IN LABOR FORCE
4.4%
UNEMPLOYMENT RATE
Blaine Zip Codes
Blaine Area Codes
Income in Blaine
Income Overview in Blaine
| Characteristic | Number | Measure |
| Per Capita Income | 254 | $37,572 |
| Median Family Income | 74 | $140,109 |
| Mean Family Income | 74 | $117,015 |
| Median Household Income | 105 | $0 |
| Mean Household Income | 105 | $88,825 |
| Income Deficit | 74 | $0 |
| Wage / Income Gap (%) | 254 | 9.46% |
| Wage / Income Gap ($) | 254 | 90.54¢ per $1 |
| Gini / Inequality Index | 254 | 0.41 |
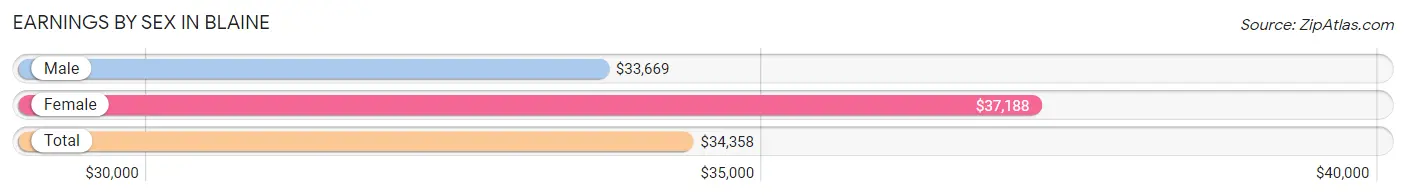
Earnings by Sex in Blaine
Average Earnings in Blaine are $34,358, $33,669 for men and $37,188 for women, a difference of 9.5%.
| Sex | Number | Average Earnings |
| Male | 97 (53.6%) | $33,669 |
| Female | 84 (46.4%) | $37,188 |
| Total | 181 (100.0%) | $34,358 |
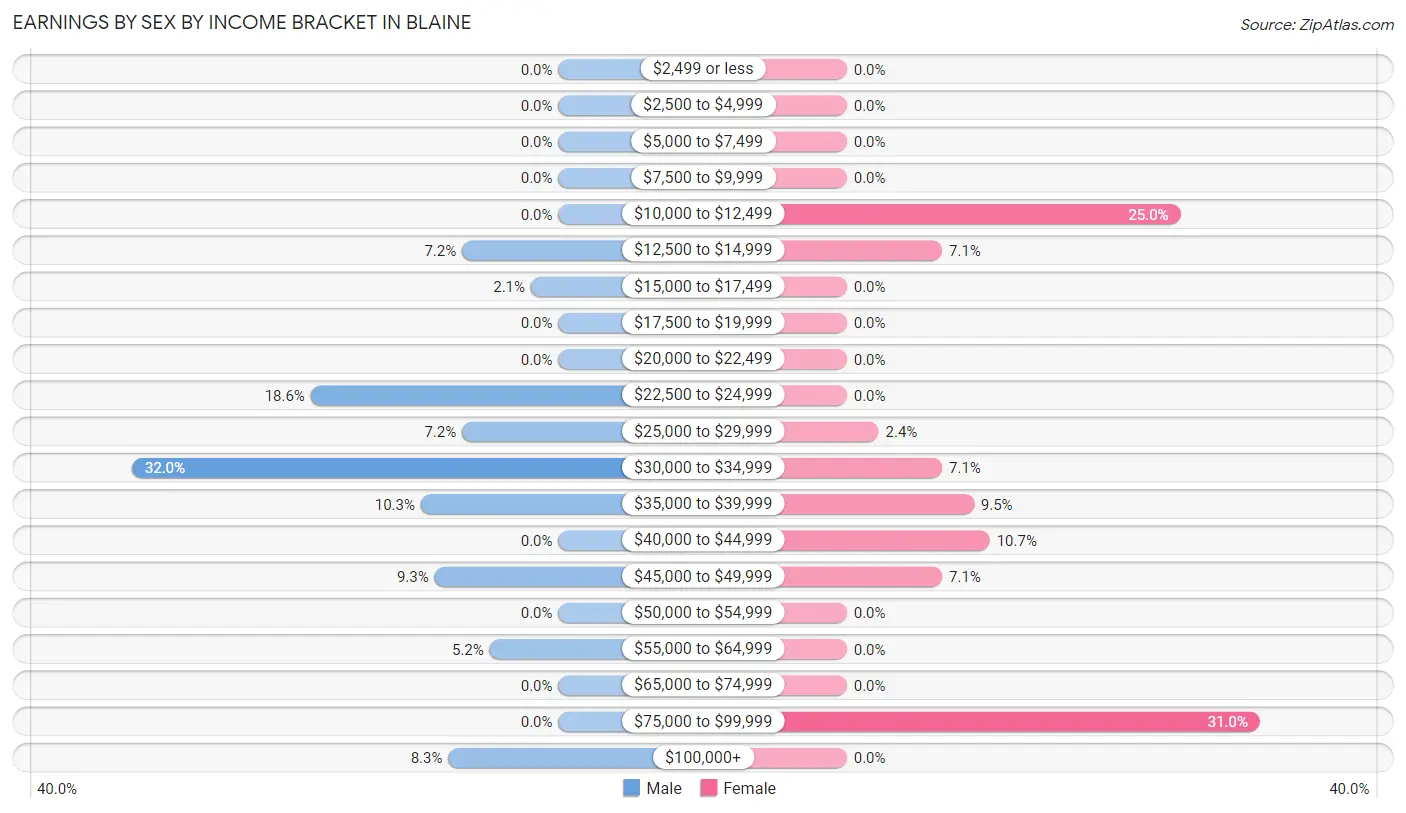
Earnings by Sex by Income Bracket in Blaine
The most common earnings brackets in Blaine are $30,000 to $34,999 for men (31 | 32.0%) and $75,000 to $99,999 for women (26 | 30.9%).
| Income | Male | Female |
| $2,499 or less | 0 (0.0%) | 0 (0.0%) |
| $2,500 to $4,999 | 0 (0.0%) | 0 (0.0%) |
| $5,000 to $7,499 | 0 (0.0%) | 0 (0.0%) |
| $7,500 to $9,999 | 0 (0.0%) | 0 (0.0%) |
| $10,000 to $12,499 | 0 (0.0%) | 21 (25.0%) |
| $12,500 to $14,999 | 7 (7.2%) | 6 (7.1%) |
| $15,000 to $17,499 | 2 (2.1%) | 0 (0.0%) |
| $17,500 to $19,999 | 0 (0.0%) | 0 (0.0%) |
| $20,000 to $22,499 | 0 (0.0%) | 0 (0.0%) |
| $22,500 to $24,999 | 18 (18.6%) | 0 (0.0%) |
| $25,000 to $29,999 | 7 (7.2%) | 2 (2.4%) |
| $30,000 to $34,999 | 31 (32.0%) | 6 (7.1%) |
| $35,000 to $39,999 | 10 (10.3%) | 8 (9.5%) |
| $40,000 to $44,999 | 0 (0.0%) | 9 (10.7%) |
| $45,000 to $49,999 | 9 (9.3%) | 6 (7.1%) |
| $50,000 to $54,999 | 0 (0.0%) | 0 (0.0%) |
| $55,000 to $64,999 | 5 (5.1%) | 0 (0.0%) |
| $65,000 to $74,999 | 0 (0.0%) | 0 (0.0%) |
| $75,000 to $99,999 | 0 (0.0%) | 26 (30.9%) |
| $100,000+ | 8 (8.3%) | 0 (0.0%) |
| Total | 97 (100.0%) | 84 (100.0%) |
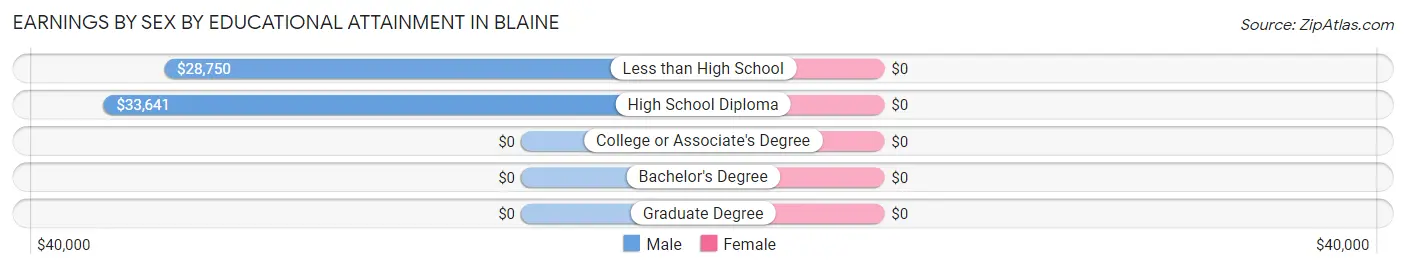
Earnings by Sex by Educational Attainment in Blaine
| Educational Attainment | Male Income | Female Income |
| Less than High School | $28,750 | $0 |
| High School Diploma | $33,641 | $0 |
| College or Associate's Degree | - | - |
| Bachelor's Degree | - | - |
| Graduate Degree | - | - |
| Total | $34,022 | $0 |
Family Income in Blaine
Family Income Brackets in Blaine
According to the Blaine family income data, there are 28 families falling into the $100,000 to $149,999 income range, which is the most common income bracket and makes up 37.8% of all families.
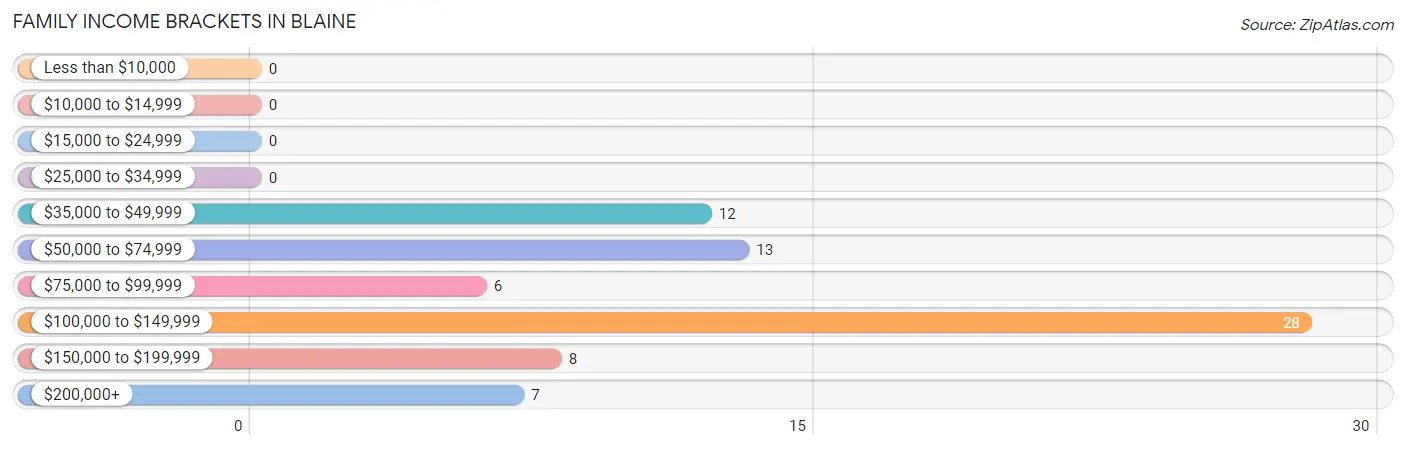
| Income Bracket | # Families | % Families |
| Less than $10,000 | 0 | 0.0% |
| $10,000 to $14,999 | 0 | 0.0% |
| $15,000 to $24,999 | 0 | 0.0% |
| $25,000 to $34,999 | 0 | 0.0% |
| $35,000 to $49,999 | 12 | 16.2% |
| $50,000 to $74,999 | 13 | 17.6% |
| $75,000 to $99,999 | 6 | 8.1% |
| $100,000 to $149,999 | 28 | 37.8% |
| $150,000 to $199,999 | 8 | 10.8% |
| $200,000+ | 7 | 9.5% |
Family Income by Famaliy Size in Blaine
4-person families (14 | 18.9%) account for the highest median family income in Blaine with $171,250 per family, while 2-person families (47 | 63.5%) have the highest median income of $70,408 per family member.
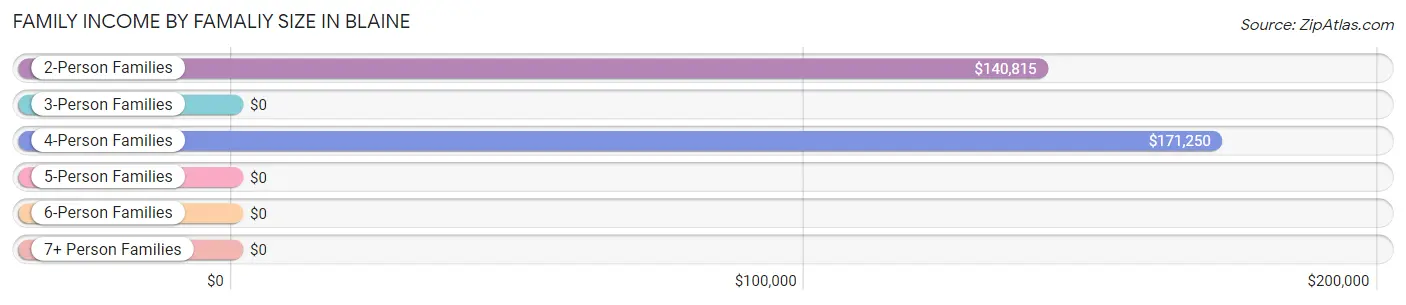
| Income Bracket | # Families | Median Income |
| 2-Person Families | 47 (63.5%) | $140,815 |
| 3-Person Families | 7 (9.5%) | $0 |
| 4-Person Families | 14 (18.9%) | $171,250 |
| 5-Person Families | 6 (8.1%) | $0 |
| 6-Person Families | 0 (0.0%) | $0 |
| 7+ Person Families | 0 (0.0%) | $0 |
| Total | 74 (100.0%) | $140,109 |
Family Income by Number of Earners in Blaine
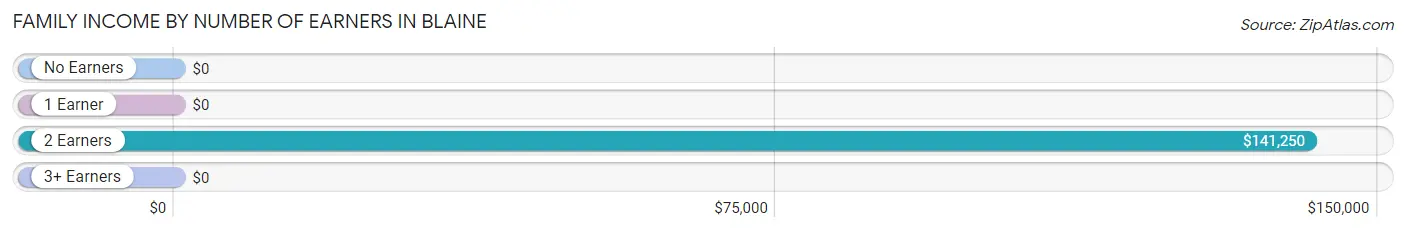
| Number of Earners | # Families | Median Income |
| No Earners | 6 (8.1%) | $0 |
| 1 Earner | 10 (13.5%) | $0 |
| 2 Earners | 39 (52.7%) | $141,250 |
| 3+ Earners | 19 (25.7%) | $0 |
| Total | 74 (100.0%) | $140,109 |
Household Income in Blaine
Household Income Brackets in Blaine
With 28 households falling in the category, the $100,000 to $149,999 income range is the most frequent in Blaine, accounting for 26.7% of all households.
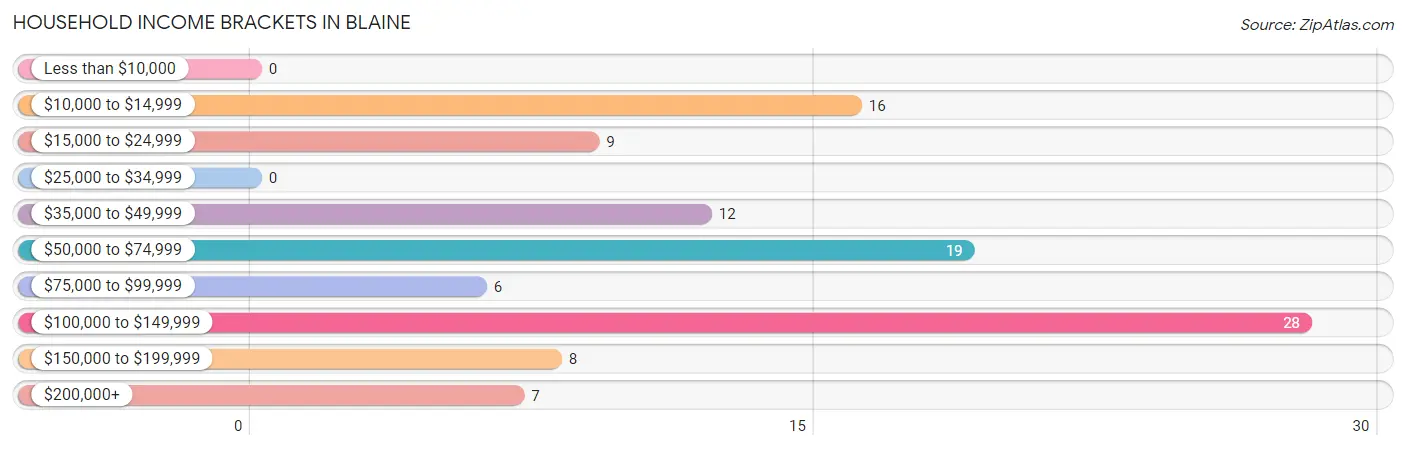
| Income Bracket | # Households | % Households |
| Less than $10,000 | 0 | 0.0% |
| $10,000 to $14,999 | 16 | 15.2% |
| $15,000 to $24,999 | 9 | 8.6% |
| $25,000 to $34,999 | 0 | 0.0% |
| $35,000 to $49,999 | 12 | 11.4% |
| $50,000 to $74,999 | 19 | 18.1% |
| $75,000 to $99,999 | 6 | 5.7% |
| $100,000 to $149,999 | 28 | 26.7% |
| $150,000 to $199,999 | 8 | 7.6% |
| $200,000+ | 7 | 6.7% |
Household Income by Householder Age in Blaine
The median household income in Blaine is $0, with the highest median household income of $160,000 found in the 45 to 64 years age bracket for the primary householder. A total of 30 households (28.6%) fall into this category.
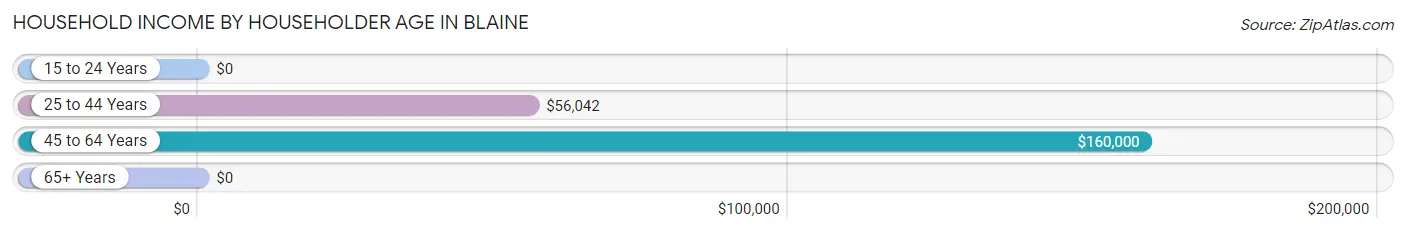
| Income Bracket | # Households | Median Income |
| 15 to 24 Years | 0 (0.0%) | $0 |
| 25 to 44 Years | 21 (20.0%) | $56,042 |
| 45 to 64 Years | 30 (28.6%) | $160,000 |
| 65+ Years | 54 (51.4%) | $0 |
| Total | 105 (100.0%) | $0 |
Poverty in Blaine
Income Below Poverty by Sex and Age in Blaine
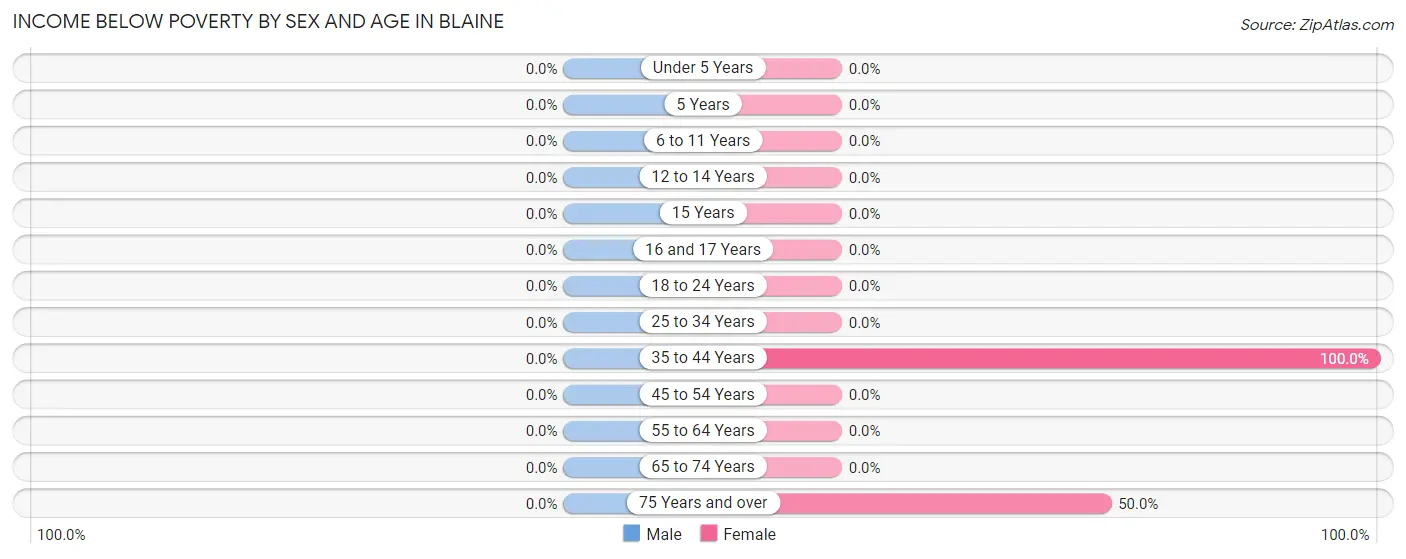
| Age Bracket | Male | Female |
| Under 5 Years | 0 (0.0%) | 0 (0.0%) |
| 5 Years | 0 (0.0%) | 0 (0.0%) |
| 6 to 11 Years | 0 (0.0%) | 0 (0.0%) |
| 12 to 14 Years | 0 (0.0%) | 0 (0.0%) |
| 15 Years | 0 (0.0%) | 0 (0.0%) |
| 16 and 17 Years | 0 (0.0%) | 0 (0.0%) |
| 18 to 24 Years | 0 (0.0%) | 0 (0.0%) |
| 25 to 34 Years | 0 (0.0%) | 0 (0.0%) |
| 35 to 44 Years | 0 (0.0%) | 6 (100.0%) |
| 45 to 54 Years | 0 (0.0%) | 0 (0.0%) |
| 55 to 64 Years | 0 (0.0%) | 0 (0.0%) |
| 65 to 74 Years | 0 (0.0%) | 0 (0.0%) |
| 75 Years and over | 0 (0.0%) | 7 (50.0%) |
| Total | 0 (0.0%) | 13 (9.5%) |
Income Above Poverty by Sex and Age in Blaine
According to the poverty statistics in Blaine, males aged 6 to 11 years and females aged under 5 years are the age groups that are most secure financially, with 100.0% of males and 100.0% of females in these age groups living above the poverty line.
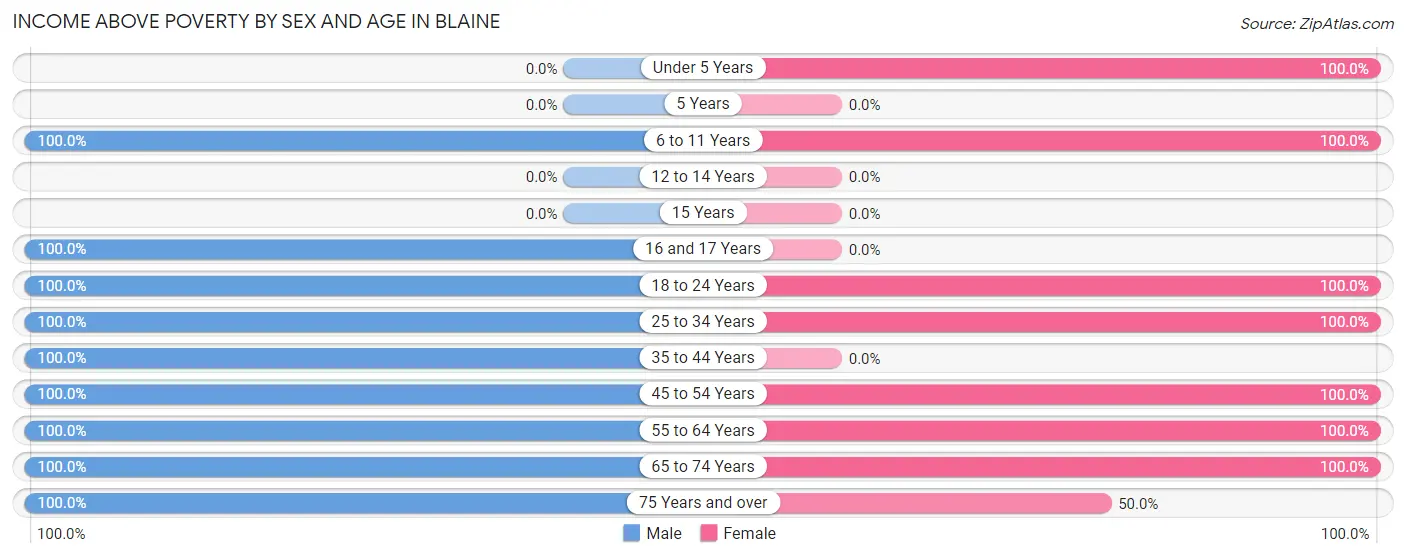
| Age Bracket | Male | Female |
| Under 5 Years | 0 (0.0%) | 2 (100.0%) |
| 5 Years | 0 (0.0%) | 0 (0.0%) |
| 6 to 11 Years | 2 (100.0%) | 20 (100.0%) |
| 12 to 14 Years | 0 (0.0%) | 0 (0.0%) |
| 15 Years | 0 (0.0%) | 0 (0.0%) |
| 16 and 17 Years | 7 (100.0%) | 0 (0.0%) |
| 18 to 24 Years | 8 (100.0%) | 25 (100.0%) |
| 25 to 34 Years | 20 (100.0%) | 8 (100.0%) |
| 35 to 44 Years | 7 (100.0%) | 0 (0.0%) |
| 45 to 54 Years | 14 (100.0%) | 18 (100.0%) |
| 55 to 64 Years | 18 (100.0%) | 19 (100.0%) |
| 65 to 74 Years | 33 (100.0%) | 25 (100.0%) |
| 75 Years and over | 8 (100.0%) | 7 (50.0%) |
| Total | 117 (100.0%) | 124 (90.5%) |
Income Below Poverty Among Married-Couple Families in Blaine
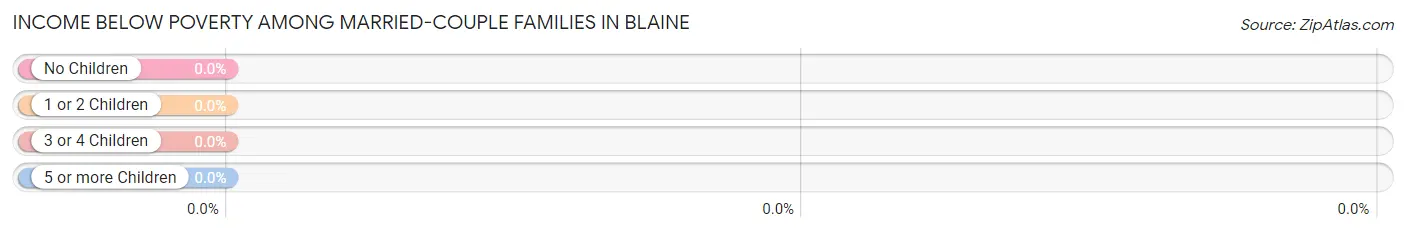
| Children | Above Poverty | Below Poverty |
| No Children | 61 (100.0%) | 0 (0.0%) |
| 1 or 2 Children | 7 (100.0%) | 0 (0.0%) |
| 3 or 4 Children | 6 (100.0%) | 0 (0.0%) |
| 5 or more Children | 0 (0.0%) | 0 (0.0%) |
| Total | 74 (100.0%) | 0 (0.0%) |
Income Below Poverty Among Single-Parent Households in Blaine
| Children | Single Father | Single Mother |
| No Children | 0 (0.0%) | 0 (0.0%) |
| 1 or 2 Children | 0 (0.0%) | 0 (0.0%) |
| 3 or 4 Children | 0 (0.0%) | 0 (0.0%) |
| 5 or more Children | 0 (0.0%) | 0 (0.0%) |
| Total | 0 (0.0%) | 0 (0.0%) |
Income Below Poverty Among Married-Couple vs Single-Parent Households in Blaine
| Children | Married-Couple Families | Single-Parent Households |
| No Children | 0 (0.0%) | 0 (0.0%) |
| 1 or 2 Children | 0 (0.0%) | 0 (0.0%) |
| 3 or 4 Children | 0 (0.0%) | 0 (0.0%) |
| 5 or more Children | 0 (0.0%) | 0 (0.0%) |
| Total | 0 (0.0%) | 0 (0.0%) |
Race in Blaine
The most populous races in Blaine are White / Caucasian (249 | 98.0%), and Native / Alaskan (5 | 2.0%).
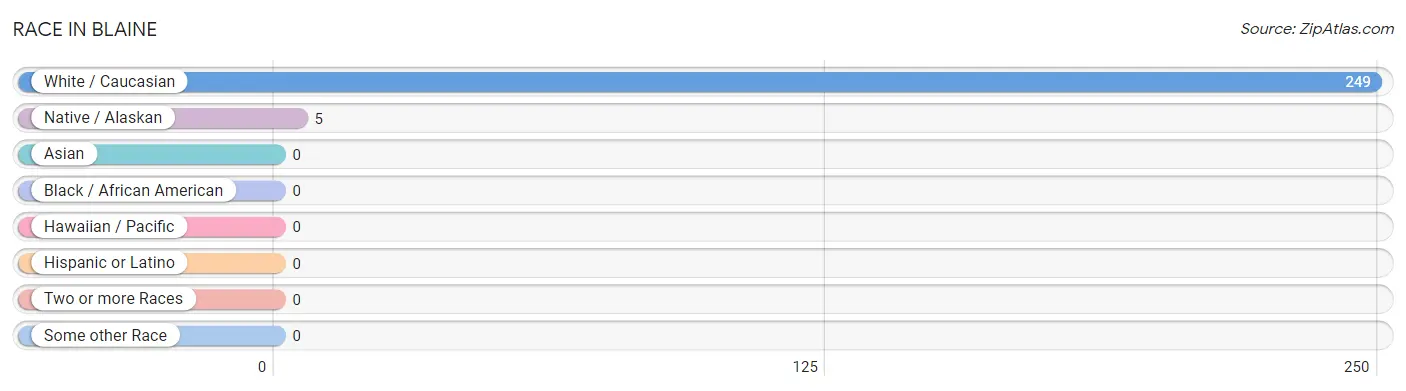
| Race | # Population | % Population |
| Asian | 0 | 0.0% |
| Black / African American | 0 | 0.0% |
| Hawaiian / Pacific | 0 | 0.0% |
| Hispanic or Latino | 0 | 0.0% |
| Native / Alaskan | 5 | 2.0% |
| White / Caucasian | 249 | 98.0% |
| Two or more Races | 0 | 0.0% |
| Some other Race | 0 | 0.0% |
| Total | 254 | 100.0% |
Ancestry in Blaine
The most populous ancestries reported in Blaine are English (90 | 35.4%), Irish (66 | 26.0%), American (40 | 15.8%), Scottish (26 | 10.2%), and Scotch-Irish (20 | 7.9%), together accounting for 95.3% of all Blaine residents.
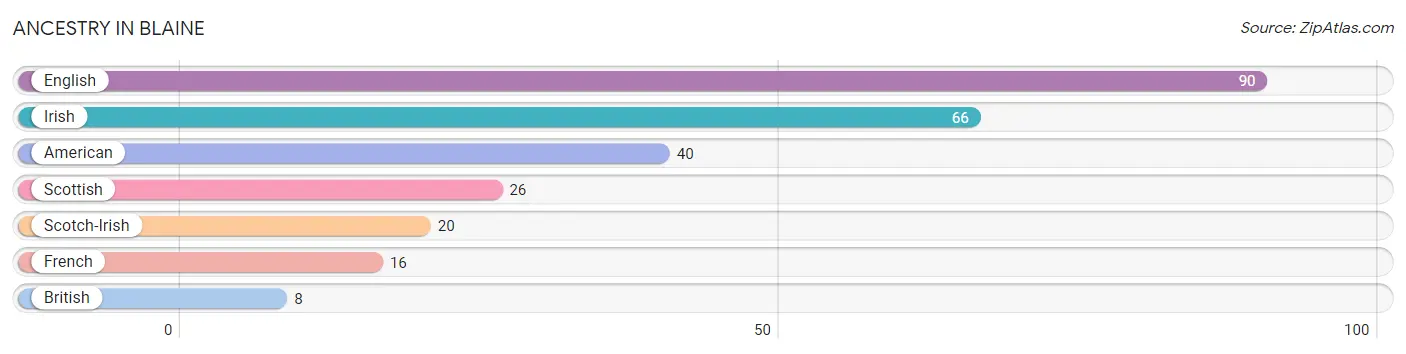
| Ancestry | # Population | % Population |
| American | 40 | 15.8% |
| British | 8 | 3.2% |
| English | 90 | 35.4% |
| French | 16 | 6.3% |
| Irish | 66 | 26.0% |
| Scotch-Irish | 20 | 7.9% |
| Scottish | 26 | 10.2% | View All 7 Rows |
Immigrants in Blaine

| Immigration Origin | # Population | % Population | View All 0 Rows |
Sex and Age in Blaine
Sex and Age in Blaine
The most populous age groups in Blaine are 70 to 74 Years (33 | 28.2%) for men and 60 to 64 Years (19 | 13.9%) for women.
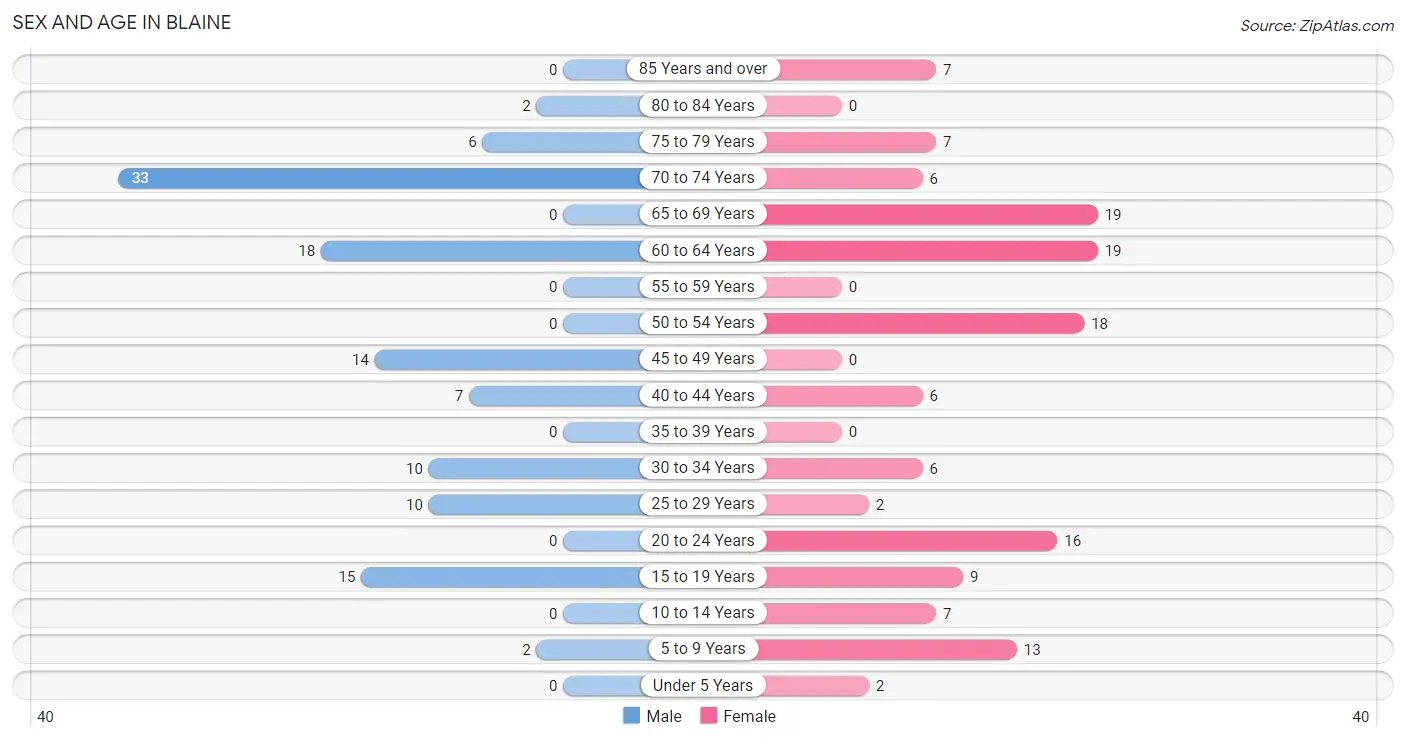
| Age Bracket | Male | Female |
| Under 5 Years | 0 (0.0%) | 2 (1.5%) |
| 5 to 9 Years | 2 (1.7%) | 13 (9.5%) |
| 10 to 14 Years | 0 (0.0%) | 7 (5.1%) |
| 15 to 19 Years | 15 (12.8%) | 9 (6.6%) |
| 20 to 24 Years | 0 (0.0%) | 16 (11.7%) |
| 25 to 29 Years | 10 (8.6%) | 2 (1.5%) |
| 30 to 34 Years | 10 (8.6%) | 6 (4.4%) |
| 35 to 39 Years | 0 (0.0%) | 0 (0.0%) |
| 40 to 44 Years | 7 (6.0%) | 6 (4.4%) |
| 45 to 49 Years | 14 (12.0%) | 0 (0.0%) |
| 50 to 54 Years | 0 (0.0%) | 18 (13.1%) |
| 55 to 59 Years | 0 (0.0%) | 0 (0.0%) |
| 60 to 64 Years | 18 (15.4%) | 19 (13.9%) |
| 65 to 69 Years | 0 (0.0%) | 19 (13.9%) |
| 70 to 74 Years | 33 (28.2%) | 6 (4.4%) |
| 75 to 79 Years | 6 (5.1%) | 7 (5.1%) |
| 80 to 84 Years | 2 (1.7%) | 0 (0.0%) |
| 85 Years and over | 0 (0.0%) | 7 (5.1%) |
| Total | 117 (100.0%) | 137 (100.0%) |
Families and Households in Blaine
Median Family Size in Blaine
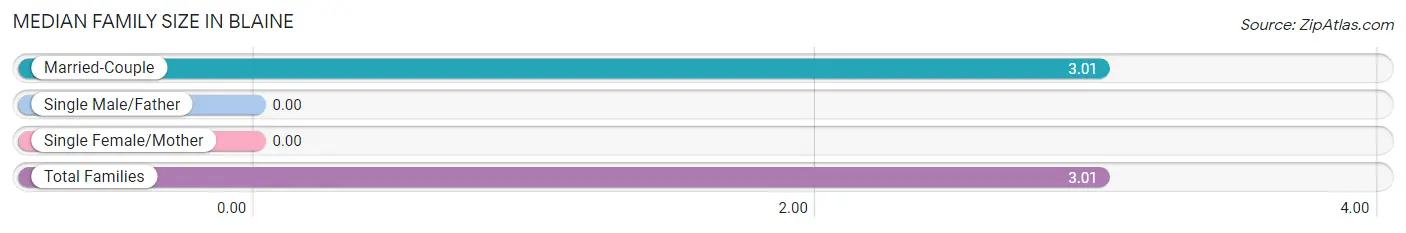
| Family Type | # Families | Family Size |
| Married-Couple | 74 (100.0%) | 3.01 |
| Single Male/Father | 0 (0.0%) | - |
| Single Female/Mother | 0 (0.0%) | - |
| Total Families | 74 (100.0%) | 3.01 |
Median Household Size in Blaine
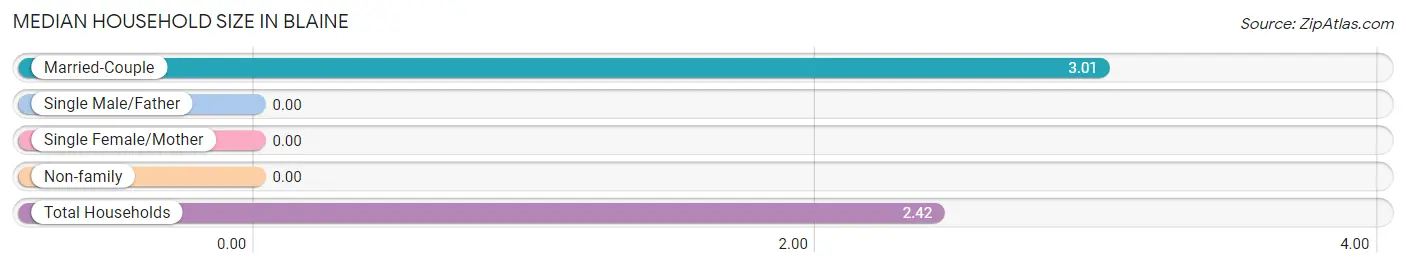
| Household Type | # Households | Household Size |
| Married-Couple | 74 (70.5%) | 3.01 |
| Single Male/Father | 0 (0.0%) | - |
| Single Female/Mother | 0 (0.0%) | - |
| Non-family | 31 (29.5%) | - |
| Total Households | 105 (100.0%) | 2.42 |
Household Size by Marriage Status in Blaine
Out of a total of 105 households in Blaine, 74 (70.5%) are family households, while 31 (29.5%) are nonfamily households. The most numerous type of family households are 2-person households, comprising 47, and the most common type of nonfamily households are 1-person households, comprising 31.
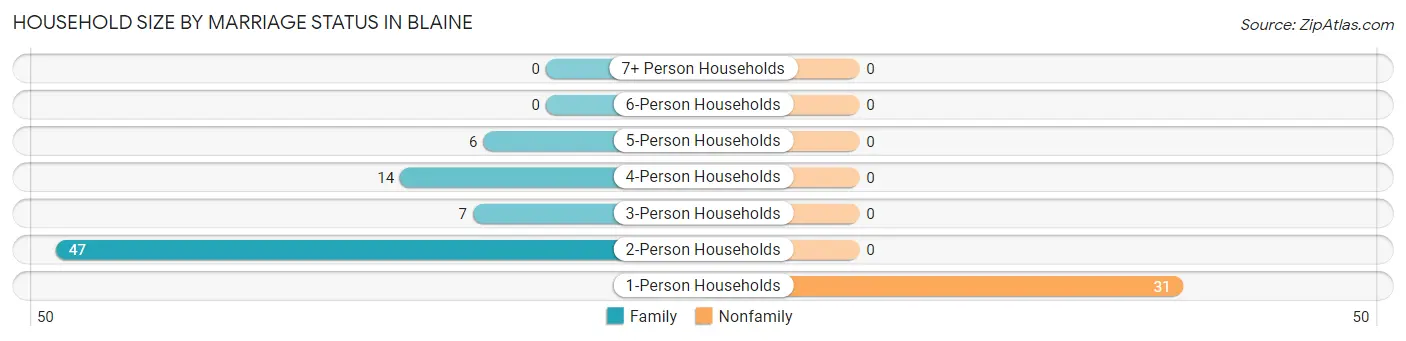
| Household Size | Family Households | Nonfamily Households |
| 1-Person Households | - | 31 (29.5%) |
| 2-Person Households | 47 (44.8%) | 0 (0.0%) |
| 3-Person Households | 7 (6.7%) | 0 (0.0%) |
| 4-Person Households | 14 (13.3%) | 0 (0.0%) |
| 5-Person Households | 6 (5.7%) | 0 (0.0%) |
| 6-Person Households | 0 (0.0%) | 0 (0.0%) |
| 7+ Person Households | 0 (0.0%) | 0 (0.0%) |
| Total | 74 (70.5%) | 31 (29.5%) |
Female Fertility in Blaine
Fertility by Age in Blaine
Average fertility rate in Blaine is 40.0 births per 1,000 women. Women in the age bracket of 20 to 34 years have the highest fertility rate with 83.0 births per 1,000 women. Women in the age bracket of 20 to 34 years acount for 100.0% of all women with births.
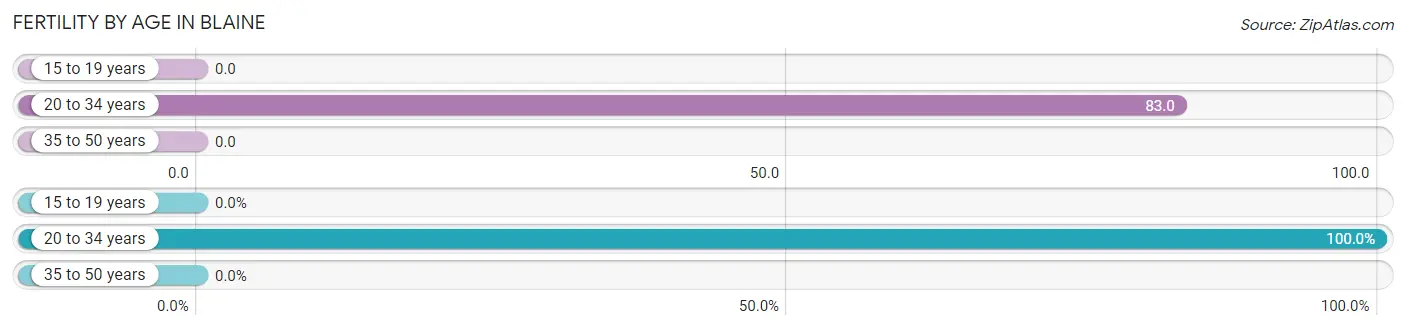
| Age Bracket | Women with Births | Births / 1,000 Women |
| 15 to 19 years | 0 (0.0%) | 0.0 |
| 20 to 34 years | 2 (100.0%) | 83.0 |
| 35 to 50 years | 0 (0.0%) | 0.0 |
| Total | 2 (100.0%) | 40.0 |
Fertility by Age by Marriage Status in Blaine
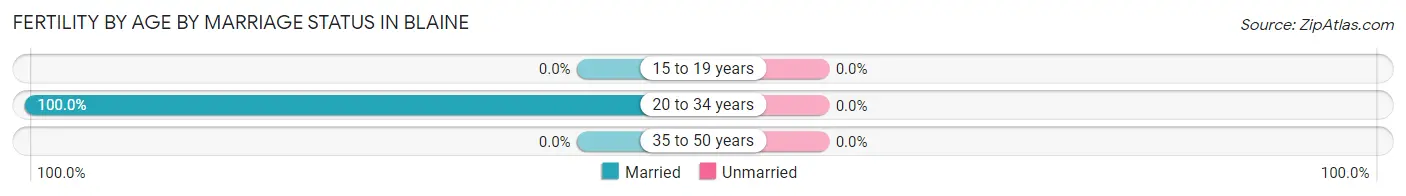
| Age Bracket | Married | Unmarried |
| 15 to 19 years | 0 (0.0%) | 0 (0.0%) |
| 20 to 34 years | 2 (100.0%) | 0 (0.0%) |
| 35 to 50 years | 0 (0.0%) | 0 (0.0%) |
| Total | 2 (100.0%) | 0 (0.0%) |
Fertility by Education in Blaine
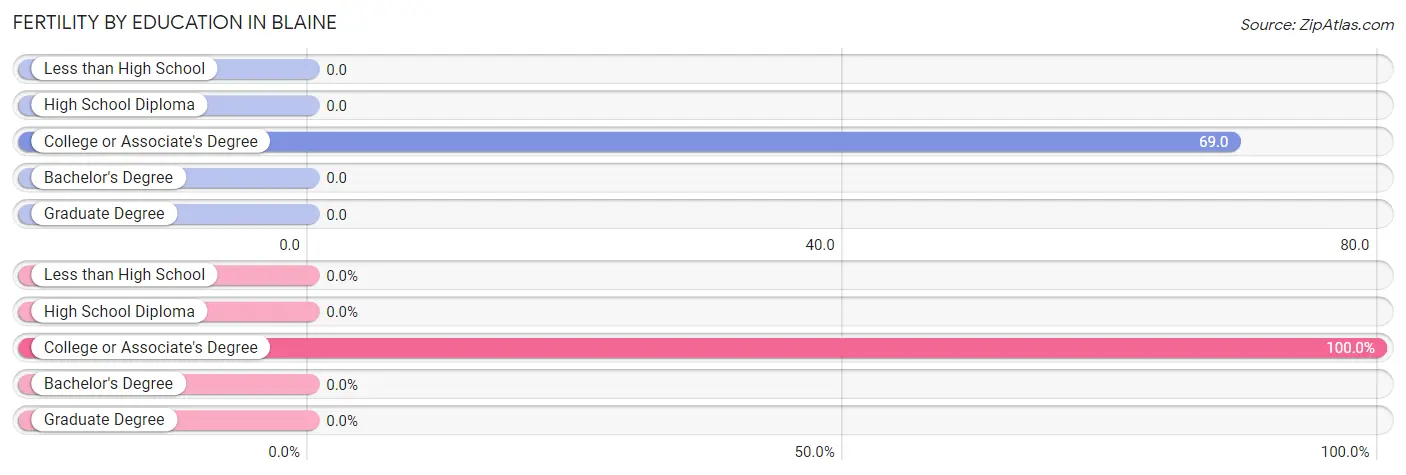
| Educational Attainment | Women with Births | Births / 1,000 Women |
| Less than High School | 0 (0.0%) | 0.0 |
| High School Diploma | 0 (0.0%) | 0.0 |
| College or Associate's Degree | 2 (100.0%) | 69.0 |
| Bachelor's Degree | 0 (0.0%) | 0.0 |
| Graduate Degree | 0 (0.0%) | 0.0 |
| Total | 2 (100.0%) | 40.0 |
Fertility by Education by Marriage Status in Blaine
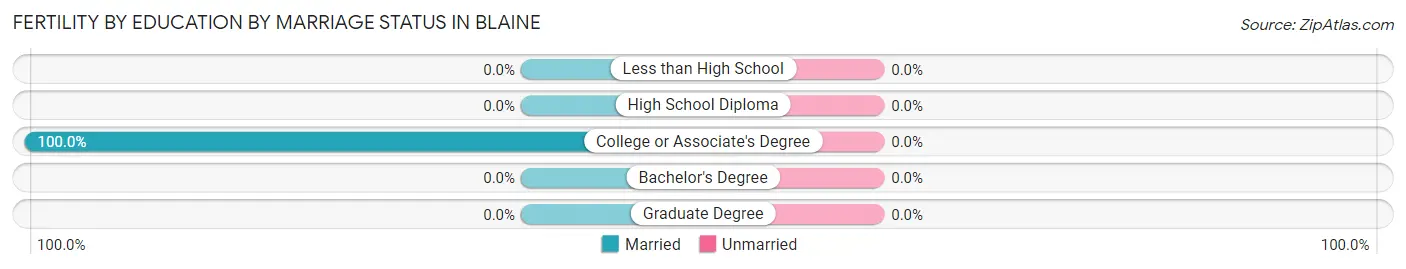
| Educational Attainment | Married | Unmarried |
| Less than High School | 0 (0.0%) | 0 (0.0%) |
| High School Diploma | 0 (0.0%) | 0 (0.0%) |
| College or Associate's Degree | 2 (100.0%) | 0 (0.0%) |
| Bachelor's Degree | 0 (0.0%) | 0 (0.0%) |
| Graduate Degree | 0 (0.0%) | 0 (0.0%) |
| Total | 2 (100.0%) | 0 (0.0%) |
Employment Characteristics in Blaine
Employment by Class of Employer in Blaine
Among the 151 employed individuals in Blaine, private company employees (84 | 55.6%), self-employed (not incorporated) (30 | 19.9%), and self-employed (incorporated) (16 | 10.6%) make up the most common classes of employment.
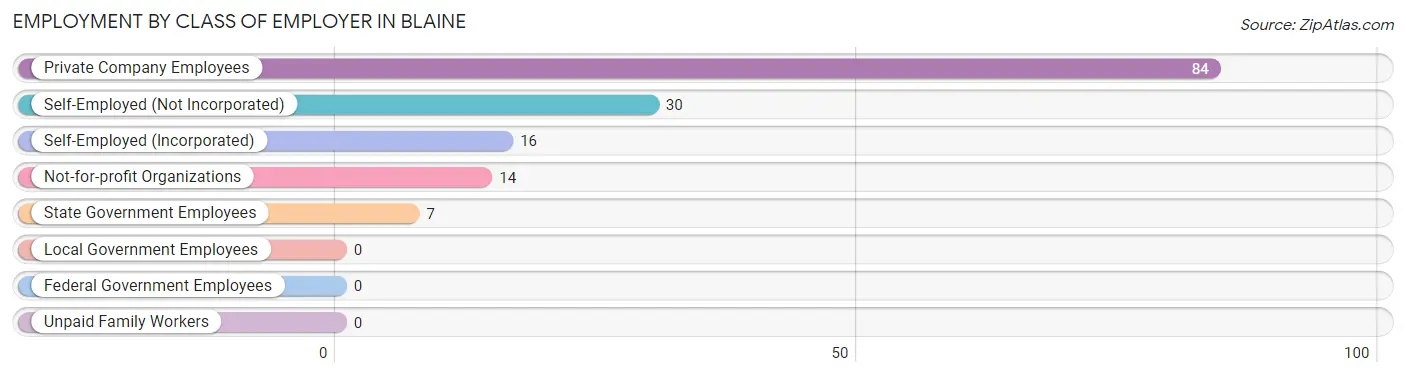
| Employer Class | # Employees | % Employees |
| Private Company Employees | 84 | 55.6% |
| Self-Employed (Incorporated) | 16 | 10.6% |
| Self-Employed (Not Incorporated) | 30 | 19.9% |
| Not-for-profit Organizations | 14 | 9.3% |
| Local Government Employees | 0 | 0.0% |
| State Government Employees | 7 | 4.6% |
| Federal Government Employees | 0 | 0.0% |
| Unpaid Family Workers | 0 | 0.0% |
| Total | 151 | 100.0% |
Employment Status by Age in Blaine
According to the labor force statistics for Blaine, out of the total population over 16 years of age (230), 78.7% or 181 individuals are in the labor force, with 4.4% or 8 of them unemployed. The age group with the highest labor force participation rate is 16 to 19 years, with 100.0% or 24 individuals in the labor force. Within the labor force, the 30 to 34 years age range has the highest percentage of unemployed individuals, with 50.0% or 8 of them being unemployed.
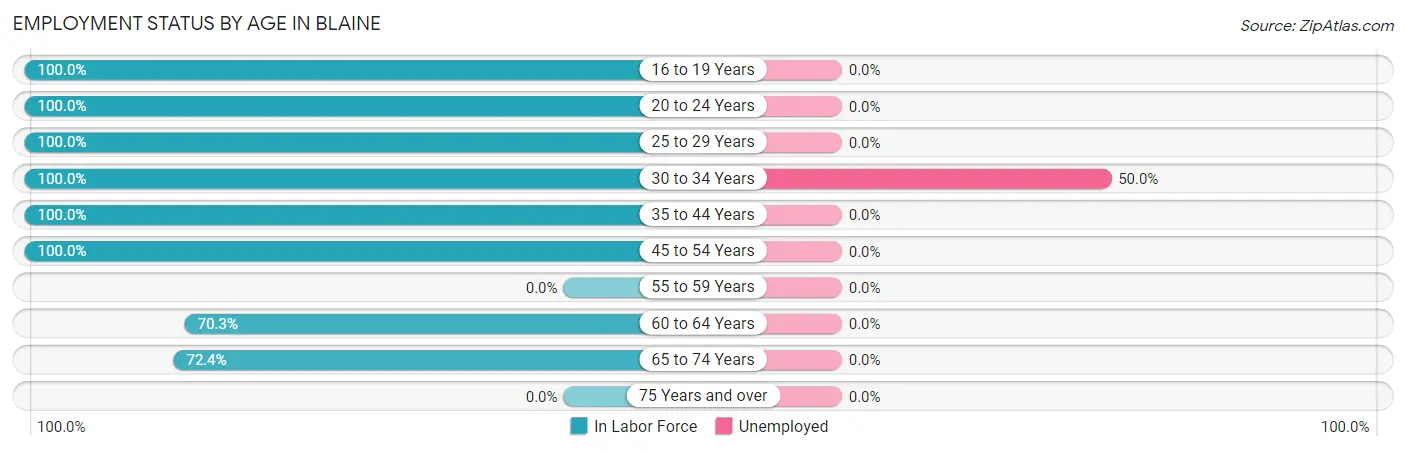
| Age Bracket | In Labor Force | Unemployed |
| 16 to 19 Years | 24 (100.0%) | 0 (0.0%) |
| 20 to 24 Years | 16 (100.0%) | 0 (0.0%) |
| 25 to 29 Years | 12 (100.0%) | 0 (0.0%) |
| 30 to 34 Years | 16 (100.0%) | 8 (50.0%) |
| 35 to 44 Years | 13 (100.0%) | 0 (0.0%) |
| 45 to 54 Years | 32 (100.0%) | 0 (0.0%) |
| 55 to 59 Years | 0 (0.0%) | 0 (0.0%) |
| 60 to 64 Years | 26 (70.3%) | 0 (0.0%) |
| 65 to 74 Years | 42 (72.4%) | 0 (0.0%) |
| 75 Years and over | 0 (0.0%) | 0 (0.0%) |
| Total | 181 (78.7%) | 8 (4.4%) |
Employment Status by Educational Attainment in Blaine
According to labor force statistics for Blaine, 90.0% of individuals (99) out of the total population between 25 and 64 years of age (110) are in the labor force, with 8.1% or 8 of them being unemployed. The group with the highest labor force participation rate are those with the educational attainment of high school diploma, with 100.0% or 24 individuals in the labor force. Within the labor force, individuals with high school diploma education have the highest percentage of unemployment, with 33.3% or 8 of them being unemployed.
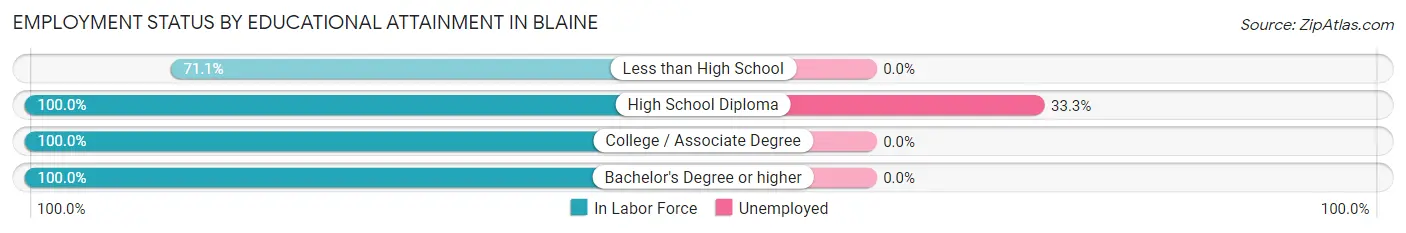
| Educational Attainment | In Labor Force | Unemployed |
| Less than High School | 27 (71.1%) | 0 (0.0%) |
| High School Diploma | 24 (100.0%) | 8 (33.3%) |
| College / Associate Degree | 30 (100.0%) | 0 (0.0%) |
| Bachelor's Degree or higher | 18 (100.0%) | 0 (0.0%) |
| Total | 99 (90.0%) | 9 (8.1%) |
Employment Occupations by Sex in Blaine
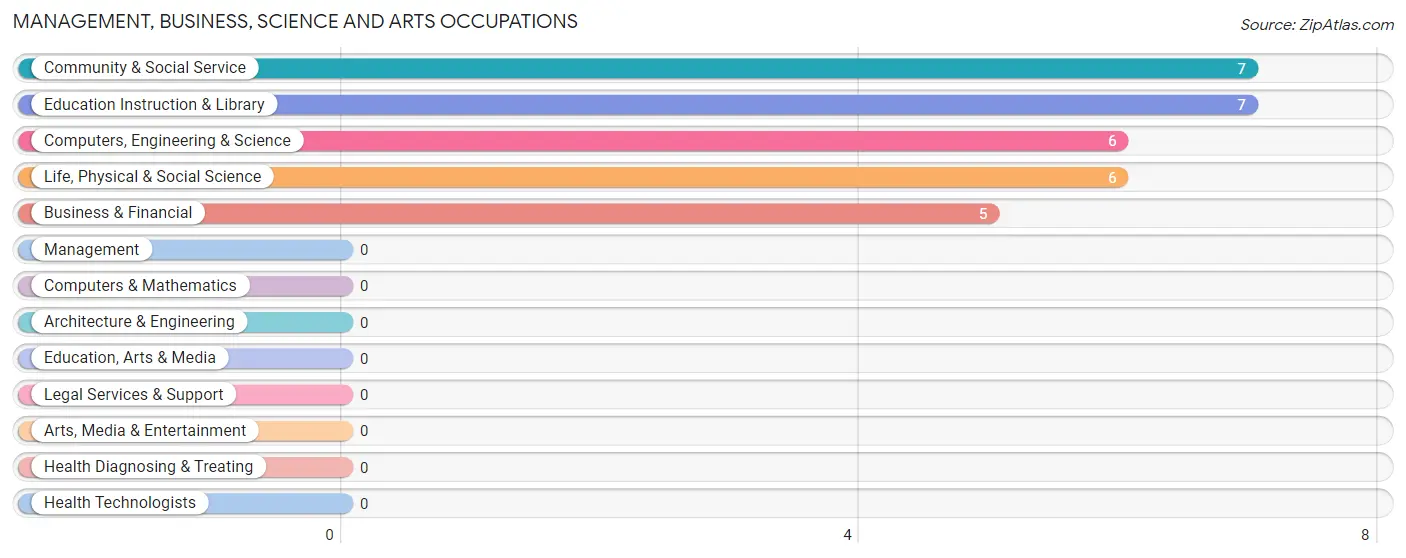
Management, Business, Science and Arts Occupations
The most common Management, Business, Science and Arts occupations in Blaine are Community & Social Service (7 | 4.1%), Education Instruction & Library (7 | 4.1%), Computers, Engineering & Science (6 | 3.5%), Life, Physical & Social Science (6 | 3.5%), and Business & Financial (5 | 2.9%).
Management, Business, Science and Arts Occupations by Sex
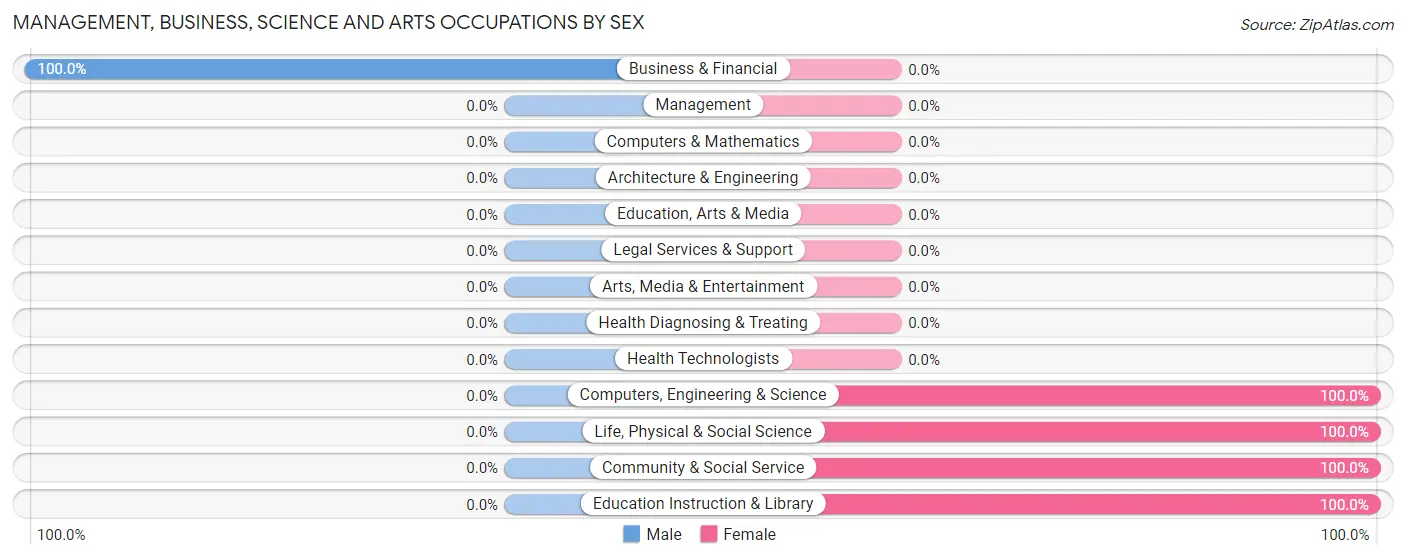
| Occupation | Male | Female |
| Management | 0 (0.0%) | 0 (0.0%) |
| Business & Financial | 5 (100.0%) | 0 (0.0%) |
| Computers, Engineering & Science | 0 (0.0%) | 6 (100.0%) |
| Computers & Mathematics | 0 (0.0%) | 0 (0.0%) |
| Architecture & Engineering | 0 (0.0%) | 0 (0.0%) |
| Life, Physical & Social Science | 0 (0.0%) | 6 (100.0%) |
| Community & Social Service | 0 (0.0%) | 7 (100.0%) |
| Education, Arts & Media | 0 (0.0%) | 0 (0.0%) |
| Legal Services & Support | 0 (0.0%) | 0 (0.0%) |
| Education Instruction & Library | 0 (0.0%) | 7 (100.0%) |
| Arts, Media & Entertainment | 0 (0.0%) | 0 (0.0%) |
| Health Diagnosing & Treating | 0 (0.0%) | 0 (0.0%) |
| Health Technologists | 0 (0.0%) | 0 (0.0%) |
| Total (Category) | 5 (27.8%) | 13 (72.2%) |
| Total (Overall) | 89 (51.4%) | 84 (48.5%) |
Services Occupations
The most common Services occupations in Blaine are Healthcare Support (9 | 5.2%), and Food Preparation & Serving (6 | 3.5%).
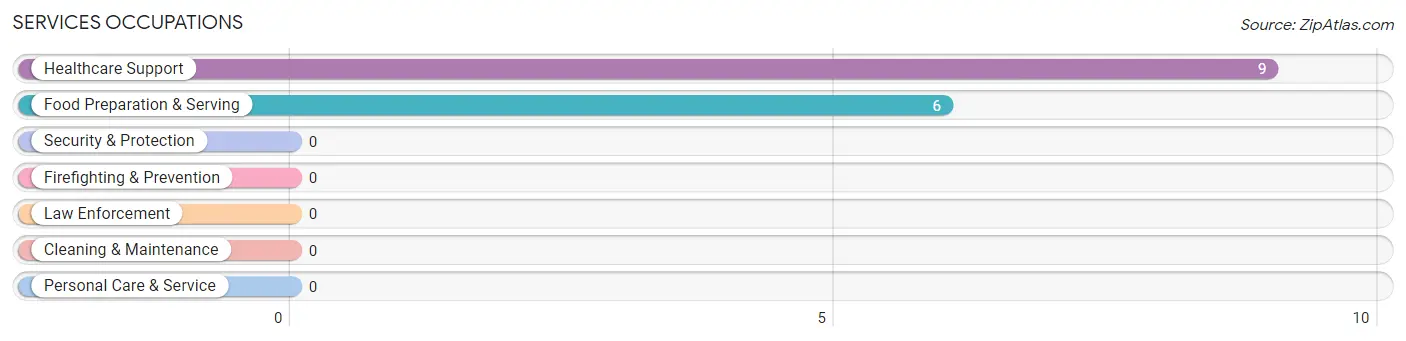
Services Occupations by Sex
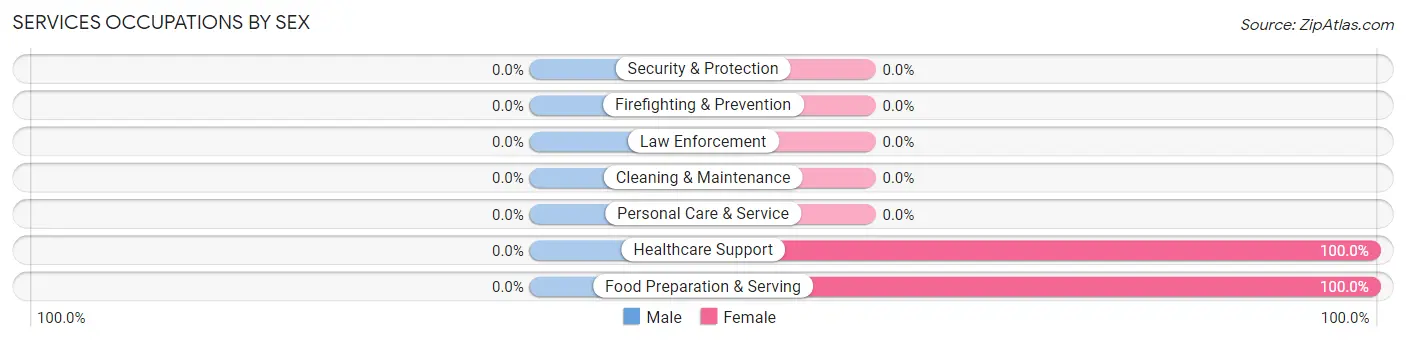
| Occupation | Male | Female |
| Healthcare Support | 0 (0.0%) | 9 (100.0%) |
| Security & Protection | 0 (0.0%) | 0 (0.0%) |
| Firefighting & Prevention | 0 (0.0%) | 0 (0.0%) |
| Law Enforcement | 0 (0.0%) | 0 (0.0%) |
| Food Preparation & Serving | 0 (0.0%) | 6 (100.0%) |
| Cleaning & Maintenance | 0 (0.0%) | 0 (0.0%) |
| Personal Care & Service | 0 (0.0%) | 0 (0.0%) |
| Total (Category) | 0 (0.0%) | 15 (100.0%) |
| Total (Overall) | 89 (51.4%) | 84 (48.5%) |
Sales and Office Occupations
The most common Sales and Office occupations in Blaine are Office & Administration (32 | 18.5%), and Sales & Related (5 | 2.9%).
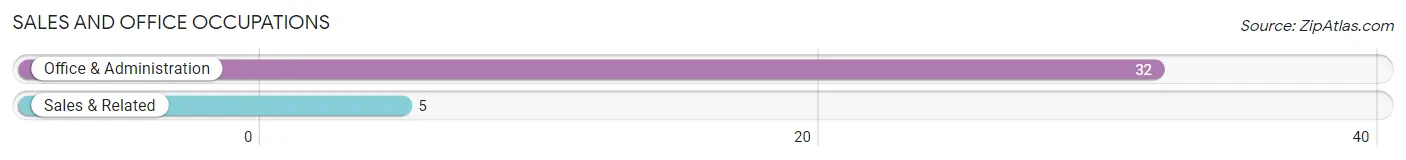
Sales and Office Occupations by Sex
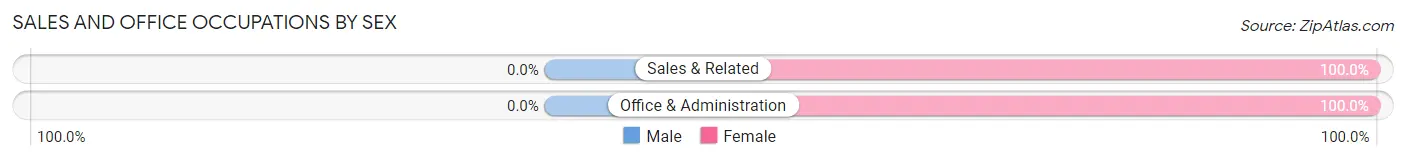
| Occupation | Male | Female |
| Sales & Related | 0 (0.0%) | 5 (100.0%) |
| Office & Administration | 0 (0.0%) | 32 (100.0%) |
| Total (Category) | 0 (0.0%) | 37 (100.0%) |
| Total (Overall) | 89 (51.4%) | 84 (48.5%) |
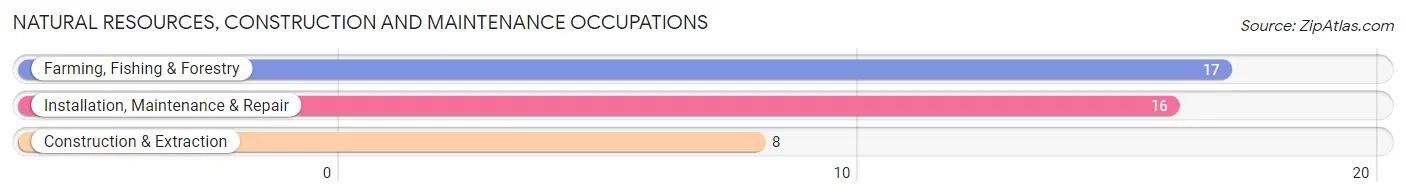
Natural Resources, Construction and Maintenance Occupations
The most common Natural Resources, Construction and Maintenance occupations in Blaine are Farming, Fishing & Forestry (17 | 9.8%), Installation, Maintenance & Repair (16 | 9.2%), and Construction & Extraction (8 | 4.6%).
Natural Resources, Construction and Maintenance Occupations by Sex
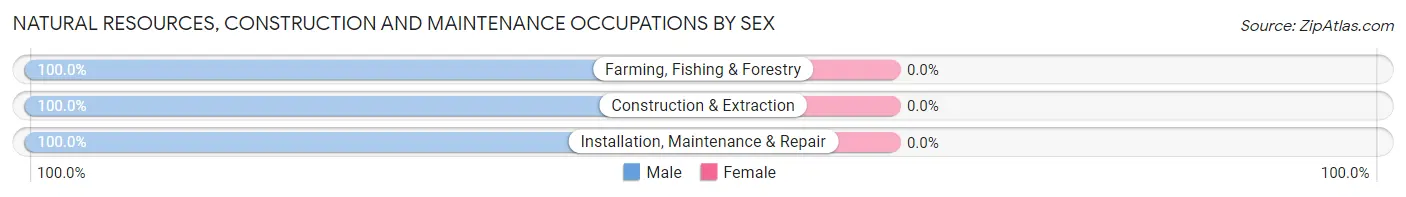
| Occupation | Male | Female |
| Farming, Fishing & Forestry | 17 (100.0%) | 0 (0.0%) |
| Construction & Extraction | 8 (100.0%) | 0 (0.0%) |
| Installation, Maintenance & Repair | 16 (100.0%) | 0 (0.0%) |
| Total (Category) | 41 (100.0%) | 0 (0.0%) |
| Total (Overall) | 89 (51.4%) | 84 (48.5%) |
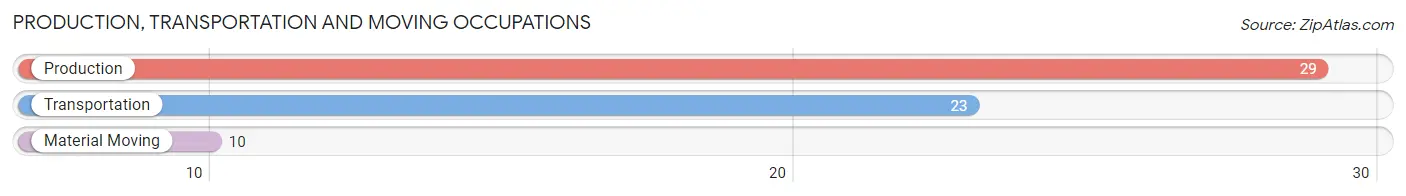
Production, Transportation and Moving Occupations
The most common Production, Transportation and Moving occupations in Blaine are Production (29 | 16.8%), Transportation (23 | 13.3%), and Material Moving (10 | 5.8%).
Production, Transportation and Moving Occupations by Sex
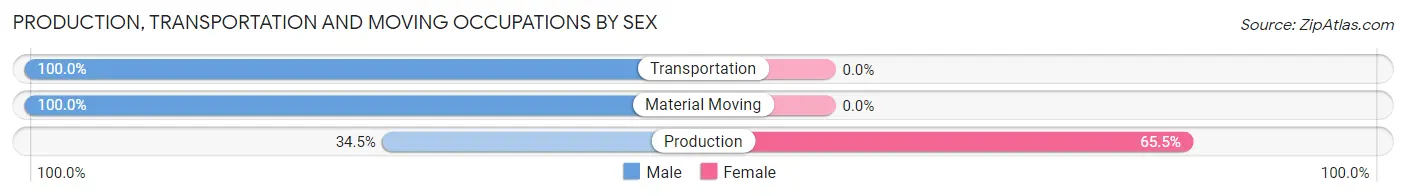
| Occupation | Male | Female |
| Production | 10 (34.5%) | 19 (65.5%) |
| Transportation | 23 (100.0%) | 0 (0.0%) |
| Material Moving | 10 (100.0%) | 0 (0.0%) |
| Total (Category) | 43 (69.4%) | 19 (30.6%) |
| Total (Overall) | 89 (51.4%) | 84 (48.5%) |
Employment Industries by Sex in Blaine
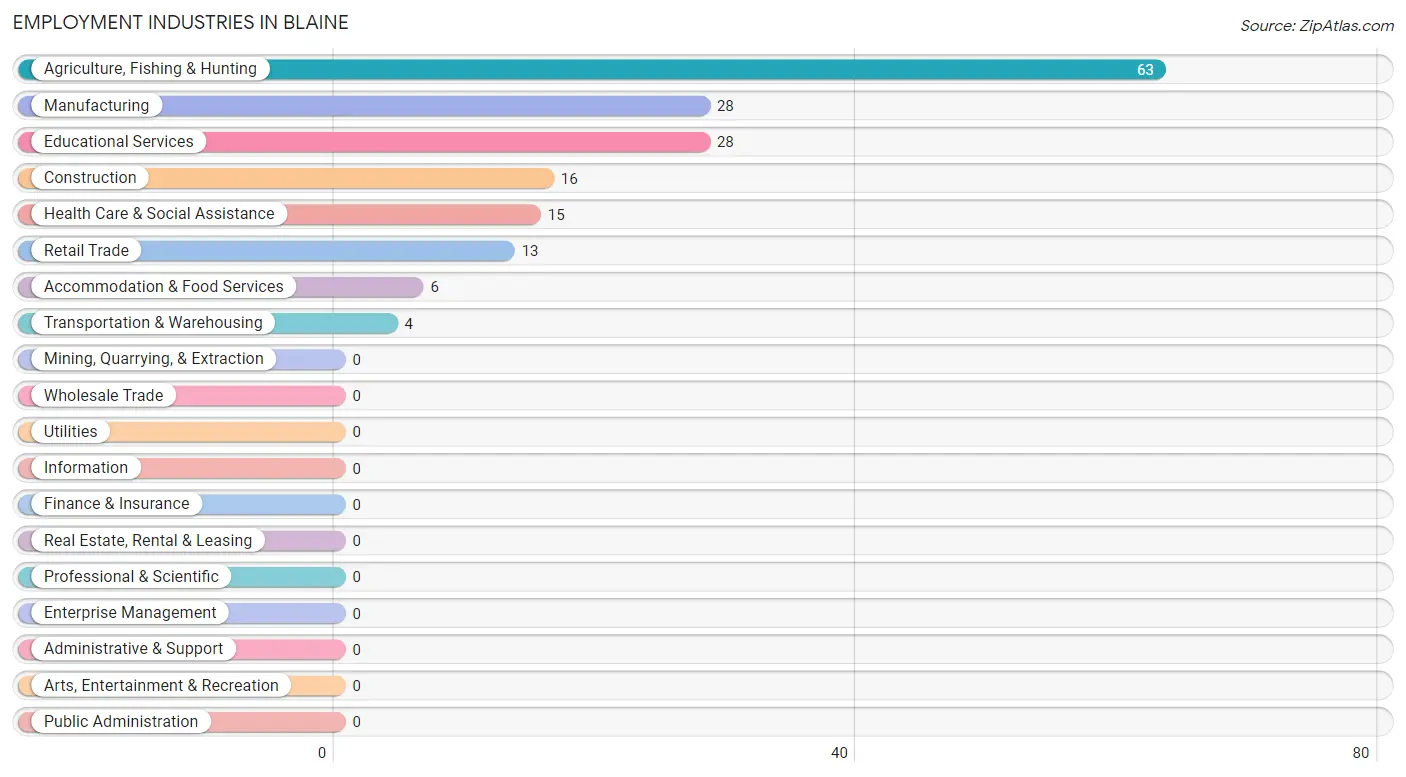
Employment Industries in Blaine
The major employment industries in Blaine include Agriculture, Fishing & Hunting (63 | 36.4%), Manufacturing (28 | 16.2%), Educational Services (28 | 16.2%), Construction (16 | 9.2%), and Health Care & Social Assistance (15 | 8.7%).
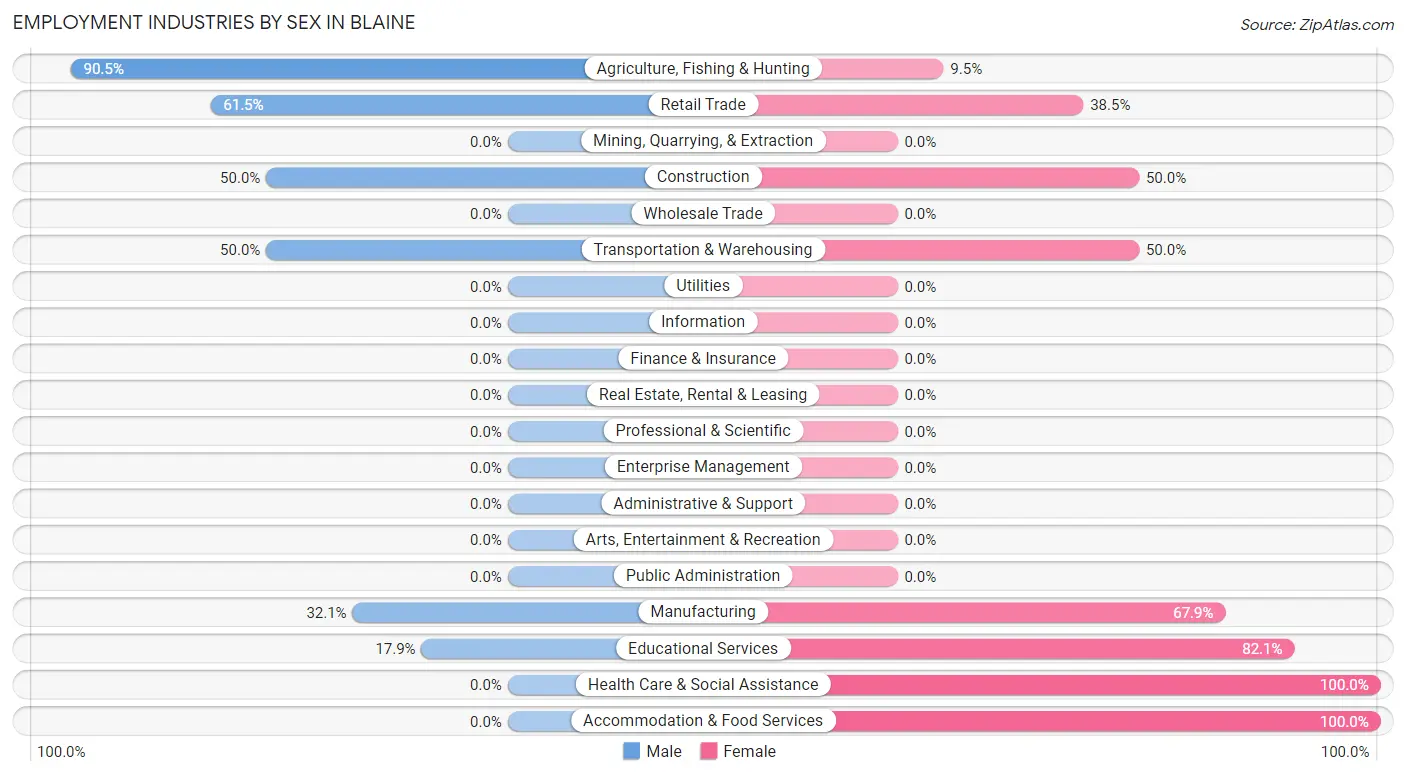
Employment Industries by Sex in Blaine
The Blaine industries that see more men than women are Agriculture, Fishing & Hunting (90.5%), Retail Trade (61.5%), and Construction (50.0%), whereas the industries that tend to have a higher number of women are Health Care & Social Assistance (100.0%), Accommodation & Food Services (100.0%), and Educational Services (82.1%).
| Industry | Male | Female |
| Agriculture, Fishing & Hunting | 57 (90.5%) | 6 (9.5%) |
| Mining, Quarrying, & Extraction | 0 (0.0%) | 0 (0.0%) |
| Construction | 8 (50.0%) | 8 (50.0%) |
| Manufacturing | 9 (32.1%) | 19 (67.9%) |
| Wholesale Trade | 0 (0.0%) | 0 (0.0%) |
| Retail Trade | 8 (61.5%) | 5 (38.5%) |
| Transportation & Warehousing | 2 (50.0%) | 2 (50.0%) |
| Utilities | 0 (0.0%) | 0 (0.0%) |
| Information | 0 (0.0%) | 0 (0.0%) |
| Finance & Insurance | 0 (0.0%) | 0 (0.0%) |
| Real Estate, Rental & Leasing | 0 (0.0%) | 0 (0.0%) |
| Professional & Scientific | 0 (0.0%) | 0 (0.0%) |
| Enterprise Management | 0 (0.0%) | 0 (0.0%) |
| Administrative & Support | 0 (0.0%) | 0 (0.0%) |
| Educational Services | 5 (17.9%) | 23 (82.1%) |
| Health Care & Social Assistance | 0 (0.0%) | 15 (100.0%) |
| Arts, Entertainment & Recreation | 0 (0.0%) | 0 (0.0%) |
| Accommodation & Food Services | 0 (0.0%) | 6 (100.0%) |
| Public Administration | 0 (0.0%) | 0 (0.0%) |
| Total | 89 (51.4%) | 84 (48.5%) |
Education in Blaine
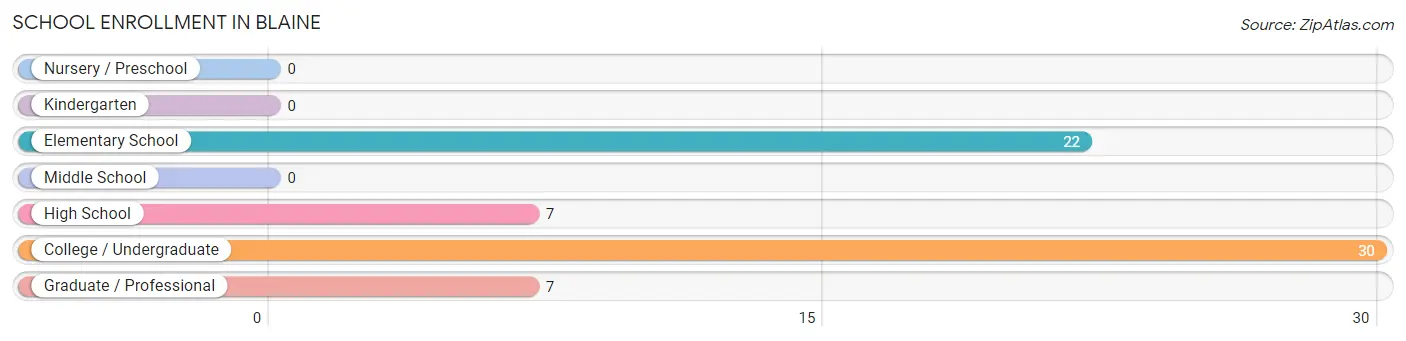
School Enrollment in Blaine
The most common levels of schooling among the 66 students in Blaine are college / undergraduate (30 | 45.5%), elementary school (22 | 33.3%), and high school (7 | 10.6%).
| School Level | # Students | % Students |
| Nursery / Preschool | 0 | 0.0% |
| Kindergarten | 0 | 0.0% |
| Elementary School | 22 | 33.3% |
| Middle School | 0 | 0.0% |
| High School | 7 | 10.6% |
| College / Undergraduate | 30 | 45.5% |
| Graduate / Professional | 7 | 10.6% |
| Total | 66 | 100.0% |
School Enrollment by Age by Funding Source in Blaine
Out of a total of 66 students who are enrolled in schools in Blaine, 31 (47.0%) attend a private institution, while the remaining 35 (53.0%) are enrolled in public schools. The age group of 18 to 19 year olds has the highest likelihood of being enrolled in private schools, with 8 (100.0% in the age bracket) enrolled. Conversely, the age group of 5 to 9 year old has the lowest likelihood of being enrolled in a private school, with 15 (100.0% in the age bracket) attending a public institution.
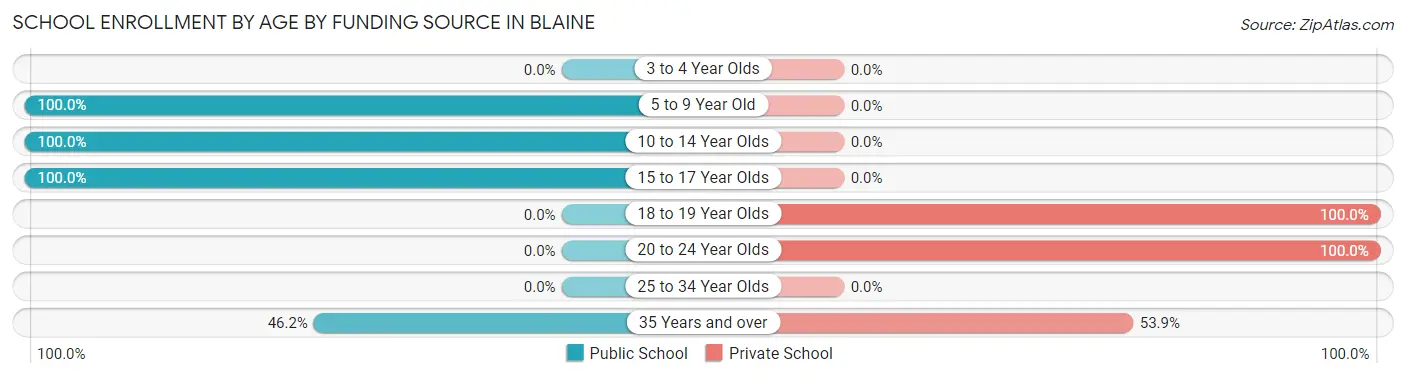
| Age Bracket | Public School | Private School |
| 3 to 4 Year Olds | 0 (0.0%) | 0 (0.0%) |
| 5 to 9 Year Old | 15 (100.0%) | 0 (0.0%) |
| 10 to 14 Year Olds | 7 (100.0%) | 0 (0.0%) |
| 15 to 17 Year Olds | 7 (100.0%) | 0 (0.0%) |
| 18 to 19 Year Olds | 0 (0.0%) | 8 (100.0%) |
| 20 to 24 Year Olds | 0 (0.0%) | 16 (100.0%) |
| 25 to 34 Year Olds | 0 (0.0%) | 0 (0.0%) |
| 35 Years and over | 6 (46.2%) | 7 (53.8%) |
| Total | 35 (53.0%) | 31 (47.0%) |
Educational Attainment by Field of Study in Blaine
Business (11 | 45.8%), education (7 | 29.2%), and social sciences (6 | 25.0%) are the most common fields of study among 24 individuals in Blaine who have obtained a bachelor's degree or higher.
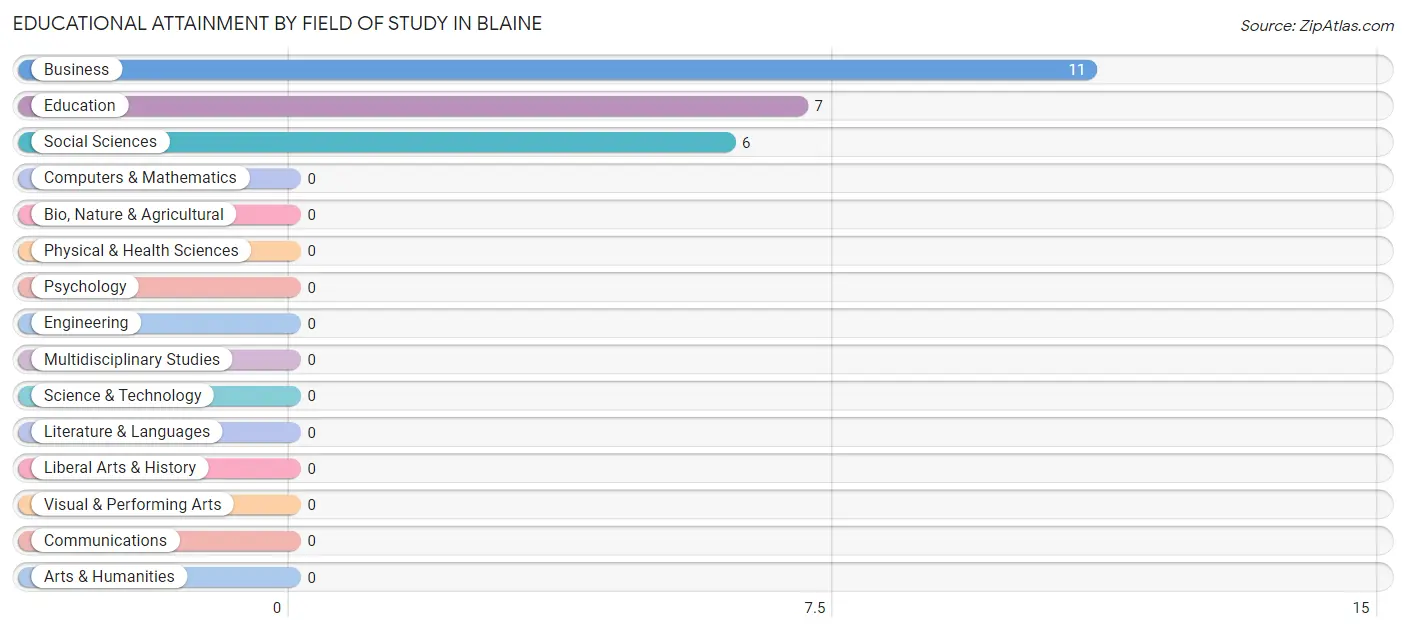
| Field of Study | # Graduates | % Graduates |
| Computers & Mathematics | 0 | 0.0% |
| Bio, Nature & Agricultural | 0 | 0.0% |
| Physical & Health Sciences | 0 | 0.0% |
| Psychology | 0 | 0.0% |
| Social Sciences | 6 | 25.0% |
| Engineering | 0 | 0.0% |
| Multidisciplinary Studies | 0 | 0.0% |
| Science & Technology | 0 | 0.0% |
| Business | 11 | 45.8% |
| Education | 7 | 29.2% |
| Literature & Languages | 0 | 0.0% |
| Liberal Arts & History | 0 | 0.0% |
| Visual & Performing Arts | 0 | 0.0% |
| Communications | 0 | 0.0% |
| Arts & Humanities | 0 | 0.0% |
| Total | 24 | 100.0% |
Transportation & Commute in Blaine
Vehicle Availability by Sex in Blaine
The most prevalent vehicle ownership categories in Blaine are males with 4 vehicles (40, accounting for 44.9%) and females with 4 vehicles (41, making up 64.5%).
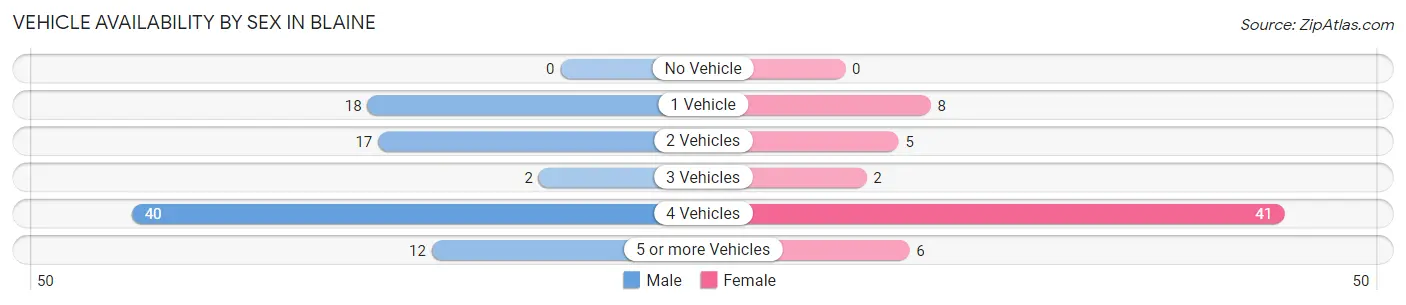
| Vehicles Available | Male | Female |
| No Vehicle | 0 (0.0%) | 0 (0.0%) |
| 1 Vehicle | 18 (20.2%) | 8 (12.9%) |
| 2 Vehicles | 17 (19.1%) | 5 (8.1%) |
| 3 Vehicles | 2 (2.2%) | 2 (3.2%) |
| 4 Vehicles | 40 (44.9%) | 41 (66.1%) |
| 5 or more Vehicles | 12 (13.5%) | 6 (9.7%) |
| Total | 89 (100.0%) | 62 (100.0%) |
Commute Time in Blaine
The most frequently occuring commute durations in Blaine are 5 to 9 minutes (40 commuters, 26.5%), 30 to 34 minutes (32 commuters, 21.2%), and 15 to 19 minutes (23 commuters, 15.2%).
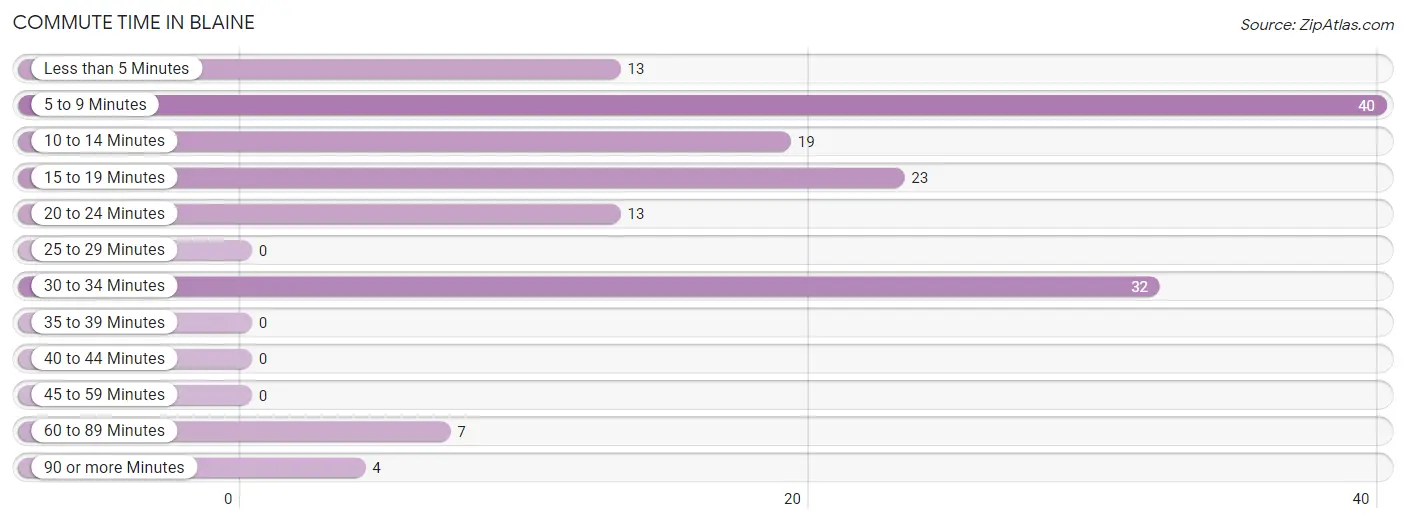
| Commute Time | # Commuters | % Commuters |
| Less than 5 Minutes | 13 | 8.6% |
| 5 to 9 Minutes | 40 | 26.5% |
| 10 to 14 Minutes | 19 | 12.6% |
| 15 to 19 Minutes | 23 | 15.2% |
| 20 to 24 Minutes | 13 | 8.6% |
| 25 to 29 Minutes | 0 | 0.0% |
| 30 to 34 Minutes | 32 | 21.2% |
| 35 to 39 Minutes | 0 | 0.0% |
| 40 to 44 Minutes | 0 | 0.0% |
| 45 to 59 Minutes | 0 | 0.0% |
| 60 to 89 Minutes | 7 | 4.6% |
| 90 or more Minutes | 4 | 2.6% |
Commute Time by Sex in Blaine
The most common commute times in Blaine are 5 to 9 minutes (27 commuters, 30.3%) for males and 10 to 14 minutes (19 commuters, 30.6%) for females.
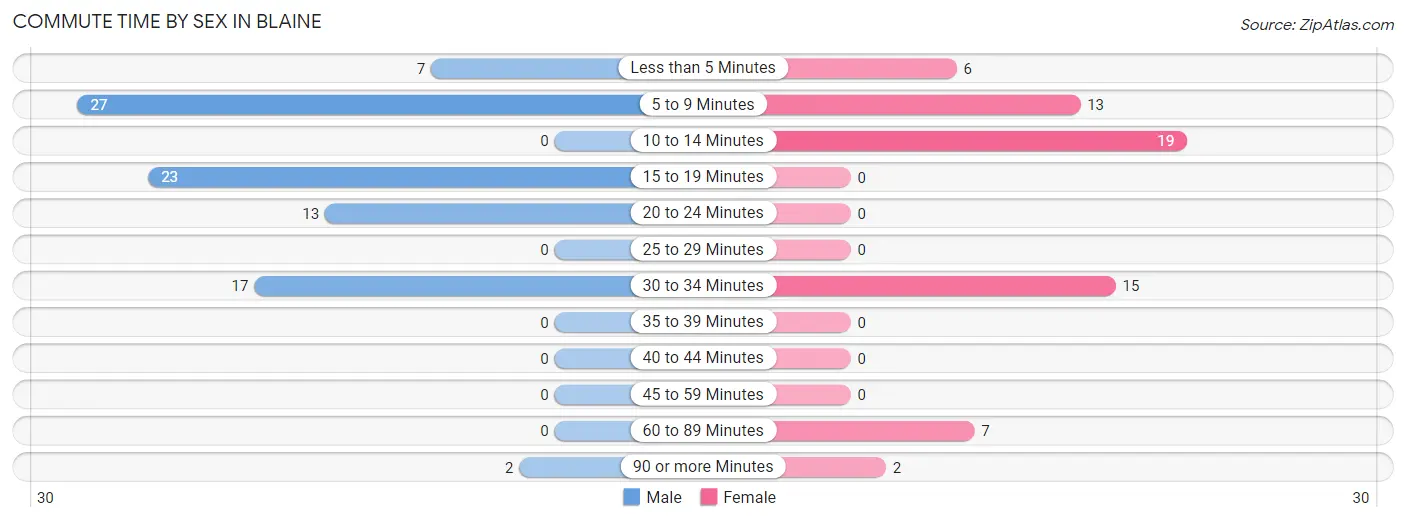
| Commute Time | Male | Female |
| Less than 5 Minutes | 7 (7.9%) | 6 (9.7%) |
| 5 to 9 Minutes | 27 (30.3%) | 13 (21.0%) |
| 10 to 14 Minutes | 0 (0.0%) | 19 (30.6%) |
| 15 to 19 Minutes | 23 (25.8%) | 0 (0.0%) |
| 20 to 24 Minutes | 13 (14.6%) | 0 (0.0%) |
| 25 to 29 Minutes | 0 (0.0%) | 0 (0.0%) |
| 30 to 34 Minutes | 17 (19.1%) | 15 (24.2%) |
| 35 to 39 Minutes | 0 (0.0%) | 0 (0.0%) |
| 40 to 44 Minutes | 0 (0.0%) | 0 (0.0%) |
| 45 to 59 Minutes | 0 (0.0%) | 0 (0.0%) |
| 60 to 89 Minutes | 0 (0.0%) | 7 (11.3%) |
| 90 or more Minutes | 2 (2.2%) | 2 (3.2%) |
Time of Departure to Work by Sex in Blaine
The most frequent times of departure to work in Blaine are 8:00 AM to 8:29 AM (31, 34.8%) for males and 8:00 AM to 8:29 AM (19, 30.6%) for females.
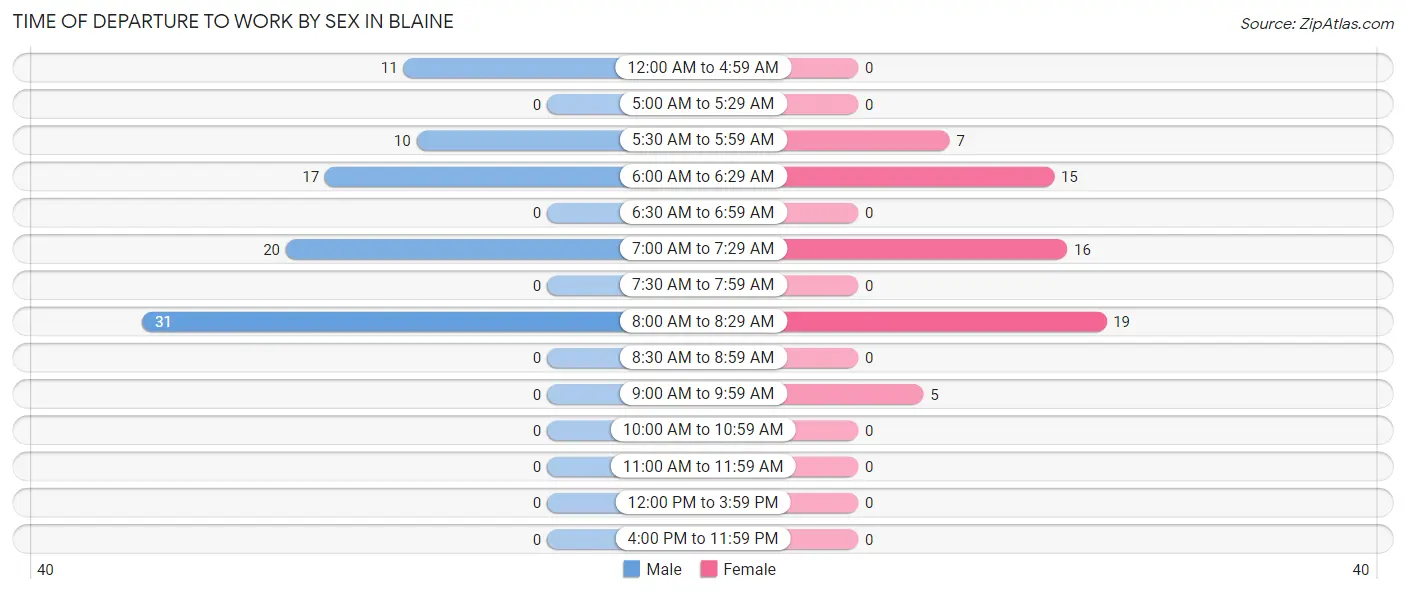
| Time of Departure | Male | Female |
| 12:00 AM to 4:59 AM | 11 (12.4%) | 0 (0.0%) |
| 5:00 AM to 5:29 AM | 0 (0.0%) | 0 (0.0%) |
| 5:30 AM to 5:59 AM | 10 (11.2%) | 7 (11.3%) |
| 6:00 AM to 6:29 AM | 17 (19.1%) | 15 (24.2%) |
| 6:30 AM to 6:59 AM | 0 (0.0%) | 0 (0.0%) |
| 7:00 AM to 7:29 AM | 20 (22.5%) | 16 (25.8%) |
| 7:30 AM to 7:59 AM | 0 (0.0%) | 0 (0.0%) |
| 8:00 AM to 8:29 AM | 31 (34.8%) | 19 (30.6%) |
| 8:30 AM to 8:59 AM | 0 (0.0%) | 0 (0.0%) |
| 9:00 AM to 9:59 AM | 0 (0.0%) | 5 (8.1%) |
| 10:00 AM to 10:59 AM | 0 (0.0%) | 0 (0.0%) |
| 11:00 AM to 11:59 AM | 0 (0.0%) | 0 (0.0%) |
| 12:00 PM to 3:59 PM | 0 (0.0%) | 0 (0.0%) |
| 4:00 PM to 11:59 PM | 0 (0.0%) | 0 (0.0%) |
| Total | 89 (100.0%) | 62 (100.0%) |
Housing Occupancy in Blaine
Occupancy by Ownership in Blaine
Of the total 105 dwellings in Blaine, owner-occupied units account for 90 (85.7%), while renter-occupied units make up 15 (14.3%).
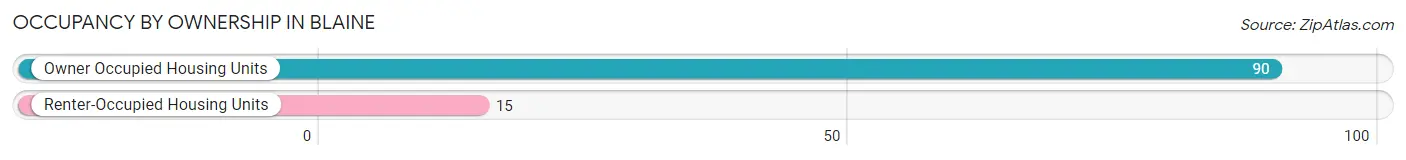
| Occupancy | # Housing Units | % Housing Units |
| Owner Occupied Housing Units | 90 | 85.7% |
| Renter-Occupied Housing Units | 15 | 14.3% |
| Total Occupied Housing Units | 105 | 100.0% |
Occupancy by Household Size in Blaine
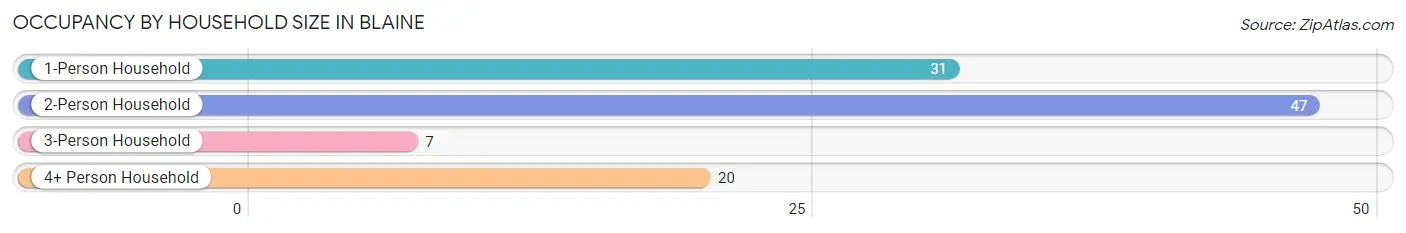
| Household Size | # Housing Units | % Housing Units |
| 1-Person Household | 31 | 29.5% |
| 2-Person Household | 47 | 44.8% |
| 3-Person Household | 7 | 6.7% |
| 4+ Person Household | 20 | 19.1% |
| Total Housing Units | 105 | 100.0% |
Occupancy by Ownership by Household Size in Blaine
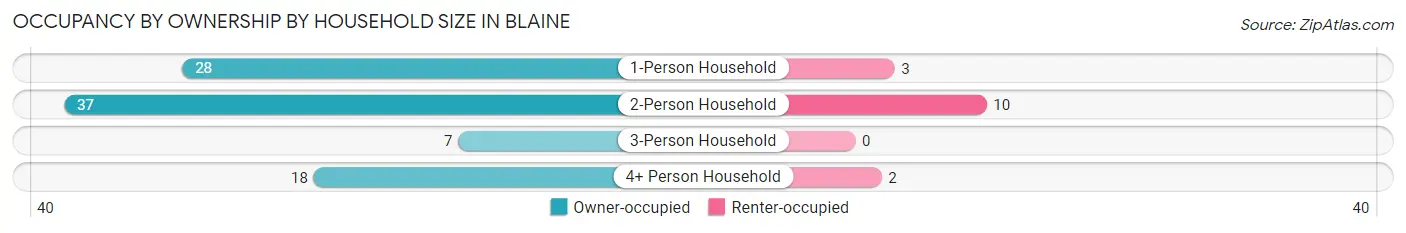
| Household Size | Owner-occupied | Renter-occupied |
| 1-Person Household | 28 (90.3%) | 3 (9.7%) |
| 2-Person Household | 37 (78.7%) | 10 (21.3%) |
| 3-Person Household | 7 (100.0%) | 0 (0.0%) |
| 4+ Person Household | 18 (90.0%) | 2 (10.0%) |
| Total Housing Units | 90 (85.7%) | 15 (14.3%) |
Occupancy by Educational Attainment in Blaine
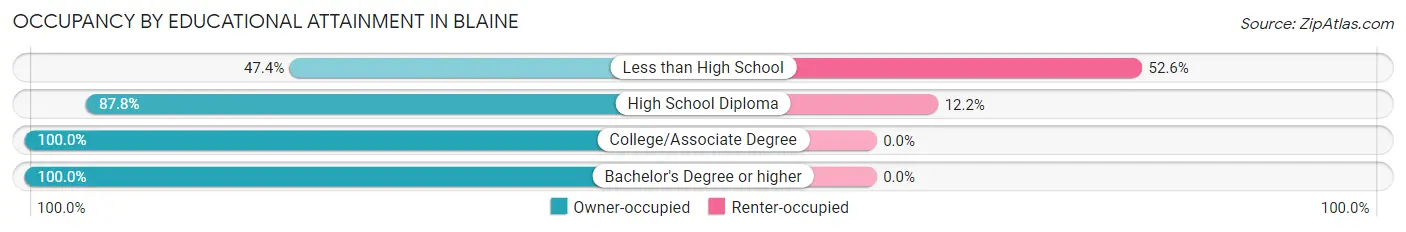
| Household Size | Owner-occupied | Renter-occupied |
| Less than High School | 9 (47.4%) | 10 (52.6%) |
| High School Diploma | 36 (87.8%) | 5 (12.2%) |
| College/Associate Degree | 27 (100.0%) | 0 (0.0%) |
| Bachelor's Degree or higher | 18 (100.0%) | 0 (0.0%) |
Occupancy by Age of Householder in Blaine
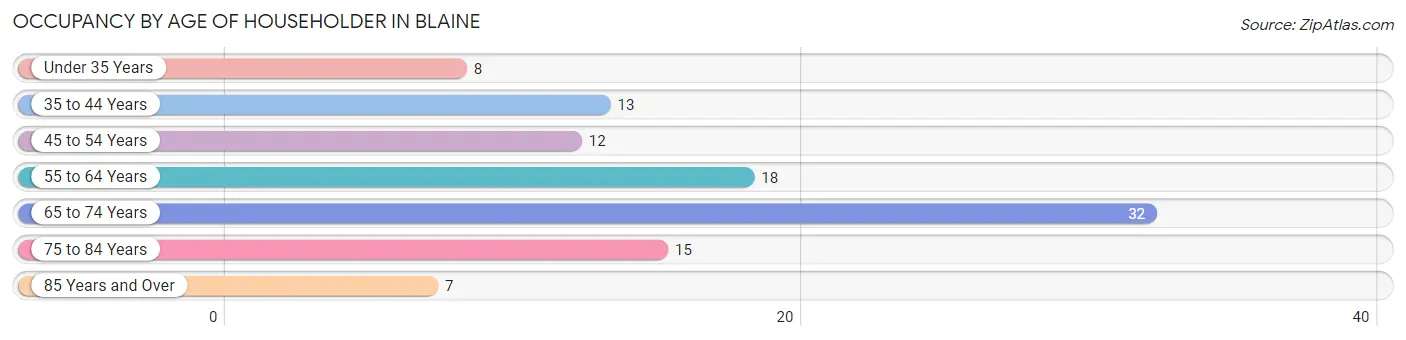
| Age Bracket | # Households | % Households |
| Under 35 Years | 8 | 7.6% |
| 35 to 44 Years | 13 | 12.4% |
| 45 to 54 Years | 12 | 11.4% |
| 55 to 64 Years | 18 | 17.1% |
| 65 to 74 Years | 32 | 30.5% |
| 75 to 84 Years | 15 | 14.3% |
| 85 Years and Over | 7 | 6.7% |
| Total | 105 | 100.0% |
Housing Finances in Blaine
Median Income by Occupancy in Blaine
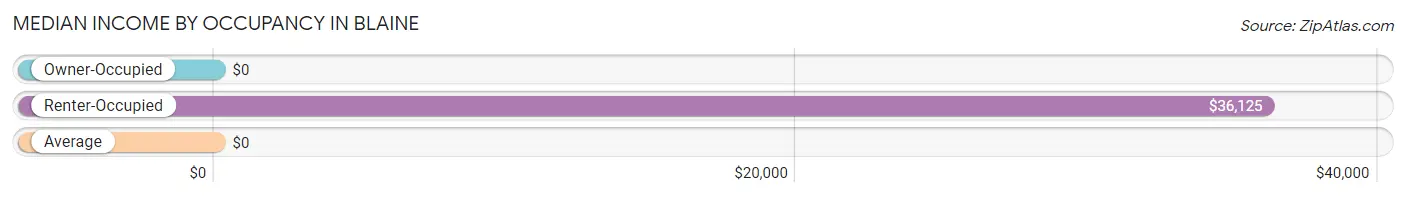
| Occupancy Type | # Households | Median Income |
| Owner-Occupied | 90 (85.7%) | $0 |
| Renter-Occupied | 15 (14.3%) | $36,125 |
| Average | 105 (100.0%) | $0 |
Occupancy by Householder Income Bracket in Blaine
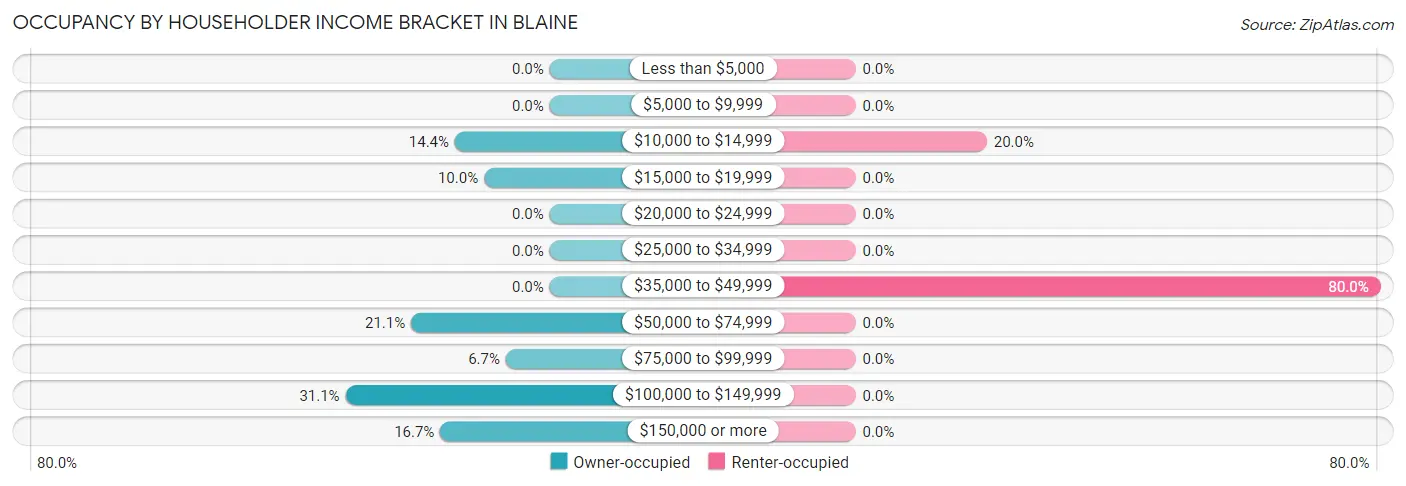
| Income Bracket | Owner-occupied | Renter-occupied |
| Less than $5,000 | 0 (0.0%) | 0 (0.0%) |
| $5,000 to $9,999 | 0 (0.0%) | 0 (0.0%) |
| $10,000 to $14,999 | 13 (14.4%) | 3 (20.0%) |
| $15,000 to $19,999 | 9 (10.0%) | 0 (0.0%) |
| $20,000 to $24,999 | 0 (0.0%) | 0 (0.0%) |
| $25,000 to $34,999 | 0 (0.0%) | 0 (0.0%) |
| $35,000 to $49,999 | 0 (0.0%) | 12 (80.0%) |
| $50,000 to $74,999 | 19 (21.1%) | 0 (0.0%) |
| $75,000 to $99,999 | 6 (6.7%) | 0 (0.0%) |
| $100,000 to $149,999 | 28 (31.1%) | 0 (0.0%) |
| $150,000 or more | 15 (16.7%) | 0 (0.0%) |
| Total | 90 (100.0%) | 15 (100.0%) |
Monthly Housing Cost Tiers in Blaine
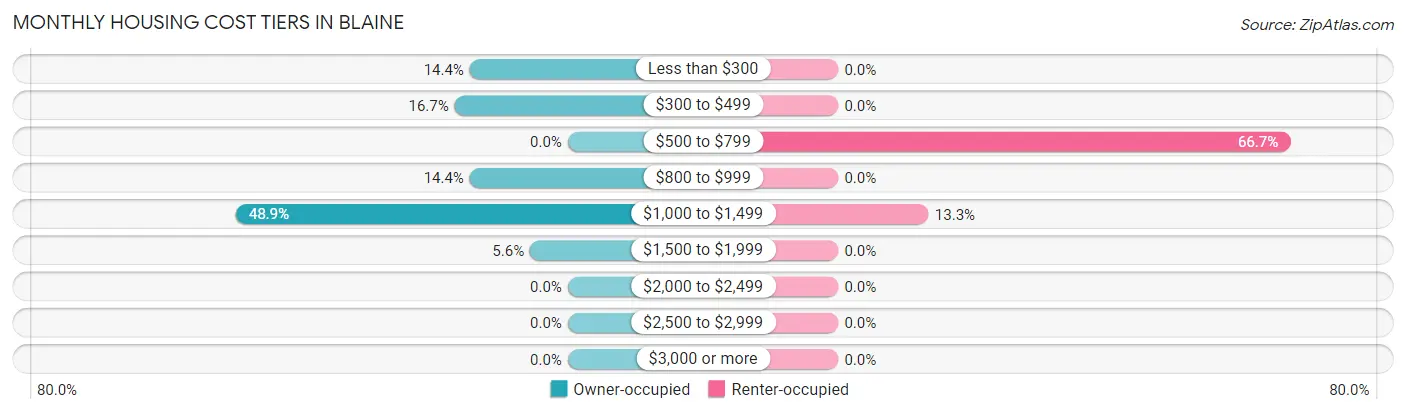
| Monthly Cost | Owner-occupied | Renter-occupied |
| Less than $300 | 13 (14.4%) | 0 (0.0%) |
| $300 to $499 | 15 (16.7%) | 0 (0.0%) |
| $500 to $799 | 0 (0.0%) | 10 (66.7%) |
| $800 to $999 | 13 (14.4%) | 0 (0.0%) |
| $1,000 to $1,499 | 44 (48.9%) | 2 (13.3%) |
| $1,500 to $1,999 | 5 (5.6%) | 0 (0.0%) |
| $2,000 to $2,499 | 0 (0.0%) | 0 (0.0%) |
| $2,500 to $2,999 | 0 (0.0%) | 0 (0.0%) |
| $3,000 or more | 0 (0.0%) | 0 (0.0%) |
| Total | 90 (100.0%) | 15 (100.0%) |
Physical Housing Characteristics in Blaine
Housing Structures in Blaine
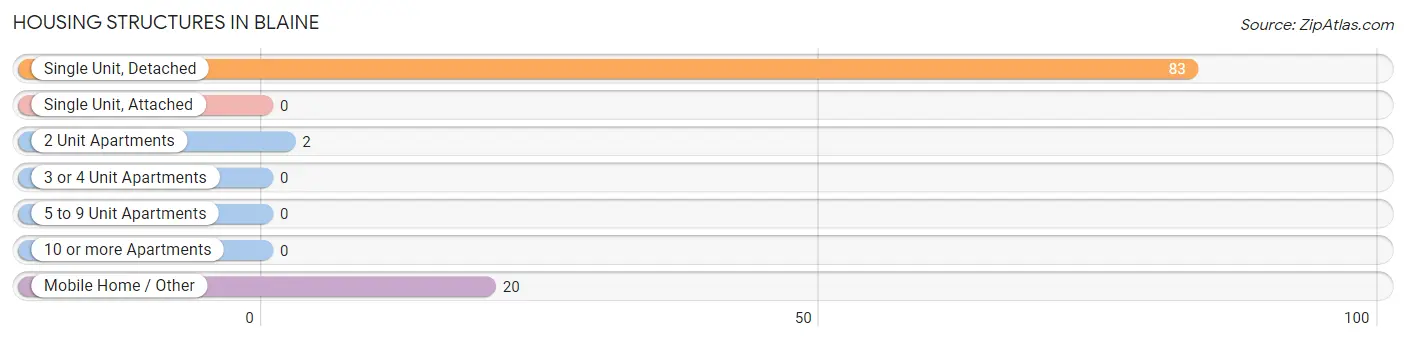
| Structure Type | # Housing Units | % Housing Units |
| Single Unit, Detached | 83 | 79.0% |
| Single Unit, Attached | 0 | 0.0% |
| 2 Unit Apartments | 2 | 1.9% |
| 3 or 4 Unit Apartments | 0 | 0.0% |
| 5 to 9 Unit Apartments | 0 | 0.0% |
| 10 or more Apartments | 0 | 0.0% |
| Mobile Home / Other | 20 | 19.1% |
| Total | 105 | 100.0% |
Housing Structures by Occupancy in Blaine
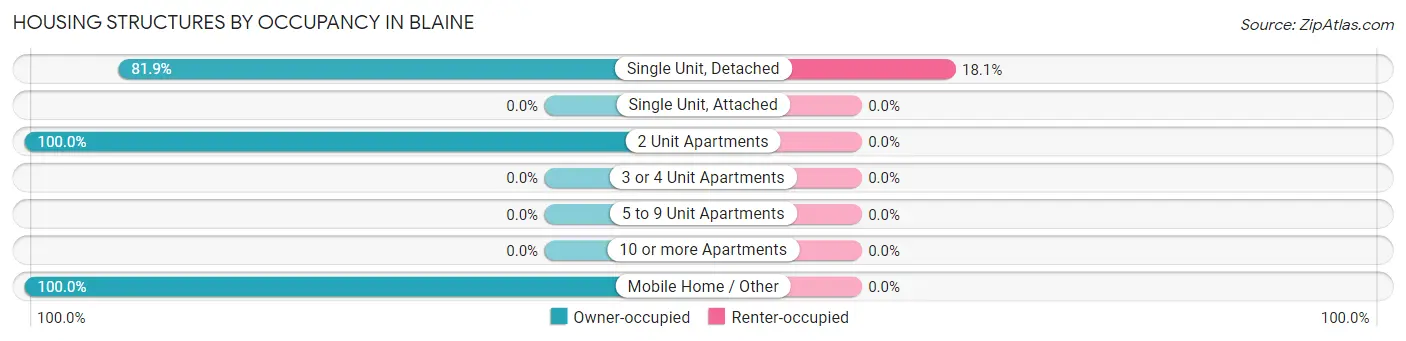
| Structure Type | Owner-occupied | Renter-occupied |
| Single Unit, Detached | 68 (81.9%) | 15 (18.1%) |
| Single Unit, Attached | 0 (0.0%) | 0 (0.0%) |
| 2 Unit Apartments | 2 (100.0%) | 0 (0.0%) |
| 3 or 4 Unit Apartments | 0 (0.0%) | 0 (0.0%) |
| 5 to 9 Unit Apartments | 0 (0.0%) | 0 (0.0%) |
| 10 or more Apartments | 0 (0.0%) | 0 (0.0%) |
| Mobile Home / Other | 20 (100.0%) | 0 (0.0%) |
| Total | 90 (85.7%) | 15 (14.3%) |
Housing Structures by Number of Rooms in Blaine
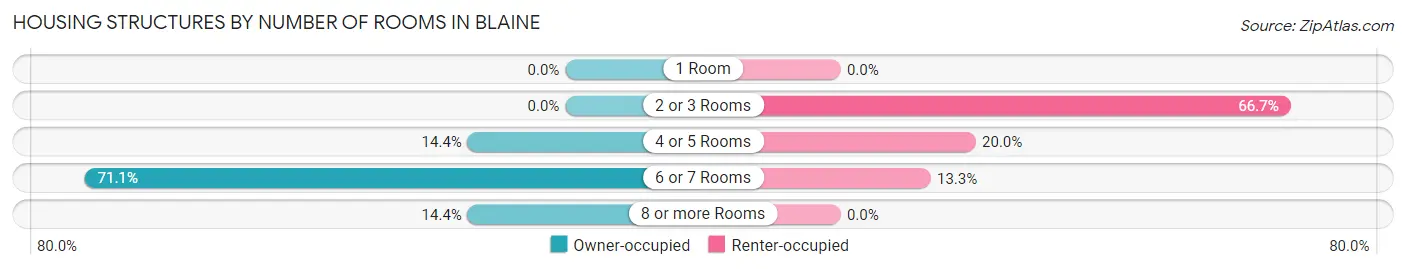
| Number of Rooms | Owner-occupied | Renter-occupied |
| 1 Room | 0 (0.0%) | 0 (0.0%) |
| 2 or 3 Rooms | 0 (0.0%) | 10 (66.7%) |
| 4 or 5 Rooms | 13 (14.4%) | 3 (20.0%) |
| 6 or 7 Rooms | 64 (71.1%) | 2 (13.3%) |
| 8 or more Rooms | 13 (14.4%) | 0 (0.0%) |
| Total | 90 (100.0%) | 15 (100.0%) |
Housing Structure by Heating Type in Blaine
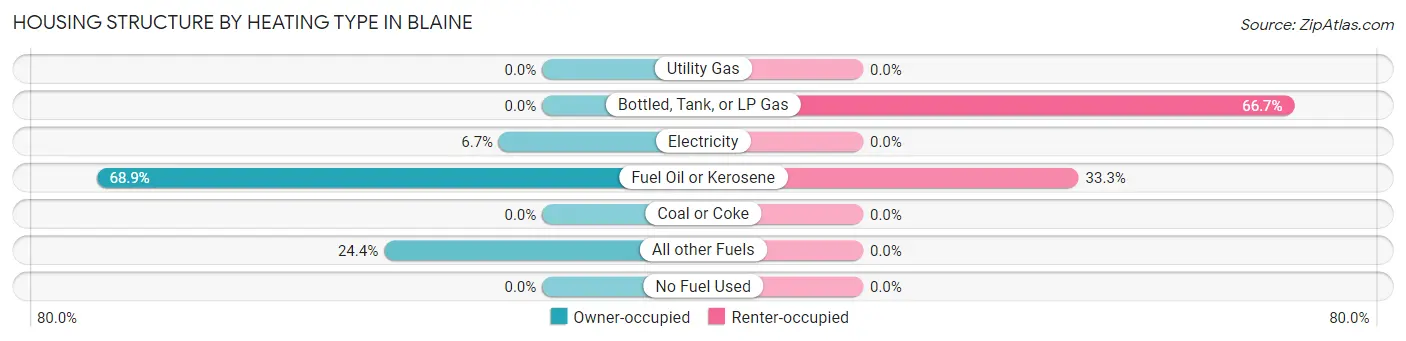
| Heating Type | Owner-occupied | Renter-occupied |
| Utility Gas | 0 (0.0%) | 0 (0.0%) |
| Bottled, Tank, or LP Gas | 0 (0.0%) | 10 (66.7%) |
| Electricity | 6 (6.7%) | 0 (0.0%) |
| Fuel Oil or Kerosene | 62 (68.9%) | 5 (33.3%) |
| Coal or Coke | 0 (0.0%) | 0 (0.0%) |
| All other Fuels | 22 (24.4%) | 0 (0.0%) |
| No Fuel Used | 0 (0.0%) | 0 (0.0%) |
| Total | 90 (100.0%) | 15 (100.0%) |
Household Vehicle Usage in Blaine
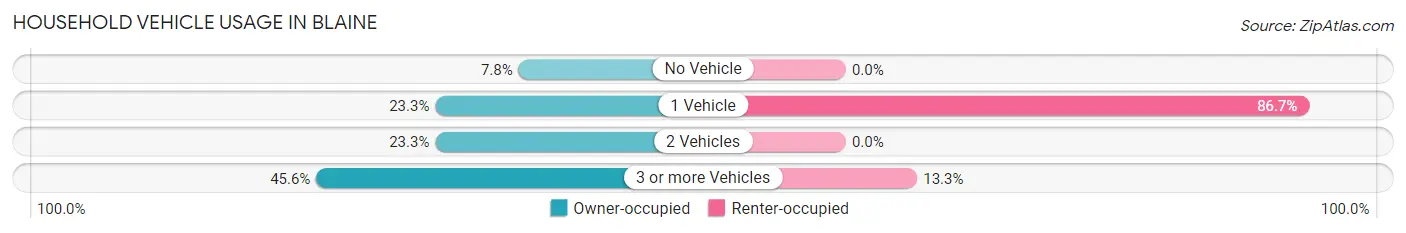
| Vehicles per Household | Owner-occupied | Renter-occupied |
| No Vehicle | 7 (7.8%) | 0 (0.0%) |
| 1 Vehicle | 21 (23.3%) | 13 (86.7%) |
| 2 Vehicles | 21 (23.3%) | 0 (0.0%) |
| 3 or more Vehicles | 41 (45.6%) | 2 (13.3%) |
| Total | 90 (100.0%) | 15 (100.0%) |
Real Estate & Mortgages in Blaine
Real Estate and Mortgage Overview in Blaine
| Characteristic | Without Mortgage | With Mortgage |
| Housing Units | 36 | 54 |
| Median Property Value | - | - |
| Median Household Income | $63,571 | $7 |
| Monthly Housing Costs | $423 | $0 |
| Real Estate Taxes | - | - |
Property Value by Mortgage Status in Blaine
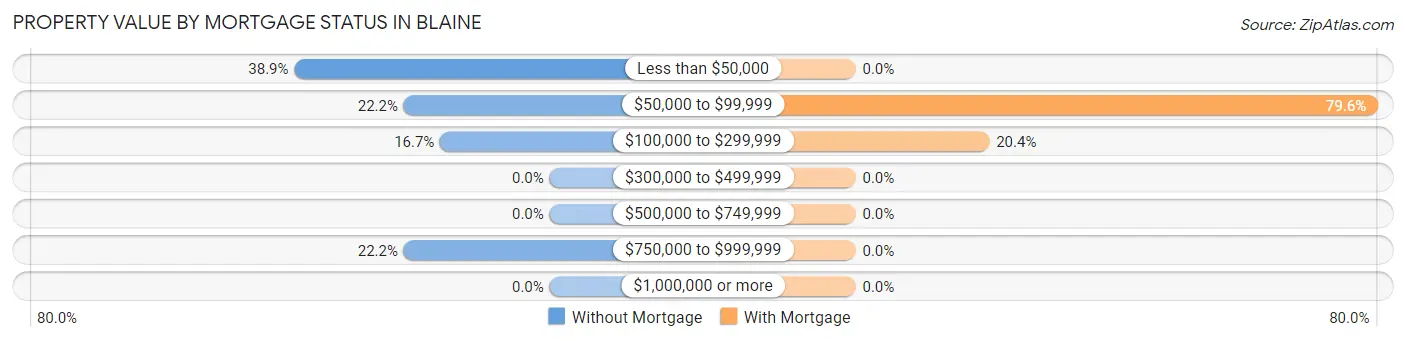
| Property Value | Without Mortgage | With Mortgage |
| Less than $50,000 | 14 (38.9%) | 0 (0.0%) |
| $50,000 to $99,999 | 8 (22.2%) | 43 (79.6%) |
| $100,000 to $299,999 | 6 (16.7%) | 11 (20.4%) |
| $300,000 to $499,999 | 0 (0.0%) | 0 (0.0%) |
| $500,000 to $749,999 | 0 (0.0%) | 0 (0.0%) |
| $750,000 to $999,999 | 8 (22.2%) | 0 (0.0%) |
| $1,000,000 or more | 0 (0.0%) | 0 (0.0%) |
| Total | 36 (100.0%) | 54 (100.0%) |
Household Income by Mortgage Status in Blaine
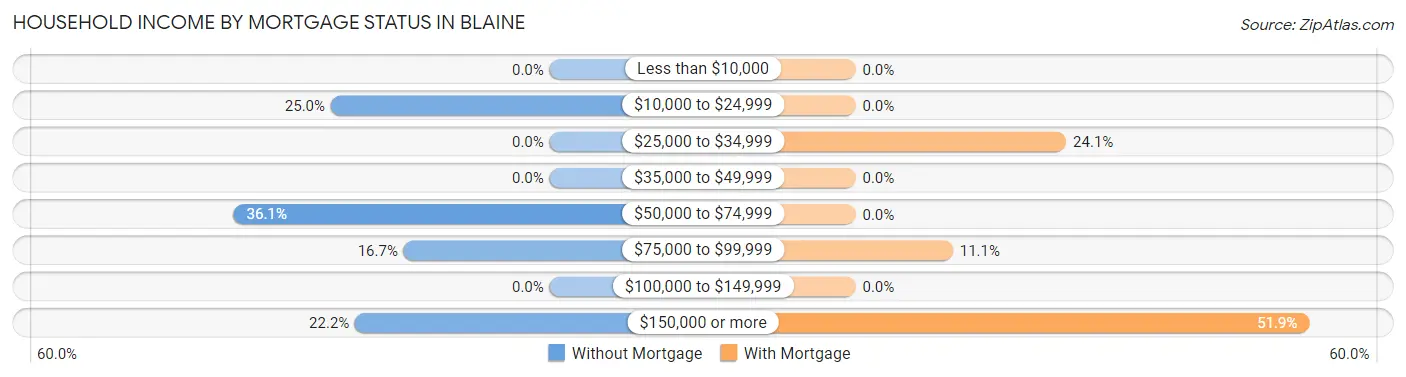
| Household Income | Without Mortgage | With Mortgage |
| Less than $10,000 | 0 (0.0%) | 0 (0.0%) |
| $10,000 to $24,999 | 9 (25.0%) | 0 (0.0%) |
| $25,000 to $34,999 | 0 (0.0%) | 13 (24.1%) |
| $35,000 to $49,999 | 0 (0.0%) | 0 (0.0%) |
| $50,000 to $74,999 | 13 (36.1%) | 0 (0.0%) |
| $75,000 to $99,999 | 6 (16.7%) | 6 (11.1%) |
| $100,000 to $149,999 | 0 (0.0%) | 0 (0.0%) |
| $150,000 or more | 8 (22.2%) | 28 (51.8%) |
| Total | 36 (100.0%) | 54 (100.0%) |
Property Value to Household Income Ratio in Blaine
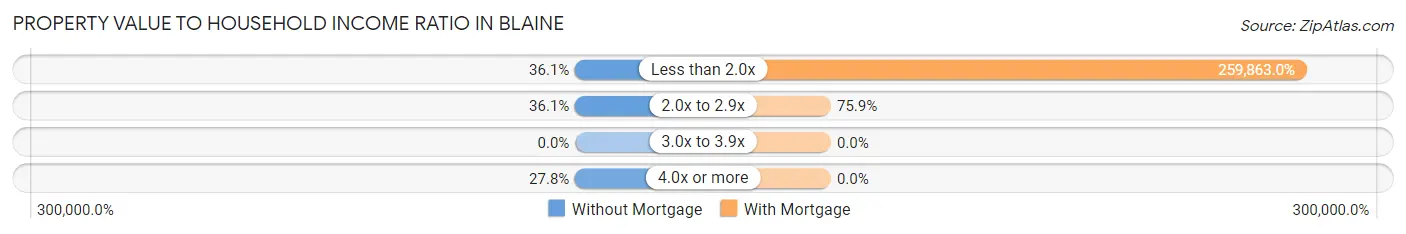
| Value-to-Income Ratio | Without Mortgage | With Mortgage |
| Less than 2.0x | 13 (36.1%) | 140,326 (259,863.0%) |
| 2.0x to 2.9x | 13 (36.1%) | 41 (75.9%) |
| 3.0x to 3.9x | 0 (0.0%) | 0 (0.0%) |
| 4.0x or more | 10 (27.8%) | 0 (0.0%) |
| Total | 36 (100.0%) | 54 (100.0%) |
Real Estate Taxes by Mortgage Status in Blaine
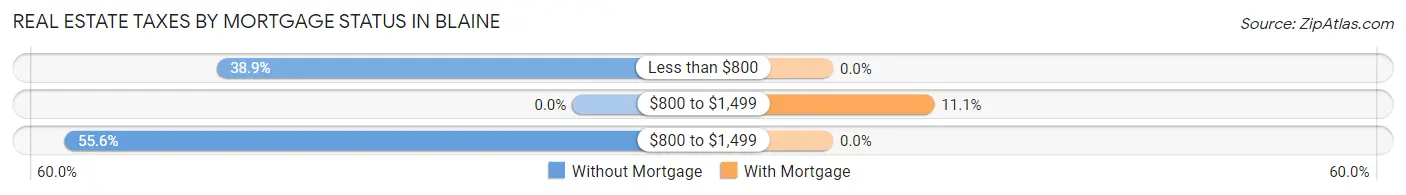
| Property Taxes | Without Mortgage | With Mortgage |
| Less than $800 | 14 (38.9%) | 0 (0.0%) |
| $800 to $1,499 | 0 (0.0%) | 6 (11.1%) |
| $800 to $1,499 | 20 (55.6%) | 0 (0.0%) |
| Total | 36 (100.0%) | 54 (100.0%) |
Health & Disability in Blaine
Health Insurance Coverage by Age in Blaine
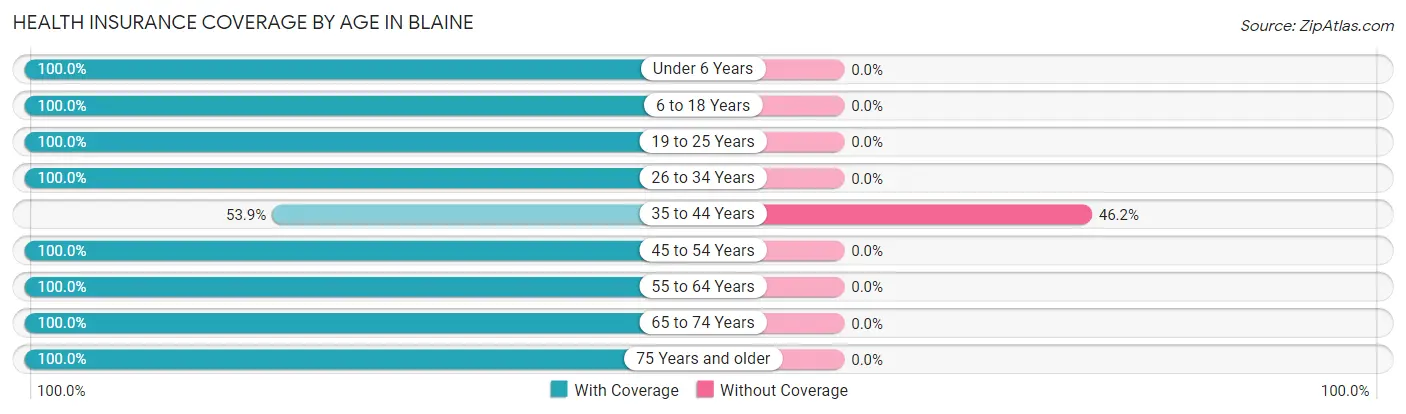
| Age Bracket | With Coverage | Without Coverage |
| Under 6 Years | 2 (100.0%) | 0 (0.0%) |
| 6 to 18 Years | 29 (100.0%) | 0 (0.0%) |
| 19 to 25 Years | 33 (100.0%) | 0 (0.0%) |
| 26 to 34 Years | 28 (100.0%) | 0 (0.0%) |
| 35 to 44 Years | 7 (53.8%) | 6 (46.2%) |
| 45 to 54 Years | 32 (100.0%) | 0 (0.0%) |
| 55 to 64 Years | 37 (100.0%) | 0 (0.0%) |
| 65 to 74 Years | 58 (100.0%) | 0 (0.0%) |
| 75 Years and older | 22 (100.0%) | 0 (0.0%) |
| Total | 248 (97.6%) | 6 (2.4%) |
Health Insurance Coverage by Citizenship Status in Blaine
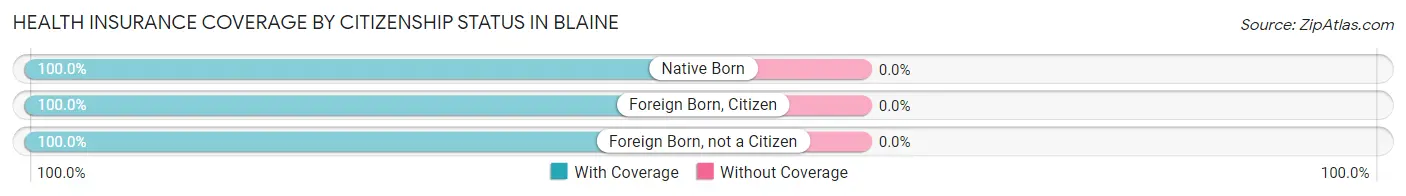
| Citizenship Status | With Coverage | Without Coverage |
| Native Born | 2 (100.0%) | 0 (0.0%) |
| Foreign Born, Citizen | 29 (100.0%) | 0 (0.0%) |
| Foreign Born, not a Citizen | 33 (100.0%) | 0 (0.0%) |
Health Insurance Coverage by Household Income in Blaine
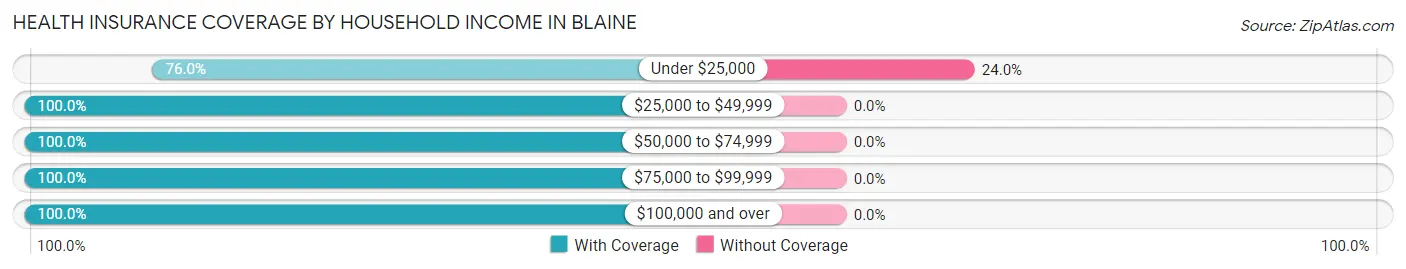
| Household Income | With Coverage | Without Coverage |
| Under $25,000 | 19 (76.0%) | 6 (24.0%) |
| $25,000 to $49,999 | 29 (100.0%) | 0 (0.0%) |
| $50,000 to $74,999 | 62 (100.0%) | 0 (0.0%) |
| $75,000 to $99,999 | 13 (100.0%) | 0 (0.0%) |
| $100,000 and over | 125 (100.0%) | 0 (0.0%) |
Public vs Private Health Insurance Coverage by Age in Blaine
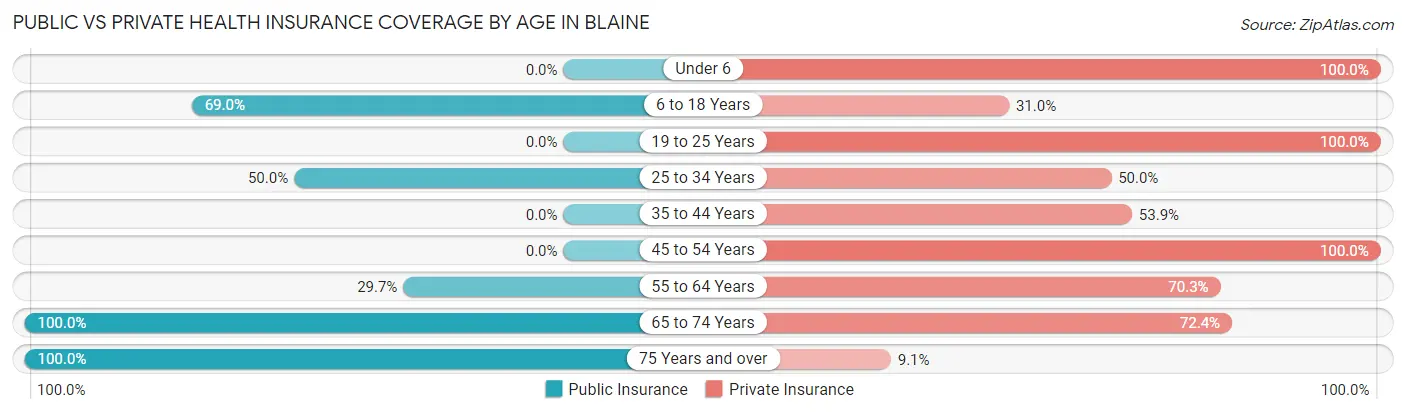
| Age Bracket | Public Insurance | Private Insurance |
| Under 6 | 0 (0.0%) | 2 (100.0%) |
| 6 to 18 Years | 20 (69.0%) | 9 (31.0%) |
| 19 to 25 Years | 0 (0.0%) | 33 (100.0%) |
| 25 to 34 Years | 14 (50.0%) | 14 (50.0%) |
| 35 to 44 Years | 0 (0.0%) | 7 (53.8%) |
| 45 to 54 Years | 0 (0.0%) | 32 (100.0%) |
| 55 to 64 Years | 11 (29.7%) | 26 (70.3%) |
| 65 to 74 Years | 58 (100.0%) | 42 (72.4%) |
| 75 Years and over | 22 (100.0%) | 2 (9.1%) |
| Total | 125 (49.2%) | 167 (65.7%) |
Disability Status by Sex by Age in Blaine
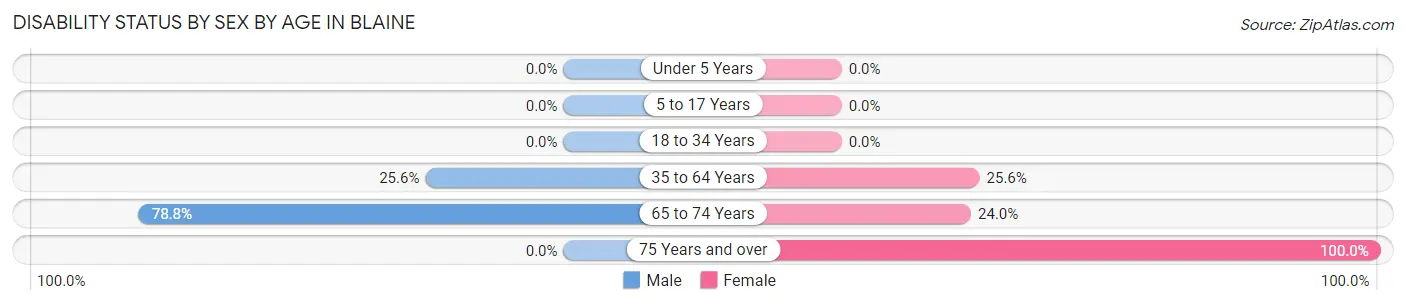
| Age Bracket | Male | Female |
| Under 5 Years | 0 (0.0%) | 0 (0.0%) |
| 5 to 17 Years | 0 (0.0%) | 0 (0.0%) |
| 18 to 34 Years | 0 (0.0%) | 0 (0.0%) |
| 35 to 64 Years | 10 (25.6%) | 11 (25.6%) |
| 65 to 74 Years | 26 (78.8%) | 6 (24.0%) |
| 75 Years and over | 0 (0.0%) | 14 (100.0%) |
Disability Class by Sex by Age in Blaine
Disability Class: Hearing Difficulty
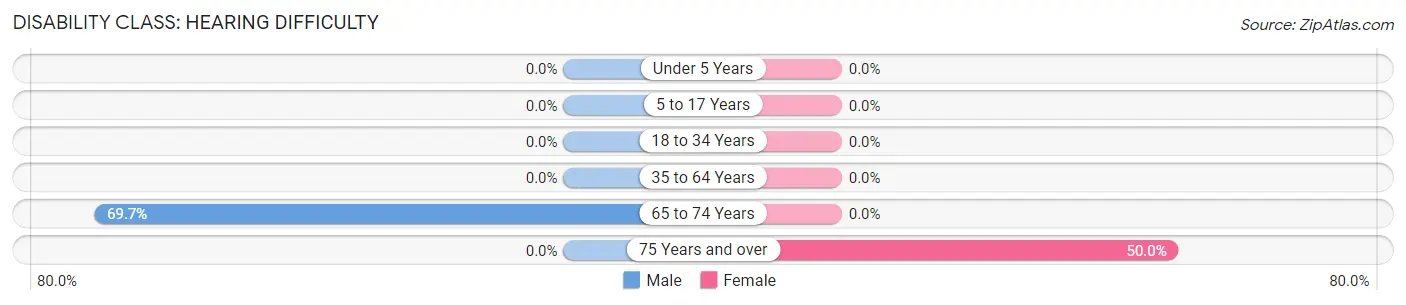
| Age Bracket | Male | Female |
| Under 5 Years | 0 (0.0%) | 0 (0.0%) |
| 5 to 17 Years | 0 (0.0%) | 0 (0.0%) |
| 18 to 34 Years | 0 (0.0%) | 0 (0.0%) |
| 35 to 64 Years | 0 (0.0%) | 0 (0.0%) |
| 65 to 74 Years | 23 (69.7%) | 0 (0.0%) |
| 75 Years and over | 0 (0.0%) | 7 (50.0%) |
Disability Class: Vision Difficulty
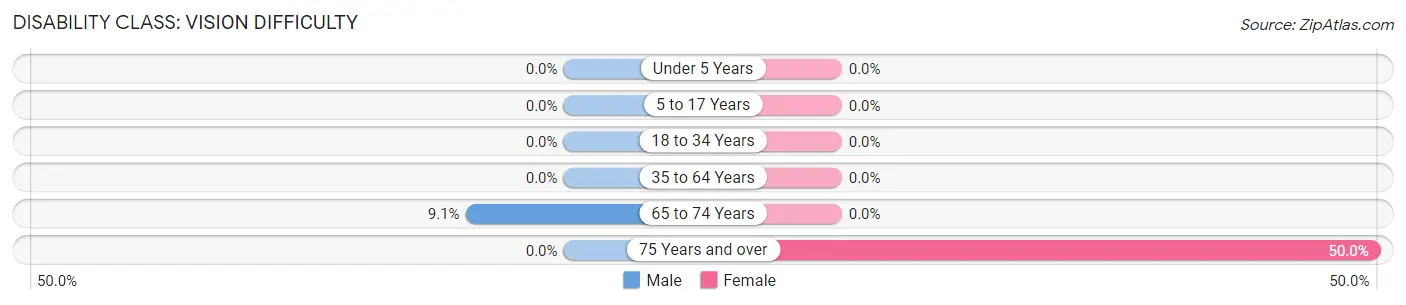
| Age Bracket | Male | Female |
| Under 5 Years | 0 (0.0%) | 0 (0.0%) |
| 5 to 17 Years | 0 (0.0%) | 0 (0.0%) |
| 18 to 34 Years | 0 (0.0%) | 0 (0.0%) |
| 35 to 64 Years | 0 (0.0%) | 0 (0.0%) |
| 65 to 74 Years | 3 (9.1%) | 0 (0.0%) |
| 75 Years and over | 0 (0.0%) | 7 (50.0%) |
Disability Class: Cognitive Difficulty
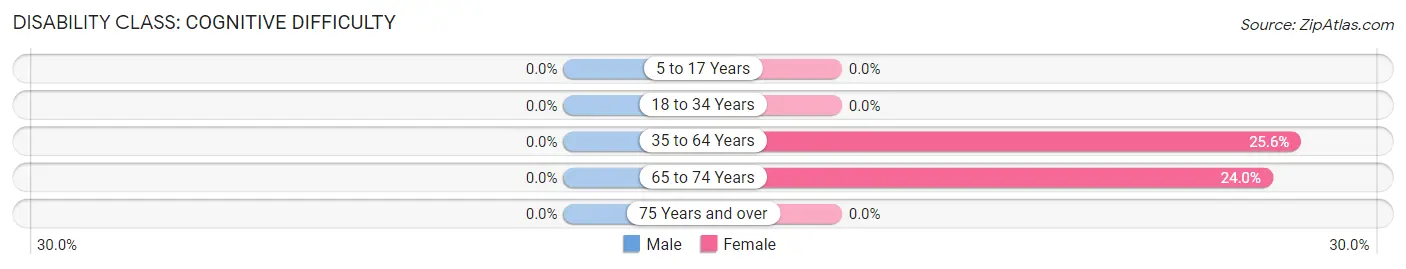
| Age Bracket | Male | Female |
| 5 to 17 Years | 0 (0.0%) | 0 (0.0%) |
| 18 to 34 Years | 0 (0.0%) | 0 (0.0%) |
| 35 to 64 Years | 0 (0.0%) | 11 (25.6%) |
| 65 to 74 Years | 0 (0.0%) | 6 (24.0%) |
| 75 Years and over | 0 (0.0%) | 0 (0.0%) |
Disability Class: Ambulatory Difficulty
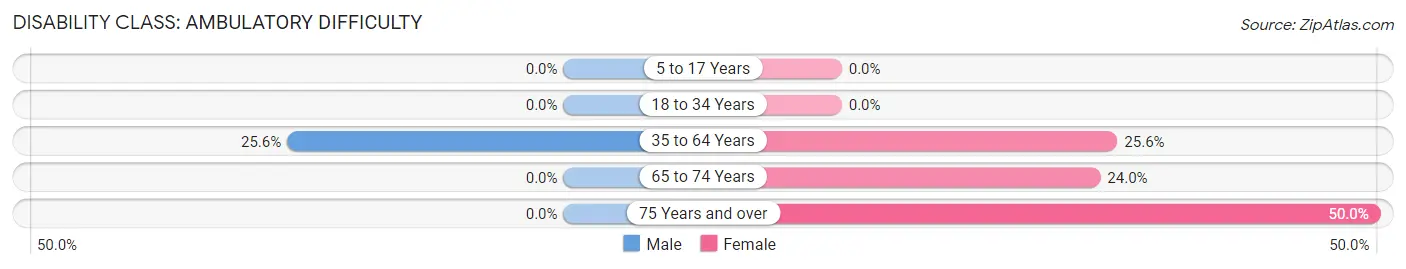
| Age Bracket | Male | Female |
| 5 to 17 Years | 0 (0.0%) | 0 (0.0%) |
| 18 to 34 Years | 0 (0.0%) | 0 (0.0%) |
| 35 to 64 Years | 10 (25.6%) | 11 (25.6%) |
| 65 to 74 Years | 0 (0.0%) | 6 (24.0%) |
| 75 Years and over | 0 (0.0%) | 7 (50.0%) |
Disability Class: Self-Care Difficulty
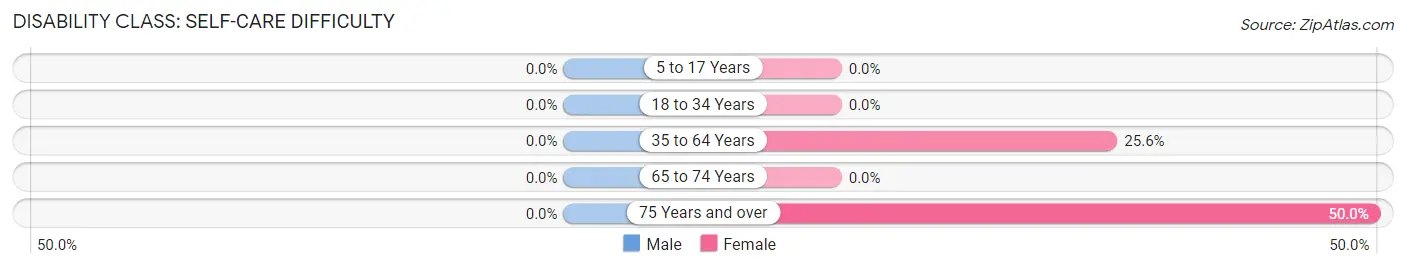
| Age Bracket | Male | Female |
| 5 to 17 Years | 0 (0.0%) | 0 (0.0%) |
| 18 to 34 Years | 0 (0.0%) | 0 (0.0%) |
| 35 to 64 Years | 0 (0.0%) | 11 (25.6%) |
| 65 to 74 Years | 0 (0.0%) | 0 (0.0%) |
| 75 Years and over | 0 (0.0%) | 7 (50.0%) |
Technology Access in Blaine
Computing Device Access in Blaine
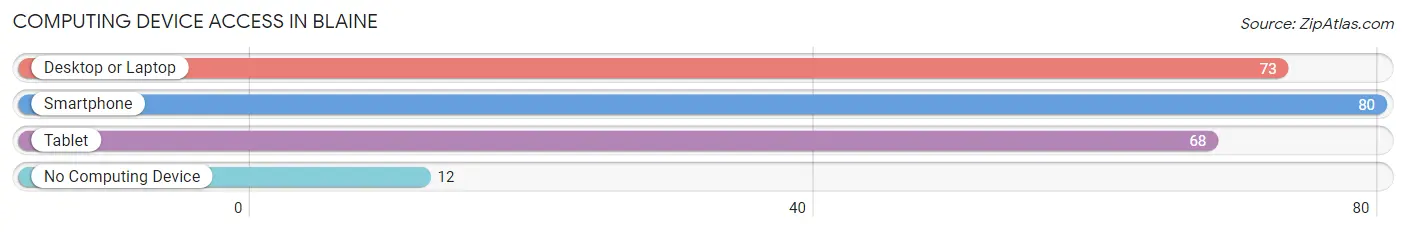
| Device Type | # Households | % Households |
| Desktop or Laptop | 73 | 69.5% |
| Smartphone | 80 | 76.2% |
| Tablet | 68 | 64.8% |
| No Computing Device | 12 | 11.4% |
| Total | 105 | 100.0% |
Internet Access in Blaine
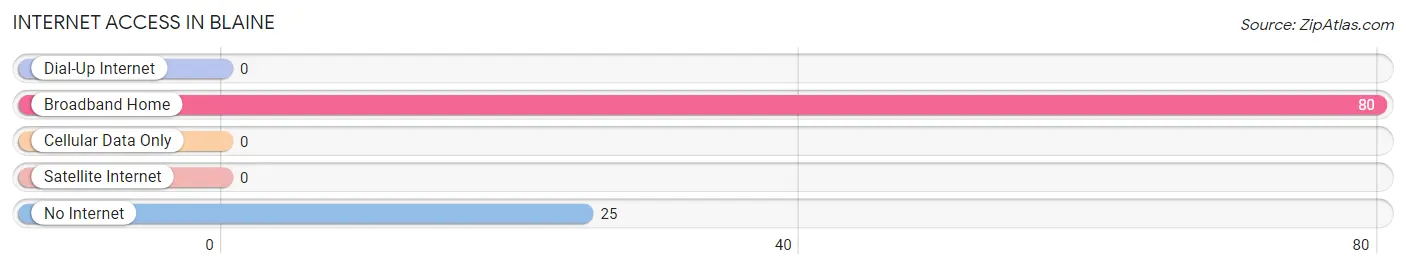
| Internet Type | # Households | % Households |
| Dial-Up Internet | 0 | 0.0% |
| Broadband Home | 80 | 76.2% |
| Cellular Data Only | 0 | 0.0% |
| Satellite Internet | 0 | 0.0% |
| No Internet | 25 | 23.8% |
| Total | 105 | 100.0% |
Blaine Summary
Blaine, Maine is a small town located in Aroostook County, Maine. It is situated on the Canada–US border, and is the northernmost town in the state. The town was incorporated in 1839 and has a population of 1,717 as of the 2010 census.
History
The area that is now Blaine was originally inhabited by the Maliseet and Passamaquoddy Native American tribes. The first European settlers arrived in the area in the late 1700s, and the town was officially incorporated in 1839. The town was named after James G. Blaine, a prominent politician from Maine who served as Speaker of the House of Representatives and Secretary of State.
The town was initially a farming community, but in the late 1800s, the lumber industry began to take off. The town was home to several sawmills and lumber camps, and the industry provided employment for many of the town’s residents.
In the early 1900s, the town began to experience a decline in the lumber industry, and many of the sawmills and lumber camps closed. The town’s economy shifted to focus on agriculture, and the town became known for its potatoes and other crops.
Geography
Blaine is located in Aroostook County, Maine, and is situated on the Canada–US border. The town is bordered by the towns of Limestone to the north, Grand Isle to the east, and Hodgdon to the south. The town is located in a rural area, and is surrounded by forests and rolling hills.
The town is located in the St. John Valley, and is situated along the St. John River. The town is located approximately 25 miles from the city of Presque Isle, and is approximately 75 miles from the city of Bangor.
Economy
The economy of Blaine is largely based on agriculture. The town is known for its potatoes, and the town is home to several potato farms. The town is also home to several small businesses, including restaurants, stores, and other services.
The town is also home to several manufacturing companies, including a paper mill and a wood products company. The town is also home to a small airport, which provides air service to the surrounding area.
Demographics
As of the 2010 census, the population of Blaine was 1,717. The town has a total area of 28.3 square miles, and the population density is 60.7 people per square mile.
The racial makeup of the town is 97.2% White, 0.5% African American, 0.3% Native American, 0.2% Asian, 0.1% Pacific Islander, 0.2% from other races, and 1.5% from two or more races. The median household income in the town is $37,917, and the median family income is $45,938.
The town has a high rate of poverty, with 24.3% of the population living below the poverty line. The town also has a high rate of unemployment, with 8.3% of the population unemployed. The town has a high rate of educational attainment, with 92.3% of the population having a high school diploma or higher.
Common Questions
What is Per Capita Income in Blaine?
Per Capita income in Blaine is $37,572.
What is the Median Family Income in Blaine?
Median Family Income in Blaine is $140,109.
What is Income or Wage Gap in Blaine?
Income or Wage Gap in Blaine is 9.5%.
Women in Blaine earn 90.5 cents for every dollar earned by a man.
What is Inequality or Gini Index in Blaine?
Inequality or Gini Index in Blaine is 0.41.
What is the Total Population of Blaine?
Total Population of Blaine is 254.
What is the Total Male Population of Blaine?
Total Male Population of Blaine is 117.
What is the Total Female Population of Blaine?
Total Female Population of Blaine is 137.
What is the Ratio of Males per 100 Females in Blaine?
There are 85.40 Males per 100 Females in Blaine.
What is the Ratio of Females per 100 Males in Blaine?
There are 117.09 Females per 100 Males in Blaine.
What is the Median Population Age in Blaine?
Median Population Age in Blaine is 50.7 Years.
What is the Average Family Size in Blaine
Average Family Size in Blaine is 3.0 People.
What is the Average Household Size in Blaine
Average Household Size in Blaine is 2.4 People.
How Large is the Labor Force in Blaine?
There are 181 People in the Labor Forcein in Blaine.
What is the Percentage of People in the Labor Force in Blaine?
78.7% of People are in the Labor Force in Blaine.
What is the Unemployment Rate in Blaine?
Unemployment Rate in Blaine is 4.4%.