Howland, ME Map & Demographics
Howland Map
Howland Overview
$21,821
PER CAPITA INCOME
$68,600
AVG FAMILY INCOME
$45,313
AVG HOUSEHOLD INCOME
10.8%
WAGE / INCOME GAP [ % ]
89.2¢/ $1
WAGE / INCOME GAP [ $ ]
0.41
INEQUALITY / GINI INDEX
1,126
TOTAL POPULATION
558
MALE POPULATION
568
FEMALE POPULATION
98.24
MALES / 100 FEMALES
101.79
FEMALES / 100 MALES
40.6
MEDIAN AGE
3.1
AVG FAMILY SIZE
2.4
AVG HOUSEHOLD SIZE
442
LABOR FORCE [ PEOPLE ]
50.1%
PERCENT IN LABOR FORCE
10.0%
UNEMPLOYMENT RATE
Howland Zip Codes
Howland Area Codes
Income in Howland
Income Overview in Howland
Per Capita Income in Howland is $21,821, while median incomes of families and households are $68,600 and $45,313 respectively.
| Characteristic | Number | Measure |
| Per Capita Income | 1,126 | $21,821 |
| Median Family Income | 268 | $68,600 |
| Mean Family Income | 268 | $63,935 |
| Median Household Income | 449 | $45,313 |
| Mean Household Income | 449 | $51,486 |
| Income Deficit | 268 | $0 |
| Wage / Income Gap (%) | 1,126 | 10.78% |
| Wage / Income Gap ($) | 1,126 | 89.22¢ per $1 |
| Gini / Inequality Index | 1,126 | 0.41 |
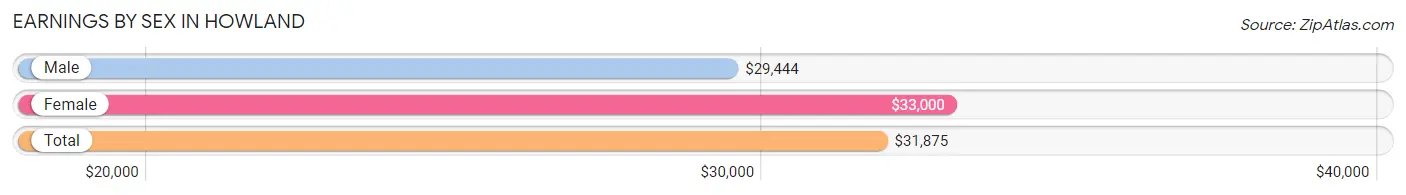
Earnings by Sex in Howland
Average Earnings in Howland are $31,875, $29,444 for men and $33,000 for women, a difference of 10.8%.
| Sex | Number | Average Earnings |
| Male | 306 (61.7%) | $29,444 |
| Female | 190 (38.3%) | $33,000 |
| Total | 496 (100.0%) | $31,875 |
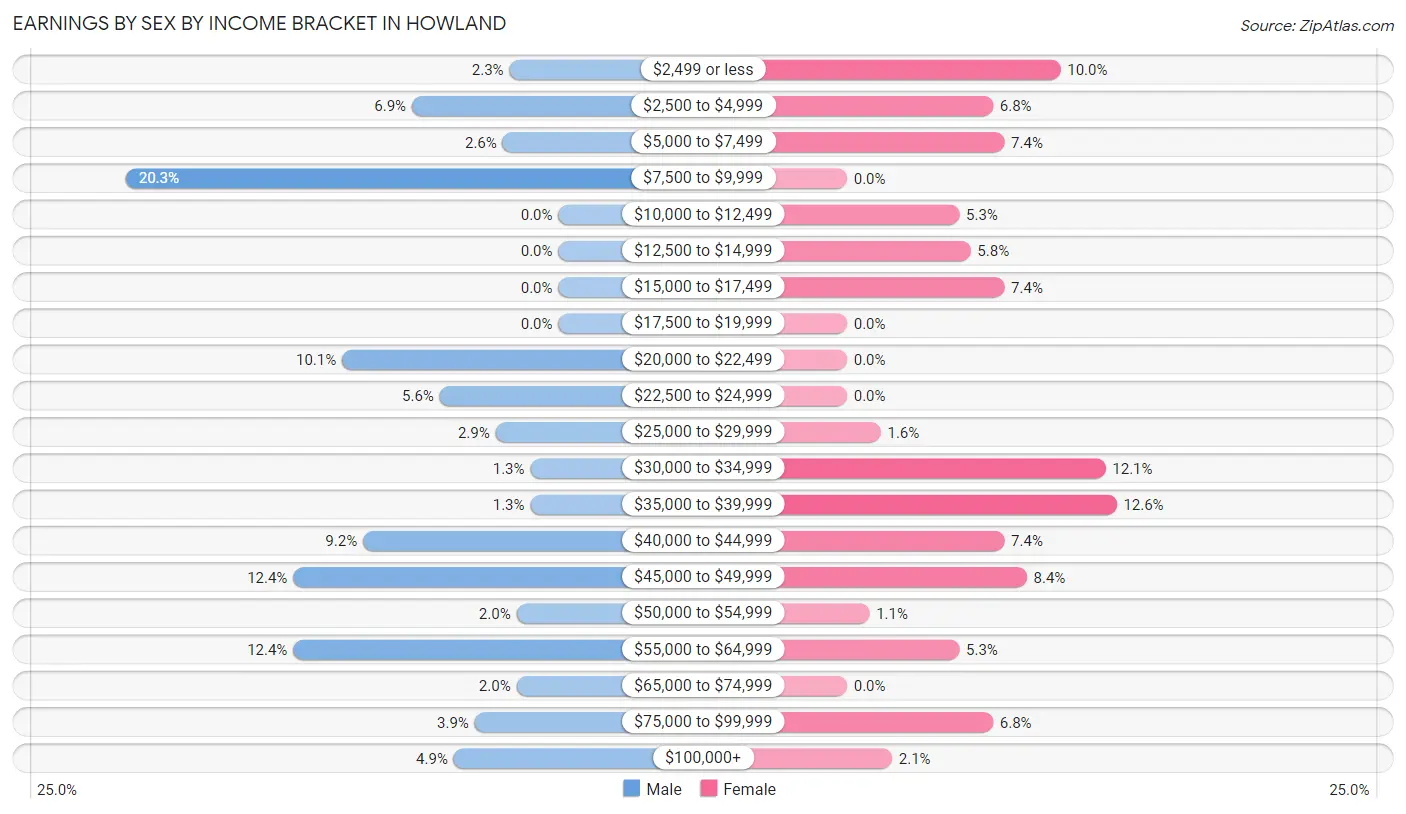
Earnings by Sex by Income Bracket in Howland
The most common earnings brackets in Howland are $7,500 to $9,999 for men (62 | 20.3%) and $35,000 to $39,999 for women (24 | 12.6%).
| Income | Male | Female |
| $2,499 or less | 7 (2.3%) | 19 (10.0%) |
| $2,500 to $4,999 | 21 (6.9%) | 13 (6.8%) |
| $5,000 to $7,499 | 8 (2.6%) | 14 (7.4%) |
| $7,500 to $9,999 | 62 (20.3%) | 0 (0.0%) |
| $10,000 to $12,499 | 0 (0.0%) | 10 (5.3%) |
| $12,500 to $14,999 | 0 (0.0%) | 11 (5.8%) |
| $15,000 to $17,499 | 0 (0.0%) | 14 (7.4%) |
| $17,500 to $19,999 | 0 (0.0%) | 0 (0.0%) |
| $20,000 to $22,499 | 31 (10.1%) | 0 (0.0%) |
| $22,500 to $24,999 | 17 (5.6%) | 0 (0.0%) |
| $25,000 to $29,999 | 9 (2.9%) | 3 (1.6%) |
| $30,000 to $34,999 | 4 (1.3%) | 23 (12.1%) |
| $35,000 to $39,999 | 4 (1.3%) | 24 (12.6%) |
| $40,000 to $44,999 | 28 (9.1%) | 14 (7.4%) |
| $45,000 to $49,999 | 38 (12.4%) | 16 (8.4%) |
| $50,000 to $54,999 | 6 (2.0%) | 2 (1.1%) |
| $55,000 to $64,999 | 38 (12.4%) | 10 (5.3%) |
| $65,000 to $74,999 | 6 (2.0%) | 0 (0.0%) |
| $75,000 to $99,999 | 12 (3.9%) | 13 (6.8%) |
| $100,000+ | 15 (4.9%) | 4 (2.1%) |
| Total | 306 (100.0%) | 190 (100.0%) |
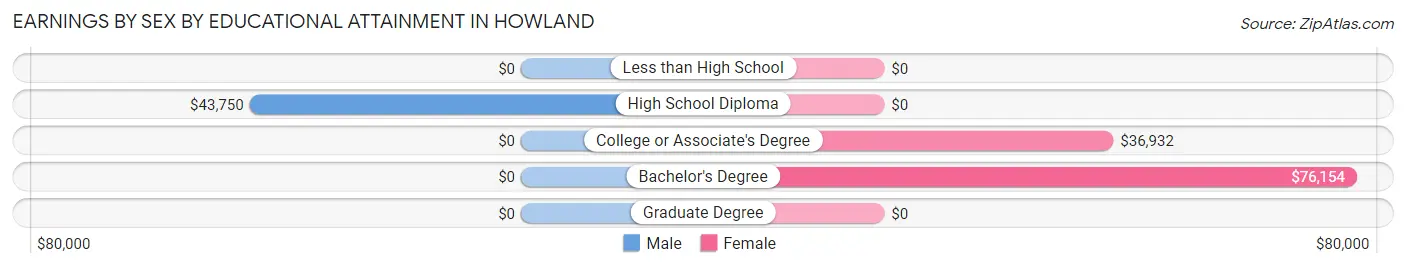
Earnings by Sex by Educational Attainment in Howland
Average earnings in Howland are $40,515 for men and $34,167 for women, a difference of 15.7%. Men with an educational attainment of high school diploma enjoy the highest average annual earnings of $43,750, while those with high school diploma education earn the least with $43,750. Women with an educational attainment of bachelor's degree earn the most with the average annual earnings of $76,154, while those with college or associate's degree education have the smallest earnings of $36,932.
| Educational Attainment | Male Income | Female Income |
| Less than High School | - | - |
| High School Diploma | $43,750 | $0 |
| College or Associate's Degree | - | - |
| Bachelor's Degree | - | - |
| Graduate Degree | - | - |
| Total | $40,515 | $34,167 |
Family Income in Howland
Family Income Brackets in Howland
According to the Howland family income data, there are 77 families falling into the $50,000 to $74,999 income range, which is the most common income bracket and makes up 28.7% of all families.
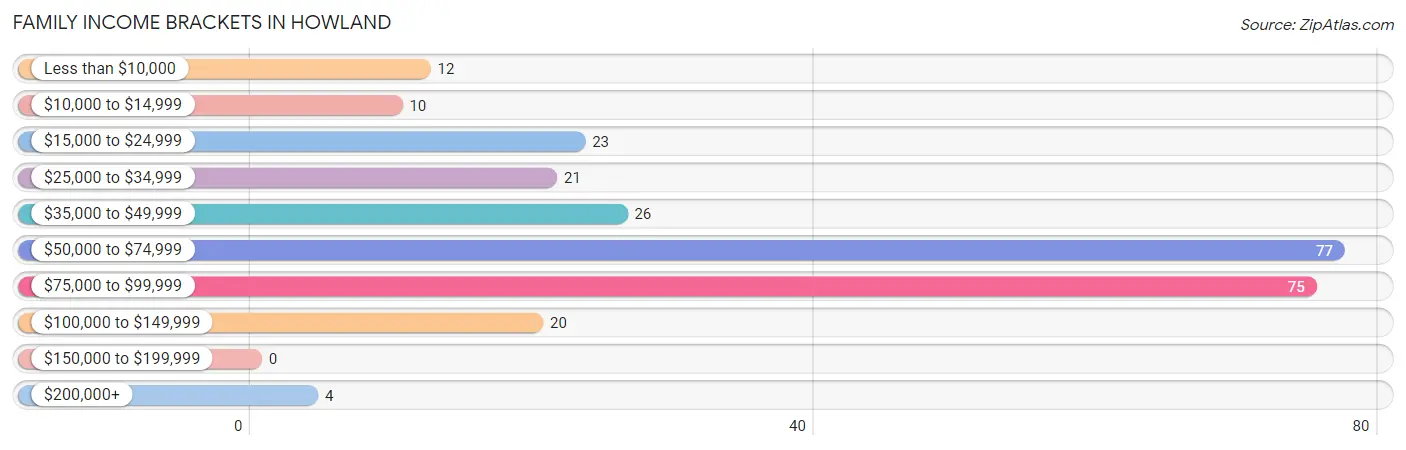
| Income Bracket | # Families | % Families |
| Less than $10,000 | 12 | 4.5% |
| $10,000 to $14,999 | 10 | 3.7% |
| $15,000 to $24,999 | 23 | 8.6% |
| $25,000 to $34,999 | 21 | 7.8% |
| $35,000 to $49,999 | 26 | 9.7% |
| $50,000 to $74,999 | 77 | 28.7% |
| $75,000 to $99,999 | 75 | 28.0% |
| $100,000 to $149,999 | 20 | 7.5% |
| $150,000 to $199,999 | 0 | 0.0% |
| $200,000+ | 4 | 1.5% |
Family Income by Famaliy Size in Howland
4-person families (83 | 31.0%) account for the highest median family income in Howland with $69,176 per family, while 2-person families (92 | 34.3%) have the highest median income of $28,472 per family member.
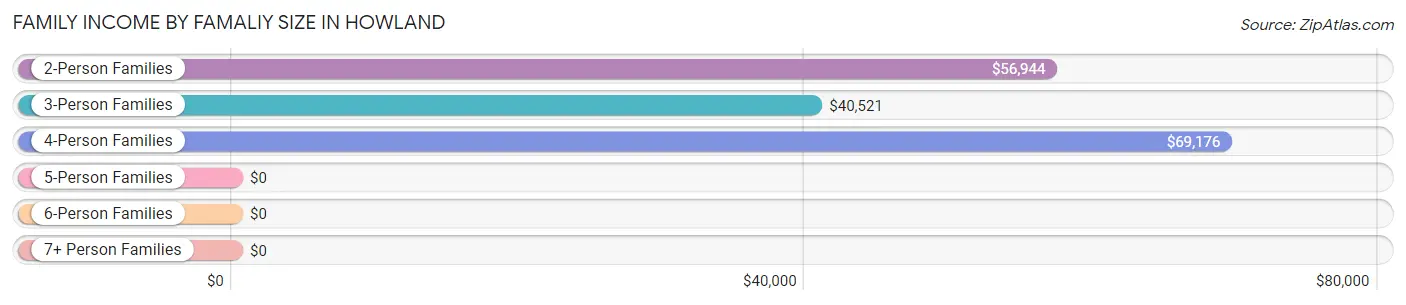
| Income Bracket | # Families | Median Income |
| 2-Person Families | 92 (34.3%) | $56,944 |
| 3-Person Families | 73 (27.2%) | $40,521 |
| 4-Person Families | 83 (31.0%) | $69,176 |
| 5-Person Families | 20 (7.5%) | $0 |
| 6-Person Families | 0 (0.0%) | $0 |
| 7+ Person Families | 0 (0.0%) | $0 |
| Total | 268 (100.0%) | $68,600 |
Family Income by Number of Earners in Howland
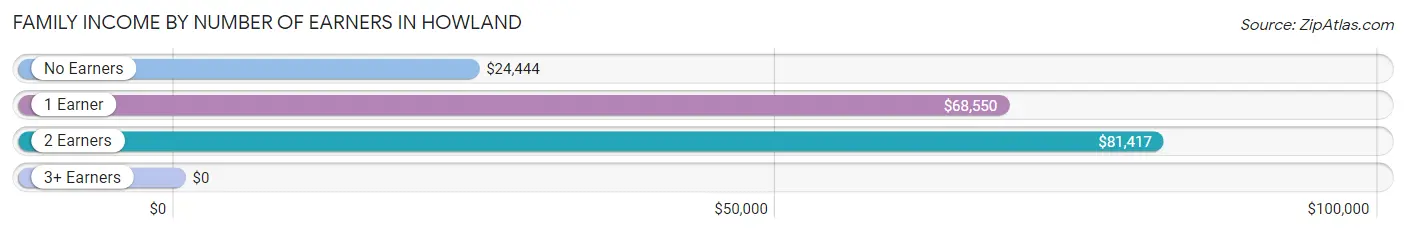
| Number of Earners | # Families | Median Income |
| No Earners | 38 (14.2%) | $24,444 |
| 1 Earner | 126 (47.0%) | $68,550 |
| 2 Earners | 95 (35.4%) | $81,417 |
| 3+ Earners | 9 (3.4%) | $0 |
| Total | 268 (100.0%) | $68,600 |
Household Income in Howland
Household Income Brackets in Howland
With 99 households falling in the category, the $50,000 to $74,999 income range is the most frequent in Howland, accounting for 22.1% of all households.
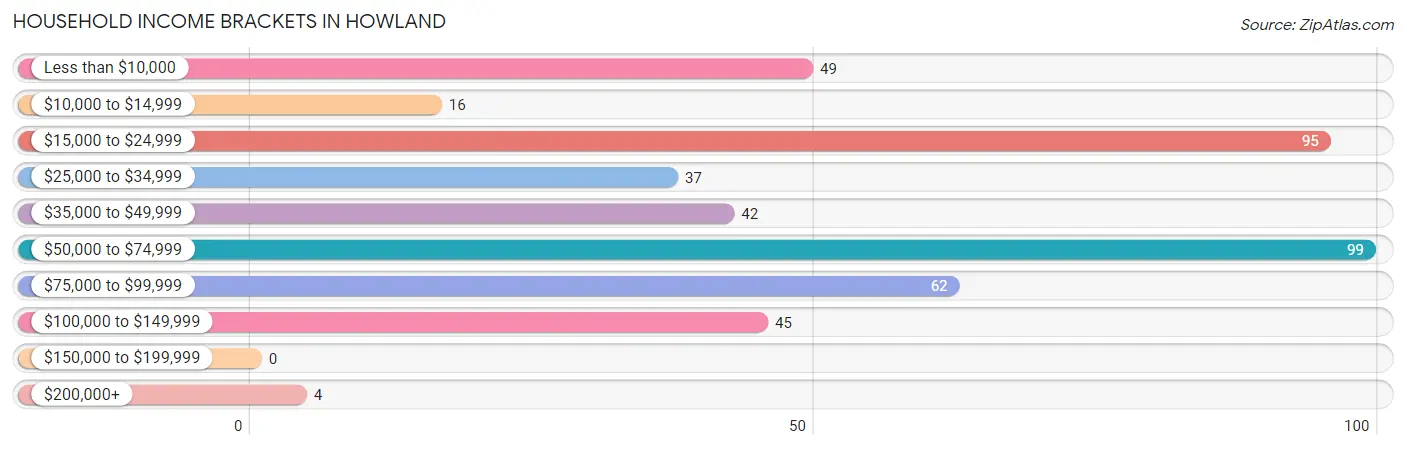
| Income Bracket | # Households | % Households |
| Less than $10,000 | 49 | 10.9% |
| $10,000 to $14,999 | 16 | 3.6% |
| $15,000 to $24,999 | 95 | 21.2% |
| $25,000 to $34,999 | 37 | 8.2% |
| $35,000 to $49,999 | 42 | 9.4% |
| $50,000 to $74,999 | 99 | 22.0% |
| $75,000 to $99,999 | 62 | 13.8% |
| $100,000 to $149,999 | 45 | 10.0% |
| $150,000 to $199,999 | 0 | 0.0% |
| $200,000+ | 4 | 0.9% |
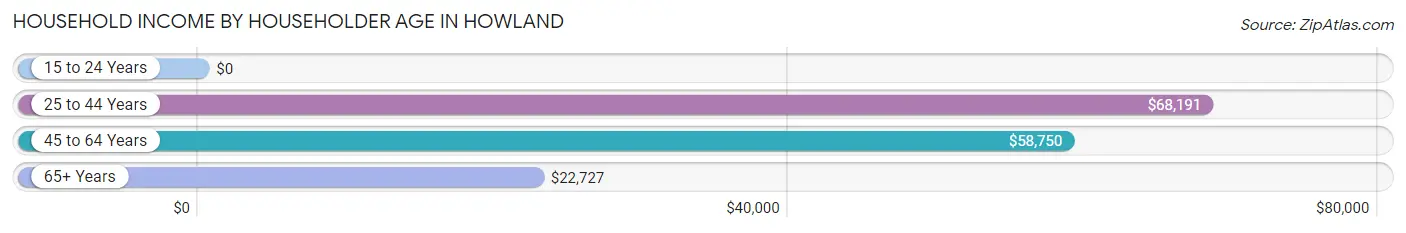
Household Income by Householder Age in Howland
The median household income in Howland is $45,313, with the highest median household income of $68,191 found in the 25 to 44 years age bracket for the primary householder. A total of 182 households (40.5%) fall into this category.
| Income Bracket | # Households | Median Income |
| 15 to 24 Years | 0 (0.0%) | $0 |
| 25 to 44 Years | 182 (40.5%) | $68,191 |
| 45 to 64 Years | 133 (29.6%) | $58,750 |
| 65+ Years | 134 (29.8%) | $22,727 |
| Total | 449 (100.0%) | $45,313 |
Poverty in Howland
Income Below Poverty by Sex and Age in Howland
With 17.7% poverty level for males and 21.6% for females among the residents of Howland, under 5 year old males and 5 year old females are the most vulnerable to poverty, with 33 males (70.2%) and 8 females (100.0%) in their respective age groups living below the poverty level.
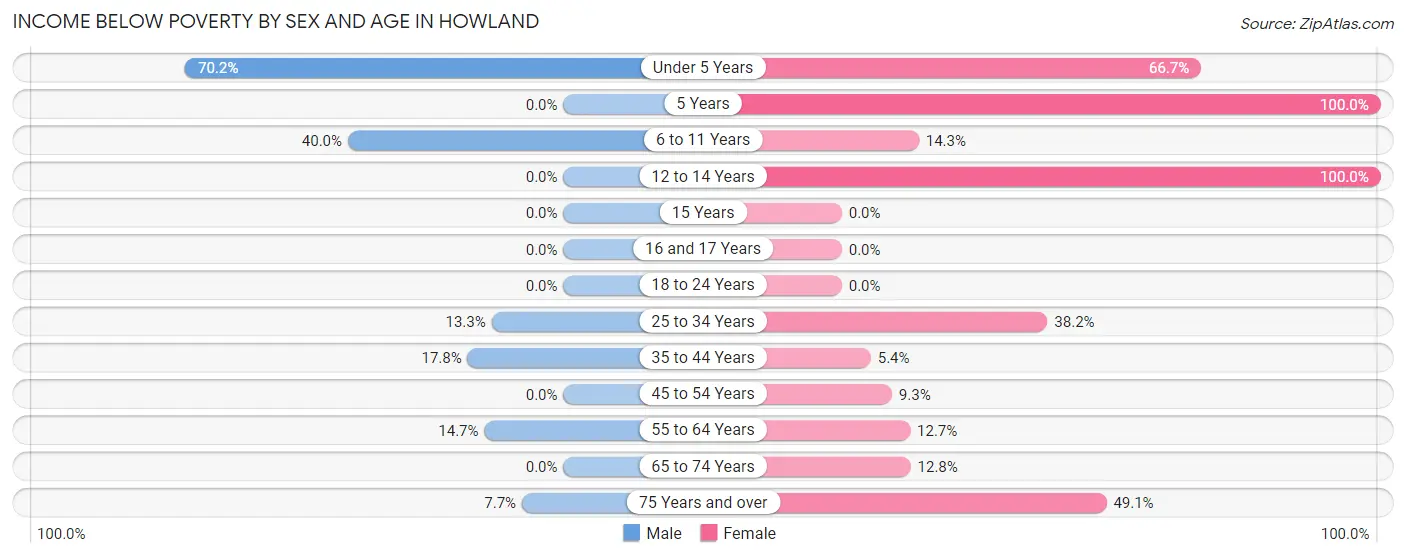
| Age Bracket | Male | Female |
| Under 5 Years | 33 (70.2%) | 8 (66.7%) |
| 5 Years | 0 (0.0%) | 8 (100.0%) |
| 6 to 11 Years | 22 (40.0%) | 12 (14.3%) |
| 12 to 14 Years | 0 (0.0%) | 3 (100.0%) |
| 15 Years | 0 (0.0%) | 0 (0.0%) |
| 16 and 17 Years | 0 (0.0%) | 0 (0.0%) |
| 18 to 24 Years | 0 (0.0%) | 0 (0.0%) |
| 25 to 34 Years | 8 (13.3%) | 29 (38.2%) |
| 35 to 44 Years | 16 (17.8%) | 5 (5.4%) |
| 45 to 54 Years | 0 (0.0%) | 4 (9.3%) |
| 55 to 64 Years | 17 (14.7%) | 9 (12.7%) |
| 65 to 74 Years | 0 (0.0%) | 6 (12.8%) |
| 75 Years and over | 3 (7.7%) | 28 (49.1%) |
| Total | 99 (17.7%) | 112 (21.6%) |
Income Above Poverty by Sex and Age in Howland
According to the poverty statistics in Howland, males aged 12 to 14 years and females aged 15 years are the age groups that are most secure financially, with 100.0% of males and 100.0% of females in these age groups living above the poverty line.
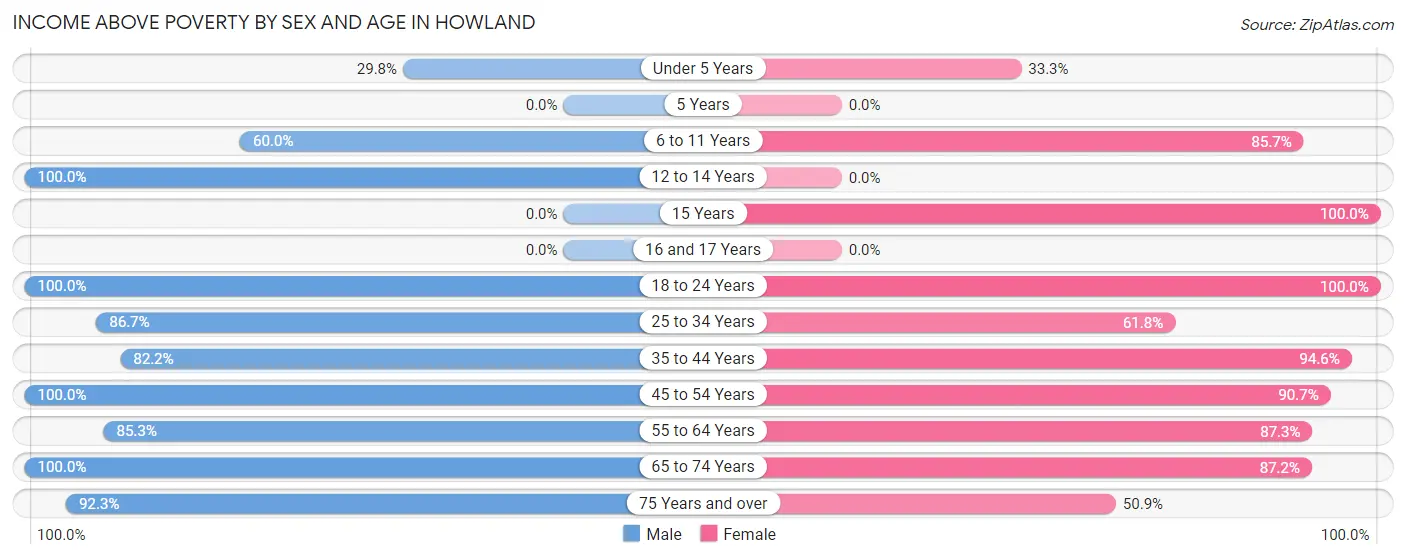
| Age Bracket | Male | Female |
| Under 5 Years | 14 (29.8%) | 4 (33.3%) |
| 5 Years | 0 (0.0%) | 0 (0.0%) |
| 6 to 11 Years | 33 (60.0%) | 72 (85.7%) |
| 12 to 14 Years | 23 (100.0%) | 0 (0.0%) |
| 15 Years | 0 (0.0%) | 11 (100.0%) |
| 16 and 17 Years | 0 (0.0%) | 0 (0.0%) |
| 18 to 24 Years | 51 (100.0%) | 14 (100.0%) |
| 25 to 34 Years | 52 (86.7%) | 47 (61.8%) |
| 35 to 44 Years | 74 (82.2%) | 88 (94.6%) |
| 45 to 54 Years | 42 (100.0%) | 39 (90.7%) |
| 55 to 64 Years | 99 (85.3%) | 62 (87.3%) |
| 65 to 74 Years | 35 (100.0%) | 41 (87.2%) |
| 75 Years and over | 36 (92.3%) | 29 (50.9%) |
| Total | 459 (82.3%) | 407 (78.4%) |
Income Below Poverty Among Married-Couple Families in Howland
The poverty statistics for married-couple families in Howland show that 4.5% or 8 of the total 177 families live below the poverty line. Families with 3 or 4 children have the highest poverty rate of 100.0%, comprising of 8 families. On the other hand, families with no children have the lowest poverty rate of 0.0%, which includes 0 families.
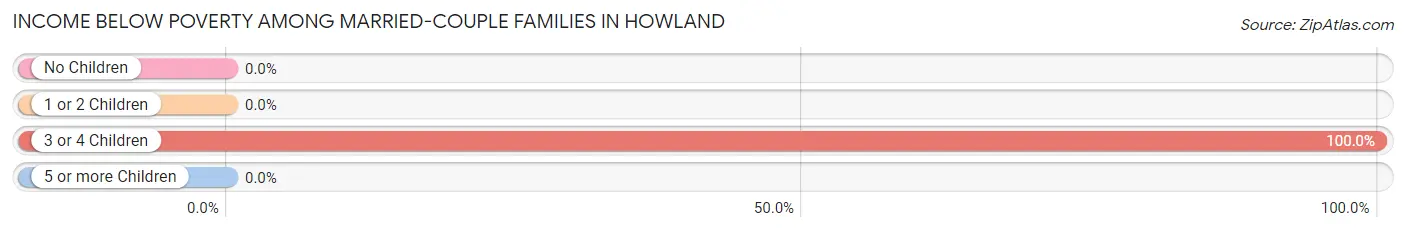
| Children | Above Poverty | Below Poverty |
| No Children | 91 (100.0%) | 0 (0.0%) |
| 1 or 2 Children | 78 (100.0%) | 0 (0.0%) |
| 3 or 4 Children | 0 (0.0%) | 8 (100.0%) |
| 5 or more Children | 0 (0.0%) | 0 (0.0%) |
| Total | 169 (95.5%) | 8 (4.5%) |
Income Below Poverty Among Single-Parent Households in Howland
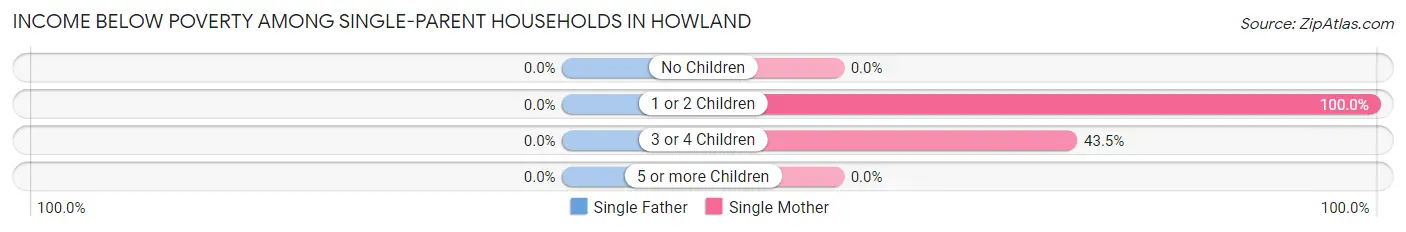
| Children | Single Father | Single Mother |
| No Children | 0 (0.0%) | 0 (0.0%) |
| 1 or 2 Children | 0 (0.0%) | 14 (100.0%) |
| 3 or 4 Children | 0 (0.0%) | 10 (43.5%) |
| 5 or more Children | 0 (0.0%) | 0 (0.0%) |
| Total | 0 (0.0%) | 24 (42.1%) |
Income Below Poverty Among Married-Couple vs Single-Parent Households in Howland
The poverty data for Howland shows that 8 of the married-couple family households (4.5%) and 24 of the single-parent households (26.4%) are living below the poverty level. Within the married-couple family households, those with 3 or 4 children have the highest poverty rate, with 8 households (100.0%) falling below the poverty line. Among the single-parent households, those with 1 or 2 children have the highest poverty rate, with 14 household (100.0%) living below poverty.
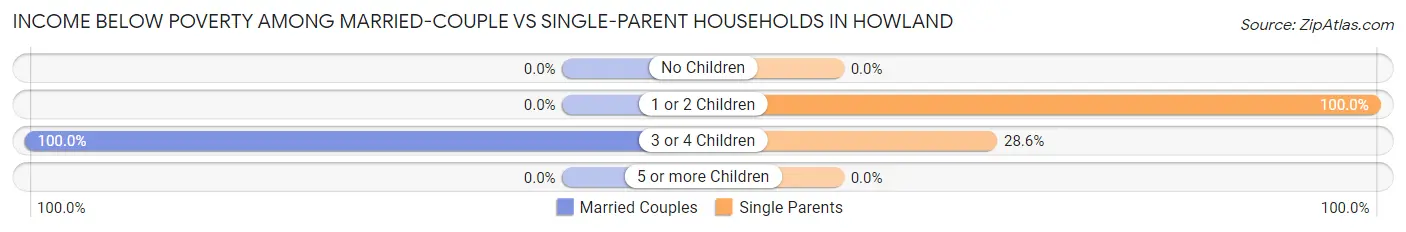
| Children | Married-Couple Families | Single-Parent Households |
| No Children | 0 (0.0%) | 0 (0.0%) |
| 1 or 2 Children | 0 (0.0%) | 14 (100.0%) |
| 3 or 4 Children | 8 (100.0%) | 10 (28.6%) |
| 5 or more Children | 0 (0.0%) | 0 (0.0%) |
| Total | 8 (4.5%) | 24 (26.4%) |
Race in Howland
The most populous races in Howland are , and White / Caucasian (1,126 | 100.0%).
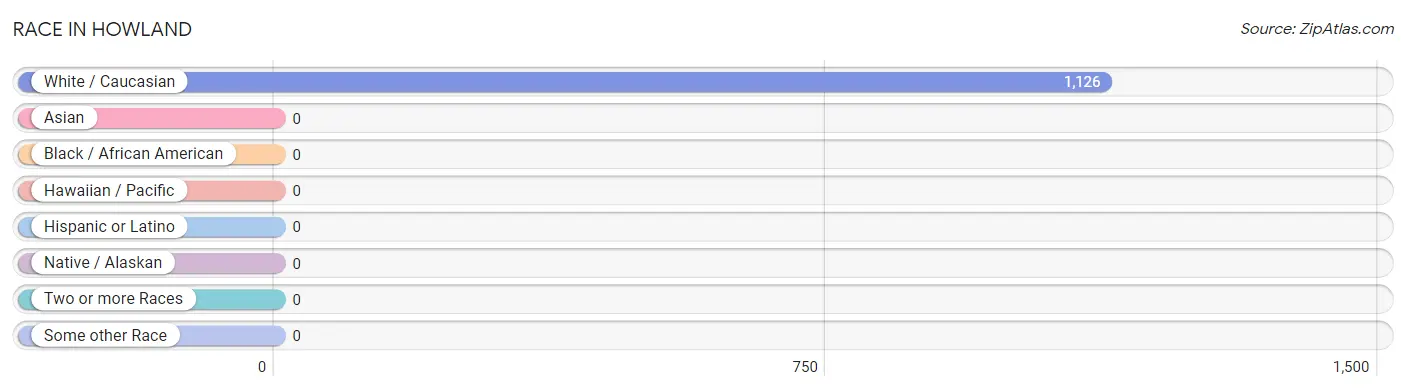
| Race | # Population | % Population |
| Asian | 0 | 0.0% |
| Black / African American | 0 | 0.0% |
| Hawaiian / Pacific | 0 | 0.0% |
| Hispanic or Latino | 0 | 0.0% |
| Native / Alaskan | 0 | 0.0% |
| White / Caucasian | 1,126 | 100.0% |
| Two or more Races | 0 | 0.0% |
| Some other Race | 0 | 0.0% |
| Total | 1,126 | 100.0% |
Ancestry in Howland
The most populous ancestries reported in Howland are Irish (232 | 20.6%), French (195 | 17.3%), American (142 | 12.6%), English (87 | 7.7%), and Swedish (69 | 6.1%), together accounting for 64.4% of all Howland residents.
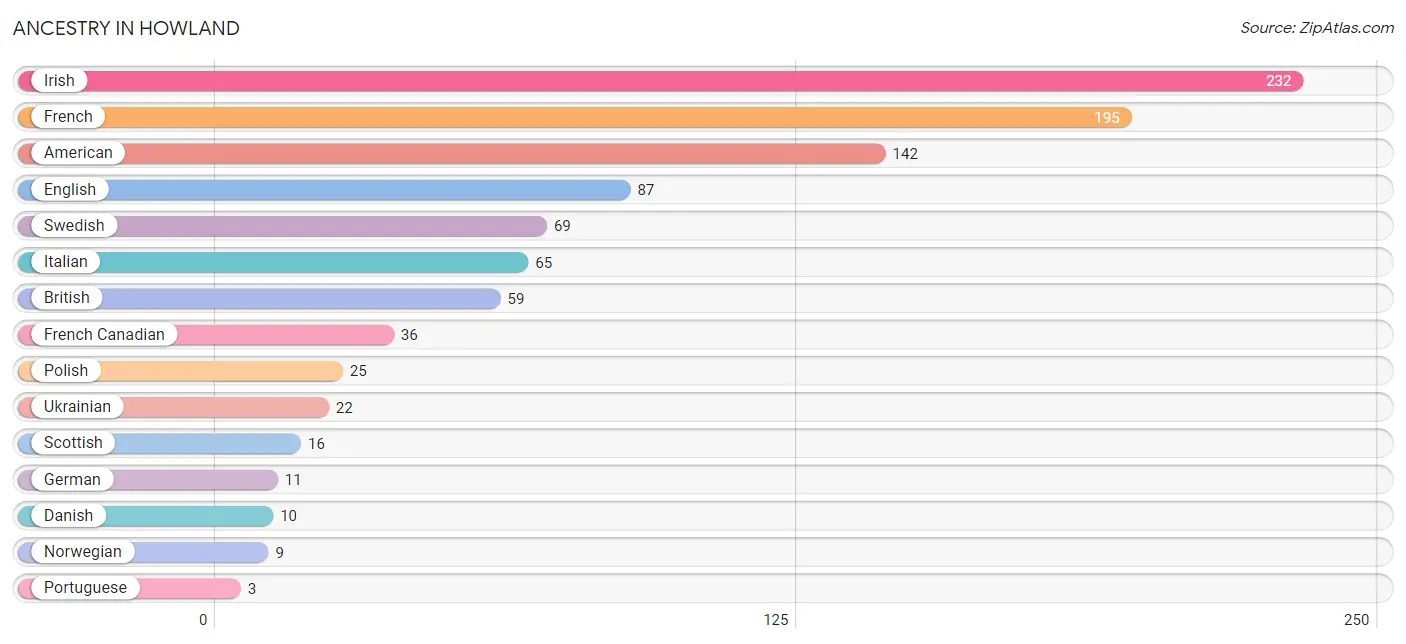
| Ancestry | # Population | % Population |
| American | 142 | 12.6% |
| British | 59 | 5.2% |
| Danish | 10 | 0.9% |
| Eastern European | 1 | 0.1% |
| English | 87 | 7.7% |
| French | 195 | 17.3% |
| French Canadian | 36 | 3.2% |
| German | 11 | 1.0% |
| Irish | 232 | 20.6% |
| Italian | 65 | 5.8% |
| Norwegian | 9 | 0.8% |
| Polish | 25 | 2.2% |
| Portuguese | 3 | 0.3% |
| Scotch-Irish | 3 | 0.3% |
| Scottish | 16 | 1.4% |
| Swedish | 69 | 6.1% |
| Ukrainian | 22 | 1.9% | View All 17 Rows |
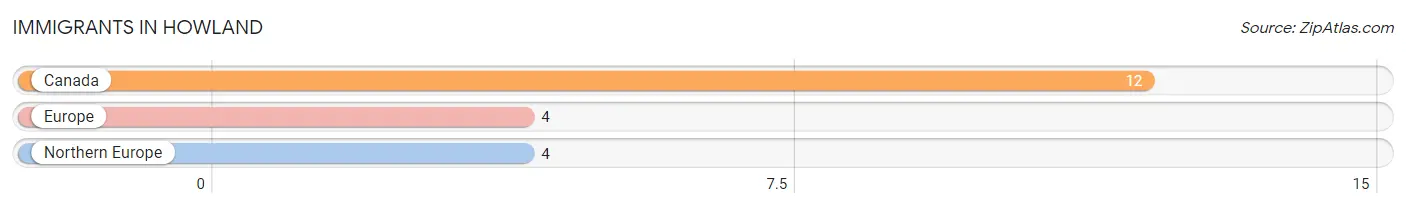
Immigrants in Howland
The most numerous immigrant groups reported in Howland came from Canada (12 | 1.1%), Europe (4 | 0.4%), and Northern Europe (4 | 0.4%), together accounting for 1.8% of all Howland residents.
| Immigration Origin | # Population | % Population |
| Canada | 12 | 1.1% |
| Europe | 4 | 0.4% |
| Northern Europe | 4 | 0.4% | View All 3 Rows |
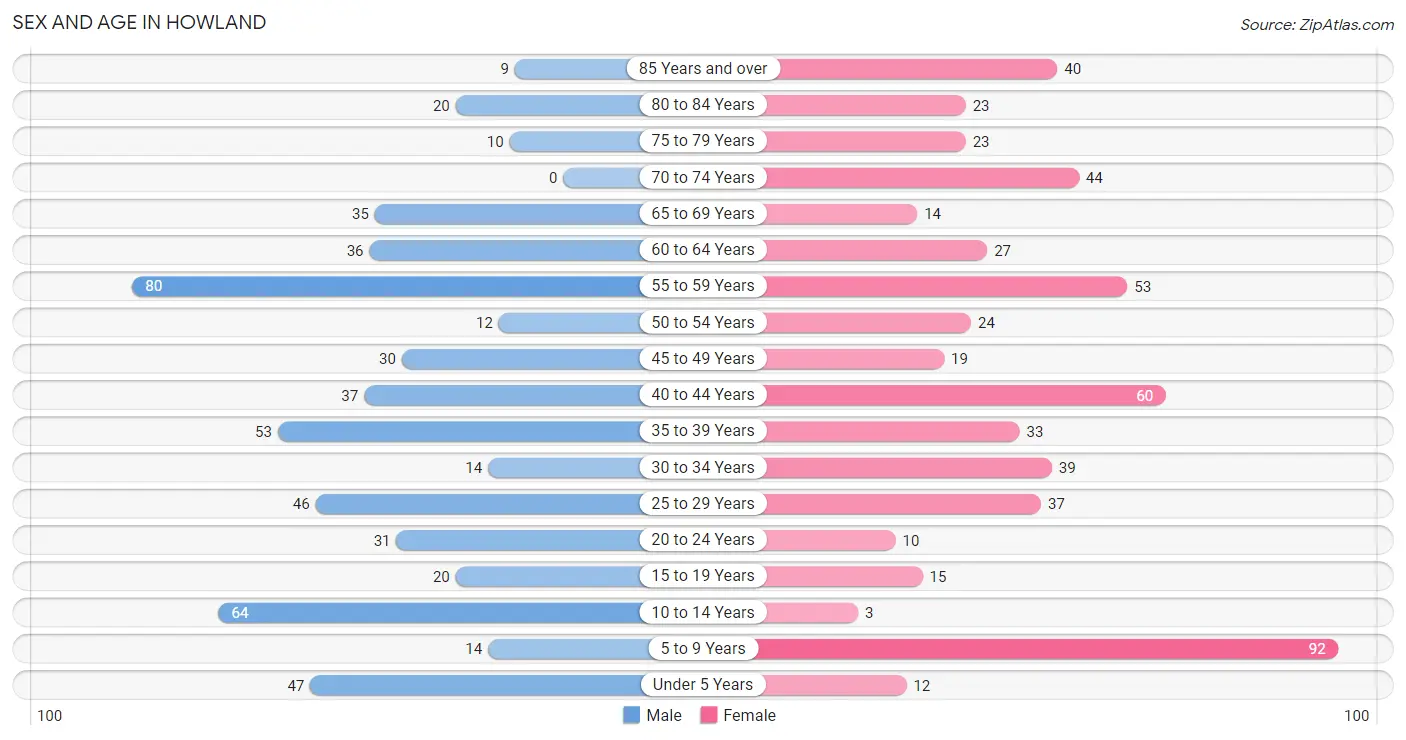
Sex and Age in Howland
Sex and Age in Howland
The most populous age groups in Howland are 55 to 59 Years (80 | 14.3%) for men and 5 to 9 Years (92 | 16.2%) for women.
| Age Bracket | Male | Female |
| Under 5 Years | 47 (8.4%) | 12 (2.1%) |
| 5 to 9 Years | 14 (2.5%) | 92 (16.2%) |
| 10 to 14 Years | 64 (11.5%) | 3 (0.5%) |
| 15 to 19 Years | 20 (3.6%) | 15 (2.6%) |
| 20 to 24 Years | 31 (5.6%) | 10 (1.8%) |
| 25 to 29 Years | 46 (8.2%) | 37 (6.5%) |
| 30 to 34 Years | 14 (2.5%) | 39 (6.9%) |
| 35 to 39 Years | 53 (9.5%) | 33 (5.8%) |
| 40 to 44 Years | 37 (6.6%) | 60 (10.6%) |
| 45 to 49 Years | 30 (5.4%) | 19 (3.4%) |
| 50 to 54 Years | 12 (2.1%) | 24 (4.2%) |
| 55 to 59 Years | 80 (14.3%) | 53 (9.3%) |
| 60 to 64 Years | 36 (6.5%) | 27 (4.8%) |
| 65 to 69 Years | 35 (6.3%) | 14 (2.5%) |
| 70 to 74 Years | 0 (0.0%) | 44 (7.7%) |
| 75 to 79 Years | 10 (1.8%) | 23 (4.1%) |
| 80 to 84 Years | 20 (3.6%) | 23 (4.1%) |
| 85 Years and over | 9 (1.6%) | 40 (7.0%) |
| Total | 558 (100.0%) | 568 (100.0%) |
Families and Households in Howland
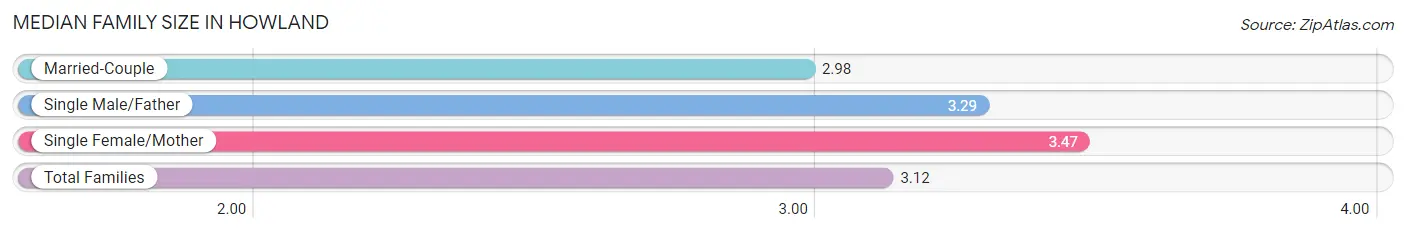
Median Family Size in Howland
The median family size in Howland is 3.12 persons per family, with single female/mother families (57 | 21.3%) accounting for the largest median family size of 3.47 persons per family. On the other hand, married-couple families (177 | 66.0%) represent the smallest median family size with 2.98 persons per family.
| Family Type | # Families | Family Size |
| Married-Couple | 177 (66.0%) | 2.98 |
| Single Male/Father | 34 (12.7%) | 3.29 |
| Single Female/Mother | 57 (21.3%) | 3.47 |
| Total Families | 268 (100.0%) | 3.12 |
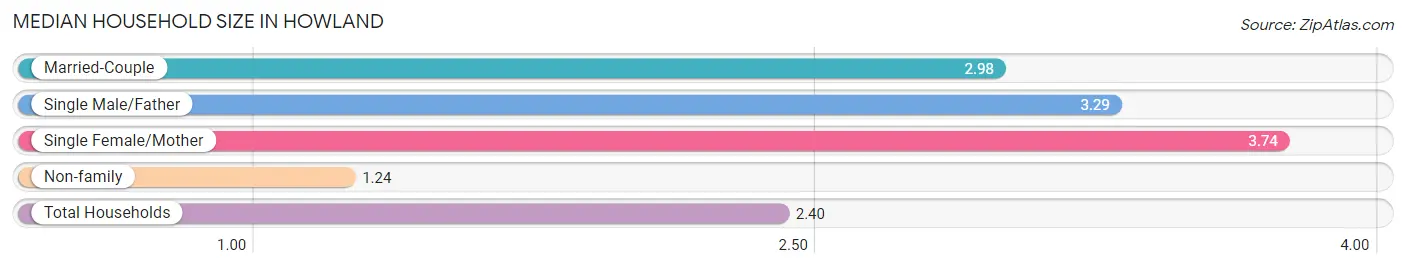
Median Household Size in Howland
The median household size in Howland is 2.40 persons per household, with single female/mother households (57 | 12.7%) accounting for the largest median household size of 3.74 persons per household. non-family households (181 | 40.3%) represent the smallest median household size with 1.24 persons per household.
| Household Type | # Households | Household Size |
| Married-Couple | 177 (39.4%) | 2.98 |
| Single Male/Father | 34 (7.6%) | 3.29 |
| Single Female/Mother | 57 (12.7%) | 3.74 |
| Non-family | 181 (40.3%) | 1.24 |
| Total Households | 449 (100.0%) | 2.40 |
Household Size by Marriage Status in Howland
Out of a total of 449 households in Howland, 268 (59.7%) are family households, while 181 (40.3%) are nonfamily households. The most numerous type of family households are 2-person households, comprising 92, and the most common type of nonfamily households are 1-person households, comprising 138.

| Household Size | Family Households | Nonfamily Households |
| 1-Person Households | - | 138 (30.7%) |
| 2-Person Households | 92 (20.5%) | 43 (9.6%) |
| 3-Person Households | 71 (15.8%) | 0 (0.0%) |
| 4-Person Households | 72 (16.0%) | 0 (0.0%) |
| 5-Person Households | 33 (7.3%) | 0 (0.0%) |
| 6-Person Households | 0 (0.0%) | 0 (0.0%) |
| 7+ Person Households | 0 (0.0%) | 0 (0.0%) |
| Total | 268 (59.7%) | 181 (40.3%) |
Female Fertility in Howland
Fertility by Age in Howland
Average fertility rate in Howland is 108.0 births per 1,000 women. Women in the age bracket of 20 to 34 years have the highest fertility rate with 267.0 births per 1,000 women. Women in the age bracket of 20 to 34 years acount for 100.0% of all women with births.
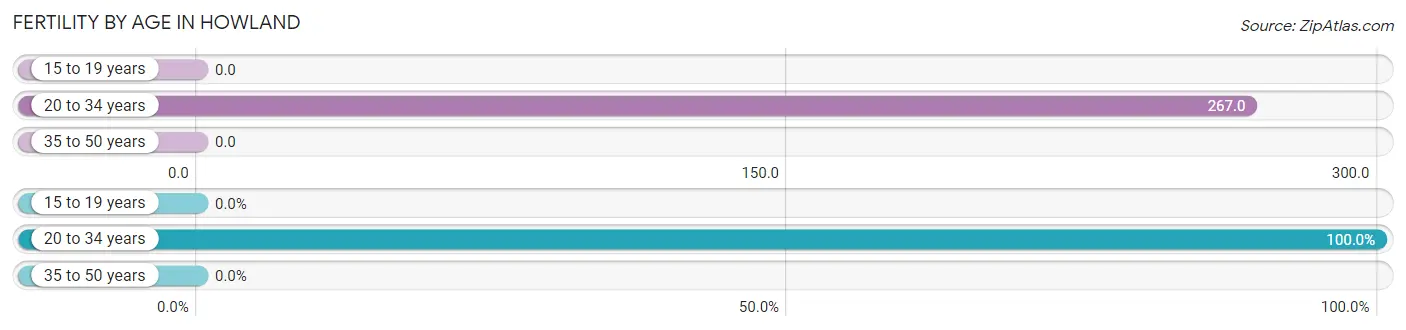
| Age Bracket | Women with Births | Births / 1,000 Women |
| 15 to 19 years | 0 (0.0%) | 0.0 |
| 20 to 34 years | 23 (100.0%) | 267.0 |
| 35 to 50 years | 0 (0.0%) | 0.0 |
| Total | 23 (100.0%) | 108.0 |
Fertility by Age by Marriage Status in Howland
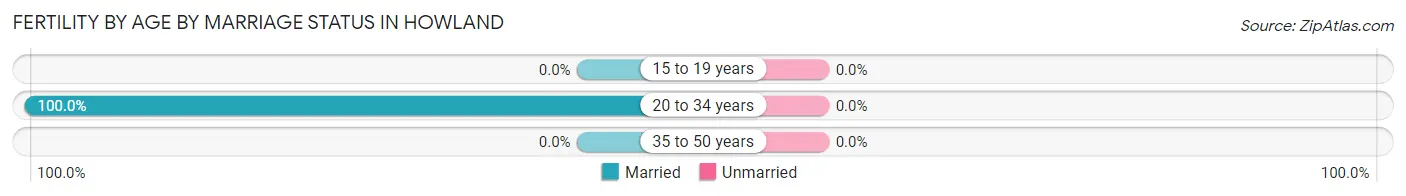
| Age Bracket | Married | Unmarried |
| 15 to 19 years | 0 (0.0%) | 0 (0.0%) |
| 20 to 34 years | 23 (100.0%) | 0 (0.0%) |
| 35 to 50 years | 0 (0.0%) | 0 (0.0%) |
| Total | 23 (100.0%) | 0 (0.0%) |
Fertility by Education in Howland
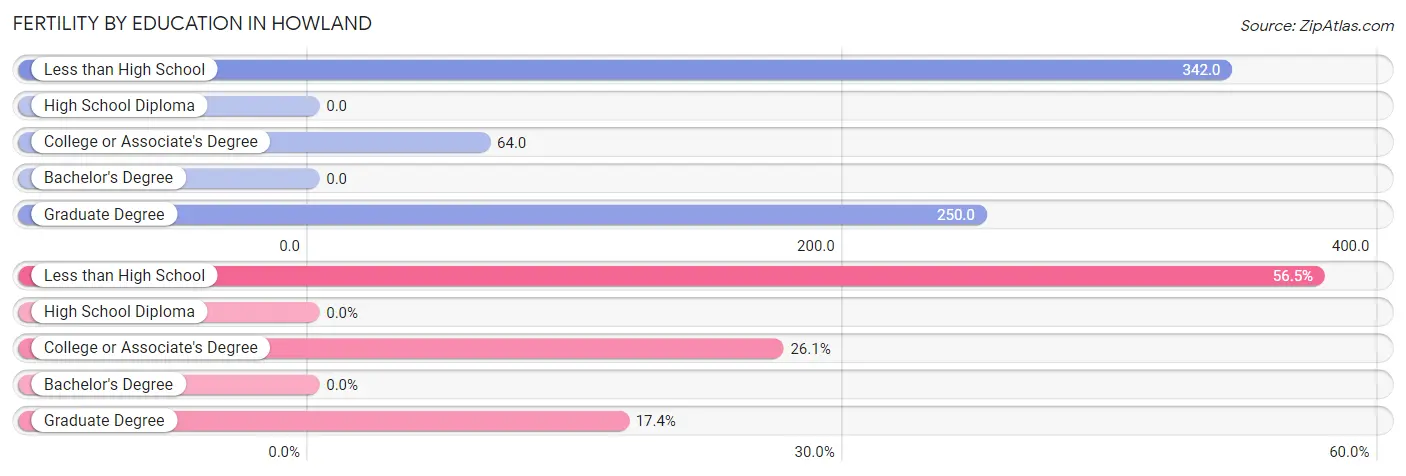
| Educational Attainment | Women with Births | Births / 1,000 Women |
| Less than High School | 13 (56.5%) | 342.0 |
| High School Diploma | 0 (0.0%) | 0.0 |
| College or Associate's Degree | 6 (26.1%) | 64.0 |
| Bachelor's Degree | 0 (0.0%) | 0.0 |
| Graduate Degree | 4 (17.4%) | 250.0 |
| Total | 23 (100.0%) | 108.0 |
Fertility by Education by Marriage Status in Howland
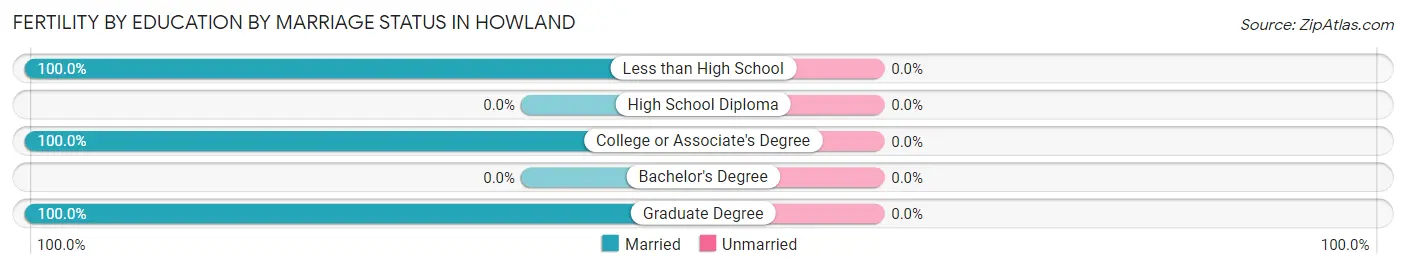
| Educational Attainment | Married | Unmarried |
| Less than High School | 13 (100.0%) | 0 (0.0%) |
| High School Diploma | 0 (0.0%) | 0 (0.0%) |
| College or Associate's Degree | 6 (100.0%) | 0 (0.0%) |
| Bachelor's Degree | 0 (0.0%) | 0 (0.0%) |
| Graduate Degree | 4 (100.0%) | 0 (0.0%) |
| Total | 23 (100.0%) | 0 (0.0%) |
Employment Characteristics in Howland
Employment by Class of Employer in Howland
Among the 367 employed individuals in Howland, private company employees (323 | 88.0%), not-for-profit organizations (22 | 6.0%), and local government employees (16 | 4.4%) make up the most common classes of employment.
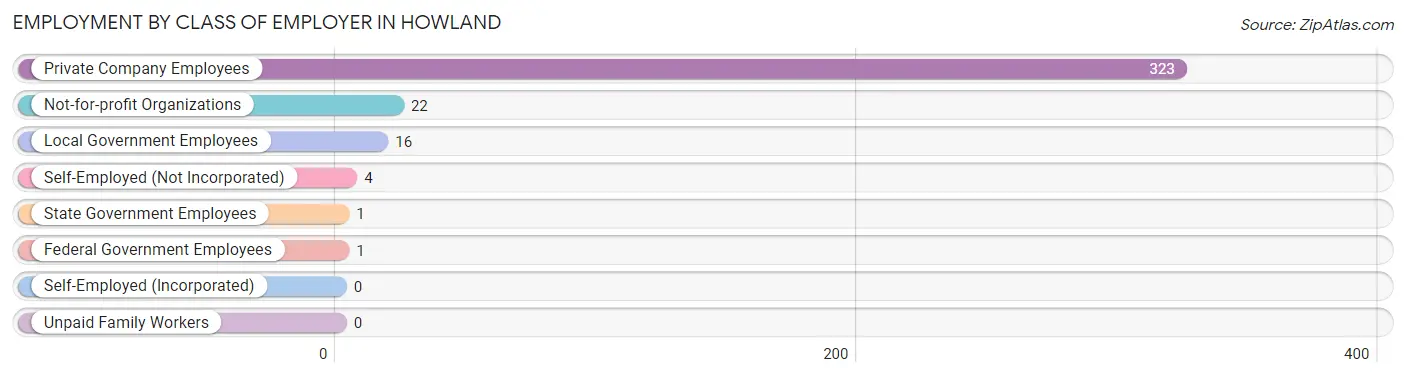
| Employer Class | # Employees | % Employees |
| Private Company Employees | 323 | 88.0% |
| Self-Employed (Incorporated) | 0 | 0.0% |
| Self-Employed (Not Incorporated) | 4 | 1.1% |
| Not-for-profit Organizations | 22 | 6.0% |
| Local Government Employees | 16 | 4.4% |
| State Government Employees | 1 | 0.3% |
| Federal Government Employees | 1 | 0.3% |
| Unpaid Family Workers | 0 | 0.0% |
| Total | 367 | 100.0% |
Employment Status by Age in Howland
According to the labor force statistics for Howland, out of the total population over 16 years of age (883), 50.1% or 442 individuals are in the labor force, with 10.0% or 44 of them unemployed. The age group with the highest labor force participation rate is 16 to 19 years, with 100.0% or 24 individuals in the labor force. Within the labor force, the 16 to 19 years age range has the highest percentage of unemployed individuals, with 41.7% or 10 of them being unemployed.
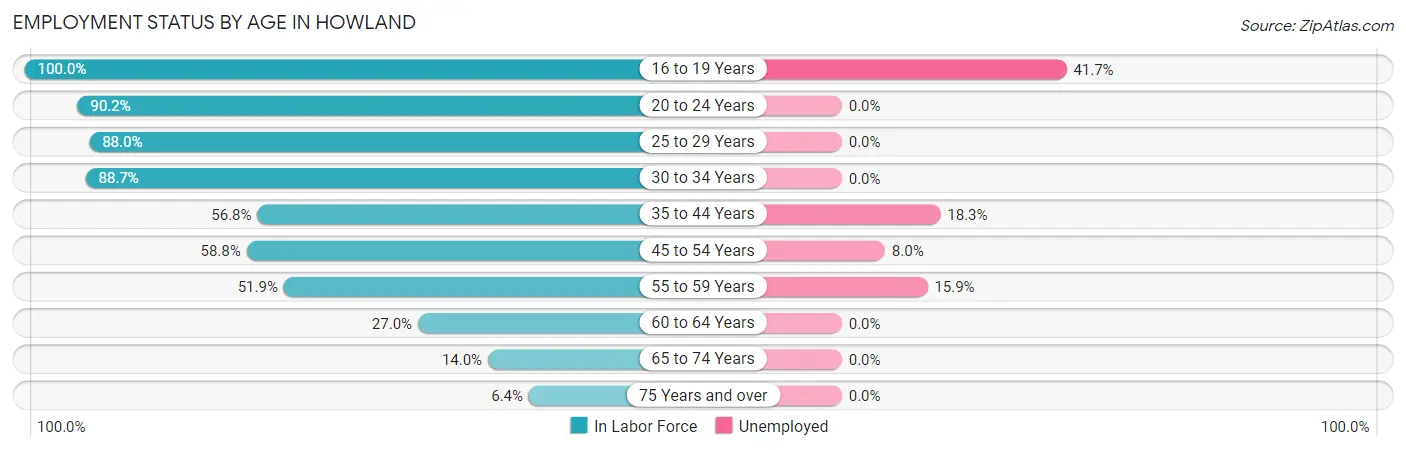
| Age Bracket | In Labor Force | Unemployed |
| 16 to 19 Years | 24 (100.0%) | 10 (41.7%) |
| 20 to 24 Years | 37 (90.2%) | 0 (0.0%) |
| 25 to 29 Years | 73 (88.0%) | 0 (0.0%) |
| 30 to 34 Years | 47 (88.7%) | 0 (0.0%) |
| 35 to 44 Years | 104 (56.8%) | 19 (18.3%) |
| 45 to 54 Years | 50 (58.8%) | 4 (8.0%) |
| 55 to 59 Years | 69 (51.9%) | 11 (15.9%) |
| 60 to 64 Years | 17 (27.0%) | 0 (0.0%) |
| 65 to 74 Years | 13 (14.0%) | 0 (0.0%) |
| 75 Years and over | 8 (6.4%) | 0 (0.0%) |
| Total | 442 (50.1%) | 44 (10.0%) |
Employment Status by Educational Attainment in Howland
According to labor force statistics for Howland, 60.0% of individuals (360) out of the total population between 25 and 64 years of age (600) are in the labor force, with 9.4% or 34 of them being unemployed. The group with the highest labor force participation rate are those with the educational attainment of bachelor's degree or higher, with 100.0% or 56 individuals in the labor force. Within the labor force, individuals with bachelor's degree or higher education have the highest percentage of unemployment, with 21.4% or 12 of them being unemployed.
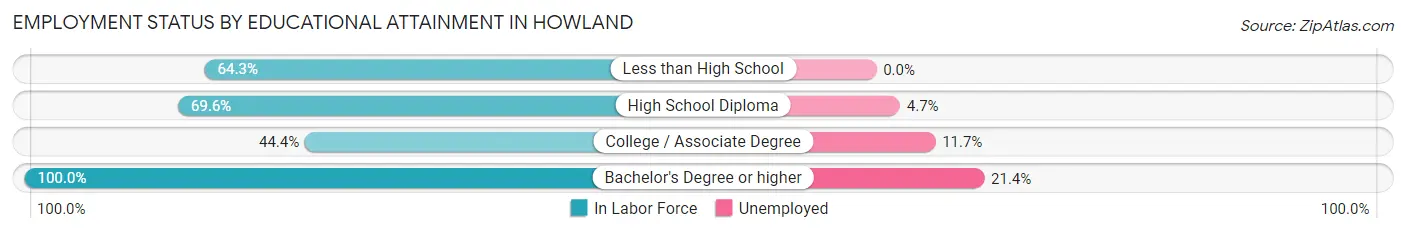
| Educational Attainment | In Labor Force | Unemployed |
| Less than High School | 27 (64.3%) | 0 (0.0%) |
| High School Diploma | 149 (69.6%) | 10 (4.7%) |
| College / Associate Degree | 128 (44.4%) | 34 (11.7%) |
| Bachelor's Degree or higher | 56 (100.0%) | 12 (21.4%) |
| Total | 360 (60.0%) | 56 (9.4%) |
Employment Occupations by Sex in Howland
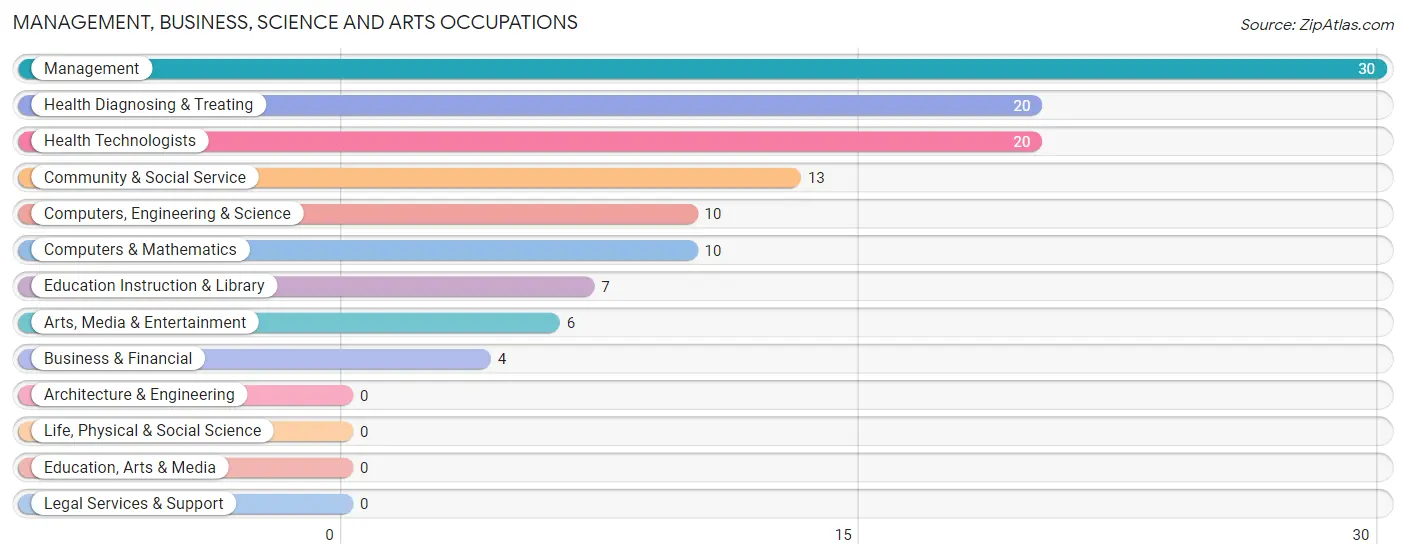
Management, Business, Science and Arts Occupations
The most common Management, Business, Science and Arts occupations in Howland are Management (30 | 7.5%), Health Diagnosing & Treating (20 | 5.0%), Health Technologists (20 | 5.0%), Community & Social Service (13 | 3.3%), and Computers, Engineering & Science (10 | 2.5%).
Management, Business, Science and Arts Occupations by Sex
Within the Management, Business, Science and Arts occupations in Howland, the most male-oriented occupations are Computers, Engineering & Science (100.0%), Computers & Mathematics (100.0%), and Arts, Media & Entertainment (100.0%), while the most female-oriented occupations are Business & Financial (100.0%), Health Diagnosing & Treating (100.0%), and Health Technologists (100.0%).
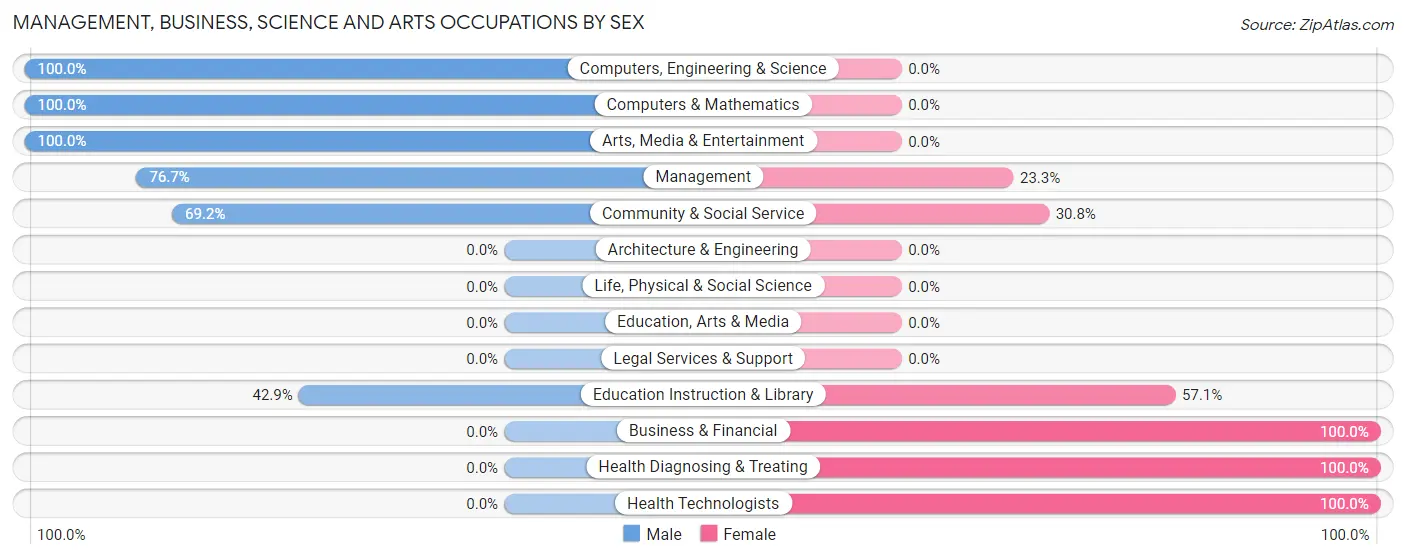
| Occupation | Male | Female |
| Management | 23 (76.7%) | 7 (23.3%) |
| Business & Financial | 0 (0.0%) | 4 (100.0%) |
| Computers, Engineering & Science | 10 (100.0%) | 0 (0.0%) |
| Computers & Mathematics | 10 (100.0%) | 0 (0.0%) |
| Architecture & Engineering | 0 (0.0%) | 0 (0.0%) |
| Life, Physical & Social Science | 0 (0.0%) | 0 (0.0%) |
| Community & Social Service | 9 (69.2%) | 4 (30.8%) |
| Education, Arts & Media | 0 (0.0%) | 0 (0.0%) |
| Legal Services & Support | 0 (0.0%) | 0 (0.0%) |
| Education Instruction & Library | 3 (42.9%) | 4 (57.1%) |
| Arts, Media & Entertainment | 6 (100.0%) | 0 (0.0%) |
| Health Diagnosing & Treating | 0 (0.0%) | 20 (100.0%) |
| Health Technologists | 0 (0.0%) | 20 (100.0%) |
| Total (Category) | 42 (54.5%) | 35 (45.5%) |
| Total (Overall) | 233 (58.5%) | 165 (41.5%) |
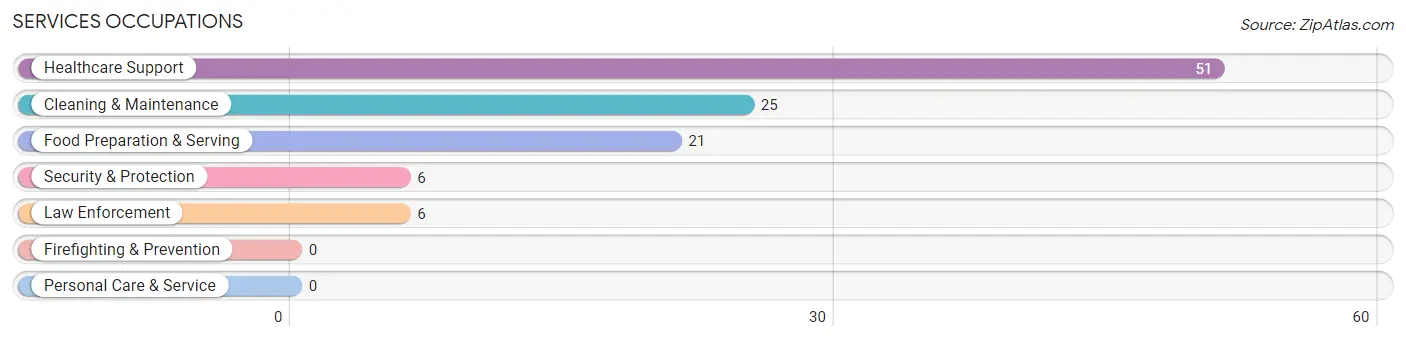
Services Occupations
The most common Services occupations in Howland are Healthcare Support (51 | 12.8%), Cleaning & Maintenance (25 | 6.3%), Food Preparation & Serving (21 | 5.3%), Security & Protection (6 | 1.5%), and Law Enforcement (6 | 1.5%).
Services Occupations by Sex
Within the Services occupations in Howland, the most male-oriented occupations are Security & Protection (100.0%), Law Enforcement (100.0%), and Food Preparation & Serving (80.9%), while the most female-oriented occupations are Healthcare Support (76.5%), Cleaning & Maintenance (52.0%), and Food Preparation & Serving (19.1%).
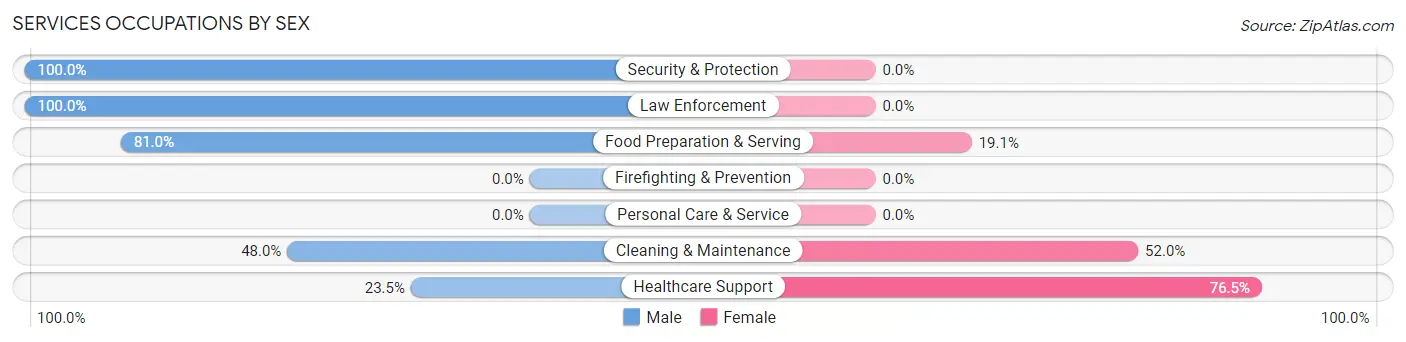
| Occupation | Male | Female |
| Healthcare Support | 12 (23.5%) | 39 (76.5%) |
| Security & Protection | 6 (100.0%) | 0 (0.0%) |
| Firefighting & Prevention | 0 (0.0%) | 0 (0.0%) |
| Law Enforcement | 6 (100.0%) | 0 (0.0%) |
| Food Preparation & Serving | 17 (80.9%) | 4 (19.1%) |
| Cleaning & Maintenance | 12 (48.0%) | 13 (52.0%) |
| Personal Care & Service | 0 (0.0%) | 0 (0.0%) |
| Total (Category) | 47 (45.6%) | 56 (54.4%) |
| Total (Overall) | 233 (58.5%) | 165 (41.5%) |
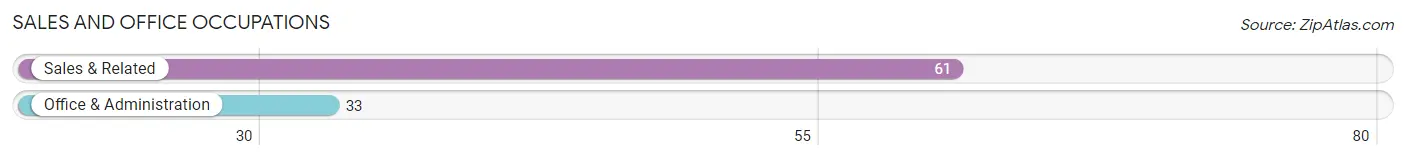
Sales and Office Occupations
The most common Sales and Office occupations in Howland are Sales & Related (61 | 15.3%), and Office & Administration (33 | 8.3%).
Sales and Office Occupations by Sex
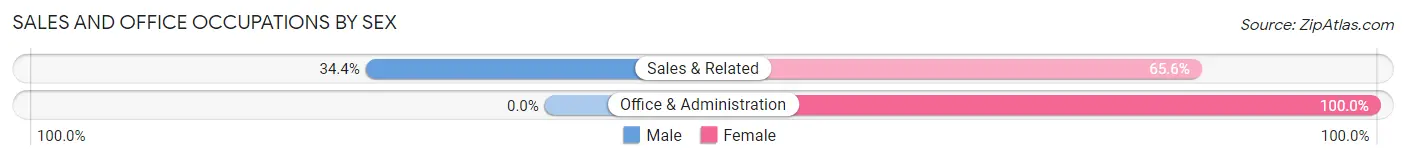
| Occupation | Male | Female |
| Sales & Related | 21 (34.4%) | 40 (65.6%) |
| Office & Administration | 0 (0.0%) | 33 (100.0%) |
| Total (Category) | 21 (22.3%) | 73 (77.7%) |
| Total (Overall) | 233 (58.5%) | 165 (41.5%) |
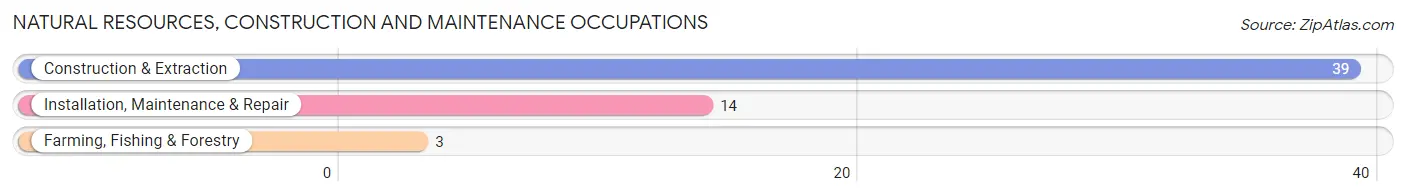
Natural Resources, Construction and Maintenance Occupations
The most common Natural Resources, Construction and Maintenance occupations in Howland are Construction & Extraction (39 | 9.8%), Installation, Maintenance & Repair (14 | 3.5%), and Farming, Fishing & Forestry (3 | 0.7%).
Natural Resources, Construction and Maintenance Occupations by Sex
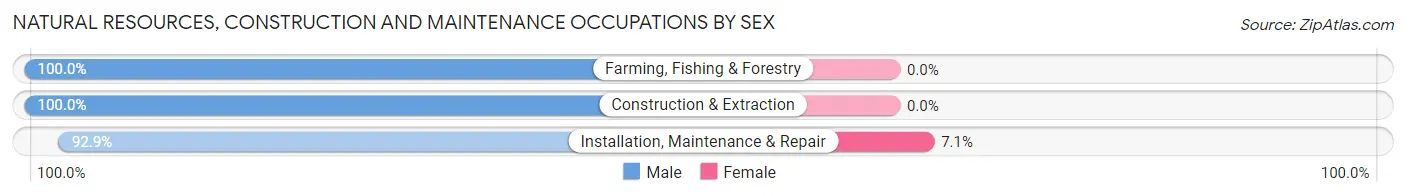
| Occupation | Male | Female |
| Farming, Fishing & Forestry | 3 (100.0%) | 0 (0.0%) |
| Construction & Extraction | 39 (100.0%) | 0 (0.0%) |
| Installation, Maintenance & Repair | 13 (92.9%) | 1 (7.1%) |
| Total (Category) | 55 (98.2%) | 1 (1.8%) |
| Total (Overall) | 233 (58.5%) | 165 (41.5%) |
Production, Transportation and Moving Occupations
The most common Production, Transportation and Moving occupations in Howland are Production (44 | 11.1%), Transportation (16 | 4.0%), and Material Moving (8 | 2.0%).
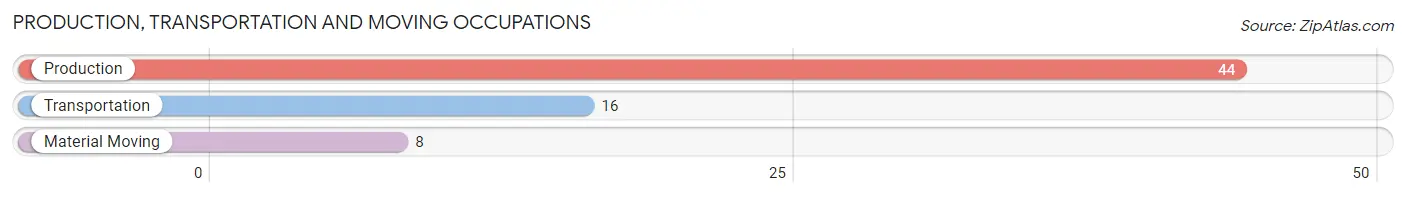
Production, Transportation and Moving Occupations by Sex
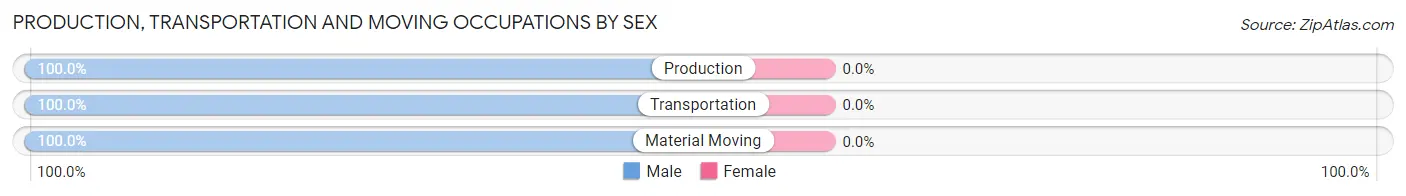
| Occupation | Male | Female |
| Production | 44 (100.0%) | 0 (0.0%) |
| Transportation | 16 (100.0%) | 0 (0.0%) |
| Material Moving | 8 (100.0%) | 0 (0.0%) |
| Total (Category) | 68 (100.0%) | 0 (0.0%) |
| Total (Overall) | 233 (58.5%) | 165 (41.5%) |
Employment Industries by Sex in Howland
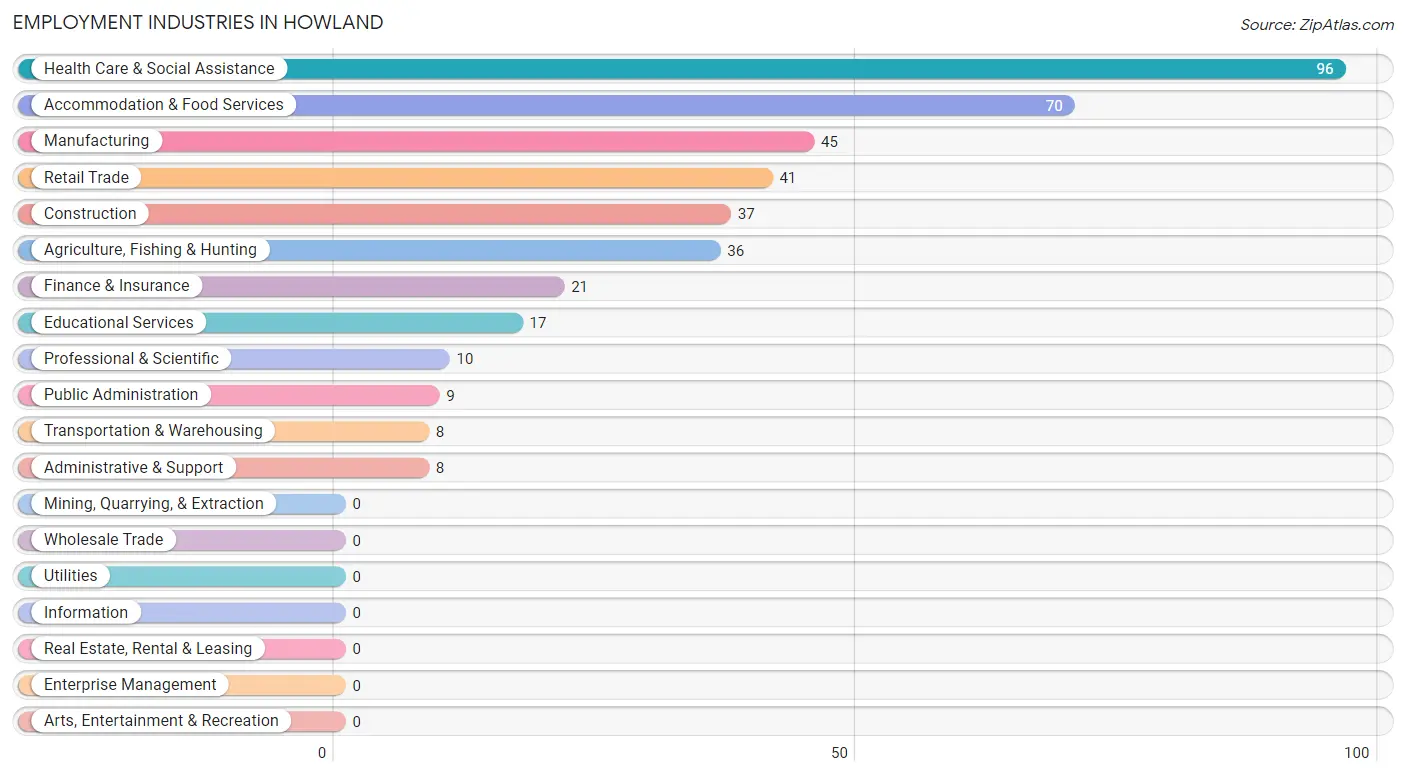
Employment Industries in Howland
The major employment industries in Howland include Health Care & Social Assistance (96 | 24.1%), Accommodation & Food Services (70 | 17.6%), Manufacturing (45 | 11.3%), Retail Trade (41 | 10.3%), and Construction (37 | 9.3%).
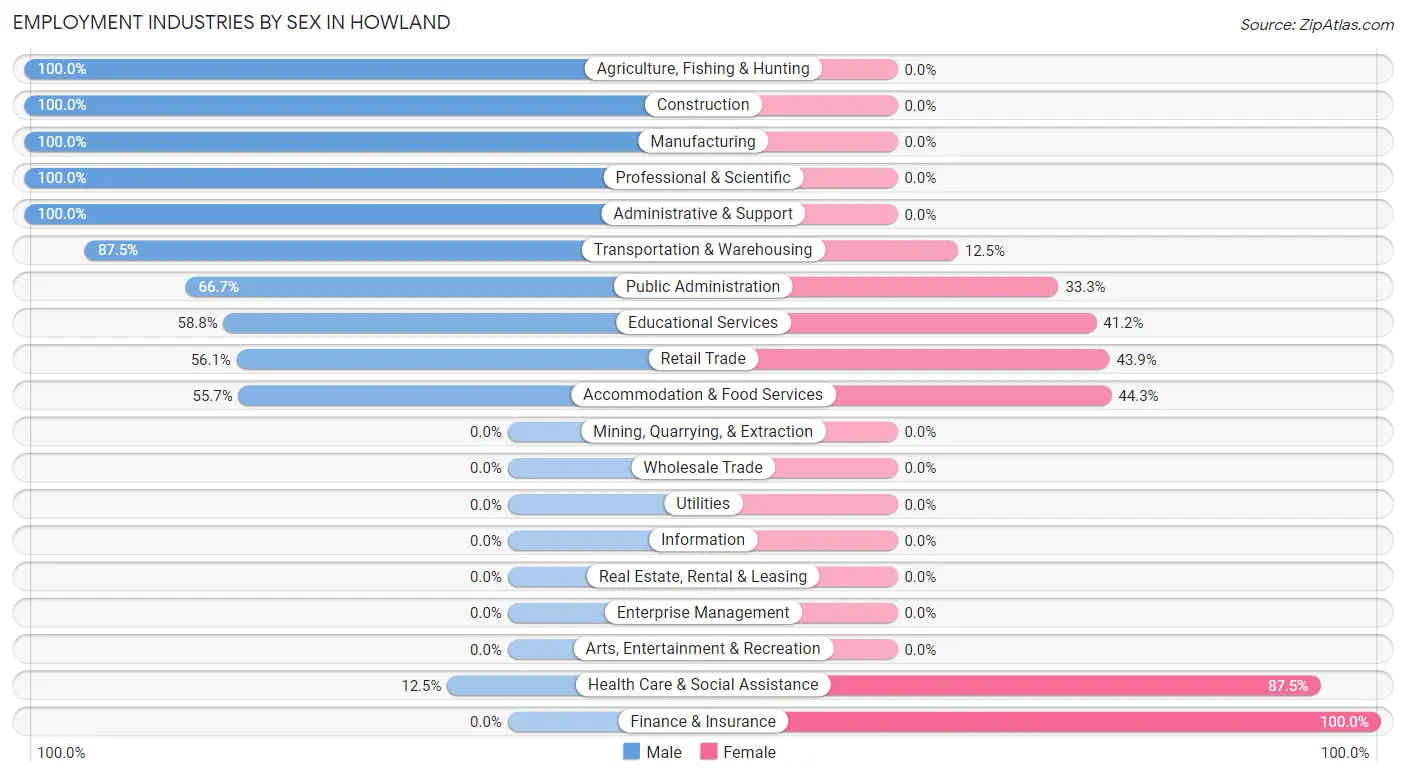
Employment Industries by Sex in Howland
The Howland industries that see more men than women are Agriculture, Fishing & Hunting (100.0%), Construction (100.0%), and Manufacturing (100.0%), whereas the industries that tend to have a higher number of women are Finance & Insurance (100.0%), Health Care & Social Assistance (87.5%), and Accommodation & Food Services (44.3%).
| Industry | Male | Female |
| Agriculture, Fishing & Hunting | 36 (100.0%) | 0 (0.0%) |
| Mining, Quarrying, & Extraction | 0 (0.0%) | 0 (0.0%) |
| Construction | 37 (100.0%) | 0 (0.0%) |
| Manufacturing | 45 (100.0%) | 0 (0.0%) |
| Wholesale Trade | 0 (0.0%) | 0 (0.0%) |
| Retail Trade | 23 (56.1%) | 18 (43.9%) |
| Transportation & Warehousing | 7 (87.5%) | 1 (12.5%) |
| Utilities | 0 (0.0%) | 0 (0.0%) |
| Information | 0 (0.0%) | 0 (0.0%) |
| Finance & Insurance | 0 (0.0%) | 21 (100.0%) |
| Real Estate, Rental & Leasing | 0 (0.0%) | 0 (0.0%) |
| Professional & Scientific | 10 (100.0%) | 0 (0.0%) |
| Enterprise Management | 0 (0.0%) | 0 (0.0%) |
| Administrative & Support | 8 (100.0%) | 0 (0.0%) |
| Educational Services | 10 (58.8%) | 7 (41.2%) |
| Health Care & Social Assistance | 12 (12.5%) | 84 (87.5%) |
| Arts, Entertainment & Recreation | 0 (0.0%) | 0 (0.0%) |
| Accommodation & Food Services | 39 (55.7%) | 31 (44.3%) |
| Public Administration | 6 (66.7%) | 3 (33.3%) |
| Total | 233 (58.5%) | 165 (41.5%) |
Education in Howland
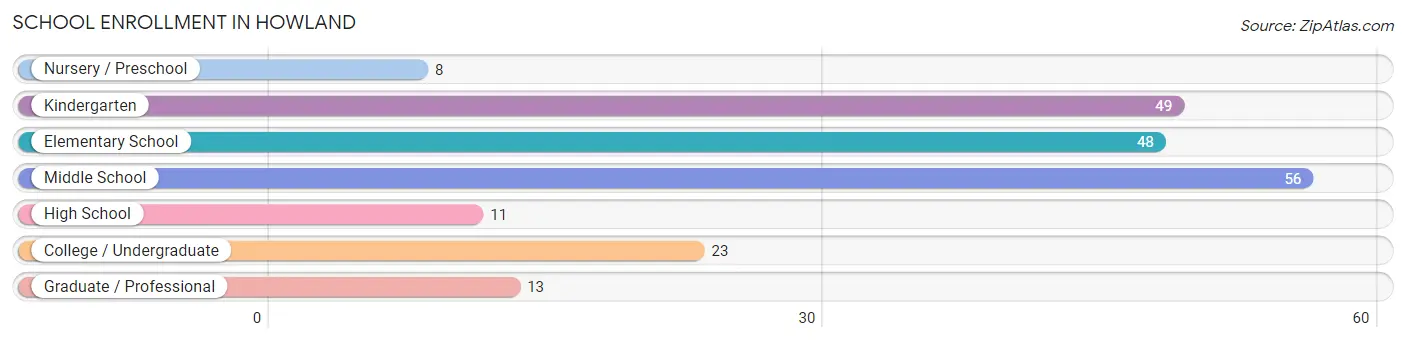
School Enrollment in Howland
The most common levels of schooling among the 208 students in Howland are middle school (56 | 26.9%), kindergarten (49 | 23.6%), and elementary school (48 | 23.1%).
| School Level | # Students | % Students |
| Nursery / Preschool | 8 | 3.8% |
| Kindergarten | 49 | 23.6% |
| Elementary School | 48 | 23.1% |
| Middle School | 56 | 26.9% |
| High School | 11 | 5.3% |
| College / Undergraduate | 23 | 11.1% |
| Graduate / Professional | 13 | 6.2% |
| Total | 208 | 100.0% |
School Enrollment by Age by Funding Source in Howland
Out of a total of 208 students who are enrolled in schools in Howland, 87 (41.8%) attend a private institution, while the remaining 121 (58.2%) are enrolled in public schools. The age group of 20 to 24 year olds has the highest likelihood of being enrolled in private schools, with 6 (100.0% in the age bracket) enrolled. Conversely, the age group of 15 to 17 year olds has the lowest likelihood of being enrolled in a private school, with 11 (100.0% in the age bracket) attending a public institution.
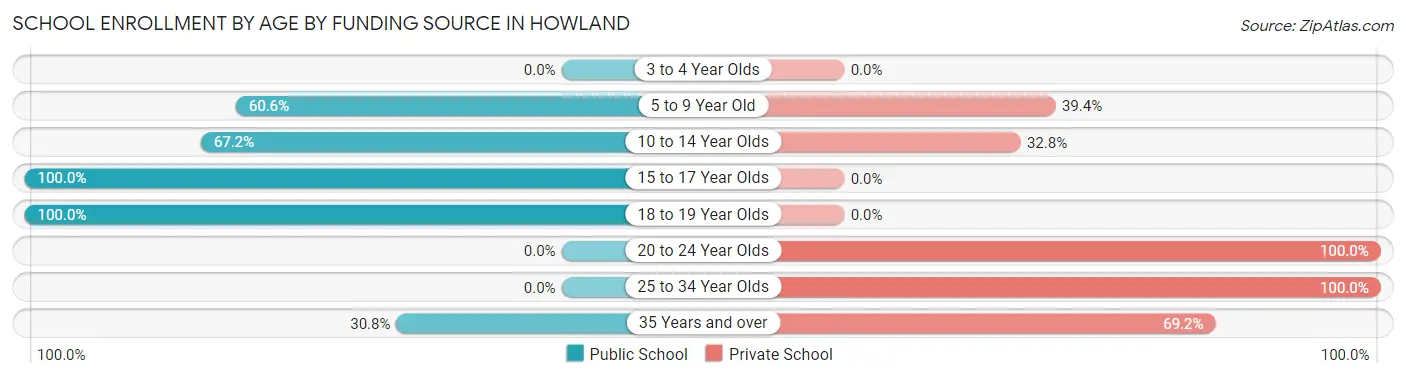
| Age Bracket | Public School | Private School |
| 3 to 4 Year Olds | 0 (0.0%) | 0 (0.0%) |
| 5 to 9 Year Old | 57 (60.6%) | 37 (39.4%) |
| 10 to 14 Year Olds | 45 (67.2%) | 22 (32.8%) |
| 15 to 17 Year Olds | 11 (100.0%) | 0 (0.0%) |
| 18 to 19 Year Olds | 4 (100.0%) | 0 (0.0%) |
| 20 to 24 Year Olds | 0 (0.0%) | 6 (100.0%) |
| 25 to 34 Year Olds | 0 (0.0%) | 13 (100.0%) |
| 35 Years and over | 4 (30.8%) | 9 (69.2%) |
| Total | 121 (58.2%) | 87 (41.8%) |
Educational Attainment by Field of Study in Howland
Business (26 | 33.8%), bio, nature & agricultural (16 | 20.8%), science & technology (13 | 16.9%), education (10 | 13.0%), and engineering (4 | 5.2%) are the most common fields of study among 77 individuals in Howland who have obtained a bachelor's degree or higher.
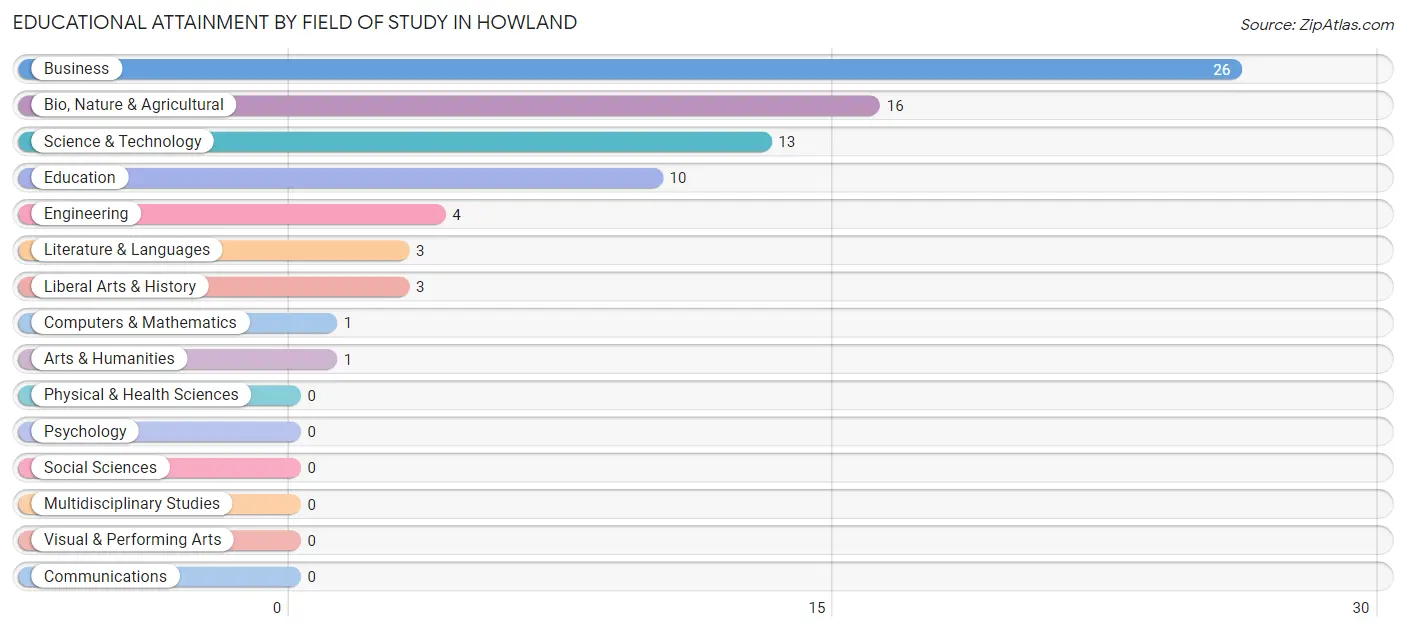
| Field of Study | # Graduates | % Graduates |
| Computers & Mathematics | 1 | 1.3% |
| Bio, Nature & Agricultural | 16 | 20.8% |
| Physical & Health Sciences | 0 | 0.0% |
| Psychology | 0 | 0.0% |
| Social Sciences | 0 | 0.0% |
| Engineering | 4 | 5.2% |
| Multidisciplinary Studies | 0 | 0.0% |
| Science & Technology | 13 | 16.9% |
| Business | 26 | 33.8% |
| Education | 10 | 13.0% |
| Literature & Languages | 3 | 3.9% |
| Liberal Arts & History | 3 | 3.9% |
| Visual & Performing Arts | 0 | 0.0% |
| Communications | 0 | 0.0% |
| Arts & Humanities | 1 | 1.3% |
| Total | 77 | 100.0% |
Transportation & Commute in Howland
Vehicle Availability by Sex in Howland
The most prevalent vehicle ownership categories in Howland are males with 2 vehicles (64, accounting for 30.0%) and females with 2 vehicles (61, making up 41.6%).
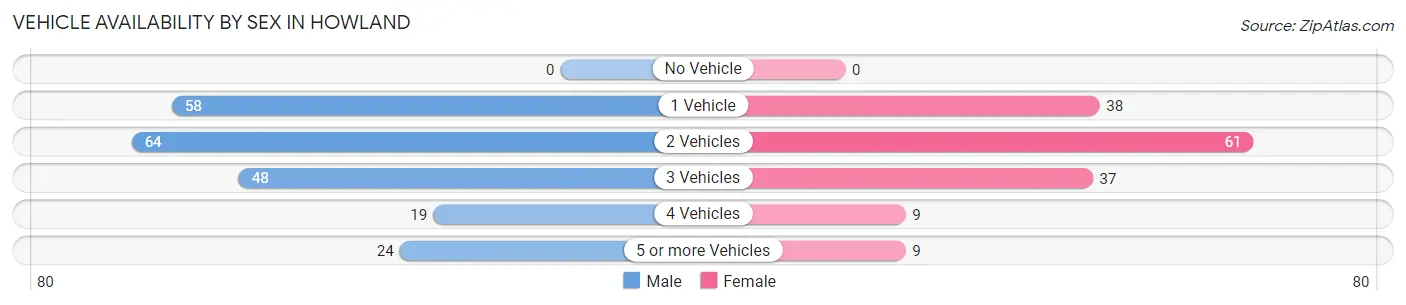
| Vehicles Available | Male | Female |
| No Vehicle | 0 (0.0%) | 0 (0.0%) |
| 1 Vehicle | 58 (27.2%) | 38 (24.7%) |
| 2 Vehicles | 64 (30.0%) | 61 (39.6%) |
| 3 Vehicles | 48 (22.5%) | 37 (24.0%) |
| 4 Vehicles | 19 (8.9%) | 9 (5.8%) |
| 5 or more Vehicles | 24 (11.3%) | 9 (5.8%) |
| Total | 213 (100.0%) | 154 (100.0%) |
Commute Time in Howland
The most frequently occuring commute durations in Howland are 30 to 34 minutes (84 commuters, 22.9%), 40 to 44 minutes (52 commuters, 14.2%), and 20 to 24 minutes (38 commuters, 10.3%).
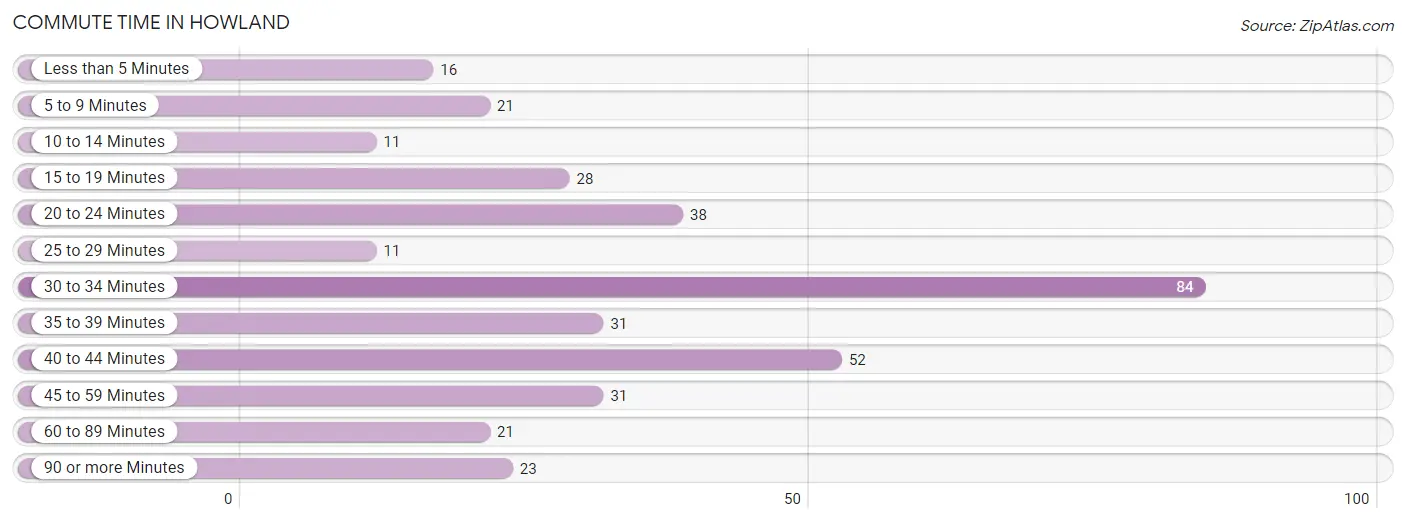
| Commute Time | # Commuters | % Commuters |
| Less than 5 Minutes | 16 | 4.4% |
| 5 to 9 Minutes | 21 | 5.7% |
| 10 to 14 Minutes | 11 | 3.0% |
| 15 to 19 Minutes | 28 | 7.6% |
| 20 to 24 Minutes | 38 | 10.3% |
| 25 to 29 Minutes | 11 | 3.0% |
| 30 to 34 Minutes | 84 | 22.9% |
| 35 to 39 Minutes | 31 | 8.5% |
| 40 to 44 Minutes | 52 | 14.2% |
| 45 to 59 Minutes | 31 | 8.5% |
| 60 to 89 Minutes | 21 | 5.7% |
| 90 or more Minutes | 23 | 6.3% |
Commute Time by Sex in Howland
The most common commute times in Howland are 30 to 34 minutes (63 commuters, 29.6%) for males and 40 to 44 minutes (23 commuters, 14.9%) for females.
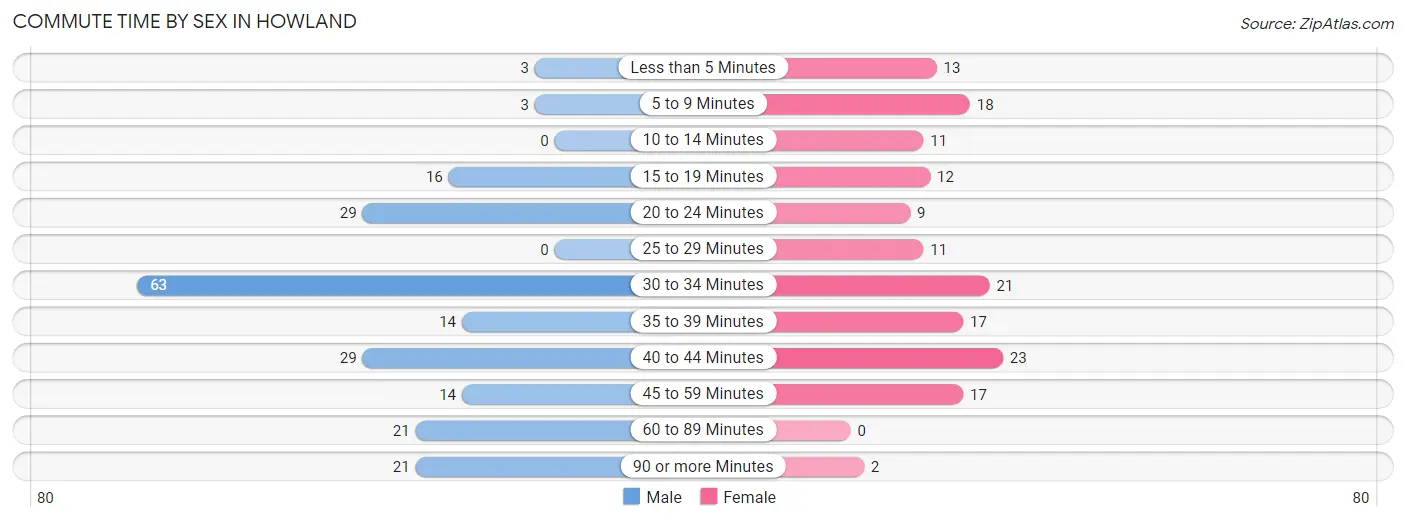
| Commute Time | Male | Female |
| Less than 5 Minutes | 3 (1.4%) | 13 (8.4%) |
| 5 to 9 Minutes | 3 (1.4%) | 18 (11.7%) |
| 10 to 14 Minutes | 0 (0.0%) | 11 (7.1%) |
| 15 to 19 Minutes | 16 (7.5%) | 12 (7.8%) |
| 20 to 24 Minutes | 29 (13.6%) | 9 (5.8%) |
| 25 to 29 Minutes | 0 (0.0%) | 11 (7.1%) |
| 30 to 34 Minutes | 63 (29.6%) | 21 (13.6%) |
| 35 to 39 Minutes | 14 (6.6%) | 17 (11.0%) |
| 40 to 44 Minutes | 29 (13.6%) | 23 (14.9%) |
| 45 to 59 Minutes | 14 (6.6%) | 17 (11.0%) |
| 60 to 89 Minutes | 21 (9.9%) | 0 (0.0%) |
| 90 or more Minutes | 21 (9.9%) | 2 (1.3%) |
Time of Departure to Work by Sex in Howland
The most frequent times of departure to work in Howland are 12:00 AM to 4:59 AM (55, 25.8%) for males and 6:30 AM to 6:59 AM (37, 24.0%) for females.
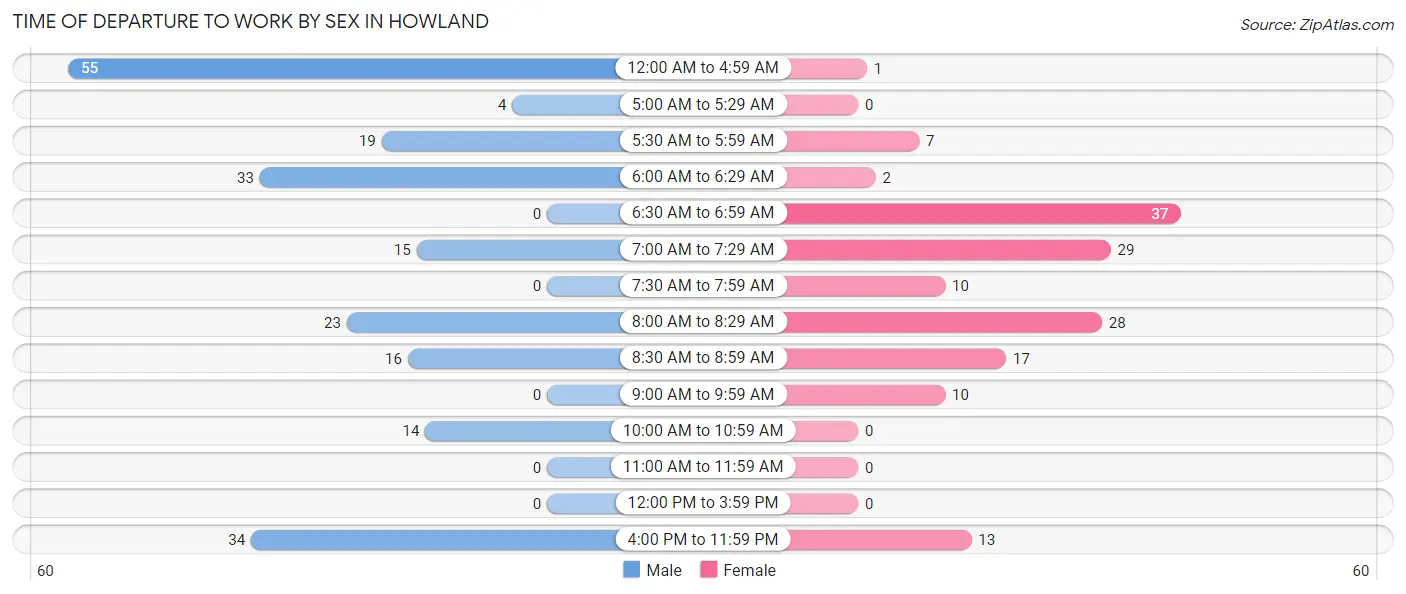
| Time of Departure | Male | Female |
| 12:00 AM to 4:59 AM | 55 (25.8%) | 1 (0.6%) |
| 5:00 AM to 5:29 AM | 4 (1.9%) | 0 (0.0%) |
| 5:30 AM to 5:59 AM | 19 (8.9%) | 7 (4.5%) |
| 6:00 AM to 6:29 AM | 33 (15.5%) | 2 (1.3%) |
| 6:30 AM to 6:59 AM | 0 (0.0%) | 37 (24.0%) |
| 7:00 AM to 7:29 AM | 15 (7.0%) | 29 (18.8%) |
| 7:30 AM to 7:59 AM | 0 (0.0%) | 10 (6.5%) |
| 8:00 AM to 8:29 AM | 23 (10.8%) | 28 (18.2%) |
| 8:30 AM to 8:59 AM | 16 (7.5%) | 17 (11.0%) |
| 9:00 AM to 9:59 AM | 0 (0.0%) | 10 (6.5%) |
| 10:00 AM to 10:59 AM | 14 (6.6%) | 0 (0.0%) |
| 11:00 AM to 11:59 AM | 0 (0.0%) | 0 (0.0%) |
| 12:00 PM to 3:59 PM | 0 (0.0%) | 0 (0.0%) |
| 4:00 PM to 11:59 PM | 34 (16.0%) | 13 (8.4%) |
| Total | 213 (100.0%) | 154 (100.0%) |
Housing Occupancy in Howland
Occupancy by Ownership in Howland
Of the total 449 dwellings in Howland, owner-occupied units account for 371 (82.6%), while renter-occupied units make up 78 (17.4%).
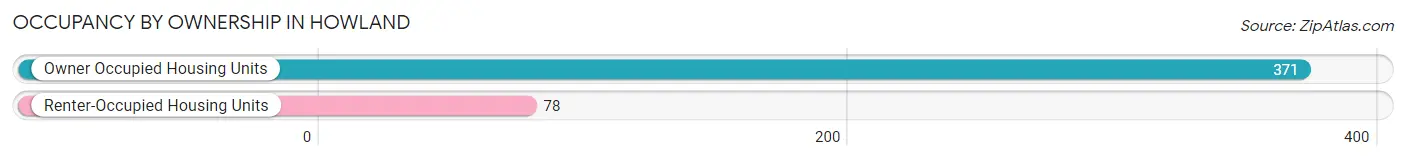
| Occupancy | # Housing Units | % Housing Units |
| Owner Occupied Housing Units | 371 | 82.6% |
| Renter-Occupied Housing Units | 78 | 17.4% |
| Total Occupied Housing Units | 449 | 100.0% |
Occupancy by Household Size in Howland
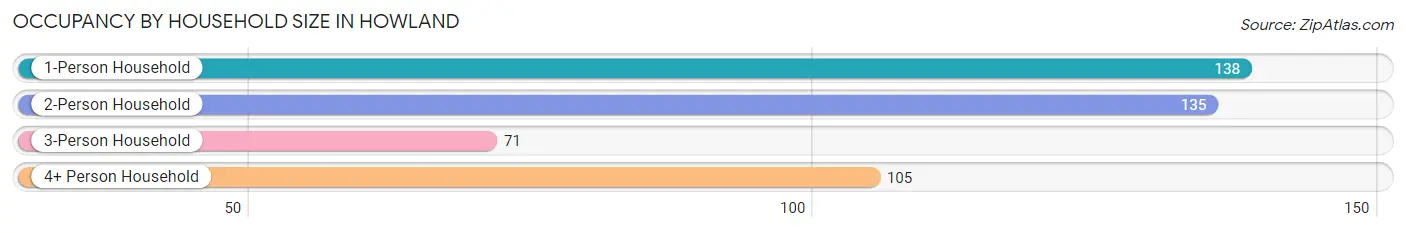
| Household Size | # Housing Units | % Housing Units |
| 1-Person Household | 138 | 30.7% |
| 2-Person Household | 135 | 30.1% |
| 3-Person Household | 71 | 15.8% |
| 4+ Person Household | 105 | 23.4% |
| Total Housing Units | 449 | 100.0% |
Occupancy by Ownership by Household Size in Howland
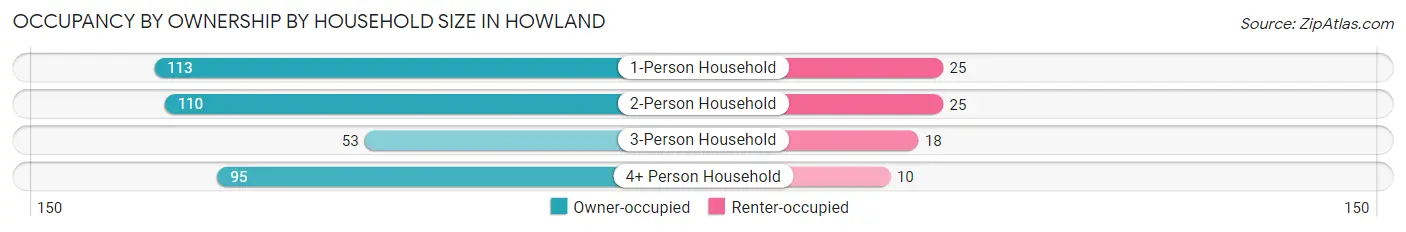
| Household Size | Owner-occupied | Renter-occupied |
| 1-Person Household | 113 (81.9%) | 25 (18.1%) |
| 2-Person Household | 110 (81.5%) | 25 (18.5%) |
| 3-Person Household | 53 (74.7%) | 18 (25.4%) |
| 4+ Person Household | 95 (90.5%) | 10 (9.5%) |
| Total Housing Units | 371 (82.6%) | 78 (17.4%) |
Occupancy by Educational Attainment in Howland
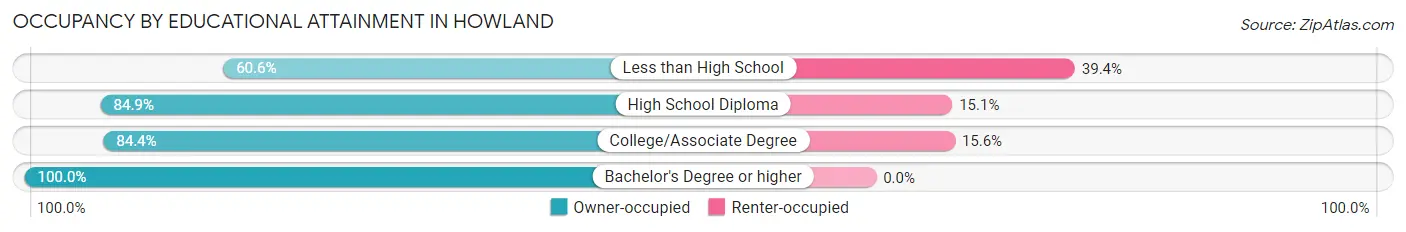
| Household Size | Owner-occupied | Renter-occupied |
| Less than High School | 40 (60.6%) | 26 (39.4%) |
| High School Diploma | 152 (84.9%) | 27 (15.1%) |
| College/Associate Degree | 135 (84.4%) | 25 (15.6%) |
| Bachelor's Degree or higher | 44 (100.0%) | 0 (0.0%) |
Occupancy by Age of Householder in Howland
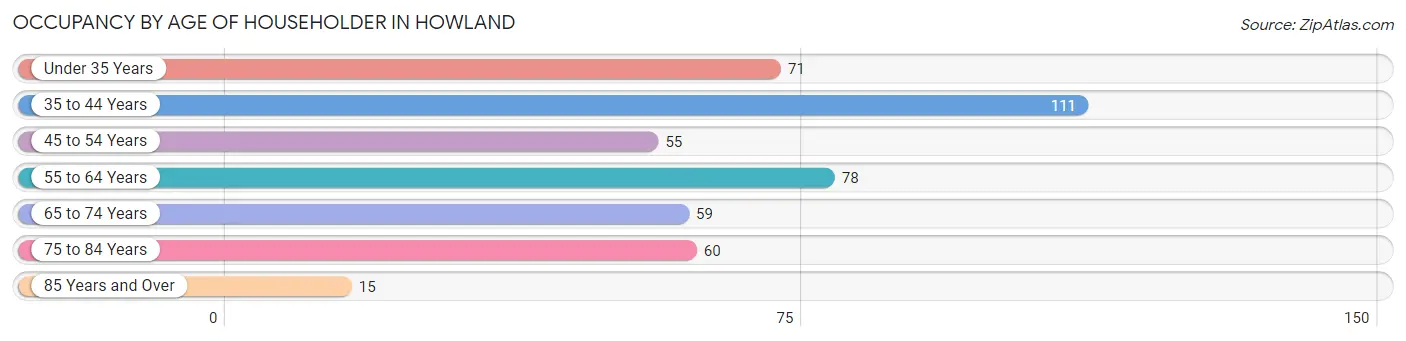
| Age Bracket | # Households | % Households |
| Under 35 Years | 71 | 15.8% |
| 35 to 44 Years | 111 | 24.7% |
| 45 to 54 Years | 55 | 12.2% |
| 55 to 64 Years | 78 | 17.4% |
| 65 to 74 Years | 59 | 13.1% |
| 75 to 84 Years | 60 | 13.4% |
| 85 Years and Over | 15 | 3.3% |
| Total | 449 | 100.0% |
Housing Finances in Howland
Median Income by Occupancy in Howland
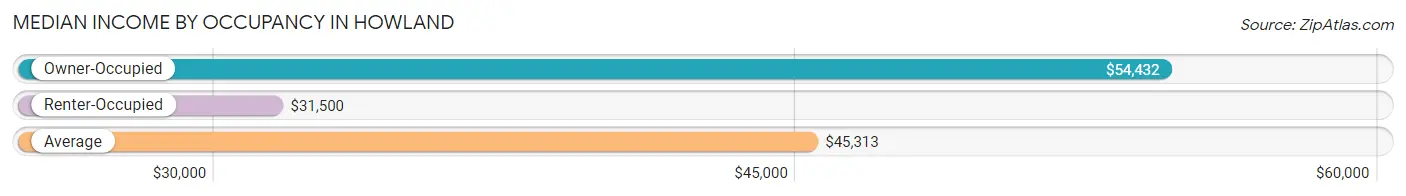
| Occupancy Type | # Households | Median Income |
| Owner-Occupied | 371 (82.6%) | $54,432 |
| Renter-Occupied | 78 (17.4%) | $31,500 |
| Average | 449 (100.0%) | $45,313 |
Occupancy by Householder Income Bracket in Howland
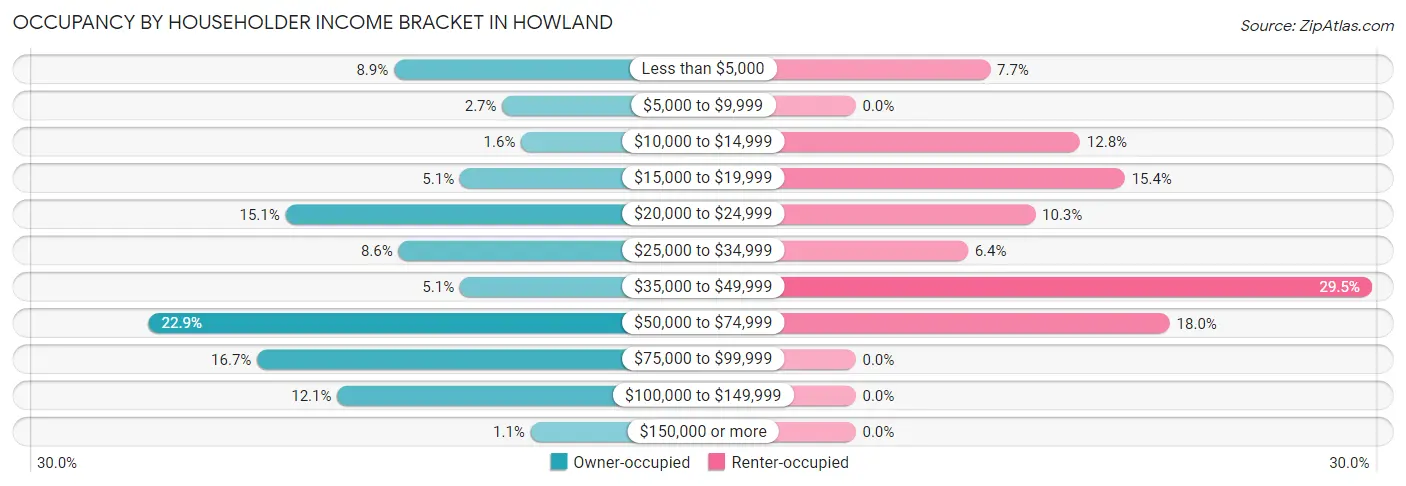
| Income Bracket | Owner-occupied | Renter-occupied |
| Less than $5,000 | 33 (8.9%) | 6 (7.7%) |
| $5,000 to $9,999 | 10 (2.7%) | 0 (0.0%) |
| $10,000 to $14,999 | 6 (1.6%) | 10 (12.8%) |
| $15,000 to $19,999 | 19 (5.1%) | 12 (15.4%) |
| $20,000 to $24,999 | 56 (15.1%) | 8 (10.3%) |
| $25,000 to $34,999 | 32 (8.6%) | 5 (6.4%) |
| $35,000 to $49,999 | 19 (5.1%) | 23 (29.5%) |
| $50,000 to $74,999 | 85 (22.9%) | 14 (17.9%) |
| $75,000 to $99,999 | 62 (16.7%) | 0 (0.0%) |
| $100,000 to $149,999 | 45 (12.1%) | 0 (0.0%) |
| $150,000 or more | 4 (1.1%) | 0 (0.0%) |
| Total | 371 (100.0%) | 78 (100.0%) |
Monthly Housing Cost Tiers in Howland
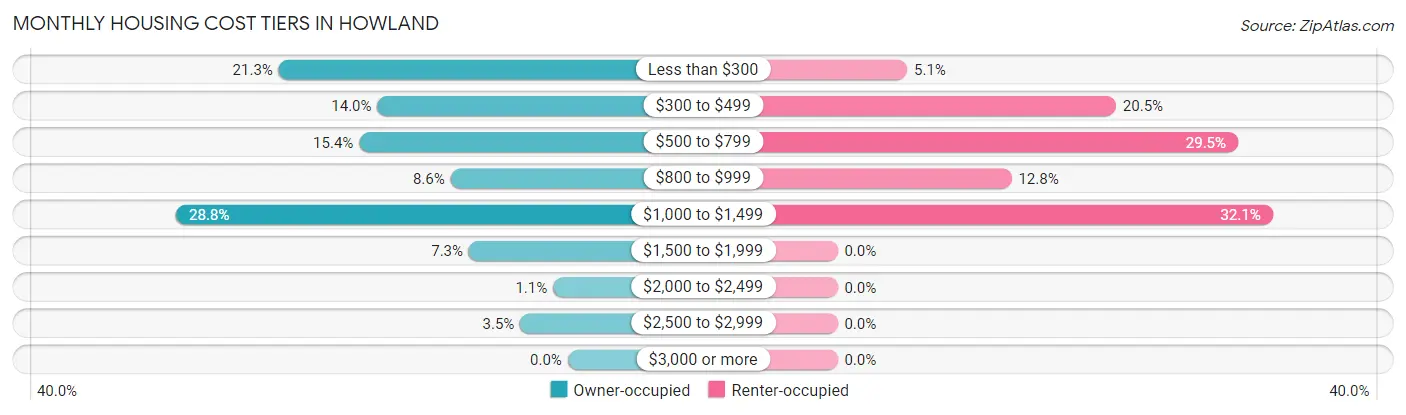
| Monthly Cost | Owner-occupied | Renter-occupied |
| Less than $300 | 79 (21.3%) | 4 (5.1%) |
| $300 to $499 | 52 (14.0%) | 16 (20.5%) |
| $500 to $799 | 57 (15.4%) | 23 (29.5%) |
| $800 to $999 | 32 (8.6%) | 10 (12.8%) |
| $1,000 to $1,499 | 107 (28.8%) | 25 (32.1%) |
| $1,500 to $1,999 | 27 (7.3%) | 0 (0.0%) |
| $2,000 to $2,499 | 4 (1.1%) | 0 (0.0%) |
| $2,500 to $2,999 | 13 (3.5%) | 0 (0.0%) |
| $3,000 or more | 0 (0.0%) | 0 (0.0%) |
| Total | 371 (100.0%) | 78 (100.0%) |
Physical Housing Characteristics in Howland
Housing Structures in Howland
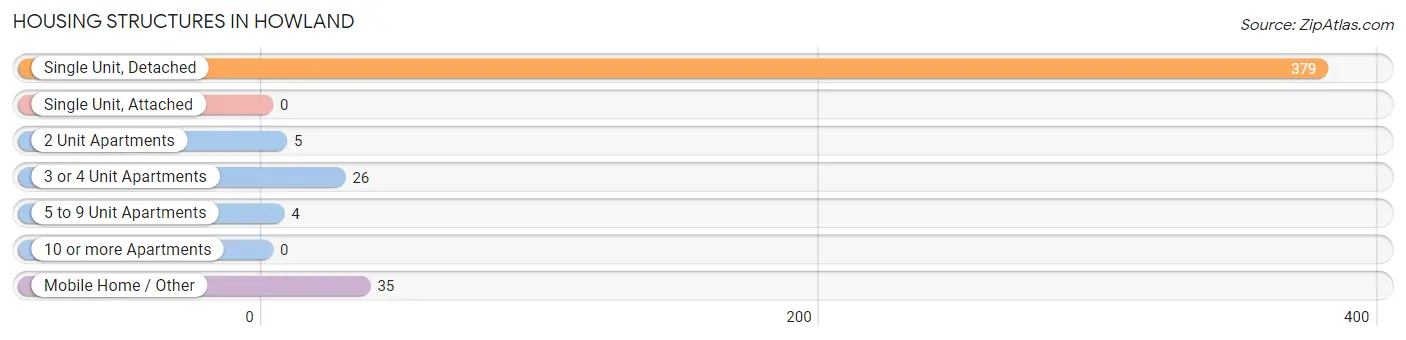
| Structure Type | # Housing Units | % Housing Units |
| Single Unit, Detached | 379 | 84.4% |
| Single Unit, Attached | 0 | 0.0% |
| 2 Unit Apartments | 5 | 1.1% |
| 3 or 4 Unit Apartments | 26 | 5.8% |
| 5 to 9 Unit Apartments | 4 | 0.9% |
| 10 or more Apartments | 0 | 0.0% |
| Mobile Home / Other | 35 | 7.8% |
| Total | 449 | 100.0% |
Housing Structures by Occupancy in Howland
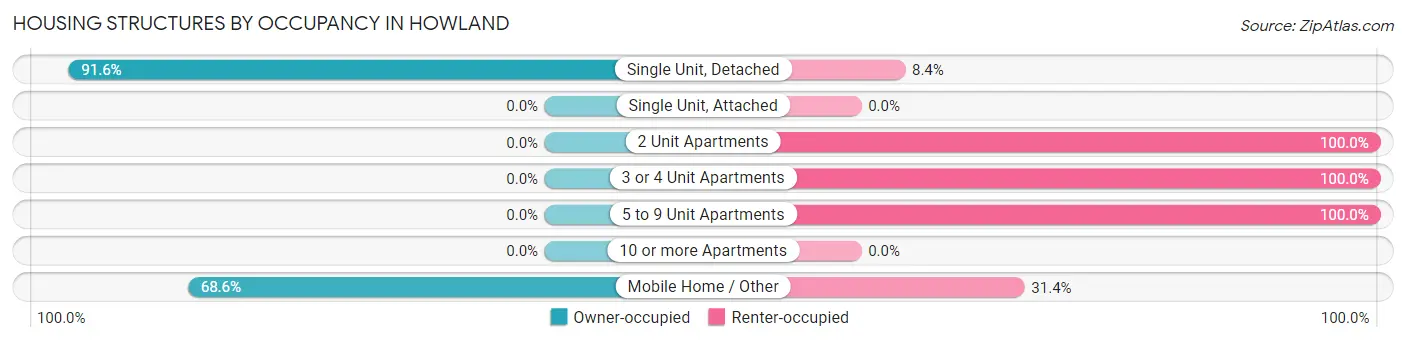
| Structure Type | Owner-occupied | Renter-occupied |
| Single Unit, Detached | 347 (91.6%) | 32 (8.4%) |
| Single Unit, Attached | 0 (0.0%) | 0 (0.0%) |
| 2 Unit Apartments | 0 (0.0%) | 5 (100.0%) |
| 3 or 4 Unit Apartments | 0 (0.0%) | 26 (100.0%) |
| 5 to 9 Unit Apartments | 0 (0.0%) | 4 (100.0%) |
| 10 or more Apartments | 0 (0.0%) | 0 (0.0%) |
| Mobile Home / Other | 24 (68.6%) | 11 (31.4%) |
| Total | 371 (82.6%) | 78 (17.4%) |
Housing Structures by Number of Rooms in Howland
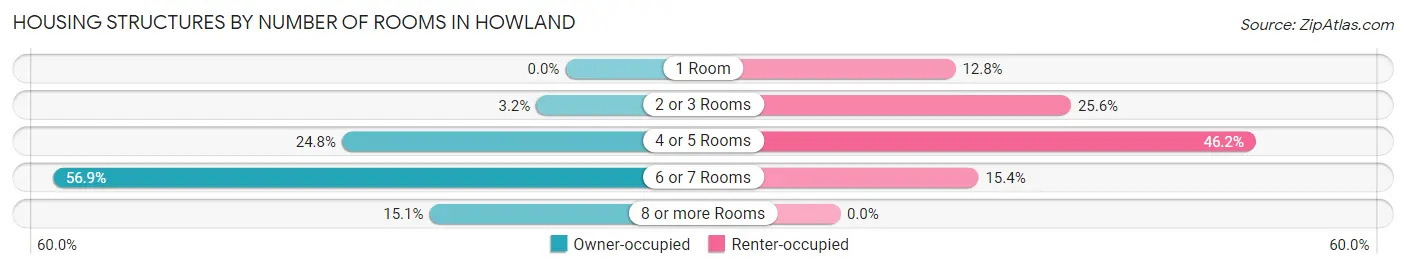
| Number of Rooms | Owner-occupied | Renter-occupied |
| 1 Room | 0 (0.0%) | 10 (12.8%) |
| 2 or 3 Rooms | 12 (3.2%) | 20 (25.6%) |
| 4 or 5 Rooms | 92 (24.8%) | 36 (46.2%) |
| 6 or 7 Rooms | 211 (56.9%) | 12 (15.4%) |
| 8 or more Rooms | 56 (15.1%) | 0 (0.0%) |
| Total | 371 (100.0%) | 78 (100.0%) |
Housing Structure by Heating Type in Howland
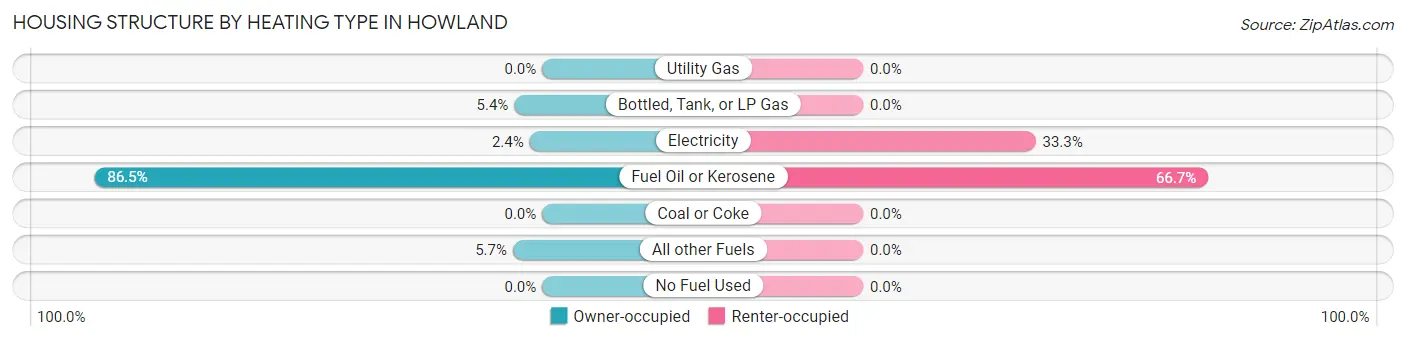
| Heating Type | Owner-occupied | Renter-occupied |
| Utility Gas | 0 (0.0%) | 0 (0.0%) |
| Bottled, Tank, or LP Gas | 20 (5.4%) | 0 (0.0%) |
| Electricity | 9 (2.4%) | 26 (33.3%) |
| Fuel Oil or Kerosene | 321 (86.5%) | 52 (66.7%) |
| Coal or Coke | 0 (0.0%) | 0 (0.0%) |
| All other Fuels | 21 (5.7%) | 0 (0.0%) |
| No Fuel Used | 0 (0.0%) | 0 (0.0%) |
| Total | 371 (100.0%) | 78 (100.0%) |
Household Vehicle Usage in Howland
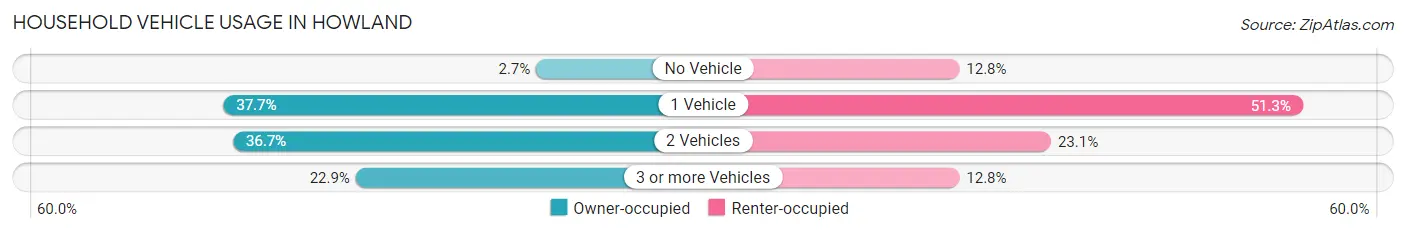
| Vehicles per Household | Owner-occupied | Renter-occupied |
| No Vehicle | 10 (2.7%) | 10 (12.8%) |
| 1 Vehicle | 140 (37.7%) | 40 (51.3%) |
| 2 Vehicles | 136 (36.7%) | 18 (23.1%) |
| 3 or more Vehicles | 85 (22.9%) | 10 (12.8%) |
| Total | 371 (100.0%) | 78 (100.0%) |
Real Estate & Mortgages in Howland
Real Estate and Mortgage Overview in Howland
| Characteristic | Without Mortgage | With Mortgage |
| Housing Units | 189 | 182 |
| Median Property Value | $85,400 | $135,000 |
| Median Household Income | $23,011 | $0 |
| Monthly Housing Costs | $384 | $0 |
| Real Estate Taxes | $1,257 | $0 |
Property Value by Mortgage Status in Howland
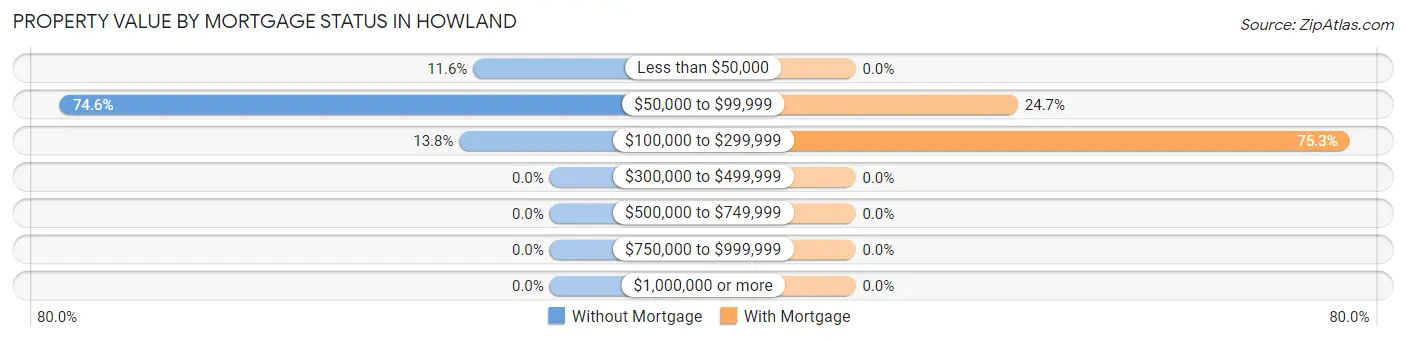
| Property Value | Without Mortgage | With Mortgage |
| Less than $50,000 | 22 (11.6%) | 0 (0.0%) |
| $50,000 to $99,999 | 141 (74.6%) | 45 (24.7%) |
| $100,000 to $299,999 | 26 (13.8%) | 137 (75.3%) |
| $300,000 to $499,999 | 0 (0.0%) | 0 (0.0%) |
| $500,000 to $749,999 | 0 (0.0%) | 0 (0.0%) |
| $750,000 to $999,999 | 0 (0.0%) | 0 (0.0%) |
| $1,000,000 or more | 0 (0.0%) | 0 (0.0%) |
| Total | 189 (100.0%) | 182 (100.0%) |
Household Income by Mortgage Status in Howland
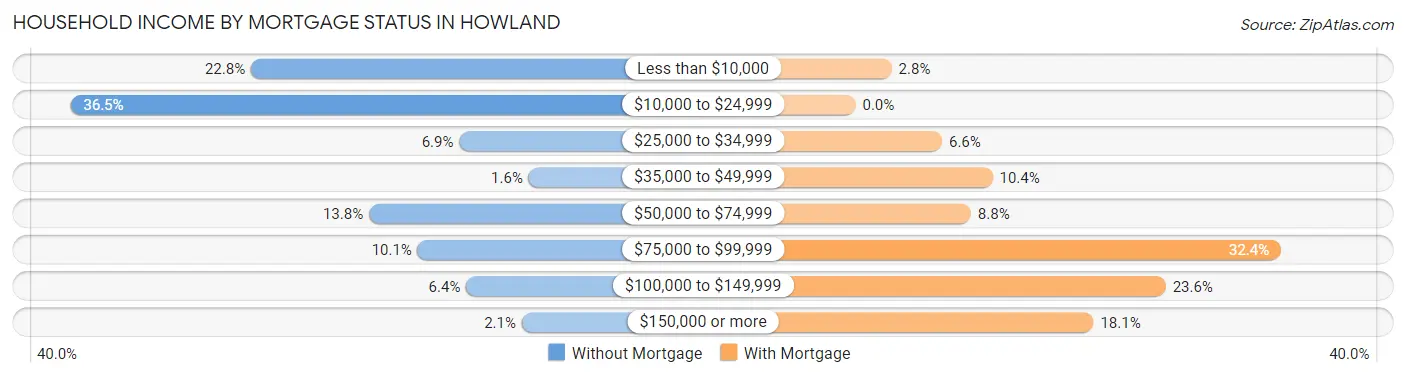
| Household Income | Without Mortgage | With Mortgage |
| Less than $10,000 | 43 (22.8%) | 5 (2.8%) |
| $10,000 to $24,999 | 69 (36.5%) | 0 (0.0%) |
| $25,000 to $34,999 | 13 (6.9%) | 12 (6.6%) |
| $35,000 to $49,999 | 3 (1.6%) | 19 (10.4%) |
| $50,000 to $74,999 | 26 (13.8%) | 16 (8.8%) |
| $75,000 to $99,999 | 19 (10.1%) | 59 (32.4%) |
| $100,000 to $149,999 | 12 (6.4%) | 43 (23.6%) |
| $150,000 or more | 4 (2.1%) | 33 (18.1%) |
| Total | 189 (100.0%) | 182 (100.0%) |
Property Value to Household Income Ratio in Howland
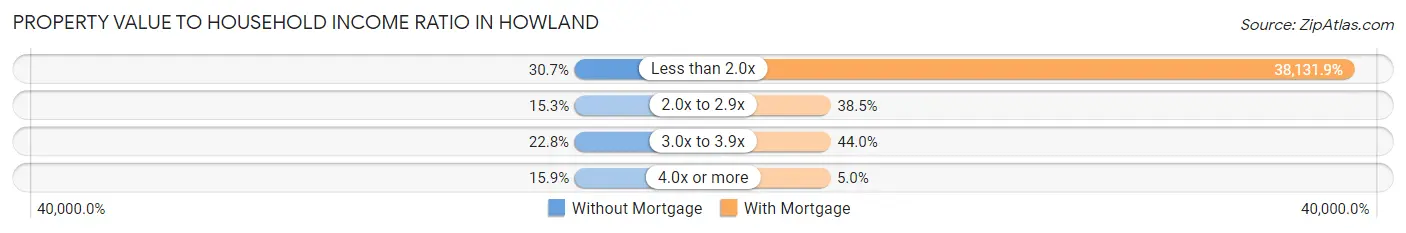
| Value-to-Income Ratio | Without Mortgage | With Mortgage |
| Less than 2.0x | 58 (30.7%) | 69,400 (38,131.9%) |
| 2.0x to 2.9x | 29 (15.3%) | 70 (38.5%) |
| 3.0x to 3.9x | 43 (22.8%) | 80 (44.0%) |
| 4.0x or more | 30 (15.9%) | 9 (5.0%) |
| Total | 189 (100.0%) | 182 (100.0%) |
Real Estate Taxes by Mortgage Status in Howland
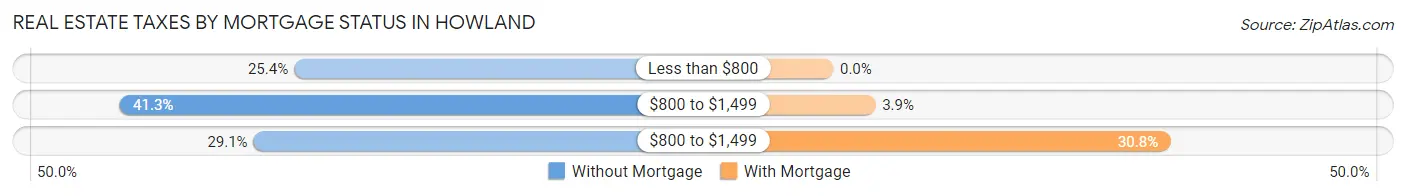
| Property Taxes | Without Mortgage | With Mortgage |
| Less than $800 | 48 (25.4%) | 0 (0.0%) |
| $800 to $1,499 | 78 (41.3%) | 7 (3.8%) |
| $800 to $1,499 | 55 (29.1%) | 56 (30.8%) |
| Total | 189 (100.0%) | 182 (100.0%) |
Health & Disability in Howland
Health Insurance Coverage by Age in Howland
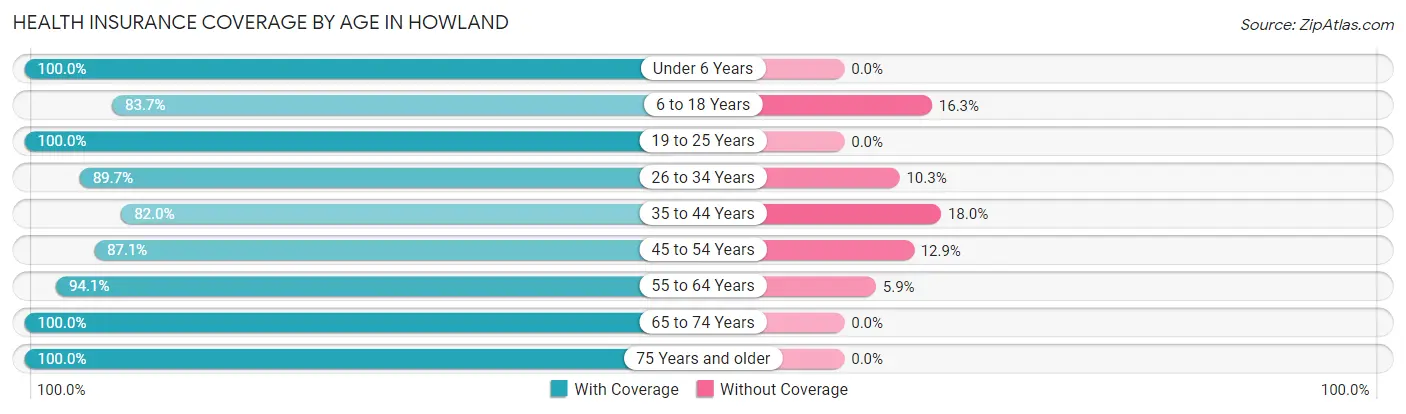
| Age Bracket | With Coverage | Without Coverage |
| Under 6 Years | 67 (100.0%) | 0 (0.0%) |
| 6 to 18 Years | 164 (83.7%) | 32 (16.3%) |
| 19 to 25 Years | 45 (100.0%) | 0 (0.0%) |
| 26 to 34 Years | 122 (89.7%) | 14 (10.3%) |
| 35 to 44 Years | 150 (82.0%) | 33 (18.0%) |
| 45 to 54 Years | 74 (87.1%) | 11 (12.9%) |
| 55 to 64 Years | 176 (94.1%) | 11 (5.9%) |
| 65 to 74 Years | 82 (100.0%) | 0 (0.0%) |
| 75 Years and older | 96 (100.0%) | 0 (0.0%) |
| Total | 976 (90.6%) | 101 (9.4%) |
Health Insurance Coverage by Citizenship Status in Howland
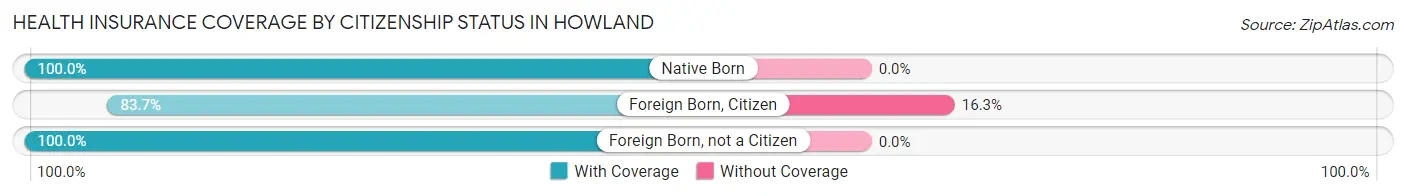
| Citizenship Status | With Coverage | Without Coverage |
| Native Born | 67 (100.0%) | 0 (0.0%) |
| Foreign Born, Citizen | 164 (83.7%) | 32 (16.3%) |
| Foreign Born, not a Citizen | 45 (100.0%) | 0 (0.0%) |
Health Insurance Coverage by Household Income in Howland
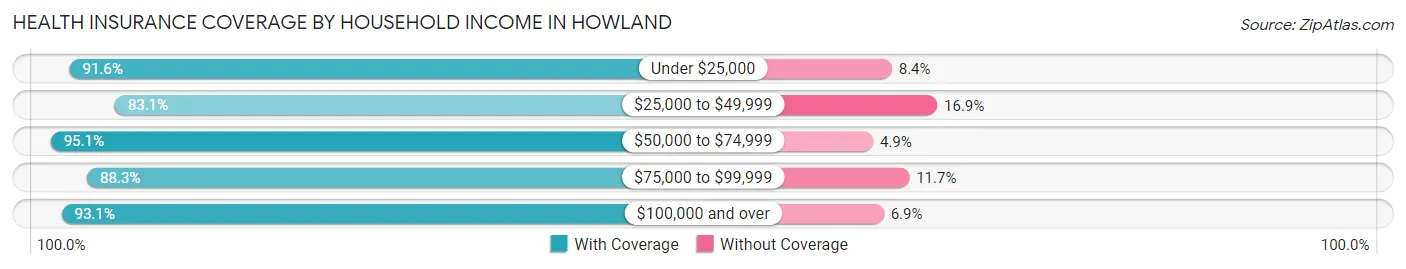
| Household Income | With Coverage | Without Coverage |
| Under $25,000 | 228 (91.6%) | 21 (8.4%) |
| $25,000 to $49,999 | 162 (83.1%) | 33 (16.9%) |
| $50,000 to $74,999 | 272 (95.1%) | 14 (4.9%) |
| $75,000 to $99,999 | 166 (88.3%) | 22 (11.7%) |
| $100,000 and over | 148 (93.1%) | 11 (6.9%) |
Public vs Private Health Insurance Coverage by Age in Howland
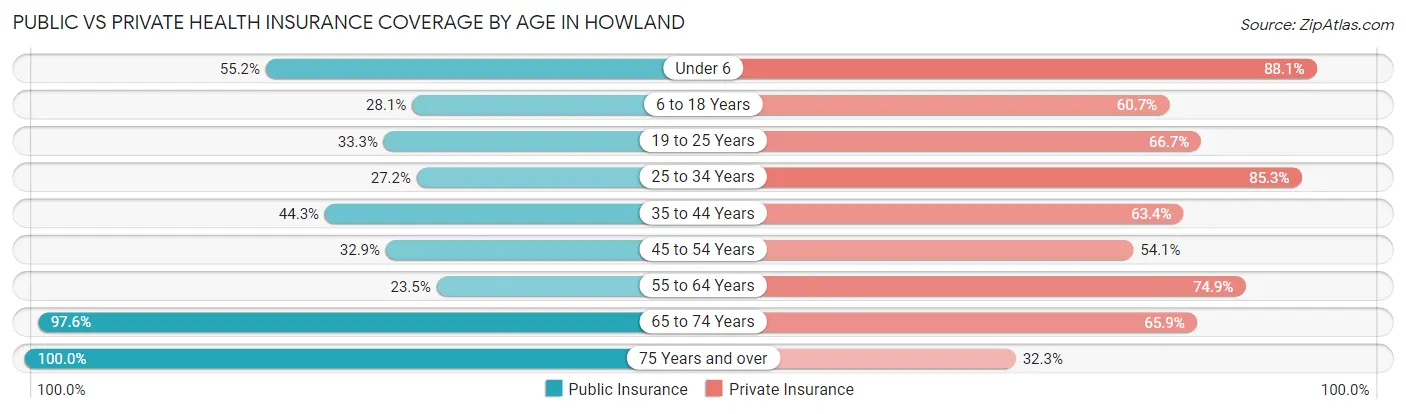
| Age Bracket | Public Insurance | Private Insurance |
| Under 6 | 37 (55.2%) | 59 (88.1%) |
| 6 to 18 Years | 55 (28.1%) | 119 (60.7%) |
| 19 to 25 Years | 15 (33.3%) | 30 (66.7%) |
| 25 to 34 Years | 37 (27.2%) | 116 (85.3%) |
| 35 to 44 Years | 81 (44.3%) | 116 (63.4%) |
| 45 to 54 Years | 28 (32.9%) | 46 (54.1%) |
| 55 to 64 Years | 44 (23.5%) | 140 (74.9%) |
| 65 to 74 Years | 80 (97.6%) | 54 (65.8%) |
| 75 Years and over | 96 (100.0%) | 31 (32.3%) |
| Total | 473 (43.9%) | 711 (66.0%) |
Disability Status by Sex by Age in Howland
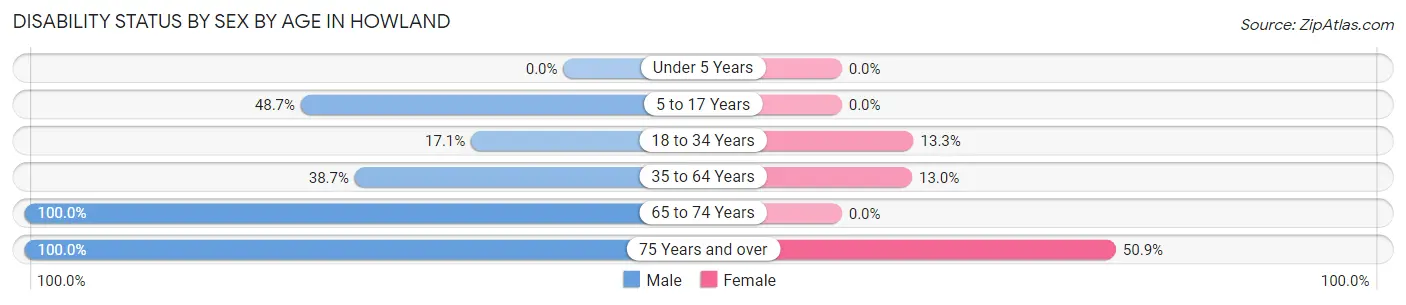
| Age Bracket | Male | Female |
| Under 5 Years | 0 (0.0%) | 0 (0.0%) |
| 5 to 17 Years | 38 (48.7%) | 0 (0.0%) |
| 18 to 34 Years | 19 (17.1%) | 12 (13.3%) |
| 35 to 64 Years | 96 (38.7%) | 27 (13.0%) |
| 65 to 74 Years | 35 (100.0%) | 0 (0.0%) |
| 75 Years and over | 39 (100.0%) | 29 (50.9%) |
Disability Class by Sex by Age in Howland
Disability Class: Hearing Difficulty
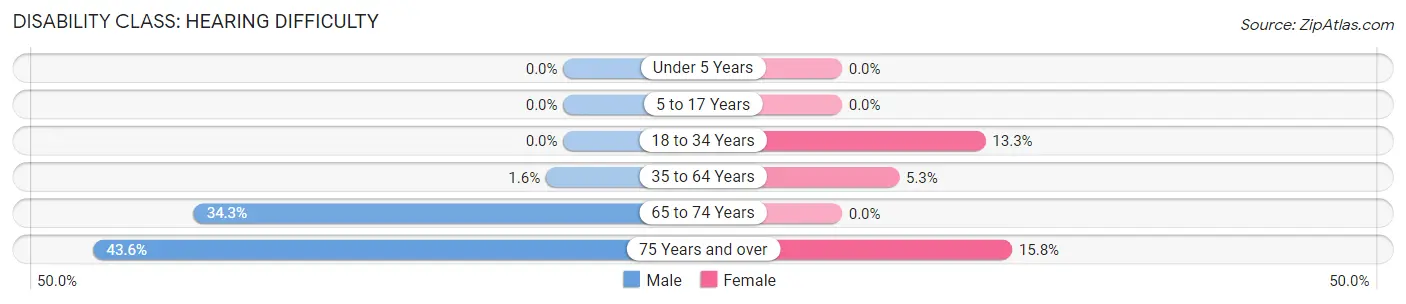
| Age Bracket | Male | Female |
| Under 5 Years | 0 (0.0%) | 0 (0.0%) |
| 5 to 17 Years | 0 (0.0%) | 0 (0.0%) |
| 18 to 34 Years | 0 (0.0%) | 12 (13.3%) |
| 35 to 64 Years | 4 (1.6%) | 11 (5.3%) |
| 65 to 74 Years | 12 (34.3%) | 0 (0.0%) |
| 75 Years and over | 17 (43.6%) | 9 (15.8%) |
Disability Class: Vision Difficulty
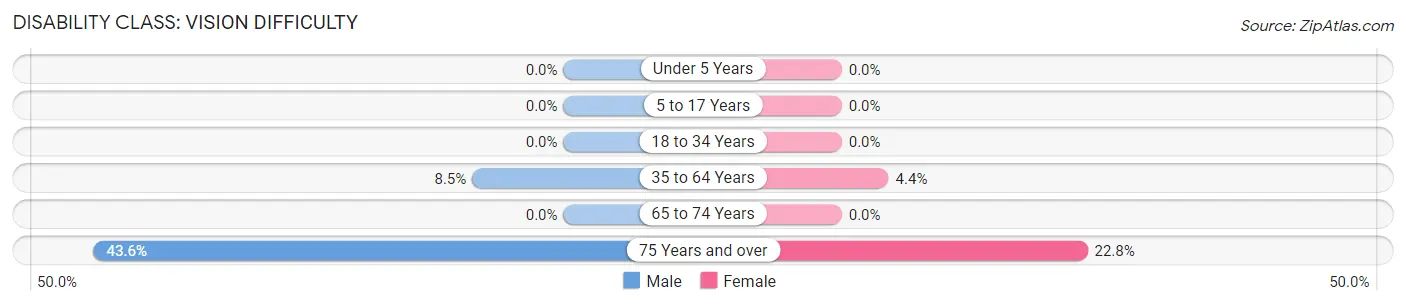
| Age Bracket | Male | Female |
| Under 5 Years | 0 (0.0%) | 0 (0.0%) |
| 5 to 17 Years | 0 (0.0%) | 0 (0.0%) |
| 18 to 34 Years | 0 (0.0%) | 0 (0.0%) |
| 35 to 64 Years | 21 (8.5%) | 9 (4.3%) |
| 65 to 74 Years | 0 (0.0%) | 0 (0.0%) |
| 75 Years and over | 17 (43.6%) | 13 (22.8%) |
Disability Class: Cognitive Difficulty
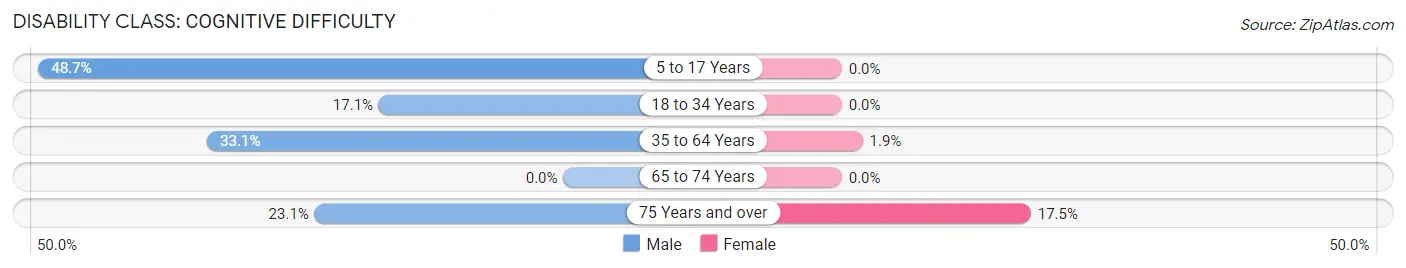
| Age Bracket | Male | Female |
| 5 to 17 Years | 38 (48.7%) | 0 (0.0%) |
| 18 to 34 Years | 19 (17.1%) | 0 (0.0%) |
| 35 to 64 Years | 82 (33.1%) | 4 (1.9%) |
| 65 to 74 Years | 0 (0.0%) | 0 (0.0%) |
| 75 Years and over | 9 (23.1%) | 10 (17.5%) |
Disability Class: Ambulatory Difficulty
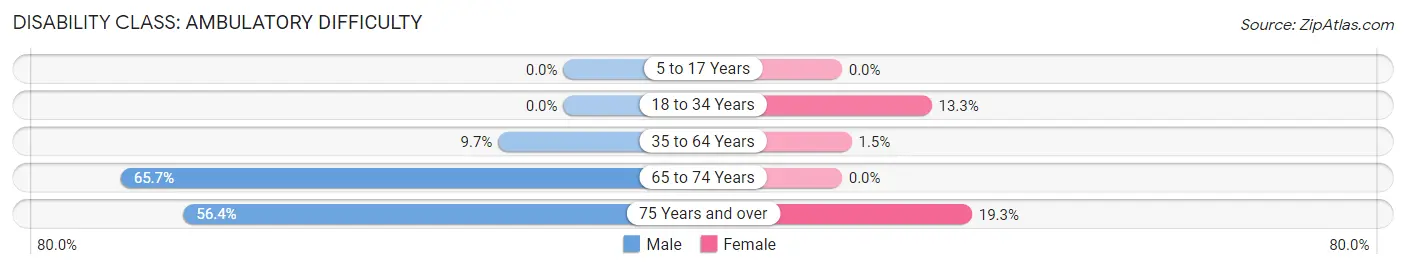
| Age Bracket | Male | Female |
| 5 to 17 Years | 0 (0.0%) | 0 (0.0%) |
| 18 to 34 Years | 0 (0.0%) | 12 (13.3%) |
| 35 to 64 Years | 24 (9.7%) | 3 (1.5%) |
| 65 to 74 Years | 23 (65.7%) | 0 (0.0%) |
| 75 Years and over | 22 (56.4%) | 11 (19.3%) |
Disability Class: Self-Care Difficulty
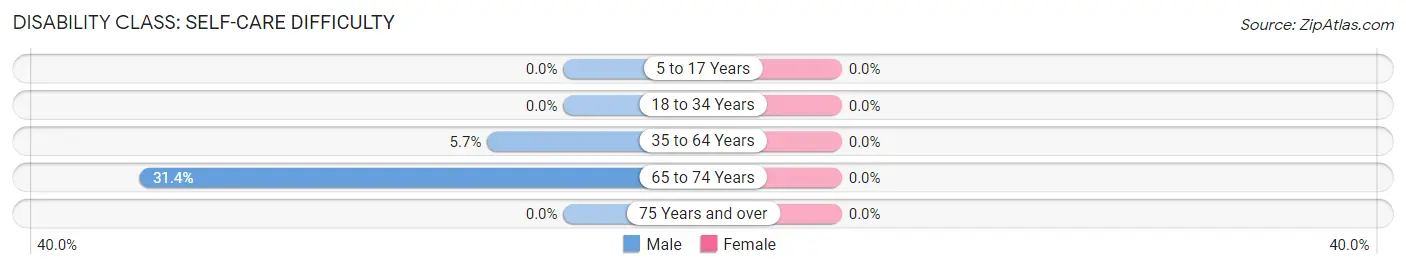
| Age Bracket | Male | Female |
| 5 to 17 Years | 0 (0.0%) | 0 (0.0%) |
| 18 to 34 Years | 0 (0.0%) | 0 (0.0%) |
| 35 to 64 Years | 14 (5.7%) | 0 (0.0%) |
| 65 to 74 Years | 11 (31.4%) | 0 (0.0%) |
| 75 Years and over | 0 (0.0%) | 0 (0.0%) |
Technology Access in Howland
Computing Device Access in Howland
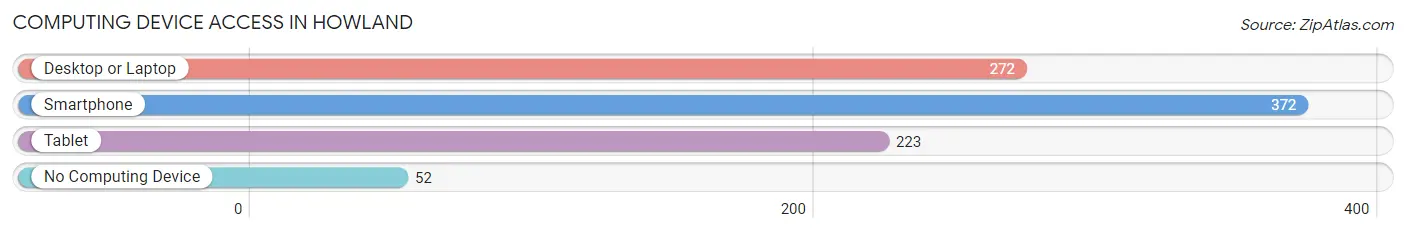
| Device Type | # Households | % Households |
| Desktop or Laptop | 272 | 60.6% |
| Smartphone | 372 | 82.9% |
| Tablet | 223 | 49.7% |
| No Computing Device | 52 | 11.6% |
| Total | 449 | 100.0% |
Internet Access in Howland
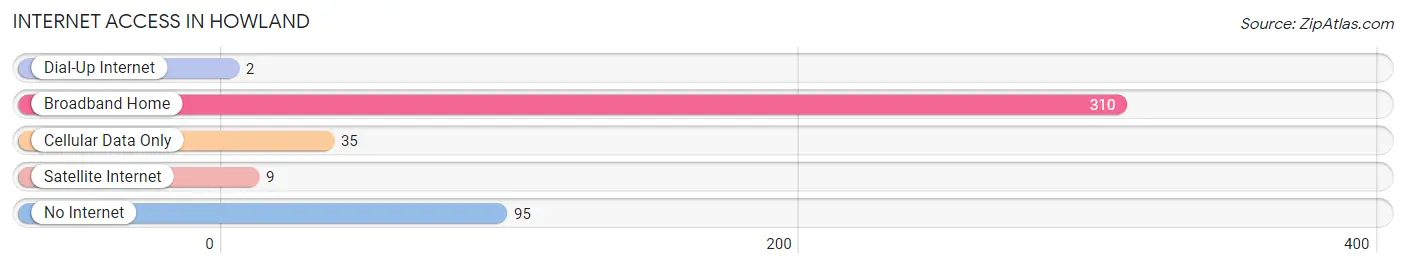
| Internet Type | # Households | % Households |
| Dial-Up Internet | 2 | 0.4% |
| Broadband Home | 310 | 69.0% |
| Cellular Data Only | 35 | 7.8% |
| Satellite Internet | 9 | 2.0% |
| No Internet | 95 | 21.2% |
| Total | 449 | 100.0% |
Howland Summary
History
The town of Howland, Maine is located in Penobscot County and is part of the Bangor Metropolitan Statistical Area. The town was first settled in 1790 by a group of settlers from Massachusetts. The town was named after Colonel Jonathan Howland, who was a prominent figure in the Revolutionary War. The town was incorporated in 1820 and has a population of 1,845 as of the 2010 census.
The town of Howland has a rich history that dates back to the early 19th century. The town was a major lumbering center in the 1800s and was home to several sawmills and gristmills. The town was also home to a number of shipbuilding yards, which produced a variety of vessels including schooners, sloops, and steamboats. The town was also home to a number of other industries including a brickyard, a tannery, and a woolen mill.
Geography
Howland is located in Penobscot County, Maine. The town is situated on the west bank of the Penobscot River, which is the second largest river in Maine. The town is bordered by the towns of Enfield, Edinburg, and Passadumkeag. The town is located approximately 25 miles north of Bangor and is part of the Bangor Metropolitan Statistical Area.
The town of Howland has a total area of 28.2 square miles, of which 27.9 square miles is land and 0.3 square miles is water. The town is located in a rural area and is mostly forested. The town is home to several lakes, including Big Lake, Little Lake, and Long Lake.
Economy
The economy of Howland is largely based on the lumber and paper industries. The town is home to several sawmills and paper mills, which produce a variety of products including lumber, paper, and pulp. The town is also home to a number of other industries, including a brickyard, a tannery, and a woolen mill.
The town is also home to a number of small businesses, including restaurants, retail stores, and service providers. The town is also home to a number of tourist attractions, including the Howland Historical Society Museum and the Howland Nature Preserve.
Demographics
As of the 2010 census, the town of Howland had a population of 1,845. The racial makeup of the town was 97.3% White, 0.3% African American, 0.2% Native American, 0.3% Asian, 0.1% Pacific Islander, 0.3% from other races, and 1.4% from two or more races. Hispanic or Latino of any race were 1.2% of the population.
The median income for a household in the town was $41,250, and the median income for a family was $50,000. The per capita income for the town was $20,945. About 11.2% of families and 14.2% of the population were below the poverty line, including 18.2% of those under age 18 and 8.3% of those age 65 or over.
Common Questions
What is Per Capita Income in Howland?
Per Capita income in Howland is $21,821.
What is the Median Family Income in Howland?
Median Family Income in Howland is $68,600.
What is the Median Household income in Howland?
Median Household Income in Howland is $45,313.
What is Income or Wage Gap in Howland?
Income or Wage Gap in Howland is 10.8%.
Women in Howland earn 89.2 cents for every dollar earned by a man.
What is Inequality or Gini Index in Howland?
Inequality or Gini Index in Howland is 0.41.
What is the Total Population of Howland?
Total Population of Howland is 1,126.
What is the Total Male Population of Howland?
Total Male Population of Howland is 558.
What is the Total Female Population of Howland?
Total Female Population of Howland is 568.
What is the Ratio of Males per 100 Females in Howland?
There are 98.24 Males per 100 Females in Howland.
What is the Ratio of Females per 100 Males in Howland?
There are 101.79 Females per 100 Males in Howland.
What is the Median Population Age in Howland?
Median Population Age in Howland is 40.6 Years.
What is the Average Family Size in Howland
Average Family Size in Howland is 3.1 People.
What is the Average Household Size in Howland
Average Household Size in Howland is 2.4 People.
How Large is the Labor Force in Howland?
There are 442 People in the Labor Forcein in Howland.
What is the Percentage of People in the Labor Force in Howland?
50.1% of People are in the Labor Force in Howland.
What is the Unemployment Rate in Howland?
Unemployment Rate in Howland is 10.0%.