Belfast, ME Map & Demographics
Belfast Map
Belfast Overview
$41,501
PER CAPITA INCOME
$71,166
AVG FAMILY INCOME
$53,925
AVG HOUSEHOLD INCOME
58.7%
WAGE / INCOME GAP [ % ]
41.3¢/ $1
WAGE / INCOME GAP [ $ ]
$4,173
FAMILY INCOME DEFICIT
0.49
INEQUALITY / GINI INDEX
6,953
TOTAL POPULATION
3,020
MALE POPULATION
3,933
FEMALE POPULATION
76.79
MALES / 100 FEMALES
130.23
FEMALES / 100 MALES
60.3
MEDIAN AGE
2.4
AVG FAMILY SIZE
2.0
AVG HOUSEHOLD SIZE
2,539
LABOR FORCE [ PEOPLE ]
42.2%
PERCENT IN LABOR FORCE
4.1%
UNEMPLOYMENT RATE
Belfast Zip Codes
Belfast Area Codes
Income in Belfast
Income Overview in Belfast
Per Capita Income in Belfast is $41,501, while median incomes of families and households are $71,166 and $53,925 respectively.
| Characteristic | Number | Measure |
| Per Capita Income | 6,953 | $41,501 |
| Median Family Income | 1,975 | $71,166 |
| Mean Family Income | 1,975 | $96,389 |
| Median Household Income | 3,355 | $53,925 |
| Mean Household Income | 3,355 | $82,124 |
| Income Deficit | 1,975 | $4,173 |
| Wage / Income Gap (%) | 6,953 | 58.74% |
| Wage / Income Gap ($) | 6,953 | 41.26¢ per $1 |
| Gini / Inequality Index | 6,953 | 0.49 |
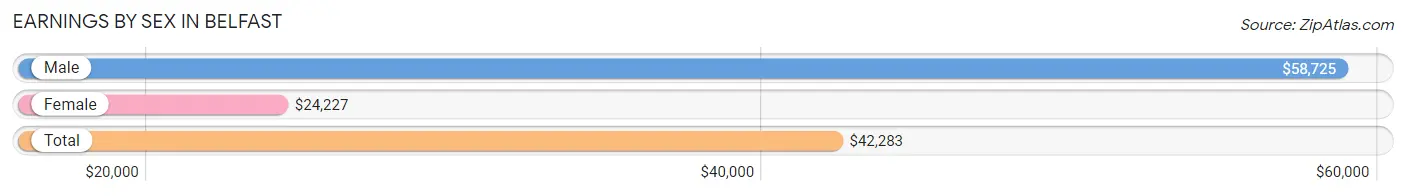
Earnings by Sex in Belfast
Average Earnings in Belfast are $42,283, $58,725 for men and $24,227 for women, a difference of 58.7%.
| Sex | Number | Average Earnings |
| Male | 1,239 (44.0%) | $58,725 |
| Female | 1,579 (56.0%) | $24,227 |
| Total | 2,818 (100.0%) | $42,283 |
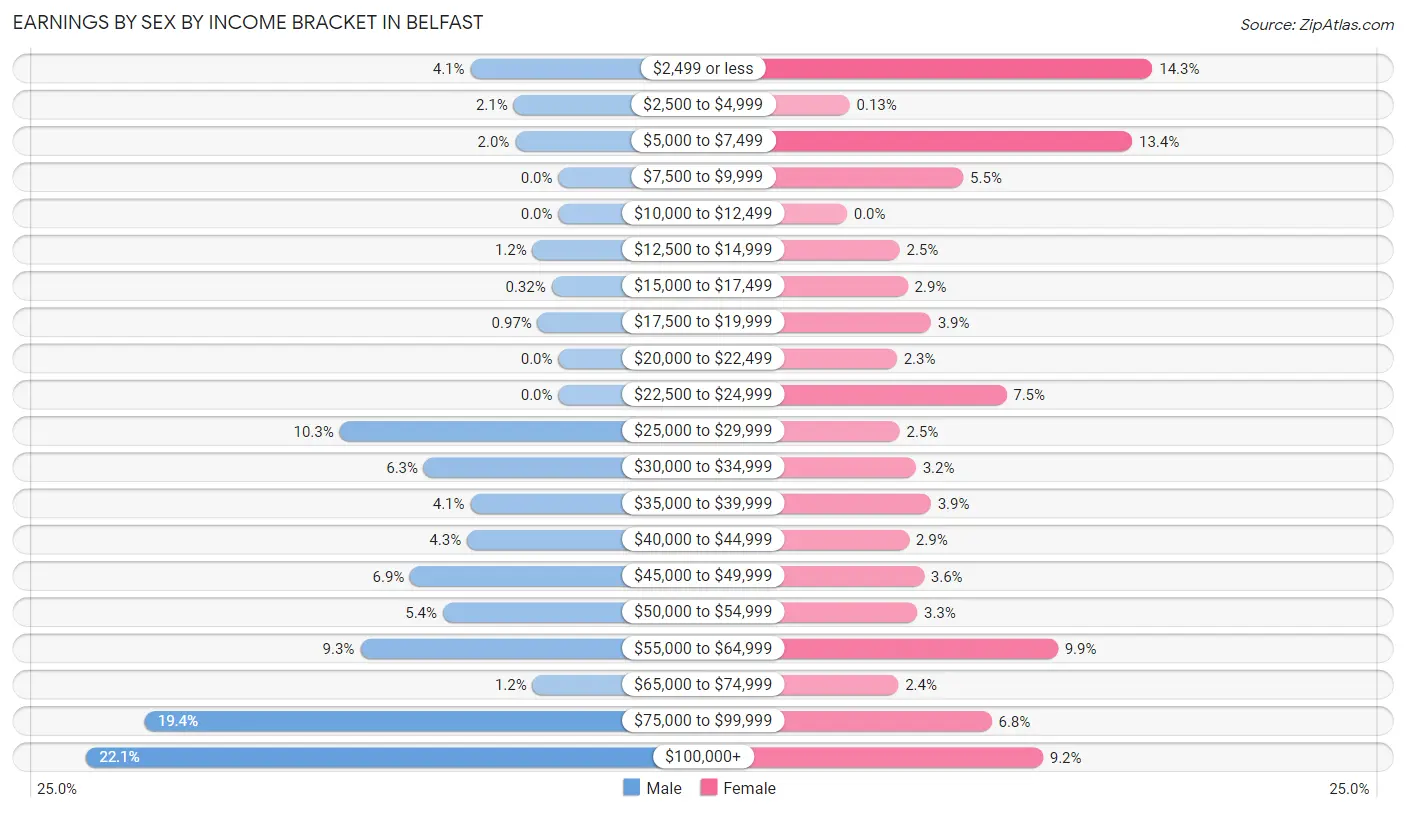
Earnings by Sex by Income Bracket in Belfast
The most common earnings brackets in Belfast are $100,000+ for men (274 | 22.1%) and $2,499 or less for women (226 | 14.3%).
| Income | Male | Female |
| $2,499 or less | 51 (4.1%) | 226 (14.3%) |
| $2,500 to $4,999 | 26 (2.1%) | 2 (0.1%) |
| $5,000 to $7,499 | 25 (2.0%) | 211 (13.4%) |
| $7,500 to $9,999 | 0 (0.0%) | 86 (5.4%) |
| $10,000 to $12,499 | 0 (0.0%) | 0 (0.0%) |
| $12,500 to $14,999 | 15 (1.2%) | 39 (2.5%) |
| $15,000 to $17,499 | 4 (0.3%) | 45 (2.9%) |
| $17,500 to $19,999 | 12 (1.0%) | 62 (3.9%) |
| $20,000 to $22,499 | 0 (0.0%) | 37 (2.3%) |
| $22,500 to $24,999 | 0 (0.0%) | 118 (7.5%) |
| $25,000 to $29,999 | 127 (10.2%) | 39 (2.5%) |
| $30,000 to $34,999 | 78 (6.3%) | 51 (3.2%) |
| $35,000 to $39,999 | 51 (4.1%) | 62 (3.9%) |
| $40,000 to $44,999 | 53 (4.3%) | 46 (2.9%) |
| $45,000 to $49,999 | 86 (6.9%) | 57 (3.6%) |
| $50,000 to $54,999 | 67 (5.4%) | 52 (3.3%) |
| $55,000 to $64,999 | 115 (9.3%) | 156 (9.9%) |
| $65,000 to $74,999 | 15 (1.2%) | 38 (2.4%) |
| $75,000 to $99,999 | 240 (19.4%) | 107 (6.8%) |
| $100,000+ | 274 (22.1%) | 145 (9.2%) |
| Total | 1,239 (100.0%) | 1,579 (100.0%) |
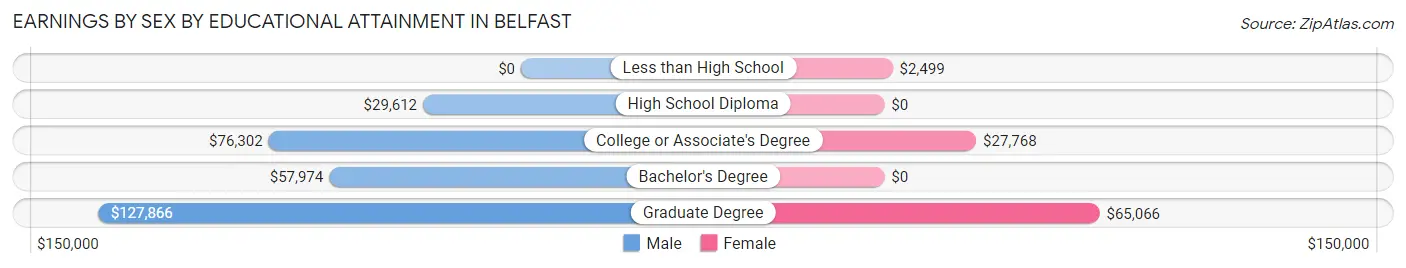
Earnings by Sex by Educational Attainment in Belfast
Average earnings in Belfast are $58,400 for men and $28,622 for women, a difference of 51.0%. Men with an educational attainment of graduate degree enjoy the highest average annual earnings of $127,866, while those with high school diploma education earn the least with $29,612. Women with an educational attainment of graduate degree earn the most with the average annual earnings of $65,066, while those with less than high school education have the smallest earnings of $2,499.
| Educational Attainment | Male Income | Female Income |
| Less than High School | - | - |
| High School Diploma | $29,612 | $0 |
| College or Associate's Degree | $76,302 | $27,768 |
| Bachelor's Degree | $57,974 | $0 |
| Graduate Degree | $127,866 | $65,066 |
| Total | $58,400 | $28,622 |
Family Income in Belfast
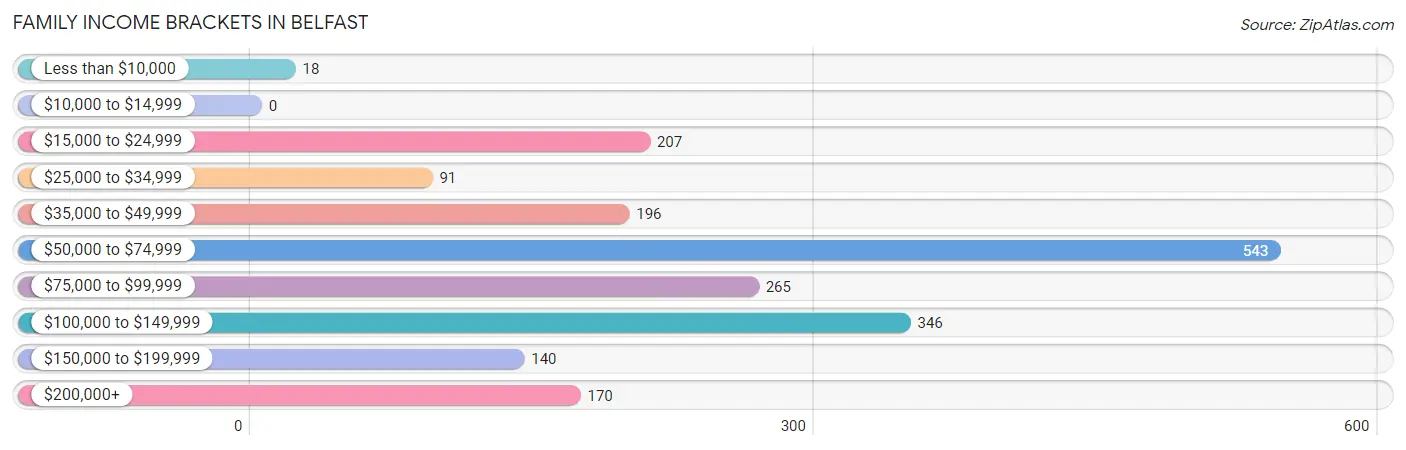
Family Income Brackets in Belfast
According to the Belfast family income data, there are 543 families falling into the $50,000 to $74,999 income range, which is the most common income bracket and makes up 27.5% of all families.
| Income Bracket | # Families | % Families |
| Less than $10,000 | 18 | 0.9% |
| $10,000 to $14,999 | 0 | 0.0% |
| $15,000 to $24,999 | 207 | 10.5% |
| $25,000 to $34,999 | 91 | 4.6% |
| $35,000 to $49,999 | 196 | 9.9% |
| $50,000 to $74,999 | 543 | 27.5% |
| $75,000 to $99,999 | 265 | 13.4% |
| $100,000 to $149,999 | 346 | 17.5% |
| $150,000 to $199,999 | 140 | 7.1% |
| $200,000+ | 170 | 8.6% |
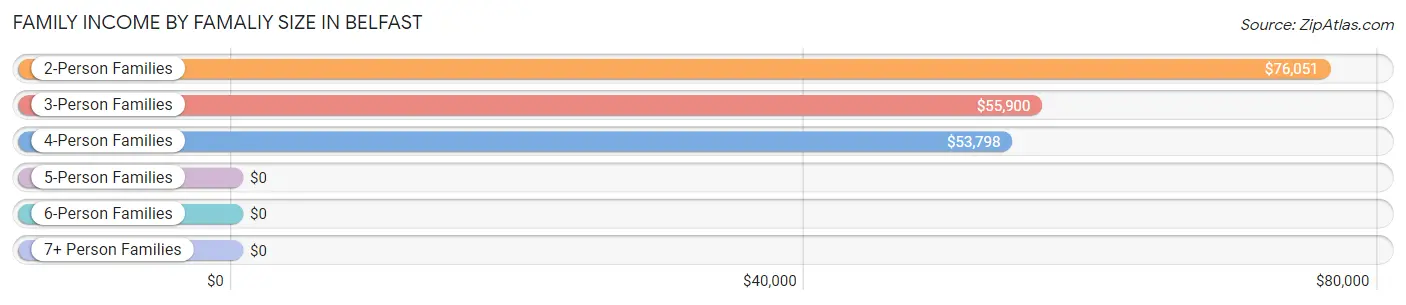
Family Income by Famaliy Size in Belfast
2-person families (1,355 | 68.6%) account for the highest median family income in Belfast with $76,051 per family, while 2-person families (1,355 | 68.6%) have the highest median income of $38,026 per family member.
| Income Bracket | # Families | Median Income |
| 2-Person Families | 1,355 (68.6%) | $76,051 |
| 3-Person Families | 406 (20.6%) | $55,900 |
| 4-Person Families | 158 (8.0%) | $53,798 |
| 5-Person Families | 56 (2.8%) | $0 |
| 6-Person Families | 0 (0.0%) | $0 |
| 7+ Person Families | 0 (0.0%) | $0 |
| Total | 1,975 (100.0%) | $71,166 |
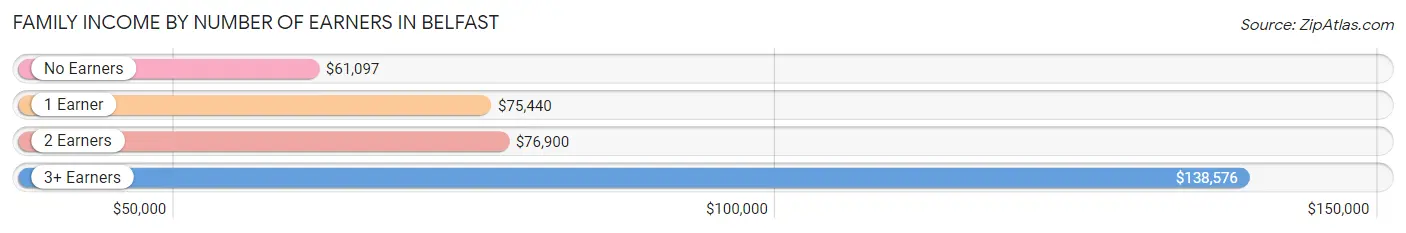
Family Income by Number of Earners in Belfast
The median family income in Belfast is $71,166, with families comprising 3+ earners (105) having the highest median family income of $138,576, while families with no earners (729) have the lowest median family income of $61,097, accounting for 5.3% and 36.9% of families, respectively.
| Number of Earners | # Families | Median Income |
| No Earners | 729 (36.9%) | $61,097 |
| 1 Earner | 757 (38.3%) | $75,440 |
| 2 Earners | 384 (19.4%) | $76,900 |
| 3+ Earners | 105 (5.3%) | $138,576 |
| Total | 1,975 (100.0%) | $71,166 |
Household Income in Belfast
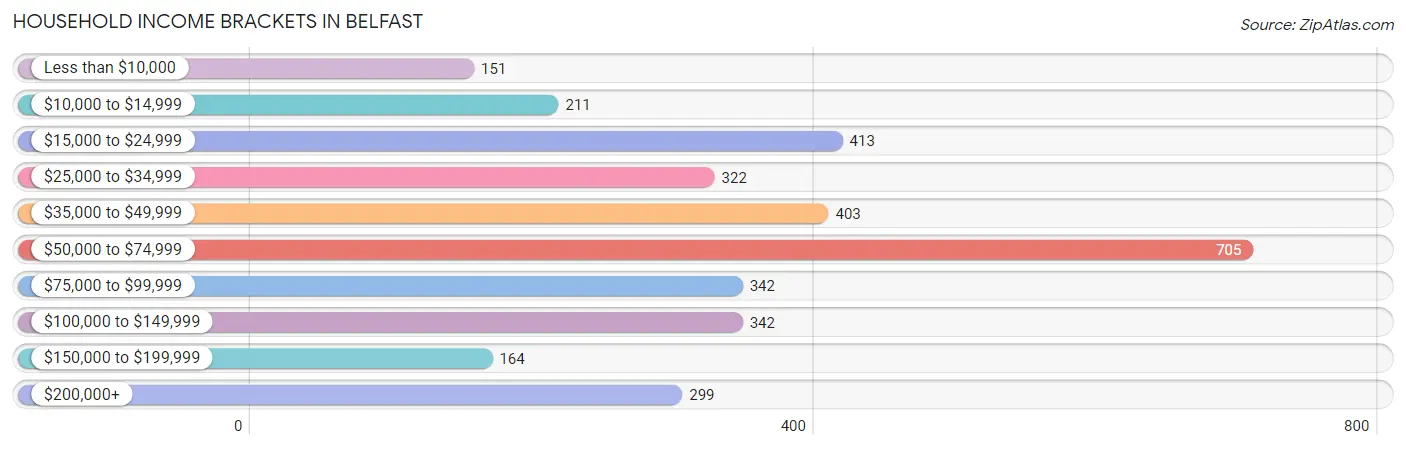
Household Income Brackets in Belfast
With 705 households falling in the category, the $50,000 to $74,999 income range is the most frequent in Belfast, accounting for 21.0% of all households. In contrast, only 151 households (4.5%) fall into the less than $10,000 income bracket, making it the least populous group.
| Income Bracket | # Households | % Households |
| Less than $10,000 | 151 | 4.5% |
| $10,000 to $14,999 | 211 | 6.3% |
| $15,000 to $24,999 | 413 | 12.3% |
| $25,000 to $34,999 | 322 | 9.6% |
| $35,000 to $49,999 | 403 | 12.0% |
| $50,000 to $74,999 | 705 | 21.0% |
| $75,000 to $99,999 | 342 | 10.2% |
| $100,000 to $149,999 | 342 | 10.2% |
| $150,000 to $199,999 | 164 | 4.9% |
| $200,000+ | 299 | 8.9% |
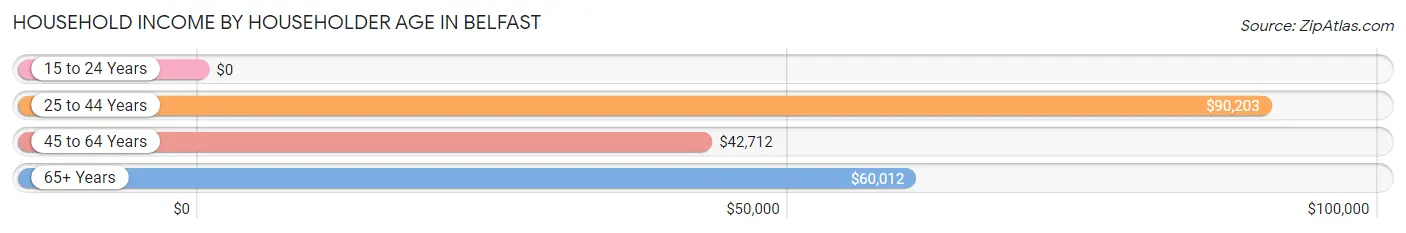
Household Income by Householder Age in Belfast
The median household income in Belfast is $53,925, with the highest median household income of $90,203 found in the 25 to 44 years age bracket for the primary householder. A total of 554 households (16.5%) fall into this category. Meanwhile, the 15 to 24 years age bracket for the primary householder has the lowest median household income of $0, with 67 households (2.0%) in this group.
| Income Bracket | # Households | Median Income |
| 15 to 24 Years | 67 (2.0%) | $0 |
| 25 to 44 Years | 554 (16.5%) | $90,203 |
| 45 to 64 Years | 989 (29.5%) | $42,712 |
| 65+ Years | 1,745 (52.0%) | $60,012 |
| Total | 3,355 (100.0%) | $53,925 |
Poverty in Belfast
Income Below Poverty by Sex and Age in Belfast
With 19.2% poverty level for males and 20.6% for females among the residents of Belfast, 12 to 14 year old males and 6 to 11 year old females are the most vulnerable to poverty, with 150 males (64.9%) and 160 females (88.4%) in their respective age groups living below the poverty level.
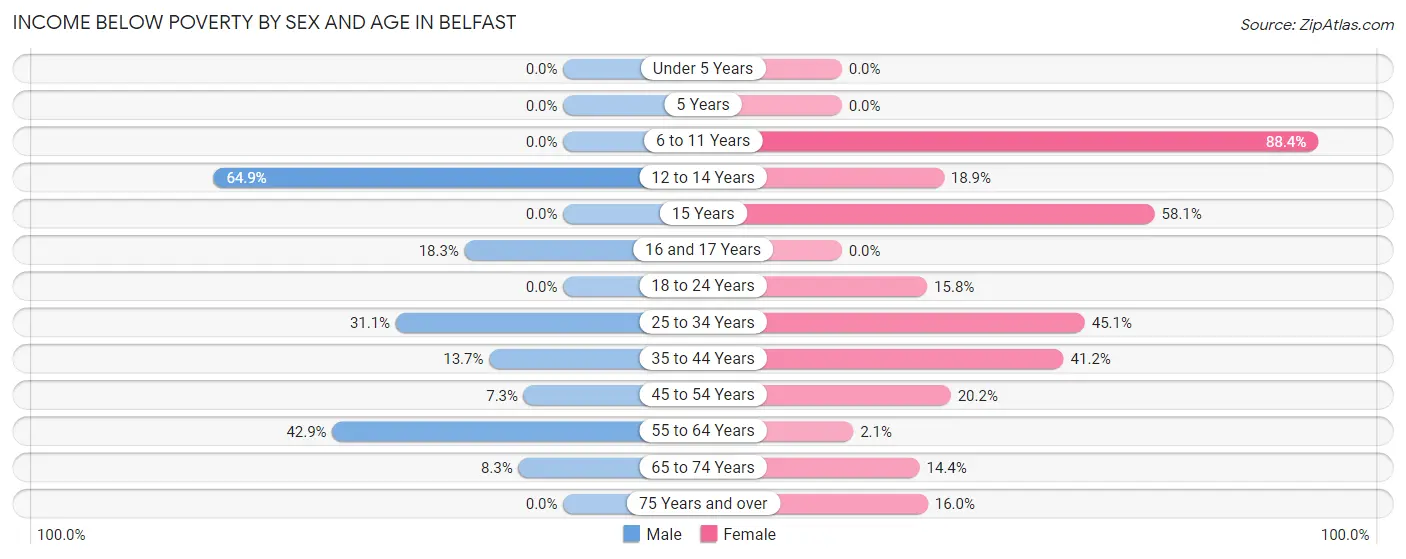
| Age Bracket | Male | Female |
| Under 5 Years | 0 (0.0%) | 0 (0.0%) |
| 5 Years | 0 (0.0%) | 0 (0.0%) |
| 6 to 11 Years | 0 (0.0%) | 160 (88.4%) |
| 12 to 14 Years | 150 (64.9%) | 25 (18.9%) |
| 15 Years | 0 (0.0%) | 18 (58.1%) |
| 16 and 17 Years | 13 (18.3%) | 0 (0.0%) |
| 18 to 24 Years | 0 (0.0%) | 32 (15.8%) |
| 25 to 34 Years | 96 (31.1%) | 120 (45.1%) |
| 35 to 44 Years | 36 (13.7%) | 154 (41.2%) |
| 45 to 54 Years | 25 (7.3%) | 56 (20.2%) |
| 55 to 64 Years | 183 (42.9%) | 16 (2.1%) |
| 65 to 74 Years | 63 (8.3%) | 132 (14.4%) |
| 75 Years and over | 0 (0.0%) | 79 (16.0%) |
| Total | 566 (19.2%) | 792 (20.6%) |
Income Above Poverty by Sex and Age in Belfast
According to the poverty statistics in Belfast, males aged under 5 years and females aged under 5 years are the age groups that are most secure financially, with 100.0% of males and 100.0% of females in these age groups living above the poverty line.
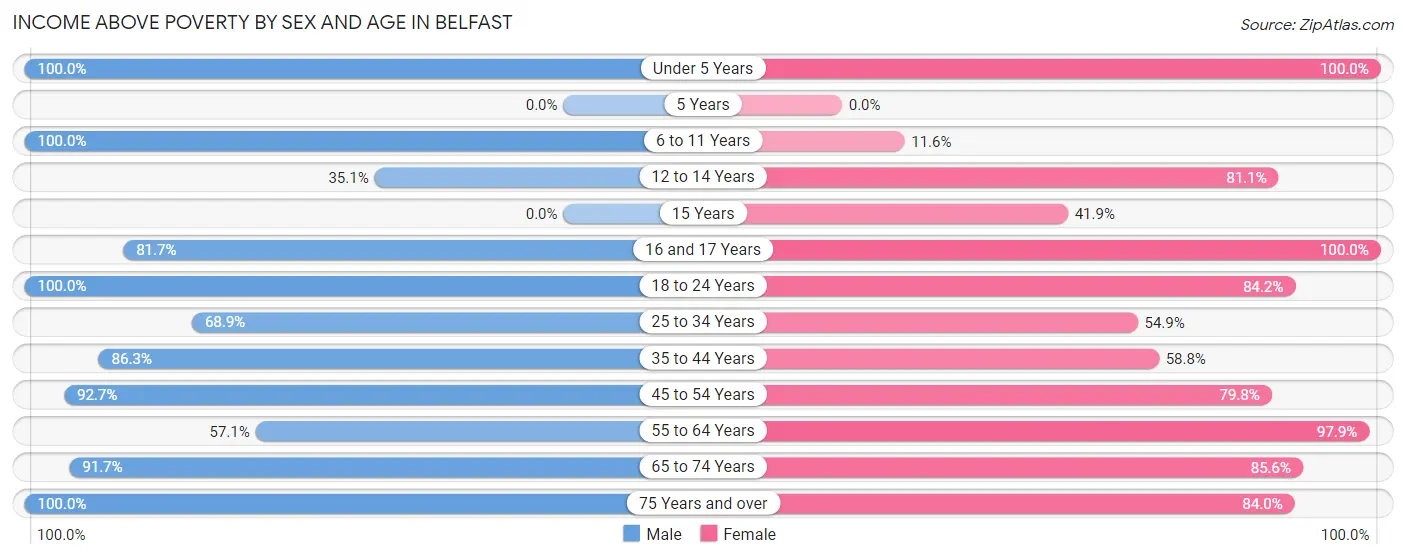
| Age Bracket | Male | Female |
| Under 5 Years | 24 (100.0%) | 188 (100.0%) |
| 5 Years | 0 (0.0%) | 0 (0.0%) |
| 6 to 11 Years | 125 (100.0%) | 21 (11.6%) |
| 12 to 14 Years | 81 (35.1%) | 107 (81.1%) |
| 15 Years | 0 (0.0%) | 13 (41.9%) |
| 16 and 17 Years | 58 (81.7%) | 39 (100.0%) |
| 18 to 24 Years | 27 (100.0%) | 170 (84.2%) |
| 25 to 34 Years | 213 (68.9%) | 146 (54.9%) |
| 35 to 44 Years | 226 (86.3%) | 220 (58.8%) |
| 45 to 54 Years | 316 (92.7%) | 221 (79.8%) |
| 55 to 64 Years | 244 (57.1%) | 737 (97.9%) |
| 65 to 74 Years | 694 (91.7%) | 782 (85.6%) |
| 75 Years and over | 369 (100.0%) | 416 (84.0%) |
| Total | 2,377 (80.8%) | 3,060 (79.4%) |
Income Below Poverty Among Married-Couple Families in Belfast
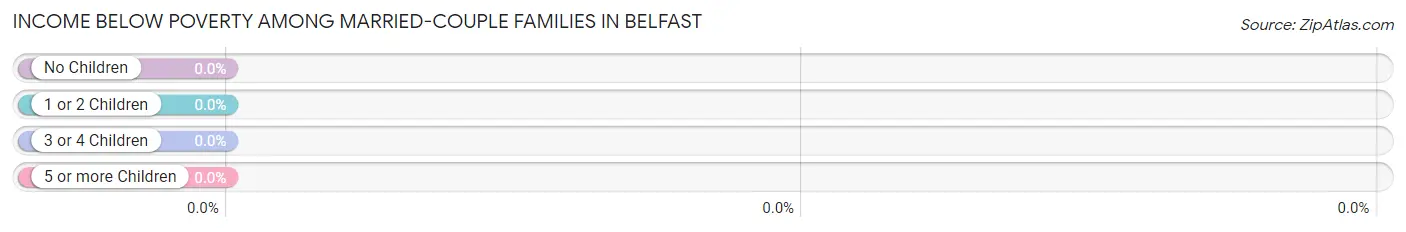
| Children | Above Poverty | Below Poverty |
| No Children | 1,221 (100.0%) | 0 (0.0%) |
| 1 or 2 Children | 147 (100.0%) | 0 (0.0%) |
| 3 or 4 Children | 39 (100.0%) | 0 (0.0%) |
| 5 or more Children | 0 (0.0%) | 0 (0.0%) |
| Total | 1,407 (100.0%) | 0 (0.0%) |
Income Below Poverty Among Single-Parent Households in Belfast
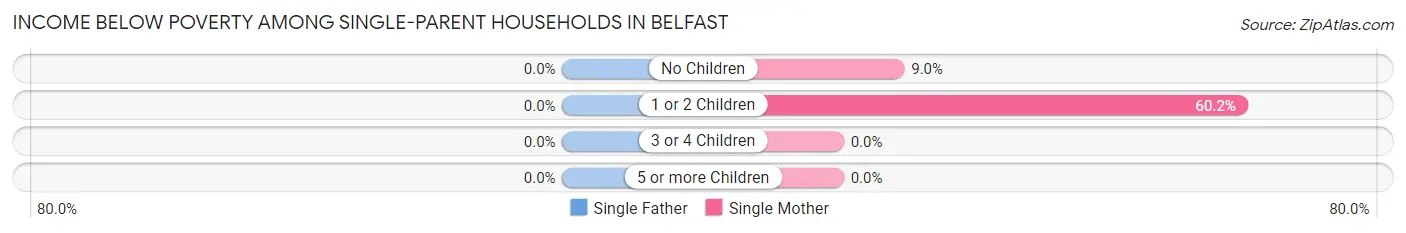
| Children | Single Father | Single Mother |
| No Children | 0 (0.0%) | 14 (9.0%) |
| 1 or 2 Children | 0 (0.0%) | 192 (60.2%) |
| 3 or 4 Children | 0 (0.0%) | 0 (0.0%) |
| 5 or more Children | 0 (0.0%) | 0 (0.0%) |
| Total | 0 (0.0%) | 206 (43.5%) |
Income Below Poverty Among Married-Couple vs Single-Parent Households in Belfast
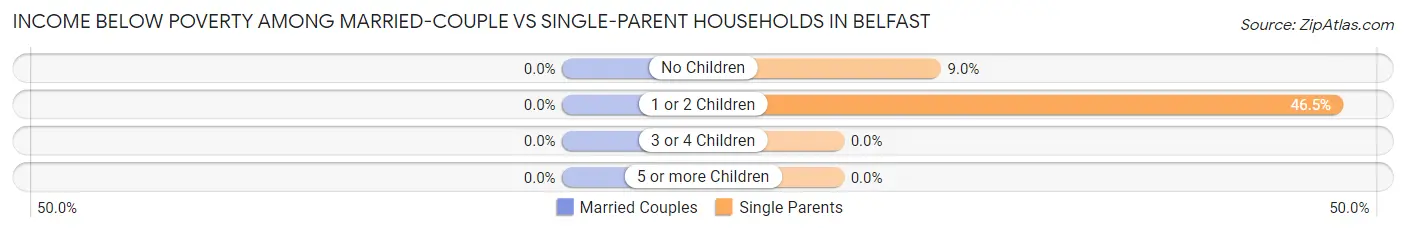
| Children | Married-Couple Families | Single-Parent Households |
| No Children | 0 (0.0%) | 14 (9.0%) |
| 1 or 2 Children | 0 (0.0%) | 192 (46.5%) |
| 3 or 4 Children | 0 (0.0%) | 0 (0.0%) |
| 5 or more Children | 0 (0.0%) | 0 (0.0%) |
| Total | 0 (0.0%) | 206 (36.3%) |
Race in Belfast
The most populous races in Belfast are White / Caucasian (5,989 | 86.1%), Two or more Races (495 | 7.1%), and Some other Race (262 | 3.8%).
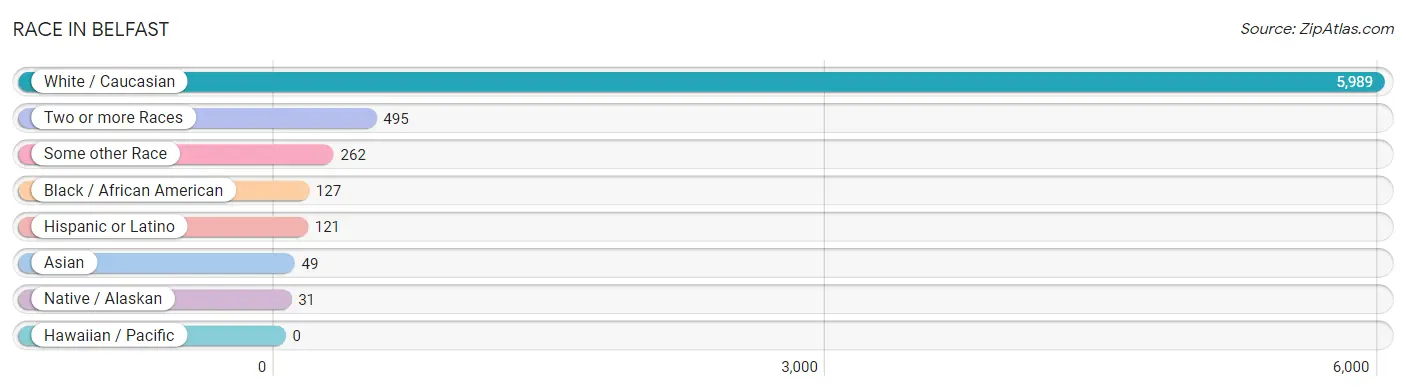
| Race | # Population | % Population |
| Asian | 49 | 0.7% |
| Black / African American | 127 | 1.8% |
| Hawaiian / Pacific | 0 | 0.0% |
| Hispanic or Latino | 121 | 1.7% |
| Native / Alaskan | 31 | 0.4% |
| White / Caucasian | 5,989 | 86.1% |
| Two or more Races | 495 | 7.1% |
| Some other Race | 262 | 3.8% |
| Total | 6,953 | 100.0% |
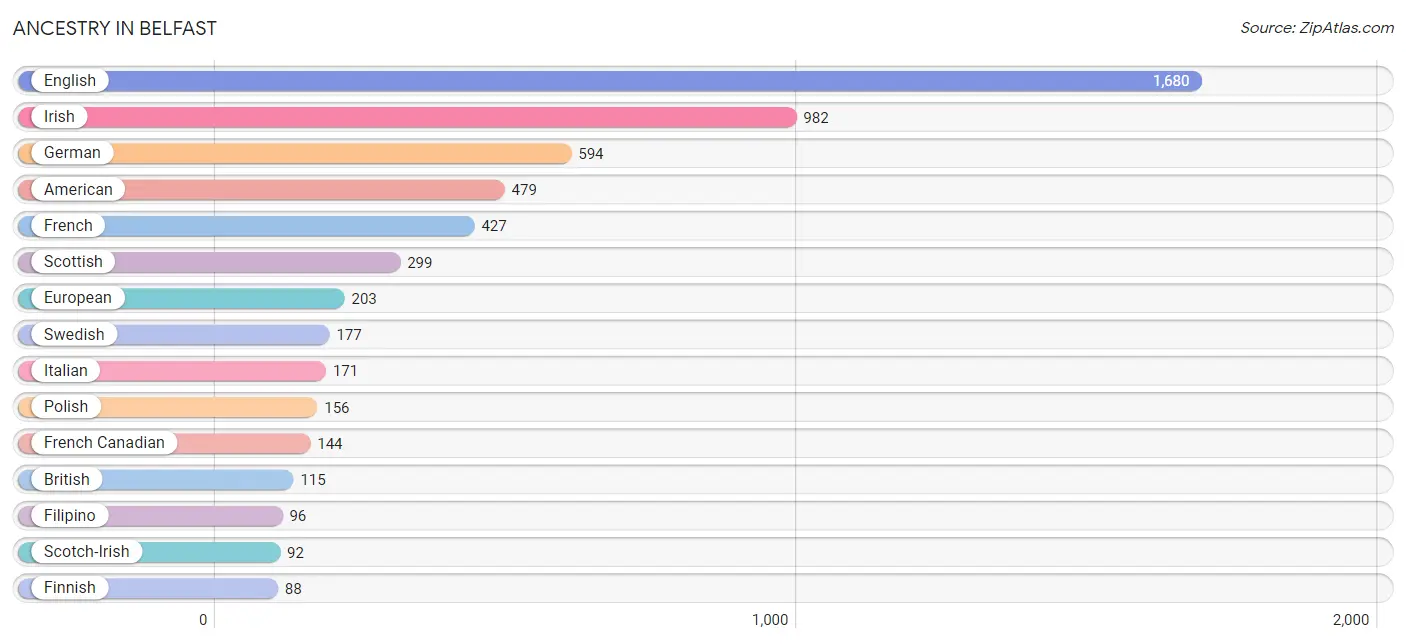
Ancestry in Belfast
The most populous ancestries reported in Belfast are English (1,680 | 24.2%), Irish (982 | 14.1%), German (594 | 8.5%), American (479 | 6.9%), and French (427 | 6.1%), together accounting for 59.9% of all Belfast residents.
| Ancestry | # Population | % Population |
| African | 66 | 0.9% |
| American | 479 | 6.9% |
| Arab | 14 | 0.2% |
| Austrian | 15 | 0.2% |
| British | 115 | 1.7% |
| Canadian | 87 | 1.3% |
| Celtic | 51 | 0.7% |
| Central American | 76 | 1.1% |
| Chilean | 15 | 0.2% |
| Czech | 66 | 0.9% |
| Danish | 63 | 0.9% |
| Dutch | 55 | 0.8% |
| Eastern European | 16 | 0.2% |
| English | 1,680 | 24.2% |
| European | 203 | 2.9% |
| Filipino | 96 | 1.4% |
| Finnish | 88 | 1.3% |
| French | 427 | 6.1% |
| French Canadian | 144 | 2.1% |
| German | 594 | 8.5% |
| Irish | 982 | 14.1% |
| Italian | 171 | 2.5% |
| Lebanese | 14 | 0.2% |
| Lithuanian | 11 | 0.2% |
| Mexican | 10 | 0.1% |
| Northern European | 33 | 0.5% |
| Norwegian | 43 | 0.6% |
| Panamanian | 56 | 0.8% |
| Polish | 156 | 2.2% |
| Portuguese | 45 | 0.6% |
| Puerto Rican | 20 | 0.3% |
| Russian | 30 | 0.4% |
| Salvadoran | 20 | 0.3% |
| Samoan | 66 | 0.9% |
| Scotch-Irish | 92 | 1.3% |
| Scottish | 299 | 4.3% |
| Slavic | 30 | 0.4% |
| South American | 15 | 0.2% |
| Sri Lankan | 12 | 0.2% |
| Subsaharan African | 66 | 0.9% |
| Swedish | 177 | 2.5% |
| Swiss | 54 | 0.8% |
| Thai | 10 | 0.1% |
| Ukrainian | 29 | 0.4% |
| Welsh | 23 | 0.3% | View All 45 Rows |
Immigrants in Belfast
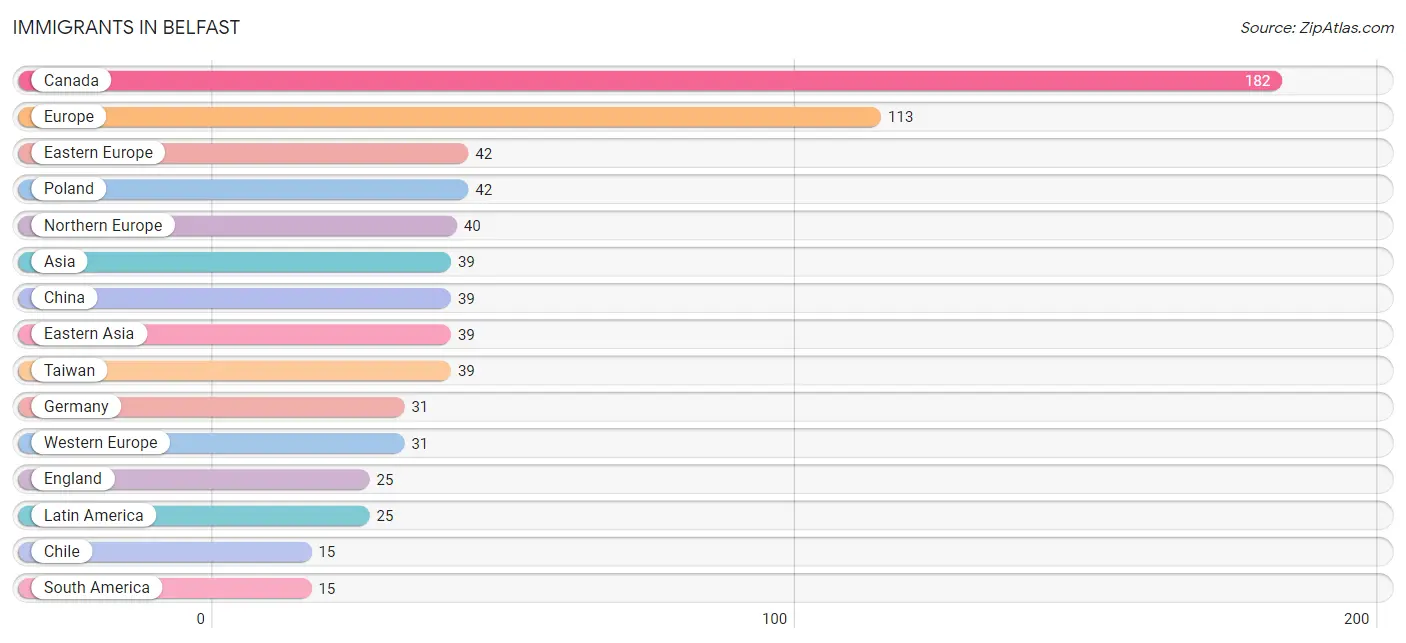
The most numerous immigrant groups reported in Belfast came from Canada (182 | 2.6%), Europe (113 | 1.6%), Eastern Europe (42 | 0.6%), Poland (42 | 0.6%), and Northern Europe (40 | 0.6%), together accounting for 6.0% of all Belfast residents.
| Immigration Origin | # Population | % Population |
| Asia | 39 | 0.6% |
| Canada | 182 | 2.6% |
| Caribbean | 10 | 0.1% |
| Chile | 15 | 0.2% |
| China | 39 | 0.6% |
| Eastern Asia | 39 | 0.6% |
| Eastern Europe | 42 | 0.6% |
| England | 25 | 0.4% |
| Europe | 113 | 1.6% |
| Germany | 31 | 0.4% |
| Latin America | 25 | 0.4% |
| Northern Europe | 40 | 0.6% |
| Poland | 42 | 0.6% |
| South America | 15 | 0.2% |
| Taiwan | 39 | 0.6% |
| Western Europe | 31 | 0.4% | View All 16 Rows |
Sex and Age in Belfast
Sex and Age in Belfast
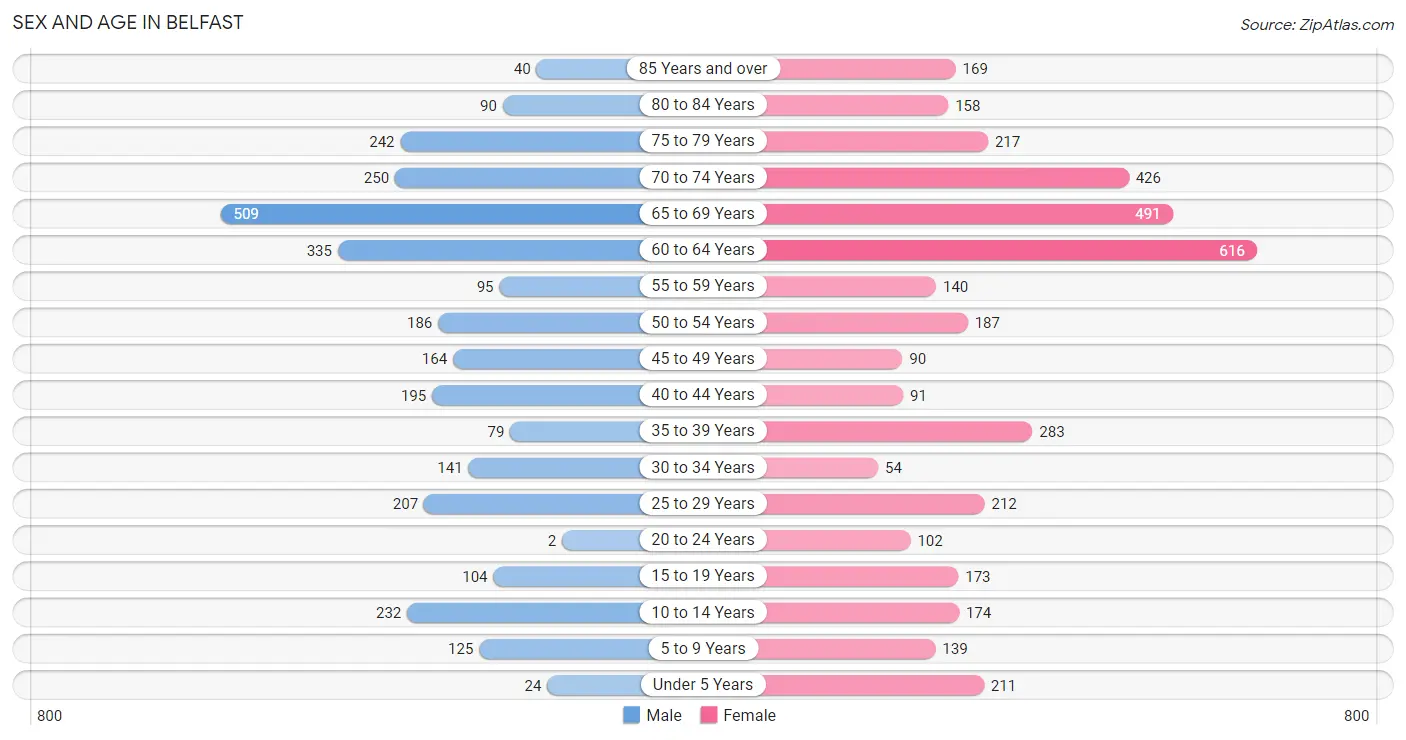
The most populous age groups in Belfast are 65 to 69 Years (509 | 16.9%) for men and 60 to 64 Years (616 | 15.7%) for women.
| Age Bracket | Male | Female |
| Under 5 Years | 24 (0.8%) | 211 (5.4%) |
| 5 to 9 Years | 125 (4.1%) | 139 (3.5%) |
| 10 to 14 Years | 232 (7.7%) | 174 (4.4%) |
| 15 to 19 Years | 104 (3.4%) | 173 (4.4%) |
| 20 to 24 Years | 2 (0.1%) | 102 (2.6%) |
| 25 to 29 Years | 207 (6.9%) | 212 (5.4%) |
| 30 to 34 Years | 141 (4.7%) | 54 (1.4%) |
| 35 to 39 Years | 79 (2.6%) | 283 (7.2%) |
| 40 to 44 Years | 195 (6.5%) | 91 (2.3%) |
| 45 to 49 Years | 164 (5.4%) | 90 (2.3%) |
| 50 to 54 Years | 186 (6.2%) | 187 (4.8%) |
| 55 to 59 Years | 95 (3.2%) | 140 (3.6%) |
| 60 to 64 Years | 335 (11.1%) | 616 (15.7%) |
| 65 to 69 Years | 509 (16.9%) | 491 (12.5%) |
| 70 to 74 Years | 250 (8.3%) | 426 (10.8%) |
| 75 to 79 Years | 242 (8.0%) | 217 (5.5%) |
| 80 to 84 Years | 90 (3.0%) | 158 (4.0%) |
| 85 Years and over | 40 (1.3%) | 169 (4.3%) |
| Total | 3,020 (100.0%) | 3,933 (100.0%) |
Families and Households in Belfast
Median Family Size in Belfast
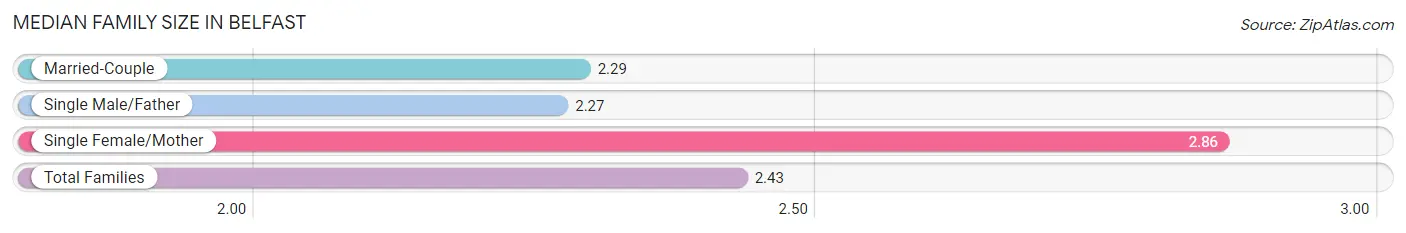
The median family size in Belfast is 2.43 persons per family, with single female/mother families (474 | 24.0%) accounting for the largest median family size of 2.86 persons per family. On the other hand, single male/father families (94 | 4.8%) represent the smallest median family size with 2.27 persons per family.
| Family Type | # Families | Family Size |
| Married-Couple | 1,407 (71.2%) | 2.29 |
| Single Male/Father | 94 (4.8%) | 2.27 |
| Single Female/Mother | 474 (24.0%) | 2.86 |
| Total Families | 1,975 (100.0%) | 2.43 |
Median Household Size in Belfast
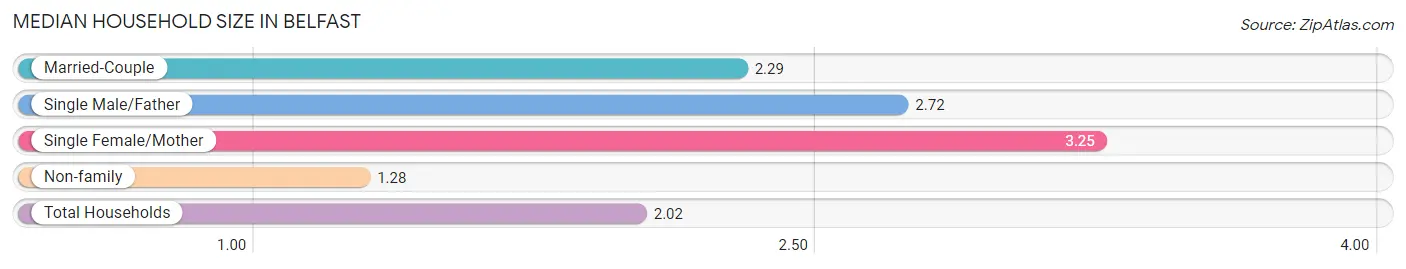
The median household size in Belfast is 2.02 persons per household, with single female/mother households (474 | 14.1%) accounting for the largest median household size of 3.25 persons per household. non-family households (1,380 | 41.1%) represent the smallest median household size with 1.28 persons per household.
| Household Type | # Households | Household Size |
| Married-Couple | 1,407 (41.9%) | 2.29 |
| Single Male/Father | 94 (2.8%) | 2.72 |
| Single Female/Mother | 474 (14.1%) | 3.25 |
| Non-family | 1,380 (41.1%) | 1.28 |
| Total Households | 3,355 (100.0%) | 2.02 |
Household Size by Marriage Status in Belfast
Out of a total of 3,355 households in Belfast, 1,975 (58.9%) are family households, while 1,380 (41.1%) are nonfamily households. The most numerous type of family households are 2-person households, comprising 1,314, and the most common type of nonfamily households are 1-person households, comprising 1,147.
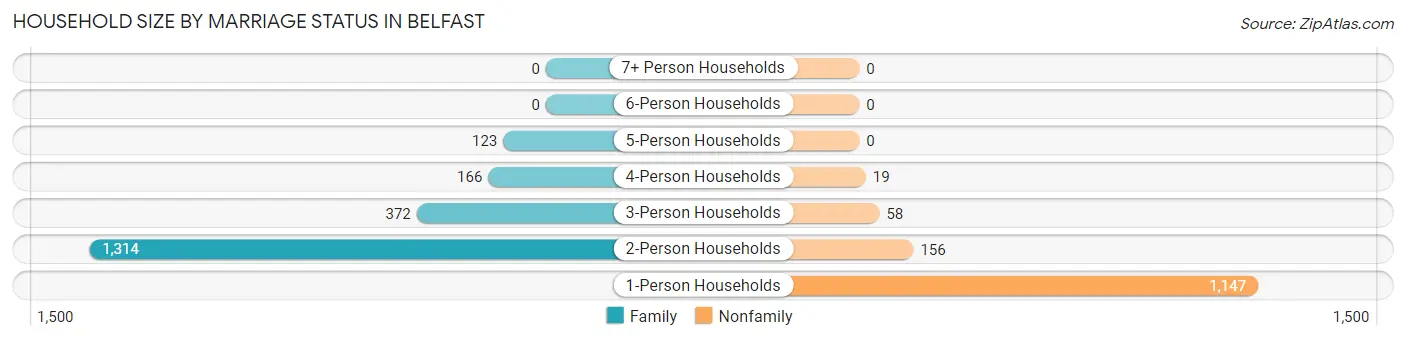
| Household Size | Family Households | Nonfamily Households |
| 1-Person Households | - | 1,147 (34.2%) |
| 2-Person Households | 1,314 (39.2%) | 156 (4.6%) |
| 3-Person Households | 372 (11.1%) | 58 (1.7%) |
| 4-Person Households | 166 (5.0%) | 19 (0.6%) |
| 5-Person Households | 123 (3.7%) | 0 (0.0%) |
| 6-Person Households | 0 (0.0%) | 0 (0.0%) |
| 7+ Person Households | 0 (0.0%) | 0 (0.0%) |
| Total | 1,975 (58.9%) | 1,380 (41.1%) |
Female Fertility in Belfast
Fertility by Age in Belfast
Average fertility rate in Belfast is 63.0 births per 1,000 women. Women in the age bracket of 20 to 34 years have the highest fertility rate with 171.0 births per 1,000 women. Women in the age bracket of 20 to 34 years acount for 100.0% of all women with births.
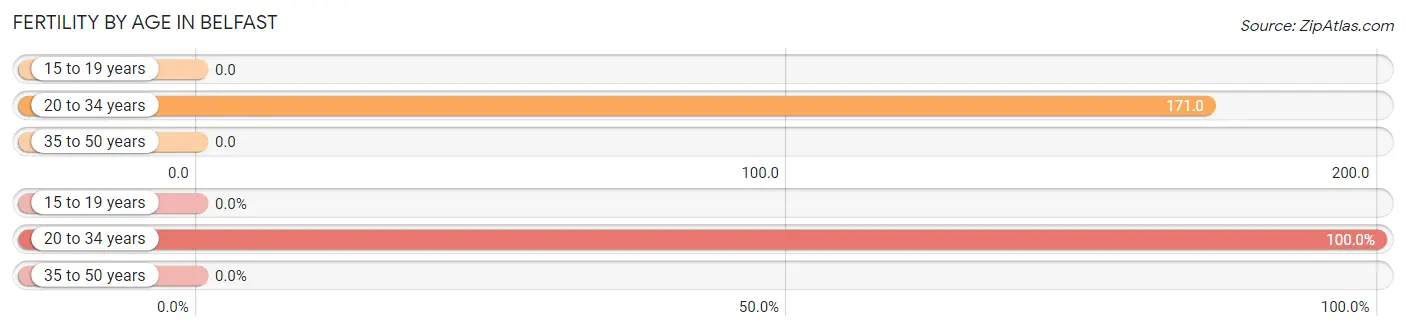
| Age Bracket | Women with Births | Births / 1,000 Women |
| 15 to 19 years | 0 (0.0%) | 0.0 |
| 20 to 34 years | 63 (100.0%) | 171.0 |
| 35 to 50 years | 0 (0.0%) | 0.0 |
| Total | 63 (100.0%) | 63.0 |
Fertility by Age by Marriage Status in Belfast
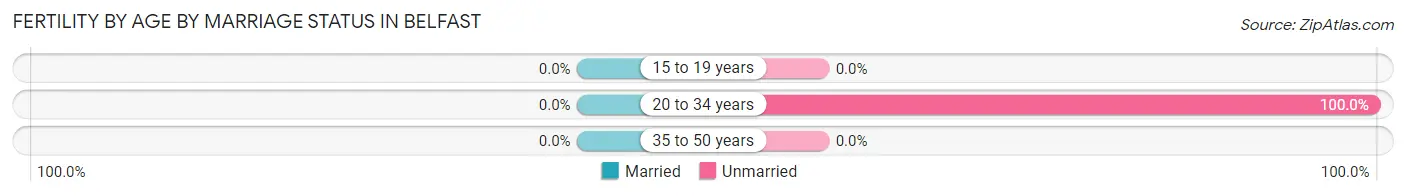
| Age Bracket | Married | Unmarried |
| 15 to 19 years | 0 (0.0%) | 0 (0.0%) |
| 20 to 34 years | 0 (0.0%) | 63 (100.0%) |
| 35 to 50 years | 0 (0.0%) | 0 (0.0%) |
| Total | 0 (0.0%) | 63 (100.0%) |
Fertility by Education in Belfast
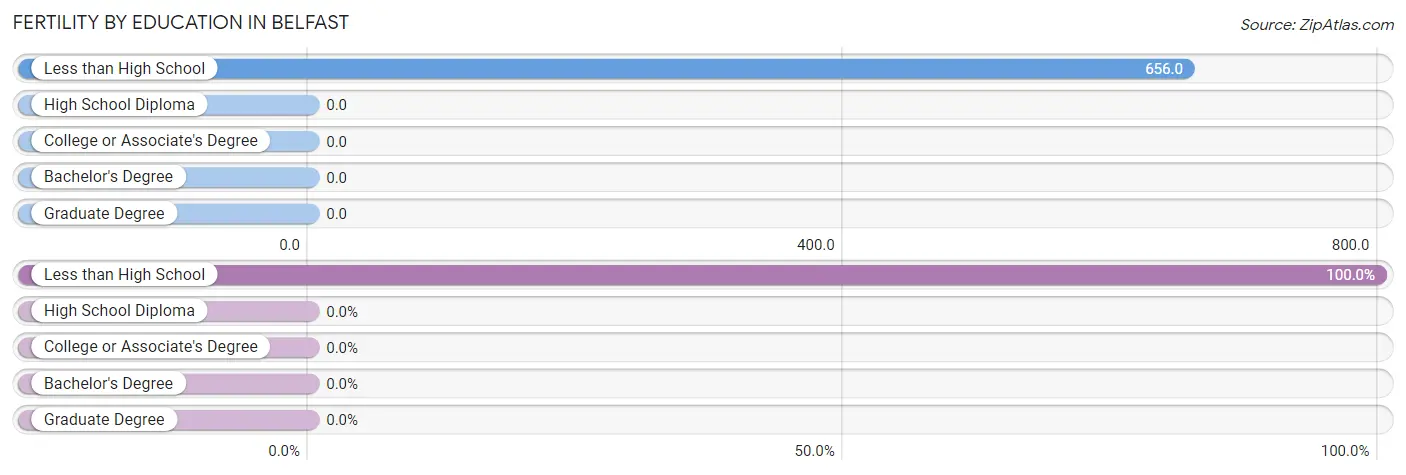
| Educational Attainment | Women with Births | Births / 1,000 Women |
| Less than High School | 63 (100.0%) | 656.0 |
| High School Diploma | 0 (0.0%) | 0.0 |
| College or Associate's Degree | 0 (0.0%) | 0.0 |
| Bachelor's Degree | 0 (0.0%) | 0.0 |
| Graduate Degree | 0 (0.0%) | 0.0 |
| Total | 63 (100.0%) | 63.0 |
Fertility by Education by Marriage Status in Belfast
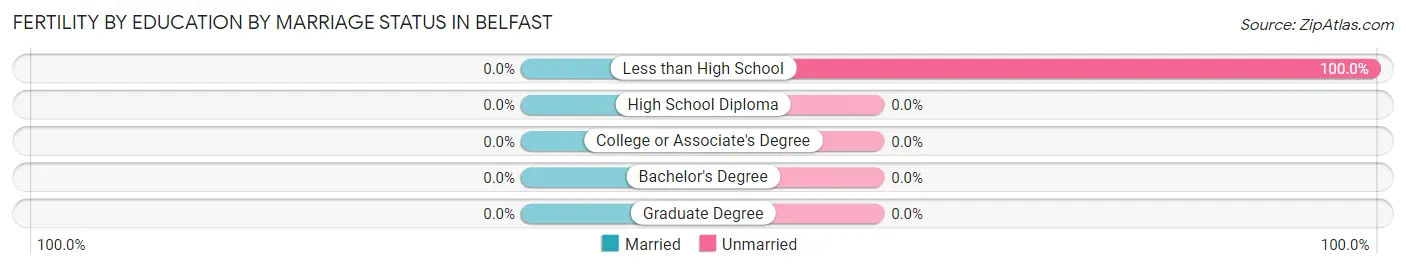
| Educational Attainment | Married | Unmarried |
| Less than High School | 0 (0.0%) | 63 (100.0%) |
| High School Diploma | 0 (0.0%) | 0 (0.0%) |
| College or Associate's Degree | 0 (0.0%) | 0 (0.0%) |
| Bachelor's Degree | 0 (0.0%) | 0 (0.0%) |
| Graduate Degree | 0 (0.0%) | 0 (0.0%) |
| Total | 0 (0.0%) | 63 (100.0%) |
Employment Characteristics in Belfast
Employment by Class of Employer in Belfast
Among the 2,375 employed individuals in Belfast, private company employees (1,130 | 47.6%), not-for-profit organizations (438 | 18.4%), and local government employees (350 | 14.7%) make up the most common classes of employment.
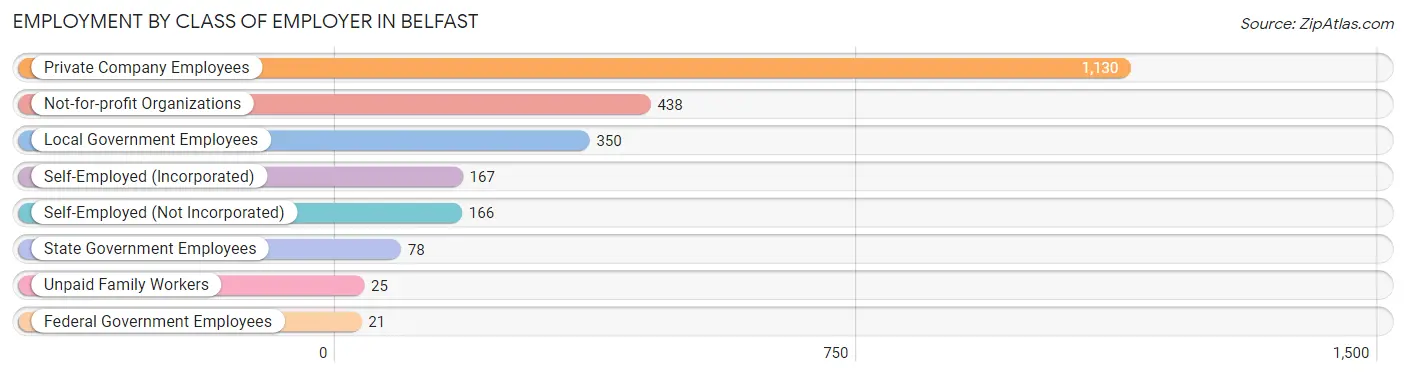
| Employer Class | # Employees | % Employees |
| Private Company Employees | 1,130 | 47.6% |
| Self-Employed (Incorporated) | 167 | 7.0% |
| Self-Employed (Not Incorporated) | 166 | 7.0% |
| Not-for-profit Organizations | 438 | 18.4% |
| Local Government Employees | 350 | 14.7% |
| State Government Employees | 78 | 3.3% |
| Federal Government Employees | 21 | 0.9% |
| Unpaid Family Workers | 25 | 1.1% |
| Total | 2,375 | 100.0% |
Employment Status by Age in Belfast
According to the labor force statistics for Belfast, out of the total population over 16 years of age (6,016), 42.2% or 2,539 individuals are in the labor force, with 4.1% or 104 of them unemployed. The age group with the highest labor force participation rate is 45 to 54 years, with 90.1% or 565 individuals in the labor force. Within the labor force, the 16 to 19 years age range has the highest percentage of unemployed individuals, with 15.5% or 13 of them being unemployed.
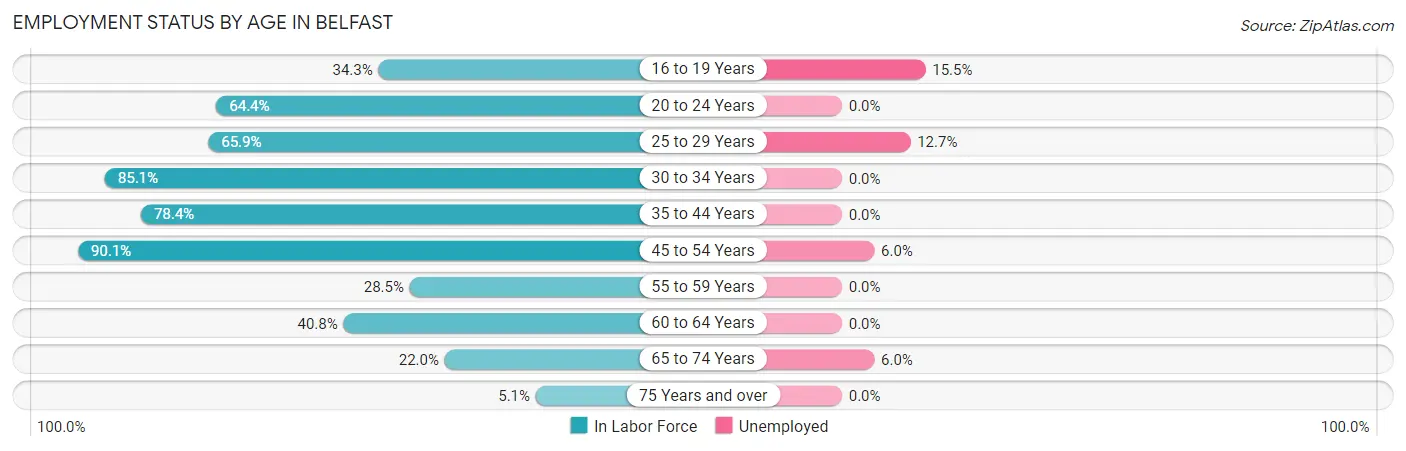
| Age Bracket | In Labor Force | Unemployed |
| 16 to 19 Years | 84 (34.3%) | 13 (15.5%) |
| 20 to 24 Years | 67 (64.4%) | 0 (0.0%) |
| 25 to 29 Years | 276 (65.9%) | 35 (12.7%) |
| 30 to 34 Years | 166 (85.1%) | 0 (0.0%) |
| 35 to 44 Years | 508 (78.4%) | 0 (0.0%) |
| 45 to 54 Years | 565 (90.1%) | 34 (6.0%) |
| 55 to 59 Years | 67 (28.5%) | 0 (0.0%) |
| 60 to 64 Years | 388 (40.8%) | 0 (0.0%) |
| 65 to 74 Years | 369 (22.0%) | 22 (6.0%) |
| 75 Years and over | 47 (5.1%) | 0 (0.0%) |
| Total | 2,539 (42.2%) | 104 (4.1%) |
Employment Status by Educational Attainment in Belfast
According to labor force statistics for Belfast, 64.1% of individuals (1,971) out of the total population between 25 and 64 years of age (3,075) are in the labor force, with 3.5% or 69 of them being unemployed. The group with the highest labor force participation rate are those with the educational attainment of bachelor's degree or higher, with 86.6% or 1,037 individuals in the labor force. Within the labor force, individuals with high school diploma education have the highest percentage of unemployment, with 8.2% or 35 of them being unemployed.
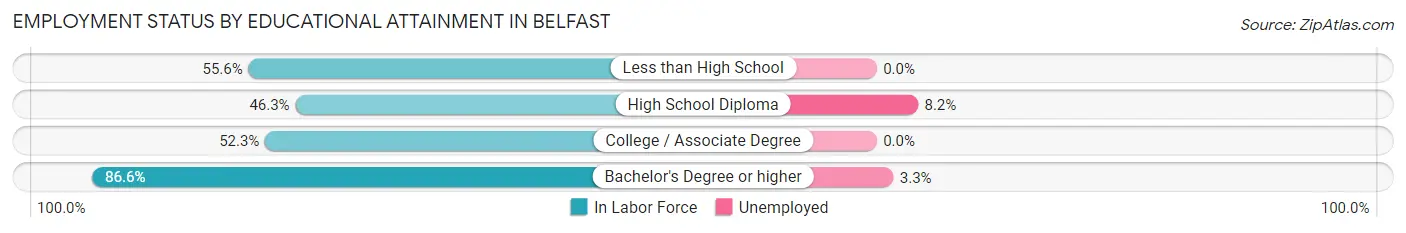
| Educational Attainment | In Labor Force | Unemployed |
| Less than High School | 99 (55.6%) | 0 (0.0%) |
| High School Diploma | 429 (46.3%) | 76 (8.2%) |
| College / Associate Degree | 405 (52.3%) | 0 (0.0%) |
| Bachelor's Degree or higher | 1,037 (86.6%) | 40 (3.3%) |
| Total | 1,971 (64.1%) | 108 (3.5%) |
Employment Occupations by Sex in Belfast
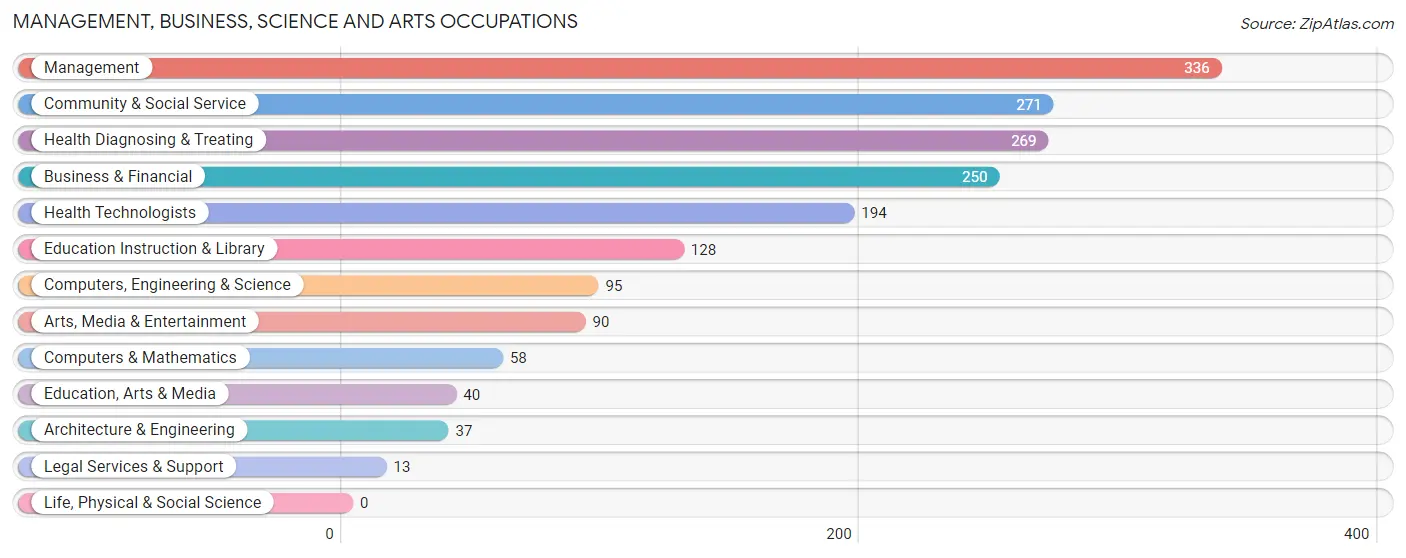
Management, Business, Science and Arts Occupations
The most common Management, Business, Science and Arts occupations in Belfast are Management (336 | 13.9%), Community & Social Service (271 | 11.2%), Health Diagnosing & Treating (269 | 11.2%), Business & Financial (250 | 10.4%), and Health Technologists (194 | 8.1%).
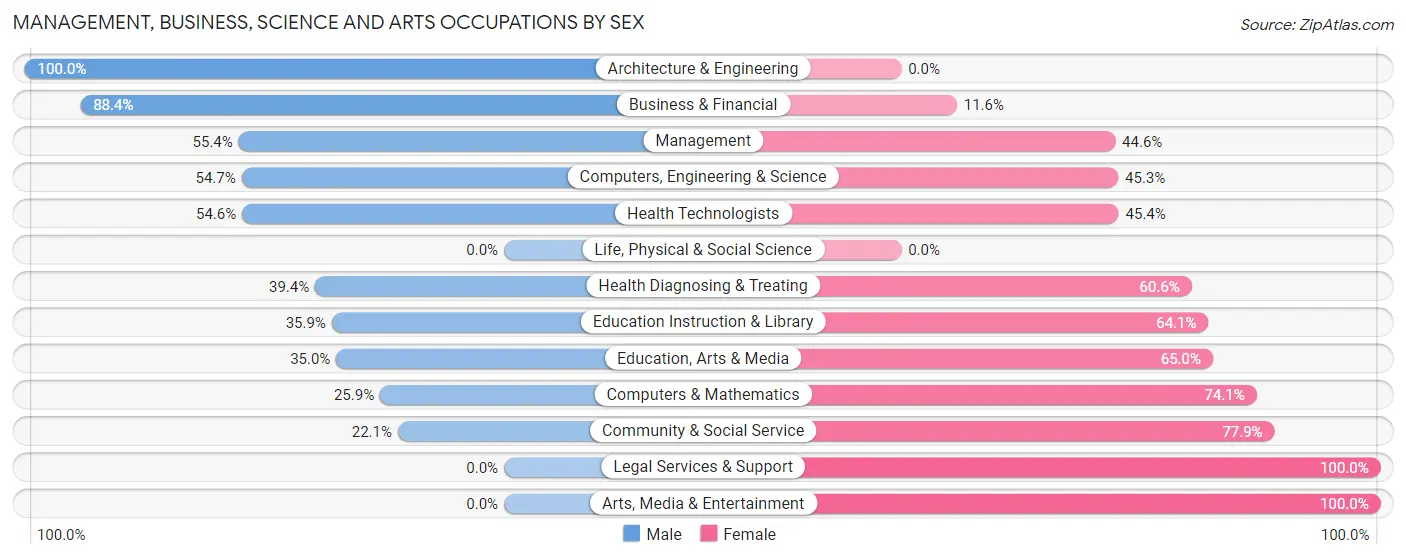
Management, Business, Science and Arts Occupations by Sex
Within the Management, Business, Science and Arts occupations in Belfast, the most male-oriented occupations are Architecture & Engineering (100.0%), Business & Financial (88.4%), and Management (55.4%), while the most female-oriented occupations are Legal Services & Support (100.0%), Arts, Media & Entertainment (100.0%), and Community & Social Service (77.9%).
| Occupation | Male | Female |
| Management | 186 (55.4%) | 150 (44.6%) |
| Business & Financial | 221 (88.4%) | 29 (11.6%) |
| Computers, Engineering & Science | 52 (54.7%) | 43 (45.3%) |
| Computers & Mathematics | 15 (25.9%) | 43 (74.1%) |
| Architecture & Engineering | 37 (100.0%) | 0 (0.0%) |
| Life, Physical & Social Science | 0 (0.0%) | 0 (0.0%) |
| Community & Social Service | 60 (22.1%) | 211 (77.9%) |
| Education, Arts & Media | 14 (35.0%) | 26 (65.0%) |
| Legal Services & Support | 0 (0.0%) | 13 (100.0%) |
| Education Instruction & Library | 46 (35.9%) | 82 (64.1%) |
| Arts, Media & Entertainment | 0 (0.0%) | 90 (100.0%) |
| Health Diagnosing & Treating | 106 (39.4%) | 163 (60.6%) |
| Health Technologists | 106 (54.6%) | 88 (45.4%) |
| Total (Category) | 625 (51.2%) | 596 (48.8%) |
| Total (Overall) | 1,045 (43.3%) | 1,366 (56.7%) |
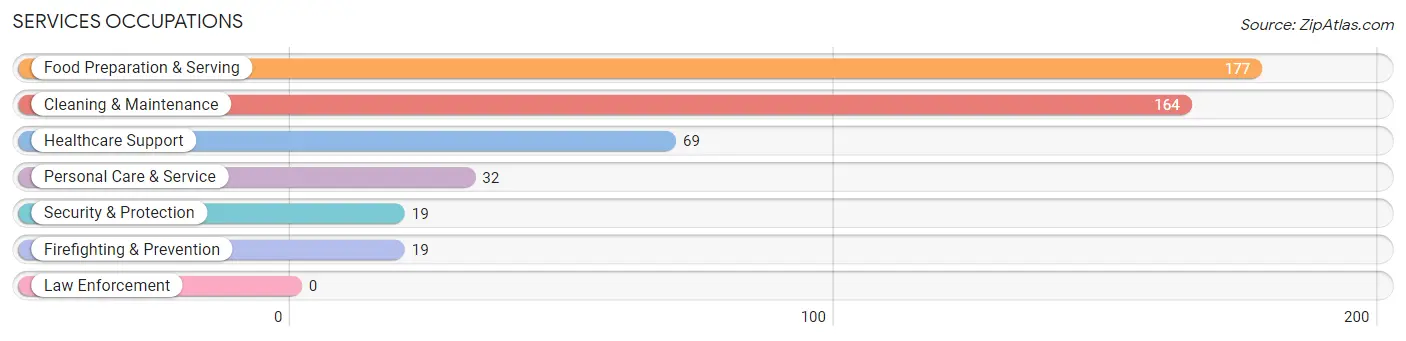
Services Occupations
The most common Services occupations in Belfast are Food Preparation & Serving (177 | 7.3%), Cleaning & Maintenance (164 | 6.8%), Healthcare Support (69 | 2.9%), Personal Care & Service (32 | 1.3%), and Security & Protection (19 | 0.8%).
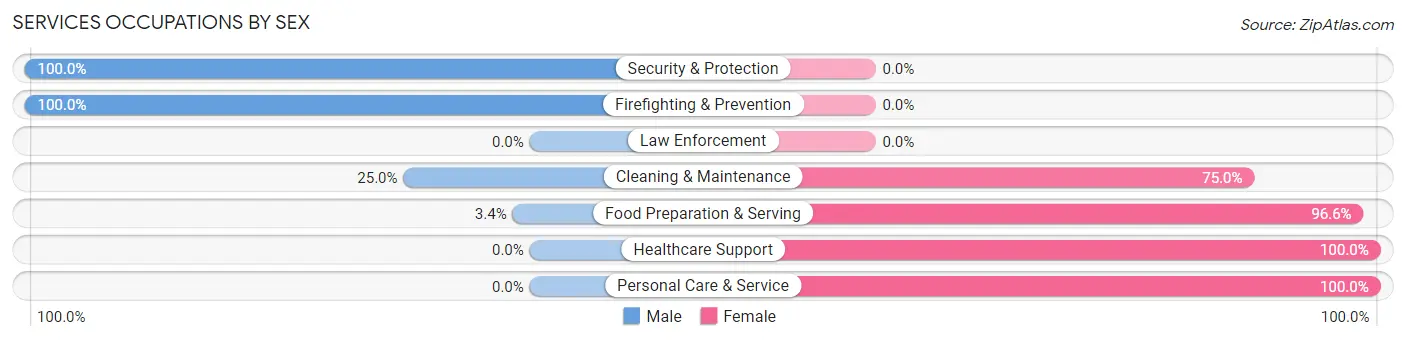
Services Occupations by Sex
Within the Services occupations in Belfast, the most male-oriented occupations are Security & Protection (100.0%), Firefighting & Prevention (100.0%), and Cleaning & Maintenance (25.0%), while the most female-oriented occupations are Healthcare Support (100.0%), Personal Care & Service (100.0%), and Food Preparation & Serving (96.6%).
| Occupation | Male | Female |
| Healthcare Support | 0 (0.0%) | 69 (100.0%) |
| Security & Protection | 19 (100.0%) | 0 (0.0%) |
| Firefighting & Prevention | 19 (100.0%) | 0 (0.0%) |
| Law Enforcement | 0 (0.0%) | 0 (0.0%) |
| Food Preparation & Serving | 6 (3.4%) | 171 (96.6%) |
| Cleaning & Maintenance | 41 (25.0%) | 123 (75.0%) |
| Personal Care & Service | 0 (0.0%) | 32 (100.0%) |
| Total (Category) | 66 (14.3%) | 395 (85.7%) |
| Total (Overall) | 1,045 (43.3%) | 1,366 (56.7%) |
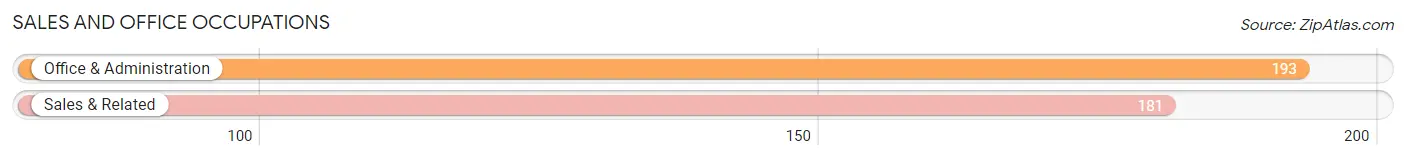
Sales and Office Occupations
The most common Sales and Office occupations in Belfast are Office & Administration (193 | 8.0%), and Sales & Related (181 | 7.5%).
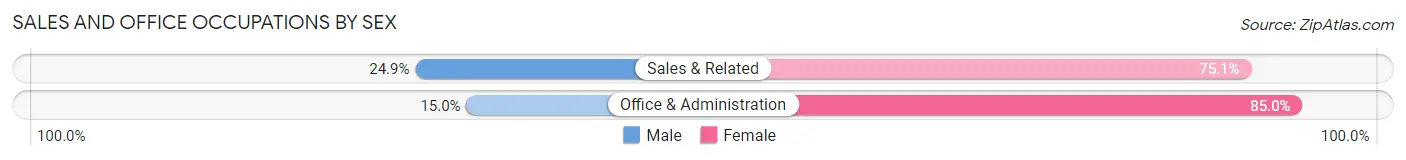
Sales and Office Occupations by Sex
| Occupation | Male | Female |
| Sales & Related | 45 (24.9%) | 136 (75.1%) |
| Office & Administration | 29 (15.0%) | 164 (85.0%) |
| Total (Category) | 74 (19.8%) | 300 (80.2%) |
| Total (Overall) | 1,045 (43.3%) | 1,366 (56.7%) |
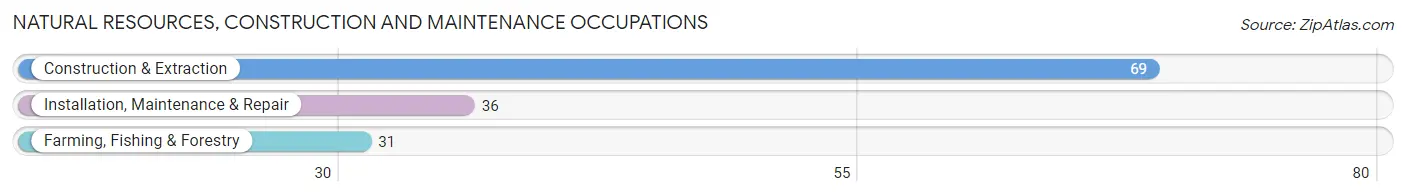
Natural Resources, Construction and Maintenance Occupations
The most common Natural Resources, Construction and Maintenance occupations in Belfast are Construction & Extraction (69 | 2.9%), Installation, Maintenance & Repair (36 | 1.5%), and Farming, Fishing & Forestry (31 | 1.3%).
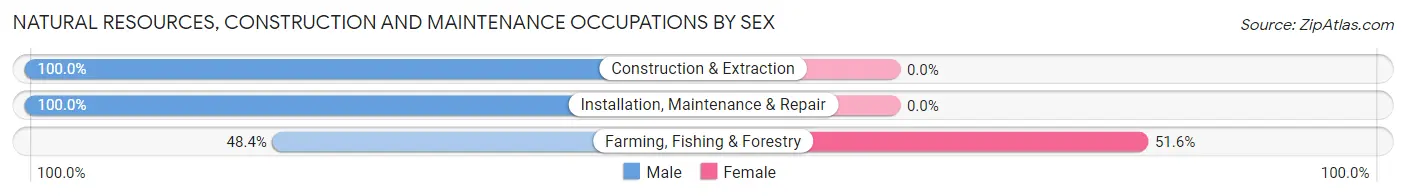
Natural Resources, Construction and Maintenance Occupations by Sex
| Occupation | Male | Female |
| Farming, Fishing & Forestry | 15 (48.4%) | 16 (51.6%) |
| Construction & Extraction | 69 (100.0%) | 0 (0.0%) |
| Installation, Maintenance & Repair | 36 (100.0%) | 0 (0.0%) |
| Total (Category) | 120 (88.2%) | 16 (11.8%) |
| Total (Overall) | 1,045 (43.3%) | 1,366 (56.7%) |
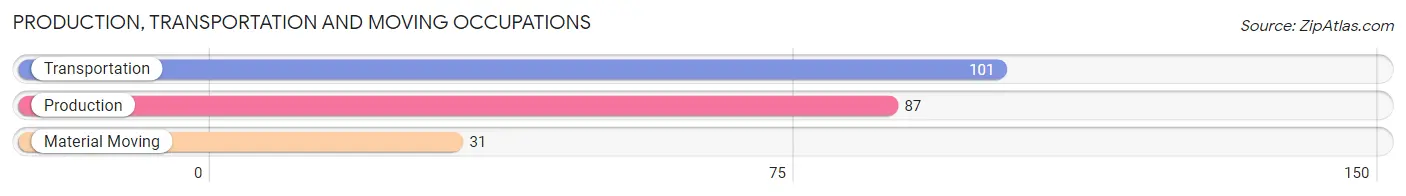
Production, Transportation and Moving Occupations
The most common Production, Transportation and Moving occupations in Belfast are Transportation (101 | 4.2%), Production (87 | 3.6%), and Material Moving (31 | 1.3%).
Production, Transportation and Moving Occupations by Sex
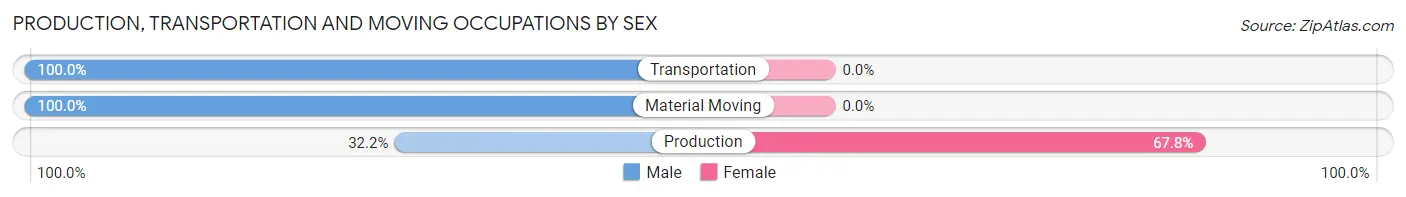
| Occupation | Male | Female |
| Production | 28 (32.2%) | 59 (67.8%) |
| Transportation | 101 (100.0%) | 0 (0.0%) |
| Material Moving | 31 (100.0%) | 0 (0.0%) |
| Total (Category) | 160 (73.1%) | 59 (26.9%) |
| Total (Overall) | 1,045 (43.3%) | 1,366 (56.7%) |
Employment Industries by Sex in Belfast
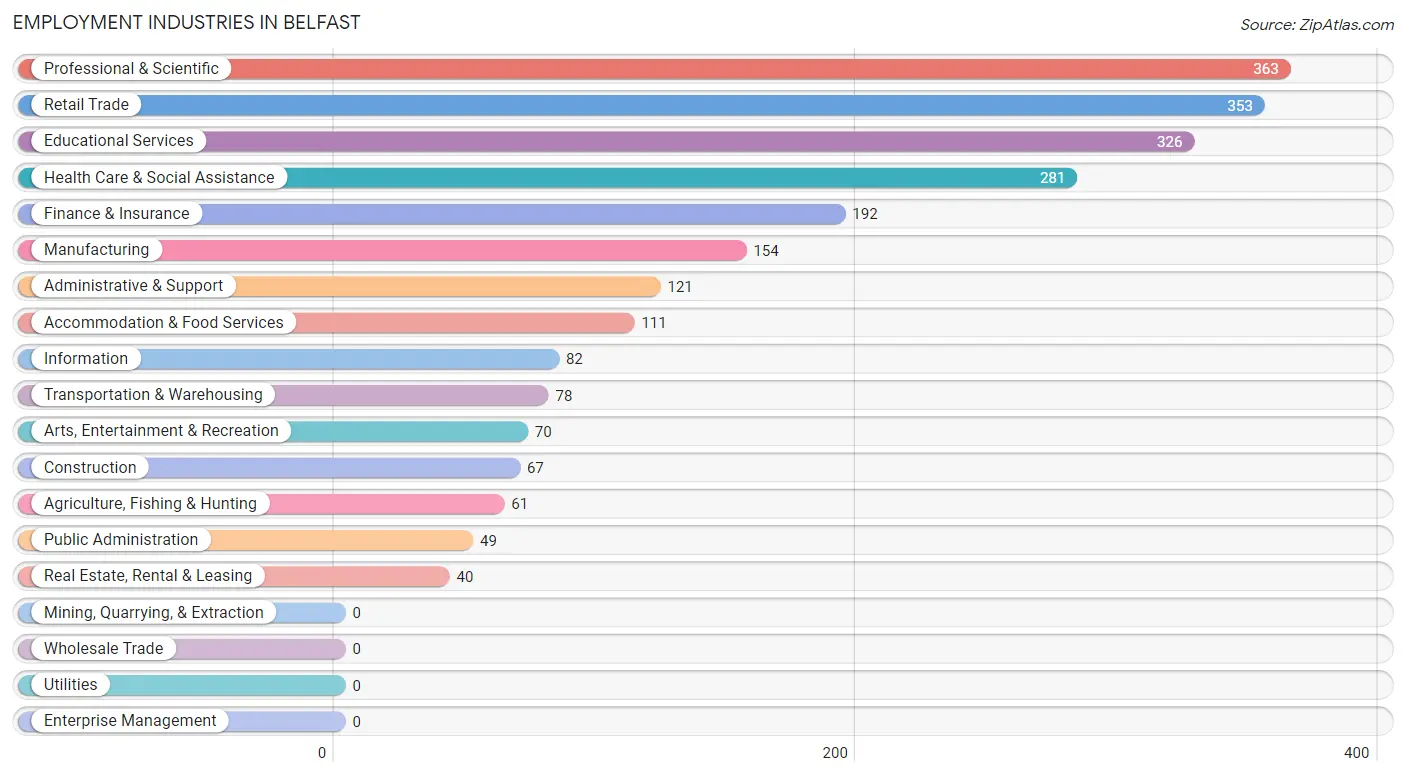
Employment Industries in Belfast
The major employment industries in Belfast include Professional & Scientific (363 | 15.1%), Retail Trade (353 | 14.6%), Educational Services (326 | 13.5%), Health Care & Social Assistance (281 | 11.7%), and Finance & Insurance (192 | 8.0%).
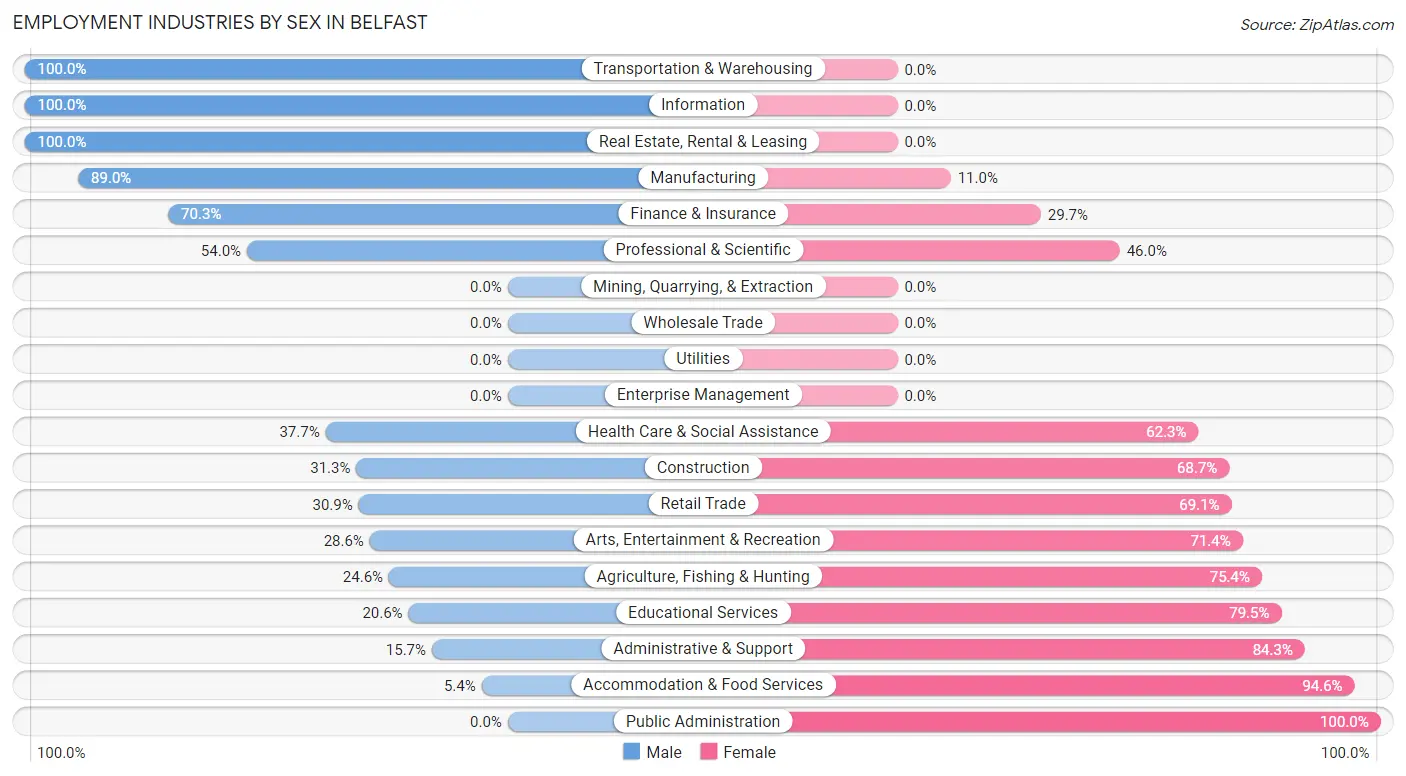
Employment Industries by Sex in Belfast
The Belfast industries that see more men than women are Transportation & Warehousing (100.0%), Information (100.0%), and Real Estate, Rental & Leasing (100.0%), whereas the industries that tend to have a higher number of women are Public Administration (100.0%), Accommodation & Food Services (94.6%), and Administrative & Support (84.3%).
| Industry | Male | Female |
| Agriculture, Fishing & Hunting | 15 (24.6%) | 46 (75.4%) |
| Mining, Quarrying, & Extraction | 0 (0.0%) | 0 (0.0%) |
| Construction | 21 (31.3%) | 46 (68.7%) |
| Manufacturing | 137 (89.0%) | 17 (11.0%) |
| Wholesale Trade | 0 (0.0%) | 0 (0.0%) |
| Retail Trade | 109 (30.9%) | 244 (69.1%) |
| Transportation & Warehousing | 78 (100.0%) | 0 (0.0%) |
| Utilities | 0 (0.0%) | 0 (0.0%) |
| Information | 82 (100.0%) | 0 (0.0%) |
| Finance & Insurance | 135 (70.3%) | 57 (29.7%) |
| Real Estate, Rental & Leasing | 40 (100.0%) | 0 (0.0%) |
| Professional & Scientific | 196 (54.0%) | 167 (46.0%) |
| Enterprise Management | 0 (0.0%) | 0 (0.0%) |
| Administrative & Support | 19 (15.7%) | 102 (84.3%) |
| Educational Services | 67 (20.5%) | 259 (79.4%) |
| Health Care & Social Assistance | 106 (37.7%) | 175 (62.3%) |
| Arts, Entertainment & Recreation | 20 (28.6%) | 50 (71.4%) |
| Accommodation & Food Services | 6 (5.4%) | 105 (94.6%) |
| Public Administration | 0 (0.0%) | 49 (100.0%) |
| Total | 1,045 (43.3%) | 1,366 (56.7%) |
Education in Belfast
School Enrollment in Belfast
The most common levels of schooling among the 1,105 students in Belfast are middle school (327 | 29.6%), high school (269 | 24.3%), and elementary school (242 | 21.9%).
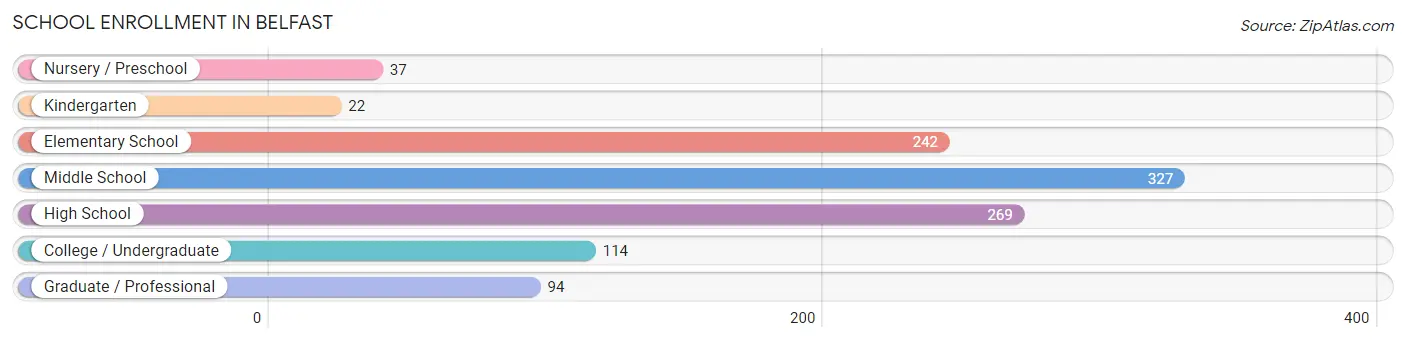
| School Level | # Students | % Students |
| Nursery / Preschool | 37 | 3.4% |
| Kindergarten | 22 | 2.0% |
| Elementary School | 242 | 21.9% |
| Middle School | 327 | 29.6% |
| High School | 269 | 24.3% |
| College / Undergraduate | 114 | 10.3% |
| Graduate / Professional | 94 | 8.5% |
| Total | 1,105 | 100.0% |
School Enrollment by Age by Funding Source in Belfast
Out of a total of 1,105 students who are enrolled in schools in Belfast, 170 (15.4%) attend a private institution, while the remaining 935 (84.6%) are enrolled in public schools. The age group of 3 to 4 year olds has the highest likelihood of being enrolled in private schools, with 37 (100.0% in the age bracket) enrolled. Conversely, the age group of 15 to 17 year olds has the lowest likelihood of being enrolled in a private school, with 129 (100.0% in the age bracket) attending a public institution.
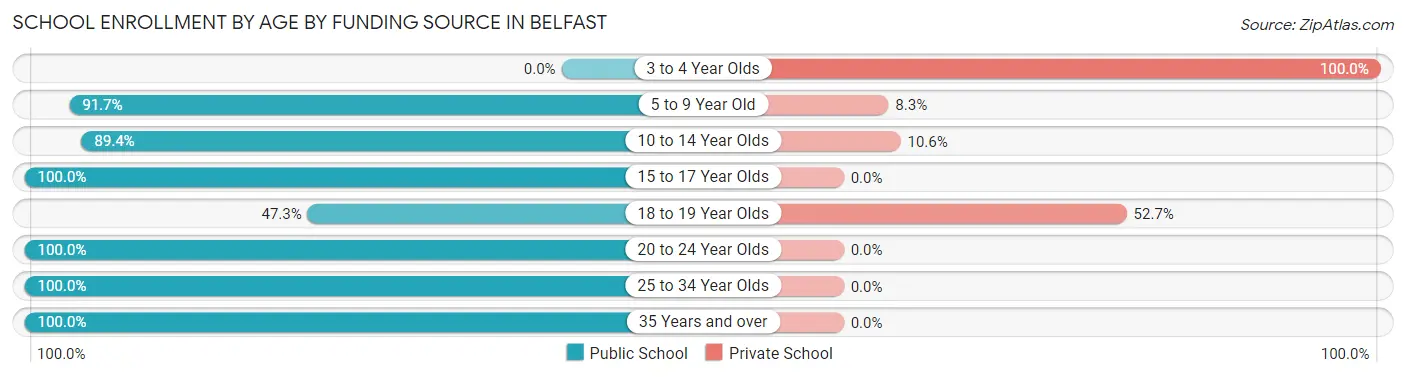
| Age Bracket | Public School | Private School |
| 3 to 4 Year Olds | 0 (0.0%) | 37 (100.0%) |
| 5 to 9 Year Old | 242 (91.7%) | 22 (8.3%) |
| 10 to 14 Year Olds | 363 (89.4%) | 43 (10.6%) |
| 15 to 17 Year Olds | 129 (100.0%) | 0 (0.0%) |
| 18 to 19 Year Olds | 61 (47.3%) | 68 (52.7%) |
| 20 to 24 Year Olds | 35 (100.0%) | 0 (0.0%) |
| 25 to 34 Year Olds | 46 (100.0%) | 0 (0.0%) |
| 35 Years and over | 59 (100.0%) | 0 (0.0%) |
| Total | 935 (84.6%) | 170 (15.4%) |
Educational Attainment by Field of Study in Belfast
Literature & languages (407 | 14.1%), science & technology (356 | 12.3%), education (312 | 10.8%), business (263 | 9.1%), and visual & performing arts (238 | 8.3%) are the most common fields of study among 2,886 individuals in Belfast who have obtained a bachelor's degree or higher.
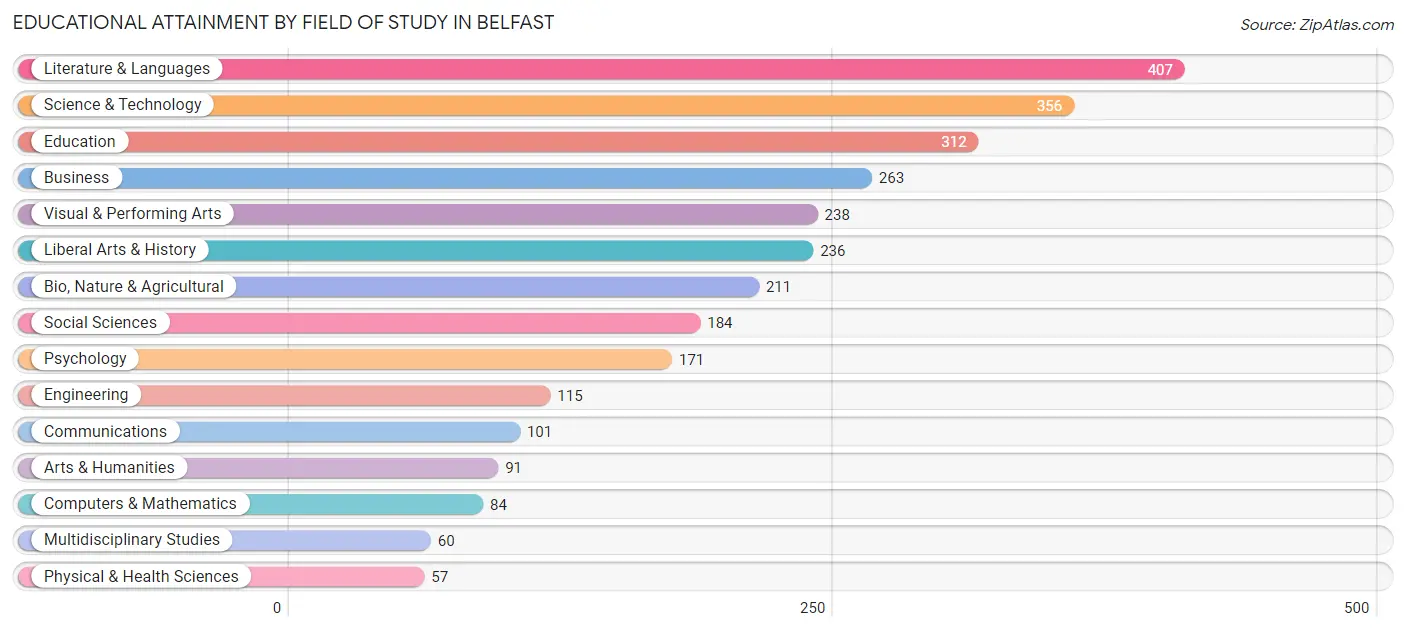
| Field of Study | # Graduates | % Graduates |
| Computers & Mathematics | 84 | 2.9% |
| Bio, Nature & Agricultural | 211 | 7.3% |
| Physical & Health Sciences | 57 | 2.0% |
| Psychology | 171 | 5.9% |
| Social Sciences | 184 | 6.4% |
| Engineering | 115 | 4.0% |
| Multidisciplinary Studies | 60 | 2.1% |
| Science & Technology | 356 | 12.3% |
| Business | 263 | 9.1% |
| Education | 312 | 10.8% |
| Literature & Languages | 407 | 14.1% |
| Liberal Arts & History | 236 | 8.2% |
| Visual & Performing Arts | 238 | 8.3% |
| Communications | 101 | 3.5% |
| Arts & Humanities | 91 | 3.2% |
| Total | 2,886 | 100.0% |
Transportation & Commute in Belfast
Vehicle Availability by Sex in Belfast
The most prevalent vehicle ownership categories in Belfast are males with 2 vehicles (485, accounting for 47.1%) and females with 2 vehicles (514, making up 36.0%).
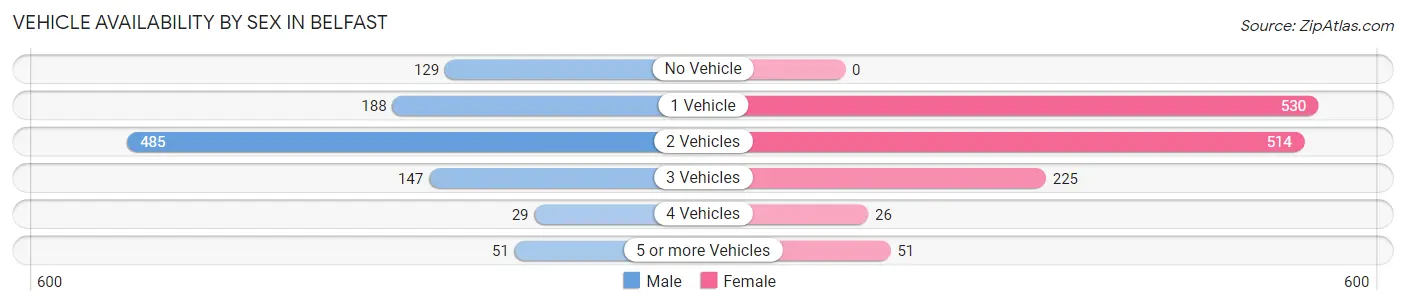
| Vehicles Available | Male | Female |
| No Vehicle | 129 (12.5%) | 0 (0.0%) |
| 1 Vehicle | 188 (18.3%) | 530 (39.4%) |
| 2 Vehicles | 485 (47.1%) | 514 (38.2%) |
| 3 Vehicles | 147 (14.3%) | 225 (16.7%) |
| 4 Vehicles | 29 (2.8%) | 26 (1.9%) |
| 5 or more Vehicles | 51 (5.0%) | 51 (3.8%) |
| Total | 1,029 (100.0%) | 1,346 (100.0%) |
Commute Time in Belfast
The most frequently occuring commute durations in Belfast are 5 to 9 minutes (612 commuters, 29.2%), 10 to 14 minutes (378 commuters, 18.0%), and 15 to 19 minutes (330 commuters, 15.8%).
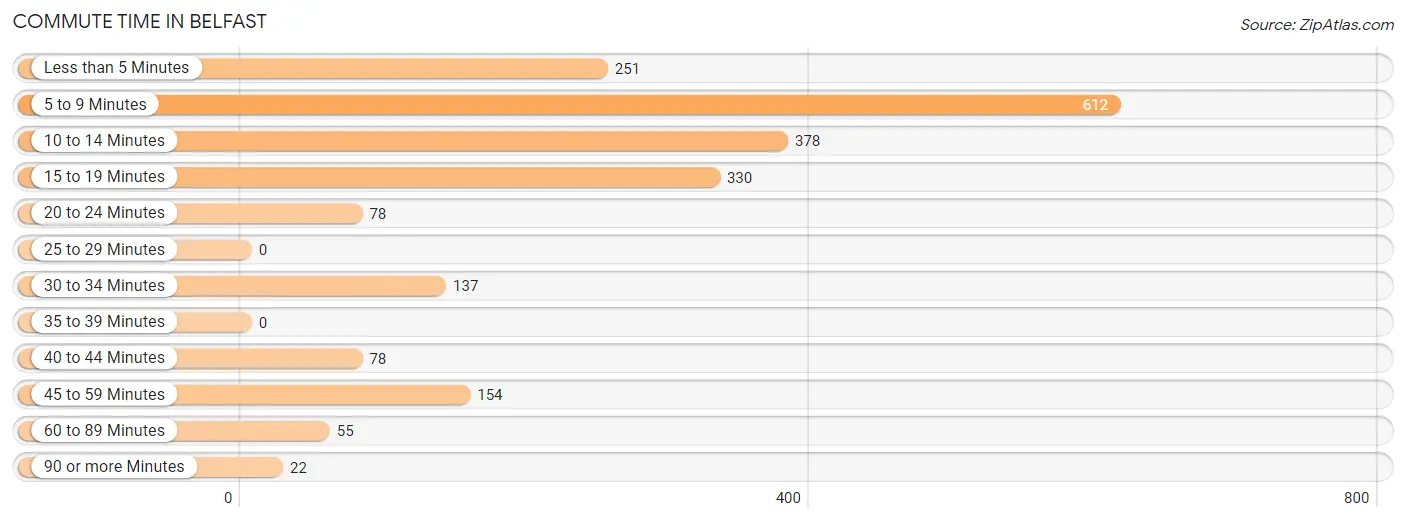
| Commute Time | # Commuters | % Commuters |
| Less than 5 Minutes | 251 | 12.0% |
| 5 to 9 Minutes | 612 | 29.2% |
| 10 to 14 Minutes | 378 | 18.0% |
| 15 to 19 Minutes | 330 | 15.8% |
| 20 to 24 Minutes | 78 | 3.7% |
| 25 to 29 Minutes | 0 | 0.0% |
| 30 to 34 Minutes | 137 | 6.5% |
| 35 to 39 Minutes | 0 | 0.0% |
| 40 to 44 Minutes | 78 | 3.7% |
| 45 to 59 Minutes | 154 | 7.3% |
| 60 to 89 Minutes | 55 | 2.6% |
| 90 or more Minutes | 22 | 1.1% |
Commute Time by Sex in Belfast
The most common commute times in Belfast are 5 to 9 minutes (274 commuters, 33.2%) for males and 5 to 9 minutes (338 commuters, 26.6%) for females.
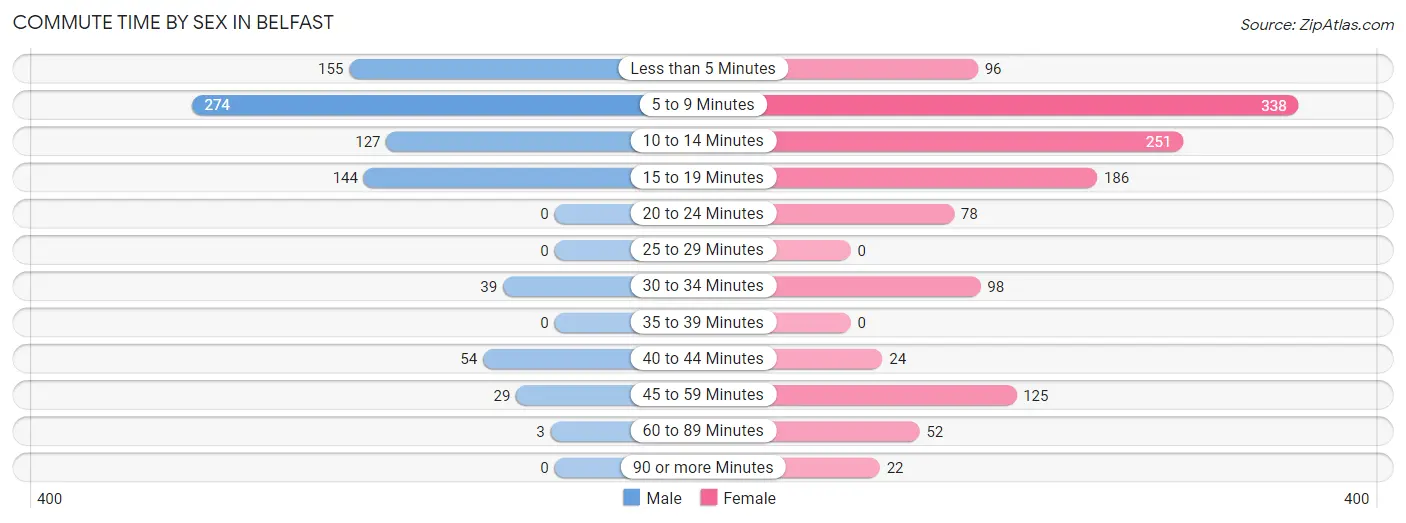
| Commute Time | Male | Female |
| Less than 5 Minutes | 155 (18.8%) | 96 (7.6%) |
| 5 to 9 Minutes | 274 (33.2%) | 338 (26.6%) |
| 10 to 14 Minutes | 127 (15.4%) | 251 (19.8%) |
| 15 to 19 Minutes | 144 (17.4%) | 186 (14.6%) |
| 20 to 24 Minutes | 0 (0.0%) | 78 (6.1%) |
| 25 to 29 Minutes | 0 (0.0%) | 0 (0.0%) |
| 30 to 34 Minutes | 39 (4.7%) | 98 (7.7%) |
| 35 to 39 Minutes | 0 (0.0%) | 0 (0.0%) |
| 40 to 44 Minutes | 54 (6.6%) | 24 (1.9%) |
| 45 to 59 Minutes | 29 (3.5%) | 125 (9.8%) |
| 60 to 89 Minutes | 3 (0.4%) | 52 (4.1%) |
| 90 or more Minutes | 0 (0.0%) | 22 (1.7%) |
Time of Departure to Work by Sex in Belfast
The most frequent times of departure to work in Belfast are 7:30 AM to 7:59 AM (119, 14.4%) for males and 7:30 AM to 7:59 AM (360, 28.3%) for females.
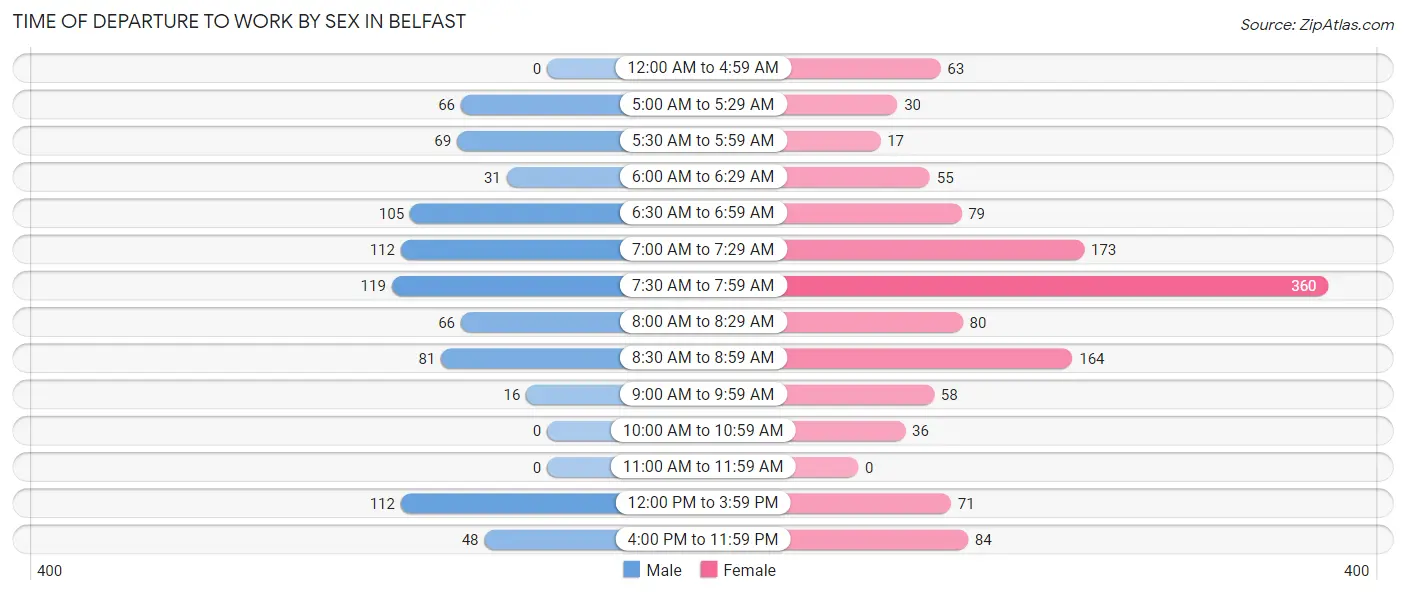
| Time of Departure | Male | Female |
| 12:00 AM to 4:59 AM | 0 (0.0%) | 63 (5.0%) |
| 5:00 AM to 5:29 AM | 66 (8.0%) | 30 (2.4%) |
| 5:30 AM to 5:59 AM | 69 (8.4%) | 17 (1.3%) |
| 6:00 AM to 6:29 AM | 31 (3.8%) | 55 (4.3%) |
| 6:30 AM to 6:59 AM | 105 (12.7%) | 79 (6.2%) |
| 7:00 AM to 7:29 AM | 112 (13.6%) | 173 (13.6%) |
| 7:30 AM to 7:59 AM | 119 (14.4%) | 360 (28.3%) |
| 8:00 AM to 8:29 AM | 66 (8.0%) | 80 (6.3%) |
| 8:30 AM to 8:59 AM | 81 (9.8%) | 164 (12.9%) |
| 9:00 AM to 9:59 AM | 16 (1.9%) | 58 (4.6%) |
| 10:00 AM to 10:59 AM | 0 (0.0%) | 36 (2.8%) |
| 11:00 AM to 11:59 AM | 0 (0.0%) | 0 (0.0%) |
| 12:00 PM to 3:59 PM | 112 (13.6%) | 71 (5.6%) |
| 4:00 PM to 11:59 PM | 48 (5.8%) | 84 (6.6%) |
| Total | 825 (100.0%) | 1,270 (100.0%) |
Housing Occupancy in Belfast
Occupancy by Ownership in Belfast
Of the total 3,355 dwellings in Belfast, owner-occupied units account for 2,338 (69.7%), while renter-occupied units make up 1,017 (30.3%).
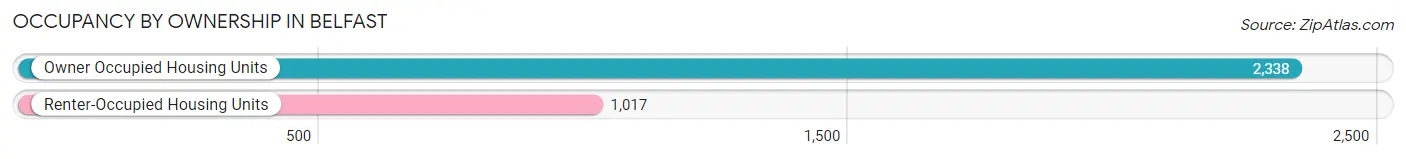
| Occupancy | # Housing Units | % Housing Units |
| Owner Occupied Housing Units | 2,338 | 69.7% |
| Renter-Occupied Housing Units | 1,017 | 30.3% |
| Total Occupied Housing Units | 3,355 | 100.0% |
Occupancy by Household Size in Belfast
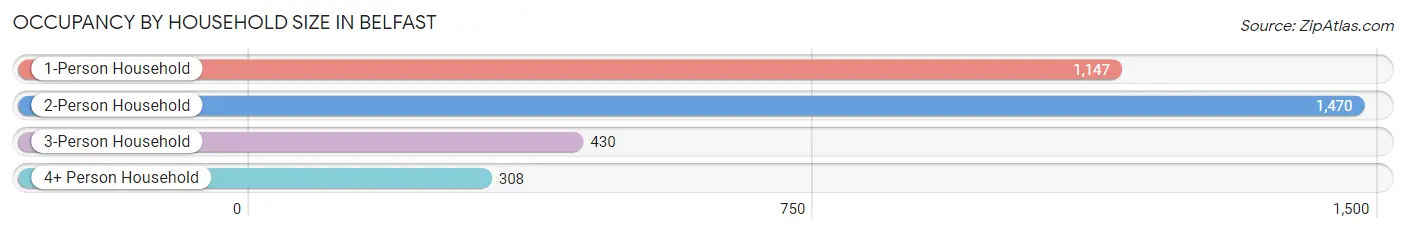
| Household Size | # Housing Units | % Housing Units |
| 1-Person Household | 1,147 | 34.2% |
| 2-Person Household | 1,470 | 43.8% |
| 3-Person Household | 430 | 12.8% |
| 4+ Person Household | 308 | 9.2% |
| Total Housing Units | 3,355 | 100.0% |
Occupancy by Ownership by Household Size in Belfast
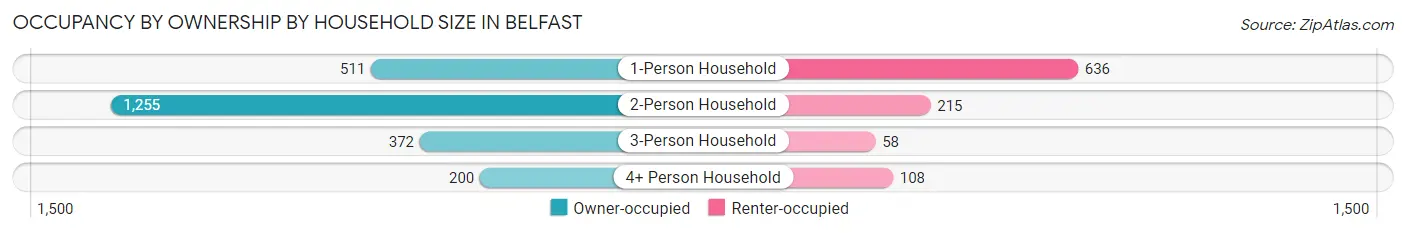
| Household Size | Owner-occupied | Renter-occupied |
| 1-Person Household | 511 (44.6%) | 636 (55.4%) |
| 2-Person Household | 1,255 (85.4%) | 215 (14.6%) |
| 3-Person Household | 372 (86.5%) | 58 (13.5%) |
| 4+ Person Household | 200 (64.9%) | 108 (35.1%) |
| Total Housing Units | 2,338 (69.7%) | 1,017 (30.3%) |
Occupancy by Educational Attainment in Belfast
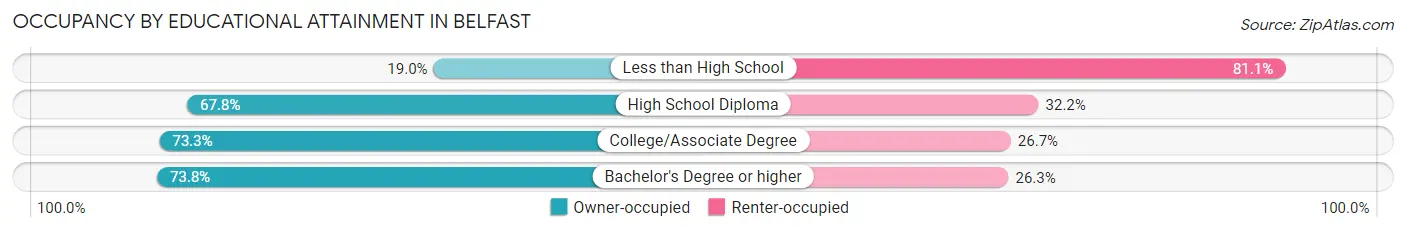
| Household Size | Owner-occupied | Renter-occupied |
| Less than High School | 29 (19.0%) | 124 (81.0%) |
| High School Diploma | 545 (67.8%) | 259 (32.2%) |
| College/Associate Degree | 719 (73.3%) | 262 (26.7%) |
| Bachelor's Degree or higher | 1,045 (73.8%) | 372 (26.3%) |
Occupancy by Age of Householder in Belfast
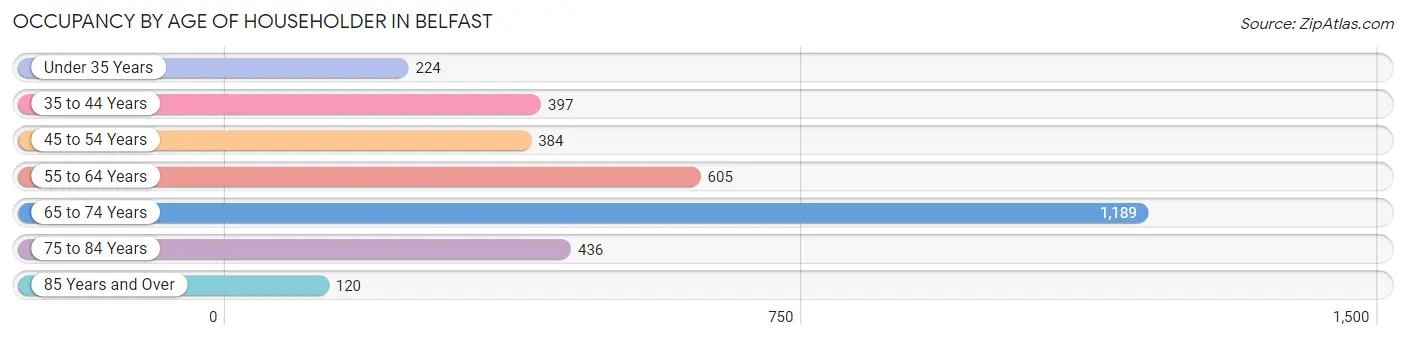
| Age Bracket | # Households | % Households |
| Under 35 Years | 224 | 6.7% |
| 35 to 44 Years | 397 | 11.8% |
| 45 to 54 Years | 384 | 11.5% |
| 55 to 64 Years | 605 | 18.0% |
| 65 to 74 Years | 1,189 | 35.4% |
| 75 to 84 Years | 436 | 13.0% |
| 85 Years and Over | 120 | 3.6% |
| Total | 3,355 | 100.0% |
Housing Finances in Belfast
Median Income by Occupancy in Belfast
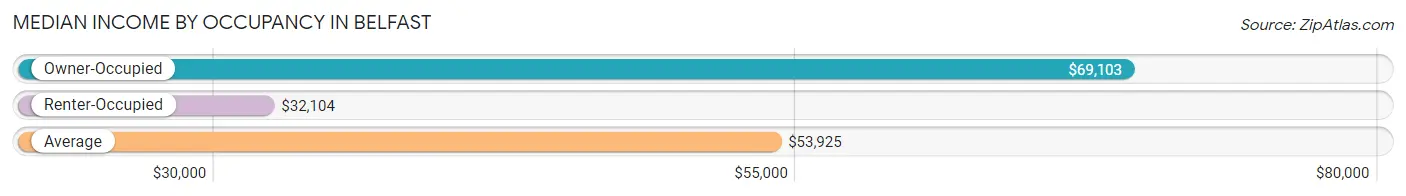
| Occupancy Type | # Households | Median Income |
| Owner-Occupied | 2,338 (69.7%) | $69,103 |
| Renter-Occupied | 1,017 (30.3%) | $32,104 |
| Average | 3,355 (100.0%) | $53,925 |
Occupancy by Householder Income Bracket in Belfast
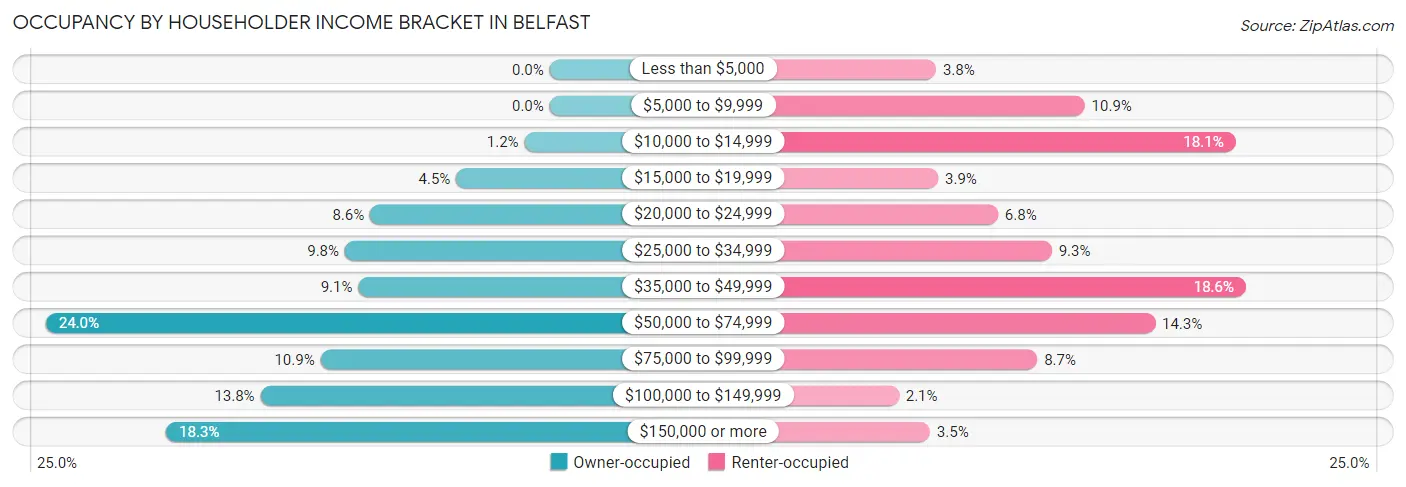
| Income Bracket | Owner-occupied | Renter-occupied |
| Less than $5,000 | 0 (0.0%) | 39 (3.8%) |
| $5,000 to $9,999 | 0 (0.0%) | 111 (10.9%) |
| $10,000 to $14,999 | 28 (1.2%) | 184 (18.1%) |
| $15,000 to $19,999 | 104 (4.4%) | 40 (3.9%) |
| $20,000 to $24,999 | 200 (8.6%) | 69 (6.8%) |
| $25,000 to $34,999 | 228 (9.8%) | 95 (9.3%) |
| $35,000 to $49,999 | 213 (9.1%) | 189 (18.6%) |
| $50,000 to $74,999 | 561 (24.0%) | 145 (14.3%) |
| $75,000 to $99,999 | 255 (10.9%) | 88 (8.6%) |
| $100,000 to $149,999 | 322 (13.8%) | 21 (2.1%) |
| $150,000 or more | 427 (18.3%) | 36 (3.5%) |
| Total | 2,338 (100.0%) | 1,017 (100.0%) |
Monthly Housing Cost Tiers in Belfast
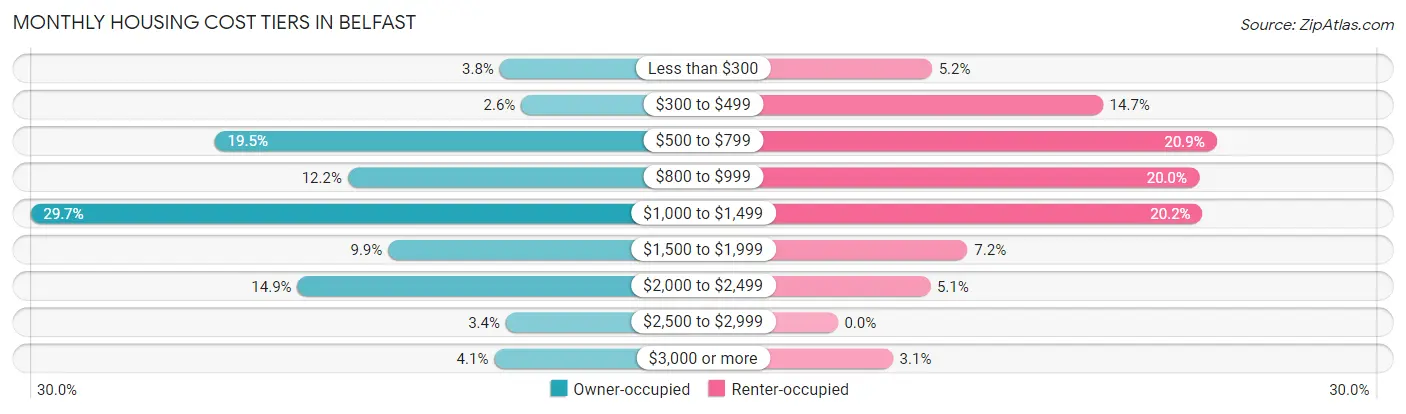
| Monthly Cost | Owner-occupied | Renter-occupied |
| Less than $300 | 88 (3.8%) | 53 (5.2%) |
| $300 to $499 | 60 (2.6%) | 149 (14.6%) |
| $500 to $799 | 456 (19.5%) | 213 (20.9%) |
| $800 to $999 | 284 (12.1%) | 203 (20.0%) |
| $1,000 to $1,499 | 694 (29.7%) | 205 (20.2%) |
| $1,500 to $1,999 | 232 (9.9%) | 73 (7.2%) |
| $2,000 to $2,499 | 349 (14.9%) | 52 (5.1%) |
| $2,500 to $2,999 | 80 (3.4%) | 0 (0.0%) |
| $3,000 or more | 95 (4.1%) | 31 (3.0%) |
| Total | 2,338 (100.0%) | 1,017 (100.0%) |
Physical Housing Characteristics in Belfast
Housing Structures in Belfast
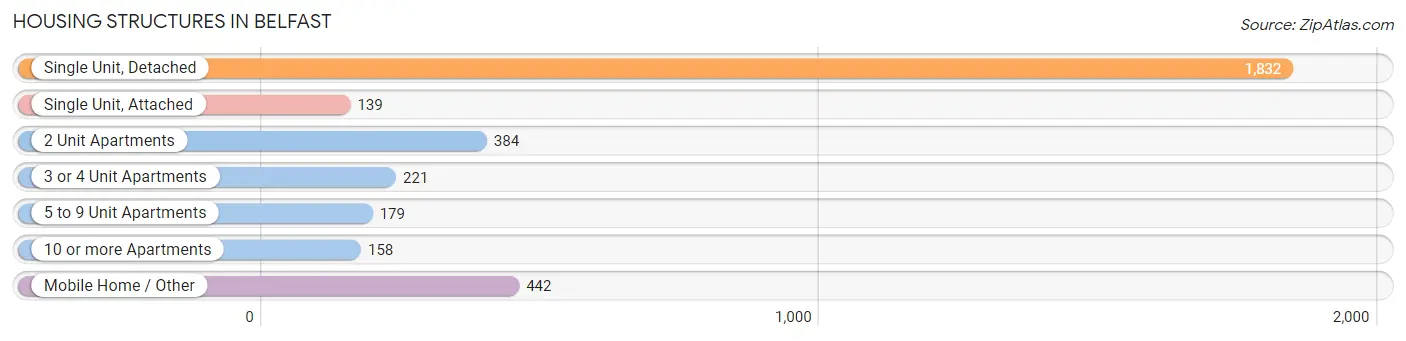
| Structure Type | # Housing Units | % Housing Units |
| Single Unit, Detached | 1,832 | 54.6% |
| Single Unit, Attached | 139 | 4.1% |
| 2 Unit Apartments | 384 | 11.5% |
| 3 or 4 Unit Apartments | 221 | 6.6% |
| 5 to 9 Unit Apartments | 179 | 5.3% |
| 10 or more Apartments | 158 | 4.7% |
| Mobile Home / Other | 442 | 13.2% |
| Total | 3,355 | 100.0% |
Housing Structures by Occupancy in Belfast
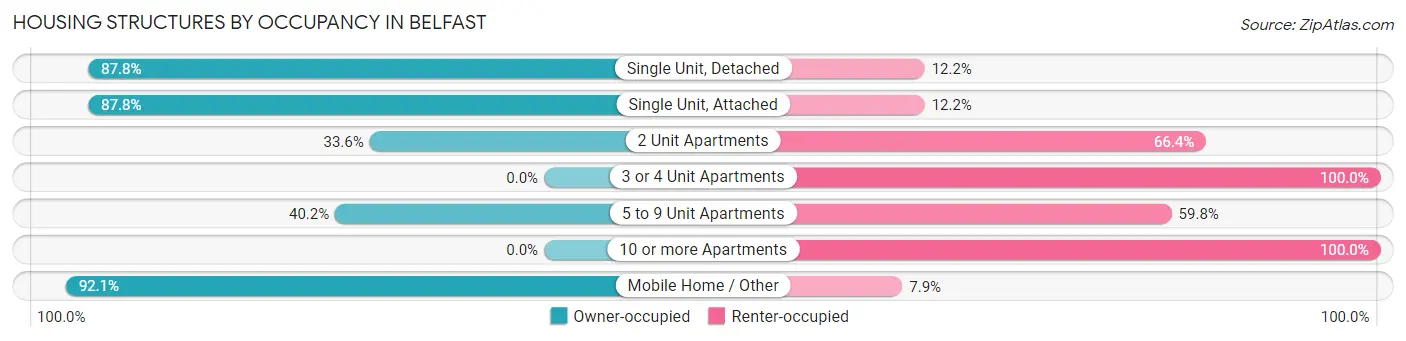
| Structure Type | Owner-occupied | Renter-occupied |
| Single Unit, Detached | 1,608 (87.8%) | 224 (12.2%) |
| Single Unit, Attached | 122 (87.8%) | 17 (12.2%) |
| 2 Unit Apartments | 129 (33.6%) | 255 (66.4%) |
| 3 or 4 Unit Apartments | 0 (0.0%) | 221 (100.0%) |
| 5 to 9 Unit Apartments | 72 (40.2%) | 107 (59.8%) |
| 10 or more Apartments | 0 (0.0%) | 158 (100.0%) |
| Mobile Home / Other | 407 (92.1%) | 35 (7.9%) |
| Total | 2,338 (69.7%) | 1,017 (30.3%) |
Housing Structures by Number of Rooms in Belfast
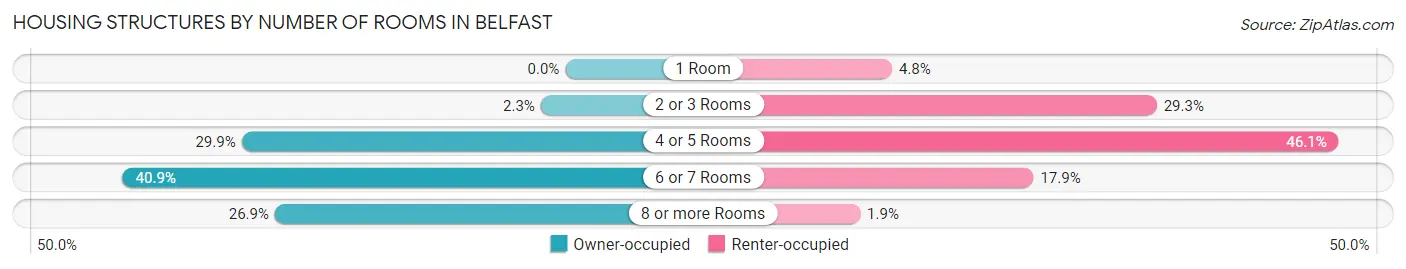
| Number of Rooms | Owner-occupied | Renter-occupied |
| 1 Room | 0 (0.0%) | 49 (4.8%) |
| 2 or 3 Rooms | 53 (2.3%) | 298 (29.3%) |
| 4 or 5 Rooms | 700 (29.9%) | 469 (46.1%) |
| 6 or 7 Rooms | 957 (40.9%) | 182 (17.9%) |
| 8 or more Rooms | 628 (26.9%) | 19 (1.9%) |
| Total | 2,338 (100.0%) | 1,017 (100.0%) |
Housing Structure by Heating Type in Belfast
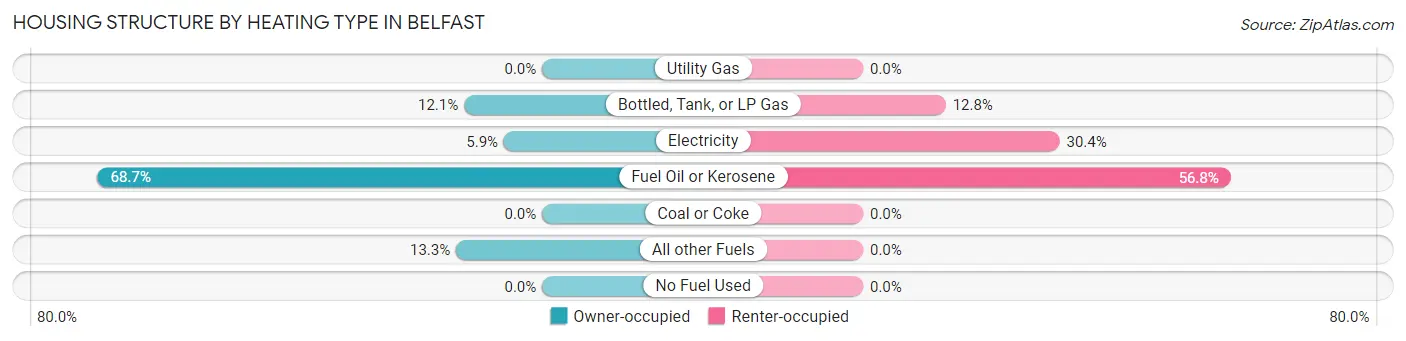
| Heating Type | Owner-occupied | Renter-occupied |
| Utility Gas | 0 (0.0%) | 0 (0.0%) |
| Bottled, Tank, or LP Gas | 282 (12.1%) | 130 (12.8%) |
| Electricity | 138 (5.9%) | 309 (30.4%) |
| Fuel Oil or Kerosene | 1,607 (68.7%) | 578 (56.8%) |
| Coal or Coke | 0 (0.0%) | 0 (0.0%) |
| All other Fuels | 311 (13.3%) | 0 (0.0%) |
| No Fuel Used | 0 (0.0%) | 0 (0.0%) |
| Total | 2,338 (100.0%) | 1,017 (100.0%) |
Household Vehicle Usage in Belfast
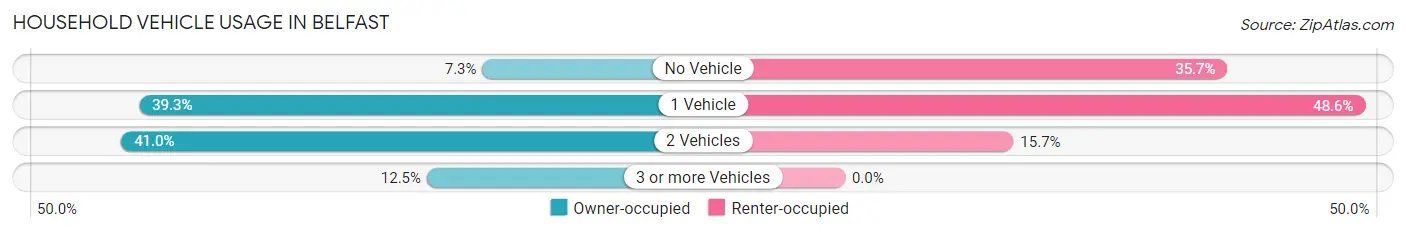
| Vehicles per Household | Owner-occupied | Renter-occupied |
| No Vehicle | 170 (7.3%) | 363 (35.7%) |
| 1 Vehicle | 919 (39.3%) | 494 (48.6%) |
| 2 Vehicles | 958 (41.0%) | 160 (15.7%) |
| 3 or more Vehicles | 291 (12.4%) | 0 (0.0%) |
| Total | 2,338 (100.0%) | 1,017 (100.0%) |
Real Estate & Mortgages in Belfast
Real Estate and Mortgage Overview in Belfast
| Characteristic | Without Mortgage | With Mortgage |
| Housing Units | 1,075 | 1,263 |
| Median Property Value | $280,500 | $207,100 |
| Median Household Income | $64,297 | $294 |
| Monthly Housing Costs | $830 | $74 |
| Real Estate Taxes | $4,200 | $19 |
Property Value by Mortgage Status in Belfast
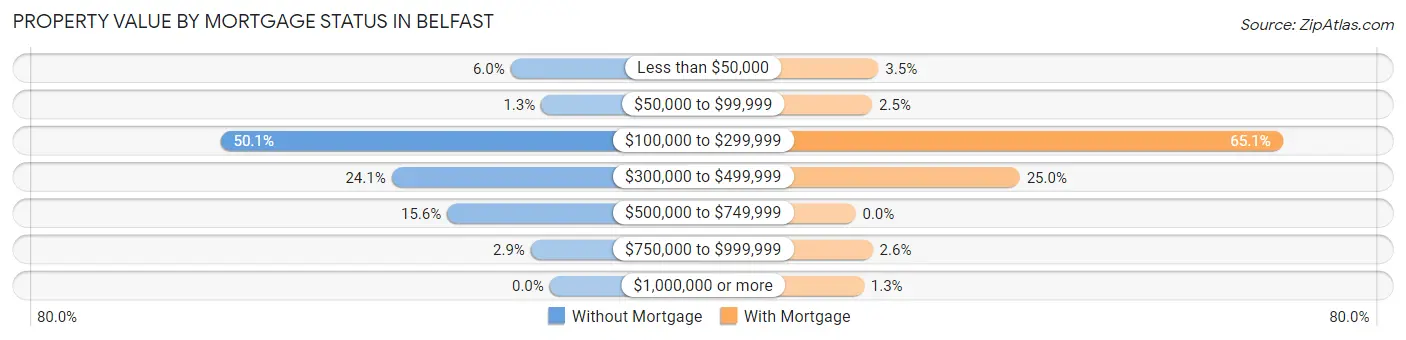
| Property Value | Without Mortgage | With Mortgage |
| Less than $50,000 | 64 (5.9%) | 44 (3.5%) |
| $50,000 to $99,999 | 14 (1.3%) | 32 (2.5%) |
| $100,000 to $299,999 | 539 (50.1%) | 822 (65.1%) |
| $300,000 to $499,999 | 259 (24.1%) | 316 (25.0%) |
| $500,000 to $749,999 | 168 (15.6%) | 0 (0.0%) |
| $750,000 to $999,999 | 31 (2.9%) | 33 (2.6%) |
| $1,000,000 or more | 0 (0.0%) | 16 (1.3%) |
| Total | 1,075 (100.0%) | 1,263 (100.0%) |
Household Income by Mortgage Status in Belfast
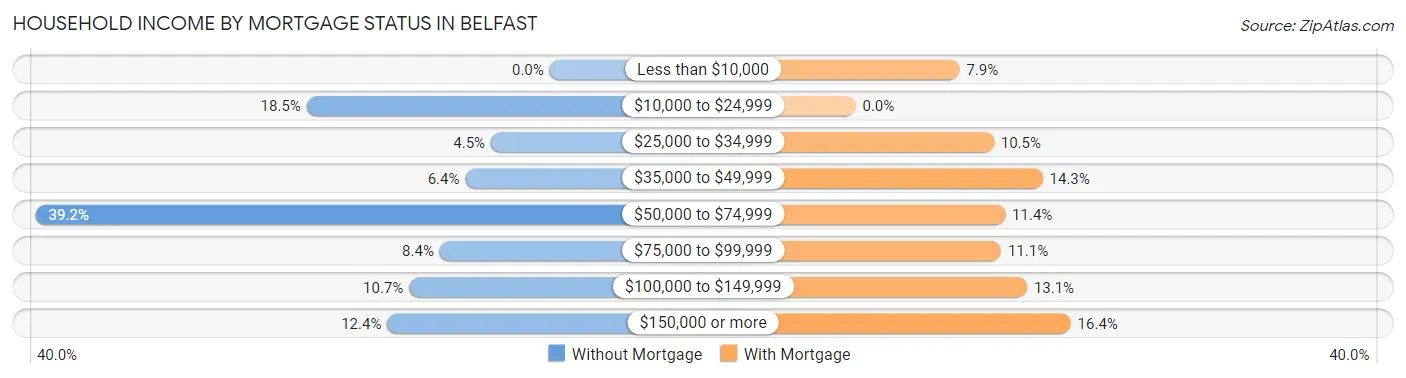
| Household Income | Without Mortgage | With Mortgage |
| Less than $10,000 | 0 (0.0%) | 100 (7.9%) |
| $10,000 to $24,999 | 199 (18.5%) | 0 (0.0%) |
| $25,000 to $34,999 | 48 (4.5%) | 133 (10.5%) |
| $35,000 to $49,999 | 69 (6.4%) | 180 (14.2%) |
| $50,000 to $74,999 | 421 (39.2%) | 144 (11.4%) |
| $75,000 to $99,999 | 90 (8.4%) | 140 (11.1%) |
| $100,000 to $149,999 | 115 (10.7%) | 165 (13.1%) |
| $150,000 or more | 133 (12.4%) | 207 (16.4%) |
| Total | 1,075 (100.0%) | 1,263 (100.0%) |
Property Value to Household Income Ratio in Belfast
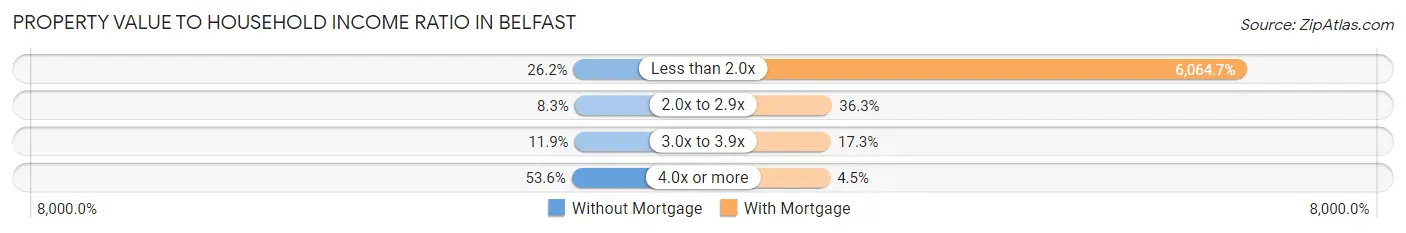
| Value-to-Income Ratio | Without Mortgage | With Mortgage |
| Less than 2.0x | 282 (26.2%) | 76,597 (6,064.7%) |
| 2.0x to 2.9x | 89 (8.3%) | 458 (36.3%) |
| 3.0x to 3.9x | 128 (11.9%) | 219 (17.3%) |
| 4.0x or more | 576 (53.6%) | 57 (4.5%) |
| Total | 1,075 (100.0%) | 1,263 (100.0%) |
Real Estate Taxes by Mortgage Status in Belfast
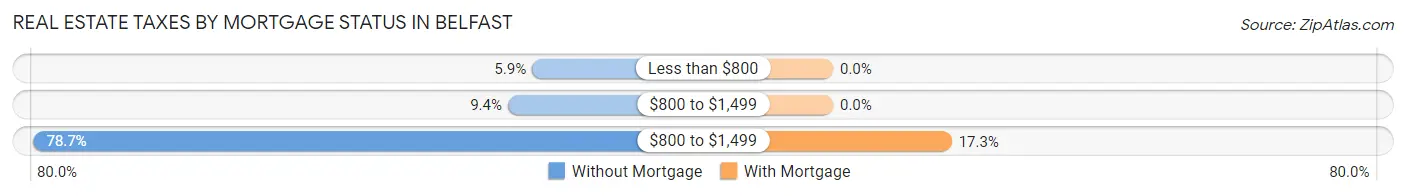
| Property Taxes | Without Mortgage | With Mortgage |
| Less than $800 | 63 (5.9%) | 0 (0.0%) |
| $800 to $1,499 | 101 (9.4%) | 0 (0.0%) |
| $800 to $1,499 | 846 (78.7%) | 219 (17.3%) |
| Total | 1,075 (100.0%) | 1,263 (100.0%) |
Health & Disability in Belfast
Health Insurance Coverage by Age in Belfast
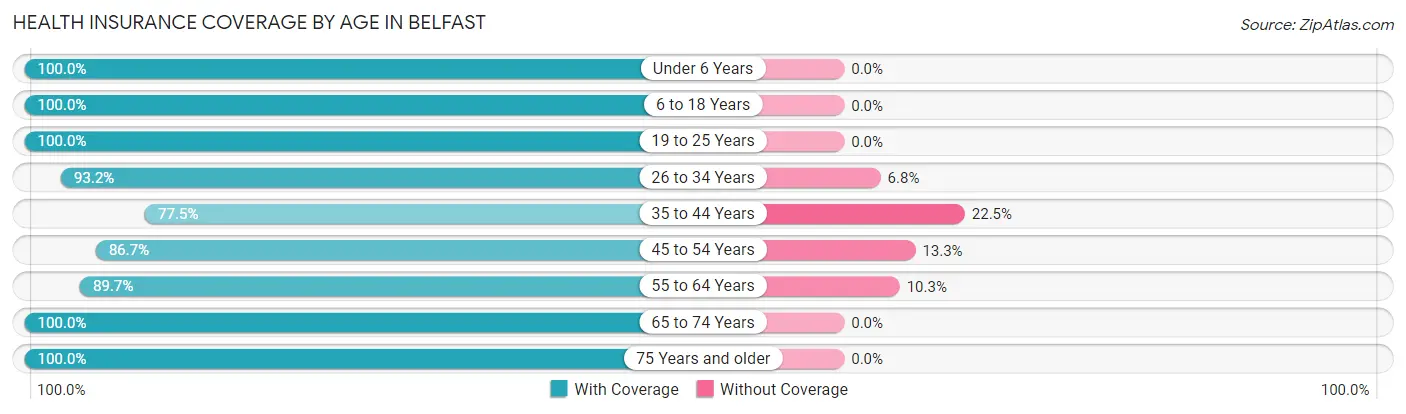
| Age Bracket | With Coverage | Without Coverage |
| Under 6 Years | 235 (100.0%) | 0 (0.0%) |
| 6 to 18 Years | 869 (100.0%) | 0 (0.0%) |
| 19 to 25 Years | 355 (100.0%) | 0 (0.0%) |
| 26 to 34 Years | 344 (93.2%) | 25 (6.8%) |
| 35 to 44 Years | 493 (77.5%) | 143 (22.5%) |
| 45 to 54 Years | 536 (86.7%) | 82 (13.3%) |
| 55 to 64 Years | 1,058 (89.7%) | 122 (10.3%) |
| 65 to 74 Years | 1,671 (100.0%) | 0 (0.0%) |
| 75 Years and older | 864 (100.0%) | 0 (0.0%) |
| Total | 6,425 (94.5%) | 372 (5.5%) |
Health Insurance Coverage by Citizenship Status in Belfast
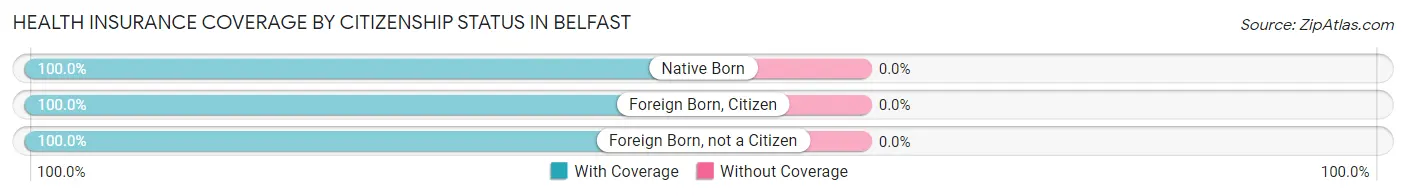
| Citizenship Status | With Coverage | Without Coverage |
| Native Born | 235 (100.0%) | 0 (0.0%) |
| Foreign Born, Citizen | 869 (100.0%) | 0 (0.0%) |
| Foreign Born, not a Citizen | 355 (100.0%) | 0 (0.0%) |
Health Insurance Coverage by Household Income in Belfast
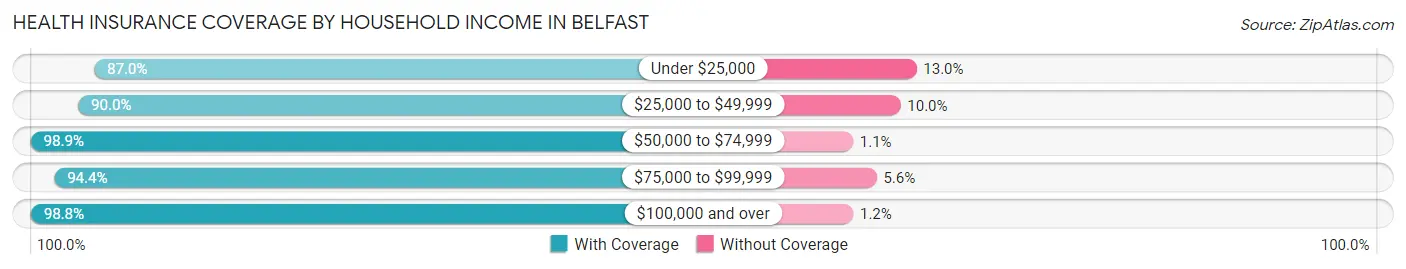
| Household Income | With Coverage | Without Coverage |
| Under $25,000 | 1,181 (87.0%) | 177 (13.0%) |
| $25,000 to $49,999 | 1,013 (90.0%) | 113 (10.0%) |
| $50,000 to $74,999 | 1,647 (98.9%) | 19 (1.1%) |
| $75,000 to $99,999 | 697 (94.4%) | 41 (5.6%) |
| $100,000 and over | 1,861 (98.8%) | 22 (1.2%) |
Public vs Private Health Insurance Coverage by Age in Belfast
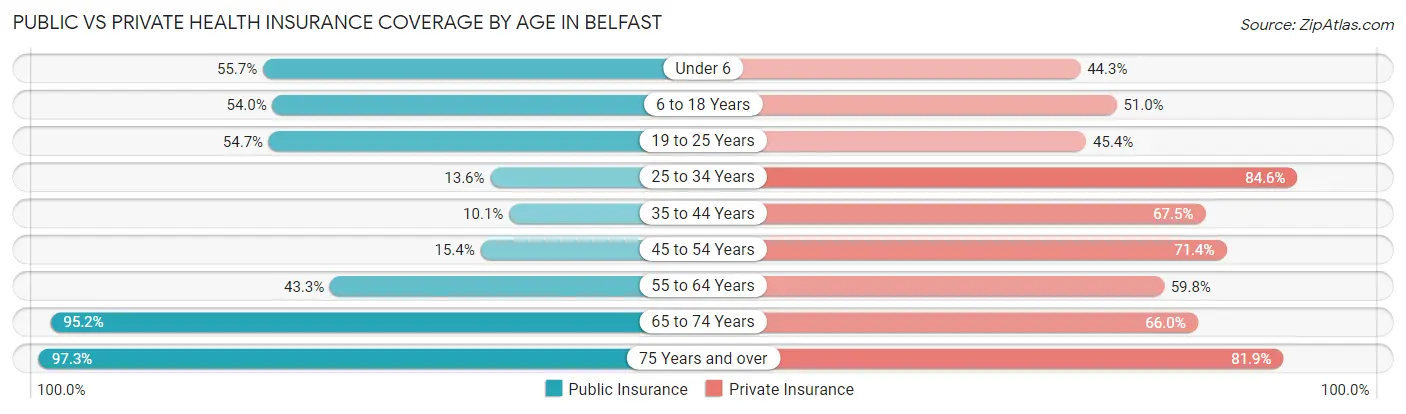
| Age Bracket | Public Insurance | Private Insurance |
| Under 6 | 131 (55.7%) | 104 (44.3%) |
| 6 to 18 Years | 469 (54.0%) | 443 (51.0%) |
| 19 to 25 Years | 194 (54.6%) | 161 (45.4%) |
| 25 to 34 Years | 50 (13.6%) | 312 (84.6%) |
| 35 to 44 Years | 64 (10.1%) | 429 (67.4%) |
| 45 to 54 Years | 95 (15.4%) | 441 (71.4%) |
| 55 to 64 Years | 511 (43.3%) | 705 (59.8%) |
| 65 to 74 Years | 1,591 (95.2%) | 1,103 (66.0%) |
| 75 Years and over | 841 (97.3%) | 708 (81.9%) |
| Total | 3,946 (58.1%) | 4,406 (64.8%) |
Disability Status by Sex by Age in Belfast
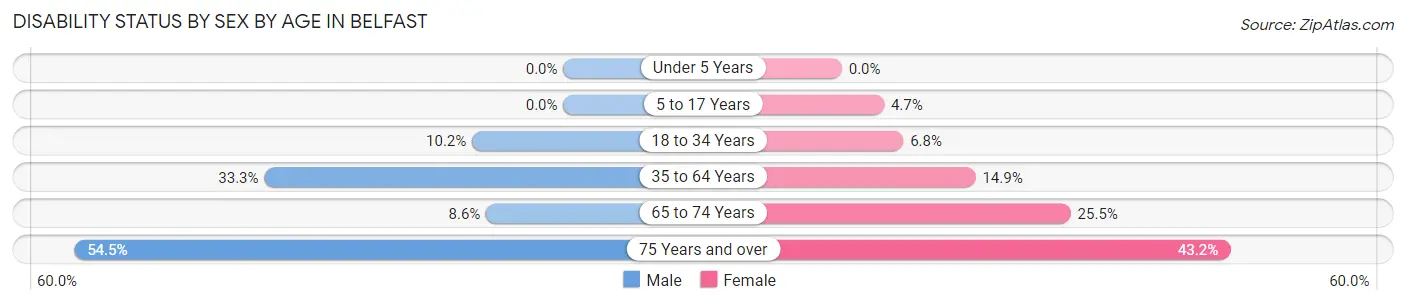
| Age Bracket | Male | Female |
| Under 5 Years | 0 (0.0%) | 0 (0.0%) |
| 5 to 17 Years | 0 (0.0%) | 18 (4.7%) |
| 18 to 34 Years | 32 (10.2%) | 32 (6.8%) |
| 35 to 64 Years | 343 (33.3%) | 209 (14.9%) |
| 65 to 74 Years | 65 (8.6%) | 233 (25.5%) |
| 75 Years and over | 201 (54.5%) | 214 (43.2%) |
Disability Class by Sex by Age in Belfast
Disability Class: Hearing Difficulty
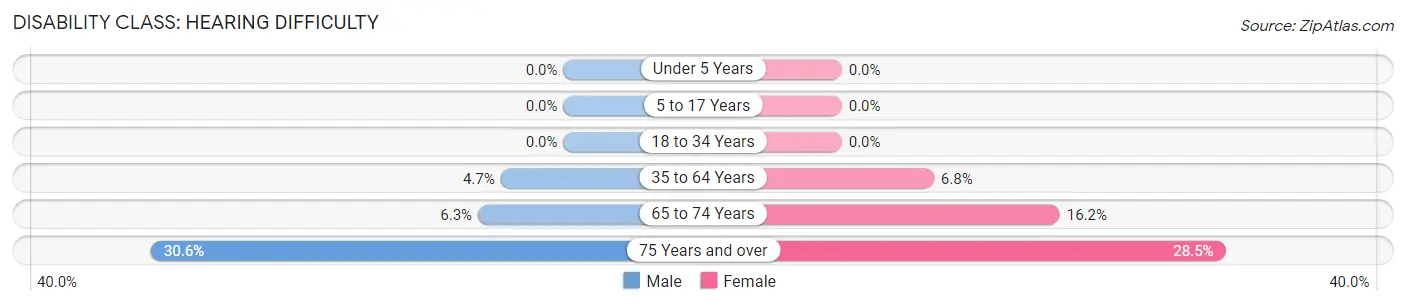
| Age Bracket | Male | Female |
| Under 5 Years | 0 (0.0%) | 0 (0.0%) |
| 5 to 17 Years | 0 (0.0%) | 0 (0.0%) |
| 18 to 34 Years | 0 (0.0%) | 0 (0.0%) |
| 35 to 64 Years | 48 (4.7%) | 96 (6.8%) |
| 65 to 74 Years | 48 (6.3%) | 148 (16.2%) |
| 75 Years and over | 113 (30.6%) | 141 (28.5%) |
Disability Class: Vision Difficulty
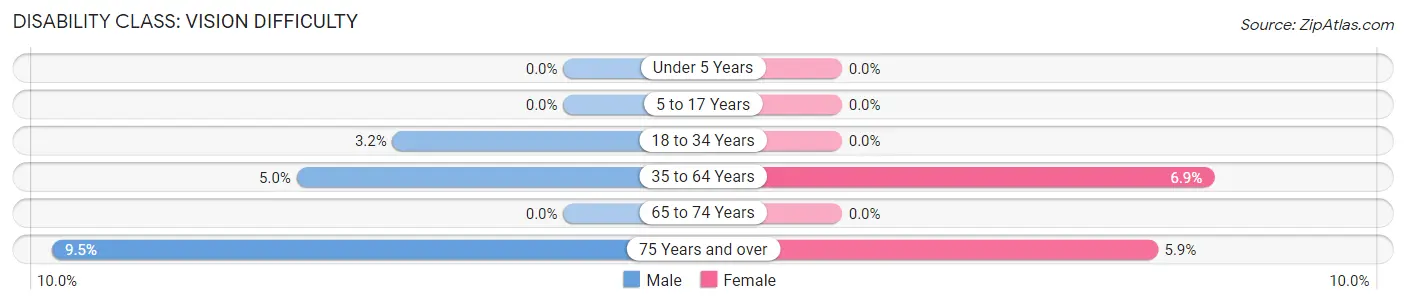
| Age Bracket | Male | Female |
| Under 5 Years | 0 (0.0%) | 0 (0.0%) |
| 5 to 17 Years | 0 (0.0%) | 0 (0.0%) |
| 18 to 34 Years | 10 (3.2%) | 0 (0.0%) |
| 35 to 64 Years | 51 (5.0%) | 97 (6.9%) |
| 65 to 74 Years | 0 (0.0%) | 0 (0.0%) |
| 75 Years and over | 35 (9.5%) | 29 (5.9%) |
Disability Class: Cognitive Difficulty
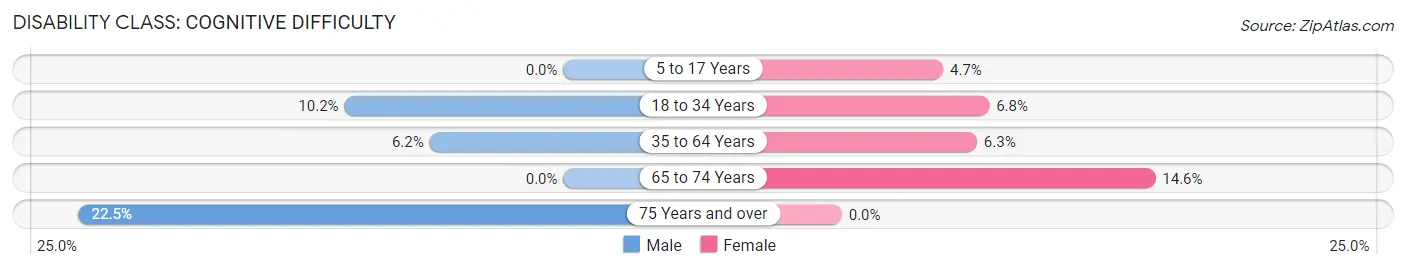
| Age Bracket | Male | Female |
| 5 to 17 Years | 0 (0.0%) | 18 (4.7%) |
| 18 to 34 Years | 32 (10.2%) | 32 (6.8%) |
| 35 to 64 Years | 64 (6.2%) | 88 (6.3%) |
| 65 to 74 Years | 0 (0.0%) | 133 (14.5%) |
| 75 Years and over | 83 (22.5%) | 0 (0.0%) |
Disability Class: Ambulatory Difficulty
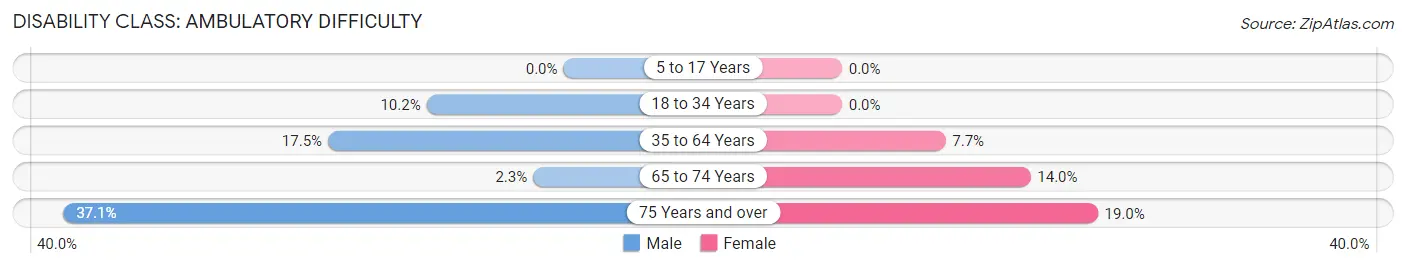
| Age Bracket | Male | Female |
| 5 to 17 Years | 0 (0.0%) | 0 (0.0%) |
| 18 to 34 Years | 32 (10.2%) | 0 (0.0%) |
| 35 to 64 Years | 180 (17.5%) | 108 (7.7%) |
| 65 to 74 Years | 17 (2.2%) | 128 (14.0%) |
| 75 Years and over | 137 (37.1%) | 94 (19.0%) |
Disability Class: Self-Care Difficulty
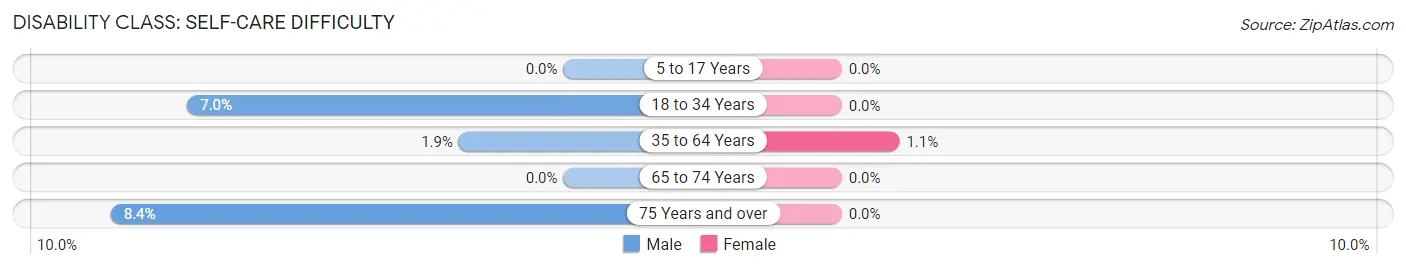
| Age Bracket | Male | Female |
| 5 to 17 Years | 0 (0.0%) | 0 (0.0%) |
| 18 to 34 Years | 22 (7.0%) | 0 (0.0%) |
| 35 to 64 Years | 20 (1.9%) | 15 (1.1%) |
| 65 to 74 Years | 0 (0.0%) | 0 (0.0%) |
| 75 Years and over | 31 (8.4%) | 0 (0.0%) |
Technology Access in Belfast
Computing Device Access in Belfast
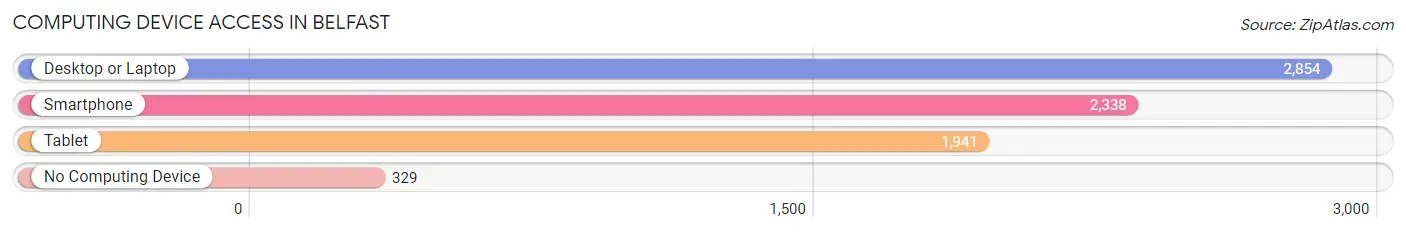
| Device Type | # Households | % Households |
| Desktop or Laptop | 2,854 | 85.1% |
| Smartphone | 2,338 | 69.7% |
| Tablet | 1,941 | 57.9% |
| No Computing Device | 329 | 9.8% |
| Total | 3,355 | 100.0% |
Internet Access in Belfast
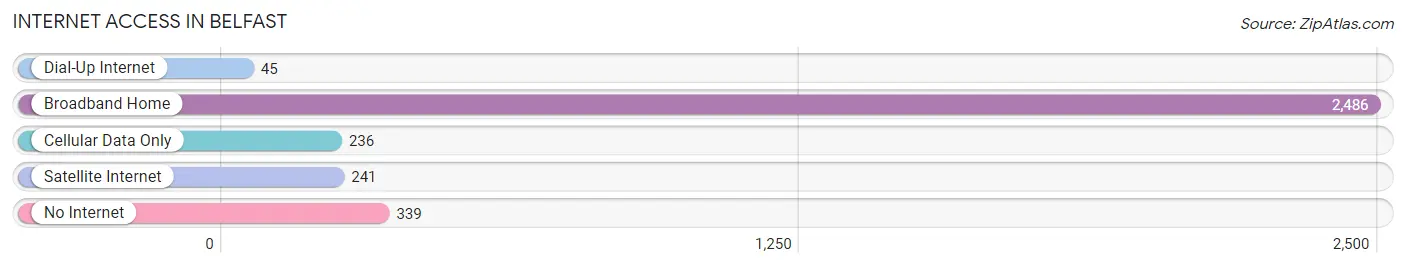
| Internet Type | # Households | % Households |
| Dial-Up Internet | 45 | 1.3% |
| Broadband Home | 2,486 | 74.1% |
| Cellular Data Only | 236 | 7.0% |
| Satellite Internet | 241 | 7.2% |
| No Internet | 339 | 10.1% |
| Total | 3,355 | 100.0% |
Belfast Summary
Belfast is a city located in Waldo County, Maine, United States. It is the county seat of Waldo County and is located on the Penobscot Bay. Belfast is a small city with a population of 6,668 as of the 2010 census. It is a popular tourist destination due to its proximity to the coast and its many attractions.
History
The area that is now Belfast was first settled in 1770 by a group of Scots-Irish immigrants led by William Gray. The settlement was originally called "Graytown" after its founder, but was later renamed Belfast after the city in Northern Ireland. The city was incorporated in 1773 and quickly became a major port and shipbuilding center. During the War of 1812, Belfast was a major supplier of ships and supplies to the United States Navy.
In the 19th century, Belfast was a major center for the lumber industry and was home to several large sawmills. The city also had a thriving shipbuilding industry, which produced a number of famous ships, including the USS Constitution.
In the 20th century, Belfast's economy shifted away from the lumber and shipbuilding industries and towards tourism and the service sector. The city is now home to a number of restaurants, shops, and other businesses catering to tourists.
Geography
Belfast is located in Waldo County, Maine, on the Penobscot Bay. The city is situated on the east bank of the Passagassawakeag River, which flows into the bay. Belfast is bordered by the towns of Northport to the north, Searsport to the east, and Stockton Springs to the south.
The city has a total area of 8.3 square miles, of which 7.9 square miles is land and 0.4 square miles is water. Belfast is located about 50 miles northeast of Augusta, the state capital, and about 90 miles northeast of Portland, the state's largest city.
Economy
Belfast's economy is largely based on tourism and the service sector. The city is home to a number of restaurants, shops, and other businesses catering to tourists. The city is also home to a number of manufacturing companies, including a paper mill and a boatbuilding company.
The city is also home to a number of educational institutions, including the University of Maine at Belfast, the Maine Maritime Academy, and the Waldo County Technical Center.
Demographics
As of the 2010 census, there were 6,668 people, 2,845 households, and 1,717 families residing in the city. The population density was 845.3 people per square mile. There were 3,093 housing units at an average density of 391.2 per square mile.
The racial makeup of the city was 94.3% White, 0.7% African American, 0.7% Native American, 1.2% Asian, 0.1% Pacific Islander, 0.7% from other races, and 2.4% from two or more races. Hispanic or Latino of any race were 2.2% of the population.
There were 2,845 households, out of which 24.3% had children under the age of 18 living with them, 44.2% were married couples living together, 11.7% had a female householder with no husband present, and 39.7% were non-families. 32.2% of all households were made up of individuals, and 13.2% had someone living alone who was 65 years of age or older. The average household size was 2.25 and the average family size was 2.83.
In the city, the population was spread out, with 21.2% under the age of 18, 8.2% from 18 to 24, 25.2% from 25 to 44, 27.2% from 45 to 64, and 18.2% who were 65 years of age or older. The median age was 41 years. For every 100 females, there were 91.2 males. For every 100 females age 18 and over, there were 88.2 males.
The median income for a household in the city was $35,938, and the median income for a family was $45,938. Males had a median income of $31,938 versus $25,938 for females. The per capita income for the city was $20,938. About 9.2% of families and 12.2% of the population were below the poverty line, including 16.2% of those under age 18 and 8.2% of those age 65 or over.
Common Questions
What is Per Capita Income in Belfast?
Per Capita income in Belfast is $41,501.
What is the Median Family Income in Belfast?
Median Family Income in Belfast is $71,166.
What is the Median Household income in Belfast?
Median Household Income in Belfast is $53,925.
What is Income or Wage Gap in Belfast?
Income or Wage Gap in Belfast is 58.7%.
Women in Belfast earn 41.3 cents for every dollar earned by a man.
What is Family Income Deficit in Belfast?
Family Income Deficit in Belfast is $4,173.
Families that are below poverty line in Belfast earn $4,173 less on average than the poverty threshold level.
What is Inequality or Gini Index in Belfast?
Inequality or Gini Index in Belfast is 0.49.
What is the Total Population of Belfast?
Total Population of Belfast is 6,953.
What is the Total Male Population of Belfast?
Total Male Population of Belfast is 3,020.
What is the Total Female Population of Belfast?
Total Female Population of Belfast is 3,933.
What is the Ratio of Males per 100 Females in Belfast?
There are 76.79 Males per 100 Females in Belfast.
What is the Ratio of Females per 100 Males in Belfast?
There are 130.23 Females per 100 Males in Belfast.
What is the Median Population Age in Belfast?
Median Population Age in Belfast is 60.3 Years.
What is the Average Family Size in Belfast
Average Family Size in Belfast is 2.4 People.
What is the Average Household Size in Belfast
Average Household Size in Belfast is 2.0 People.
How Large is the Labor Force in Belfast?
There are 2,539 People in the Labor Forcein in Belfast.
What is the Percentage of People in the Labor Force in Belfast?
42.2% of People are in the Labor Force in Belfast.
What is the Unemployment Rate in Belfast?
Unemployment Rate in Belfast is 4.1%.