Hallowell, ME Map & Demographics
Hallowell Map
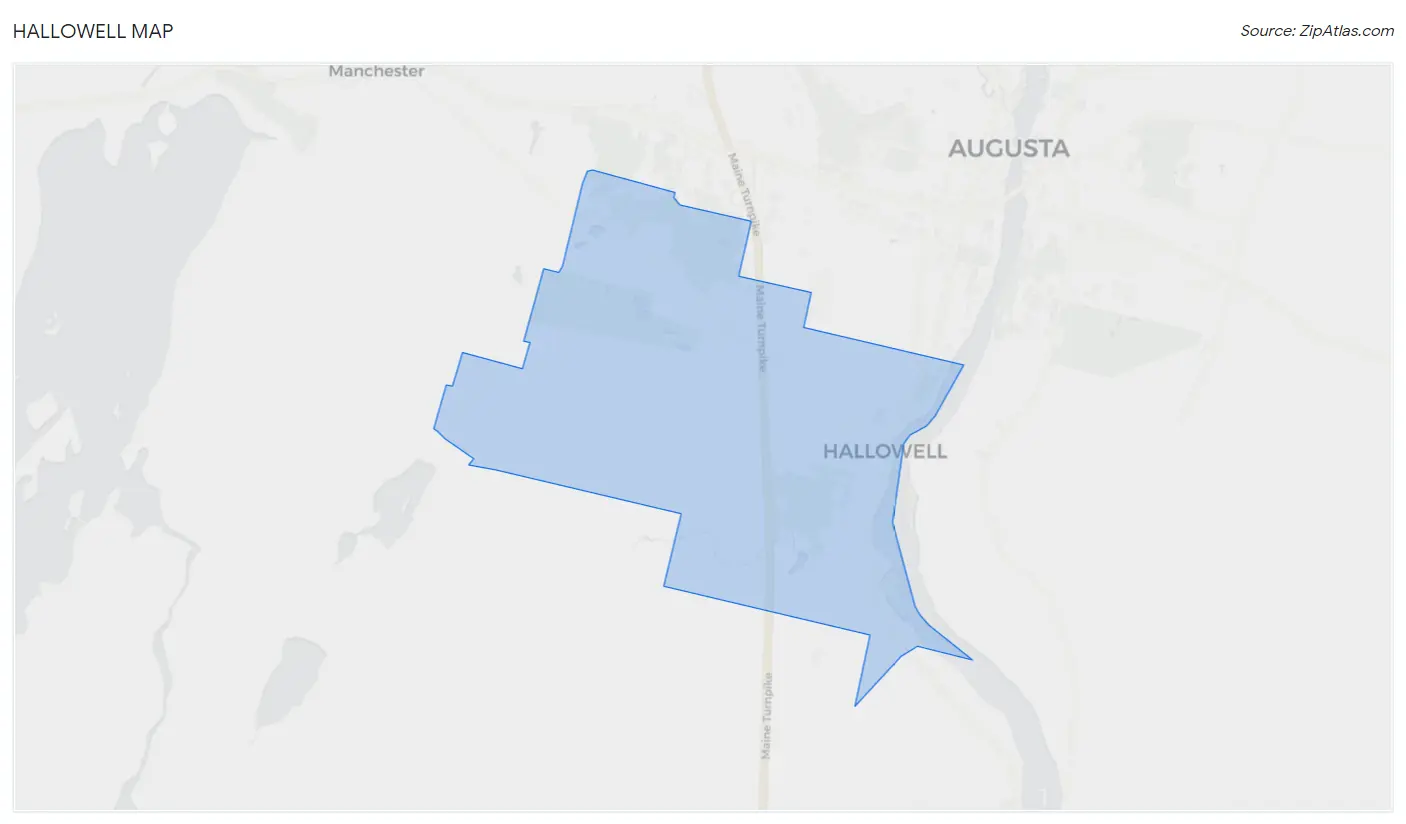
Hallowell Overview
$43,597
PER CAPITA INCOME
$76,974
AVG FAMILY INCOME
$62,990
AVG HOUSEHOLD INCOME
15.1%
WAGE / INCOME GAP [ % ]
84.9¢/ $1
WAGE / INCOME GAP [ $ ]
0.47
INEQUALITY / GINI INDEX
2,558
TOTAL POPULATION
1,217
MALE POPULATION
1,341
FEMALE POPULATION
90.75
MALES / 100 FEMALES
110.19
FEMALES / 100 MALES
49.5
MEDIAN AGE
2.7
AVG FAMILY SIZE
1.8
AVG HOUSEHOLD SIZE
1,376
LABOR FORCE [ PEOPLE ]
60.8%
PERCENT IN LABOR FORCE
0.9%
UNEMPLOYMENT RATE
Hallowell Zip Codes
Hallowell Area Codes
Income in Hallowell
Income Overview in Hallowell
Per Capita Income in Hallowell is $43,597, while median incomes of families and households are $76,974 and $62,990 respectively.
| Characteristic | Number | Measure |
| Per Capita Income | 2,558 | $43,597 |
| Median Family Income | 558 | $76,974 |
| Mean Family Income | 558 | $105,359 |
| Median Household Income | 1,359 | $62,990 |
| Mean Household Income | 1,359 | $79,311 |
| Income Deficit | 558 | $0 |
| Wage / Income Gap (%) | 2,558 | 15.08% |
| Wage / Income Gap ($) | 2,558 | 84.92¢ per $1 |
| Gini / Inequality Index | 2,558 | 0.47 |
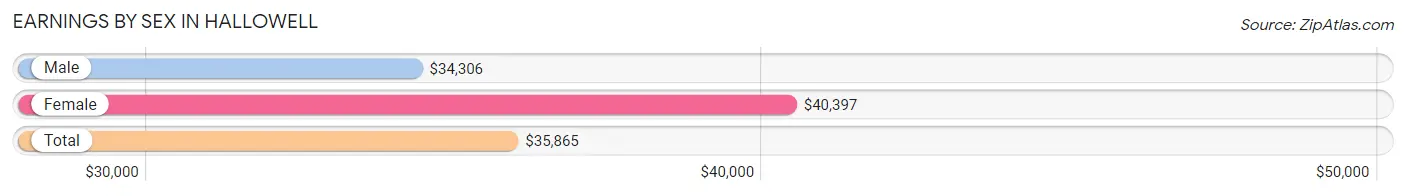
Earnings by Sex in Hallowell
Average Earnings in Hallowell are $35,865, $34,306 for men and $40,397 for women, a difference of 15.1%.
| Sex | Number | Average Earnings |
| Male | 647 (43.4%) | $34,306 |
| Female | 842 (56.6%) | $40,397 |
| Total | 1,489 (100.0%) | $35,865 |
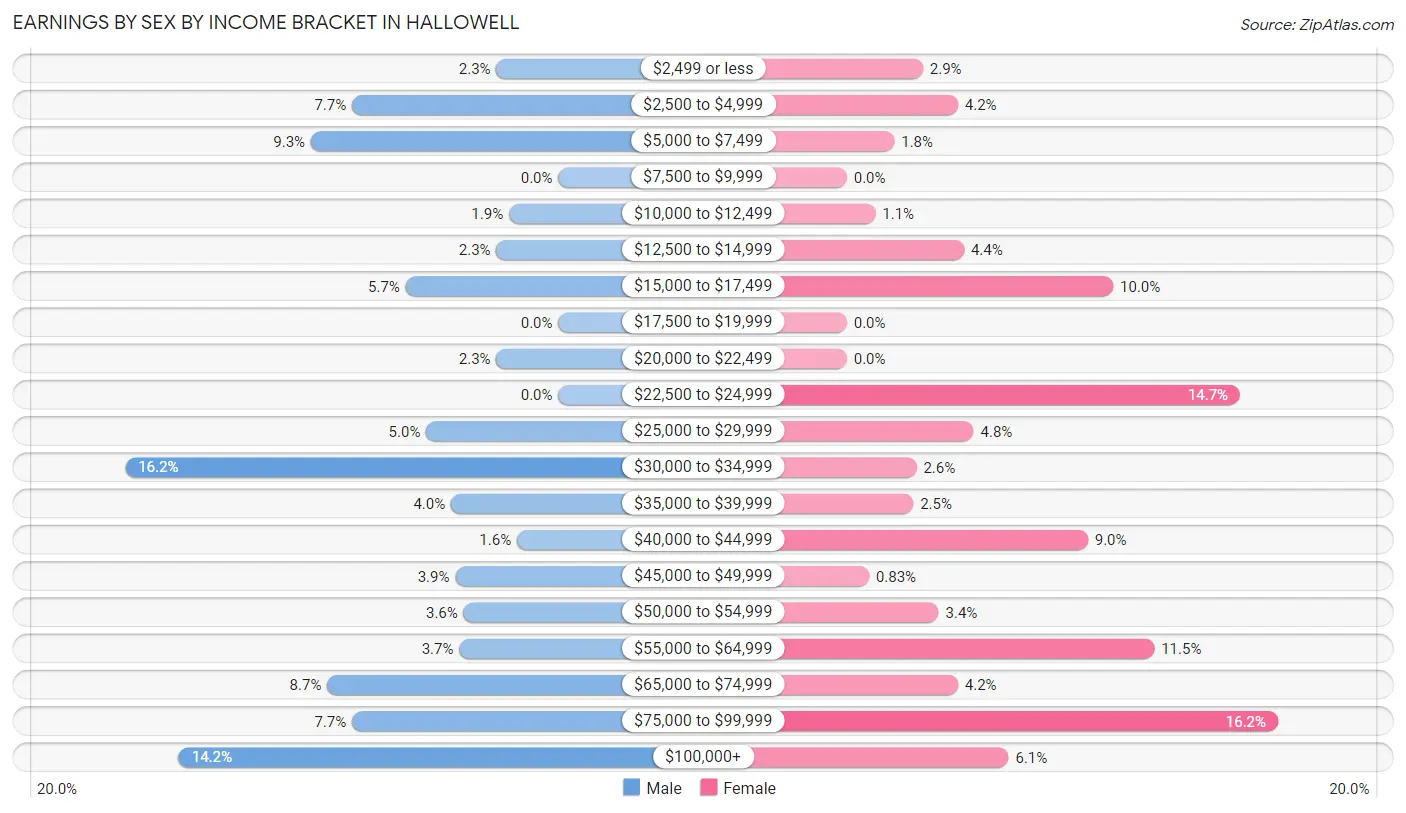
Earnings by Sex by Income Bracket in Hallowell
The most common earnings brackets in Hallowell are $30,000 to $34,999 for men (105 | 16.2%) and $75,000 to $99,999 for women (136 | 16.2%).
| Income | Male | Female |
| $2,499 or less | 15 (2.3%) | 24 (2.9%) |
| $2,500 to $4,999 | 50 (7.7%) | 35 (4.2%) |
| $5,000 to $7,499 | 60 (9.3%) | 15 (1.8%) |
| $7,500 to $9,999 | 0 (0.0%) | 0 (0.0%) |
| $10,000 to $12,499 | 12 (1.8%) | 9 (1.1%) |
| $12,500 to $14,999 | 15 (2.3%) | 37 (4.4%) |
| $15,000 to $17,499 | 37 (5.7%) | 84 (10.0%) |
| $17,500 to $19,999 | 0 (0.0%) | 0 (0.0%) |
| $20,000 to $22,499 | 15 (2.3%) | 0 (0.0%) |
| $22,500 to $24,999 | 0 (0.0%) | 124 (14.7%) |
| $25,000 to $29,999 | 32 (5.0%) | 40 (4.8%) |
| $30,000 to $34,999 | 105 (16.2%) | 22 (2.6%) |
| $35,000 to $39,999 | 26 (4.0%) | 21 (2.5%) |
| $40,000 to $44,999 | 10 (1.5%) | 76 (9.0%) |
| $45,000 to $49,999 | 25 (3.9%) | 7 (0.8%) |
| $50,000 to $54,999 | 23 (3.5%) | 29 (3.4%) |
| $55,000 to $64,999 | 24 (3.7%) | 97 (11.5%) |
| $65,000 to $74,999 | 56 (8.7%) | 35 (4.2%) |
| $75,000 to $99,999 | 50 (7.7%) | 136 (16.2%) |
| $100,000+ | 92 (14.2%) | 51 (6.1%) |
| Total | 647 (100.0%) | 842 (100.0%) |
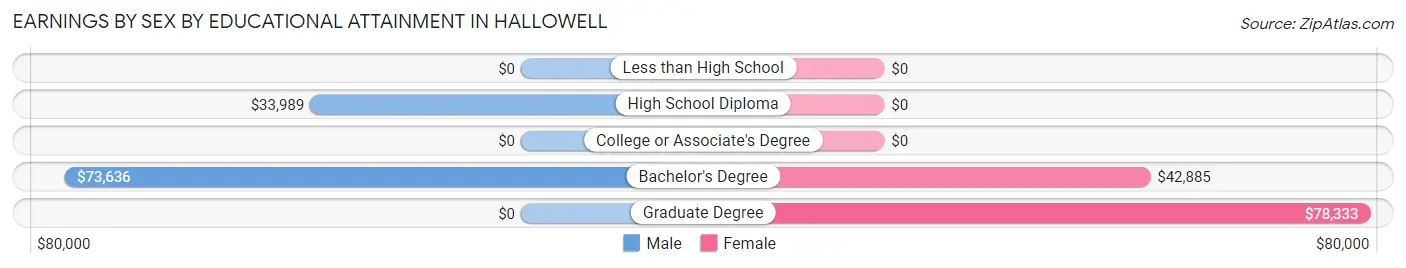
Earnings by Sex by Educational Attainment in Hallowell
Average earnings in Hallowell are $34,894 for men and $49,464 for women, a difference of 29.5%. Men with an educational attainment of bachelor's degree enjoy the highest average annual earnings of $73,636, while those with high school diploma education earn the least with $33,989. Women with an educational attainment of graduate degree earn the most with the average annual earnings of $78,333, while those with bachelor's degree education have the smallest earnings of $42,885.
| Educational Attainment | Male Income | Female Income |
| Less than High School | - | - |
| High School Diploma | $33,989 | $0 |
| College or Associate's Degree | - | - |
| Bachelor's Degree | $73,636 | $42,885 |
| Graduate Degree | - | - |
| Total | $34,894 | $49,464 |
Family Income in Hallowell
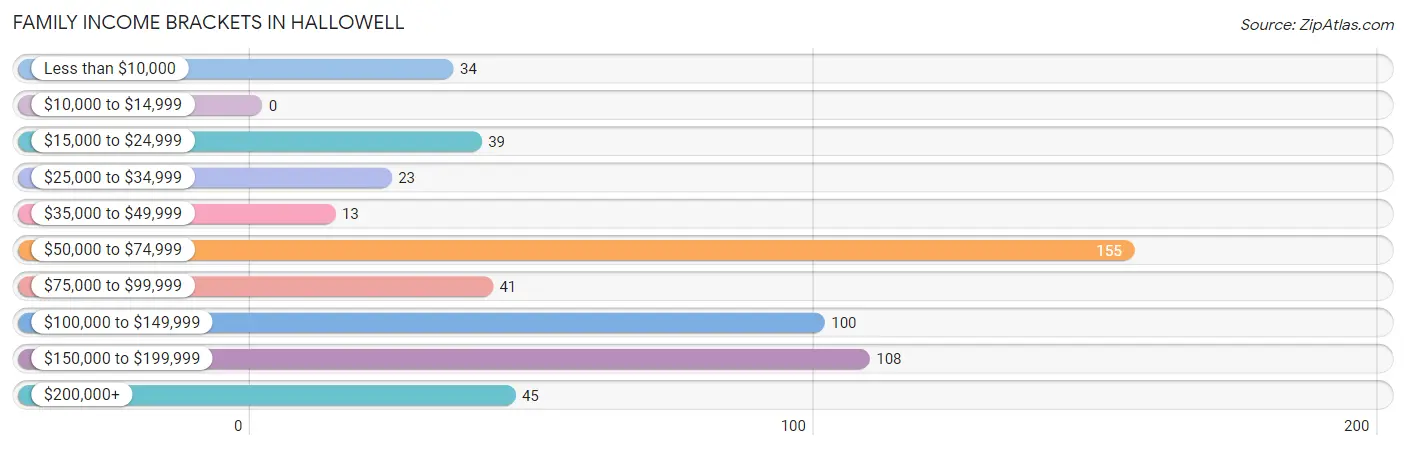
Family Income Brackets in Hallowell
According to the Hallowell family income data, there are 155 families falling into the $50,000 to $74,999 income range, which is the most common income bracket and makes up 27.8% of all families.
| Income Bracket | # Families | % Families |
| Less than $10,000 | 34 | 6.1% |
| $10,000 to $14,999 | 0 | 0.0% |
| $15,000 to $24,999 | 39 | 7.0% |
| $25,000 to $34,999 | 23 | 4.1% |
| $35,000 to $49,999 | 13 | 2.3% |
| $50,000 to $74,999 | 155 | 27.8% |
| $75,000 to $99,999 | 41 | 7.3% |
| $100,000 to $149,999 | 100 | 17.9% |
| $150,000 to $199,999 | 108 | 19.4% |
| $200,000+ | 45 | 8.1% |
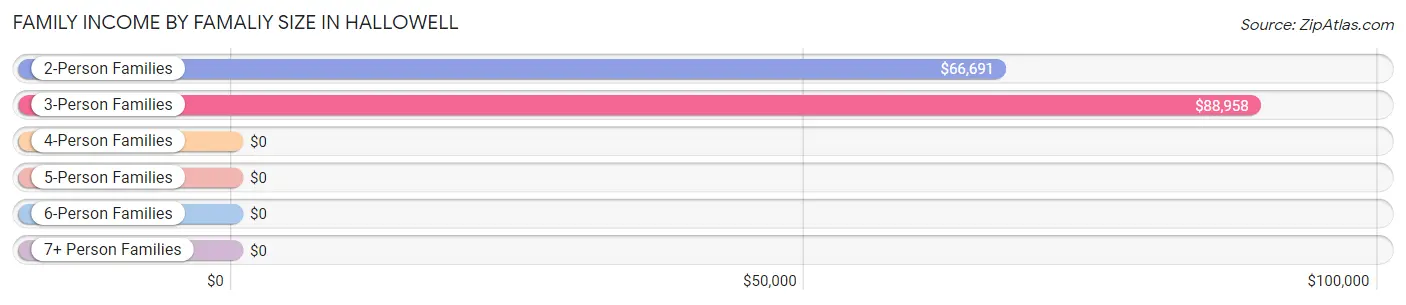
Family Income by Famaliy Size in Hallowell
3-person families (96 | 17.2%) account for the highest median family income in Hallowell with $88,958 per family, while 2-person families (378 | 67.7%) have the highest median income of $33,346 per family member.
| Income Bracket | # Families | Median Income |
| 2-Person Families | 378 (67.7%) | $66,691 |
| 3-Person Families | 96 (17.2%) | $88,958 |
| 4-Person Families | 39 (7.0%) | $0 |
| 5-Person Families | 14 (2.5%) | $0 |
| 6-Person Families | 31 (5.6%) | $0 |
| 7+ Person Families | 0 (0.0%) | $0 |
| Total | 558 (100.0%) | $76,974 |
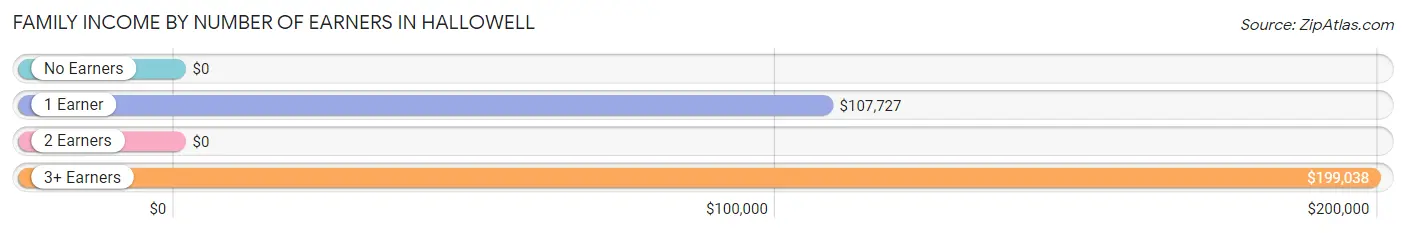
Family Income by Number of Earners in Hallowell
| Number of Earners | # Families | Median Income |
| No Earners | 96 (17.2%) | $0 |
| 1 Earner | 148 (26.5%) | $107,727 |
| 2 Earners | 276 (49.5%) | $0 |
| 3+ Earners | 38 (6.8%) | $199,038 |
| Total | 558 (100.0%) | $76,974 |
Household Income in Hallowell
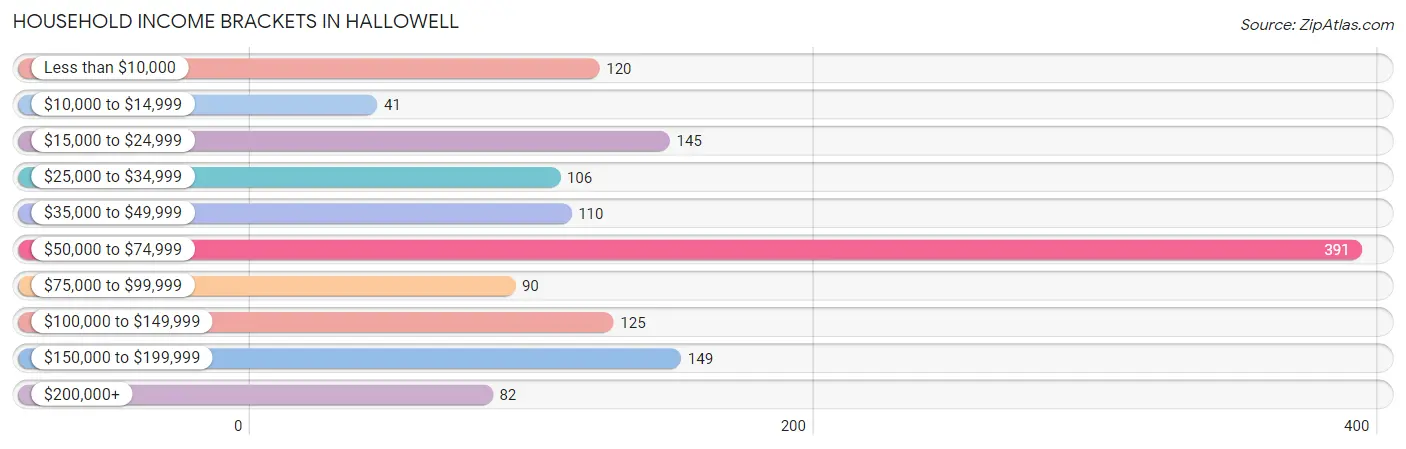
Household Income Brackets in Hallowell
With 391 households falling in the category, the $50,000 to $74,999 income range is the most frequent in Hallowell, accounting for 28.8% of all households. In contrast, only 41 households (3.0%) fall into the $10,000 to $14,999 income bracket, making it the least populous group.
| Income Bracket | # Households | % Households |
| Less than $10,000 | 120 | 8.8% |
| $10,000 to $14,999 | 41 | 3.0% |
| $15,000 to $24,999 | 145 | 10.7% |
| $25,000 to $34,999 | 106 | 7.8% |
| $35,000 to $49,999 | 110 | 8.1% |
| $50,000 to $74,999 | 391 | 28.8% |
| $75,000 to $99,999 | 90 | 6.6% |
| $100,000 to $149,999 | 125 | 9.2% |
| $150,000 to $199,999 | 149 | 11.0% |
| $200,000+ | 82 | 6.0% |
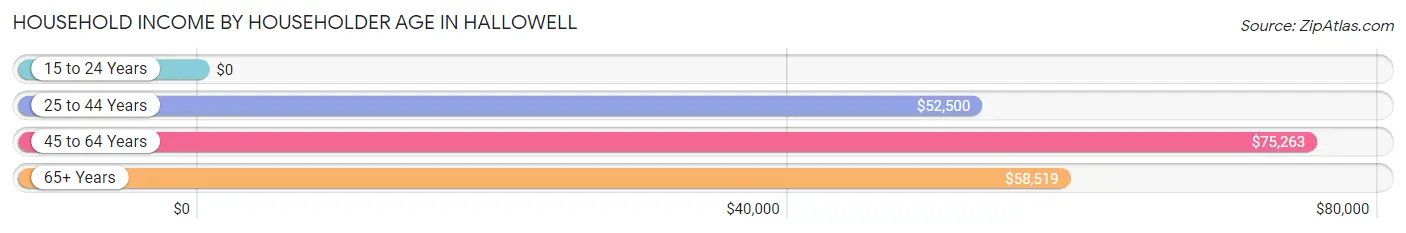
Household Income by Householder Age in Hallowell
The median household income in Hallowell is $62,990, with the highest median household income of $75,263 found in the 45 to 64 years age bracket for the primary householder. A total of 432 households (31.8%) fall into this category. Meanwhile, the 15 to 24 years age bracket for the primary householder has the lowest median household income of $0, with 9 households (0.7%) in this group.
| Income Bracket | # Households | Median Income |
| 15 to 24 Years | 9 (0.7%) | $0 |
| 25 to 44 Years | 398 (29.3%) | $52,500 |
| 45 to 64 Years | 432 (31.8%) | $75,263 |
| 65+ Years | 520 (38.3%) | $58,519 |
| Total | 1,359 (100.0%) | $62,990 |
Poverty in Hallowell
Income Below Poverty by Sex and Age in Hallowell
With 13.0% poverty level for males and 10.6% for females among the residents of Hallowell, 16 and 17 year old males and 35 to 44 year old females are the most vulnerable to poverty, with 26 males (100.0%) and 66 females (43.1%) in their respective age groups living below the poverty level.
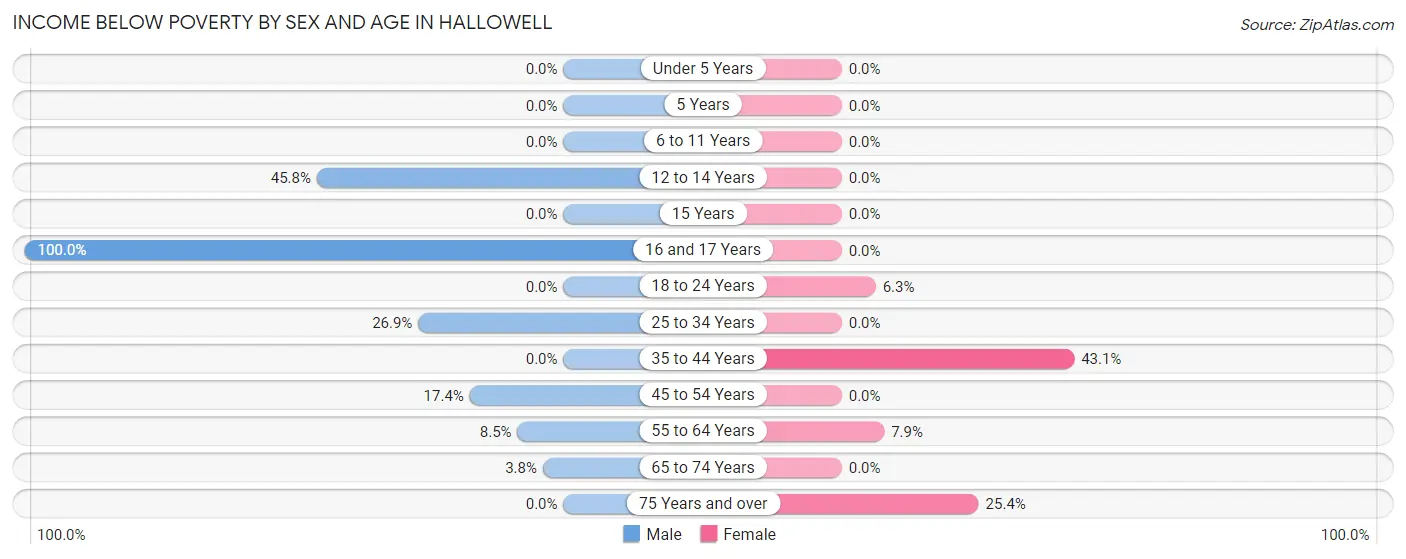
| Age Bracket | Male | Female |
| Under 5 Years | 0 (0.0%) | 0 (0.0%) |
| 5 Years | 0 (0.0%) | 0 (0.0%) |
| 6 to 11 Years | 0 (0.0%) | 0 (0.0%) |
| 12 to 14 Years | 27 (45.8%) | 0 (0.0%) |
| 15 Years | 0 (0.0%) | 0 (0.0%) |
| 16 and 17 Years | 26 (100.0%) | 0 (0.0%) |
| 18 to 24 Years | 0 (0.0%) | 9 (6.3%) |
| 25 to 34 Years | 66 (26.9%) | 0 (0.0%) |
| 35 to 44 Years | 0 (0.0%) | 66 (43.1%) |
| 45 to 54 Years | 12 (17.4%) | 0 (0.0%) |
| 55 to 64 Years | 11 (8.5%) | 19 (7.9%) |
| 65 to 74 Years | 10 (3.8%) | 0 (0.0%) |
| 75 Years and over | 0 (0.0%) | 48 (25.4%) |
| Total | 152 (13.0%) | 142 (10.6%) |
Income Above Poverty by Sex and Age in Hallowell
According to the poverty statistics in Hallowell, males aged under 5 years and females aged under 5 years are the age groups that are most secure financially, with 100.0% of males and 100.0% of females in these age groups living above the poverty line.
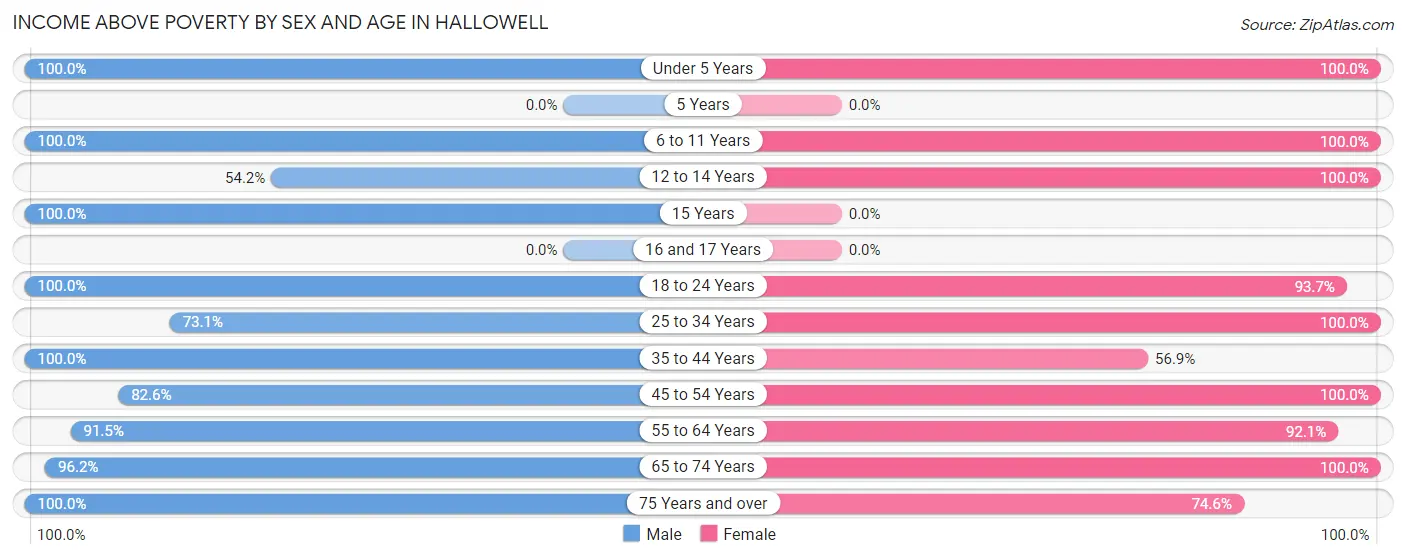
| Age Bracket | Male | Female |
| Under 5 Years | 26 (100.0%) | 36 (100.0%) |
| 5 Years | 0 (0.0%) | 0 (0.0%) |
| 6 to 11 Years | 91 (100.0%) | 42 (100.0%) |
| 12 to 14 Years | 32 (54.2%) | 14 (100.0%) |
| 15 Years | 27 (100.0%) | 0 (0.0%) |
| 16 and 17 Years | 0 (0.0%) | 0 (0.0%) |
| 18 to 24 Years | 27 (100.0%) | 134 (93.7%) |
| 25 to 34 Years | 179 (73.1%) | 142 (100.0%) |
| 35 to 44 Years | 141 (100.0%) | 87 (56.9%) |
| 45 to 54 Years | 57 (82.6%) | 159 (100.0%) |
| 55 to 64 Years | 118 (91.5%) | 222 (92.1%) |
| 65 to 74 Years | 252 (96.2%) | 214 (100.0%) |
| 75 Years and over | 66 (100.0%) | 141 (74.6%) |
| Total | 1,016 (87.0%) | 1,191 (89.3%) |
Income Below Poverty Among Married-Couple Families in Hallowell
The poverty statistics for married-couple families in Hallowell show that 2.7% or 10 of the total 367 families live below the poverty line. Families with no children have the highest poverty rate of 3.7%, comprising of 10 families. On the other hand, families with 1 or 2 children have the lowest poverty rate of 0.0%, which includes 0 families.
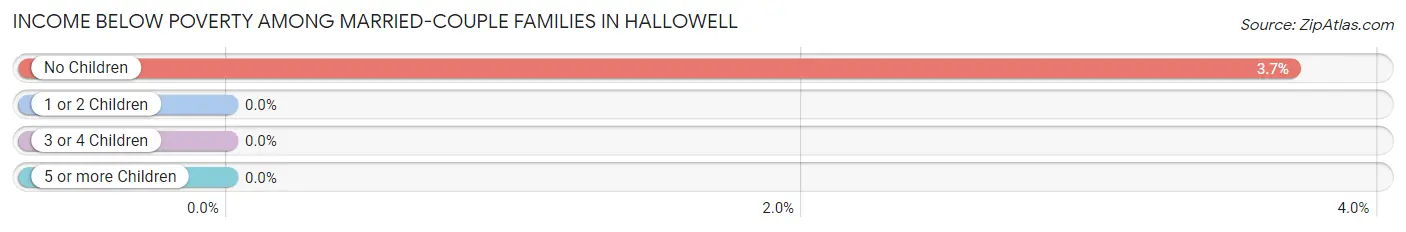
| Children | Above Poverty | Below Poverty |
| No Children | 260 (96.3%) | 10 (3.7%) |
| 1 or 2 Children | 77 (100.0%) | 0 (0.0%) |
| 3 or 4 Children | 20 (100.0%) | 0 (0.0%) |
| 5 or more Children | 0 (0.0%) | 0 (0.0%) |
| Total | 357 (97.3%) | 10 (2.7%) |
Income Below Poverty Among Single-Parent Households in Hallowell
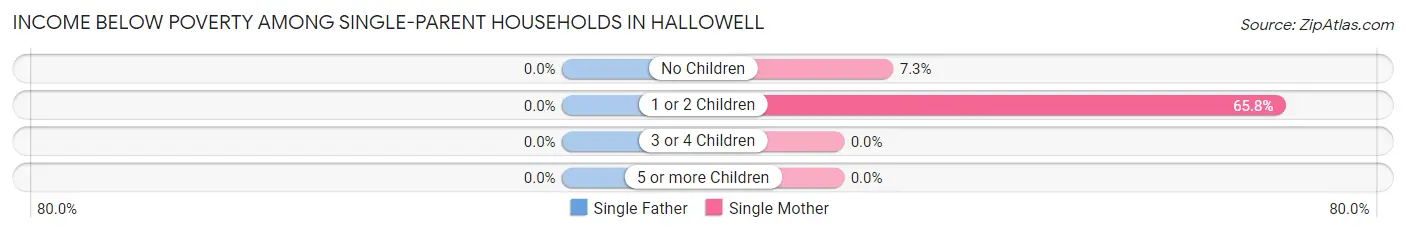
| Children | Single Father | Single Mother |
| No Children | 0 (0.0%) | 9 (7.3%) |
| 1 or 2 Children | 0 (0.0%) | 25 (65.8%) |
| 3 or 4 Children | 0 (0.0%) | 0 (0.0%) |
| 5 or more Children | 0 (0.0%) | 0 (0.0%) |
| Total | 0 (0.0%) | 34 (19.2%) |
Income Below Poverty Among Married-Couple vs Single-Parent Households in Hallowell
The poverty data for Hallowell shows that 10 of the married-couple family households (2.7%) and 34 of the single-parent households (17.8%) are living below the poverty level. Within the married-couple family households, those with no children have the highest poverty rate, with 10 households (3.7%) falling below the poverty line. Among the single-parent households, those with 1 or 2 children have the highest poverty rate, with 25 household (65.8%) living below poverty.
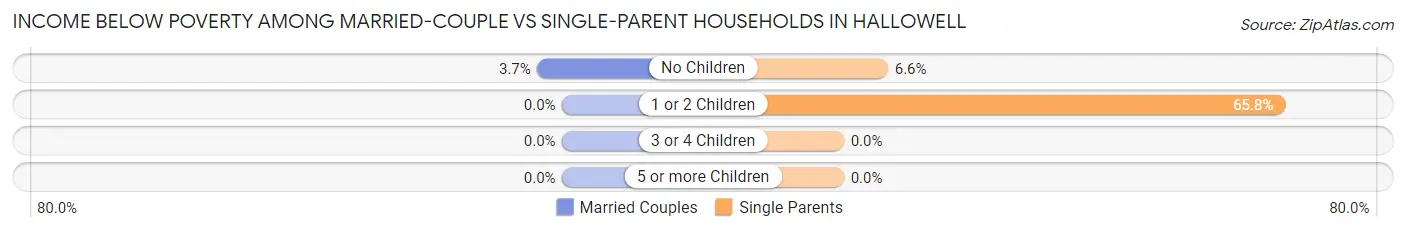
| Children | Married-Couple Families | Single-Parent Households |
| No Children | 10 (3.7%) | 9 (6.6%) |
| 1 or 2 Children | 0 (0.0%) | 25 (65.8%) |
| 3 or 4 Children | 0 (0.0%) | 0 (0.0%) |
| 5 or more Children | 0 (0.0%) | 0 (0.0%) |
| Total | 10 (2.7%) | 34 (17.8%) |
Race in Hallowell
The most populous races in Hallowell are White / Caucasian (2,545 | 99.5%), Hispanic or Latino (13 | 0.5%), and Two or more Races (9 | 0.4%).
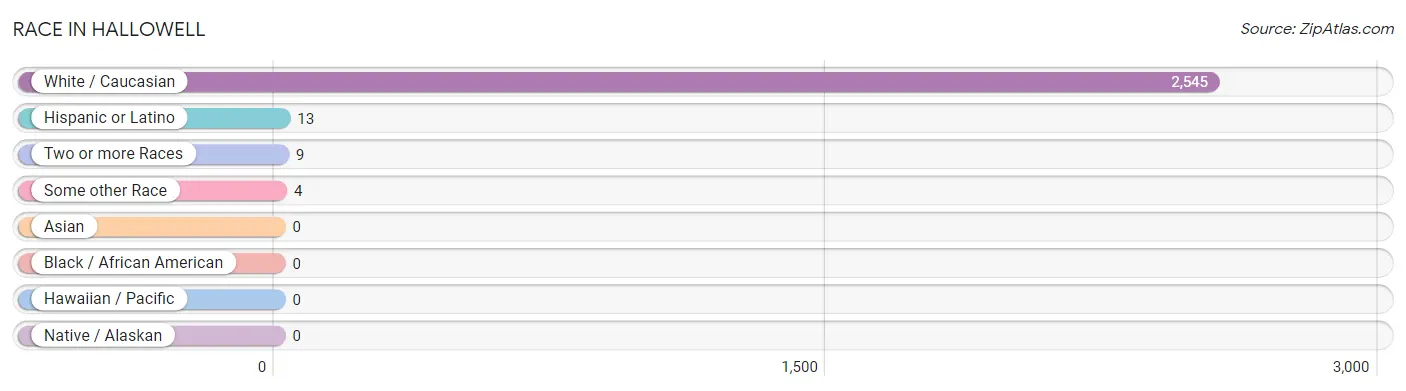
| Race | # Population | % Population |
| Asian | 0 | 0.0% |
| Black / African American | 0 | 0.0% |
| Hawaiian / Pacific | 0 | 0.0% |
| Hispanic or Latino | 13 | 0.5% |
| Native / Alaskan | 0 | 0.0% |
| White / Caucasian | 2,545 | 99.5% |
| Two or more Races | 9 | 0.4% |
| Some other Race | 4 | 0.2% |
| Total | 2,558 | 100.0% |
Ancestry in Hallowell
The most populous ancestries reported in Hallowell are English (763 | 29.8%), Irish (558 | 21.8%), French (334 | 13.1%), German (325 | 12.7%), and Italian (227 | 8.9%), together accounting for 86.3% of all Hallowell residents.
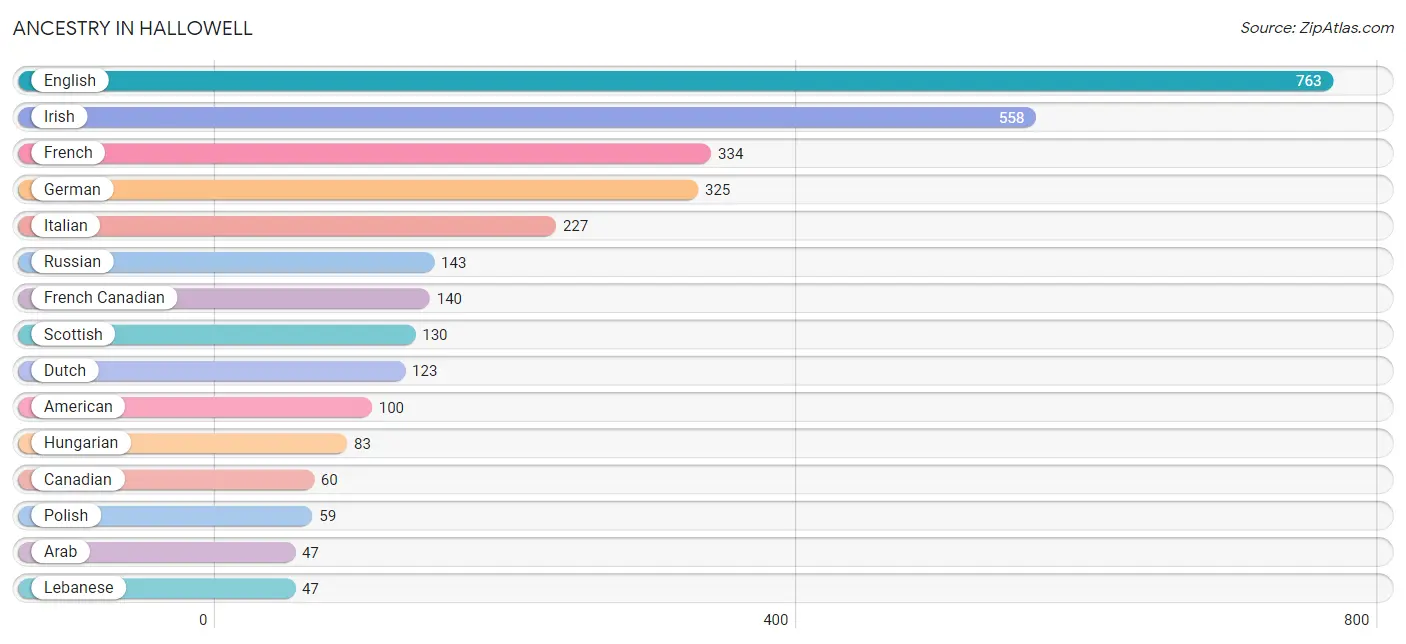
| Ancestry | # Population | % Population |
| American | 100 | 3.9% |
| Arab | 47 | 1.8% |
| Austrian | 12 | 0.5% |
| Belgian | 14 | 0.5% |
| British | 23 | 0.9% |
| Canadian | 60 | 2.4% |
| Central American | 4 | 0.2% |
| Czech | 15 | 0.6% |
| Czechoslovakian | 7 | 0.3% |
| Danish | 35 | 1.4% |
| Dutch | 123 | 4.8% |
| Eastern European | 23 | 0.9% |
| English | 763 | 29.8% |
| European | 12 | 0.5% |
| French | 334 | 13.1% |
| French Canadian | 140 | 5.5% |
| German | 325 | 12.7% |
| Hungarian | 83 | 3.2% |
| Irish | 558 | 21.8% |
| Italian | 227 | 8.9% |
| Lebanese | 47 | 1.8% |
| Lithuanian | 7 | 0.3% |
| Polish | 59 | 2.3% |
| Russian | 143 | 5.6% |
| Salvadoran | 4 | 0.2% |
| Scandinavian | 16 | 0.6% |
| Scotch-Irish | 40 | 1.6% |
| Scottish | 130 | 5.1% |
| Sioux | 9 | 0.4% |
| South American | 9 | 0.4% |
| Swedish | 14 | 0.5% |
| Swiss | 13 | 0.5% |
| Venezuelan | 9 | 0.4% |
| Welsh | 9 | 0.4% | View All 34 Rows |
Immigrants in Hallowell
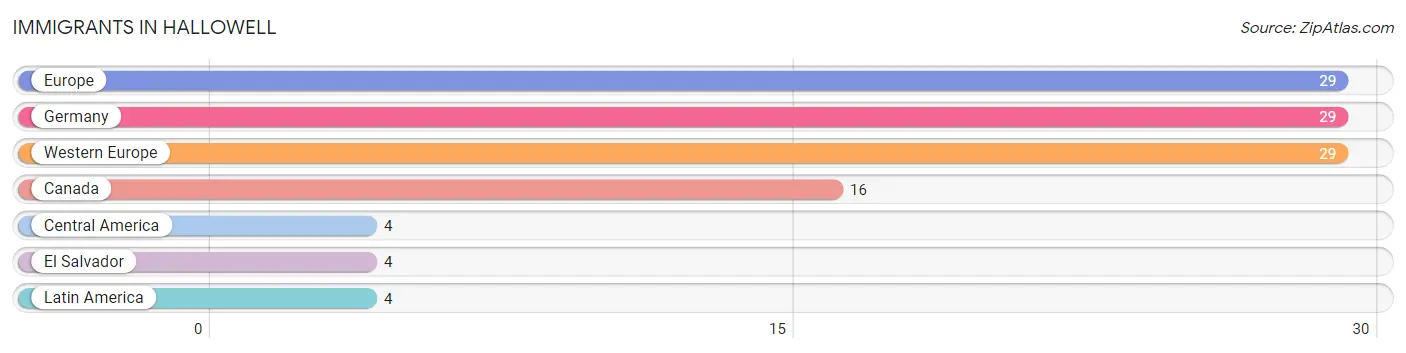
The most numerous immigrant groups reported in Hallowell came from Europe (29 | 1.1%), Germany (29 | 1.1%), Western Europe (29 | 1.1%), Canada (16 | 0.6%), and Central America (4 | 0.2%), together accounting for 4.2% of all Hallowell residents.
| Immigration Origin | # Population | % Population |
| Canada | 16 | 0.6% |
| Central America | 4 | 0.2% |
| El Salvador | 4 | 0.2% |
| Europe | 29 | 1.1% |
| Germany | 29 | 1.1% |
| Latin America | 4 | 0.2% |
| Western Europe | 29 | 1.1% | View All 7 Rows |
Sex and Age in Hallowell
Sex and Age in Hallowell
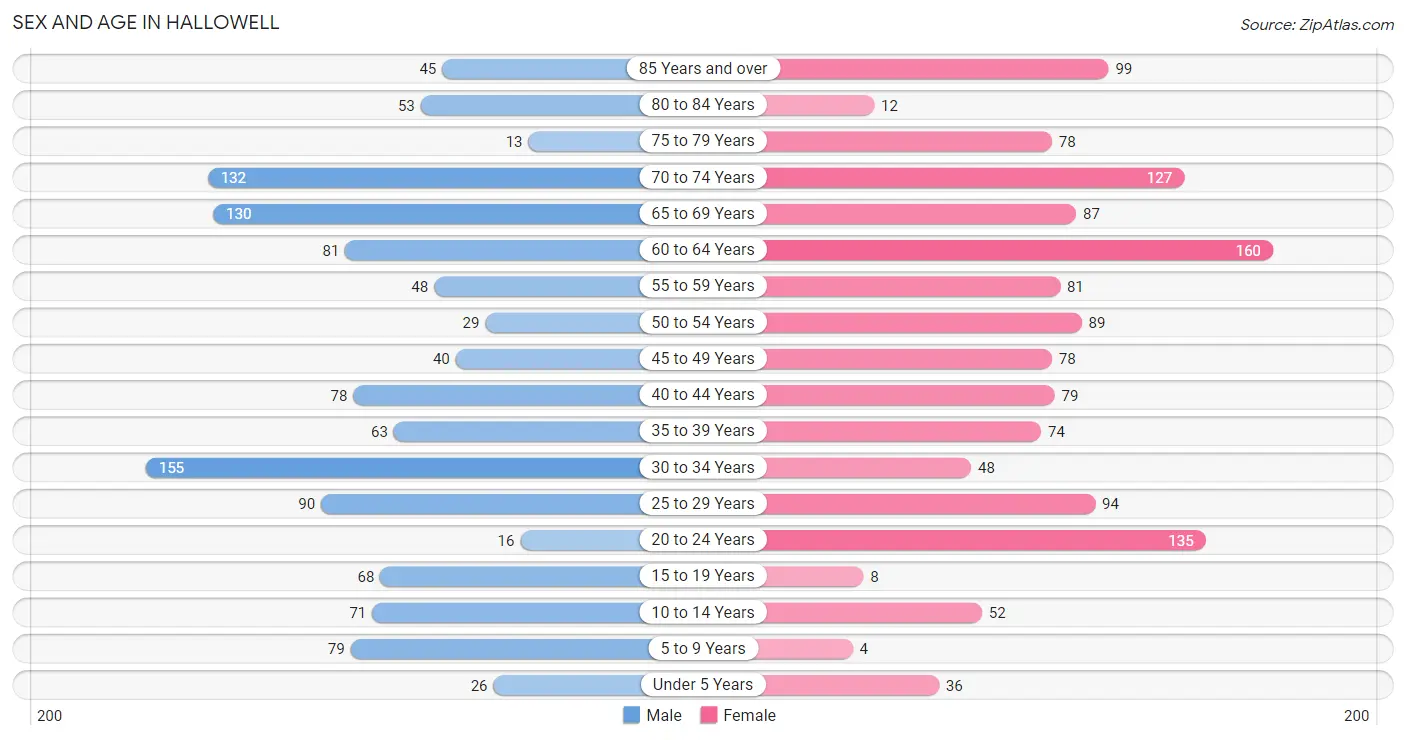
The most populous age groups in Hallowell are 30 to 34 Years (155 | 12.7%) for men and 60 to 64 Years (160 | 11.9%) for women.
| Age Bracket | Male | Female |
| Under 5 Years | 26 (2.1%) | 36 (2.7%) |
| 5 to 9 Years | 79 (6.5%) | 4 (0.3%) |
| 10 to 14 Years | 71 (5.8%) | 52 (3.9%) |
| 15 to 19 Years | 68 (5.6%) | 8 (0.6%) |
| 20 to 24 Years | 16 (1.3%) | 135 (10.1%) |
| 25 to 29 Years | 90 (7.4%) | 94 (7.0%) |
| 30 to 34 Years | 155 (12.7%) | 48 (3.6%) |
| 35 to 39 Years | 63 (5.2%) | 74 (5.5%) |
| 40 to 44 Years | 78 (6.4%) | 79 (5.9%) |
| 45 to 49 Years | 40 (3.3%) | 78 (5.8%) |
| 50 to 54 Years | 29 (2.4%) | 89 (6.6%) |
| 55 to 59 Years | 48 (3.9%) | 81 (6.0%) |
| 60 to 64 Years | 81 (6.7%) | 160 (11.9%) |
| 65 to 69 Years | 130 (10.7%) | 87 (6.5%) |
| 70 to 74 Years | 132 (10.8%) | 127 (9.5%) |
| 75 to 79 Years | 13 (1.1%) | 78 (5.8%) |
| 80 to 84 Years | 53 (4.3%) | 12 (0.9%) |
| 85 Years and over | 45 (3.7%) | 99 (7.4%) |
| Total | 1,217 (100.0%) | 1,341 (100.0%) |
Families and Households in Hallowell
Median Family Size in Hallowell
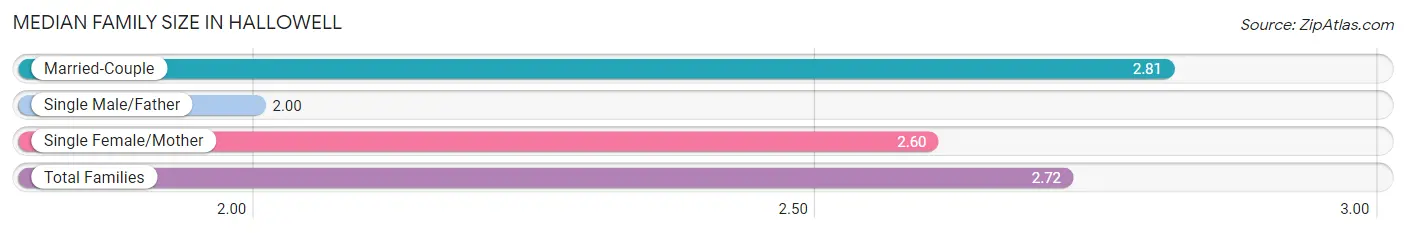
The median family size in Hallowell is 2.72 persons per family, with married-couple families (367 | 65.8%) accounting for the largest median family size of 2.81 persons per family. On the other hand, single male/father families (14 | 2.5%) represent the smallest median family size with 2.00 persons per family.
| Family Type | # Families | Family Size |
| Married-Couple | 367 (65.8%) | 2.81 |
| Single Male/Father | 14 (2.5%) | 2.00 |
| Single Female/Mother | 177 (31.7%) | 2.60 |
| Total Families | 558 (100.0%) | 2.72 |
Median Household Size in Hallowell
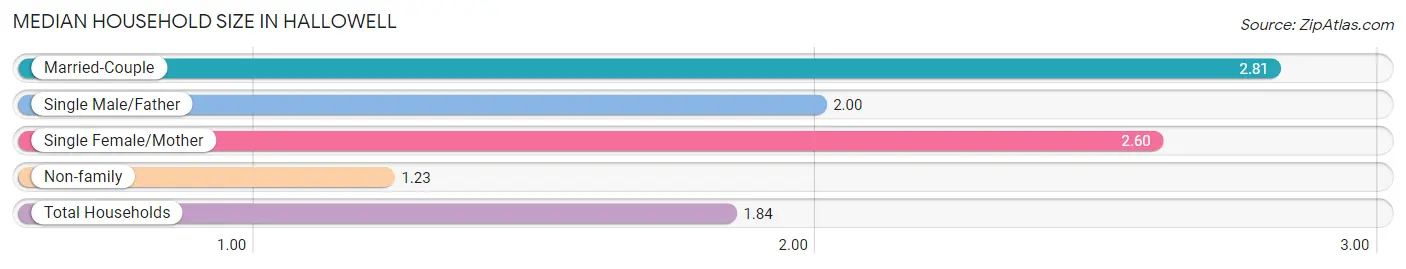
The median household size in Hallowell is 1.84 persons per household, with married-couple households (367 | 27.0%) accounting for the largest median household size of 2.81 persons per household. non-family households (801 | 58.9%) represent the smallest median household size with 1.23 persons per household.
| Household Type | # Households | Household Size |
| Married-Couple | 367 (27.0%) | 2.81 |
| Single Male/Father | 14 (1.0%) | 2.00 |
| Single Female/Mother | 177 (13.0%) | 2.60 |
| Non-family | 801 (58.9%) | 1.23 |
| Total Households | 1,359 (100.0%) | 1.84 |
Household Size by Marriage Status in Hallowell
Out of a total of 1,359 households in Hallowell, 558 (41.1%) are family households, while 801 (58.9%) are nonfamily households. The most numerous type of family households are 2-person households, comprising 378, and the most common type of nonfamily households are 1-person households, comprising 622.
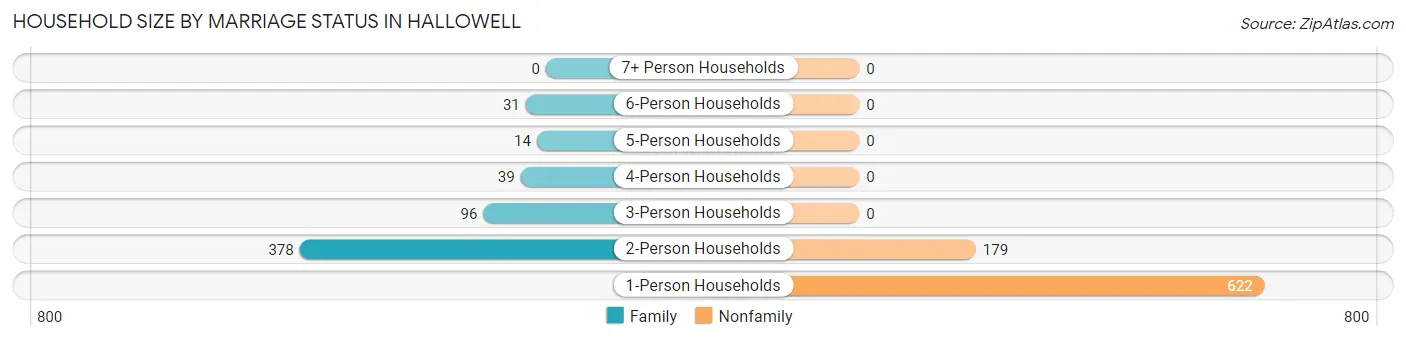
| Household Size | Family Households | Nonfamily Households |
| 1-Person Households | - | 622 (45.8%) |
| 2-Person Households | 378 (27.8%) | 179 (13.2%) |
| 3-Person Households | 96 (7.1%) | 0 (0.0%) |
| 4-Person Households | 39 (2.9%) | 0 (0.0%) |
| 5-Person Households | 14 (1.0%) | 0 (0.0%) |
| 6-Person Households | 31 (2.3%) | 0 (0.0%) |
| 7+ Person Households | 0 (0.0%) | 0 (0.0%) |
| Total | 558 (41.1%) | 801 (58.9%) |
Female Fertility in Hallowell
Fertility by Age in Hallowell
Average fertility rate in Hallowell is 19.0 births per 1,000 women. Women in the age bracket of 20 to 34 years have the highest fertility rate with 40.0 births per 1,000 women. Women in the age bracket of 20 to 34 years acount for 100.0% of all women with births.
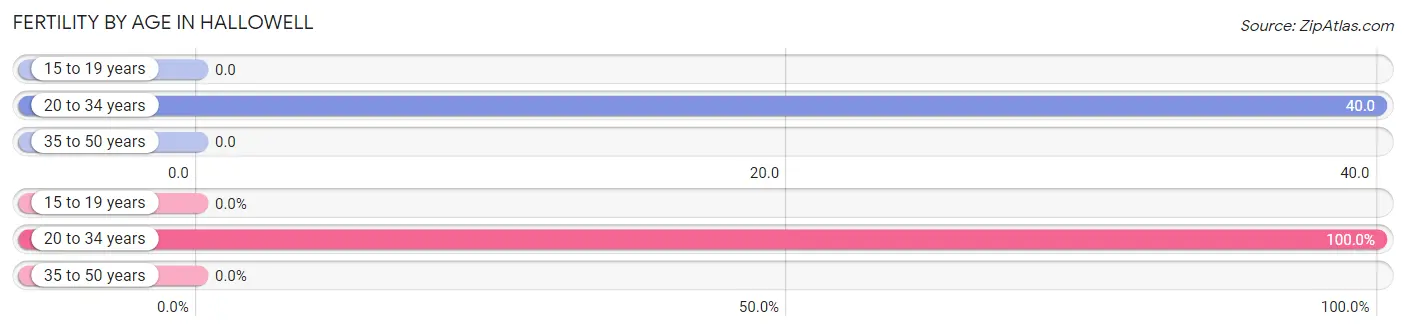
| Age Bracket | Women with Births | Births / 1,000 Women |
| 15 to 19 years | 0 (0.0%) | 0.0 |
| 20 to 34 years | 11 (100.0%) | 40.0 |
| 35 to 50 years | 0 (0.0%) | 0.0 |
| Total | 11 (100.0%) | 19.0 |
Fertility by Age by Marriage Status in Hallowell
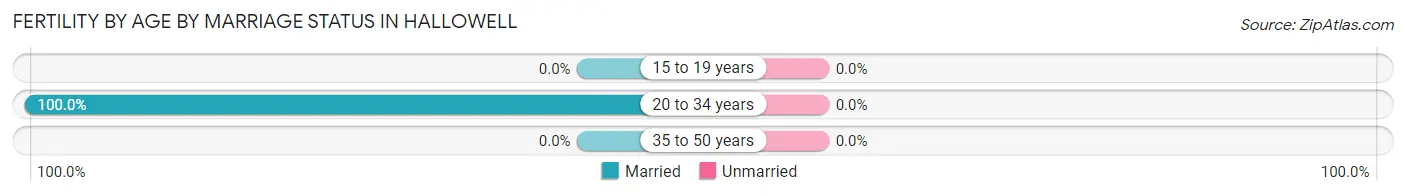
| Age Bracket | Married | Unmarried |
| 15 to 19 years | 0 (0.0%) | 0 (0.0%) |
| 20 to 34 years | 11 (100.0%) | 0 (0.0%) |
| 35 to 50 years | 0 (0.0%) | 0 (0.0%) |
| Total | 11 (100.0%) | 0 (0.0%) |
Fertility by Education in Hallowell
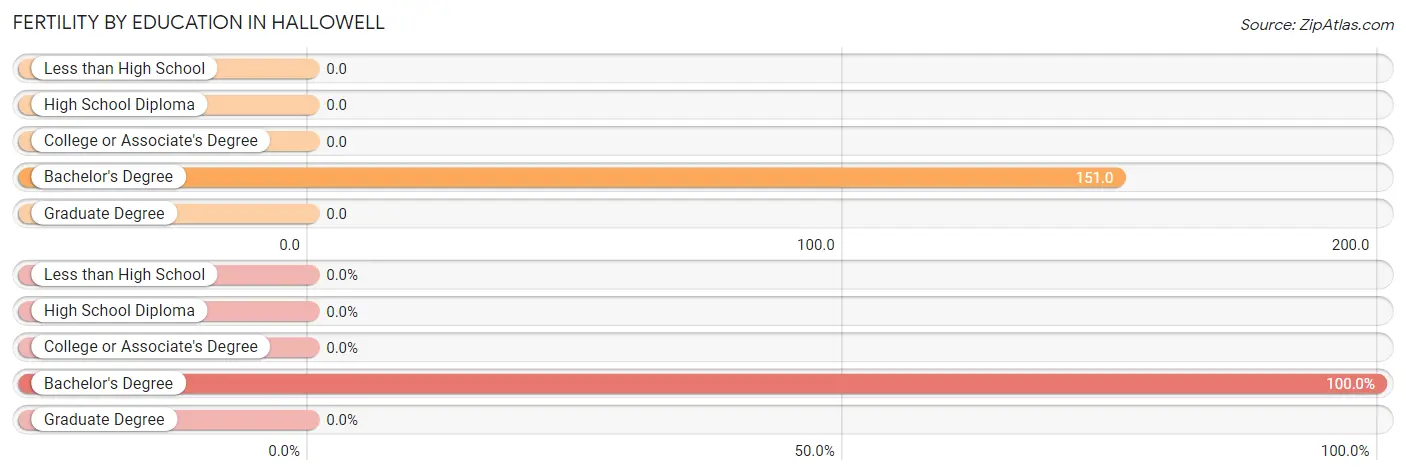
| Educational Attainment | Women with Births | Births / 1,000 Women |
| Less than High School | 0 (0.0%) | 0.0 |
| High School Diploma | 0 (0.0%) | 0.0 |
| College or Associate's Degree | 0 (0.0%) | 0.0 |
| Bachelor's Degree | 11 (100.0%) | 151.0 |
| Graduate Degree | 0 (0.0%) | 0.0 |
| Total | 11 (100.0%) | 19.0 |
Fertility by Education by Marriage Status in Hallowell
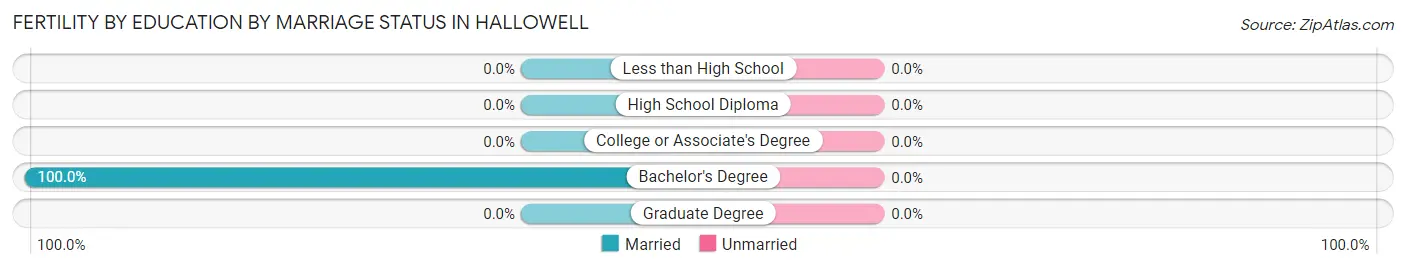
| Educational Attainment | Married | Unmarried |
| Less than High School | 0 (0.0%) | 0 (0.0%) |
| High School Diploma | 0 (0.0%) | 0 (0.0%) |
| College or Associate's Degree | 0 (0.0%) | 0 (0.0%) |
| Bachelor's Degree | 11 (100.0%) | 0 (0.0%) |
| Graduate Degree | 0 (0.0%) | 0 (0.0%) |
| Total | 11 (100.0%) | 0 (0.0%) |
Employment Characteristics in Hallowell
Employment by Class of Employer in Hallowell
Among the 1,353 employed individuals in Hallowell, private company employees (797 | 58.9%), not-for-profit organizations (169 | 12.5%), and state government employees (126 | 9.3%) make up the most common classes of employment.
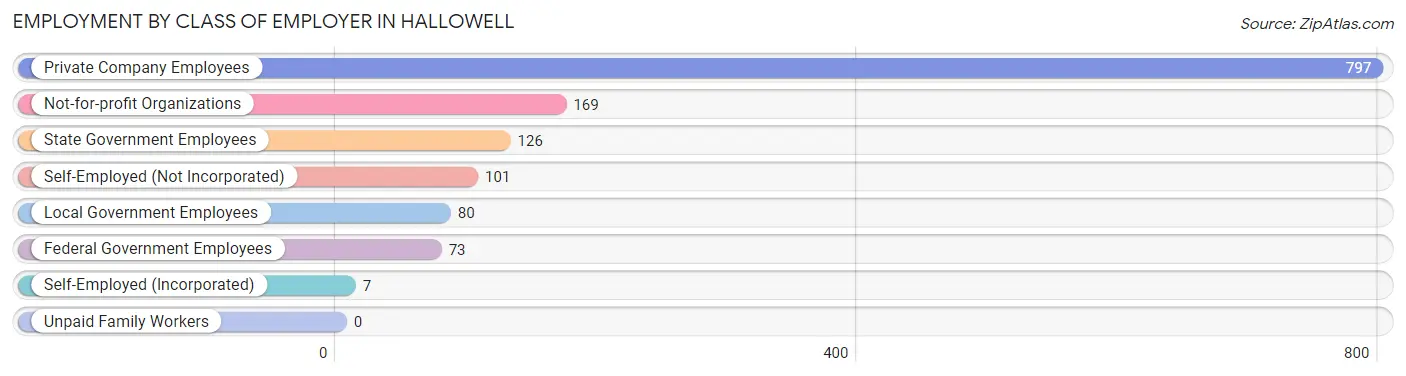
| Employer Class | # Employees | % Employees |
| Private Company Employees | 797 | 58.9% |
| Self-Employed (Incorporated) | 7 | 0.5% |
| Self-Employed (Not Incorporated) | 101 | 7.5% |
| Not-for-profit Organizations | 169 | 12.5% |
| Local Government Employees | 80 | 5.9% |
| State Government Employees | 126 | 9.3% |
| Federal Government Employees | 73 | 5.4% |
| Unpaid Family Workers | 0 | 0.0% |
| Total | 1,353 | 100.0% |
Employment Status by Age in Hallowell
According to the labor force statistics for Hallowell, out of the total population over 16 years of age (2,263), 60.8% or 1,376 individuals are in the labor force, with 0.9% or 12 of them unemployed. The age group with the highest labor force participation rate is 20 to 24 years, with 100.0% or 151 individuals in the labor force. Within the labor force, the 45 to 54 years age range has the highest percentage of unemployed individuals, with 5.3% or 12 of them being unemployed.
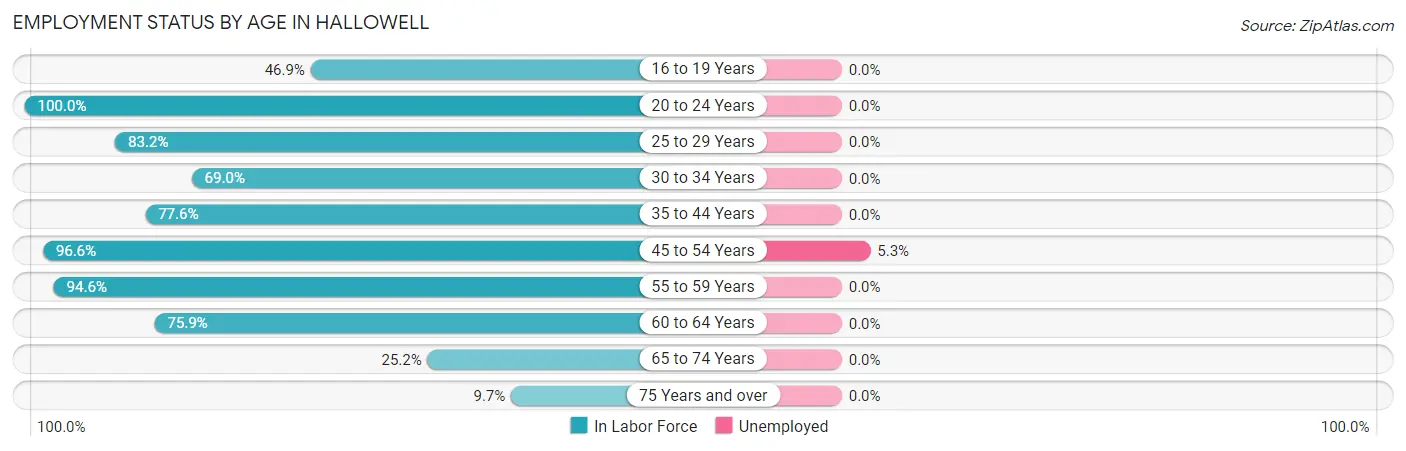
| Age Bracket | In Labor Force | Unemployed |
| 16 to 19 Years | 23 (46.9%) | 0 (0.0%) |
| 20 to 24 Years | 151 (100.0%) | 0 (0.0%) |
| 25 to 29 Years | 153 (83.2%) | 0 (0.0%) |
| 30 to 34 Years | 140 (69.0%) | 0 (0.0%) |
| 35 to 44 Years | 228 (77.6%) | 0 (0.0%) |
| 45 to 54 Years | 228 (96.6%) | 12 (5.3%) |
| 55 to 59 Years | 122 (94.6%) | 0 (0.0%) |
| 60 to 64 Years | 183 (75.9%) | 0 (0.0%) |
| 65 to 74 Years | 120 (25.2%) | 0 (0.0%) |
| 75 Years and over | 29 (9.7%) | 0 (0.0%) |
| Total | 1,376 (60.8%) | 12 (0.9%) |
Employment Status by Educational Attainment in Hallowell
According to labor force statistics for Hallowell, 81.9% of individuals (1,054) out of the total population between 25 and 64 years of age (1,287) are in the labor force, with 1.1% or 12 of them being unemployed. The group with the highest labor force participation rate are those with the educational attainment of bachelor's degree or higher, with 94.3% or 632 individuals in the labor force. Within the labor force, individuals with college / associate degree education have the highest percentage of unemployment, with 5.5% or 12 of them being unemployed.
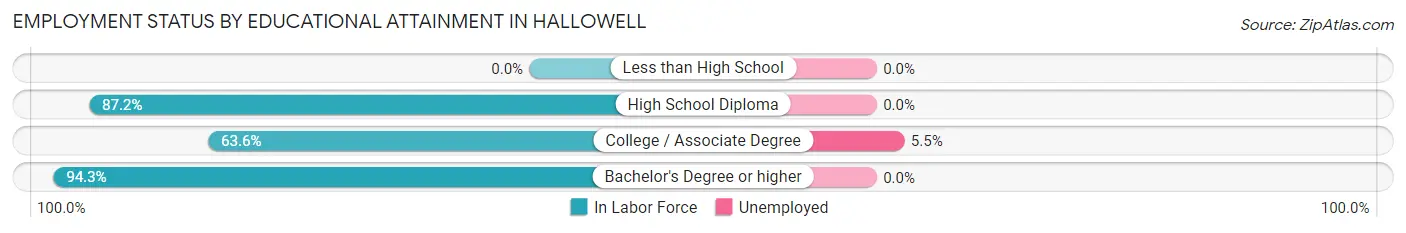
| Educational Attainment | In Labor Force | Unemployed |
| Less than High School | 0 (0.0%) | 0 (0.0%) |
| High School Diploma | 204 (87.2%) | 0 (0.0%) |
| College / Associate Degree | 218 (63.6%) | 19 (5.5%) |
| Bachelor's Degree or higher | 632 (94.3%) | 0 (0.0%) |
| Total | 1,054 (81.9%) | 14 (1.1%) |
Employment Occupations by Sex in Hallowell
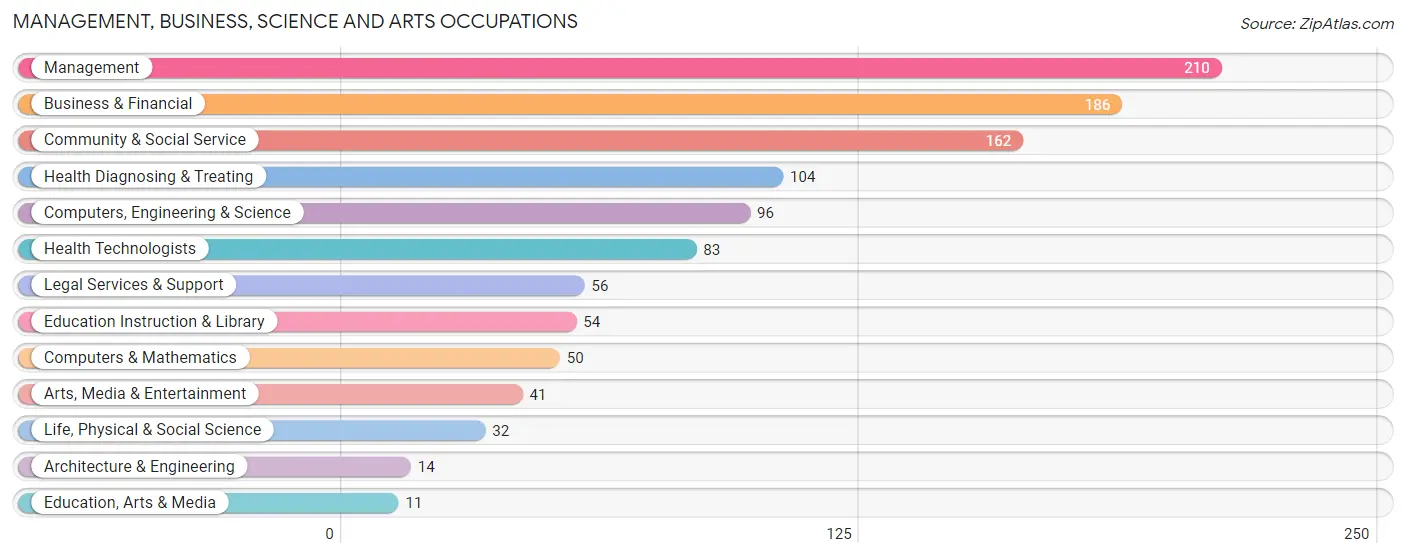
Management, Business, Science and Arts Occupations
The most common Management, Business, Science and Arts occupations in Hallowell are Management (210 | 15.4%), Business & Financial (186 | 13.6%), Community & Social Service (162 | 11.9%), Health Diagnosing & Treating (104 | 7.6%), and Computers, Engineering & Science (96 | 7.0%).
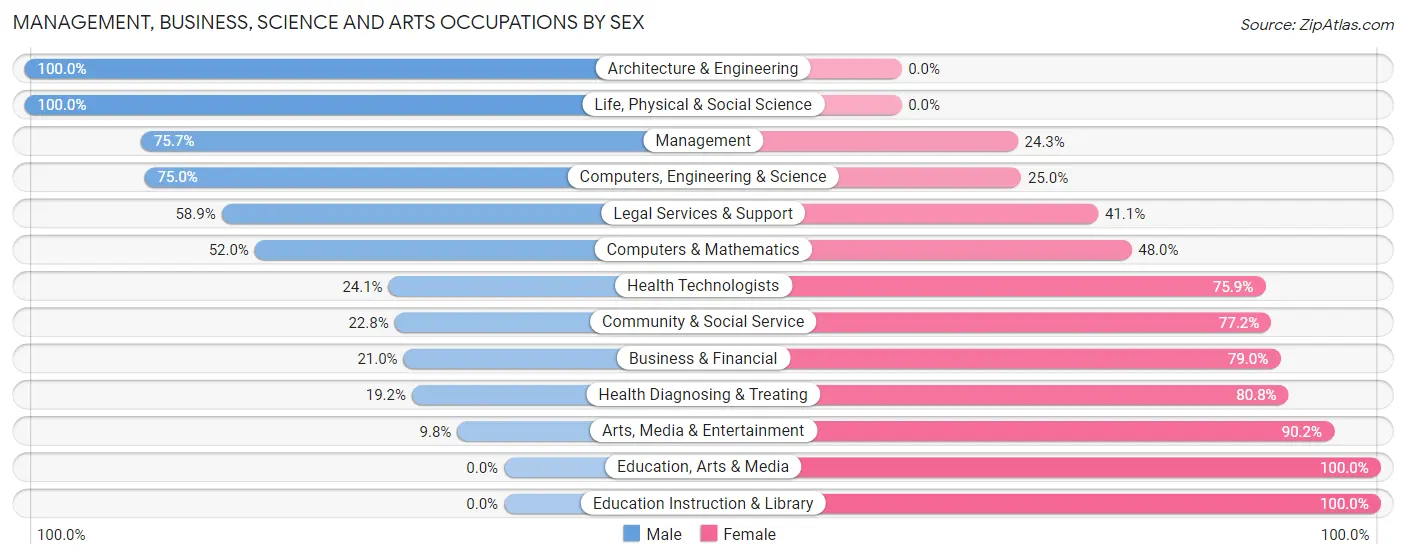
Management, Business, Science and Arts Occupations by Sex
Within the Management, Business, Science and Arts occupations in Hallowell, the most male-oriented occupations are Architecture & Engineering (100.0%), Life, Physical & Social Science (100.0%), and Management (75.7%), while the most female-oriented occupations are Education, Arts & Media (100.0%), Education Instruction & Library (100.0%), and Arts, Media & Entertainment (90.2%).
| Occupation | Male | Female |
| Management | 159 (75.7%) | 51 (24.3%) |
| Business & Financial | 39 (21.0%) | 147 (79.0%) |
| Computers, Engineering & Science | 72 (75.0%) | 24 (25.0%) |
| Computers & Mathematics | 26 (52.0%) | 24 (48.0%) |
| Architecture & Engineering | 14 (100.0%) | 0 (0.0%) |
| Life, Physical & Social Science | 32 (100.0%) | 0 (0.0%) |
| Community & Social Service | 37 (22.8%) | 125 (77.2%) |
| Education, Arts & Media | 0 (0.0%) | 11 (100.0%) |
| Legal Services & Support | 33 (58.9%) | 23 (41.1%) |
| Education Instruction & Library | 0 (0.0%) | 54 (100.0%) |
| Arts, Media & Entertainment | 4 (9.8%) | 37 (90.2%) |
| Health Diagnosing & Treating | 20 (19.2%) | 84 (80.8%) |
| Health Technologists | 20 (24.1%) | 63 (75.9%) |
| Total (Category) | 327 (43.1%) | 431 (56.9%) |
| Total (Overall) | 560 (41.0%) | 805 (59.0%) |
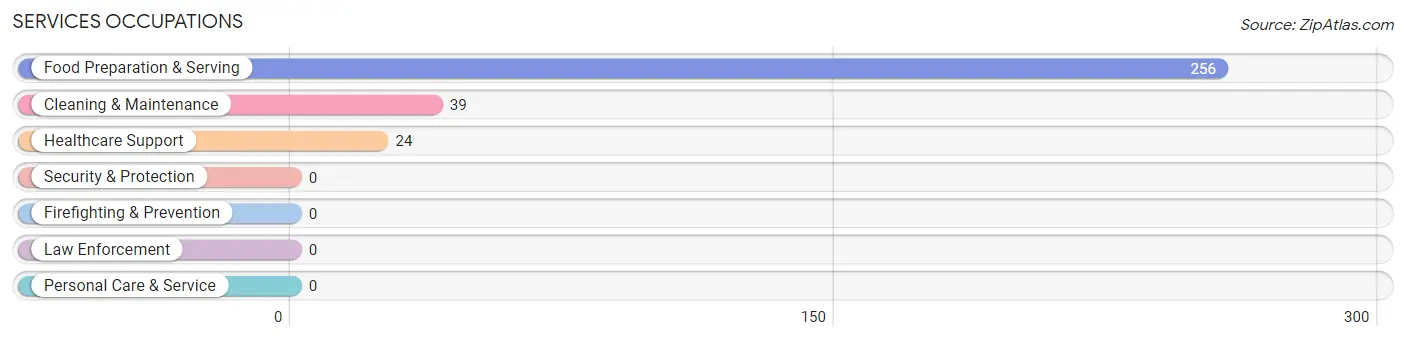
Services Occupations
The most common Services occupations in Hallowell are Food Preparation & Serving (256 | 18.8%), Cleaning & Maintenance (39 | 2.9%), and Healthcare Support (24 | 1.8%).
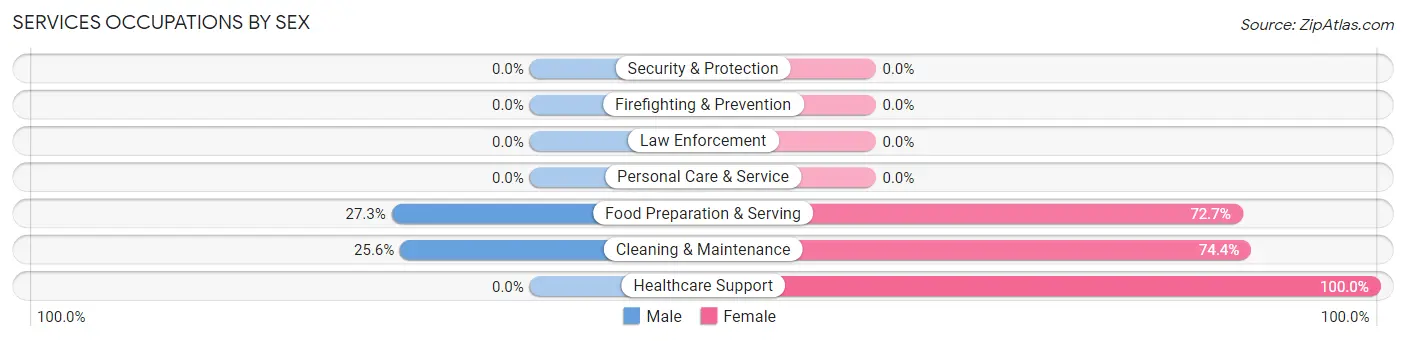
Services Occupations by Sex
Within the Services occupations in Hallowell, the most male-oriented occupations are Food Preparation & Serving (27.3%), and Cleaning & Maintenance (25.6%), while the most female-oriented occupations are Healthcare Support (100.0%), Cleaning & Maintenance (74.4%), and Food Preparation & Serving (72.7%).
| Occupation | Male | Female |
| Healthcare Support | 0 (0.0%) | 24 (100.0%) |
| Security & Protection | 0 (0.0%) | 0 (0.0%) |
| Firefighting & Prevention | 0 (0.0%) | 0 (0.0%) |
| Law Enforcement | 0 (0.0%) | 0 (0.0%) |
| Food Preparation & Serving | 70 (27.3%) | 186 (72.7%) |
| Cleaning & Maintenance | 10 (25.6%) | 29 (74.4%) |
| Personal Care & Service | 0 (0.0%) | 0 (0.0%) |
| Total (Category) | 80 (25.1%) | 239 (74.9%) |
| Total (Overall) | 560 (41.0%) | 805 (59.0%) |
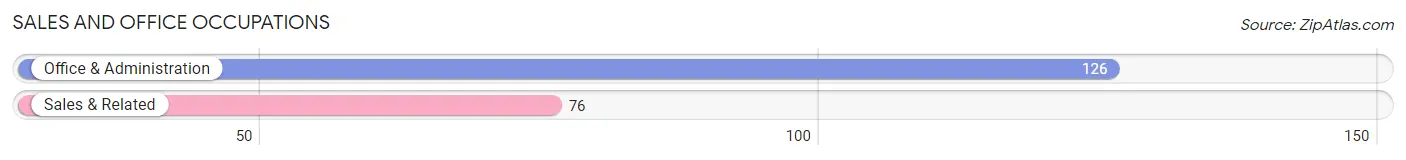
Sales and Office Occupations
The most common Sales and Office occupations in Hallowell are Office & Administration (126 | 9.2%), and Sales & Related (76 | 5.6%).
Sales and Office Occupations by Sex
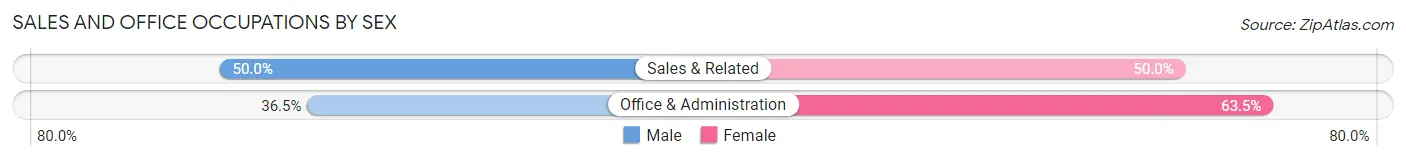
| Occupation | Male | Female |
| Sales & Related | 38 (50.0%) | 38 (50.0%) |
| Office & Administration | 46 (36.5%) | 80 (63.5%) |
| Total (Category) | 84 (41.6%) | 118 (58.4%) |
| Total (Overall) | 560 (41.0%) | 805 (59.0%) |
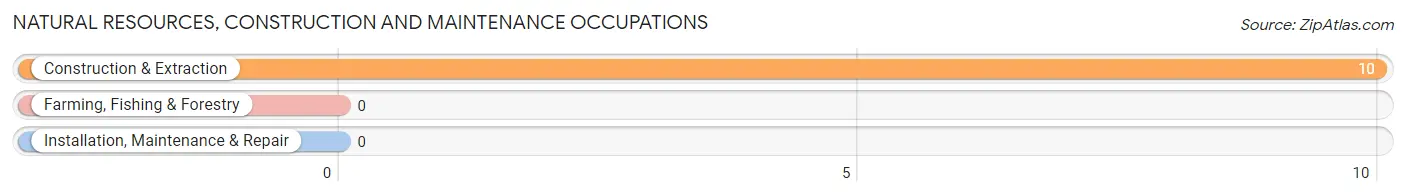
Natural Resources, Construction and Maintenance Occupations
The most common Natural Resources, Construction and Maintenance occupations in Hallowell are , and Construction & Extraction (10 | 0.7%).
Natural Resources, Construction and Maintenance Occupations by Sex
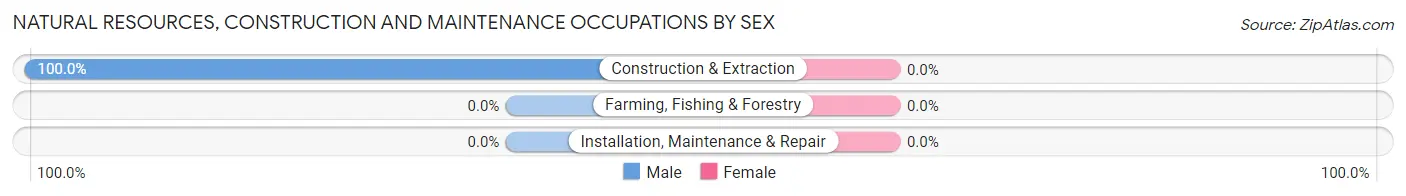
| Occupation | Male | Female |
| Farming, Fishing & Forestry | 0 (0.0%) | 0 (0.0%) |
| Construction & Extraction | 10 (100.0%) | 0 (0.0%) |
| Installation, Maintenance & Repair | 0 (0.0%) | 0 (0.0%) |
| Total (Category) | 10 (100.0%) | 0 (0.0%) |
| Total (Overall) | 560 (41.0%) | 805 (59.0%) |
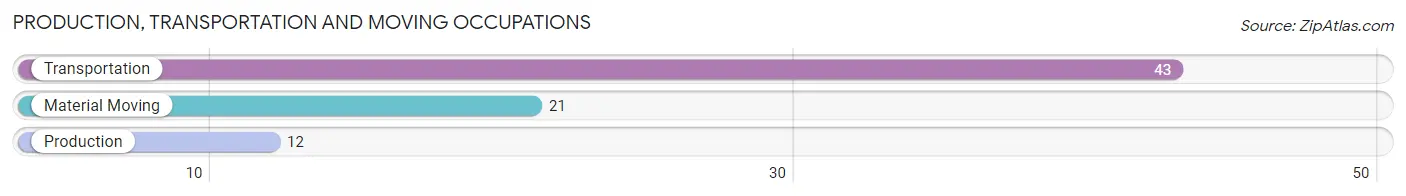
Production, Transportation and Moving Occupations
The most common Production, Transportation and Moving occupations in Hallowell are Transportation (43 | 3.2%), Material Moving (21 | 1.5%), and Production (12 | 0.9%).
Production, Transportation and Moving Occupations by Sex
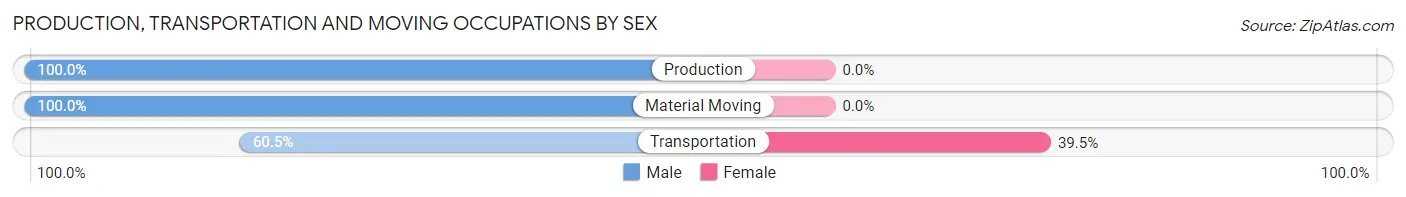
| Occupation | Male | Female |
| Production | 12 (100.0%) | 0 (0.0%) |
| Transportation | 26 (60.5%) | 17 (39.5%) |
| Material Moving | 21 (100.0%) | 0 (0.0%) |
| Total (Category) | 59 (77.6%) | 17 (22.4%) |
| Total (Overall) | 560 (41.0%) | 805 (59.0%) |
Employment Industries by Sex in Hallowell
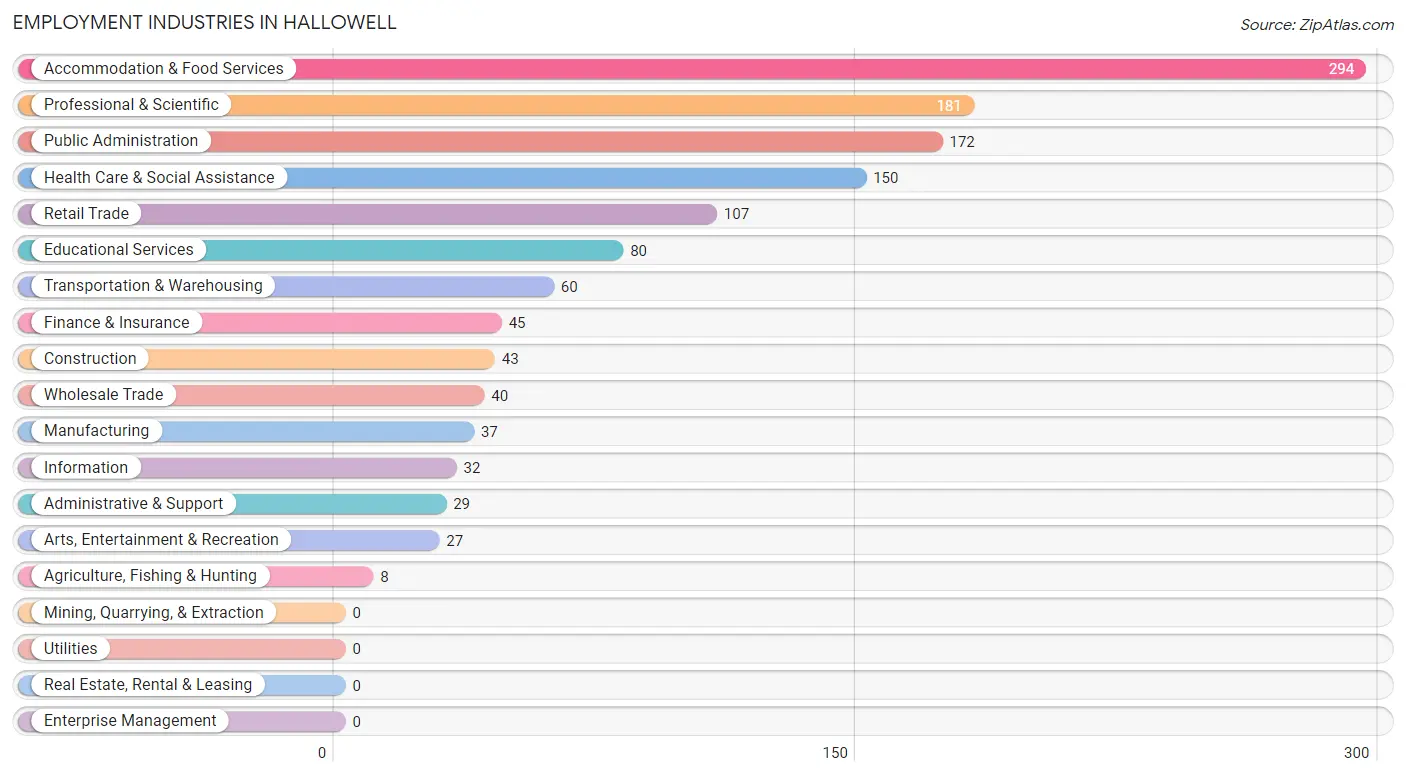
Employment Industries in Hallowell
The major employment industries in Hallowell include Accommodation & Food Services (294 | 21.5%), Professional & Scientific (181 | 13.3%), Public Administration (172 | 12.6%), Health Care & Social Assistance (150 | 11.0%), and Retail Trade (107 | 7.8%).
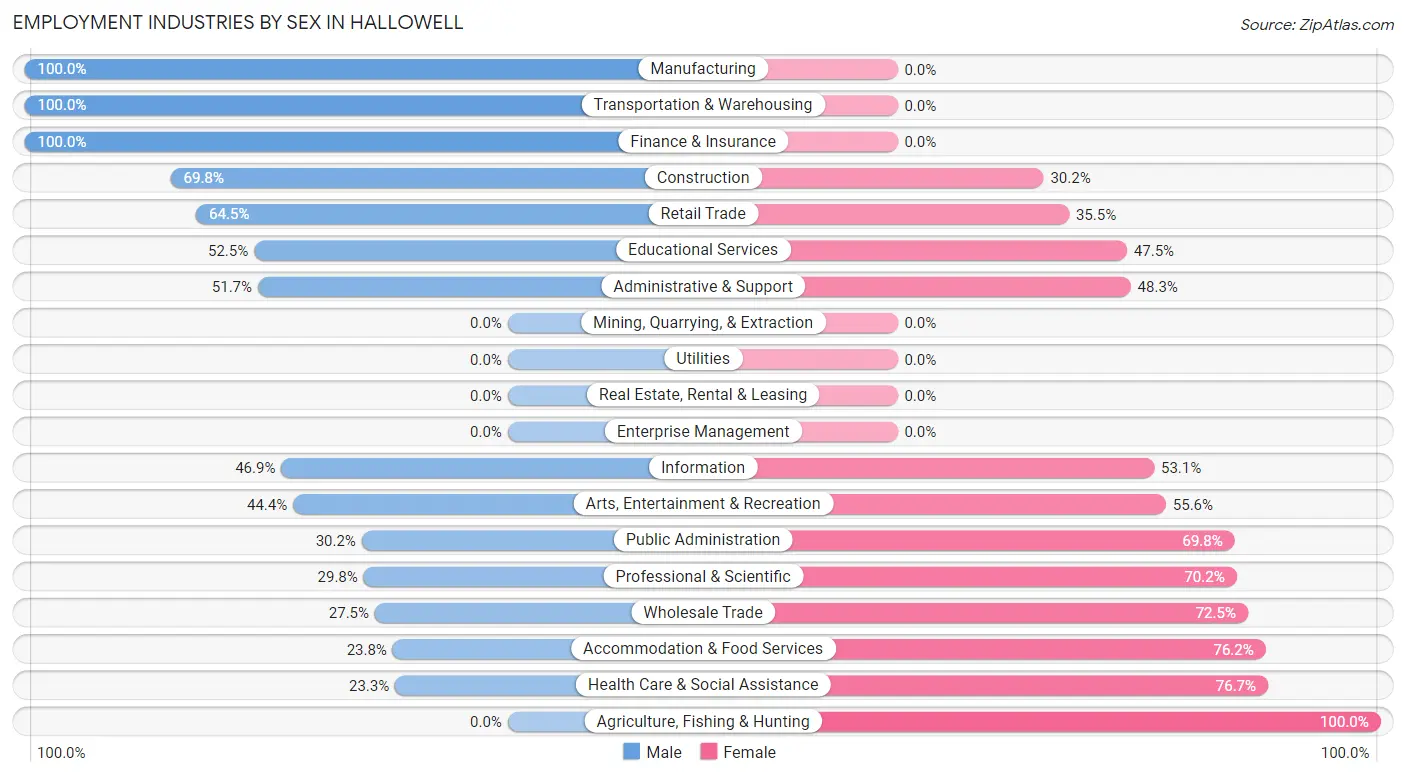
Employment Industries by Sex in Hallowell
The Hallowell industries that see more men than women are Manufacturing (100.0%), Transportation & Warehousing (100.0%), and Finance & Insurance (100.0%), whereas the industries that tend to have a higher number of women are Agriculture, Fishing & Hunting (100.0%), Health Care & Social Assistance (76.7%), and Accommodation & Food Services (76.2%).
| Industry | Male | Female |
| Agriculture, Fishing & Hunting | 0 (0.0%) | 8 (100.0%) |
| Mining, Quarrying, & Extraction | 0 (0.0%) | 0 (0.0%) |
| Construction | 30 (69.8%) | 13 (30.2%) |
| Manufacturing | 37 (100.0%) | 0 (0.0%) |
| Wholesale Trade | 11 (27.5%) | 29 (72.5%) |
| Retail Trade | 69 (64.5%) | 38 (35.5%) |
| Transportation & Warehousing | 60 (100.0%) | 0 (0.0%) |
| Utilities | 0 (0.0%) | 0 (0.0%) |
| Information | 15 (46.9%) | 17 (53.1%) |
| Finance & Insurance | 45 (100.0%) | 0 (0.0%) |
| Real Estate, Rental & Leasing | 0 (0.0%) | 0 (0.0%) |
| Professional & Scientific | 54 (29.8%) | 127 (70.2%) |
| Enterprise Management | 0 (0.0%) | 0 (0.0%) |
| Administrative & Support | 15 (51.7%) | 14 (48.3%) |
| Educational Services | 42 (52.5%) | 38 (47.5%) |
| Health Care & Social Assistance | 35 (23.3%) | 115 (76.7%) |
| Arts, Entertainment & Recreation | 12 (44.4%) | 15 (55.6%) |
| Accommodation & Food Services | 70 (23.8%) | 224 (76.2%) |
| Public Administration | 52 (30.2%) | 120 (69.8%) |
| Total | 560 (41.0%) | 805 (59.0%) |
Education in Hallowell
School Enrollment in Hallowell
The most common levels of schooling among the 506 students in Hallowell are college / undergraduate (195 | 38.5%), middle school (103 | 20.4%), and high school (64 | 12.7%).
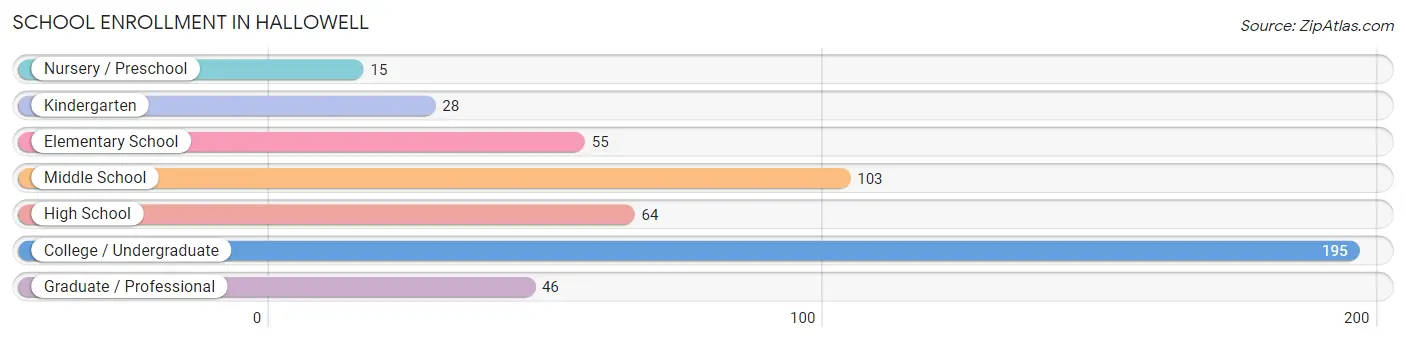
| School Level | # Students | % Students |
| Nursery / Preschool | 15 | 3.0% |
| Kindergarten | 28 | 5.5% |
| Elementary School | 55 | 10.9% |
| Middle School | 103 | 20.4% |
| High School | 64 | 12.7% |
| College / Undergraduate | 195 | 38.5% |
| Graduate / Professional | 46 | 9.1% |
| Total | 506 | 100.0% |
School Enrollment by Age by Funding Source in Hallowell
Out of a total of 506 students who are enrolled in schools in Hallowell, 113 (22.3%) attend a private institution, while the remaining 393 (77.7%) are enrolled in public schools. The age group of 3 to 4 year olds has the highest likelihood of being enrolled in private schools, with 15 (100.0% in the age bracket) enrolled. Conversely, the age group of 10 to 14 year olds has the lowest likelihood of being enrolled in a private school, with 103 (100.0% in the age bracket) attending a public institution.
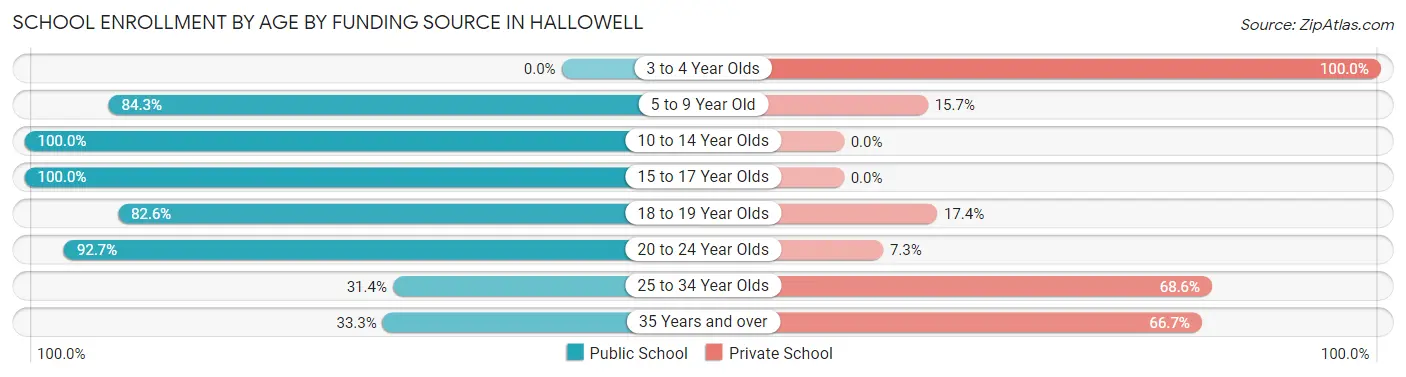
| Age Bracket | Public School | Private School |
| 3 to 4 Year Olds | 0 (0.0%) | 15 (100.0%) |
| 5 to 9 Year Old | 70 (84.3%) | 13 (15.7%) |
| 10 to 14 Year Olds | 103 (100.0%) | 0 (0.0%) |
| 15 to 17 Year Olds | 53 (100.0%) | 0 (0.0%) |
| 18 to 19 Year Olds | 19 (82.6%) | 4 (17.4%) |
| 20 to 24 Year Olds | 114 (92.7%) | 9 (7.3%) |
| 25 to 34 Year Olds | 22 (31.4%) | 48 (68.6%) |
| 35 Years and over | 12 (33.3%) | 24 (66.7%) |
| Total | 393 (77.7%) | 113 (22.3%) |
Educational Attainment by Field of Study in Hallowell
Bio, nature & agricultural (169 | 13.2%), social sciences (161 | 12.5%), business (154 | 12.0%), education (104 | 8.1%), and arts & humanities (99 | 7.7%) are the most common fields of study among 1,285 individuals in Hallowell who have obtained a bachelor's degree or higher.
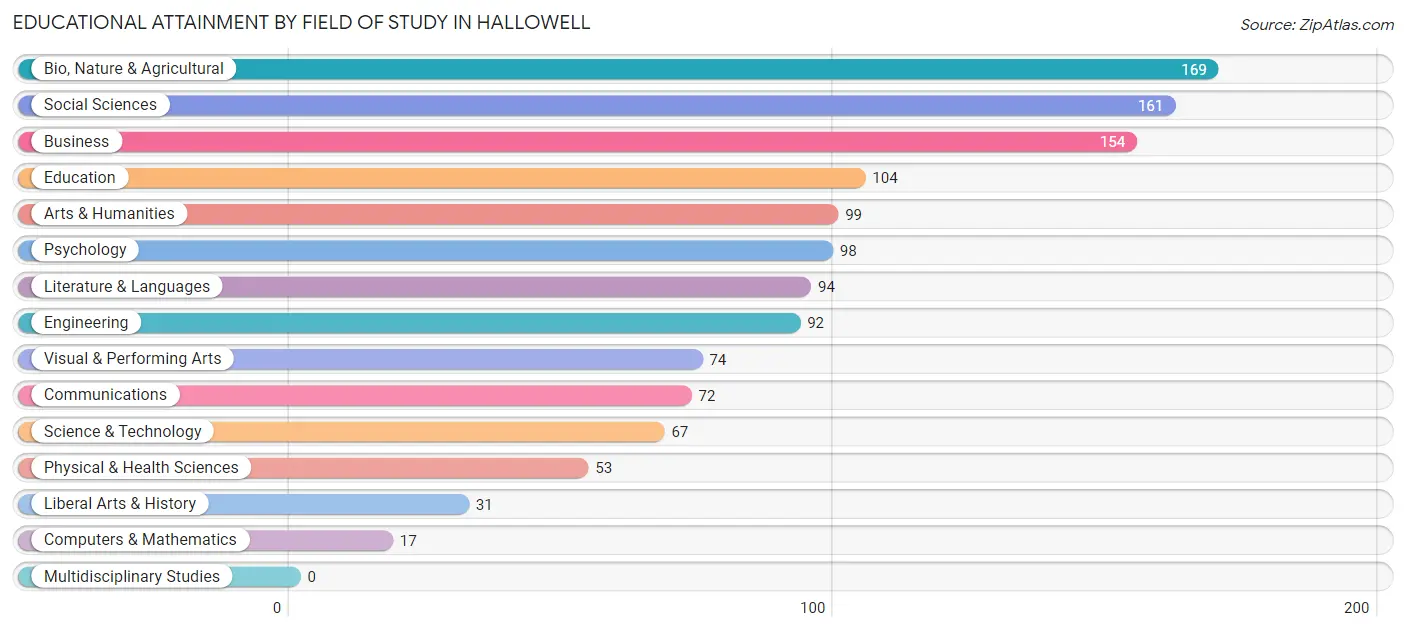
| Field of Study | # Graduates | % Graduates |
| Computers & Mathematics | 17 | 1.3% |
| Bio, Nature & Agricultural | 169 | 13.2% |
| Physical & Health Sciences | 53 | 4.1% |
| Psychology | 98 | 7.6% |
| Social Sciences | 161 | 12.5% |
| Engineering | 92 | 7.2% |
| Multidisciplinary Studies | 0 | 0.0% |
| Science & Technology | 67 | 5.2% |
| Business | 154 | 12.0% |
| Education | 104 | 8.1% |
| Literature & Languages | 94 | 7.3% |
| Liberal Arts & History | 31 | 2.4% |
| Visual & Performing Arts | 74 | 5.8% |
| Communications | 72 | 5.6% |
| Arts & Humanities | 99 | 7.7% |
| Total | 1,285 | 100.0% |
Transportation & Commute in Hallowell
Vehicle Availability by Sex in Hallowell
The most prevalent vehicle ownership categories in Hallowell are males with 2 vehicles (243, accounting for 43.7%) and females with 2 vehicles (358, making up 30.6%).
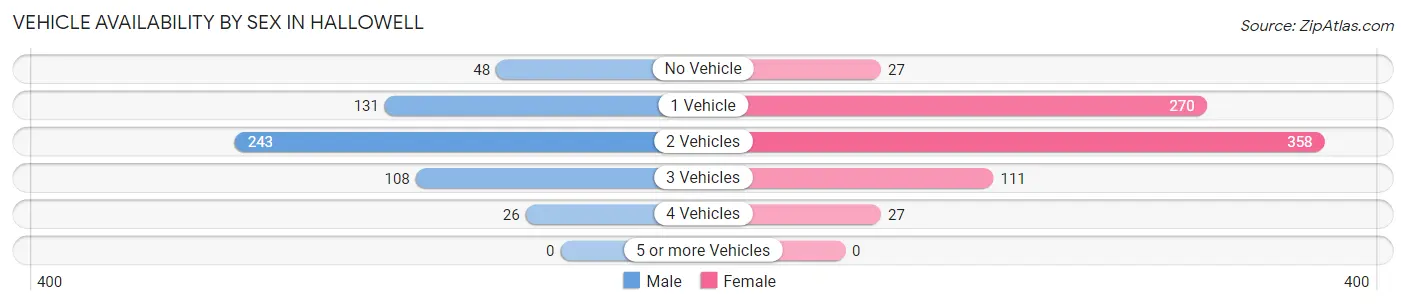
| Vehicles Available | Male | Female |
| No Vehicle | 48 (8.6%) | 27 (3.4%) |
| 1 Vehicle | 131 (23.6%) | 270 (34.1%) |
| 2 Vehicles | 243 (43.7%) | 358 (45.2%) |
| 3 Vehicles | 108 (19.4%) | 111 (14.0%) |
| 4 Vehicles | 26 (4.7%) | 27 (3.4%) |
| 5 or more Vehicles | 0 (0.0%) | 0 (0.0%) |
| Total | 556 (100.0%) | 793 (100.0%) |
Commute Time in Hallowell
The most frequently occuring commute durations in Hallowell are less than 5 minutes (249 commuters, 21.4%), 10 to 14 minutes (229 commuters, 19.7%), and 15 to 19 minutes (220 commuters, 18.9%).
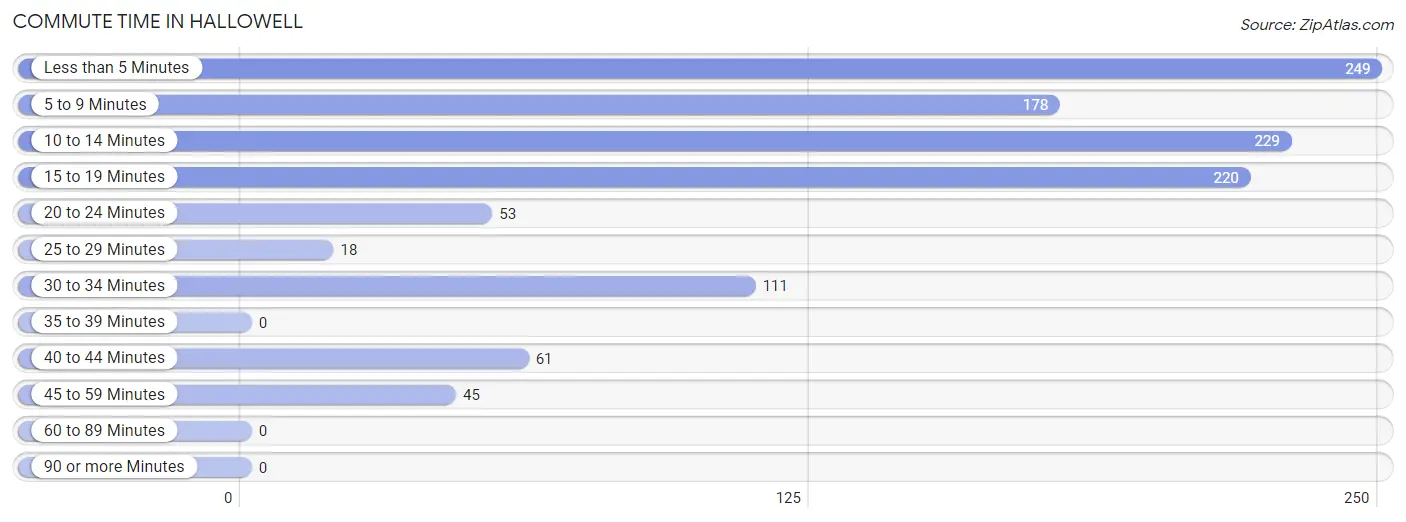
| Commute Time | # Commuters | % Commuters |
| Less than 5 Minutes | 249 | 21.4% |
| 5 to 9 Minutes | 178 | 15.3% |
| 10 to 14 Minutes | 229 | 19.7% |
| 15 to 19 Minutes | 220 | 18.9% |
| 20 to 24 Minutes | 53 | 4.5% |
| 25 to 29 Minutes | 18 | 1.5% |
| 30 to 34 Minutes | 111 | 9.5% |
| 35 to 39 Minutes | 0 | 0.0% |
| 40 to 44 Minutes | 61 | 5.2% |
| 45 to 59 Minutes | 45 | 3.9% |
| 60 to 89 Minutes | 0 | 0.0% |
| 90 or more Minutes | 0 | 0.0% |
Commute Time by Sex in Hallowell
The most common commute times in Hallowell are 15 to 19 minutes (146 commuters, 30.2%) for males and less than 5 minutes (209 commuters, 30.7%) for females.
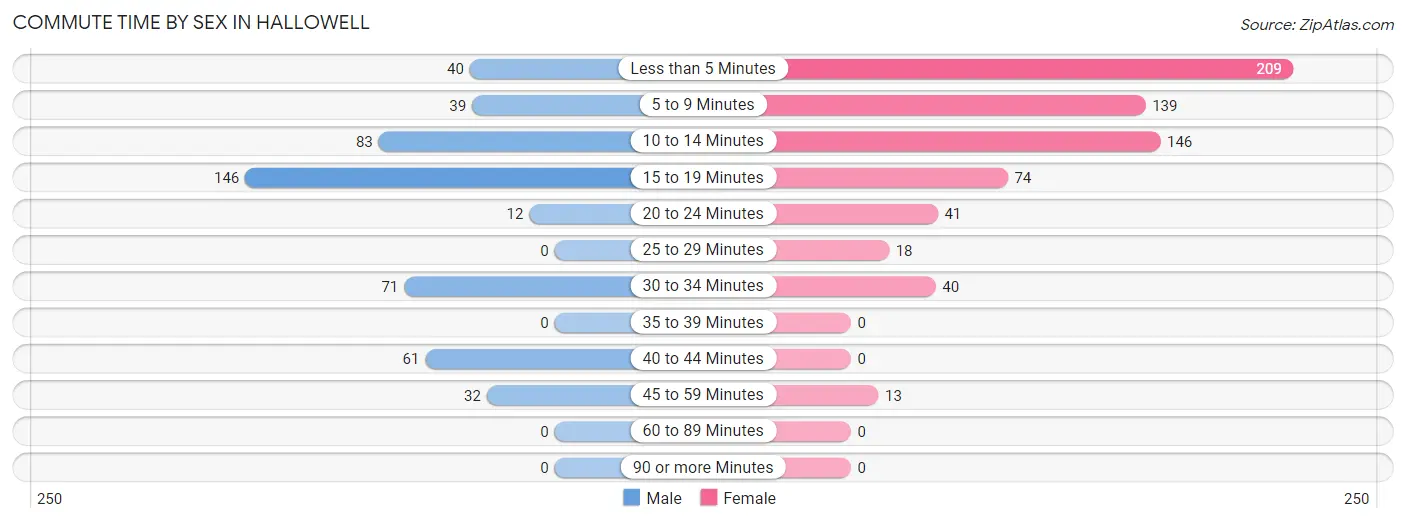
| Commute Time | Male | Female |
| Less than 5 Minutes | 40 (8.3%) | 209 (30.7%) |
| 5 to 9 Minutes | 39 (8.1%) | 139 (20.4%) |
| 10 to 14 Minutes | 83 (17.2%) | 146 (21.5%) |
| 15 to 19 Minutes | 146 (30.2%) | 74 (10.9%) |
| 20 to 24 Minutes | 12 (2.5%) | 41 (6.0%) |
| 25 to 29 Minutes | 0 (0.0%) | 18 (2.6%) |
| 30 to 34 Minutes | 71 (14.7%) | 40 (5.9%) |
| 35 to 39 Minutes | 0 (0.0%) | 0 (0.0%) |
| 40 to 44 Minutes | 61 (12.6%) | 0 (0.0%) |
| 45 to 59 Minutes | 32 (6.6%) | 13 (1.9%) |
| 60 to 89 Minutes | 0 (0.0%) | 0 (0.0%) |
| 90 or more Minutes | 0 (0.0%) | 0 (0.0%) |
Time of Departure to Work by Sex in Hallowell
The most frequent times of departure to work in Hallowell are 8:00 AM to 8:29 AM (78, 16.1%) for males and 12:00 PM to 3:59 PM (186, 27.4%) for females.
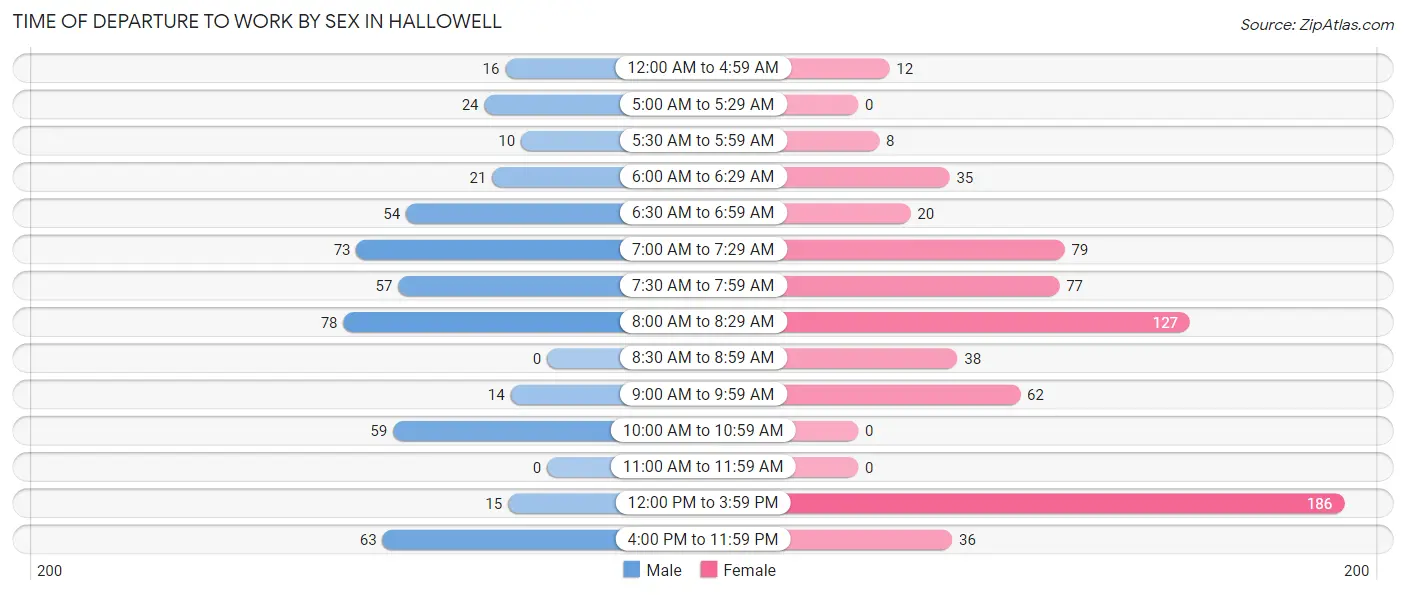
| Time of Departure | Male | Female |
| 12:00 AM to 4:59 AM | 16 (3.3%) | 12 (1.8%) |
| 5:00 AM to 5:29 AM | 24 (5.0%) | 0 (0.0%) |
| 5:30 AM to 5:59 AM | 10 (2.1%) | 8 (1.2%) |
| 6:00 AM to 6:29 AM | 21 (4.3%) | 35 (5.1%) |
| 6:30 AM to 6:59 AM | 54 (11.2%) | 20 (2.9%) |
| 7:00 AM to 7:29 AM | 73 (15.1%) | 79 (11.6%) |
| 7:30 AM to 7:59 AM | 57 (11.8%) | 77 (11.3%) |
| 8:00 AM to 8:29 AM | 78 (16.1%) | 127 (18.7%) |
| 8:30 AM to 8:59 AM | 0 (0.0%) | 38 (5.6%) |
| 9:00 AM to 9:59 AM | 14 (2.9%) | 62 (9.1%) |
| 10:00 AM to 10:59 AM | 59 (12.2%) | 0 (0.0%) |
| 11:00 AM to 11:59 AM | 0 (0.0%) | 0 (0.0%) |
| 12:00 PM to 3:59 PM | 15 (3.1%) | 186 (27.4%) |
| 4:00 PM to 11:59 PM | 63 (13.0%) | 36 (5.3%) |
| Total | 484 (100.0%) | 680 (100.0%) |
Housing Occupancy in Hallowell
Occupancy by Ownership in Hallowell
Of the total 1,359 dwellings in Hallowell, owner-occupied units account for 774 (57.0%), while renter-occupied units make up 585 (43.0%).
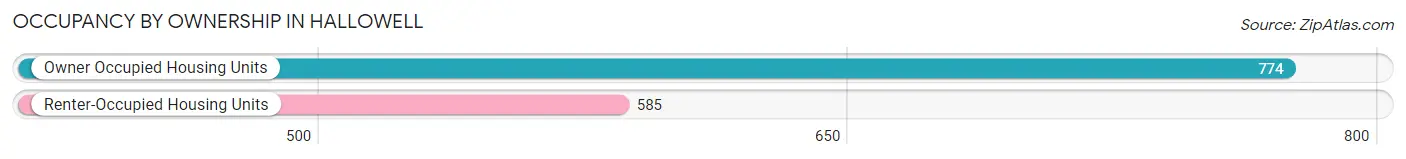
| Occupancy | # Housing Units | % Housing Units |
| Owner Occupied Housing Units | 774 | 57.0% |
| Renter-Occupied Housing Units | 585 | 43.0% |
| Total Occupied Housing Units | 1,359 | 100.0% |
Occupancy by Household Size in Hallowell
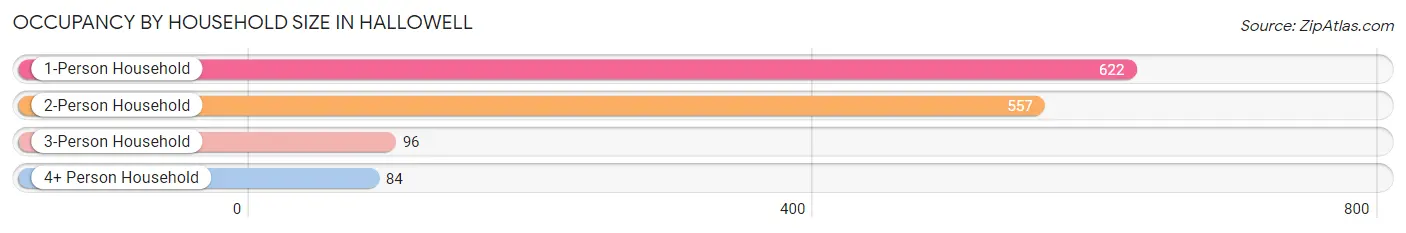
| Household Size | # Housing Units | % Housing Units |
| 1-Person Household | 622 | 45.8% |
| 2-Person Household | 557 | 41.0% |
| 3-Person Household | 96 | 7.1% |
| 4+ Person Household | 84 | 6.2% |
| Total Housing Units | 1,359 | 100.0% |
Occupancy by Ownership by Household Size in Hallowell
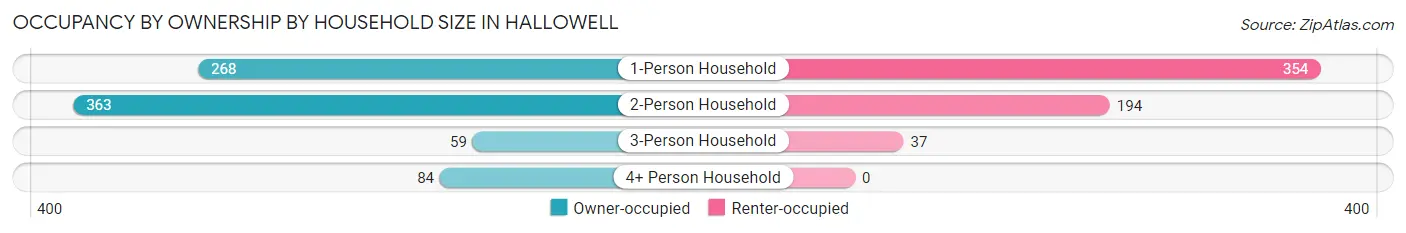
| Household Size | Owner-occupied | Renter-occupied |
| 1-Person Household | 268 (43.1%) | 354 (56.9%) |
| 2-Person Household | 363 (65.2%) | 194 (34.8%) |
| 3-Person Household | 59 (61.5%) | 37 (38.5%) |
| 4+ Person Household | 84 (100.0%) | 0 (0.0%) |
| Total Housing Units | 774 (57.0%) | 585 (43.0%) |
Occupancy by Educational Attainment in Hallowell
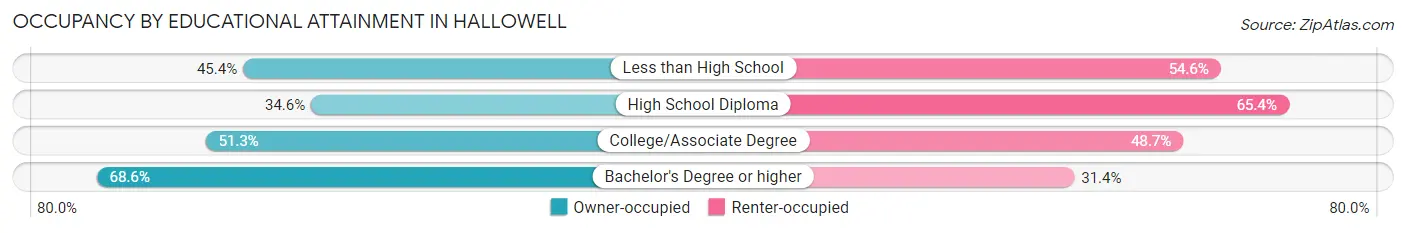
| Household Size | Owner-occupied | Renter-occupied |
| Less than High School | 44 (45.4%) | 53 (54.6%) |
| High School Diploma | 84 (34.6%) | 159 (65.4%) |
| College/Associate Degree | 157 (51.3%) | 149 (48.7%) |
| Bachelor's Degree or higher | 489 (68.6%) | 224 (31.4%) |
Occupancy by Age of Householder in Hallowell
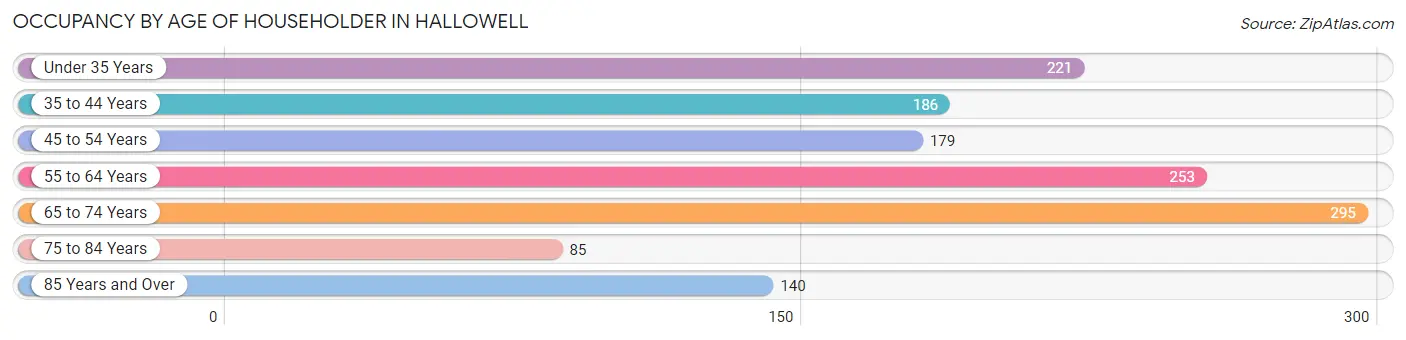
| Age Bracket | # Households | % Households |
| Under 35 Years | 221 | 16.3% |
| 35 to 44 Years | 186 | 13.7% |
| 45 to 54 Years | 179 | 13.2% |
| 55 to 64 Years | 253 | 18.6% |
| 65 to 74 Years | 295 | 21.7% |
| 75 to 84 Years | 85 | 6.2% |
| 85 Years and Over | 140 | 10.3% |
| Total | 1,359 | 100.0% |
Housing Finances in Hallowell
Median Income by Occupancy in Hallowell
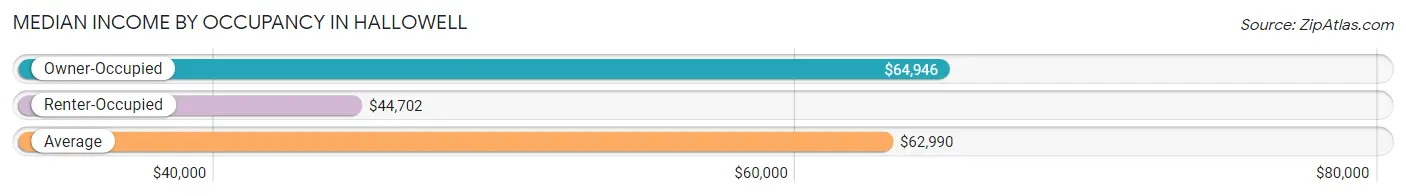
| Occupancy Type | # Households | Median Income |
| Owner-Occupied | 774 (57.0%) | $64,946 |
| Renter-Occupied | 585 (43.0%) | $44,702 |
| Average | 1,359 (100.0%) | $62,990 |
Occupancy by Householder Income Bracket in Hallowell
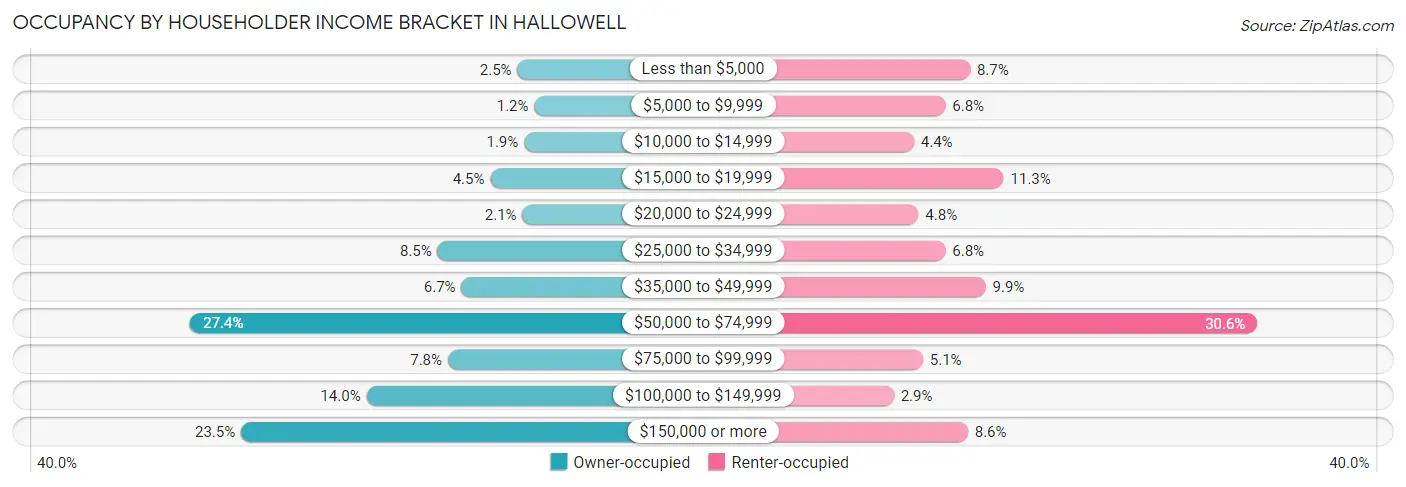
| Income Bracket | Owner-occupied | Renter-occupied |
| Less than $5,000 | 19 (2.5%) | 51 (8.7%) |
| $5,000 to $9,999 | 9 (1.2%) | 40 (6.8%) |
| $10,000 to $14,999 | 15 (1.9%) | 26 (4.4%) |
| $15,000 to $19,999 | 35 (4.5%) | 66 (11.3%) |
| $20,000 to $24,999 | 16 (2.1%) | 28 (4.8%) |
| $25,000 to $34,999 | 66 (8.5%) | 40 (6.8%) |
| $35,000 to $49,999 | 52 (6.7%) | 58 (9.9%) |
| $50,000 to $74,999 | 212 (27.4%) | 179 (30.6%) |
| $75,000 to $99,999 | 60 (7.7%) | 30 (5.1%) |
| $100,000 to $149,999 | 108 (14.0%) | 17 (2.9%) |
| $150,000 or more | 182 (23.5%) | 50 (8.6%) |
| Total | 774 (100.0%) | 585 (100.0%) |
Monthly Housing Cost Tiers in Hallowell
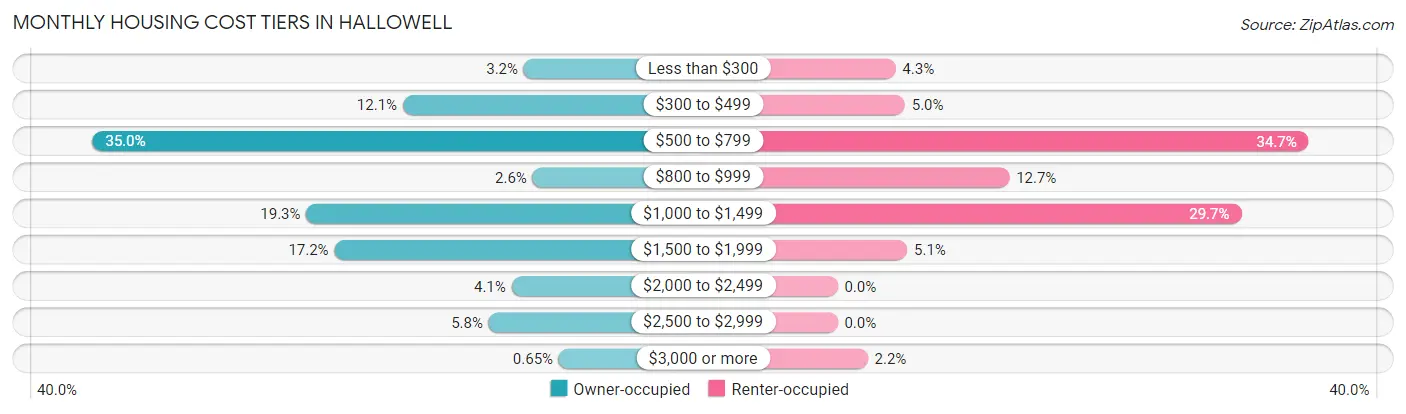
| Monthly Cost | Owner-occupied | Renter-occupied |
| Less than $300 | 25 (3.2%) | 25 (4.3%) |
| $300 to $499 | 94 (12.1%) | 29 (5.0%) |
| $500 to $799 | 271 (35.0%) | 203 (34.7%) |
| $800 to $999 | 20 (2.6%) | 74 (12.7%) |
| $1,000 to $1,499 | 149 (19.3%) | 174 (29.7%) |
| $1,500 to $1,999 | 133 (17.2%) | 30 (5.1%) |
| $2,000 to $2,499 | 32 (4.1%) | 0 (0.0%) |
| $2,500 to $2,999 | 45 (5.8%) | 0 (0.0%) |
| $3,000 or more | 5 (0.6%) | 13 (2.2%) |
| Total | 774 (100.0%) | 585 (100.0%) |
Physical Housing Characteristics in Hallowell
Housing Structures in Hallowell
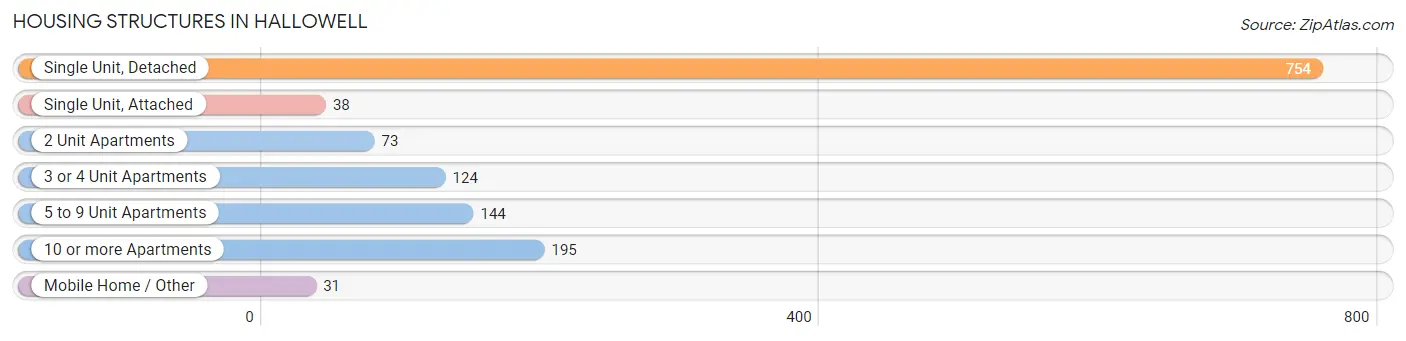
| Structure Type | # Housing Units | % Housing Units |
| Single Unit, Detached | 754 | 55.5% |
| Single Unit, Attached | 38 | 2.8% |
| 2 Unit Apartments | 73 | 5.4% |
| 3 or 4 Unit Apartments | 124 | 9.1% |
| 5 to 9 Unit Apartments | 144 | 10.6% |
| 10 or more Apartments | 195 | 14.3% |
| Mobile Home / Other | 31 | 2.3% |
| Total | 1,359 | 100.0% |
Housing Structures by Occupancy in Hallowell
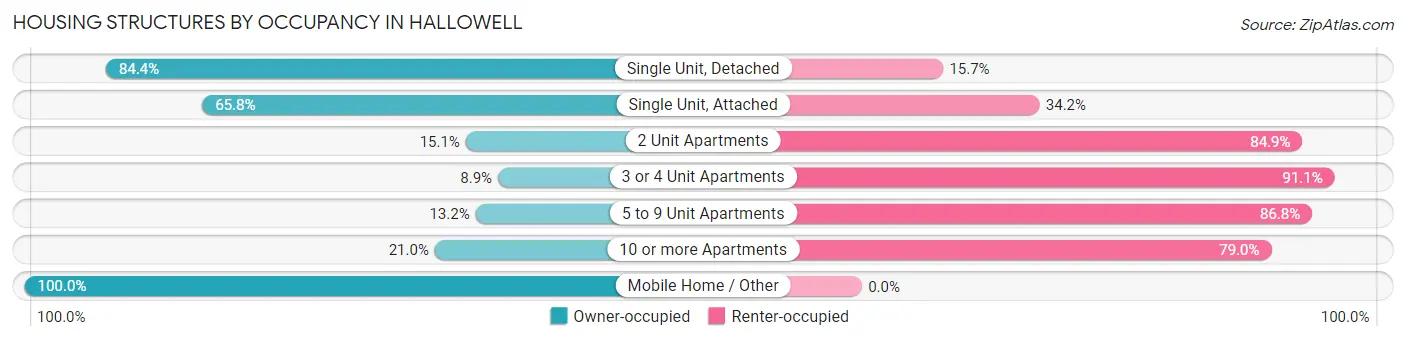
| Structure Type | Owner-occupied | Renter-occupied |
| Single Unit, Detached | 636 (84.4%) | 118 (15.7%) |
| Single Unit, Attached | 25 (65.8%) | 13 (34.2%) |
| 2 Unit Apartments | 11 (15.1%) | 62 (84.9%) |
| 3 or 4 Unit Apartments | 11 (8.9%) | 113 (91.1%) |
| 5 to 9 Unit Apartments | 19 (13.2%) | 125 (86.8%) |
| 10 or more Apartments | 41 (21.0%) | 154 (79.0%) |
| Mobile Home / Other | 31 (100.0%) | 0 (0.0%) |
| Total | 774 (57.0%) | 585 (43.0%) |
Housing Structures by Number of Rooms in Hallowell
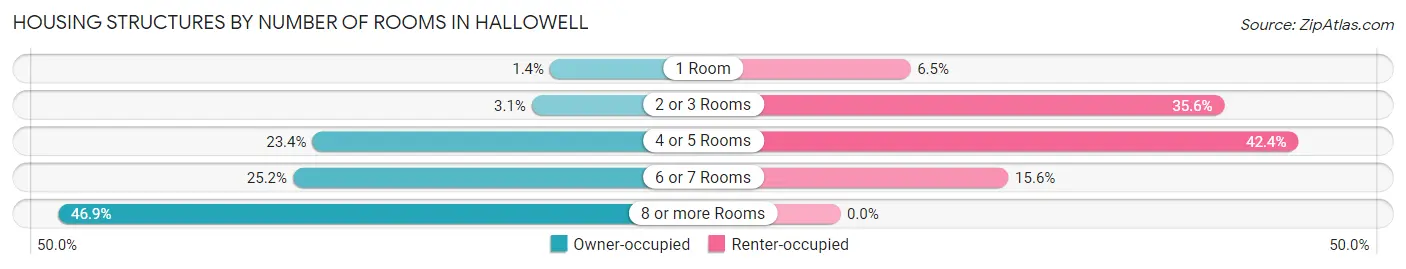
| Number of Rooms | Owner-occupied | Renter-occupied |
| 1 Room | 11 (1.4%) | 38 (6.5%) |
| 2 or 3 Rooms | 24 (3.1%) | 208 (35.6%) |
| 4 or 5 Rooms | 181 (23.4%) | 248 (42.4%) |
| 6 or 7 Rooms | 195 (25.2%) | 91 (15.6%) |
| 8 or more Rooms | 363 (46.9%) | 0 (0.0%) |
| Total | 774 (100.0%) | 585 (100.0%) |
Housing Structure by Heating Type in Hallowell
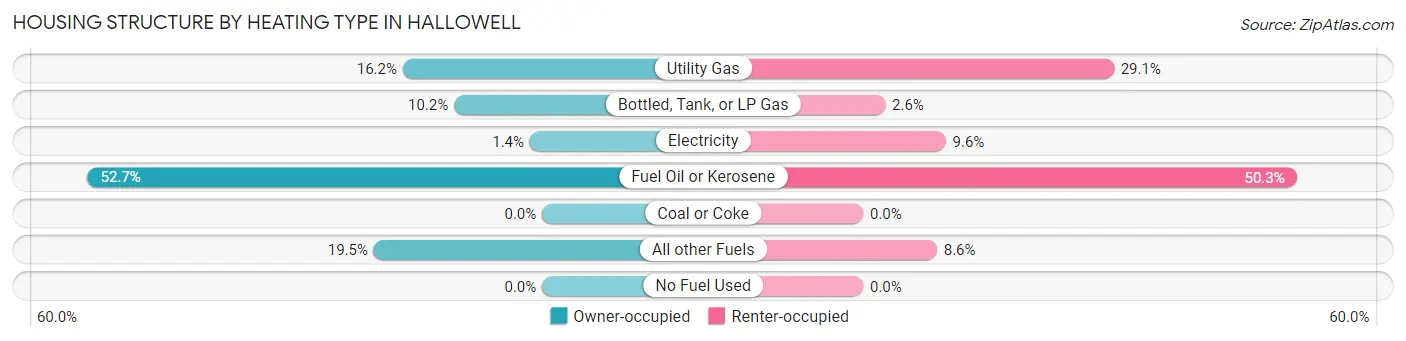
| Heating Type | Owner-occupied | Renter-occupied |
| Utility Gas | 125 (16.2%) | 170 (29.1%) |
| Bottled, Tank, or LP Gas | 79 (10.2%) | 15 (2.6%) |
| Electricity | 11 (1.4%) | 56 (9.6%) |
| Fuel Oil or Kerosene | 408 (52.7%) | 294 (50.3%) |
| Coal or Coke | 0 (0.0%) | 0 (0.0%) |
| All other Fuels | 151 (19.5%) | 50 (8.6%) |
| No Fuel Used | 0 (0.0%) | 0 (0.0%) |
| Total | 774 (100.0%) | 585 (100.0%) |
Household Vehicle Usage in Hallowell
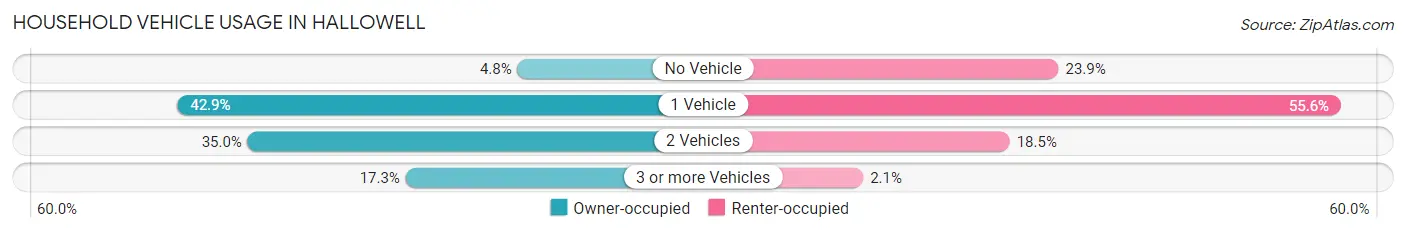
| Vehicles per Household | Owner-occupied | Renter-occupied |
| No Vehicle | 37 (4.8%) | 140 (23.9%) |
| 1 Vehicle | 332 (42.9%) | 325 (55.6%) |
| 2 Vehicles | 271 (35.0%) | 108 (18.5%) |
| 3 or more Vehicles | 134 (17.3%) | 12 (2.1%) |
| Total | 774 (100.0%) | 585 (100.0%) |
Real Estate & Mortgages in Hallowell
Real Estate and Mortgage Overview in Hallowell
| Characteristic | Without Mortgage | With Mortgage |
| Housing Units | 382 | 392 |
| Median Property Value | $191,300 | $275,800 |
| Median Household Income | $58,148 | $138 |
| Monthly Housing Costs | $569 | $5 |
| Real Estate Taxes | $3,188 | $30 |
Property Value by Mortgage Status in Hallowell
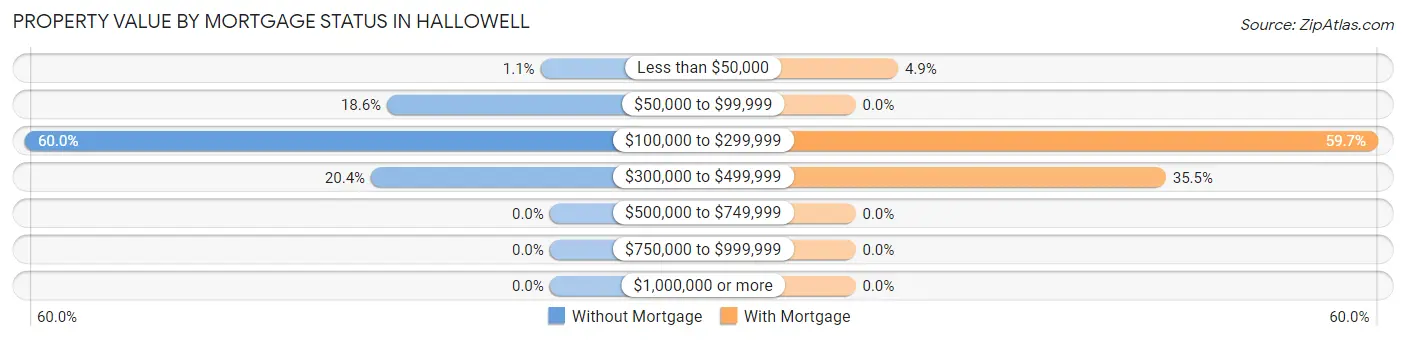
| Property Value | Without Mortgage | With Mortgage |
| Less than $50,000 | 4 (1.1%) | 19 (4.9%) |
| $50,000 to $99,999 | 71 (18.6%) | 0 (0.0%) |
| $100,000 to $299,999 | 229 (60.0%) | 234 (59.7%) |
| $300,000 to $499,999 | 78 (20.4%) | 139 (35.5%) |
| $500,000 to $749,999 | 0 (0.0%) | 0 (0.0%) |
| $750,000 to $999,999 | 0 (0.0%) | 0 (0.0%) |
| $1,000,000 or more | 0 (0.0%) | 0 (0.0%) |
| Total | 382 (100.0%) | 392 (100.0%) |
Household Income by Mortgage Status in Hallowell
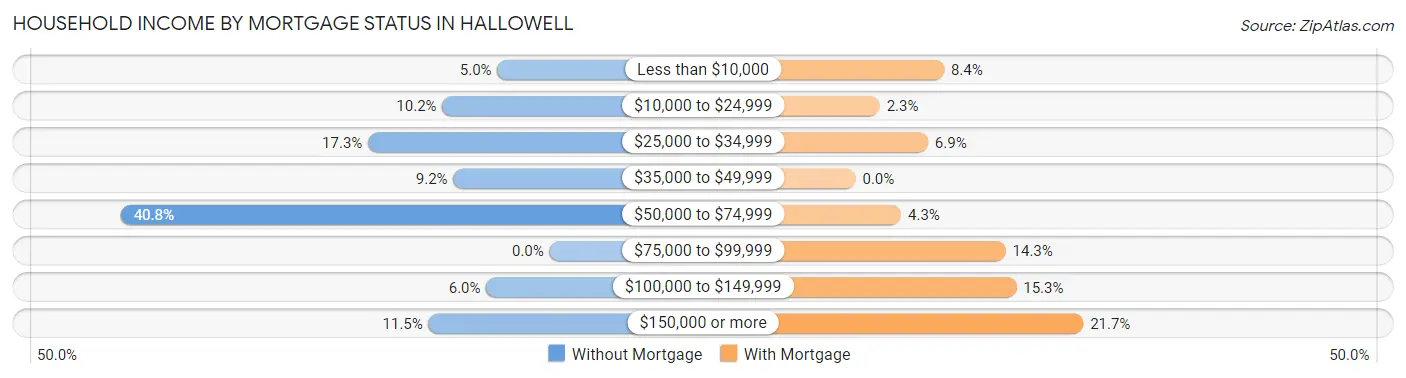
| Household Income | Without Mortgage | With Mortgage |
| Less than $10,000 | 19 (5.0%) | 33 (8.4%) |
| $10,000 to $24,999 | 39 (10.2%) | 9 (2.3%) |
| $25,000 to $34,999 | 66 (17.3%) | 27 (6.9%) |
| $35,000 to $49,999 | 35 (9.2%) | 0 (0.0%) |
| $50,000 to $74,999 | 156 (40.8%) | 17 (4.3%) |
| $75,000 to $99,999 | 0 (0.0%) | 56 (14.3%) |
| $100,000 to $149,999 | 23 (6.0%) | 60 (15.3%) |
| $150,000 or more | 44 (11.5%) | 85 (21.7%) |
| Total | 382 (100.0%) | 392 (100.0%) |
Property Value to Household Income Ratio in Hallowell
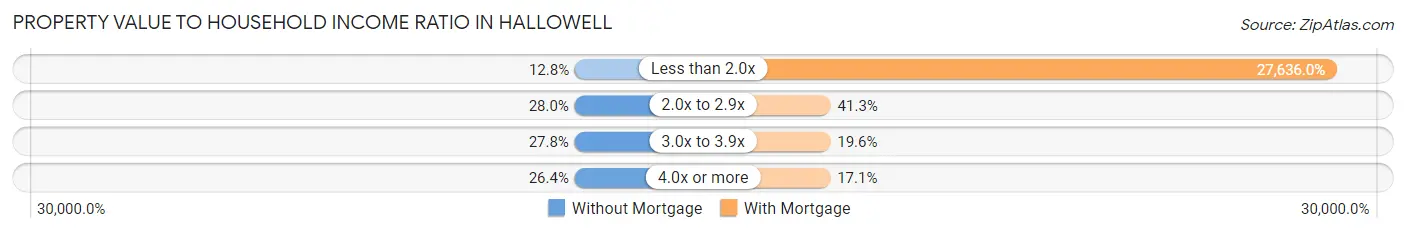
| Value-to-Income Ratio | Without Mortgage | With Mortgage |
| Less than 2.0x | 49 (12.8%) | 108,333 (27,636.0%) |
| 2.0x to 2.9x | 107 (28.0%) | 162 (41.3%) |
| 3.0x to 3.9x | 106 (27.8%) | 77 (19.6%) |
| 4.0x or more | 101 (26.4%) | 67 (17.1%) |
| Total | 382 (100.0%) | 392 (100.0%) |
Real Estate Taxes by Mortgage Status in Hallowell
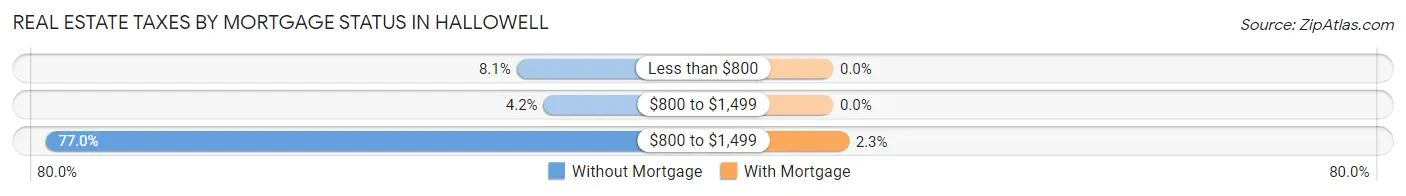
| Property Taxes | Without Mortgage | With Mortgage |
| Less than $800 | 31 (8.1%) | 0 (0.0%) |
| $800 to $1,499 | 16 (4.2%) | 0 (0.0%) |
| $800 to $1,499 | 294 (77.0%) | 9 (2.3%) |
| Total | 382 (100.0%) | 392 (100.0%) |
Health & Disability in Hallowell
Health Insurance Coverage by Age in Hallowell
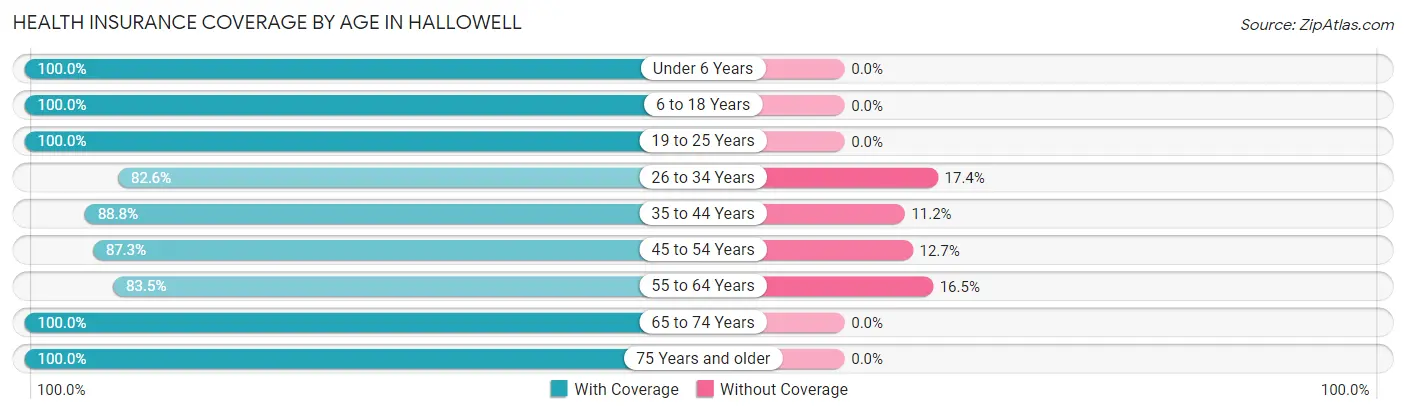
| Age Bracket | With Coverage | Without Coverage |
| Under 6 Years | 62 (100.0%) | 0 (0.0%) |
| 6 to 18 Years | 270 (100.0%) | 0 (0.0%) |
| 19 to 25 Years | 188 (100.0%) | 0 (0.0%) |
| 26 to 34 Years | 299 (82.6%) | 63 (17.4%) |
| 35 to 44 Years | 261 (88.8%) | 33 (11.2%) |
| 45 to 54 Years | 199 (87.3%) | 29 (12.7%) |
| 55 to 64 Years | 309 (83.5%) | 61 (16.5%) |
| 65 to 74 Years | 476 (100.0%) | 0 (0.0%) |
| 75 Years and older | 255 (100.0%) | 0 (0.0%) |
| Total | 2,319 (92.6%) | 186 (7.4%) |
Health Insurance Coverage by Citizenship Status in Hallowell
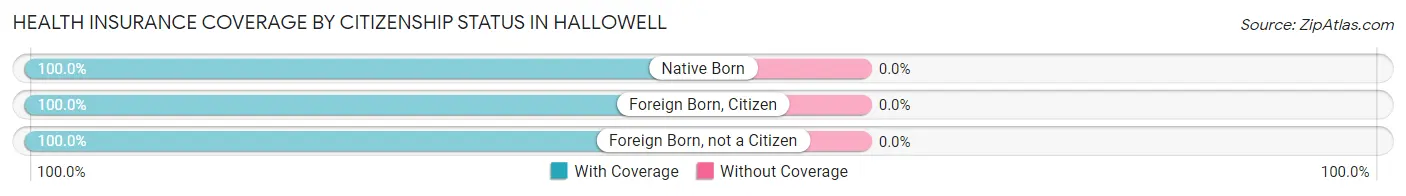
| Citizenship Status | With Coverage | Without Coverage |
| Native Born | 62 (100.0%) | 0 (0.0%) |
| Foreign Born, Citizen | 270 (100.0%) | 0 (0.0%) |
| Foreign Born, not a Citizen | 188 (100.0%) | 0 (0.0%) |
Health Insurance Coverage by Household Income in Hallowell
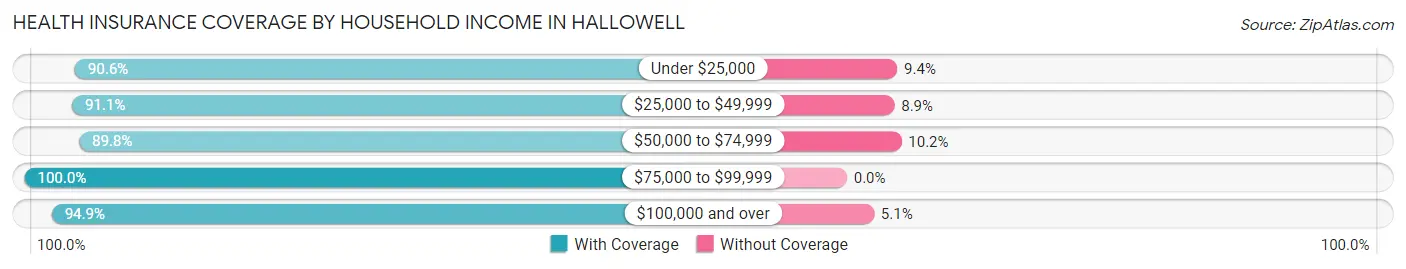
| Household Income | With Coverage | Without Coverage |
| Under $25,000 | 413 (90.6%) | 43 (9.4%) |
| $25,000 to $49,999 | 256 (91.1%) | 25 (8.9%) |
| $50,000 to $74,999 | 624 (89.8%) | 71 (10.2%) |
| $75,000 to $99,999 | 143 (100.0%) | 0 (0.0%) |
| $100,000 and over | 879 (94.9%) | 47 (5.1%) |
Public vs Private Health Insurance Coverage by Age in Hallowell
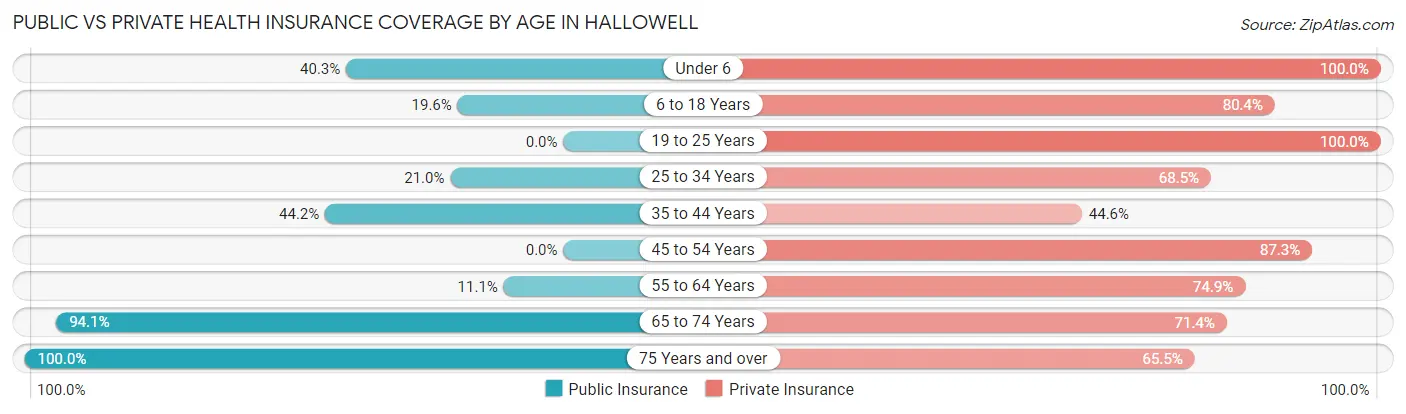
| Age Bracket | Public Insurance | Private Insurance |
| Under 6 | 25 (40.3%) | 62 (100.0%) |
| 6 to 18 Years | 53 (19.6%) | 217 (80.4%) |
| 19 to 25 Years | 0 (0.0%) | 188 (100.0%) |
| 25 to 34 Years | 76 (21.0%) | 248 (68.5%) |
| 35 to 44 Years | 130 (44.2%) | 131 (44.6%) |
| 45 to 54 Years | 0 (0.0%) | 199 (87.3%) |
| 55 to 64 Years | 41 (11.1%) | 277 (74.9%) |
| 65 to 74 Years | 448 (94.1%) | 340 (71.4%) |
| 75 Years and over | 255 (100.0%) | 167 (65.5%) |
| Total | 1,028 (41.0%) | 1,829 (73.0%) |
Disability Status by Sex by Age in Hallowell
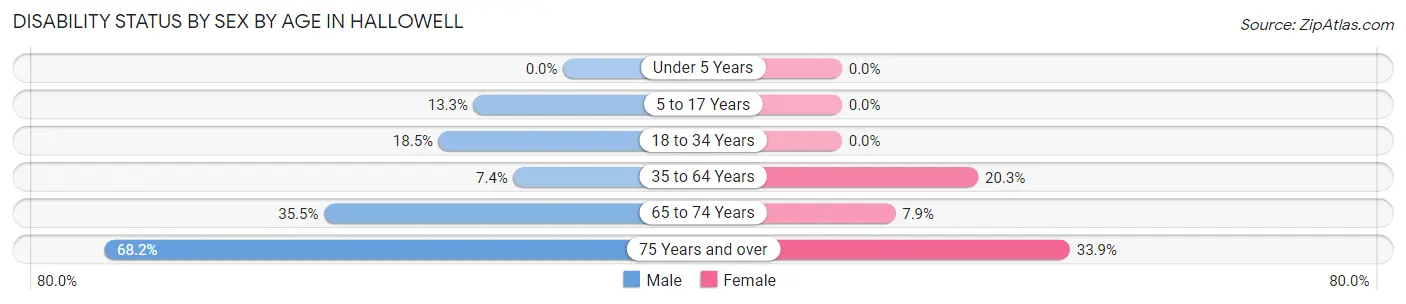
| Age Bracket | Male | Female |
| Under 5 Years | 0 (0.0%) | 0 (0.0%) |
| 5 to 17 Years | 27 (13.3%) | 0 (0.0%) |
| 18 to 34 Years | 51 (18.5%) | 0 (0.0%) |
| 35 to 64 Years | 25 (7.4%) | 112 (20.3%) |
| 65 to 74 Years | 93 (35.5%) | 17 (7.9%) |
| 75 Years and over | 45 (68.2%) | 64 (33.9%) |
Disability Class by Sex by Age in Hallowell
Disability Class: Hearing Difficulty
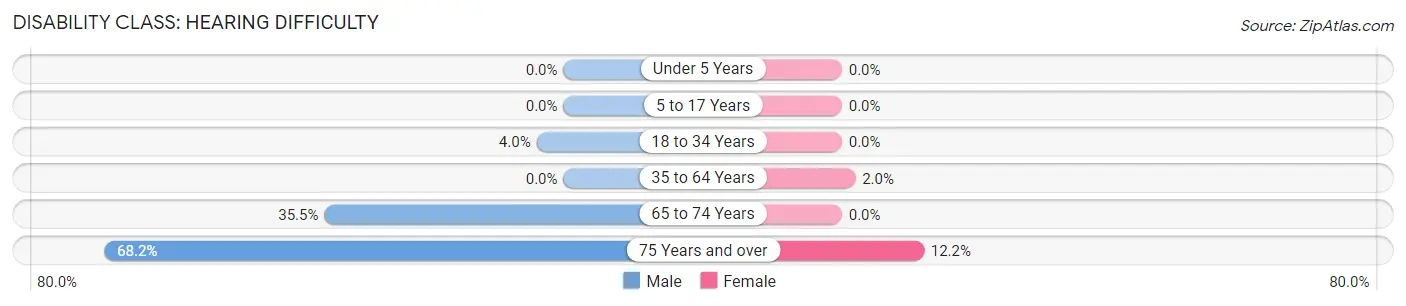
| Age Bracket | Male | Female |
| Under 5 Years | 0 (0.0%) | 0 (0.0%) |
| 5 to 17 Years | 0 (0.0%) | 0 (0.0%) |
| 18 to 34 Years | 11 (4.0%) | 0 (0.0%) |
| 35 to 64 Years | 0 (0.0%) | 11 (2.0%) |
| 65 to 74 Years | 93 (35.5%) | 0 (0.0%) |
| 75 Years and over | 45 (68.2%) | 23 (12.2%) |
Disability Class: Vision Difficulty
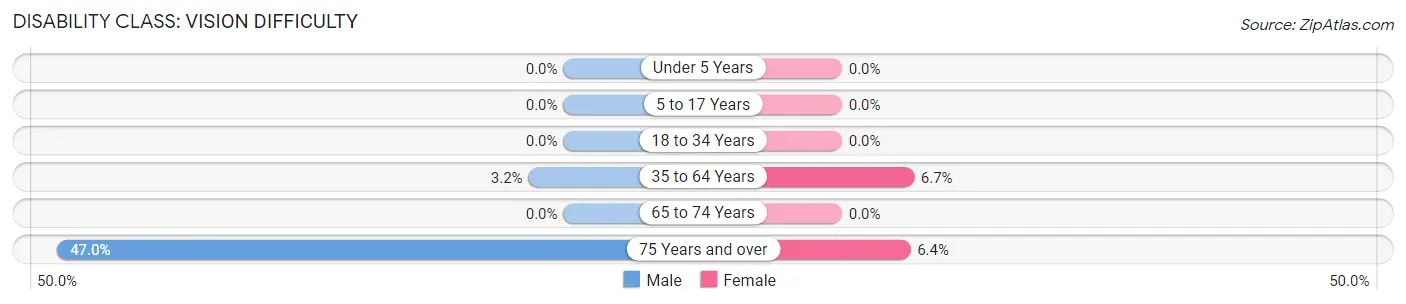
| Age Bracket | Male | Female |
| Under 5 Years | 0 (0.0%) | 0 (0.0%) |
| 5 to 17 Years | 0 (0.0%) | 0 (0.0%) |
| 18 to 34 Years | 0 (0.0%) | 0 (0.0%) |
| 35 to 64 Years | 11 (3.2%) | 37 (6.7%) |
| 65 to 74 Years | 0 (0.0%) | 0 (0.0%) |
| 75 Years and over | 31 (47.0%) | 12 (6.4%) |
Disability Class: Cognitive Difficulty
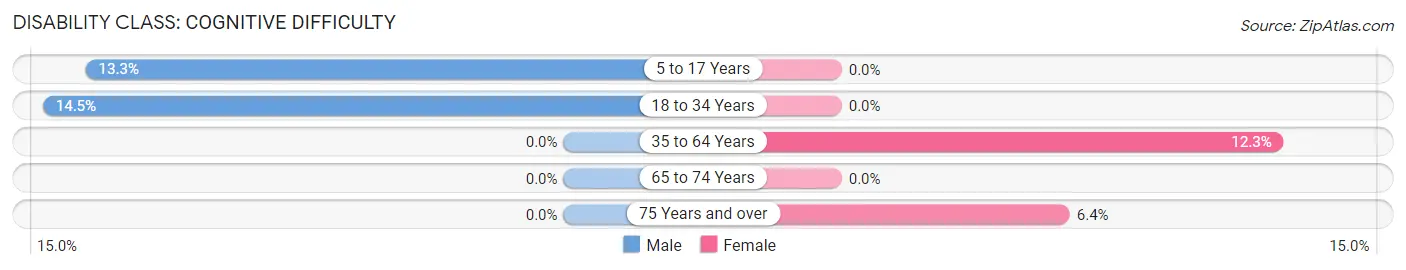
| Age Bracket | Male | Female |
| 5 to 17 Years | 27 (13.3%) | 0 (0.0%) |
| 18 to 34 Years | 40 (14.5%) | 0 (0.0%) |
| 35 to 64 Years | 0 (0.0%) | 68 (12.3%) |
| 65 to 74 Years | 0 (0.0%) | 0 (0.0%) |
| 75 Years and over | 0 (0.0%) | 12 (6.4%) |
Disability Class: Ambulatory Difficulty
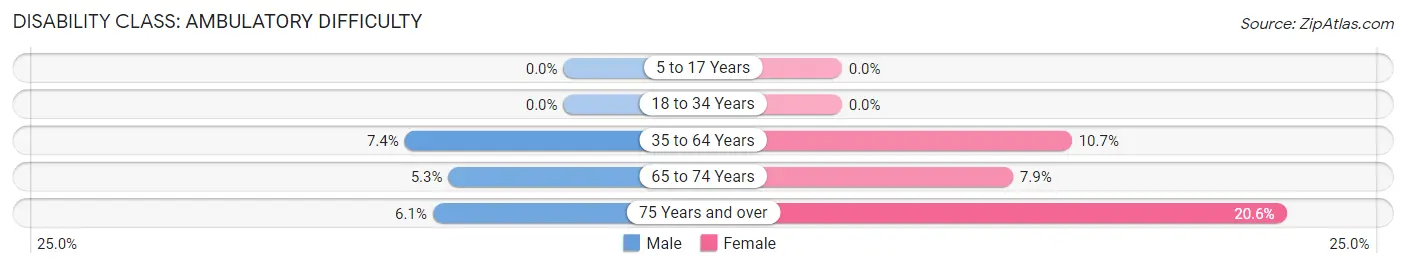
| Age Bracket | Male | Female |
| 5 to 17 Years | 0 (0.0%) | 0 (0.0%) |
| 18 to 34 Years | 0 (0.0%) | 0 (0.0%) |
| 35 to 64 Years | 25 (7.4%) | 59 (10.7%) |
| 65 to 74 Years | 14 (5.3%) | 17 (7.9%) |
| 75 Years and over | 4 (6.1%) | 39 (20.6%) |
Disability Class: Self-Care Difficulty
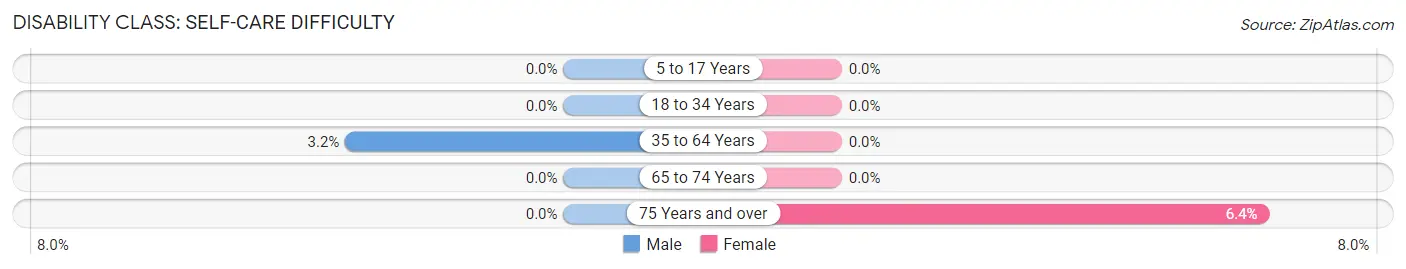
| Age Bracket | Male | Female |
| 5 to 17 Years | 0 (0.0%) | 0 (0.0%) |
| 18 to 34 Years | 0 (0.0%) | 0 (0.0%) |
| 35 to 64 Years | 11 (3.2%) | 0 (0.0%) |
| 65 to 74 Years | 0 (0.0%) | 0 (0.0%) |
| 75 Years and over | 0 (0.0%) | 12 (6.4%) |
Technology Access in Hallowell
Computing Device Access in Hallowell
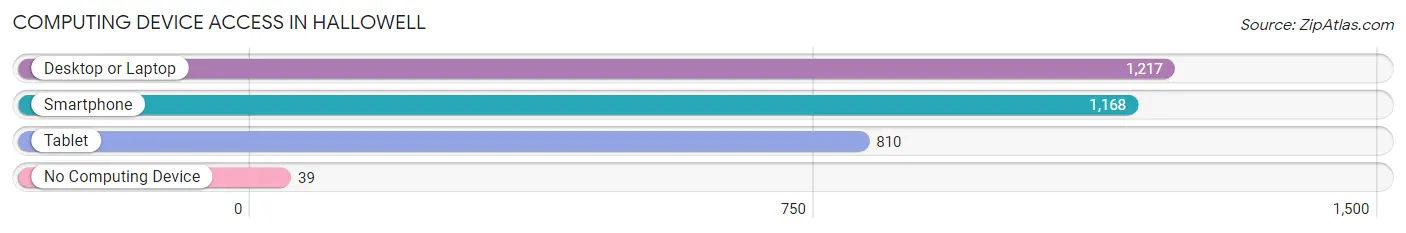
| Device Type | # Households | % Households |
| Desktop or Laptop | 1,217 | 89.5% |
| Smartphone | 1,168 | 86.0% |
| Tablet | 810 | 59.6% |
| No Computing Device | 39 | 2.9% |
| Total | 1,359 | 100.0% |
Internet Access in Hallowell
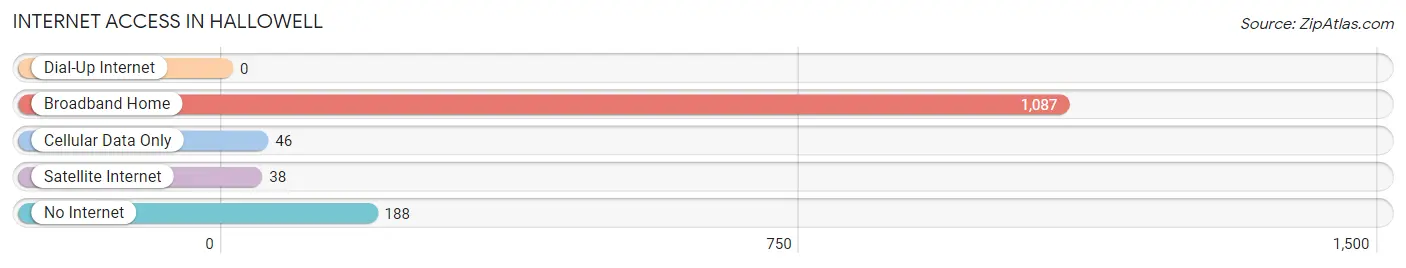
| Internet Type | # Households | % Households |
| Dial-Up Internet | 0 | 0.0% |
| Broadband Home | 1,087 | 80.0% |
| Cellular Data Only | 46 | 3.4% |
| Satellite Internet | 38 | 2.8% |
| No Internet | 188 | 13.8% |
| Total | 1,359 | 100.0% |
Hallowell Summary
Hallowell is a city located in Kennebec County, Maine, United States. It is situated on the east bank of the Kennebec River, approximately 15 miles (24 km) northeast of the state capital of Augusta. The population was 2,381 at the 2010 census.
History
Hallowell was first settled in 1754 by British colonists, who named it after Benjamin Hallowell, a prominent Boston merchant. The town was incorporated in 1771 and was the first town in Maine to be incorporated after the Revolutionary War.
In the 19th century, Hallowell was a major port on the Kennebec River, and was home to several shipbuilding and lumber mills. The city was also home to the Hallowell Granite Company, which quarried granite for many of the buildings in the area.
Geography
Hallowell is located at 44°15′N 69°45′W (44.25, -69.75). According to the United States Census Bureau, the city has a total area of 4.2 square miles (10.8 km2), of which 4.1 square miles (10.6 km2) is land and 0.1 square mile (0.2 km2) is water.
Economy
Hallowell is home to several businesses, including a number of restaurants, retail stores, and professional services. The city is also home to the Maine State Museum, which houses a collection of artifacts and exhibits related to the history of Maine.
Demographics
As of the census of 2010, there were 2,381 people, 1,039 households, and 590 families residing in the city. The population density was 581.2 people per square mile (224.3/km2). There were 1,097 housing units at an average density of 268.2 per square mile (103.5/km2). The racial makeup of the city was 97.2% White, 0.7% African American, 0.3% Native American, 0.4% Asian, 0.1% Pacific Islander, 0.2% from other races, and 1.1% from two or more races. Hispanic or Latino of any race were 1.2% of the population.
There were 1,039 households, out of which 24.2% had children under the age of 18 living with them, 43.2% were married couples living together, 11.2% had a female householder with no husband present, and 41.2% were non-families. 33.2% of all households were made up of individuals, and 13.2% had someone living alone who was 65 years of age or older. The average household size was 2.22 and the average family size was 2.83.
In the city, the population was spread out, with 20.7% under the age of 18, 7.2% from 18 to 24, 28.2% from 25 to 44, 28.2% from 45 to 64, and 15.7% who were 65 years of age or older. The median age was 40 years. For every 100 females, there were 91.2 males. For every 100 females age 18 and over, there were 88.2 males.
The median income for a household in the city was $37,917, and the median income for a family was $48,750. Males had a median income of $35,938 versus $27,917 for females. The per capita income for the city was $20,945. About 8.2% of families and 11.2% of the population were below the poverty line, including 15.2% of those under age 18 and 8.2% of those age 65 or over.
Common Questions
What is Per Capita Income in Hallowell?
Per Capita income in Hallowell is $43,597.
What is the Median Family Income in Hallowell?
Median Family Income in Hallowell is $76,974.
What is the Median Household income in Hallowell?
Median Household Income in Hallowell is $62,990.
What is Income or Wage Gap in Hallowell?
Income or Wage Gap in Hallowell is 15.1%.
Women in Hallowell earn 84.9 cents for every dollar earned by a man.
What is Inequality or Gini Index in Hallowell?
Inequality or Gini Index in Hallowell is 0.47.
What is the Total Population of Hallowell?
Total Population of Hallowell is 2,558.
What is the Total Male Population of Hallowell?
Total Male Population of Hallowell is 1,217.
What is the Total Female Population of Hallowell?
Total Female Population of Hallowell is 1,341.
What is the Ratio of Males per 100 Females in Hallowell?
There are 90.75 Males per 100 Females in Hallowell.
What is the Ratio of Females per 100 Males in Hallowell?
There are 110.19 Females per 100 Males in Hallowell.
What is the Median Population Age in Hallowell?
Median Population Age in Hallowell is 49.5 Years.
What is the Average Family Size in Hallowell
Average Family Size in Hallowell is 2.7 People.
What is the Average Household Size in Hallowell
Average Household Size in Hallowell is 1.8 People.
How Large is the Labor Force in Hallowell?
There are 1,376 People in the Labor Forcein in Hallowell.
What is the Percentage of People in the Labor Force in Hallowell?
60.8% of People are in the Labor Force in Hallowell.
What is the Unemployment Rate in Hallowell?
Unemployment Rate in Hallowell is 0.9%.