Dover Foxcroft, ME Map & Demographics
Dover Foxcroft Map
Dover Foxcroft Overview
$28,327
PER CAPITA INCOME
$60,331
AVG FAMILY INCOME
$47,764
AVG HOUSEHOLD INCOME
48.8%
WAGE / INCOME GAP [ % ]
51.2¢/ $1
WAGE / INCOME GAP [ $ ]
0.49
INEQUALITY / GINI INDEX
2,836
TOTAL POPULATION
1,251
MALE POPULATION
1,585
FEMALE POPULATION
78.93
MALES / 100 FEMALES
126.70
FEMALES / 100 MALES
45.2
MEDIAN AGE
2.6
AVG FAMILY SIZE
2.1
AVG HOUSEHOLD SIZE
1,173
LABOR FORCE [ PEOPLE ]
50.6%
PERCENT IN LABOR FORCE
7.1%
UNEMPLOYMENT RATE
Dover Foxcroft Zip Codes
Dover Foxcroft Area Codes
Income in Dover Foxcroft
Income Overview in Dover Foxcroft
Per Capita Income in Dover Foxcroft is $28,327, while median incomes of families and households are $60,331 and $47,764 respectively.
| Characteristic | Number | Measure |
| Per Capita Income | 2,836 | $28,327 |
| Median Family Income | 707 | $60,331 |
| Mean Family Income | 707 | $82,568 |
| Median Household Income | 1,243 | $47,764 |
| Mean Household Income | 1,243 | $62,232 |
| Income Deficit | 707 | $0 |
| Wage / Income Gap (%) | 2,836 | 48.81% |
| Wage / Income Gap ($) | 2,836 | 51.19¢ per $1 |
| Gini / Inequality Index | 2,836 | 0.49 |
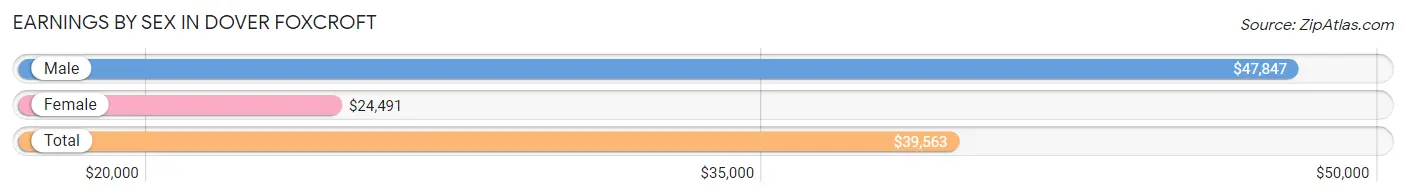
Earnings by Sex in Dover Foxcroft
Average Earnings in Dover Foxcroft are $39,563, $47,847 for men and $24,491 for women, a difference of 48.8%.
| Sex | Number | Average Earnings |
| Male | 589 (48.8%) | $47,847 |
| Female | 617 (51.2%) | $24,491 |
| Total | 1,206 (100.0%) | $39,563 |
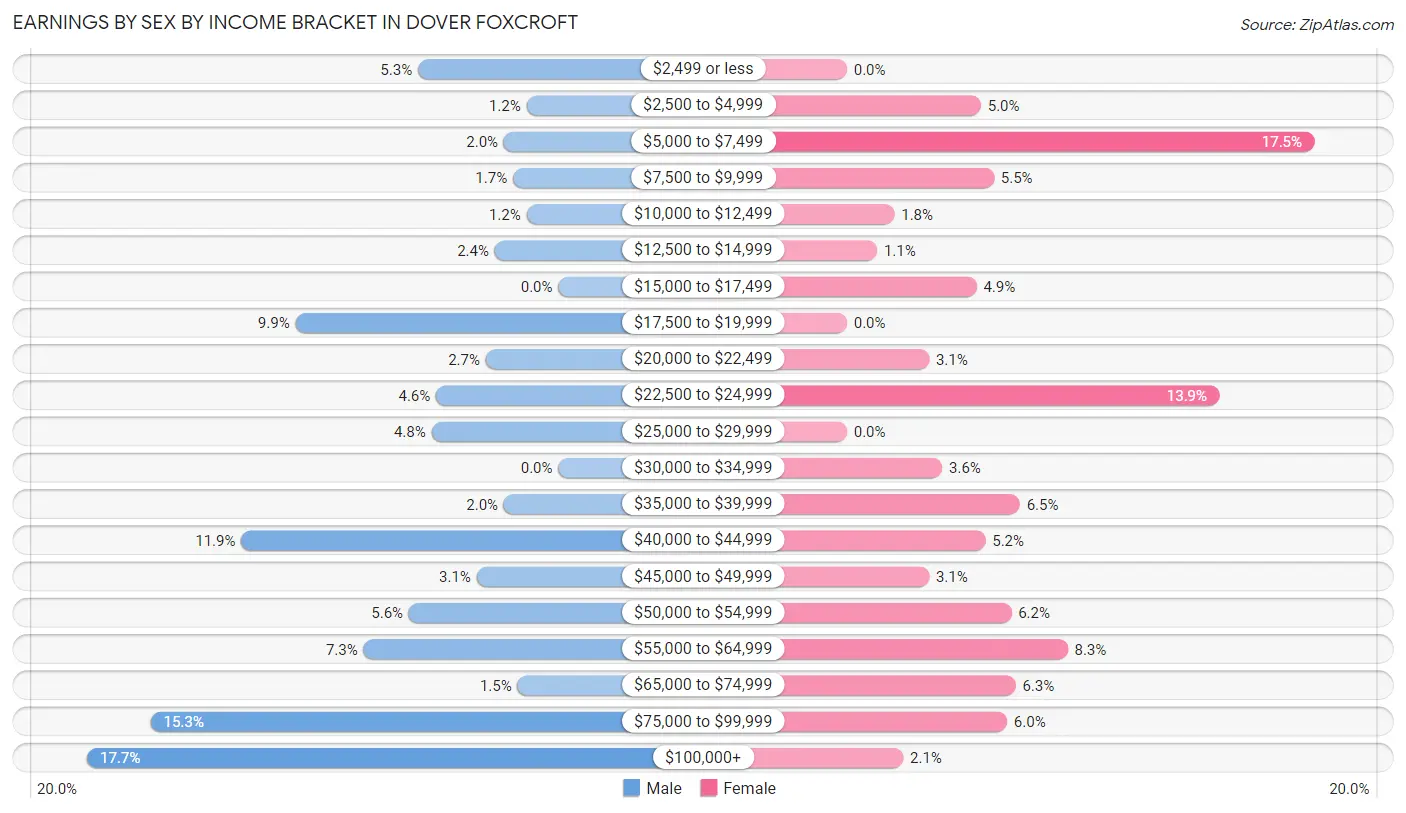
Earnings by Sex by Income Bracket in Dover Foxcroft
The most common earnings brackets in Dover Foxcroft are $100,000+ for men (104 | 17.7%) and $5,000 to $7,499 for women (108 | 17.5%).
| Income | Male | Female |
| $2,499 or less | 31 (5.3%) | 0 (0.0%) |
| $2,500 to $4,999 | 7 (1.2%) | 31 (5.0%) |
| $5,000 to $7,499 | 12 (2.0%) | 108 (17.5%) |
| $7,500 to $9,999 | 10 (1.7%) | 34 (5.5%) |
| $10,000 to $12,499 | 7 (1.2%) | 11 (1.8%) |
| $12,500 to $14,999 | 14 (2.4%) | 7 (1.1%) |
| $15,000 to $17,499 | 0 (0.0%) | 30 (4.9%) |
| $17,500 to $19,999 | 58 (9.9%) | 0 (0.0%) |
| $20,000 to $22,499 | 16 (2.7%) | 19 (3.1%) |
| $22,500 to $24,999 | 27 (4.6%) | 86 (13.9%) |
| $25,000 to $29,999 | 28 (4.8%) | 0 (0.0%) |
| $30,000 to $34,999 | 0 (0.0%) | 22 (3.6%) |
| $35,000 to $39,999 | 12 (2.0%) | 40 (6.5%) |
| $40,000 to $44,999 | 70 (11.9%) | 32 (5.2%) |
| $45,000 to $49,999 | 18 (3.1%) | 19 (3.1%) |
| $50,000 to $54,999 | 33 (5.6%) | 38 (6.2%) |
| $55,000 to $64,999 | 43 (7.3%) | 51 (8.3%) |
| $65,000 to $74,999 | 9 (1.5%) | 39 (6.3%) |
| $75,000 to $99,999 | 90 (15.3%) | 37 (6.0%) |
| $100,000+ | 104 (17.7%) | 13 (2.1%) |
| Total | 589 (100.0%) | 617 (100.0%) |
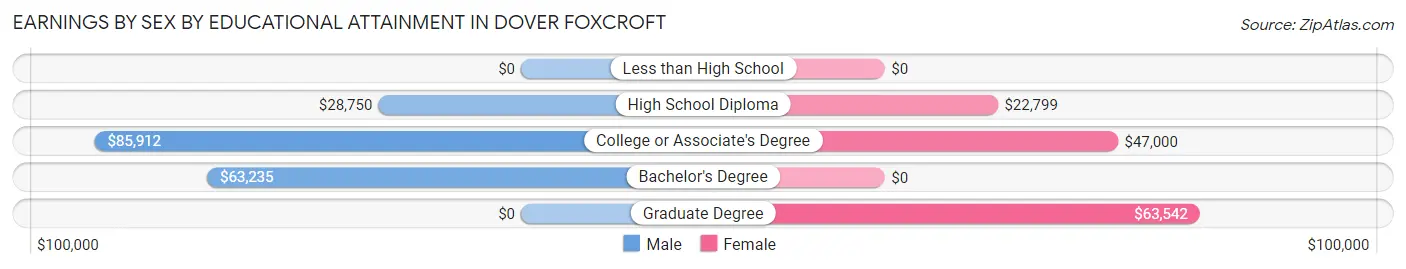
Earnings by Sex by Educational Attainment in Dover Foxcroft
Average earnings in Dover Foxcroft are $51,442 for men and $39,844 for women, a difference of 22.6%. Men with an educational attainment of college or associate's degree enjoy the highest average annual earnings of $85,912, while those with high school diploma education earn the least with $28,750. Women with an educational attainment of graduate degree earn the most with the average annual earnings of $63,542, while those with high school diploma education have the smallest earnings of $22,799.
| Educational Attainment | Male Income | Female Income |
| Less than High School | - | - |
| High School Diploma | $28,750 | $22,799 |
| College or Associate's Degree | $85,912 | $47,000 |
| Bachelor's Degree | $63,235 | $0 |
| Graduate Degree | - | - |
| Total | $51,442 | $39,844 |
Family Income in Dover Foxcroft
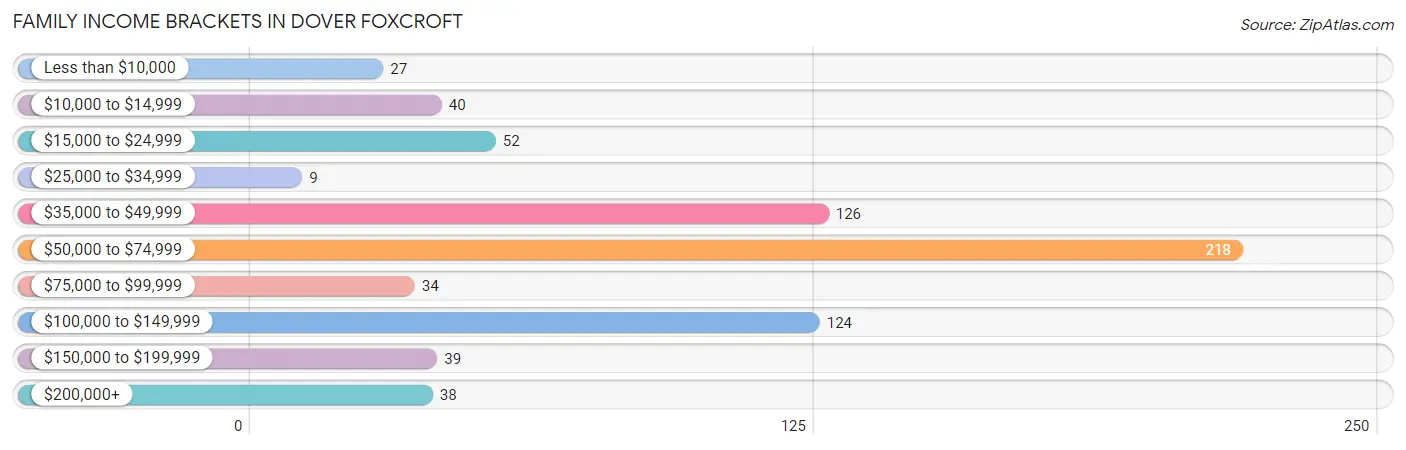
Family Income Brackets in Dover Foxcroft
According to the Dover Foxcroft family income data, there are 218 families falling into the $50,000 to $74,999 income range, which is the most common income bracket and makes up 30.8% of all families. Conversely, the $25,000 to $34,999 income bracket is the least frequent group with only 9 families (1.3%) belonging to this category.
| Income Bracket | # Families | % Families |
| Less than $10,000 | 27 | 3.8% |
| $10,000 to $14,999 | 40 | 5.7% |
| $15,000 to $24,999 | 52 | 7.4% |
| $25,000 to $34,999 | 9 | 1.3% |
| $35,000 to $49,999 | 126 | 17.8% |
| $50,000 to $74,999 | 218 | 30.8% |
| $75,000 to $99,999 | 34 | 4.8% |
| $100,000 to $149,999 | 124 | 17.5% |
| $150,000 to $199,999 | 39 | 5.5% |
| $200,000+ | 38 | 5.4% |
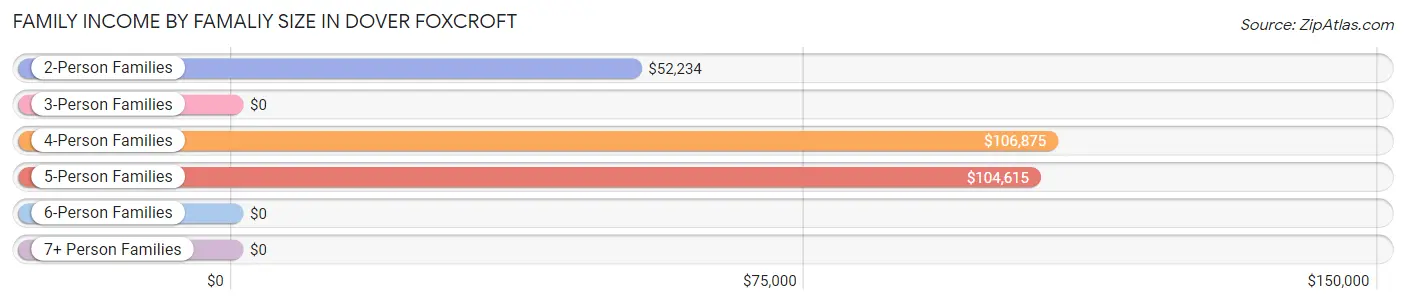
Family Income by Famaliy Size in Dover Foxcroft
4-person families (93 | 13.2%) account for the highest median family income in Dover Foxcroft with $106,875 per family, while 4-person families (93 | 13.2%) have the highest median income of $26,719 per family member.
| Income Bracket | # Families | Median Income |
| 2-Person Families | 446 (63.1%) | $52,234 |
| 3-Person Families | 102 (14.4%) | $0 |
| 4-Person Families | 93 (13.2%) | $106,875 |
| 5-Person Families | 66 (9.3%) | $104,615 |
| 6-Person Families | 0 (0.0%) | $0 |
| 7+ Person Families | 0 (0.0%) | $0 |
| Total | 707 (100.0%) | $60,331 |
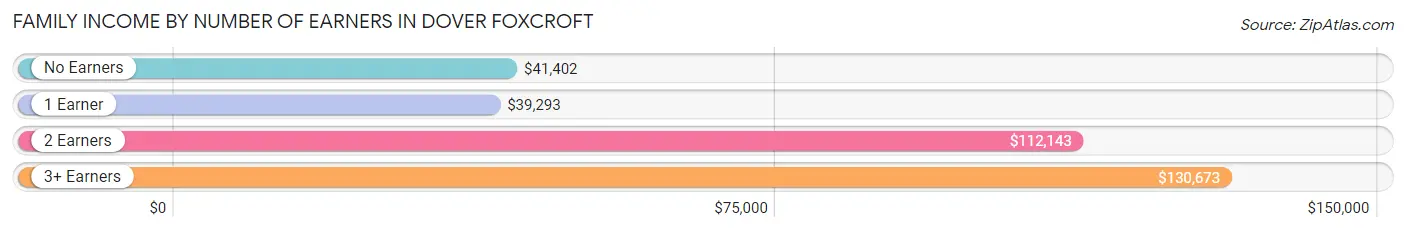
Family Income by Number of Earners in Dover Foxcroft
The median family income in Dover Foxcroft is $60,331, with families comprising 3+ earners (45) having the highest median family income of $130,673, while families with 1 earner (161) have the lowest median family income of $39,293, accounting for 6.4% and 22.8% of families, respectively.
| Number of Earners | # Families | Median Income |
| No Earners | 265 (37.5%) | $41,402 |
| 1 Earner | 161 (22.8%) | $39,293 |
| 2 Earners | 236 (33.4%) | $112,143 |
| 3+ Earners | 45 (6.4%) | $130,673 |
| Total | 707 (100.0%) | $60,331 |
Household Income in Dover Foxcroft
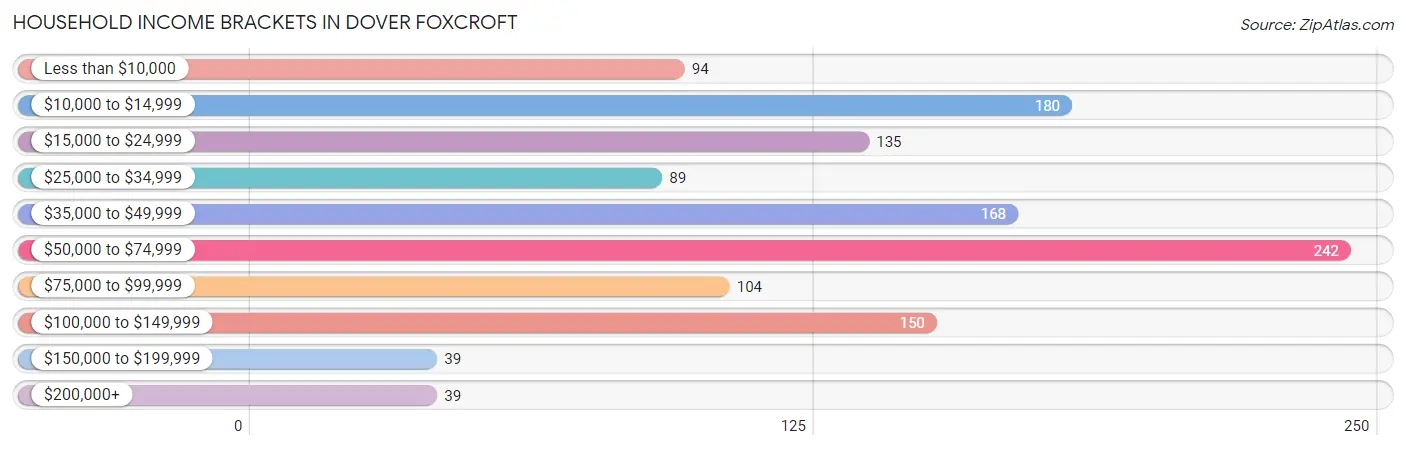
Household Income Brackets in Dover Foxcroft
With 242 households falling in the category, the $50,000 to $74,999 income range is the most frequent in Dover Foxcroft, accounting for 19.5% of all households. In contrast, only 39 households (3.1%) fall into the $150,000 to $199,999 income bracket, making it the least populous group.
| Income Bracket | # Households | % Households |
| Less than $10,000 | 94 | 7.6% |
| $10,000 to $14,999 | 180 | 14.5% |
| $15,000 to $24,999 | 135 | 10.9% |
| $25,000 to $34,999 | 89 | 7.2% |
| $35,000 to $49,999 | 168 | 13.5% |
| $50,000 to $74,999 | 242 | 19.5% |
| $75,000 to $99,999 | 104 | 8.4% |
| $100,000 to $149,999 | 150 | 12.1% |
| $150,000 to $199,999 | 39 | 3.1% |
| $200,000+ | 39 | 3.1% |
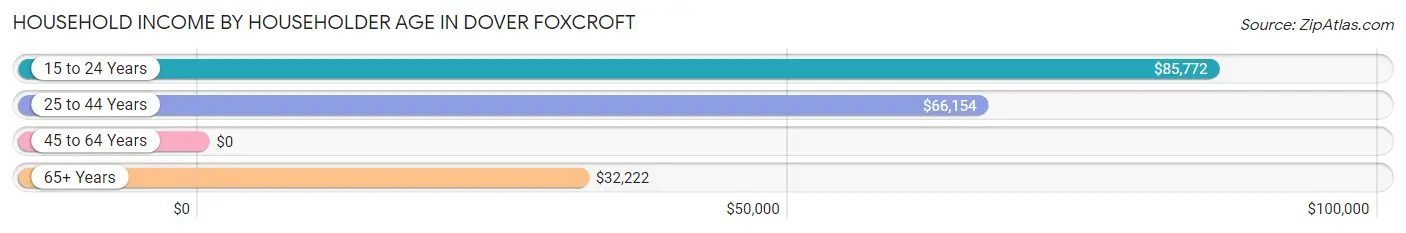
Household Income by Householder Age in Dover Foxcroft
The median household income in Dover Foxcroft is $47,764, with the highest median household income of $85,772 found in the 15 to 24 years age bracket for the primary householder. A total of 101 households (8.1%) fall into this category. Meanwhile, the 45 to 64 years age bracket for the primary householder has the lowest median household income of $0, with 414 households (33.3%) in this group.
| Income Bracket | # Households | Median Income |
| 15 to 24 Years | 101 (8.1%) | $85,772 |
| 25 to 44 Years | 240 (19.3%) | $66,154 |
| 45 to 64 Years | 414 (33.3%) | $0 |
| 65+ Years | 488 (39.3%) | $32,222 |
| Total | 1,243 (100.0%) | $47,764 |
Poverty in Dover Foxcroft
Income Below Poverty by Sex and Age in Dover Foxcroft
With 18.2% poverty level for males and 23.9% for females among the residents of Dover Foxcroft, 12 to 14 year old males and 75 year old and over females are the most vulnerable to poverty, with 9 males (100.0%) and 96 females (49.2%) in their respective age groups living below the poverty level.
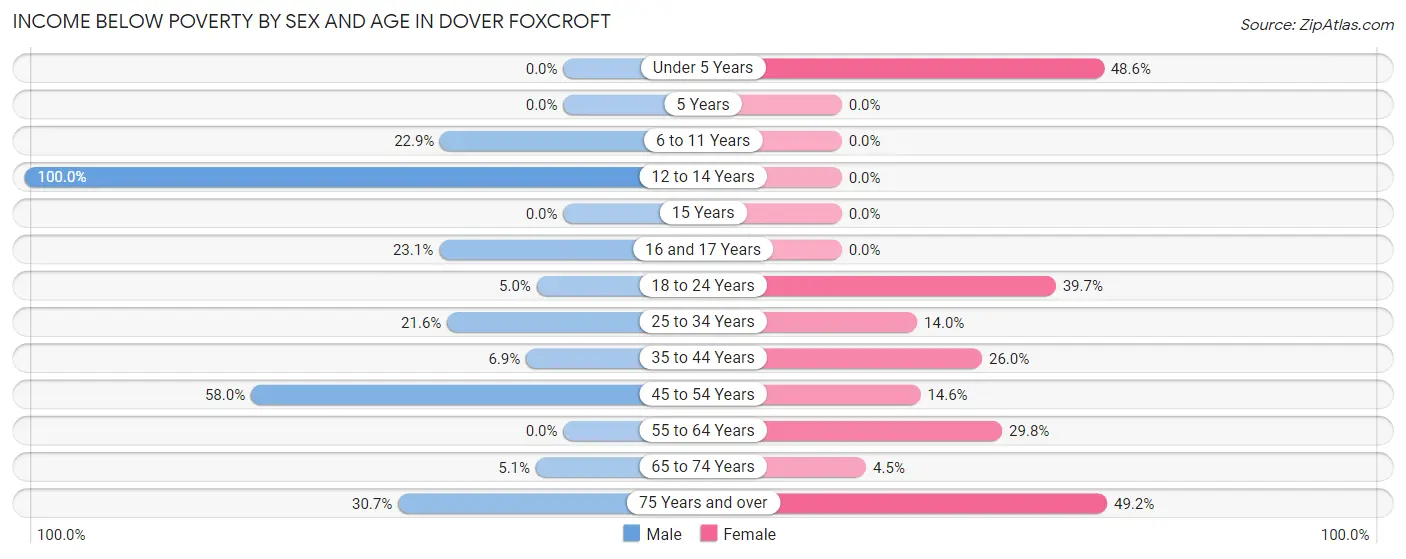
| Age Bracket | Male | Female |
| Under 5 Years | 0 (0.0%) | 53 (48.6%) |
| 5 Years | 0 (0.0%) | 0 (0.0%) |
| 6 to 11 Years | 16 (22.9%) | 0 (0.0%) |
| 12 to 14 Years | 9 (100.0%) | 0 (0.0%) |
| 15 Years | 0 (0.0%) | 0 (0.0%) |
| 16 and 17 Years | 3 (23.1%) | 0 (0.0%) |
| 18 to 24 Years | 5 (5.0%) | 54 (39.7%) |
| 25 to 34 Years | 11 (21.6%) | 20 (14.0%) |
| 35 to 44 Years | 11 (6.9%) | 38 (26.0%) |
| 45 to 54 Years | 109 (58.0%) | 20 (14.6%) |
| 55 to 64 Years | 0 (0.0%) | 64 (29.8%) |
| 65 to 74 Years | 10 (5.1%) | 10 (4.5%) |
| 75 Years and over | 31 (30.7%) | 96 (49.2%) |
| Total | 205 (18.2%) | 355 (23.9%) |
Income Above Poverty by Sex and Age in Dover Foxcroft
According to the poverty statistics in Dover Foxcroft, males aged under 5 years and females aged 5 years are the age groups that are most secure financially, with 100.0% of males and 100.0% of females in these age groups living above the poverty line.
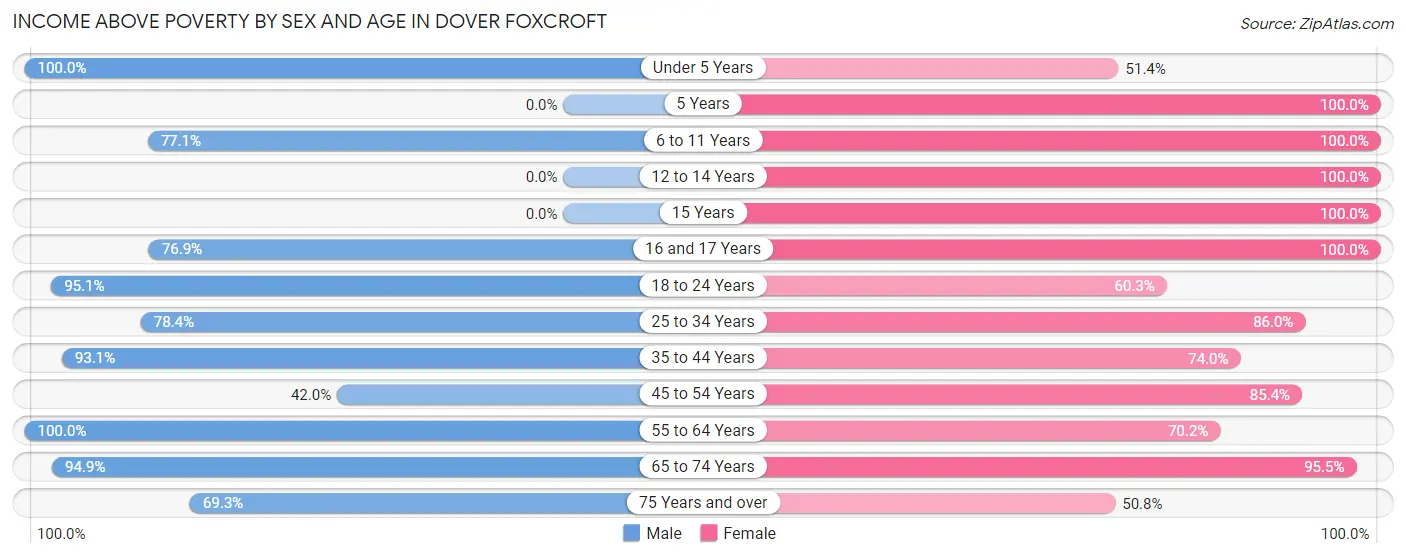
| Age Bracket | Male | Female |
| Under 5 Years | 132 (100.0%) | 56 (51.4%) |
| 5 Years | 0 (0.0%) | 28 (100.0%) |
| 6 to 11 Years | 54 (77.1%) | 93 (100.0%) |
| 12 to 14 Years | 0 (0.0%) | 31 (100.0%) |
| 15 Years | 0 (0.0%) | 9 (100.0%) |
| 16 and 17 Years | 10 (76.9%) | 21 (100.0%) |
| 18 to 24 Years | 96 (95.1%) | 82 (60.3%) |
| 25 to 34 Years | 40 (78.4%) | 123 (86.0%) |
| 35 to 44 Years | 148 (93.1%) | 108 (74.0%) |
| 45 to 54 Years | 79 (42.0%) | 117 (85.4%) |
| 55 to 64 Years | 107 (100.0%) | 151 (70.2%) |
| 65 to 74 Years | 186 (94.9%) | 211 (95.5%) |
| 75 Years and over | 70 (69.3%) | 99 (50.8%) |
| Total | 922 (81.8%) | 1,129 (76.1%) |
Income Below Poverty Among Married-Couple Families in Dover Foxcroft
The poverty statistics for married-couple families in Dover Foxcroft show that 6.2% or 29 of the total 465 families live below the poverty line. Families with no children have the highest poverty rate of 9.2%, comprising of 29 families. On the other hand, families with 1 or 2 children have the lowest poverty rate of 0.0%, which includes 0 families.
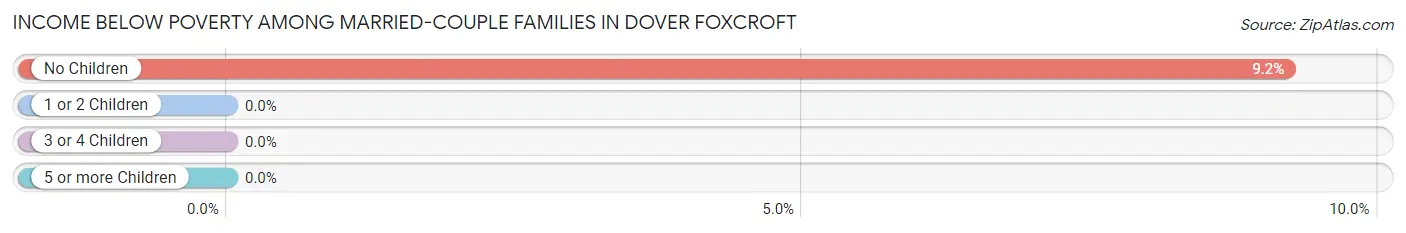
| Children | Above Poverty | Below Poverty |
| No Children | 286 (90.8%) | 29 (9.2%) |
| 1 or 2 Children | 97 (100.0%) | 0 (0.0%) |
| 3 or 4 Children | 53 (100.0%) | 0 (0.0%) |
| 5 or more Children | 0 (0.0%) | 0 (0.0%) |
| Total | 436 (93.8%) | 29 (6.2%) |
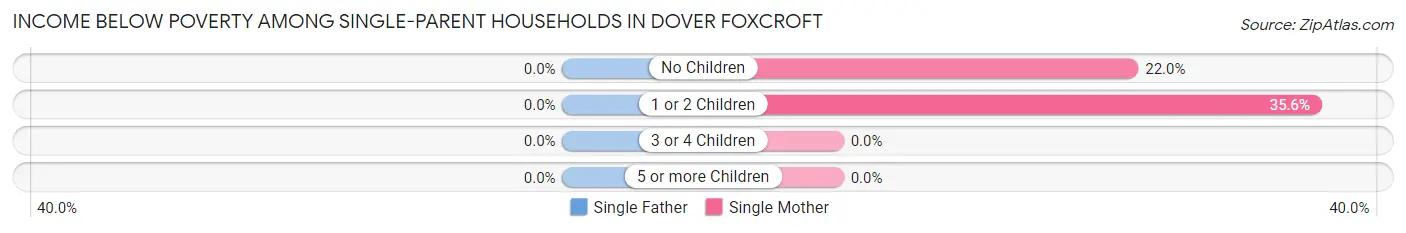
Income Below Poverty Among Single-Parent Households in Dover Foxcroft
| Children | Single Father | Single Mother |
| No Children | 0 (0.0%) | 18 (22.0%) |
| 1 or 2 Children | 0 (0.0%) | 57 (35.6%) |
| 3 or 4 Children | 0 (0.0%) | 0 (0.0%) |
| 5 or more Children | 0 (0.0%) | 0 (0.0%) |
| Total | 0 (0.0%) | 75 (31.0%) |
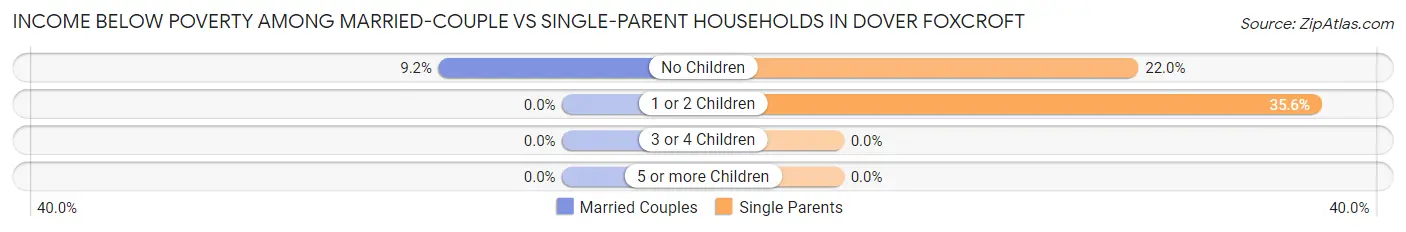
Income Below Poverty Among Married-Couple vs Single-Parent Households in Dover Foxcroft
The poverty data for Dover Foxcroft shows that 29 of the married-couple family households (6.2%) and 75 of the single-parent households (31.0%) are living below the poverty level. Within the married-couple family households, those with no children have the highest poverty rate, with 29 households (9.2%) falling below the poverty line. Among the single-parent households, those with 1 or 2 children have the highest poverty rate, with 57 household (35.6%) living below poverty.
| Children | Married-Couple Families | Single-Parent Households |
| No Children | 29 (9.2%) | 18 (22.0%) |
| 1 or 2 Children | 0 (0.0%) | 57 (35.6%) |
| 3 or 4 Children | 0 (0.0%) | 0 (0.0%) |
| 5 or more Children | 0 (0.0%) | 0 (0.0%) |
| Total | 29 (6.2%) | 75 (31.0%) |
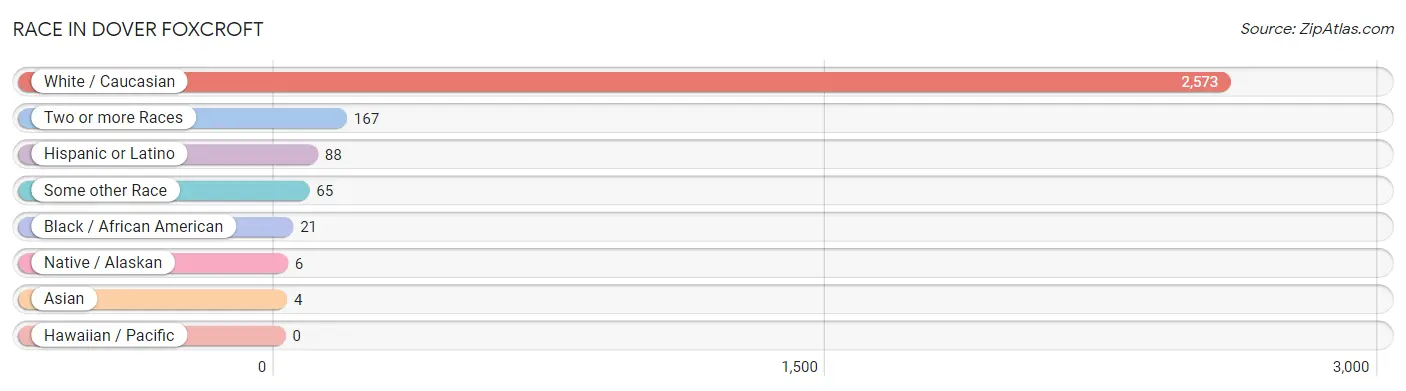
Race in Dover Foxcroft
The most populous races in Dover Foxcroft are White / Caucasian (2,573 | 90.7%), Two or more Races (167 | 5.9%), and Hispanic or Latino (88 | 3.1%).
| Race | # Population | % Population |
| Asian | 4 | 0.1% |
| Black / African American | 21 | 0.7% |
| Hawaiian / Pacific | 0 | 0.0% |
| Hispanic or Latino | 88 | 3.1% |
| Native / Alaskan | 6 | 0.2% |
| White / Caucasian | 2,573 | 90.7% |
| Two or more Races | 167 | 5.9% |
| Some other Race | 65 | 2.3% |
| Total | 2,836 | 100.0% |
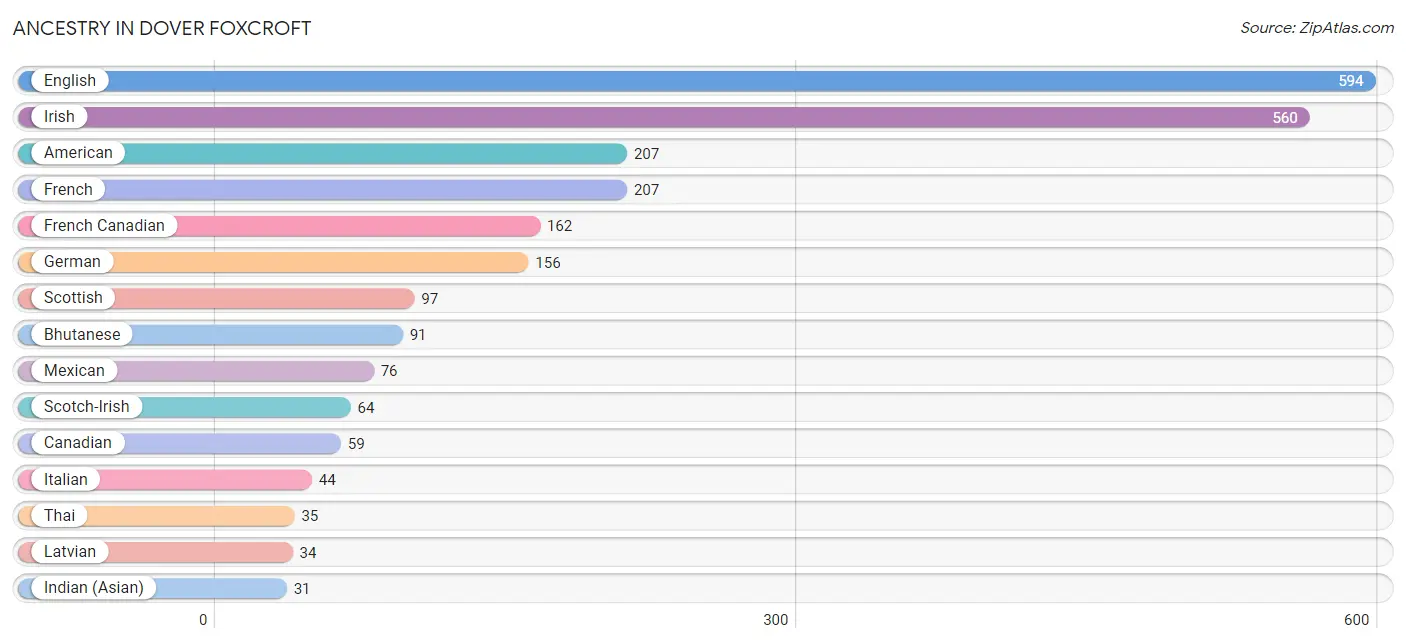
Ancestry in Dover Foxcroft
The most populous ancestries reported in Dover Foxcroft are English (594 | 20.9%), Irish (560 | 19.8%), American (207 | 7.3%), French (207 | 7.3%), and French Canadian (162 | 5.7%), together accounting for 61.0% of all Dover Foxcroft residents.
| Ancestry | # Population | % Population |
| American | 207 | 7.3% |
| Arab | 11 | 0.4% |
| Bhutanese | 91 | 3.2% |
| British | 8 | 0.3% |
| Cajun | 22 | 0.8% |
| Canadian | 59 | 2.1% |
| Choctaw | 6 | 0.2% |
| English | 594 | 20.9% |
| European | 13 | 0.5% |
| French | 207 | 7.3% |
| French Canadian | 162 | 5.7% |
| German | 156 | 5.5% |
| Greek | 1 | 0.0% |
| Hungarian | 6 | 0.2% |
| Indian (Asian) | 31 | 1.1% |
| Irish | 560 | 19.8% |
| Italian | 44 | 1.5% |
| Jordanian | 11 | 0.4% |
| Korean | 31 | 1.1% |
| Latvian | 34 | 1.2% |
| Mexican | 76 | 2.7% |
| Pennsylvania German | 6 | 0.2% |
| Polish | 15 | 0.5% |
| Portuguese | 4 | 0.1% |
| Russian | 3 | 0.1% |
| Scotch-Irish | 64 | 2.3% |
| Scottish | 97 | 3.4% |
| Spanish American | 5 | 0.2% |
| Sri Lankan | 31 | 1.1% |
| Swedish | 23 | 0.8% |
| Thai | 35 | 1.2% | View All 31 Rows |
Immigrants in Dover Foxcroft
The most numerous immigrant groups reported in Dover Foxcroft came from Central America (56 | 2.0%), Latin America (56 | 2.0%), Mexico (56 | 2.0%), Canada (38 | 1.3%), and Asia (15 | 0.5%), together accounting for 7.8% of all Dover Foxcroft residents.
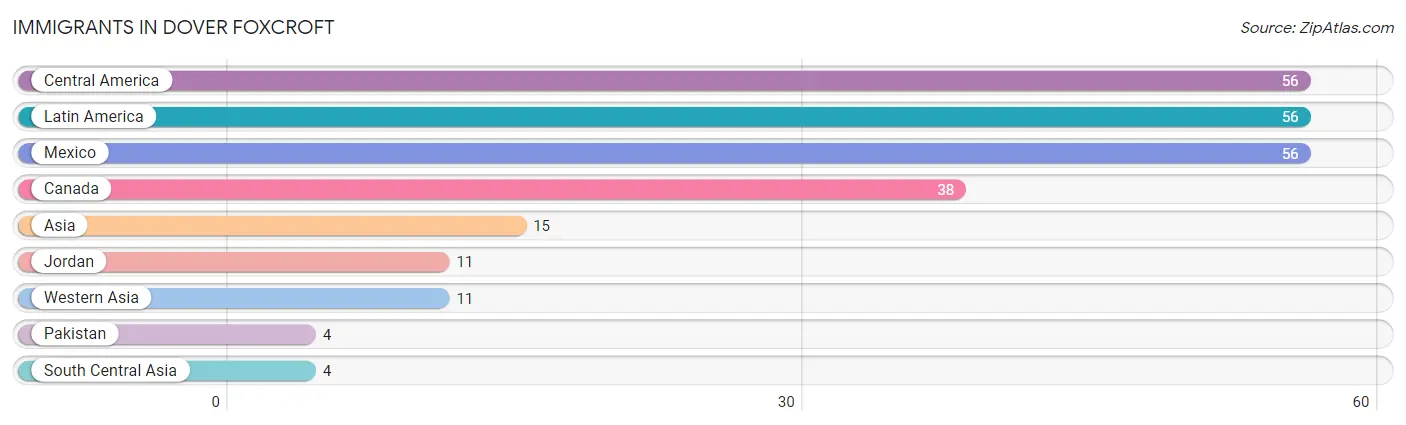
| Immigration Origin | # Population | % Population |
| Asia | 15 | 0.5% |
| Canada | 38 | 1.3% |
| Central America | 56 | 2.0% |
| Jordan | 11 | 0.4% |
| Latin America | 56 | 2.0% |
| Mexico | 56 | 2.0% |
| Pakistan | 4 | 0.1% |
| South Central Asia | 4 | 0.1% |
| Western Asia | 11 | 0.4% | View All 9 Rows |
Sex and Age in Dover Foxcroft
Sex and Age in Dover Foxcroft
The most populous age groups in Dover Foxcroft are 65 to 69 Years (152 | 12.1%) for men and 70 to 74 Years (200 | 12.6%) for women.
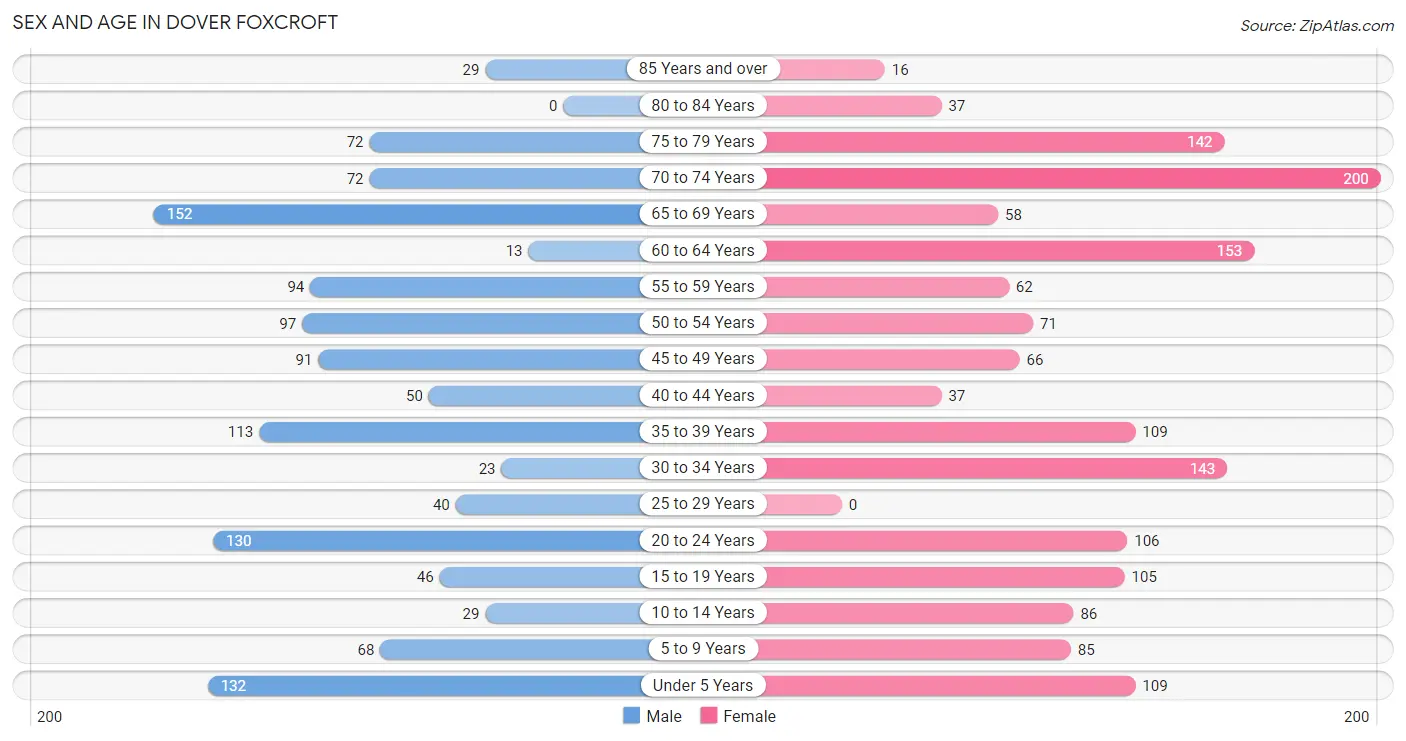
| Age Bracket | Male | Female |
| Under 5 Years | 132 (10.5%) | 109 (6.9%) |
| 5 to 9 Years | 68 (5.4%) | 85 (5.4%) |
| 10 to 14 Years | 29 (2.3%) | 86 (5.4%) |
| 15 to 19 Years | 46 (3.7%) | 105 (6.6%) |
| 20 to 24 Years | 130 (10.4%) | 106 (6.7%) |
| 25 to 29 Years | 40 (3.2%) | 0 (0.0%) |
| 30 to 34 Years | 23 (1.8%) | 143 (9.0%) |
| 35 to 39 Years | 113 (9.0%) | 109 (6.9%) |
| 40 to 44 Years | 50 (4.0%) | 37 (2.3%) |
| 45 to 49 Years | 91 (7.3%) | 66 (4.2%) |
| 50 to 54 Years | 97 (7.7%) | 71 (4.5%) |
| 55 to 59 Years | 94 (7.5%) | 62 (3.9%) |
| 60 to 64 Years | 13 (1.0%) | 153 (9.7%) |
| 65 to 69 Years | 152 (12.1%) | 58 (3.7%) |
| 70 to 74 Years | 72 (5.8%) | 200 (12.6%) |
| 75 to 79 Years | 72 (5.8%) | 142 (9.0%) |
| 80 to 84 Years | 0 (0.0%) | 37 (2.3%) |
| 85 Years and over | 29 (2.3%) | 16 (1.0%) |
| Total | 1,251 (100.0%) | 1,585 (100.0%) |
Families and Households in Dover Foxcroft
Median Family Size in Dover Foxcroft
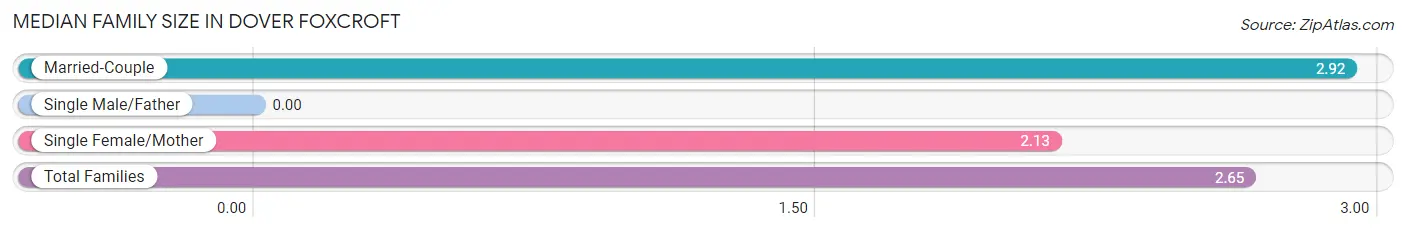
| Family Type | # Families | Family Size |
| Married-Couple | 465 (65.8%) | 2.92 |
| Single Male/Father | 0 (0.0%) | - |
| Single Female/Mother | 242 (34.2%) | 2.13 |
| Total Families | 707 (100.0%) | 2.65 |
Median Household Size in Dover Foxcroft
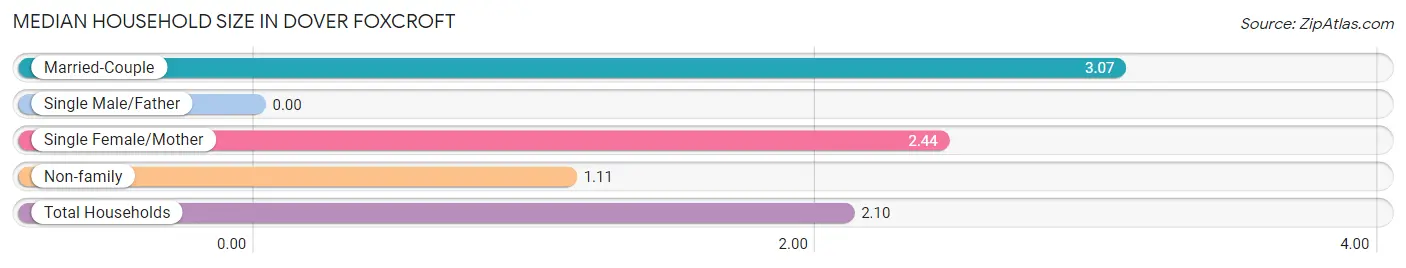
| Household Type | # Households | Household Size |
| Married-Couple | 465 (37.4%) | 3.07 |
| Single Male/Father | 0 (0.0%) | - |
| Single Female/Mother | 242 (19.5%) | 2.44 |
| Non-family | 536 (43.1%) | 1.11 |
| Total Households | 1,243 (100.0%) | 2.10 |
Household Size by Marriage Status in Dover Foxcroft
Out of a total of 1,243 households in Dover Foxcroft, 707 (56.9%) are family households, while 536 (43.1%) are nonfamily households. The most numerous type of family households are 2-person households, comprising 364, and the most common type of nonfamily households are 1-person households, comprising 457.
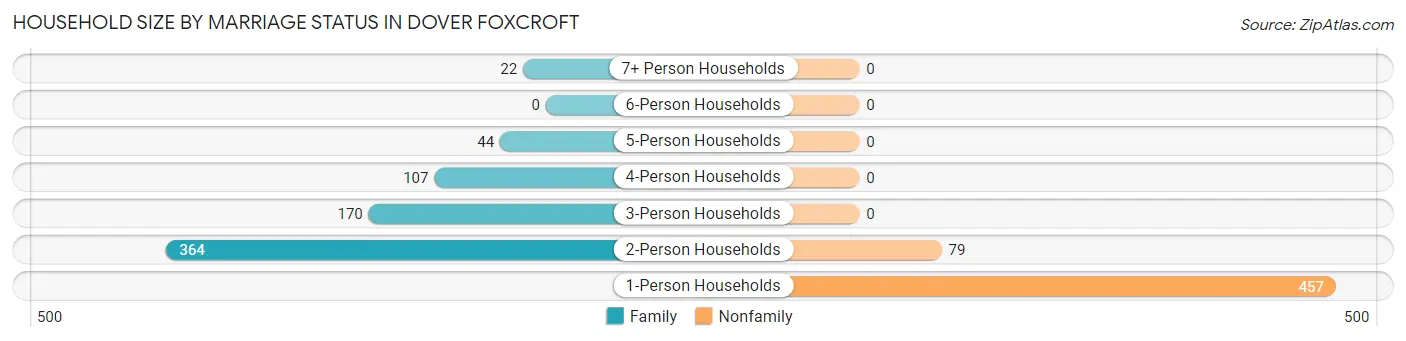
| Household Size | Family Households | Nonfamily Households |
| 1-Person Households | - | 457 (36.8%) |
| 2-Person Households | 364 (29.3%) | 79 (6.4%) |
| 3-Person Households | 170 (13.7%) | 0 (0.0%) |
| 4-Person Households | 107 (8.6%) | 0 (0.0%) |
| 5-Person Households | 44 (3.5%) | 0 (0.0%) |
| 6-Person Households | 0 (0.0%) | 0 (0.0%) |
| 7+ Person Households | 22 (1.8%) | 0 (0.0%) |
| Total | 707 (56.9%) | 536 (43.1%) |
Female Fertility in Dover Foxcroft
Fertility by Age in Dover Foxcroft
Average fertility rate in Dover Foxcroft is 46.0 births per 1,000 women. Women in the age bracket of 15 to 19 years have the highest fertility rate with 257.0 births per 1,000 women. Women in the age bracket of 15 to 19 years acount for 100.0% of all women with births.
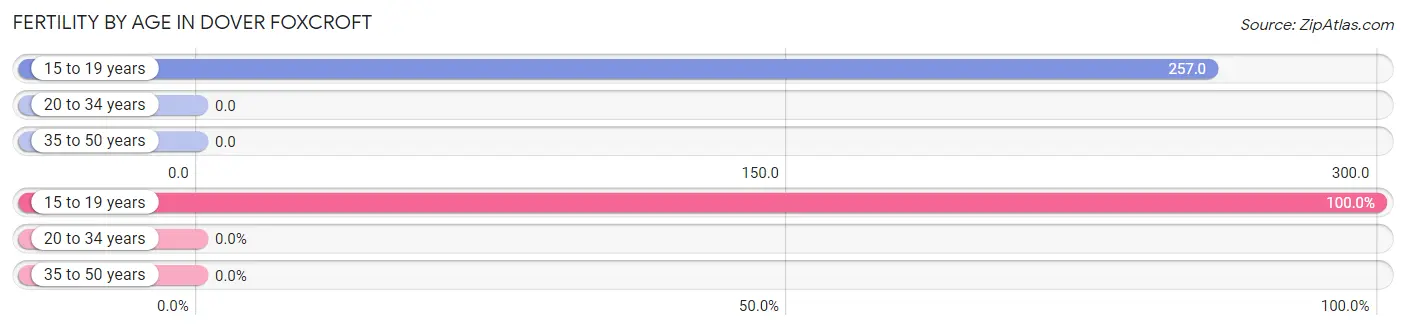
| Age Bracket | Women with Births | Births / 1,000 Women |
| 15 to 19 years | 27 (100.0%) | 257.0 |
| 20 to 34 years | 0 (0.0%) | 0.0 |
| 35 to 50 years | 0 (0.0%) | 0.0 |
| Total | 27 (100.0%) | 46.0 |
Fertility by Age by Marriage Status in Dover Foxcroft
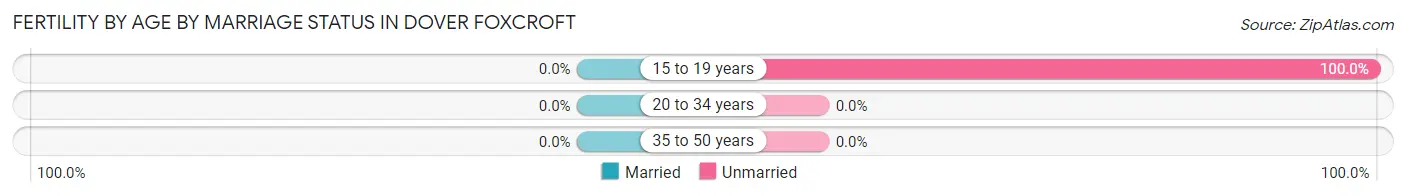
| Age Bracket | Married | Unmarried |
| 15 to 19 years | 0 (0.0%) | 27 (100.0%) |
| 20 to 34 years | 0 (0.0%) | 0 (0.0%) |
| 35 to 50 years | 0 (0.0%) | 0 (0.0%) |
| Total | 0 (0.0%) | 27 (100.0%) |
Fertility by Education in Dover Foxcroft
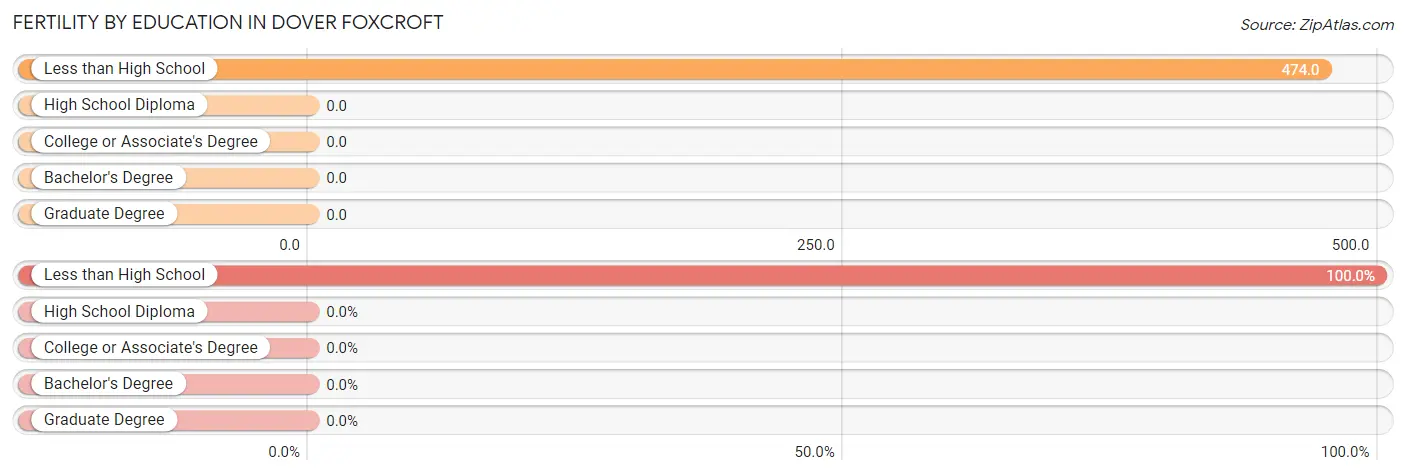
| Educational Attainment | Women with Births | Births / 1,000 Women |
| Less than High School | 27 (100.0%) | 474.0 |
| High School Diploma | 0 (0.0%) | 0.0 |
| College or Associate's Degree | 0 (0.0%) | 0.0 |
| Bachelor's Degree | 0 (0.0%) | 0.0 |
| Graduate Degree | 0 (0.0%) | 0.0 |
| Total | 27 (100.0%) | 46.0 |
Fertility by Education by Marriage Status in Dover Foxcroft
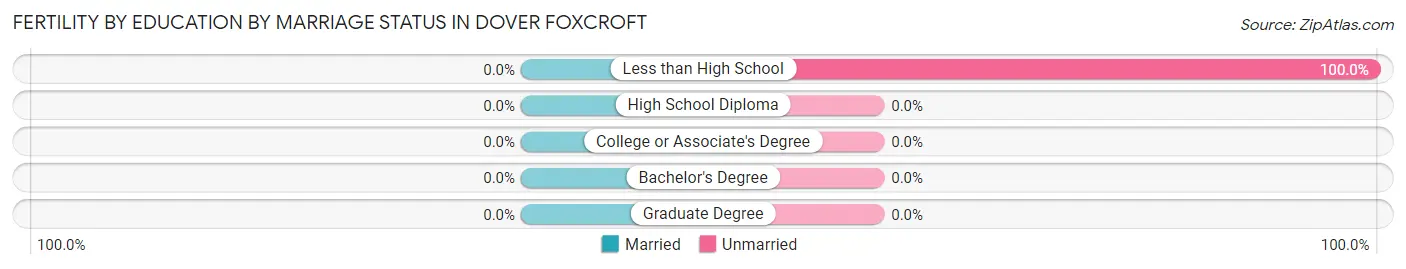
| Educational Attainment | Married | Unmarried |
| Less than High School | 0 (0.0%) | 27 (100.0%) |
| High School Diploma | 0 (0.0%) | 0 (0.0%) |
| College or Associate's Degree | 0 (0.0%) | 0 (0.0%) |
| Bachelor's Degree | 0 (0.0%) | 0 (0.0%) |
| Graduate Degree | 0 (0.0%) | 0 (0.0%) |
| Total | 0 (0.0%) | 27 (100.0%) |
Employment Characteristics in Dover Foxcroft
Employment by Class of Employer in Dover Foxcroft
Among the 986 employed individuals in Dover Foxcroft, private company employees (454 | 46.0%), not-for-profit organizations (249 | 25.3%), and self-employed (not incorporated) (97 | 9.8%) make up the most common classes of employment.
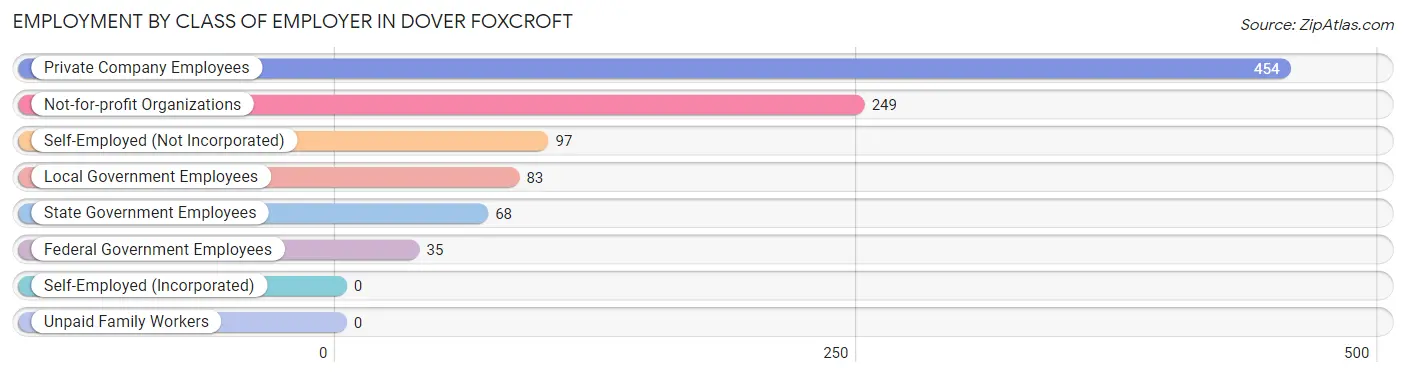
| Employer Class | # Employees | % Employees |
| Private Company Employees | 454 | 46.0% |
| Self-Employed (Incorporated) | 0 | 0.0% |
| Self-Employed (Not Incorporated) | 97 | 9.8% |
| Not-for-profit Organizations | 249 | 25.3% |
| Local Government Employees | 83 | 8.4% |
| State Government Employees | 68 | 6.9% |
| Federal Government Employees | 35 | 3.5% |
| Unpaid Family Workers | 0 | 0.0% |
| Total | 986 | 100.0% |
Employment Status by Age in Dover Foxcroft
According to the labor force statistics for Dover Foxcroft, out of the total population over 16 years of age (2,318), 50.6% or 1,173 individuals are in the labor force, with 7.1% or 83 of them unemployed. The age group with the highest labor force participation rate is 25 to 29 years, with 95.0% or 38 individuals in the labor force. Within the labor force, the 25 to 29 years age range has the highest percentage of unemployed individuals, with 100.0% or 38 of them being unemployed.
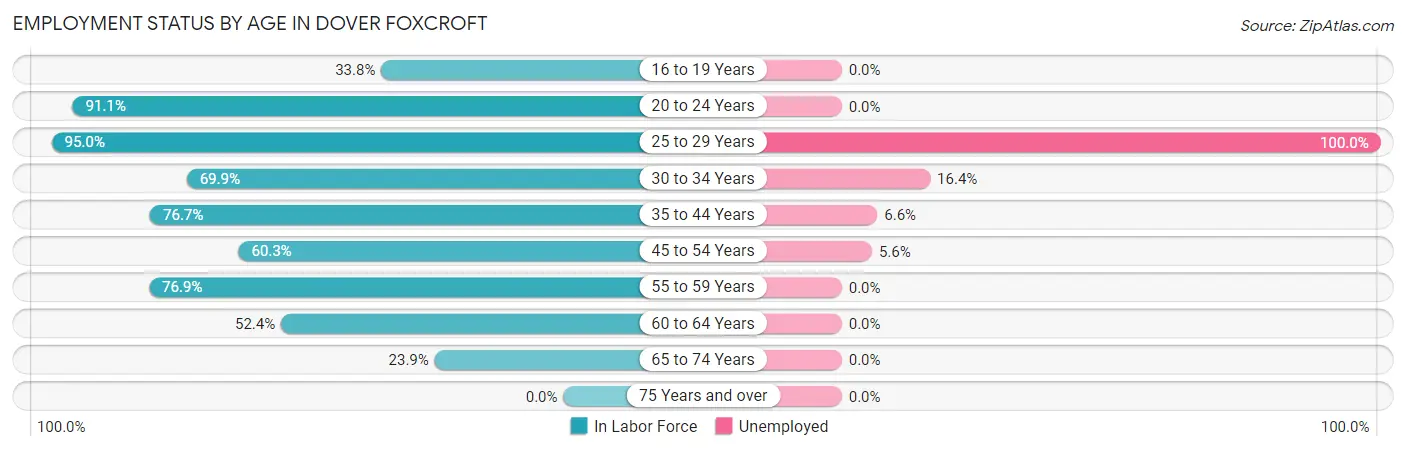
| Age Bracket | In Labor Force | Unemployed |
| 16 to 19 Years | 48 (33.8%) | 0 (0.0%) |
| 20 to 24 Years | 215 (91.1%) | 0 (0.0%) |
| 25 to 29 Years | 38 (95.0%) | 38 (100.0%) |
| 30 to 34 Years | 116 (69.9%) | 19 (16.4%) |
| 35 to 44 Years | 237 (76.7%) | 16 (6.6%) |
| 45 to 54 Years | 196 (60.3%) | 11 (5.6%) |
| 55 to 59 Years | 120 (76.9%) | 0 (0.0%) |
| 60 to 64 Years | 87 (52.4%) | 0 (0.0%) |
| 65 to 74 Years | 115 (23.9%) | 0 (0.0%) |
| 75 Years and over | 0 (0.0%) | 0 (0.0%) |
| Total | 1,173 (50.6%) | 83 (7.1%) |
Employment Status by Educational Attainment in Dover Foxcroft
According to labor force statistics for Dover Foxcroft, 68.3% of individuals (794) out of the total population between 25 and 64 years of age (1,162) are in the labor force, with 10.6% or 84 of them being unemployed. The group with the highest labor force participation rate are those with the educational attainment of less than high school, with 88.9% or 32 individuals in the labor force. Within the labor force, individuals with high school diploma education have the highest percentage of unemployment, with 19.9% or 44 of them being unemployed.
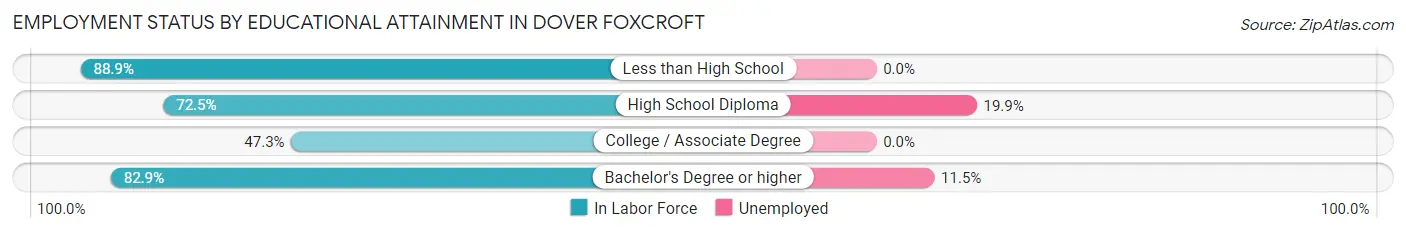
| Educational Attainment | In Labor Force | Unemployed |
| Less than High School | 32 (88.9%) | 0 (0.0%) |
| High School Diploma | 221 (72.5%) | 61 (19.9%) |
| College / Associate Degree | 186 (47.3%) | 0 (0.0%) |
| Bachelor's Degree or higher | 355 (82.9%) | 49 (11.5%) |
| Total | 794 (68.3%) | 123 (10.6%) |
Employment Occupations by Sex in Dover Foxcroft
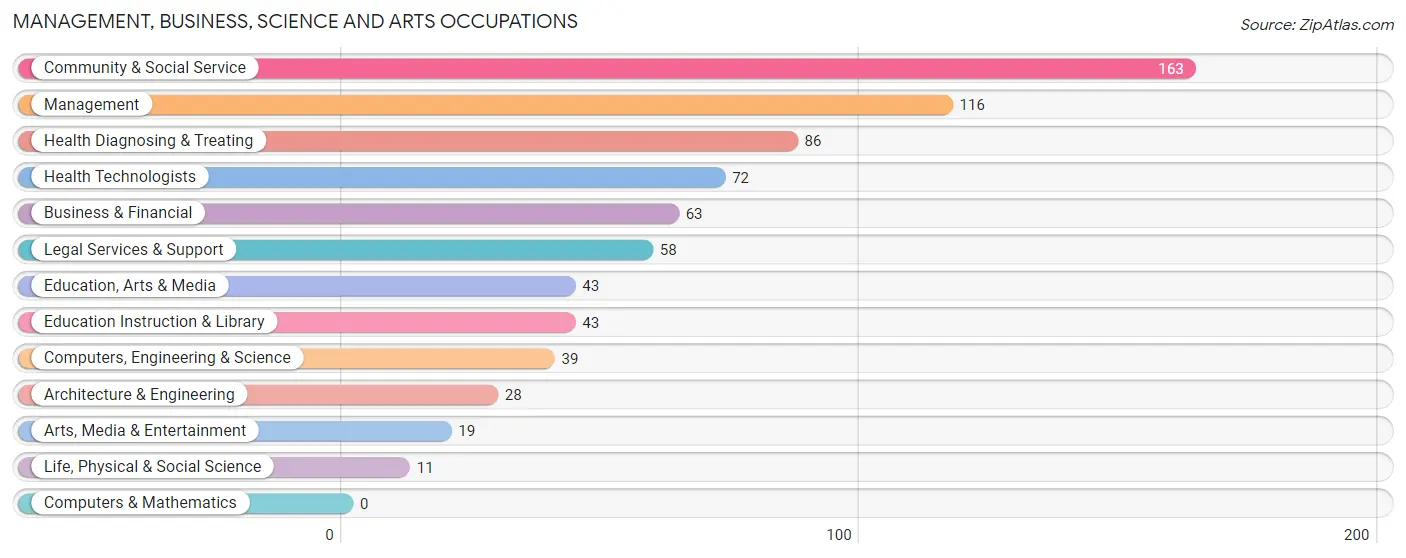
Management, Business, Science and Arts Occupations
The most common Management, Business, Science and Arts occupations in Dover Foxcroft are Community & Social Service (163 | 15.3%), Management (116 | 10.9%), Health Diagnosing & Treating (86 | 8.1%), Health Technologists (72 | 6.8%), and Business & Financial (63 | 5.9%).
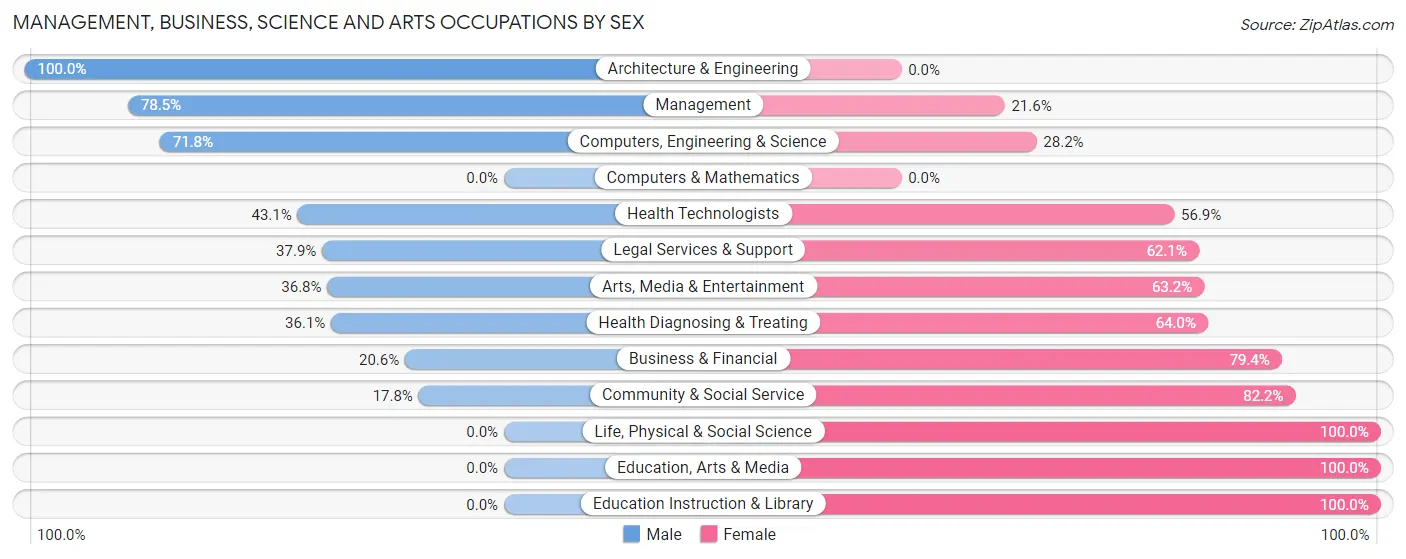
Management, Business, Science and Arts Occupations by Sex
Within the Management, Business, Science and Arts occupations in Dover Foxcroft, the most male-oriented occupations are Architecture & Engineering (100.0%), Management (78.4%), and Computers, Engineering & Science (71.8%), while the most female-oriented occupations are Life, Physical & Social Science (100.0%), Education, Arts & Media (100.0%), and Education Instruction & Library (100.0%).
| Occupation | Male | Female |
| Management | 91 (78.4%) | 25 (21.5%) |
| Business & Financial | 13 (20.6%) | 50 (79.4%) |
| Computers, Engineering & Science | 28 (71.8%) | 11 (28.2%) |
| Computers & Mathematics | 0 (0.0%) | 0 (0.0%) |
| Architecture & Engineering | 28 (100.0%) | 0 (0.0%) |
| Life, Physical & Social Science | 0 (0.0%) | 11 (100.0%) |
| Community & Social Service | 29 (17.8%) | 134 (82.2%) |
| Education, Arts & Media | 0 (0.0%) | 43 (100.0%) |
| Legal Services & Support | 22 (37.9%) | 36 (62.1%) |
| Education Instruction & Library | 0 (0.0%) | 43 (100.0%) |
| Arts, Media & Entertainment | 7 (36.8%) | 12 (63.2%) |
| Health Diagnosing & Treating | 31 (36.0%) | 55 (63.9%) |
| Health Technologists | 31 (43.1%) | 41 (56.9%) |
| Total (Category) | 192 (41.1%) | 275 (58.9%) |
| Total (Overall) | 528 (49.5%) | 538 (50.5%) |
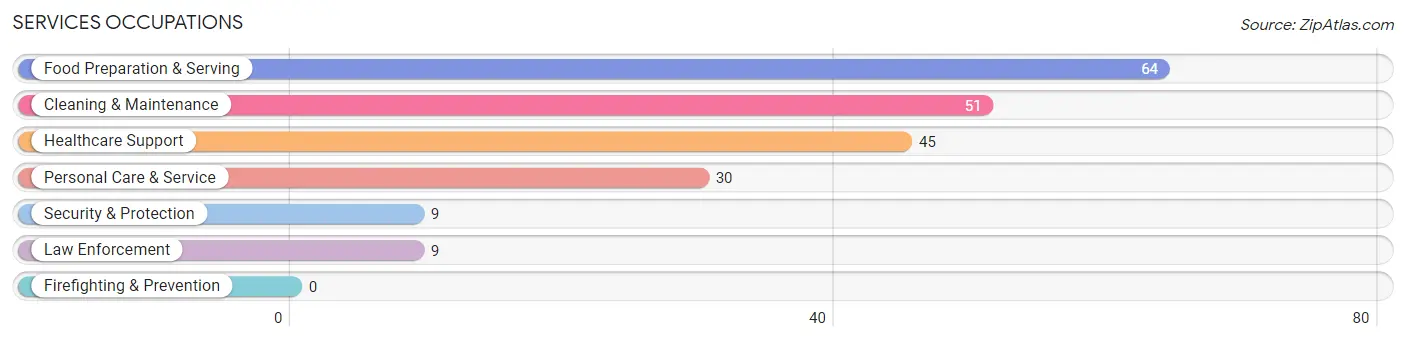
Services Occupations
The most common Services occupations in Dover Foxcroft are Food Preparation & Serving (64 | 6.0%), Cleaning & Maintenance (51 | 4.8%), Healthcare Support (45 | 4.2%), Personal Care & Service (30 | 2.8%), and Security & Protection (9 | 0.8%).
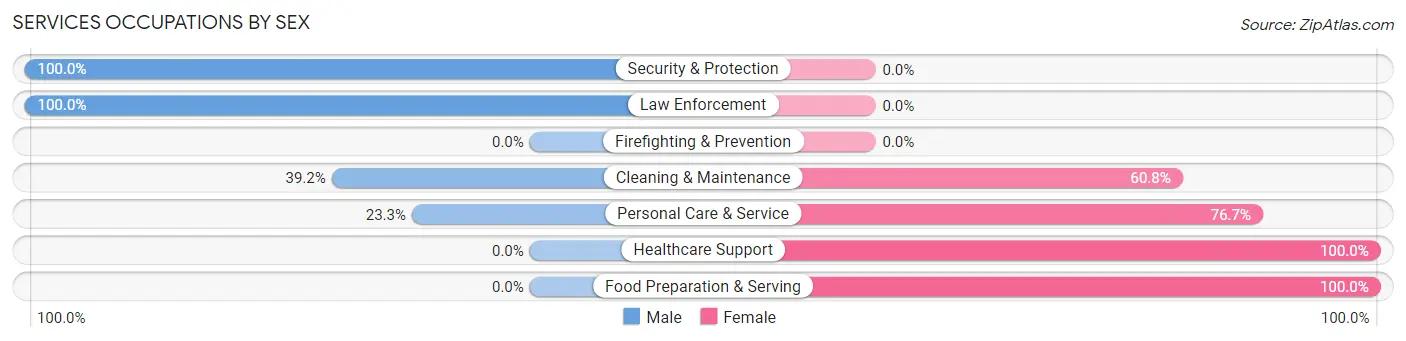
Services Occupations by Sex
Within the Services occupations in Dover Foxcroft, the most male-oriented occupations are Security & Protection (100.0%), Law Enforcement (100.0%), and Cleaning & Maintenance (39.2%), while the most female-oriented occupations are Healthcare Support (100.0%), Food Preparation & Serving (100.0%), and Personal Care & Service (76.7%).
| Occupation | Male | Female |
| Healthcare Support | 0 (0.0%) | 45 (100.0%) |
| Security & Protection | 9 (100.0%) | 0 (0.0%) |
| Firefighting & Prevention | 0 (0.0%) | 0 (0.0%) |
| Law Enforcement | 9 (100.0%) | 0 (0.0%) |
| Food Preparation & Serving | 0 (0.0%) | 64 (100.0%) |
| Cleaning & Maintenance | 20 (39.2%) | 31 (60.8%) |
| Personal Care & Service | 7 (23.3%) | 23 (76.7%) |
| Total (Category) | 36 (18.1%) | 163 (81.9%) |
| Total (Overall) | 528 (49.5%) | 538 (50.5%) |
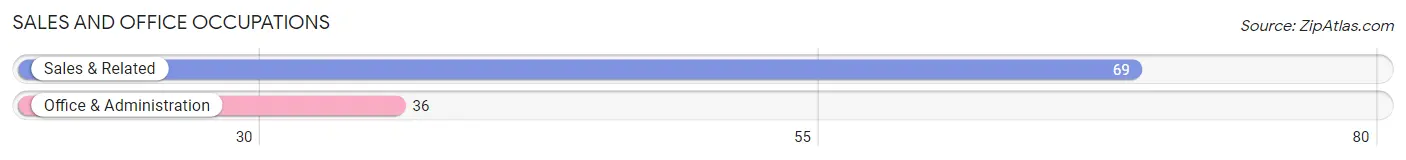
Sales and Office Occupations
The most common Sales and Office occupations in Dover Foxcroft are Sales & Related (69 | 6.5%), and Office & Administration (36 | 3.4%).
Sales and Office Occupations by Sex
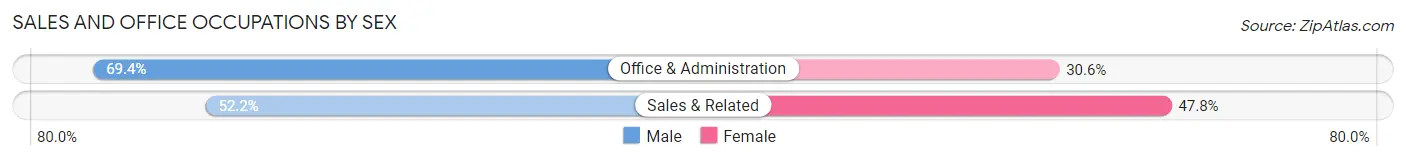
| Occupation | Male | Female |
| Sales & Related | 36 (52.2%) | 33 (47.8%) |
| Office & Administration | 25 (69.4%) | 11 (30.6%) |
| Total (Category) | 61 (58.1%) | 44 (41.9%) |
| Total (Overall) | 528 (49.5%) | 538 (50.5%) |
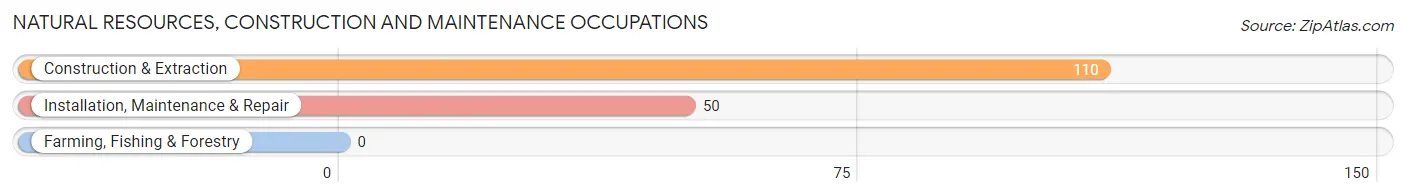
Natural Resources, Construction and Maintenance Occupations
The most common Natural Resources, Construction and Maintenance occupations in Dover Foxcroft are Construction & Extraction (110 | 10.3%), and Installation, Maintenance & Repair (50 | 4.7%).
Natural Resources, Construction and Maintenance Occupations by Sex
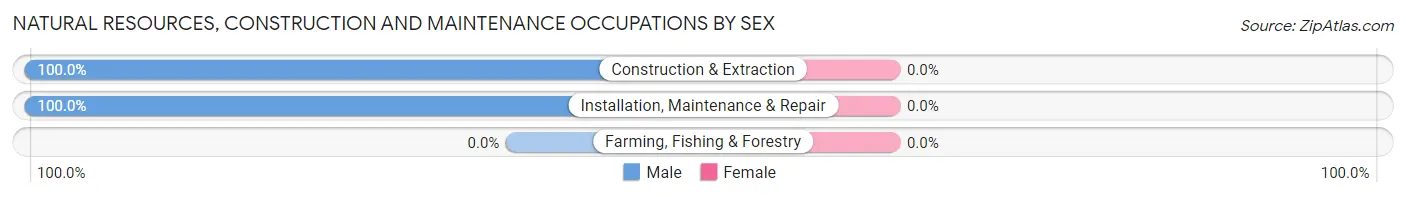
| Occupation | Male | Female |
| Farming, Fishing & Forestry | 0 (0.0%) | 0 (0.0%) |
| Construction & Extraction | 110 (100.0%) | 0 (0.0%) |
| Installation, Maintenance & Repair | 50 (100.0%) | 0 (0.0%) |
| Total (Category) | 160 (100.0%) | 0 (0.0%) |
| Total (Overall) | 528 (49.5%) | 538 (50.5%) |
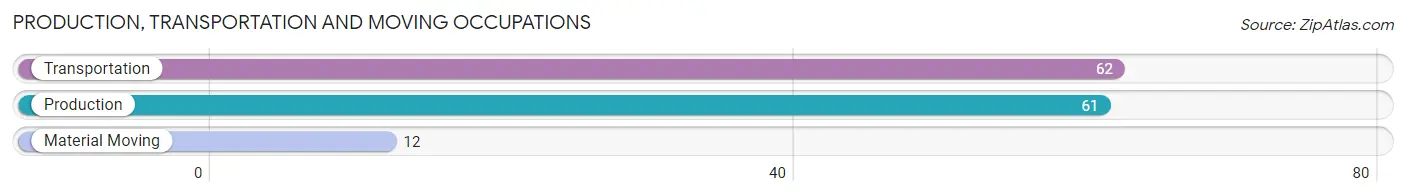
Production, Transportation and Moving Occupations
The most common Production, Transportation and Moving occupations in Dover Foxcroft are Transportation (62 | 5.8%), Production (61 | 5.7%), and Material Moving (12 | 1.1%).
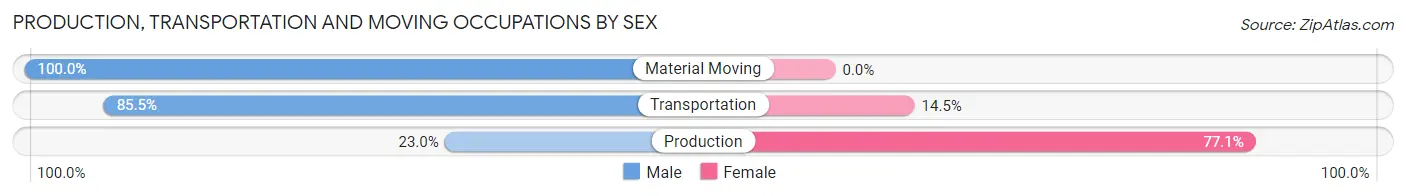
Production, Transportation and Moving Occupations by Sex
| Occupation | Male | Female |
| Production | 14 (23.0%) | 47 (77.0%) |
| Transportation | 53 (85.5%) | 9 (14.5%) |
| Material Moving | 12 (100.0%) | 0 (0.0%) |
| Total (Category) | 79 (58.5%) | 56 (41.5%) |
| Total (Overall) | 528 (49.5%) | 538 (50.5%) |
Employment Industries by Sex in Dover Foxcroft
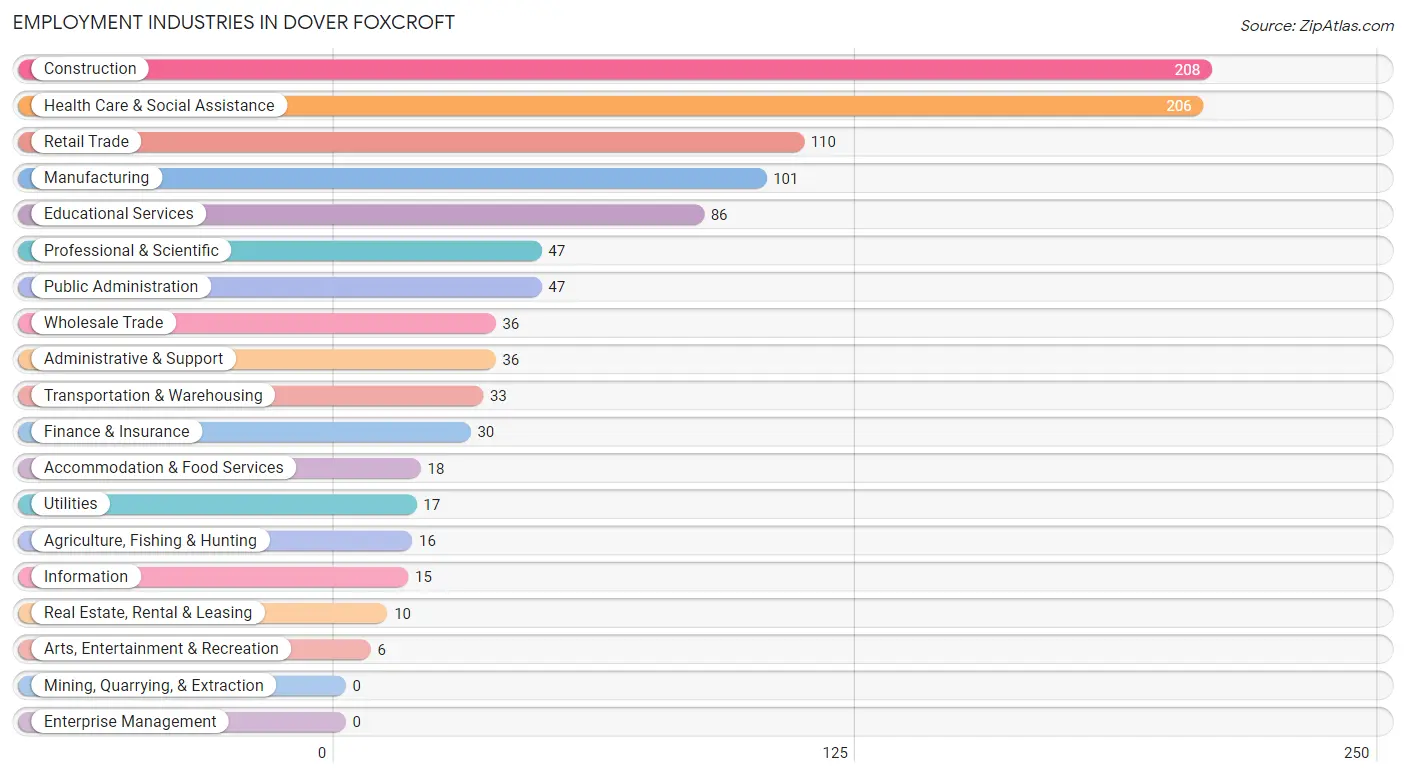
Employment Industries in Dover Foxcroft
The major employment industries in Dover Foxcroft include Construction (208 | 19.5%), Health Care & Social Assistance (206 | 19.3%), Retail Trade (110 | 10.3%), Manufacturing (101 | 9.5%), and Educational Services (86 | 8.1%).
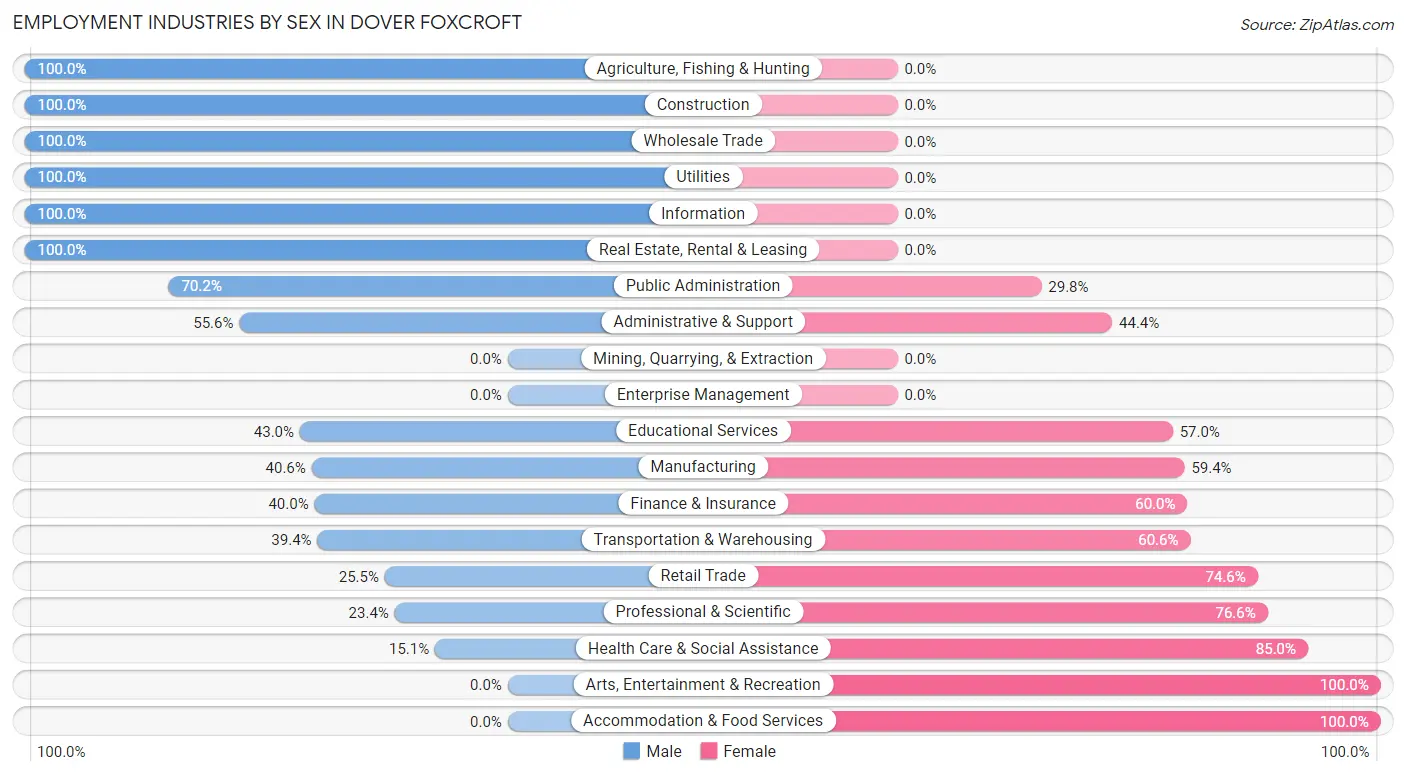
Employment Industries by Sex in Dover Foxcroft
The Dover Foxcroft industries that see more men than women are Agriculture, Fishing & Hunting (100.0%), Construction (100.0%), and Wholesale Trade (100.0%), whereas the industries that tend to have a higher number of women are Arts, Entertainment & Recreation (100.0%), Accommodation & Food Services (100.0%), and Health Care & Social Assistance (85.0%).
| Industry | Male | Female |
| Agriculture, Fishing & Hunting | 16 (100.0%) | 0 (0.0%) |
| Mining, Quarrying, & Extraction | 0 (0.0%) | 0 (0.0%) |
| Construction | 208 (100.0%) | 0 (0.0%) |
| Manufacturing | 41 (40.6%) | 60 (59.4%) |
| Wholesale Trade | 36 (100.0%) | 0 (0.0%) |
| Retail Trade | 28 (25.5%) | 82 (74.6%) |
| Transportation & Warehousing | 13 (39.4%) | 20 (60.6%) |
| Utilities | 17 (100.0%) | 0 (0.0%) |
| Information | 15 (100.0%) | 0 (0.0%) |
| Finance & Insurance | 12 (40.0%) | 18 (60.0%) |
| Real Estate, Rental & Leasing | 10 (100.0%) | 0 (0.0%) |
| Professional & Scientific | 11 (23.4%) | 36 (76.6%) |
| Enterprise Management | 0 (0.0%) | 0 (0.0%) |
| Administrative & Support | 20 (55.6%) | 16 (44.4%) |
| Educational Services | 37 (43.0%) | 49 (57.0%) |
| Health Care & Social Assistance | 31 (15.0%) | 175 (85.0%) |
| Arts, Entertainment & Recreation | 0 (0.0%) | 6 (100.0%) |
| Accommodation & Food Services | 0 (0.0%) | 18 (100.0%) |
| Public Administration | 33 (70.2%) | 14 (29.8%) |
| Total | 528 (49.5%) | 538 (50.5%) |
Education in Dover Foxcroft
School Enrollment in Dover Foxcroft
The most common levels of schooling among the 495 students in Dover Foxcroft are college / undergraduate (153 | 30.9%), elementary school (116 | 23.4%), and middle school (89 | 18.0%).
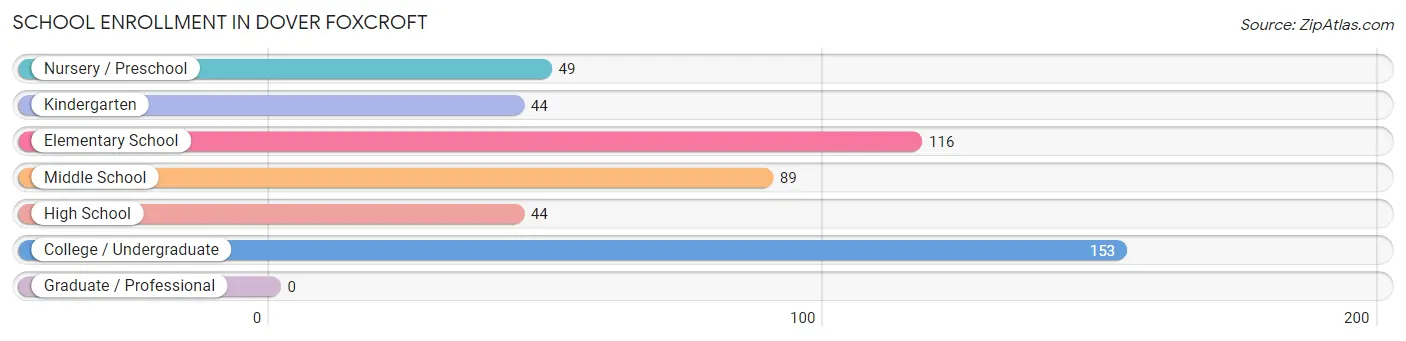
| School Level | # Students | % Students |
| Nursery / Preschool | 49 | 9.9% |
| Kindergarten | 44 | 8.9% |
| Elementary School | 116 | 23.4% |
| Middle School | 89 | 18.0% |
| High School | 44 | 8.9% |
| College / Undergraduate | 153 | 30.9% |
| Graduate / Professional | 0 | 0.0% |
| Total | 495 | 100.0% |
School Enrollment by Age by Funding Source in Dover Foxcroft
Out of a total of 495 students who are enrolled in schools in Dover Foxcroft, 102 (20.6%) attend a private institution, while the remaining 393 (79.4%) are enrolled in public schools. The age group of 15 to 17 year olds has the highest likelihood of being enrolled in private schools, with 21 (48.8% in the age bracket) enrolled. Conversely, the age group of 5 to 9 year old has the lowest likelihood of being enrolled in a private school, with 153 (100.0% in the age bracket) attending a public institution.
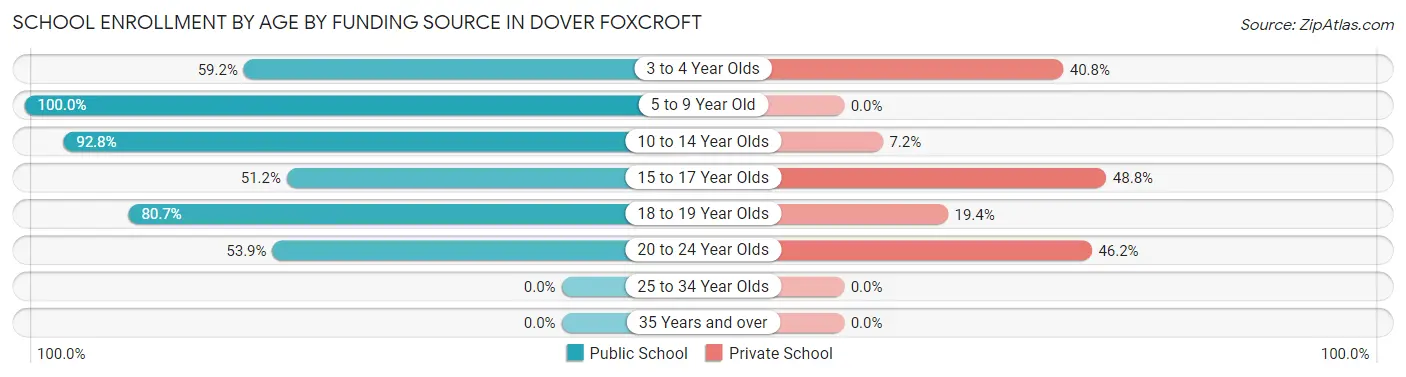
| Age Bracket | Public School | Private School |
| 3 to 4 Year Olds | 29 (59.2%) | 20 (40.8%) |
| 5 to 9 Year Old | 153 (100.0%) | 0 (0.0%) |
| 10 to 14 Year Olds | 90 (92.8%) | 7 (7.2%) |
| 15 to 17 Year Olds | 22 (51.2%) | 21 (48.8%) |
| 18 to 19 Year Olds | 50 (80.6%) | 12 (19.4%) |
| 20 to 24 Year Olds | 49 (53.8%) | 42 (46.2%) |
| 25 to 34 Year Olds | 0 (0.0%) | 0 (0.0%) |
| 35 Years and over | 0 (0.0%) | 0 (0.0%) |
| Total | 393 (79.4%) | 102 (20.6%) |
Educational Attainment by Field of Study in Dover Foxcroft
Business (138 | 22.3%), science & technology (92 | 14.9%), arts & humanities (79 | 12.8%), education (58 | 9.4%), and social sciences (47 | 7.6%) are the most common fields of study among 619 individuals in Dover Foxcroft who have obtained a bachelor's degree or higher.
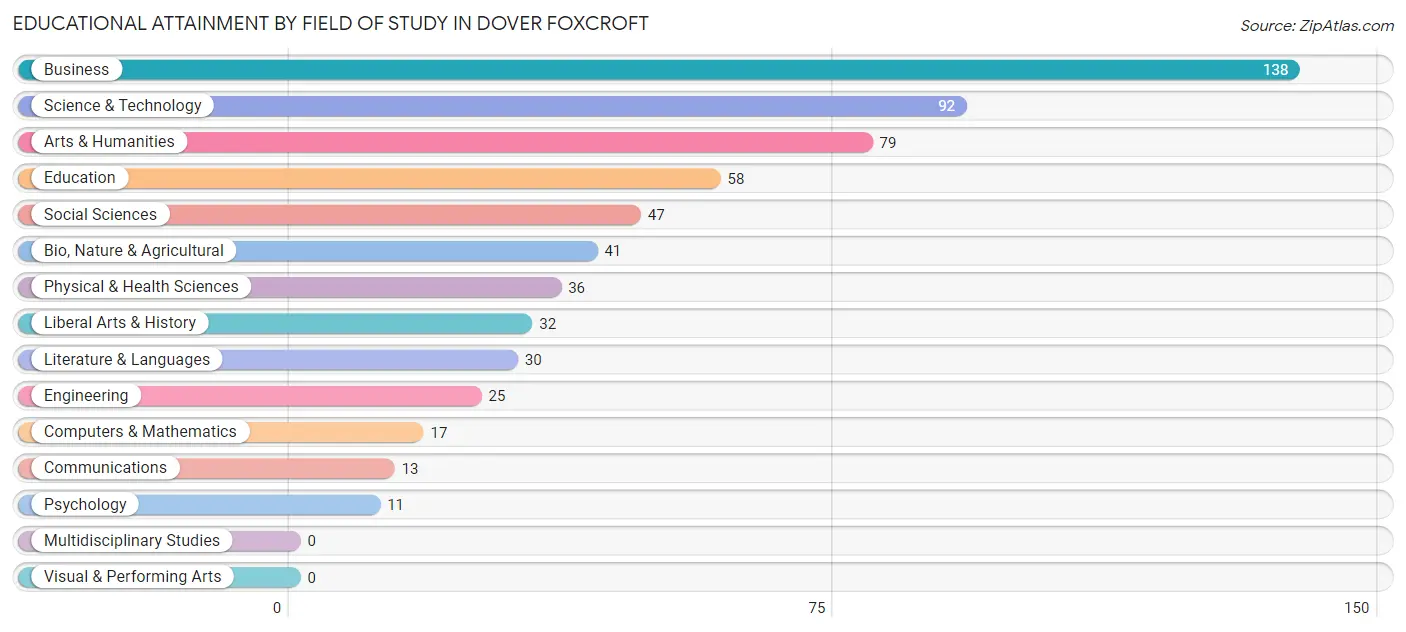
| Field of Study | # Graduates | % Graduates |
| Computers & Mathematics | 17 | 2.8% |
| Bio, Nature & Agricultural | 41 | 6.6% |
| Physical & Health Sciences | 36 | 5.8% |
| Psychology | 11 | 1.8% |
| Social Sciences | 47 | 7.6% |
| Engineering | 25 | 4.0% |
| Multidisciplinary Studies | 0 | 0.0% |
| Science & Technology | 92 | 14.9% |
| Business | 138 | 22.3% |
| Education | 58 | 9.4% |
| Literature & Languages | 30 | 4.9% |
| Liberal Arts & History | 32 | 5.2% |
| Visual & Performing Arts | 0 | 0.0% |
| Communications | 13 | 2.1% |
| Arts & Humanities | 79 | 12.8% |
| Total | 619 | 100.0% |
Transportation & Commute in Dover Foxcroft
Vehicle Availability by Sex in Dover Foxcroft
The most prevalent vehicle ownership categories in Dover Foxcroft are males with 2 vehicles (185, accounting for 42.5%) and females with 2 vehicles (101, making up 38.1%).
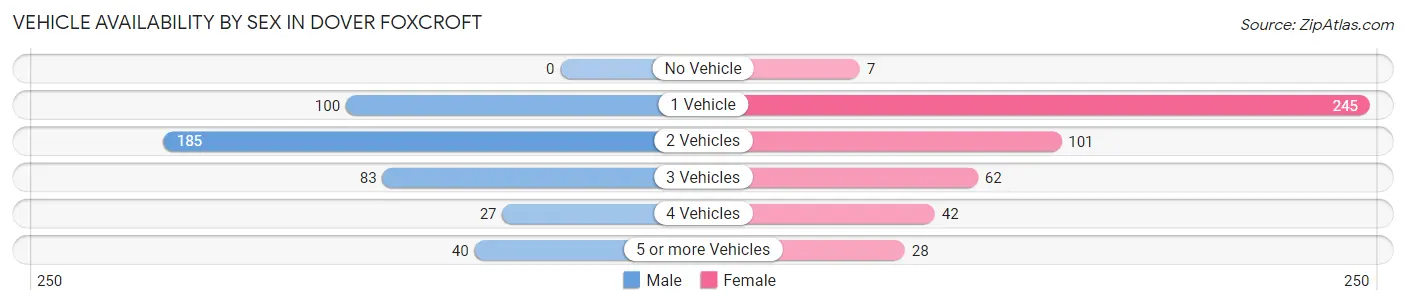
| Vehicles Available | Male | Female |
| No Vehicle | 0 (0.0%) | 7 (1.4%) |
| 1 Vehicle | 100 (23.0%) | 245 (50.5%) |
| 2 Vehicles | 185 (42.5%) | 101 (20.8%) |
| 3 Vehicles | 83 (19.1%) | 62 (12.8%) |
| 4 Vehicles | 27 (6.2%) | 42 (8.7%) |
| 5 or more Vehicles | 40 (9.2%) | 28 (5.8%) |
| Total | 435 (100.0%) | 485 (100.0%) |
Commute Time in Dover Foxcroft
The most frequently occuring commute durations in Dover Foxcroft are 5 to 9 minutes (353 commuters, 38.2%), less than 5 minutes (105 commuters, 11.4%), and 10 to 14 minutes (103 commuters, 11.1%).
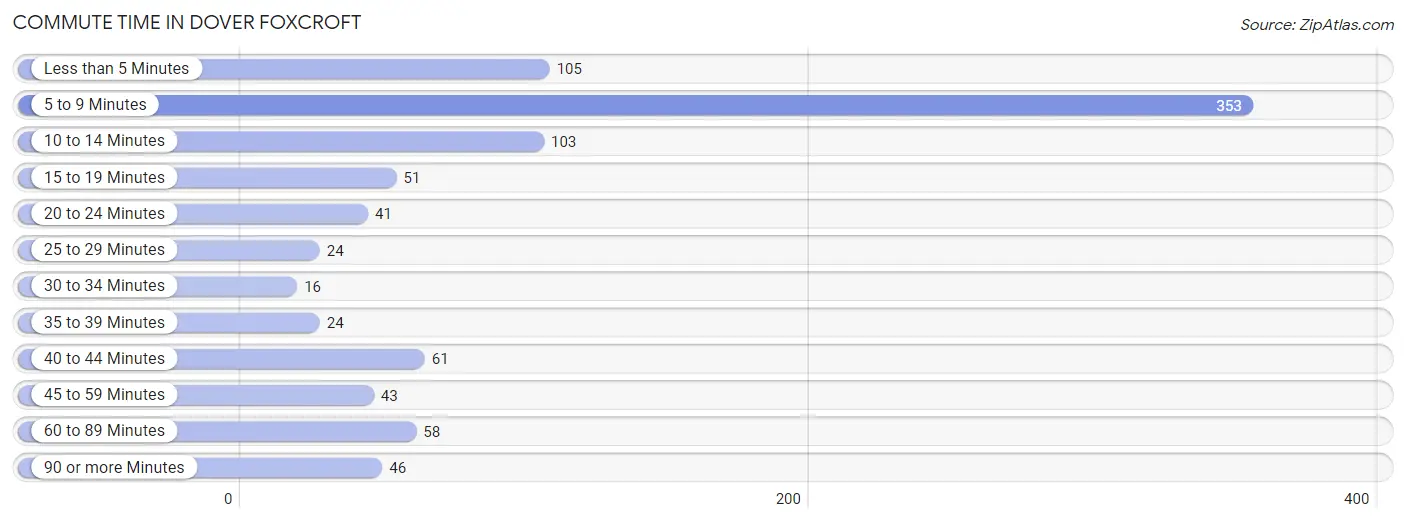
| Commute Time | # Commuters | % Commuters |
| Less than 5 Minutes | 105 | 11.4% |
| 5 to 9 Minutes | 353 | 38.2% |
| 10 to 14 Minutes | 103 | 11.1% |
| 15 to 19 Minutes | 51 | 5.5% |
| 20 to 24 Minutes | 41 | 4.4% |
| 25 to 29 Minutes | 24 | 2.6% |
| 30 to 34 Minutes | 16 | 1.7% |
| 35 to 39 Minutes | 24 | 2.6% |
| 40 to 44 Minutes | 61 | 6.6% |
| 45 to 59 Minutes | 43 | 4.6% |
| 60 to 89 Minutes | 58 | 6.3% |
| 90 or more Minutes | 46 | 5.0% |
Commute Time by Sex in Dover Foxcroft
The most common commute times in Dover Foxcroft are 5 to 9 minutes (161 commuters, 35.5%) for males and 5 to 9 minutes (192 commuters, 40.7%) for females.
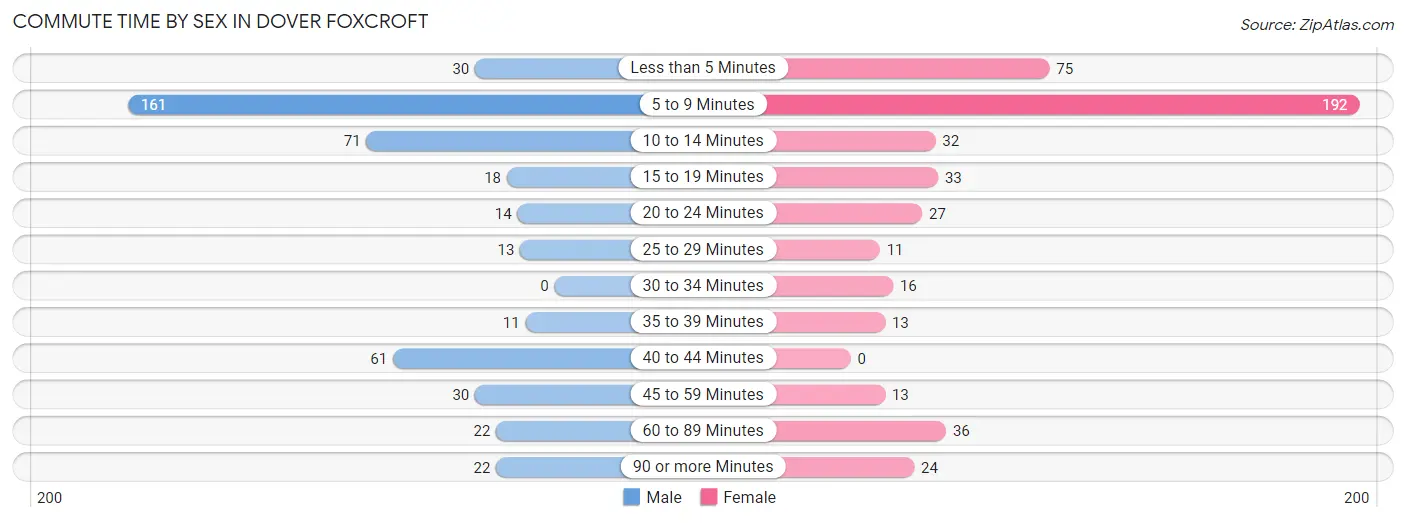
| Commute Time | Male | Female |
| Less than 5 Minutes | 30 (6.6%) | 75 (15.9%) |
| 5 to 9 Minutes | 161 (35.5%) | 192 (40.7%) |
| 10 to 14 Minutes | 71 (15.7%) | 32 (6.8%) |
| 15 to 19 Minutes | 18 (4.0%) | 33 (7.0%) |
| 20 to 24 Minutes | 14 (3.1%) | 27 (5.7%) |
| 25 to 29 Minutes | 13 (2.9%) | 11 (2.3%) |
| 30 to 34 Minutes | 0 (0.0%) | 16 (3.4%) |
| 35 to 39 Minutes | 11 (2.4%) | 13 (2.8%) |
| 40 to 44 Minutes | 61 (13.5%) | 0 (0.0%) |
| 45 to 59 Minutes | 30 (6.6%) | 13 (2.8%) |
| 60 to 89 Minutes | 22 (4.9%) | 36 (7.6%) |
| 90 or more Minutes | 22 (4.9%) | 24 (5.1%) |
Time of Departure to Work by Sex in Dover Foxcroft
The most frequent times of departure to work in Dover Foxcroft are 7:00 AM to 7:29 AM (136, 30.0%) for males and 8:00 AM to 8:29 AM (86, 18.2%) for females.
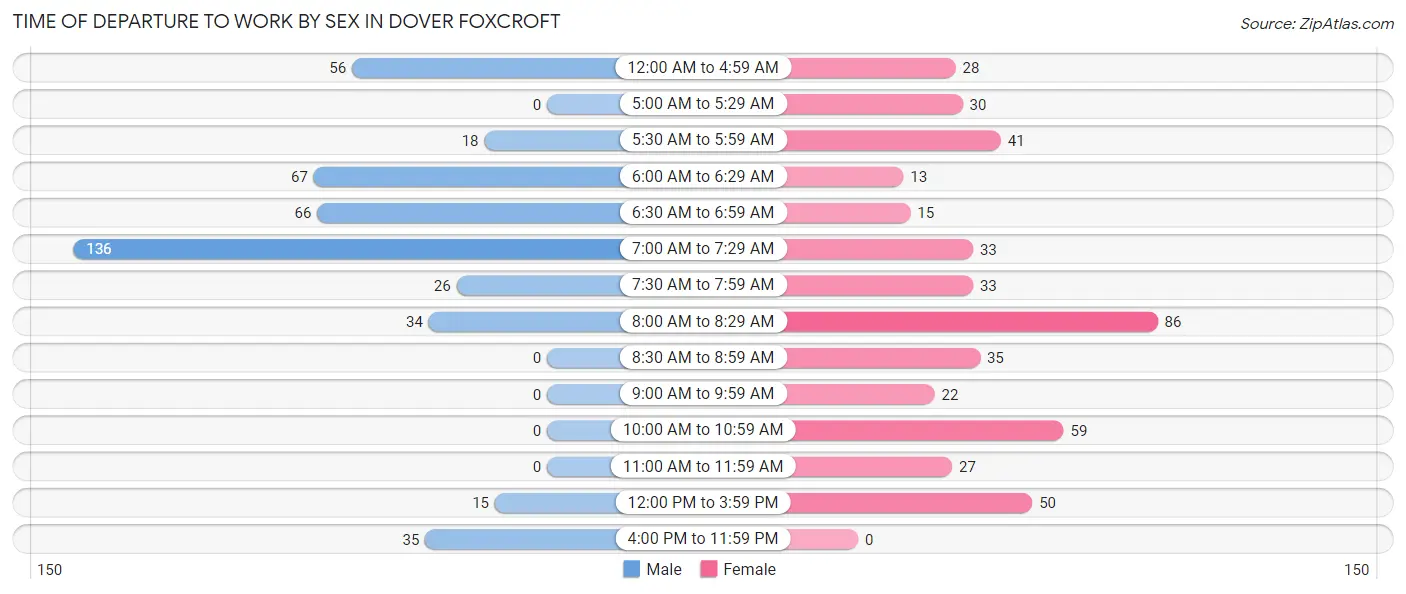
| Time of Departure | Male | Female |
| 12:00 AM to 4:59 AM | 56 (12.4%) | 28 (5.9%) |
| 5:00 AM to 5:29 AM | 0 (0.0%) | 30 (6.4%) |
| 5:30 AM to 5:59 AM | 18 (4.0%) | 41 (8.7%) |
| 6:00 AM to 6:29 AM | 67 (14.8%) | 13 (2.8%) |
| 6:30 AM to 6:59 AM | 66 (14.6%) | 15 (3.2%) |
| 7:00 AM to 7:29 AM | 136 (30.0%) | 33 (7.0%) |
| 7:30 AM to 7:59 AM | 26 (5.7%) | 33 (7.0%) |
| 8:00 AM to 8:29 AM | 34 (7.5%) | 86 (18.2%) |
| 8:30 AM to 8:59 AM | 0 (0.0%) | 35 (7.4%) |
| 9:00 AM to 9:59 AM | 0 (0.0%) | 22 (4.7%) |
| 10:00 AM to 10:59 AM | 0 (0.0%) | 59 (12.5%) |
| 11:00 AM to 11:59 AM | 0 (0.0%) | 27 (5.7%) |
| 12:00 PM to 3:59 PM | 15 (3.3%) | 50 (10.6%) |
| 4:00 PM to 11:59 PM | 35 (7.7%) | 0 (0.0%) |
| Total | 453 (100.0%) | 472 (100.0%) |
Housing Occupancy in Dover Foxcroft
Occupancy by Ownership in Dover Foxcroft
Of the total 1,243 dwellings in Dover Foxcroft, owner-occupied units account for 609 (49.0%), while renter-occupied units make up 634 (51.0%).
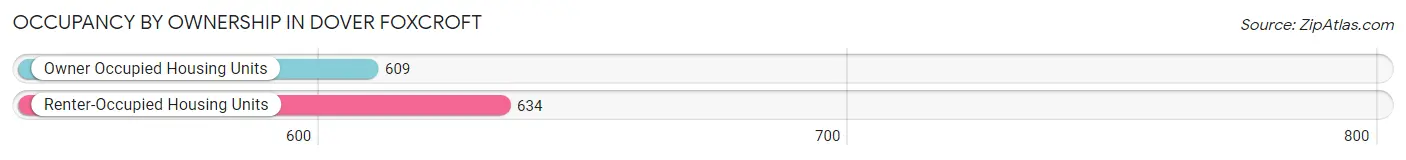
| Occupancy | # Housing Units | % Housing Units |
| Owner Occupied Housing Units | 609 | 49.0% |
| Renter-Occupied Housing Units | 634 | 51.0% |
| Total Occupied Housing Units | 1,243 | 100.0% |
Occupancy by Household Size in Dover Foxcroft
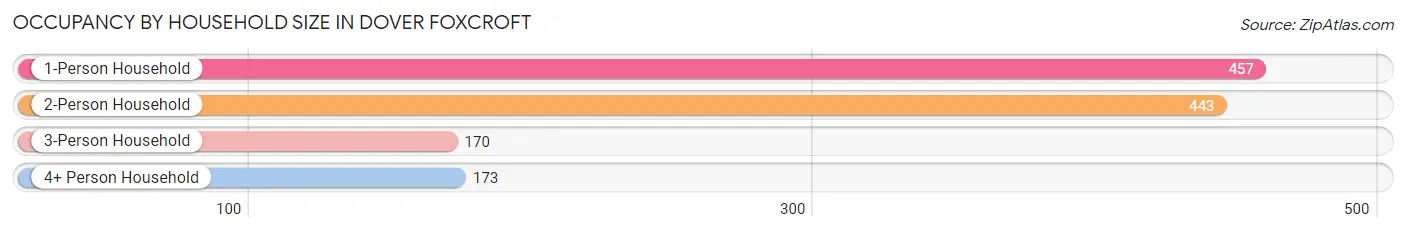
| Household Size | # Housing Units | % Housing Units |
| 1-Person Household | 457 | 36.8% |
| 2-Person Household | 443 | 35.6% |
| 3-Person Household | 170 | 13.7% |
| 4+ Person Household | 173 | 13.9% |
| Total Housing Units | 1,243 | 100.0% |
Occupancy by Ownership by Household Size in Dover Foxcroft
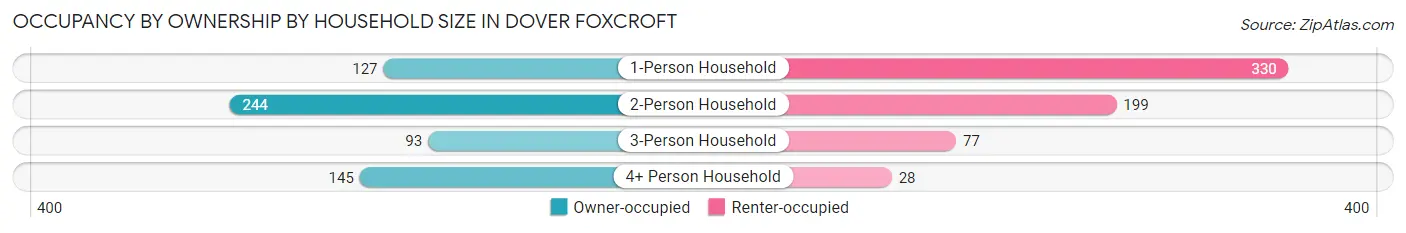
| Household Size | Owner-occupied | Renter-occupied |
| 1-Person Household | 127 (27.8%) | 330 (72.2%) |
| 2-Person Household | 244 (55.1%) | 199 (44.9%) |
| 3-Person Household | 93 (54.7%) | 77 (45.3%) |
| 4+ Person Household | 145 (83.8%) | 28 (16.2%) |
| Total Housing Units | 609 (49.0%) | 634 (51.0%) |
Occupancy by Educational Attainment in Dover Foxcroft
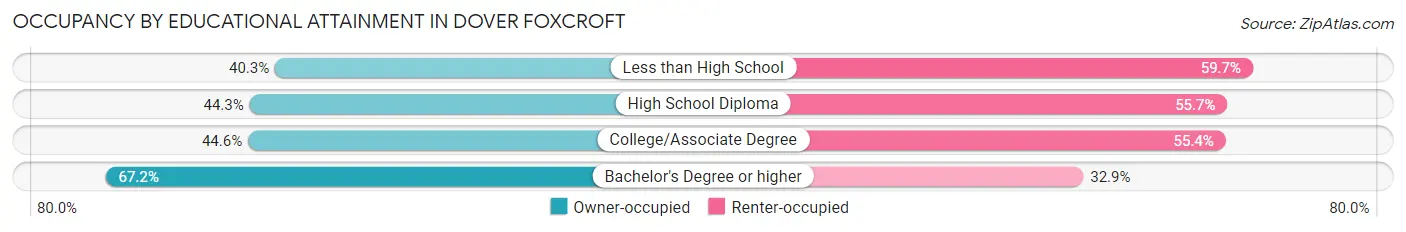
| Household Size | Owner-occupied | Renter-occupied |
| Less than High School | 60 (40.3%) | 89 (59.7%) |
| High School Diploma | 199 (44.3%) | 250 (55.7%) |
| College/Associate Degree | 164 (44.6%) | 204 (55.4%) |
| Bachelor's Degree or higher | 186 (67.1%) | 91 (32.9%) |
Occupancy by Age of Householder in Dover Foxcroft
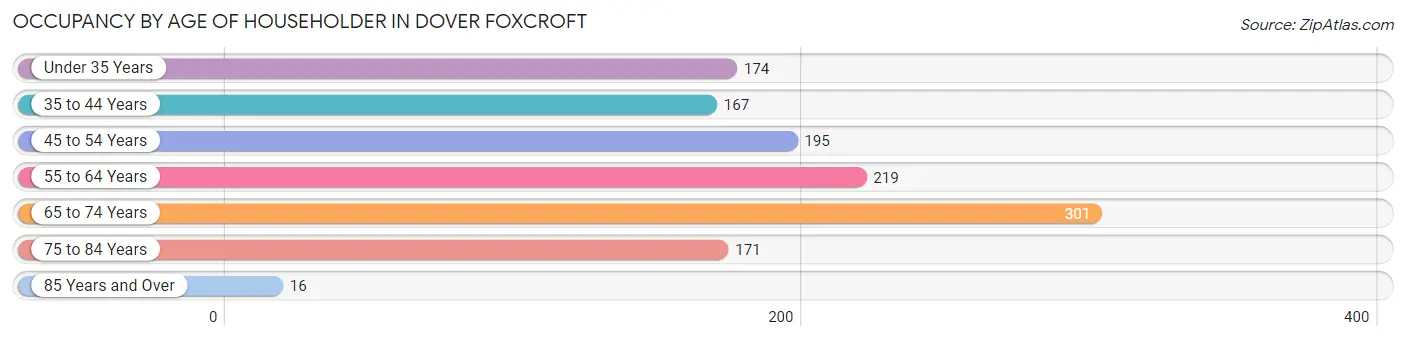
| Age Bracket | # Households | % Households |
| Under 35 Years | 174 | 14.0% |
| 35 to 44 Years | 167 | 13.4% |
| 45 to 54 Years | 195 | 15.7% |
| 55 to 64 Years | 219 | 17.6% |
| 65 to 74 Years | 301 | 24.2% |
| 75 to 84 Years | 171 | 13.8% |
| 85 Years and Over | 16 | 1.3% |
| Total | 1,243 | 100.0% |
Housing Finances in Dover Foxcroft
Median Income by Occupancy in Dover Foxcroft
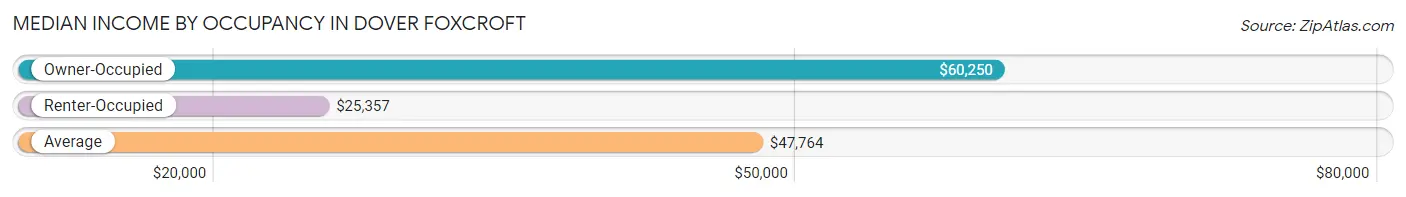
| Occupancy Type | # Households | Median Income |
| Owner-Occupied | 609 (49.0%) | $60,250 |
| Renter-Occupied | 634 (51.0%) | $25,357 |
| Average | 1,243 (100.0%) | $47,764 |
Occupancy by Householder Income Bracket in Dover Foxcroft
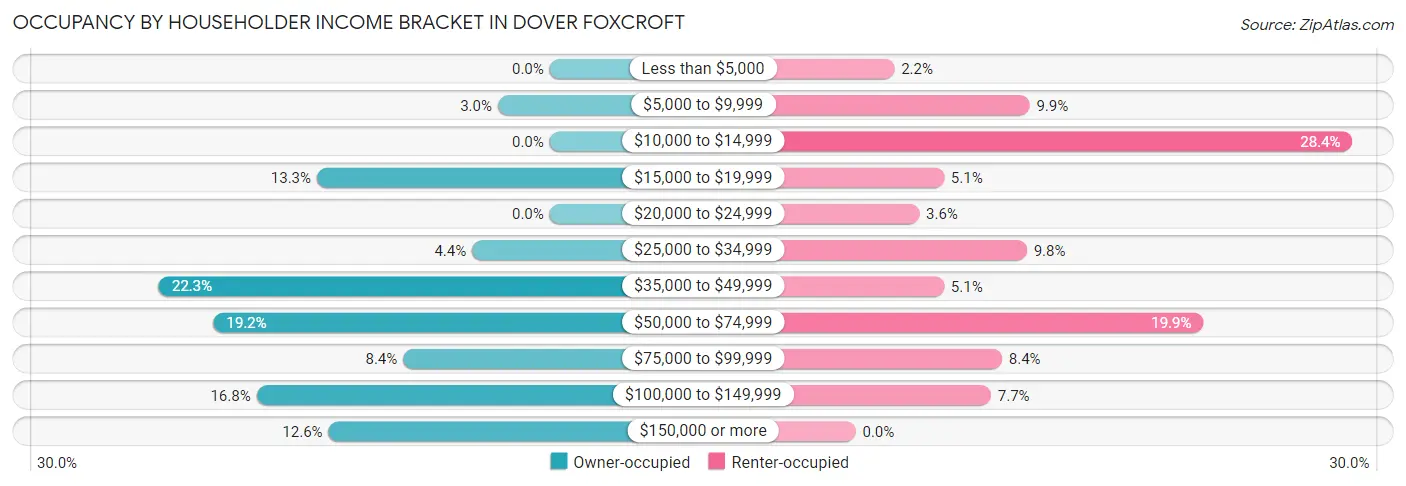
| Income Bracket | Owner-occupied | Renter-occupied |
| Less than $5,000 | 0 (0.0%) | 14 (2.2%) |
| $5,000 to $9,999 | 18 (3.0%) | 63 (9.9%) |
| $10,000 to $14,999 | 0 (0.0%) | 180 (28.4%) |
| $15,000 to $19,999 | 81 (13.3%) | 32 (5.1%) |
| $20,000 to $24,999 | 0 (0.0%) | 23 (3.6%) |
| $25,000 to $34,999 | 27 (4.4%) | 62 (9.8%) |
| $35,000 to $49,999 | 136 (22.3%) | 32 (5.1%) |
| $50,000 to $74,999 | 117 (19.2%) | 126 (19.9%) |
| $75,000 to $99,999 | 51 (8.4%) | 53 (8.4%) |
| $100,000 to $149,999 | 102 (16.8%) | 49 (7.7%) |
| $150,000 or more | 77 (12.6%) | 0 (0.0%) |
| Total | 609 (100.0%) | 634 (100.0%) |
Monthly Housing Cost Tiers in Dover Foxcroft
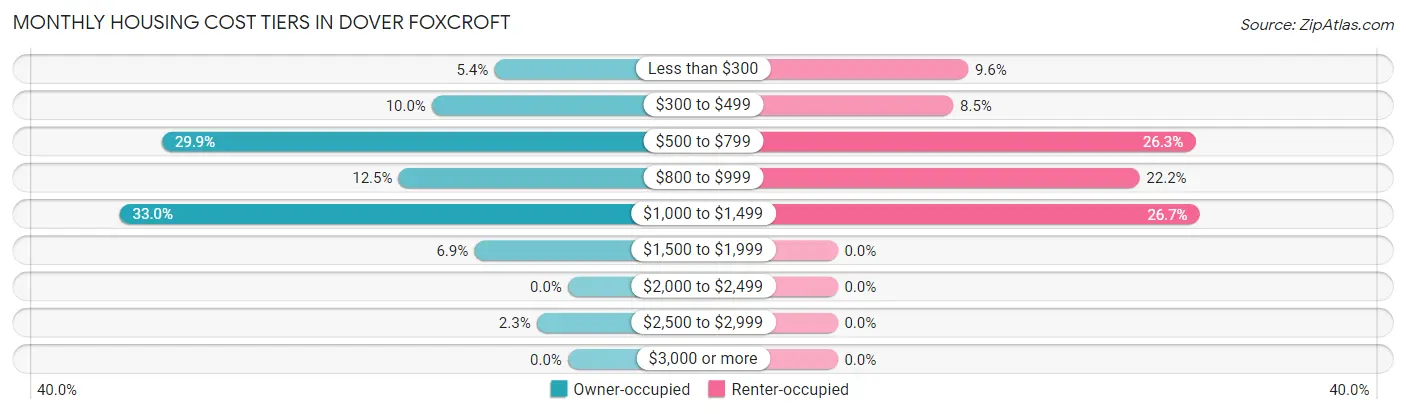
| Monthly Cost | Owner-occupied | Renter-occupied |
| Less than $300 | 33 (5.4%) | 61 (9.6%) |
| $300 to $499 | 61 (10.0%) | 54 (8.5%) |
| $500 to $799 | 182 (29.9%) | 167 (26.3%) |
| $800 to $999 | 76 (12.5%) | 141 (22.2%) |
| $1,000 to $1,499 | 201 (33.0%) | 169 (26.7%) |
| $1,500 to $1,999 | 42 (6.9%) | 0 (0.0%) |
| $2,000 to $2,499 | 0 (0.0%) | 0 (0.0%) |
| $2,500 to $2,999 | 14 (2.3%) | 0 (0.0%) |
| $3,000 or more | 0 (0.0%) | 0 (0.0%) |
| Total | 609 (100.0%) | 634 (100.0%) |
Physical Housing Characteristics in Dover Foxcroft
Housing Structures in Dover Foxcroft
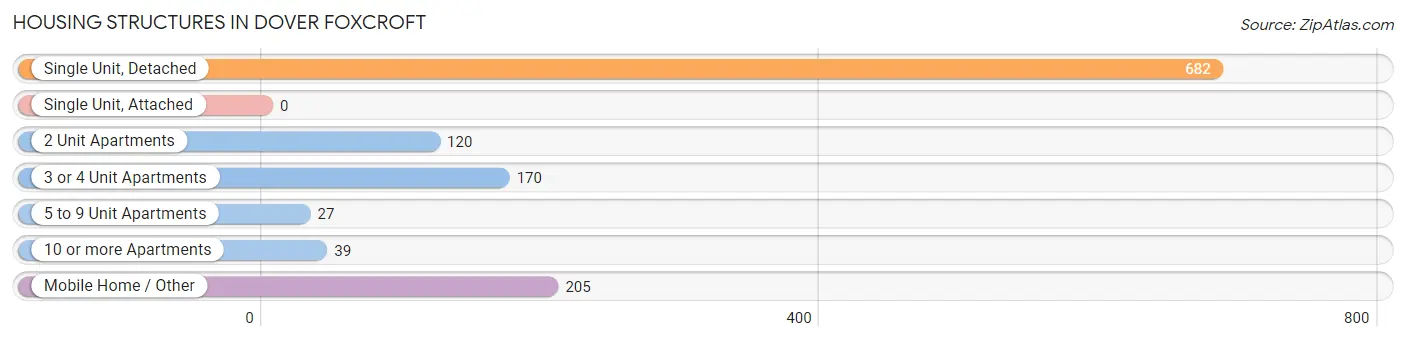
| Structure Type | # Housing Units | % Housing Units |
| Single Unit, Detached | 682 | 54.9% |
| Single Unit, Attached | 0 | 0.0% |
| 2 Unit Apartments | 120 | 9.7% |
| 3 or 4 Unit Apartments | 170 | 13.7% |
| 5 to 9 Unit Apartments | 27 | 2.2% |
| 10 or more Apartments | 39 | 3.1% |
| Mobile Home / Other | 205 | 16.5% |
| Total | 1,243 | 100.0% |
Housing Structures by Occupancy in Dover Foxcroft
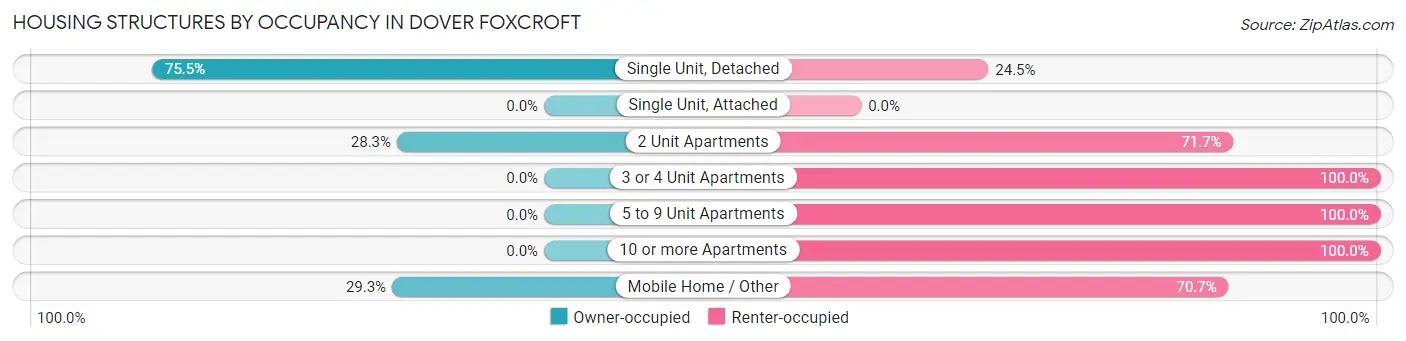
| Structure Type | Owner-occupied | Renter-occupied |
| Single Unit, Detached | 515 (75.5%) | 167 (24.5%) |
| Single Unit, Attached | 0 (0.0%) | 0 (0.0%) |
| 2 Unit Apartments | 34 (28.3%) | 86 (71.7%) |
| 3 or 4 Unit Apartments | 0 (0.0%) | 170 (100.0%) |
| 5 to 9 Unit Apartments | 0 (0.0%) | 27 (100.0%) |
| 10 or more Apartments | 0 (0.0%) | 39 (100.0%) |
| Mobile Home / Other | 60 (29.3%) | 145 (70.7%) |
| Total | 609 (49.0%) | 634 (51.0%) |
Housing Structures by Number of Rooms in Dover Foxcroft
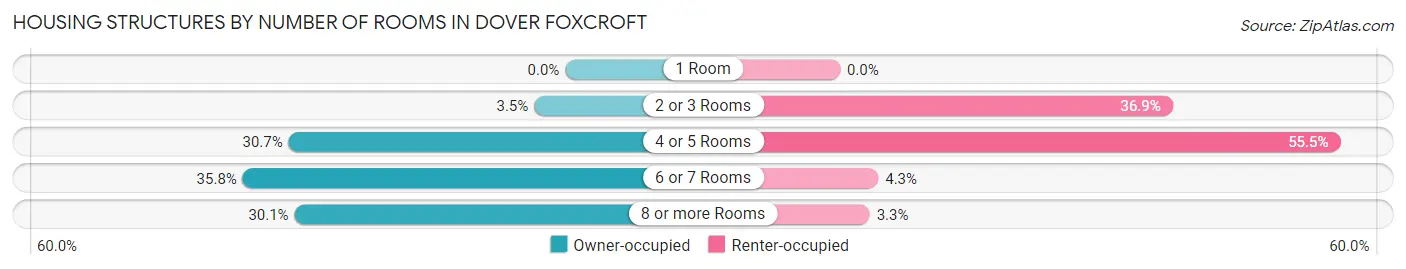
| Number of Rooms | Owner-occupied | Renter-occupied |
| 1 Room | 0 (0.0%) | 0 (0.0%) |
| 2 or 3 Rooms | 21 (3.5%) | 234 (36.9%) |
| 4 or 5 Rooms | 187 (30.7%) | 352 (55.5%) |
| 6 or 7 Rooms | 218 (35.8%) | 27 (4.3%) |
| 8 or more Rooms | 183 (30.0%) | 21 (3.3%) |
| Total | 609 (100.0%) | 634 (100.0%) |
Housing Structure by Heating Type in Dover Foxcroft
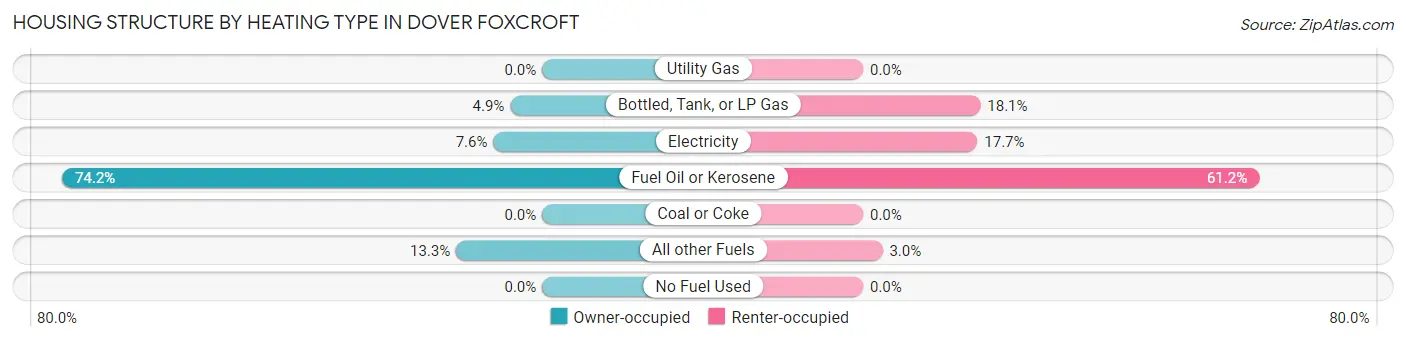
| Heating Type | Owner-occupied | Renter-occupied |
| Utility Gas | 0 (0.0%) | 0 (0.0%) |
| Bottled, Tank, or LP Gas | 30 (4.9%) | 115 (18.1%) |
| Electricity | 46 (7.5%) | 112 (17.7%) |
| Fuel Oil or Kerosene | 452 (74.2%) | 388 (61.2%) |
| Coal or Coke | 0 (0.0%) | 0 (0.0%) |
| All other Fuels | 81 (13.3%) | 19 (3.0%) |
| No Fuel Used | 0 (0.0%) | 0 (0.0%) |
| Total | 609 (100.0%) | 634 (100.0%) |
Household Vehicle Usage in Dover Foxcroft
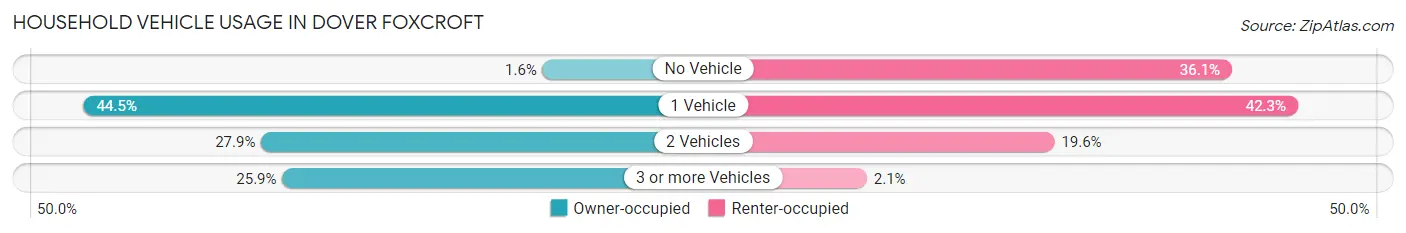
| Vehicles per Household | Owner-occupied | Renter-occupied |
| No Vehicle | 10 (1.6%) | 229 (36.1%) |
| 1 Vehicle | 271 (44.5%) | 268 (42.3%) |
| 2 Vehicles | 170 (27.9%) | 124 (19.6%) |
| 3 or more Vehicles | 158 (25.9%) | 13 (2.1%) |
| Total | 609 (100.0%) | 634 (100.0%) |
Real Estate & Mortgages in Dover Foxcroft
Real Estate and Mortgage Overview in Dover Foxcroft
| Characteristic | Without Mortgage | With Mortgage |
| Housing Units | 290 | 319 |
| Median Property Value | $127,900 | $128,600 |
| Median Household Income | $56,786 | $49 |
| Monthly Housing Costs | $703 | $0 |
| Real Estate Taxes | $1,651 | $21 |
Property Value by Mortgage Status in Dover Foxcroft
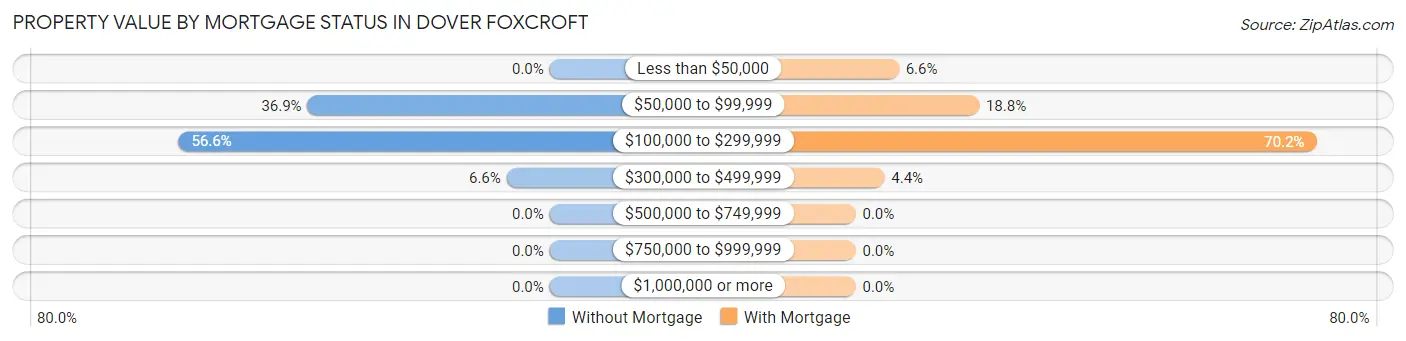
| Property Value | Without Mortgage | With Mortgage |
| Less than $50,000 | 0 (0.0%) | 21 (6.6%) |
| $50,000 to $99,999 | 107 (36.9%) | 60 (18.8%) |
| $100,000 to $299,999 | 164 (56.6%) | 224 (70.2%) |
| $300,000 to $499,999 | 19 (6.6%) | 14 (4.4%) |
| $500,000 to $749,999 | 0 (0.0%) | 0 (0.0%) |
| $750,000 to $999,999 | 0 (0.0%) | 0 (0.0%) |
| $1,000,000 or more | 0 (0.0%) | 0 (0.0%) |
| Total | 290 (100.0%) | 319 (100.0%) |
Household Income by Mortgage Status in Dover Foxcroft
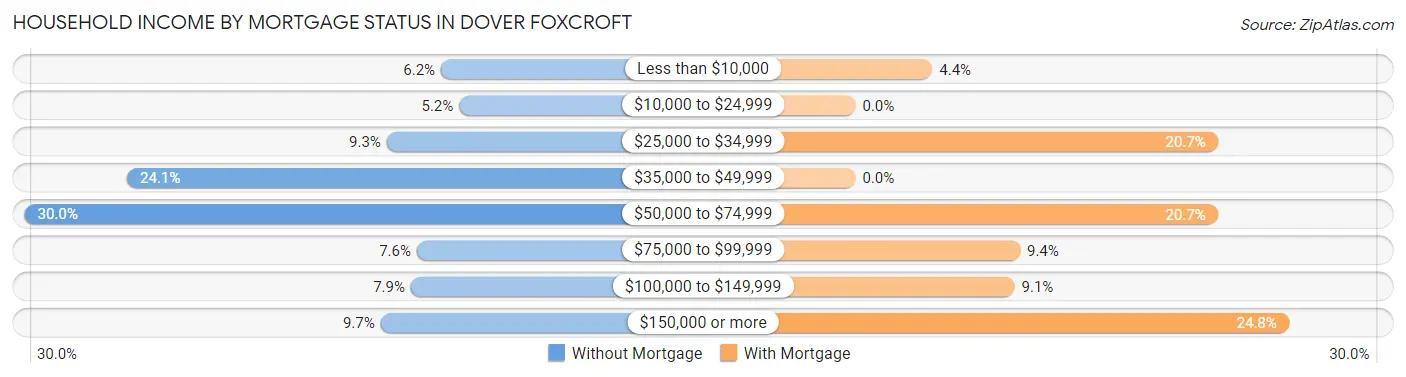
| Household Income | Without Mortgage | With Mortgage |
| Less than $10,000 | 18 (6.2%) | 14 (4.4%) |
| $10,000 to $24,999 | 15 (5.2%) | 0 (0.0%) |
| $25,000 to $34,999 | 27 (9.3%) | 66 (20.7%) |
| $35,000 to $49,999 | 70 (24.1%) | 0 (0.0%) |
| $50,000 to $74,999 | 87 (30.0%) | 66 (20.7%) |
| $75,000 to $99,999 | 22 (7.6%) | 30 (9.4%) |
| $100,000 to $149,999 | 23 (7.9%) | 29 (9.1%) |
| $150,000 or more | 28 (9.7%) | 79 (24.8%) |
| Total | 290 (100.0%) | 319 (100.0%) |
Property Value to Household Income Ratio in Dover Foxcroft
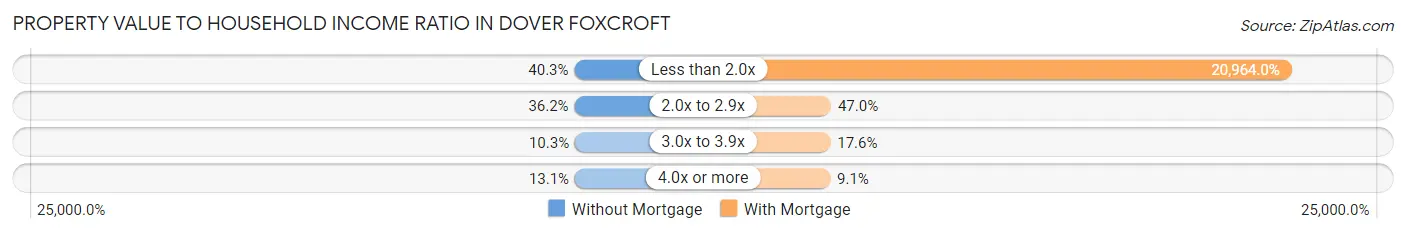
| Value-to-Income Ratio | Without Mortgage | With Mortgage |
| Less than 2.0x | 117 (40.3%) | 66,875 (20,963.9%) |
| 2.0x to 2.9x | 105 (36.2%) | 150 (47.0%) |
| 3.0x to 3.9x | 30 (10.3%) | 56 (17.5%) |
| 4.0x or more | 38 (13.1%) | 29 (9.1%) |
| Total | 290 (100.0%) | 319 (100.0%) |
Real Estate Taxes by Mortgage Status in Dover Foxcroft
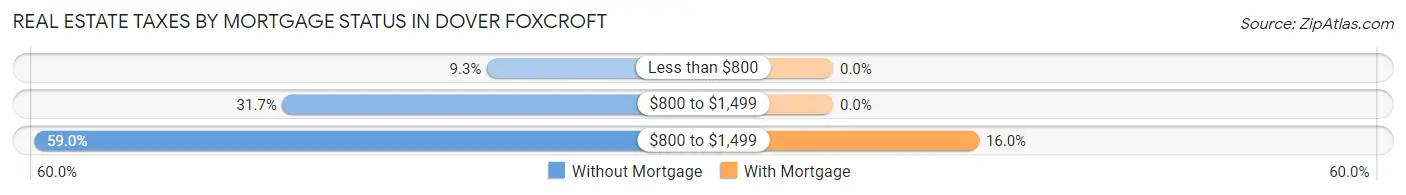
| Property Taxes | Without Mortgage | With Mortgage |
| Less than $800 | 27 (9.3%) | 0 (0.0%) |
| $800 to $1,499 | 92 (31.7%) | 0 (0.0%) |
| $800 to $1,499 | 171 (59.0%) | 51 (16.0%) |
| Total | 290 (100.0%) | 319 (100.0%) |
Health & Disability in Dover Foxcroft
Health Insurance Coverage by Age in Dover Foxcroft
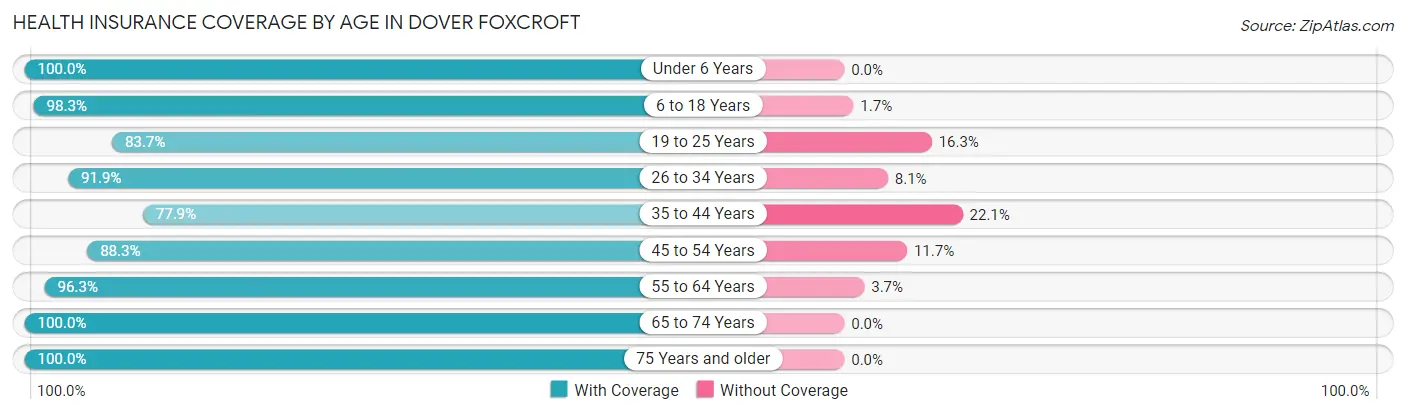
| Age Bracket | With Coverage | Without Coverage |
| Under 6 Years | 269 (100.0%) | 0 (0.0%) |
| 6 to 18 Years | 289 (98.3%) | 5 (1.7%) |
| 19 to 25 Years | 303 (83.7%) | 59 (16.3%) |
| 26 to 34 Years | 147 (91.9%) | 13 (8.1%) |
| 35 to 44 Years | 219 (77.9%) | 62 (22.1%) |
| 45 to 54 Years | 287 (88.3%) | 38 (11.7%) |
| 55 to 64 Years | 310 (96.3%) | 12 (3.7%) |
| 65 to 74 Years | 417 (100.0%) | 0 (0.0%) |
| 75 Years and older | 296 (100.0%) | 0 (0.0%) |
| Total | 2,537 (93.1%) | 189 (6.9%) |
Health Insurance Coverage by Citizenship Status in Dover Foxcroft
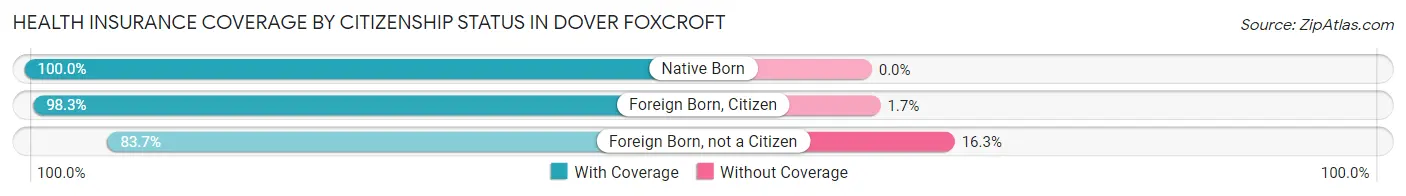
| Citizenship Status | With Coverage | Without Coverage |
| Native Born | 269 (100.0%) | 0 (0.0%) |
| Foreign Born, Citizen | 289 (98.3%) | 5 (1.7%) |
| Foreign Born, not a Citizen | 303 (83.7%) | 59 (16.3%) |
Health Insurance Coverage by Household Income in Dover Foxcroft
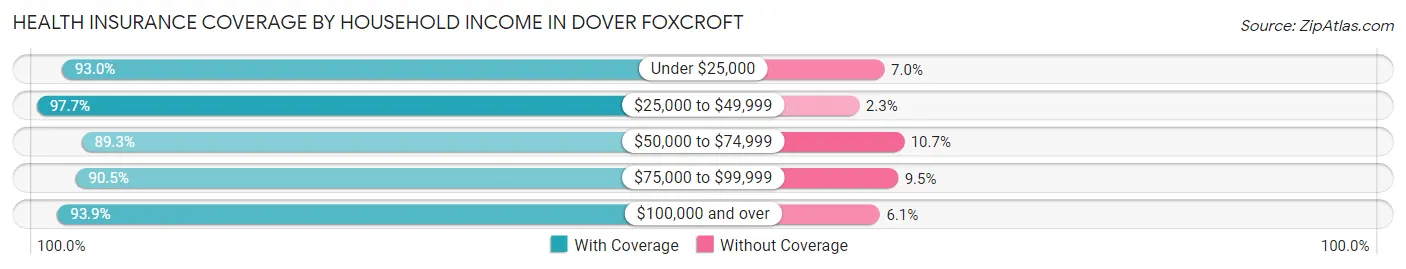
| Household Income | With Coverage | Without Coverage |
| Under $25,000 | 452 (93.0%) | 34 (7.0%) |
| $25,000 to $49,999 | 516 (97.7%) | 12 (2.3%) |
| $50,000 to $74,999 | 385 (89.3%) | 46 (10.7%) |
| $75,000 to $99,999 | 313 (90.5%) | 33 (9.5%) |
| $100,000 and over | 749 (93.9%) | 49 (6.1%) |
Public vs Private Health Insurance Coverage by Age in Dover Foxcroft
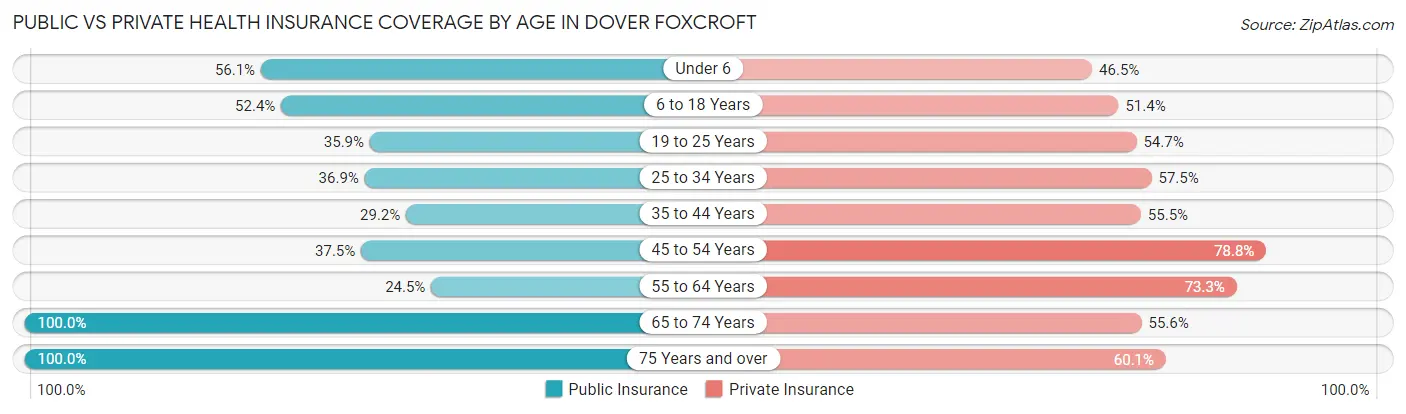
| Age Bracket | Public Insurance | Private Insurance |
| Under 6 | 151 (56.1%) | 125 (46.5%) |
| 6 to 18 Years | 154 (52.4%) | 151 (51.4%) |
| 19 to 25 Years | 130 (35.9%) | 198 (54.7%) |
| 25 to 34 Years | 59 (36.9%) | 92 (57.5%) |
| 35 to 44 Years | 82 (29.2%) | 156 (55.5%) |
| 45 to 54 Years | 122 (37.5%) | 256 (78.8%) |
| 55 to 64 Years | 79 (24.5%) | 236 (73.3%) |
| 65 to 74 Years | 417 (100.0%) | 232 (55.6%) |
| 75 Years and over | 296 (100.0%) | 178 (60.1%) |
| Total | 1,490 (54.7%) | 1,624 (59.6%) |
Disability Status by Sex by Age in Dover Foxcroft
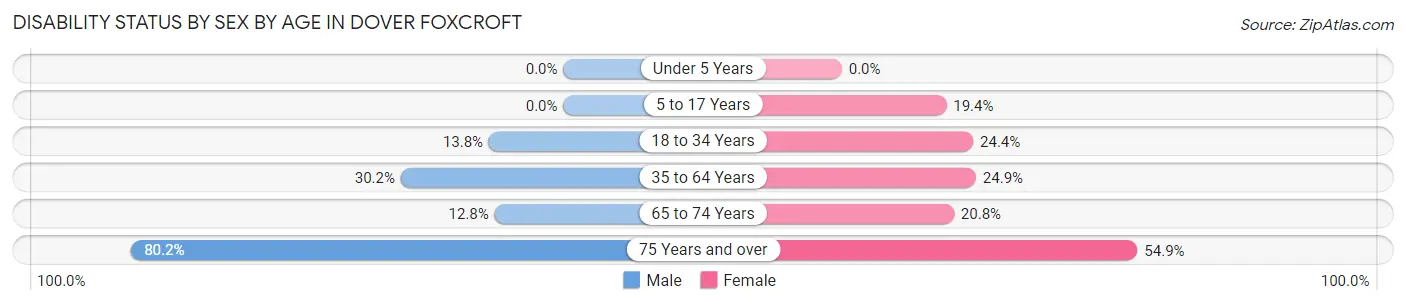
| Age Bracket | Male | Female |
| Under 5 Years | 0 (0.0%) | 0 (0.0%) |
| 5 to 17 Years | 0 (0.0%) | 39 (19.4%) |
| 18 to 34 Years | 29 (13.8%) | 79 (24.4%) |
| 35 to 64 Years | 137 (30.2%) | 118 (24.9%) |
| 65 to 74 Years | 25 (12.8%) | 46 (20.8%) |
| 75 Years and over | 81 (80.2%) | 107 (54.9%) |
Disability Class by Sex by Age in Dover Foxcroft
Disability Class: Hearing Difficulty
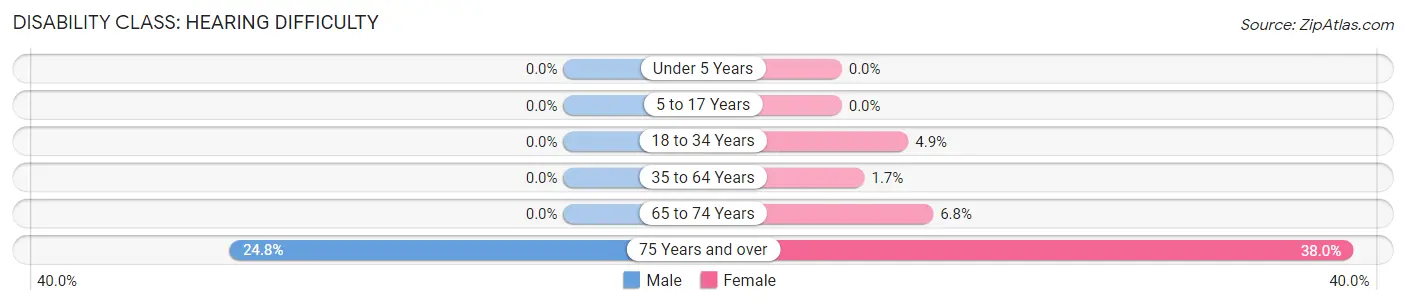
| Age Bracket | Male | Female |
| Under 5 Years | 0 (0.0%) | 0 (0.0%) |
| 5 to 17 Years | 0 (0.0%) | 0 (0.0%) |
| 18 to 34 Years | 0 (0.0%) | 16 (4.9%) |
| 35 to 64 Years | 0 (0.0%) | 8 (1.7%) |
| 65 to 74 Years | 0 (0.0%) | 15 (6.8%) |
| 75 Years and over | 25 (24.7%) | 74 (38.0%) |
Disability Class: Vision Difficulty
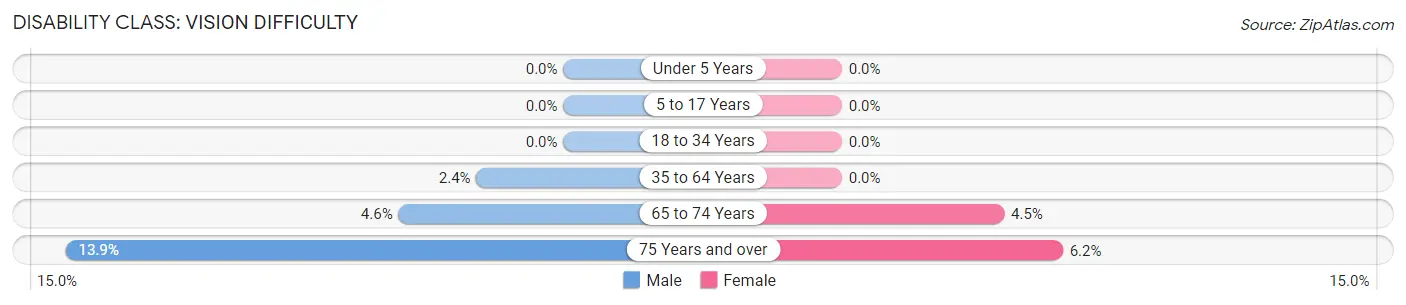
| Age Bracket | Male | Female |
| Under 5 Years | 0 (0.0%) | 0 (0.0%) |
| 5 to 17 Years | 0 (0.0%) | 0 (0.0%) |
| 18 to 34 Years | 0 (0.0%) | 0 (0.0%) |
| 35 to 64 Years | 11 (2.4%) | 0 (0.0%) |
| 65 to 74 Years | 9 (4.6%) | 10 (4.5%) |
| 75 Years and over | 14 (13.9%) | 12 (6.1%) |
Disability Class: Cognitive Difficulty
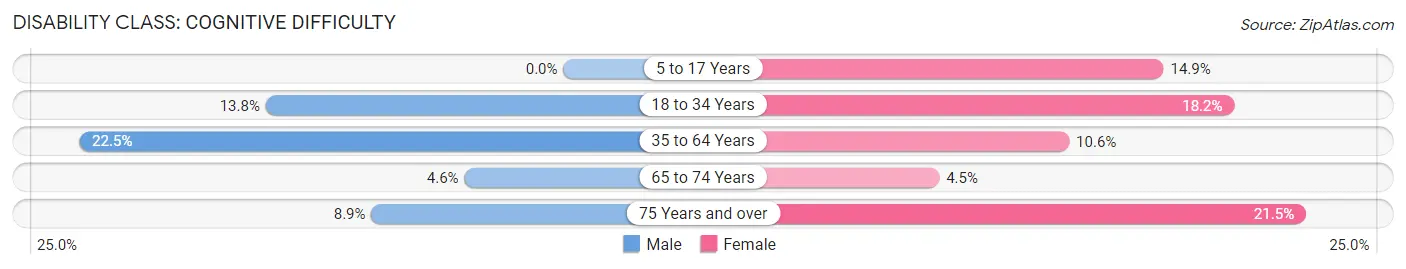
| Age Bracket | Male | Female |
| 5 to 17 Years | 0 (0.0%) | 30 (14.9%) |
| 18 to 34 Years | 29 (13.8%) | 59 (18.2%) |
| 35 to 64 Years | 102 (22.5%) | 50 (10.5%) |
| 65 to 74 Years | 9 (4.6%) | 10 (4.5%) |
| 75 Years and over | 9 (8.9%) | 42 (21.5%) |
Disability Class: Ambulatory Difficulty
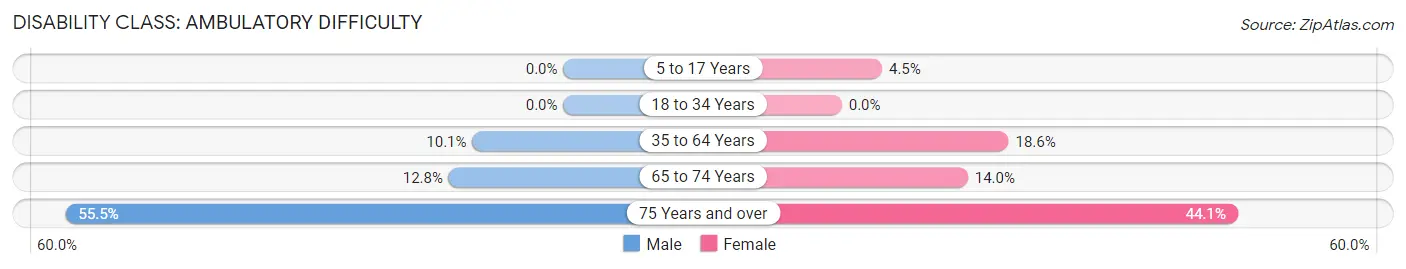
| Age Bracket | Male | Female |
| 5 to 17 Years | 0 (0.0%) | 9 (4.5%) |
| 18 to 34 Years | 0 (0.0%) | 0 (0.0%) |
| 35 to 64 Years | 46 (10.1%) | 88 (18.6%) |
| 65 to 74 Years | 25 (12.8%) | 31 (14.0%) |
| 75 Years and over | 56 (55.4%) | 86 (44.1%) |
Disability Class: Self-Care Difficulty
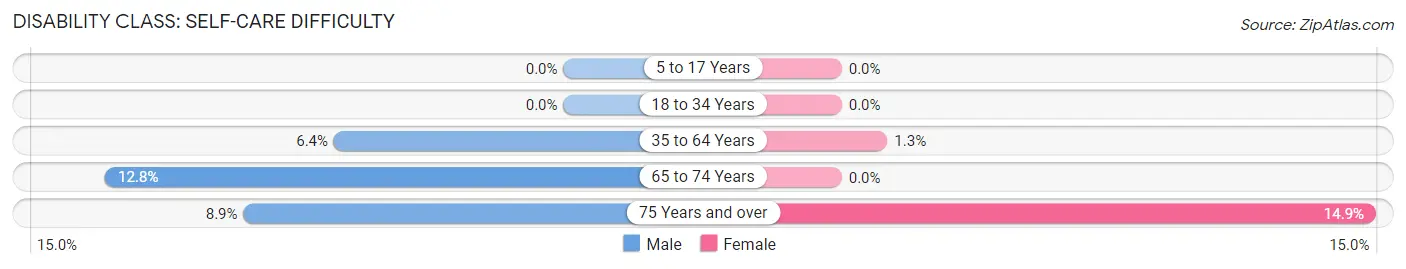
| Age Bracket | Male | Female |
| 5 to 17 Years | 0 (0.0%) | 0 (0.0%) |
| 18 to 34 Years | 0 (0.0%) | 0 (0.0%) |
| 35 to 64 Years | 29 (6.4%) | 6 (1.3%) |
| 65 to 74 Years | 25 (12.8%) | 0 (0.0%) |
| 75 Years and over | 9 (8.9%) | 29 (14.9%) |
Technology Access in Dover Foxcroft
Computing Device Access in Dover Foxcroft
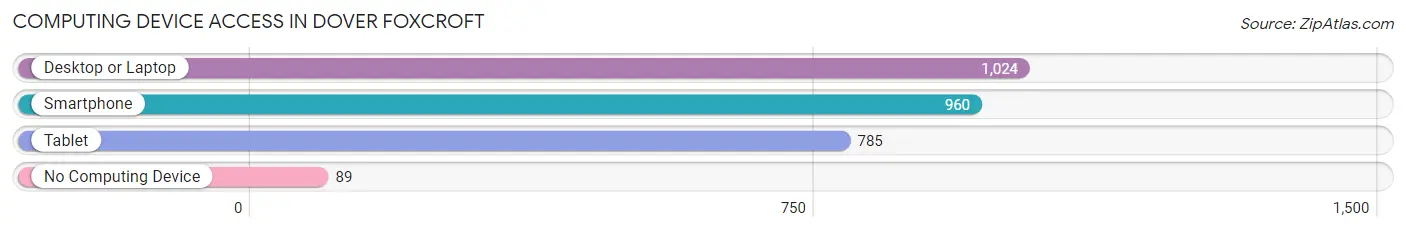
| Device Type | # Households | % Households |
| Desktop or Laptop | 1,024 | 82.4% |
| Smartphone | 960 | 77.2% |
| Tablet | 785 | 63.1% |
| No Computing Device | 89 | 7.2% |
| Total | 1,243 | 100.0% |
Internet Access in Dover Foxcroft
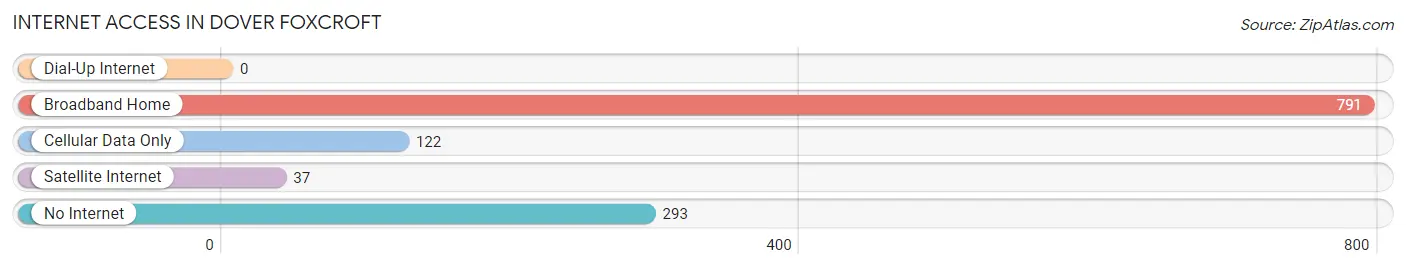
| Internet Type | # Households | % Households |
| Dial-Up Internet | 0 | 0.0% |
| Broadband Home | 791 | 63.6% |
| Cellular Data Only | 122 | 9.8% |
| Satellite Internet | 37 | 3.0% |
| No Internet | 293 | 23.6% |
| Total | 1,243 | 100.0% |
Dover Foxcroft Summary
Dover Foxcroft is a town located in Piscataquis County, Maine, United States. The population was 4,213 at the 2010 census. It is the county seat of Piscataquis County.
History
The area that is now Dover Foxcroft was first settled in 1794 by a group of settlers from Dover, New Hampshire. The town was incorporated in 1805 and named after the two towns from which the settlers had come.
The town was an important center of commerce and industry in the 19th century. It was home to several mills, including a sawmill, gristmill, and a woolen mill. The town was also home to a number of tanneries, which produced leather goods for the local market.
In the late 19th century, the town was home to a number of prominent citizens, including the poet Henry Wadsworth Longfellow, who wrote his famous poem “The Song of Hiawatha” while living in Dover Foxcroft.
Geography
Dover Foxcroft is located at 44°37′N 69°45′W (44.619, -69.749). According to the United States Census Bureau, the town has a total area of 28.2 square miles (73.1 km2), of which, 27.9 square miles (72.2 km2) of it is land and 0.3 square miles (0.9 km2) is water.
The town is located on the Piscataquis River, which flows through the center of town. The town is bordered by the towns of Milo to the north, Guilford to the east, and Sangerville to the south.
Economy
Dover Foxcroft is a rural community with a diverse economy. The town is home to several small businesses, including a number of retail stores, restaurants, and service providers. The town is also home to a number of manufacturing companies, including a paper mill, a wood products manufacturer, and a metal fabrication shop.
The town is also home to a number of agricultural operations, including dairy farms, apple orchards, and vegetable farms. The town is also home to a number of logging operations, which provide timber for the local paper mill.
Demographics
As of the census of 2010, there were 4,213 people, 1,817 households, and 1,093 families residing in the town. The population density was 150.7 people per square mile (58.2/km2). There were 2,039 housing units at an average density of 73.2 per square mile (28.3/km2). The racial makeup of the town was 97.2% White, 0.3% African American, 0.4% Native American, 0.3% Asian, 0.1% Pacific Islander, 0.3% from other races, and 1.4% from two or more races. Hispanic or Latino of any race were 0.9% of the population.
There were 1,817 households, out of which 25.2% had children under the age of 18 living with them, 44.2% were married couples living together, 11.7% had a female householder with no husband present, and 38.7% were non-families. 32.2% of all households were made up of individuals, and 14.2% had someone living alone who was 65 years of age or older. The average household size was 2.27 and the average family size was 2.83.
In the town, the population was spread out, with 22.2% under the age of 18, 8.2% from 18 to 24, 24.2% from 25 to 44, 27.2% from 45 to 64, and 18.2% who were 65 years of age or older. The median age was 41 years. For every 100 females, there were 91.2 males. For every 100 females age 18 and over, there were 88.2 males.
The median income for a household in the town was $30,938, and the median income for a family was $37,917. Males had a median income of $30,000 versus $21,964 for females. The per capita income for the town was $17,845. About 11.2% of families and 14.7% of the population were below the poverty line, including 19.2% of those under age 18 and 11.2% of those age 65 or over.
Common Questions
What is Per Capita Income in Dover Foxcroft?
Per Capita income in Dover Foxcroft is $28,327.
What is the Median Family Income in Dover Foxcroft?
Median Family Income in Dover Foxcroft is $60,331.
What is the Median Household income in Dover Foxcroft?
Median Household Income in Dover Foxcroft is $47,764.
What is Income or Wage Gap in Dover Foxcroft?
Income or Wage Gap in Dover Foxcroft is 48.8%.
Women in Dover Foxcroft earn 51.2 cents for every dollar earned by a man.
What is Inequality or Gini Index in Dover Foxcroft?
Inequality or Gini Index in Dover Foxcroft is 0.49.
What is the Total Population of Dover Foxcroft?
Total Population of Dover Foxcroft is 2,836.
What is the Total Male Population of Dover Foxcroft?
Total Male Population of Dover Foxcroft is 1,251.
What is the Total Female Population of Dover Foxcroft?
Total Female Population of Dover Foxcroft is 1,585.
What is the Ratio of Males per 100 Females in Dover Foxcroft?
There are 78.93 Males per 100 Females in Dover Foxcroft.
What is the Ratio of Females per 100 Males in Dover Foxcroft?
There are 126.70 Females per 100 Males in Dover Foxcroft.
What is the Median Population Age in Dover Foxcroft?
Median Population Age in Dover Foxcroft is 45.2 Years.
What is the Average Family Size in Dover Foxcroft
Average Family Size in Dover Foxcroft is 2.6 People.
What is the Average Household Size in Dover Foxcroft
Average Household Size in Dover Foxcroft is 2.1 People.
How Large is the Labor Force in Dover Foxcroft?
There are 1,173 People in the Labor Forcein in Dover Foxcroft.
What is the Percentage of People in the Labor Force in Dover Foxcroft?
50.6% of People are in the Labor Force in Dover Foxcroft.
What is the Unemployment Rate in Dover Foxcroft?
Unemployment Rate in Dover Foxcroft is 7.1%.