Machias, ME Map & Demographics
Machias Map
Machias Overview
$17,371
PER CAPITA INCOME
$41,688
AVG FAMILY INCOME
$25,278
AVG HOUSEHOLD INCOME
37.9%
WAGE / INCOME GAP [ % ]
62.1¢/ $1
WAGE / INCOME GAP [ $ ]
0.48
INEQUALITY / GINI INDEX
1,331
TOTAL POPULATION
618
MALE POPULATION
713
FEMALE POPULATION
86.68
MALES / 100 FEMALES
115.37
FEMALES / 100 MALES
52.2
MEDIAN AGE
2.8
AVG FAMILY SIZE
1.8
AVG HOUSEHOLD SIZE
474
LABOR FORCE [ PEOPLE ]
40.0%
PERCENT IN LABOR FORCE
8.6%
UNEMPLOYMENT RATE
Machias Zip Codes
Machias Area Codes
Income in Machias
Income Overview in Machias
Per Capita Income in Machias is $17,371, while median incomes of families and households are $41,688 and $25,278 respectively.
| Characteristic | Number | Measure |
| Per Capita Income | 1,331 | $17,371 |
| Median Family Income | 207 | $41,688 |
| Mean Family Income | 207 | $46,116 |
| Median Household Income | 584 | $25,278 |
| Mean Household Income | 584 | $35,772 |
| Income Deficit | 207 | $0 |
| Wage / Income Gap (%) | 1,331 | 37.94% |
| Wage / Income Gap ($) | 1,331 | 62.06¢ per $1 |
| Gini / Inequality Index | 1,331 | 0.48 |
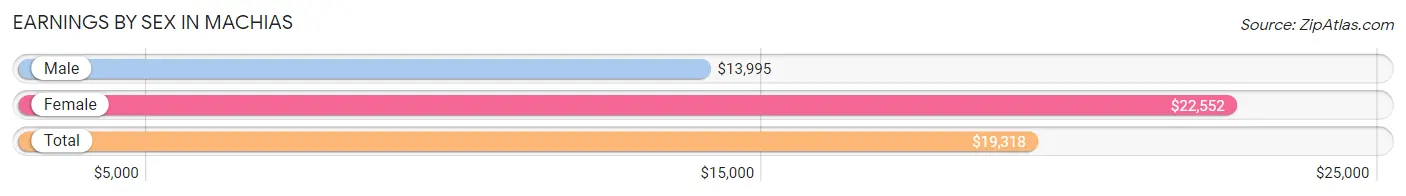
Earnings by Sex in Machias
Average Earnings in Machias are $19,318, $13,995 for men and $22,552 for women, a difference of 37.9%.
| Sex | Number | Average Earnings |
| Male | 259 (47.6%) | $13,995 |
| Female | 285 (52.4%) | $22,552 |
| Total | 544 (100.0%) | $19,318 |
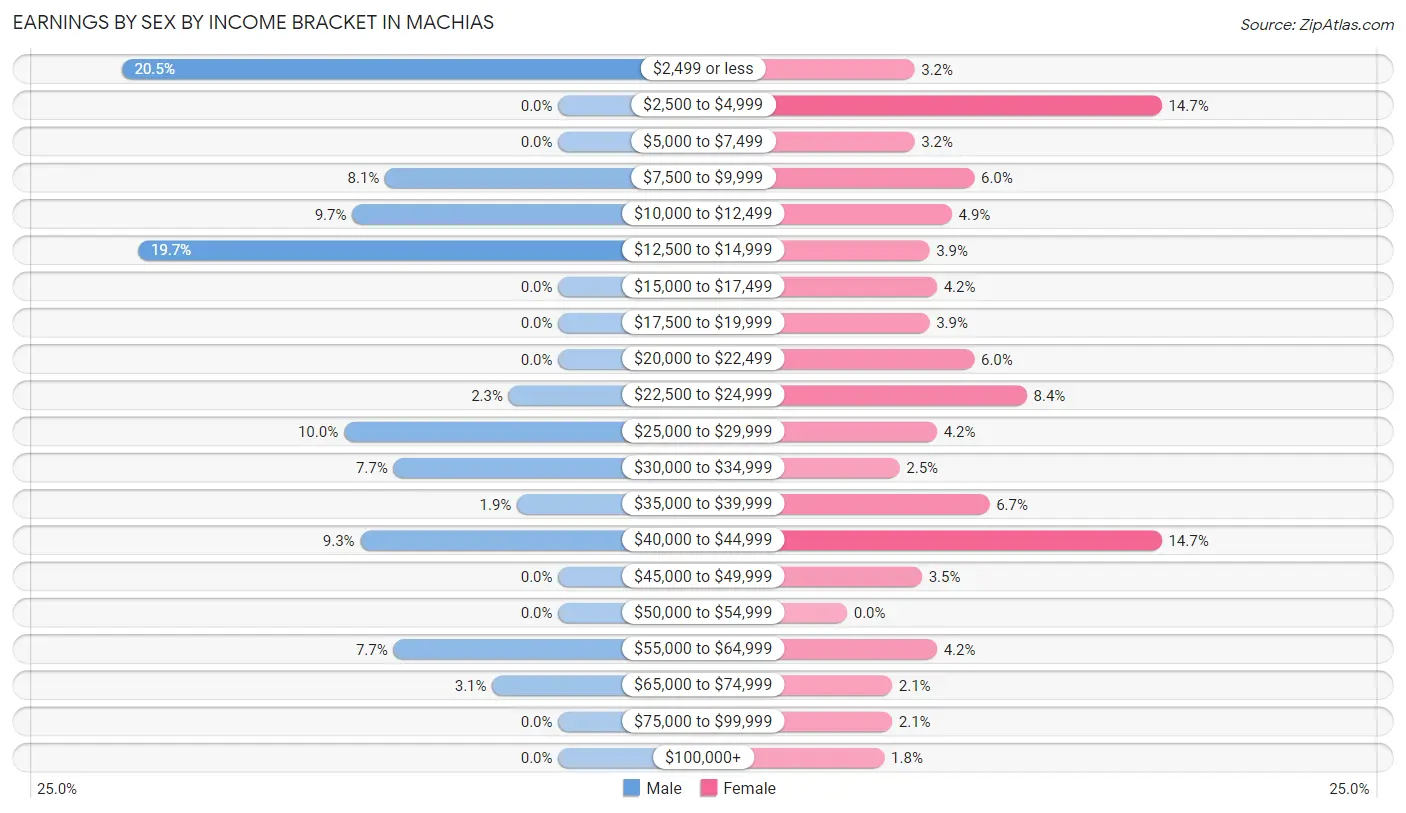
Earnings by Sex by Income Bracket in Machias
The most common earnings brackets in Machias are $2,499 or less for men (53 | 20.5%) and $2,500 to $4,999 for women (42 | 14.7%).
| Income | Male | Female |
| $2,499 or less | 53 (20.5%) | 9 (3.2%) |
| $2,500 to $4,999 | 0 (0.0%) | 42 (14.7%) |
| $5,000 to $7,499 | 0 (0.0%) | 9 (3.2%) |
| $7,500 to $9,999 | 21 (8.1%) | 17 (6.0%) |
| $10,000 to $12,499 | 25 (9.7%) | 14 (4.9%) |
| $12,500 to $14,999 | 51 (19.7%) | 11 (3.9%) |
| $15,000 to $17,499 | 0 (0.0%) | 12 (4.2%) |
| $17,500 to $19,999 | 0 (0.0%) | 11 (3.9%) |
| $20,000 to $22,499 | 0 (0.0%) | 17 (6.0%) |
| $22,500 to $24,999 | 6 (2.3%) | 24 (8.4%) |
| $25,000 to $29,999 | 26 (10.0%) | 12 (4.2%) |
| $30,000 to $34,999 | 20 (7.7%) | 7 (2.5%) |
| $35,000 to $39,999 | 5 (1.9%) | 19 (6.7%) |
| $40,000 to $44,999 | 24 (9.3%) | 42 (14.7%) |
| $45,000 to $49,999 | 0 (0.0%) | 10 (3.5%) |
| $50,000 to $54,999 | 0 (0.0%) | 0 (0.0%) |
| $55,000 to $64,999 | 20 (7.7%) | 12 (4.2%) |
| $65,000 to $74,999 | 8 (3.1%) | 6 (2.1%) |
| $75,000 to $99,999 | 0 (0.0%) | 6 (2.1%) |
| $100,000+ | 0 (0.0%) | 5 (1.8%) |
| Total | 259 (100.0%) | 285 (100.0%) |
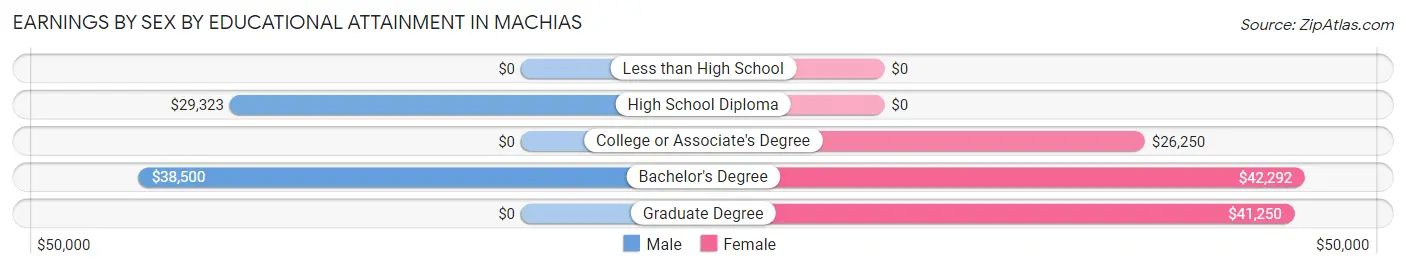
Earnings by Sex by Educational Attainment in Machias
Average earnings in Machias are $28,798 for men and $25,729 for women, a difference of 10.7%. Men with an educational attainment of bachelor's degree enjoy the highest average annual earnings of $38,500, while those with high school diploma education earn the least with $29,323. Women with an educational attainment of bachelor's degree earn the most with the average annual earnings of $42,292, while those with college or associate's degree education have the smallest earnings of $26,250.
| Educational Attainment | Male Income | Female Income |
| Less than High School | - | - |
| High School Diploma | $29,323 | $0 |
| College or Associate's Degree | - | - |
| Bachelor's Degree | $38,500 | $42,292 |
| Graduate Degree | - | - |
| Total | $28,798 | $25,729 |
Family Income in Machias
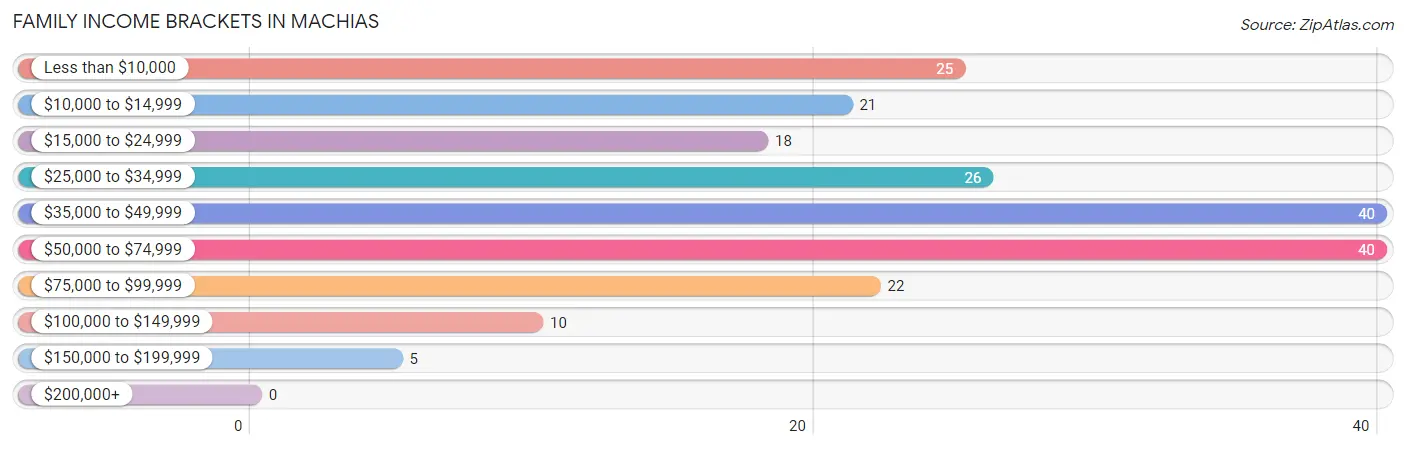
Family Income Brackets in Machias
According to the Machias family income data, there are 40 families falling into the $35,000 to $49,999 income range, which is the most common income bracket and makes up 19.3% of all families.
| Income Bracket | # Families | % Families |
| Less than $10,000 | 25 | 12.1% |
| $10,000 to $14,999 | 21 | 10.1% |
| $15,000 to $24,999 | 18 | 8.7% |
| $25,000 to $34,999 | 26 | 12.6% |
| $35,000 to $49,999 | 40 | 19.3% |
| $50,000 to $74,999 | 40 | 19.3% |
| $75,000 to $99,999 | 22 | 10.6% |
| $100,000 to $149,999 | 10 | 4.8% |
| $150,000 to $199,999 | 5 | 2.4% |
| $200,000+ | 0 | 0.0% |
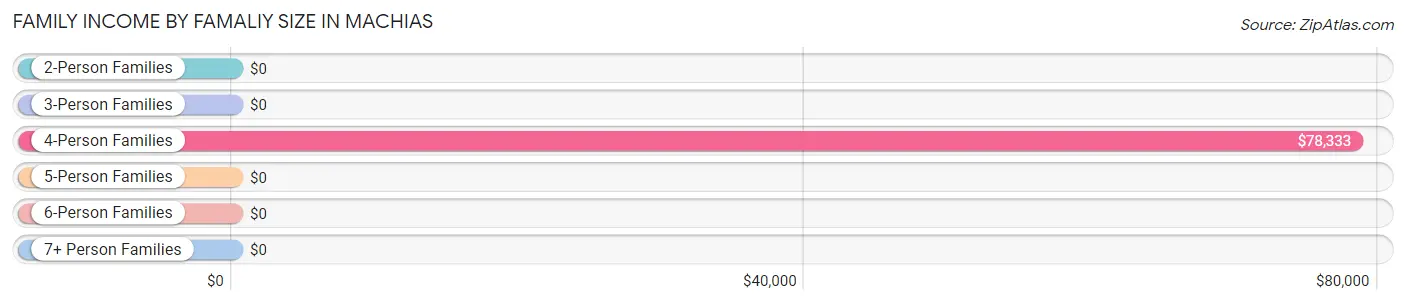
Family Income by Famaliy Size in Machias
4-person families (16 | 7.7%) account for the highest median family income in Machias with $78,333 per family, while 4-person families (16 | 7.7%) have the highest median income of $19,583 per family member.
| Income Bracket | # Families | Median Income |
| 2-Person Families | 139 (67.1%) | $0 |
| 3-Person Families | 39 (18.8%) | $0 |
| 4-Person Families | 16 (7.7%) | $78,333 |
| 5-Person Families | 0 (0.0%) | $0 |
| 6-Person Families | 13 (6.3%) | $0 |
| 7+ Person Families | 0 (0.0%) | $0 |
| Total | 207 (100.0%) | $41,688 |
Family Income by Number of Earners in Machias
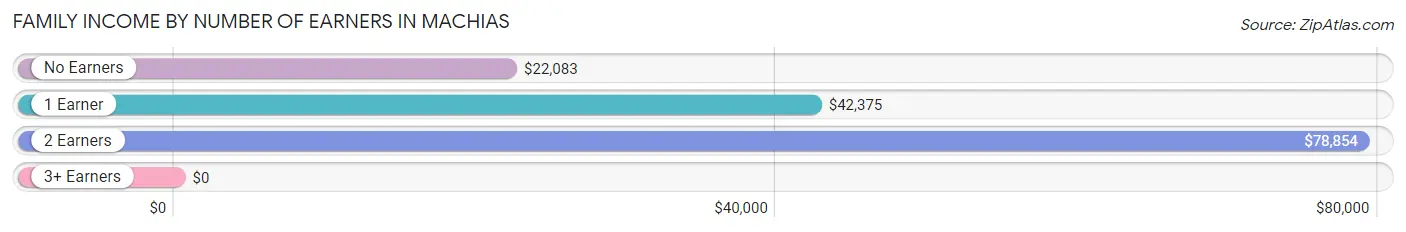
| Number of Earners | # Families | Median Income |
| No Earners | 76 (36.7%) | $22,083 |
| 1 Earner | 74 (35.7%) | $42,375 |
| 2 Earners | 53 (25.6%) | $78,854 |
| 3+ Earners | 4 (1.9%) | $0 |
| Total | 207 (100.0%) | $41,688 |
Household Income in Machias
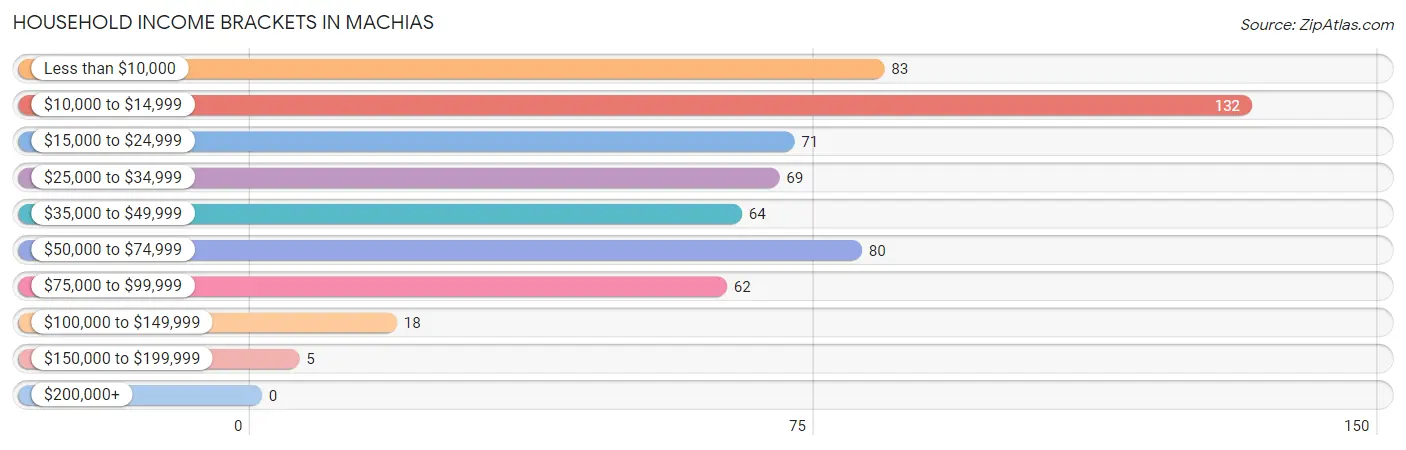
Household Income Brackets in Machias
With 132 households falling in the category, the $10,000 to $14,999 income range is the most frequent in Machias, accounting for 22.6% of all households.
| Income Bracket | # Households | % Households |
| Less than $10,000 | 83 | 14.2% |
| $10,000 to $14,999 | 132 | 22.6% |
| $15,000 to $24,999 | 71 | 12.2% |
| $25,000 to $34,999 | 69 | 11.8% |
| $35,000 to $49,999 | 64 | 11.0% |
| $50,000 to $74,999 | 80 | 13.7% |
| $75,000 to $99,999 | 62 | 10.6% |
| $100,000 to $149,999 | 18 | 3.1% |
| $150,000 to $199,999 | 5 | 0.9% |
| $200,000+ | 0 | 0.0% |
Household Income by Householder Age in Machias
The median household income in Machias is $25,278, with the highest median household income of $26,221 found in the 45 to 64 years age bracket for the primary householder. A total of 208 households (35.6%) fall into this category. Meanwhile, the 15 to 24 years age bracket for the primary householder has the lowest median household income of $0, with 32 households (5.5%) in this group.

| Income Bracket | # Households | Median Income |
| 15 to 24 Years | 32 (5.5%) | $0 |
| 25 to 44 Years | 143 (24.5%) | $0 |
| 45 to 64 Years | 208 (35.6%) | $26,221 |
| 65+ Years | 201 (34.4%) | $20,083 |
| Total | 584 (100.0%) | $25,278 |
Poverty in Machias
Income Below Poverty by Sex and Age in Machias
With 33.6% poverty level for males and 38.4% for females among the residents of Machias, 16 and 17 year old males and under 5 year old females are the most vulnerable to poverty, with 6 males (100.0%) and 6 females (100.0%) in their respective age groups living below the poverty level.
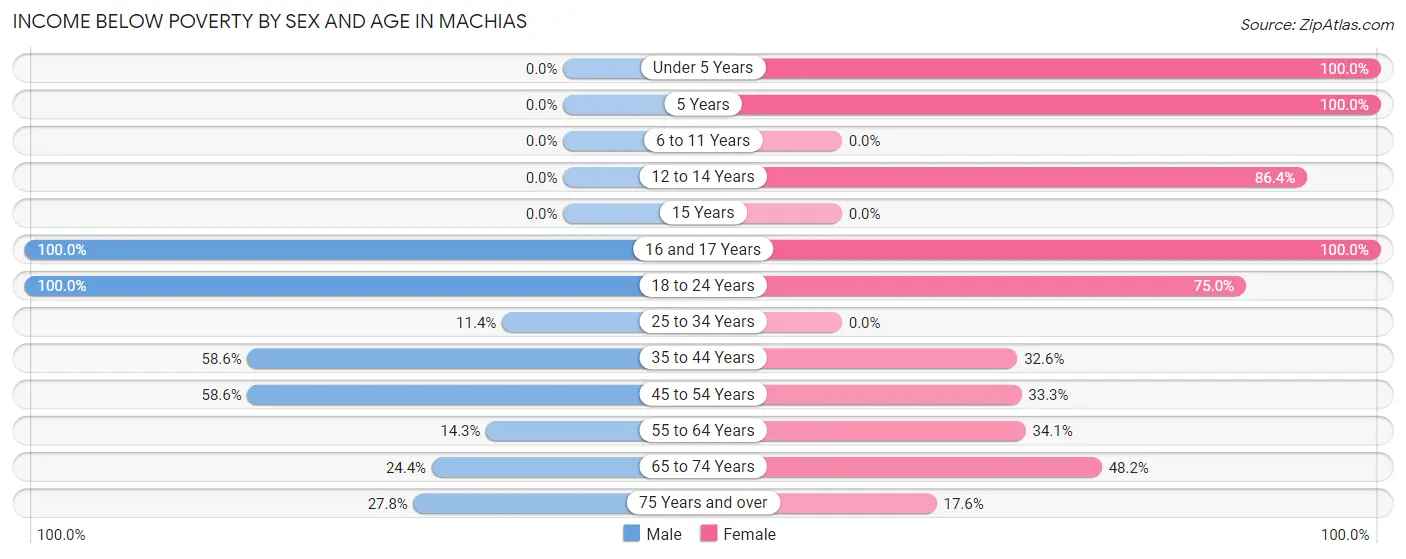
| Age Bracket | Male | Female |
| Under 5 Years | 0 (0.0%) | 6 (100.0%) |
| 5 Years | 0 (0.0%) | 8 (100.0%) |
| 6 to 11 Years | 0 (0.0%) | 0 (0.0%) |
| 12 to 14 Years | 0 (0.0%) | 38 (86.4%) |
| 15 Years | 0 (0.0%) | 0 (0.0%) |
| 16 and 17 Years | 6 (100.0%) | 8 (100.0%) |
| 18 to 24 Years | 25 (100.0%) | 21 (75.0%) |
| 25 to 34 Years | 5 (11.4%) | 0 (0.0%) |
| 35 to 44 Years | 51 (58.6%) | 28 (32.6%) |
| 45 to 54 Years | 34 (58.6%) | 18 (33.3%) |
| 55 to 64 Years | 13 (14.3%) | 44 (34.1%) |
| 65 to 74 Years | 10 (24.4%) | 41 (48.2%) |
| 75 Years and over | 5 (27.8%) | 19 (17.6%) |
| Total | 149 (33.6%) | 231 (38.4%) |
Income Above Poverty by Sex and Age in Machias
According to the poverty statistics in Machias, males aged under 5 years and females aged 6 to 11 years are the age groups that are most secure financially, with 100.0% of males and 100.0% of females in these age groups living above the poverty line.
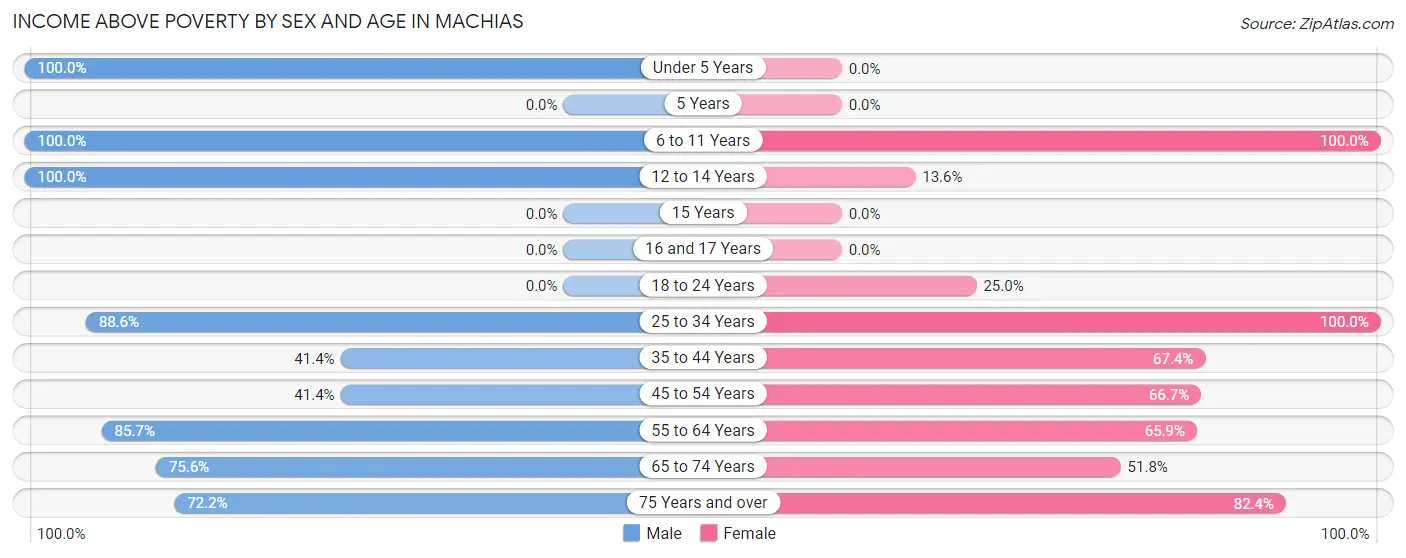
| Age Bracket | Male | Female |
| Under 5 Years | 21 (100.0%) | 0 (0.0%) |
| 5 Years | 0 (0.0%) | 0 (0.0%) |
| 6 to 11 Years | 46 (100.0%) | 13 (100.0%) |
| 12 to 14 Years | 7 (100.0%) | 6 (13.6%) |
| 15 Years | 0 (0.0%) | 0 (0.0%) |
| 16 and 17 Years | 0 (0.0%) | 0 (0.0%) |
| 18 to 24 Years | 0 (0.0%) | 7 (25.0%) |
| 25 to 34 Years | 39 (88.6%) | 33 (100.0%) |
| 35 to 44 Years | 36 (41.4%) | 58 (67.4%) |
| 45 to 54 Years | 24 (41.4%) | 36 (66.7%) |
| 55 to 64 Years | 78 (85.7%) | 85 (65.9%) |
| 65 to 74 Years | 31 (75.6%) | 44 (51.8%) |
| 75 Years and over | 13 (72.2%) | 89 (82.4%) |
| Total | 295 (66.4%) | 371 (61.6%) |
Income Below Poverty Among Married-Couple Families in Machias
The poverty statistics for married-couple families in Machias show that 11.8% or 13 of the total 110 families live below the poverty line. Families with no children have the highest poverty rate of 14.3%, comprising of 13 families. On the other hand, families with 1 or 2 children have the lowest poverty rate of 0.0%, which includes 0 families.
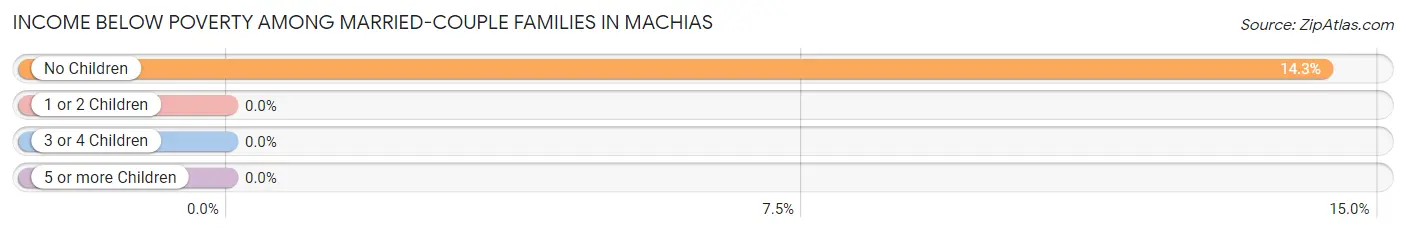
| Children | Above Poverty | Below Poverty |
| No Children | 78 (85.7%) | 13 (14.3%) |
| 1 or 2 Children | 19 (100.0%) | 0 (0.0%) |
| 3 or 4 Children | 0 (0.0%) | 0 (0.0%) |
| 5 or more Children | 0 (0.0%) | 0 (0.0%) |
| Total | 97 (88.2%) | 13 (11.8%) |
Income Below Poverty Among Single-Parent Households in Machias
According to the poverty data in Machias, 41.2% or 7 single-father households and 55.0% or 44 single-mother households are living below the poverty line. Among single-father households, those with 1 or 2 children have the highest poverty rate, with 7 households (100.0%) experiencing poverty. Likewise, among single-mother households, those with 5 or more children have the highest poverty rate, with 7 households (100.0%) falling below the poverty line.
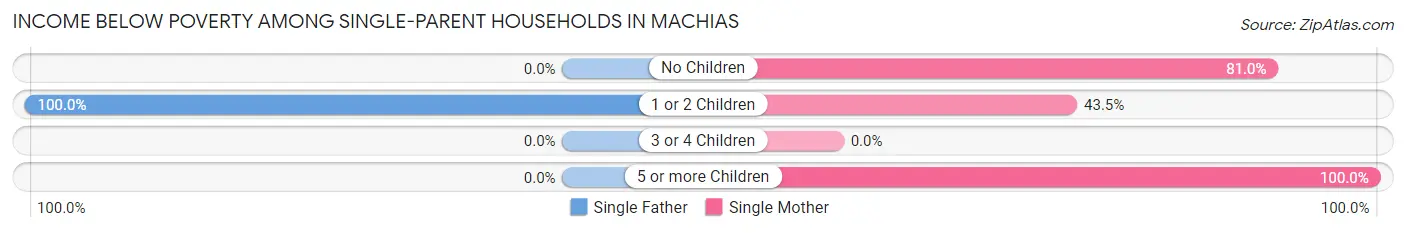
| Children | Single Father | Single Mother |
| No Children | 0 (0.0%) | 17 (80.9%) |
| 1 or 2 Children | 7 (100.0%) | 20 (43.5%) |
| 3 or 4 Children | 0 (0.0%) | 0 (0.0%) |
| 5 or more Children | 0 (0.0%) | 7 (100.0%) |
| Total | 7 (41.2%) | 44 (55.0%) |
Income Below Poverty Among Married-Couple vs Single-Parent Households in Machias
The poverty data for Machias shows that 13 of the married-couple family households (11.8%) and 51 of the single-parent households (52.6%) are living below the poverty level. Within the married-couple family households, those with no children have the highest poverty rate, with 13 households (14.3%) falling below the poverty line. Among the single-parent households, those with 5 or more children have the highest poverty rate, with 7 household (100.0%) living below poverty.
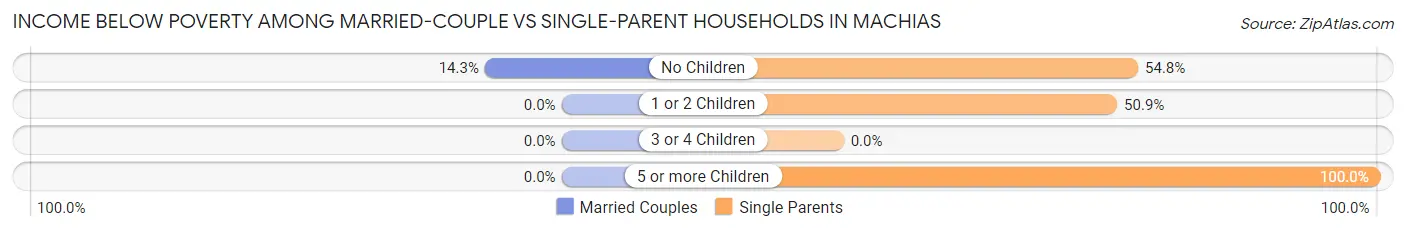
| Children | Married-Couple Families | Single-Parent Households |
| No Children | 13 (14.3%) | 17 (54.8%) |
| 1 or 2 Children | 0 (0.0%) | 27 (50.9%) |
| 3 or 4 Children | 0 (0.0%) | 0 (0.0%) |
| 5 or more Children | 0 (0.0%) | 7 (100.0%) |
| Total | 13 (11.8%) | 51 (52.6%) |
Race in Machias
The most populous races in Machias are White / Caucasian (1,251 | 94.0%), Two or more Races (44 | 3.3%), and Native / Alaskan (25 | 1.9%).
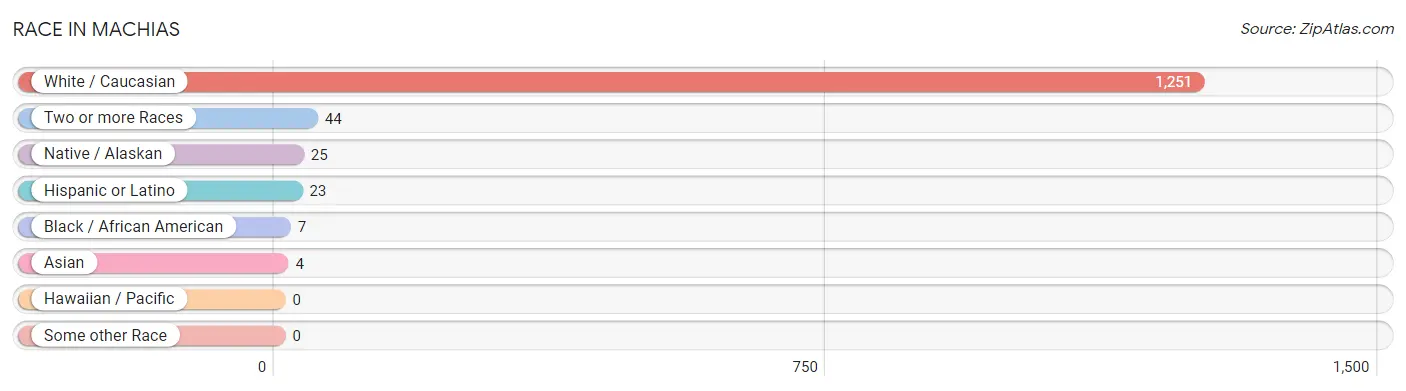
| Race | # Population | % Population |
| Asian | 4 | 0.3% |
| Black / African American | 7 | 0.5% |
| Hawaiian / Pacific | 0 | 0.0% |
| Hispanic or Latino | 23 | 1.7% |
| Native / Alaskan | 25 | 1.9% |
| White / Caucasian | 1,251 | 94.0% |
| Two or more Races | 44 | 3.3% |
| Some other Race | 0 | 0.0% |
| Total | 1,331 | 100.0% |
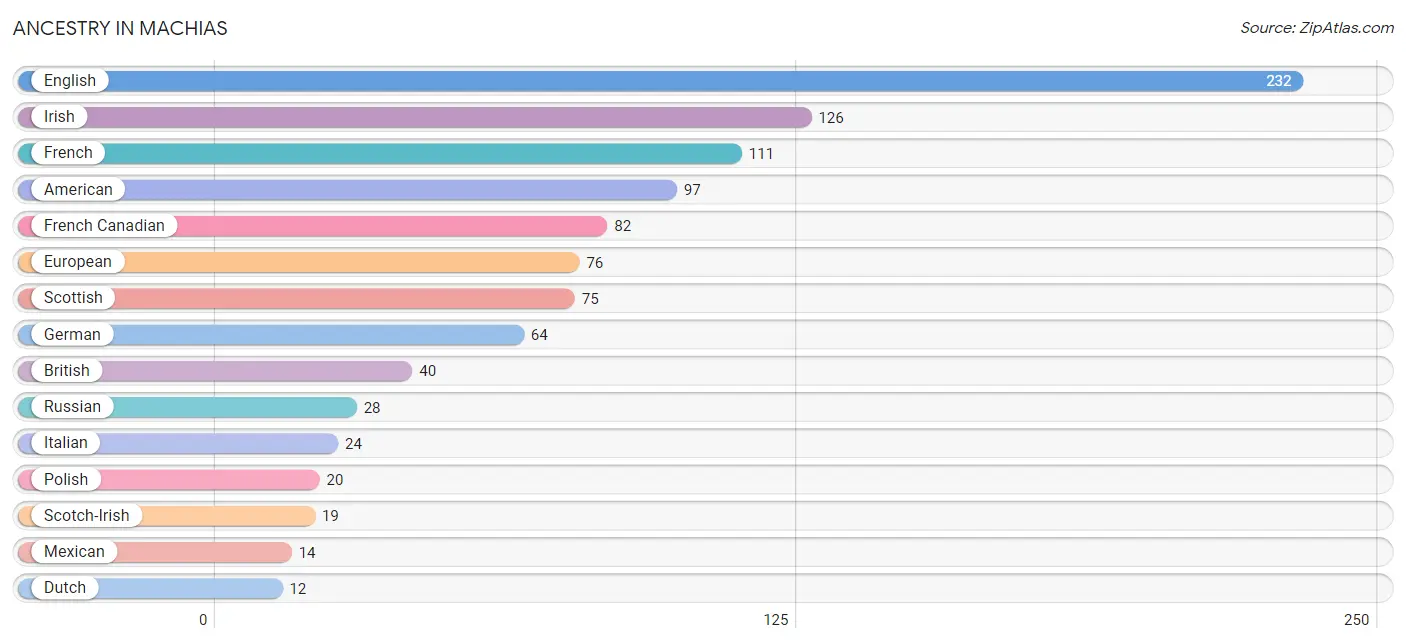
Ancestry in Machias
The most populous ancestries reported in Machias are English (232 | 17.4%), Irish (126 | 9.5%), French (111 | 8.3%), American (97 | 7.3%), and French Canadian (82 | 6.2%), together accounting for 48.7% of all Machias residents.
| Ancestry | # Population | % Population |
| American | 97 | 7.3% |
| British | 40 | 3.0% |
| Burmese | 6 | 0.4% |
| Dominican | 4 | 0.3% |
| Dutch | 12 | 0.9% |
| English | 232 | 17.4% |
| European | 76 | 5.7% |
| French | 111 | 8.3% |
| French Canadian | 82 | 6.2% |
| German | 64 | 4.8% |
| Greek | 3 | 0.2% |
| Indian (Asian) | 9 | 0.7% |
| Irish | 126 | 9.5% |
| Italian | 24 | 1.8% |
| Lithuanian | 9 | 0.7% |
| Mexican | 14 | 1.1% |
| Native Hawaiian | 4 | 0.3% |
| Northern European | 10 | 0.7% |
| Norwegian | 8 | 0.6% |
| Polish | 20 | 1.5% |
| Russian | 28 | 2.1% |
| Scotch-Irish | 19 | 1.4% |
| Scottish | 75 | 5.6% |
| Slavic | 2 | 0.2% |
| South American | 5 | 0.4% |
| Sri Lankan | 4 | 0.3% |
| Swedish | 10 | 0.7% |
| Ukrainian | 3 | 0.2% |
| Uruguayan | 5 | 0.4% | View All 29 Rows |
Immigrants in Machias
The most numerous immigrant groups reported in Machias came from , and Canada (12 | 0.9%), together accounting for 0.9% of all Machias residents.

| Immigration Origin | # Population | % Population |
| Canada | 12 | 0.9% | View All 1 Rows |
Sex and Age in Machias
Sex and Age in Machias
The most populous age groups in Machias are 35 to 39 Years (77 | 12.5%) for men and 55 to 59 Years (89 | 12.5%) for women.
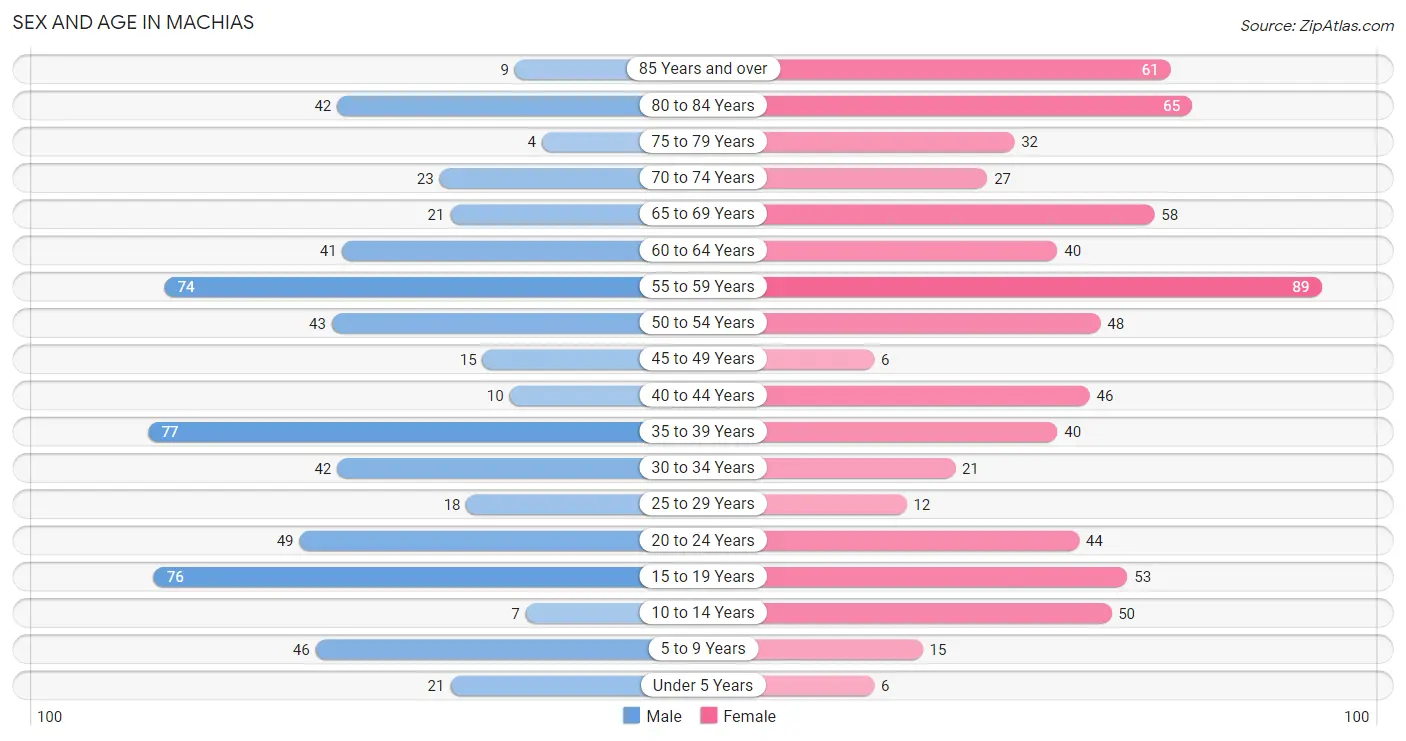
| Age Bracket | Male | Female |
| Under 5 Years | 21 (3.4%) | 6 (0.8%) |
| 5 to 9 Years | 46 (7.4%) | 15 (2.1%) |
| 10 to 14 Years | 7 (1.1%) | 50 (7.0%) |
| 15 to 19 Years | 76 (12.3%) | 53 (7.4%) |
| 20 to 24 Years | 49 (7.9%) | 44 (6.2%) |
| 25 to 29 Years | 18 (2.9%) | 12 (1.7%) |
| 30 to 34 Years | 42 (6.8%) | 21 (2.9%) |
| 35 to 39 Years | 77 (12.5%) | 40 (5.6%) |
| 40 to 44 Years | 10 (1.6%) | 46 (6.5%) |
| 45 to 49 Years | 15 (2.4%) | 6 (0.8%) |
| 50 to 54 Years | 43 (7.0%) | 48 (6.7%) |
| 55 to 59 Years | 74 (12.0%) | 89 (12.5%) |
| 60 to 64 Years | 41 (6.6%) | 40 (5.6%) |
| 65 to 69 Years | 21 (3.4%) | 58 (8.1%) |
| 70 to 74 Years | 23 (3.7%) | 27 (3.8%) |
| 75 to 79 Years | 4 (0.6%) | 32 (4.5%) |
| 80 to 84 Years | 42 (6.8%) | 65 (9.1%) |
| 85 Years and over | 9 (1.5%) | 61 (8.6%) |
| Total | 618 (100.0%) | 713 (100.0%) |
Families and Households in Machias
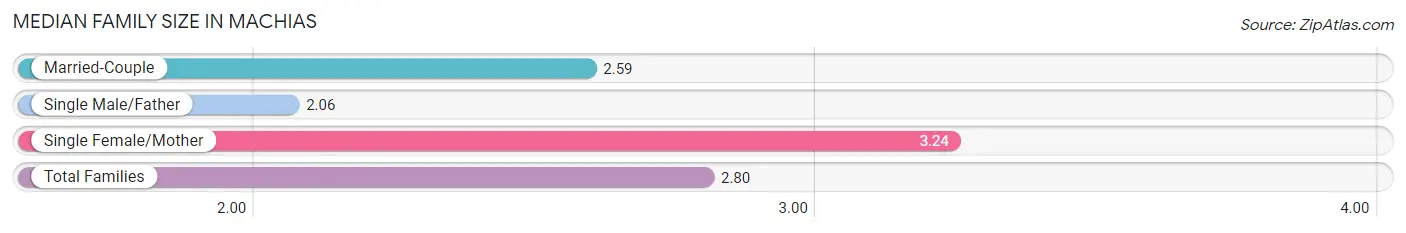
Median Family Size in Machias
The median family size in Machias is 2.80 persons per family, with single female/mother families (80 | 38.7%) accounting for the largest median family size of 3.24 persons per family. On the other hand, single male/father families (17 | 8.2%) represent the smallest median family size with 2.06 persons per family.
| Family Type | # Families | Family Size |
| Married-Couple | 110 (53.1%) | 2.59 |
| Single Male/Father | 17 (8.2%) | 2.06 |
| Single Female/Mother | 80 (38.7%) | 3.24 |
| Total Families | 207 (100.0%) | 2.80 |
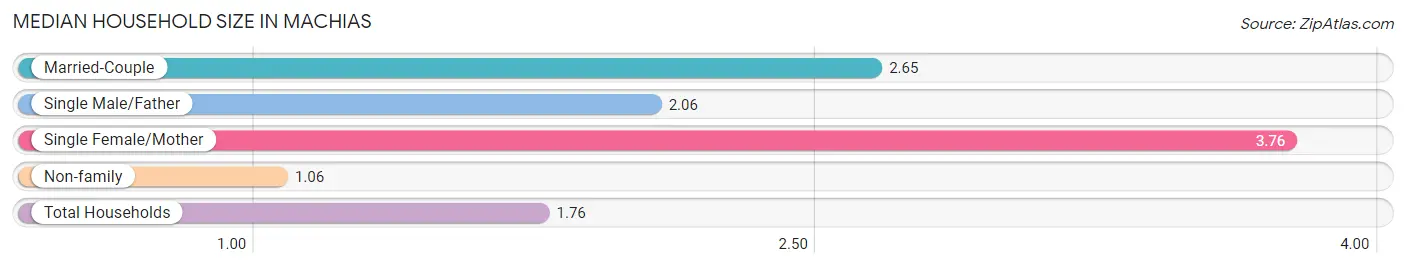
Median Household Size in Machias
The median household size in Machias is 1.76 persons per household, with single female/mother households (80 | 13.7%) accounting for the largest median household size of 3.76 persons per household. non-family households (377 | 64.5%) represent the smallest median household size with 1.06 persons per household.
| Household Type | # Households | Household Size |
| Married-Couple | 110 (18.8%) | 2.65 |
| Single Male/Father | 17 (2.9%) | 2.06 |
| Single Female/Mother | 80 (13.7%) | 3.76 |
| Non-family | 377 (64.5%) | 1.06 |
| Total Households | 584 (100.0%) | 1.76 |
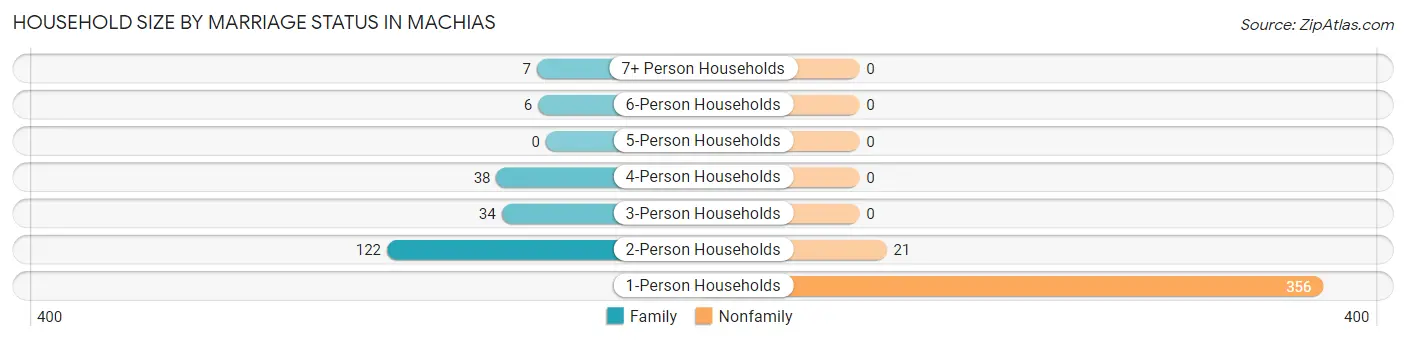
Household Size by Marriage Status in Machias
Out of a total of 584 households in Machias, 207 (35.4%) are family households, while 377 (64.5%) are nonfamily households. The most numerous type of family households are 2-person households, comprising 122, and the most common type of nonfamily households are 1-person households, comprising 356.
| Household Size | Family Households | Nonfamily Households |
| 1-Person Households | - | 356 (61.0%) |
| 2-Person Households | 122 (20.9%) | 21 (3.6%) |
| 3-Person Households | 34 (5.8%) | 0 (0.0%) |
| 4-Person Households | 38 (6.5%) | 0 (0.0%) |
| 5-Person Households | 0 (0.0%) | 0 (0.0%) |
| 6-Person Households | 6 (1.0%) | 0 (0.0%) |
| 7+ Person Households | 7 (1.2%) | 0 (0.0%) |
| Total | 207 (35.4%) | 377 (64.5%) |
Female Fertility in Machias
Fertility by Age in Machias
| Age Bracket | Women with Births | Births / 1,000 Women |
| 15 to 19 years | 0 (0.0%) | 0.0 |
| 20 to 34 years | 0 (0.0%) | 0.0 |
| 35 to 50 years | 0 (0.0%) | 0.0 |
| Total | 0 (0.0%) | 0.0 |
Fertility by Age by Marriage Status in Machias
| Age Bracket | Married | Unmarried |
| 15 to 19 years | 0 (0.0%) | 0 (0.0%) |
| 20 to 34 years | 0 (0.0%) | 0 (0.0%) |
| 35 to 50 years | 0 (0.0%) | 0 (0.0%) |
| Total | 0 (0.0%) | 0 (0.0%) |
Fertility by Education in Machias
| Educational Attainment | Women with Births | Births / 1,000 Women |
| Less than High School | 0 (0.0%) | 0.0 |
| High School Diploma | 0 (0.0%) | 0.0 |
| College or Associate's Degree | 0 (0.0%) | 0.0 |
| Bachelor's Degree | 0 (0.0%) | 0.0 |
| Graduate Degree | 0 (0.0%) | 0.0 |
| Total | 0 (0.0%) | 0.0 |
Fertility by Education by Marriage Status in Machias
| Educational Attainment | Married | Unmarried |
| Less than High School | 0 (0.0%) | 0 (0.0%) |
| High School Diploma | 0 (0.0%) | 0 (0.0%) |
| College or Associate's Degree | 0 (0.0%) | 0 (0.0%) |
| Bachelor's Degree | 0 (0.0%) | 0 (0.0%) |
| Graduate Degree | 0 (0.0%) | 0 (0.0%) |
| Total | 0 (0.0%) | 0 (0.0%) |
Employment Characteristics in Machias
Employment by Class of Employer in Machias
Among the 414 employed individuals in Machias, private company employees (151 | 36.5%), not-for-profit organizations (82 | 19.8%), and state government employees (65 | 15.7%) make up the most common classes of employment.
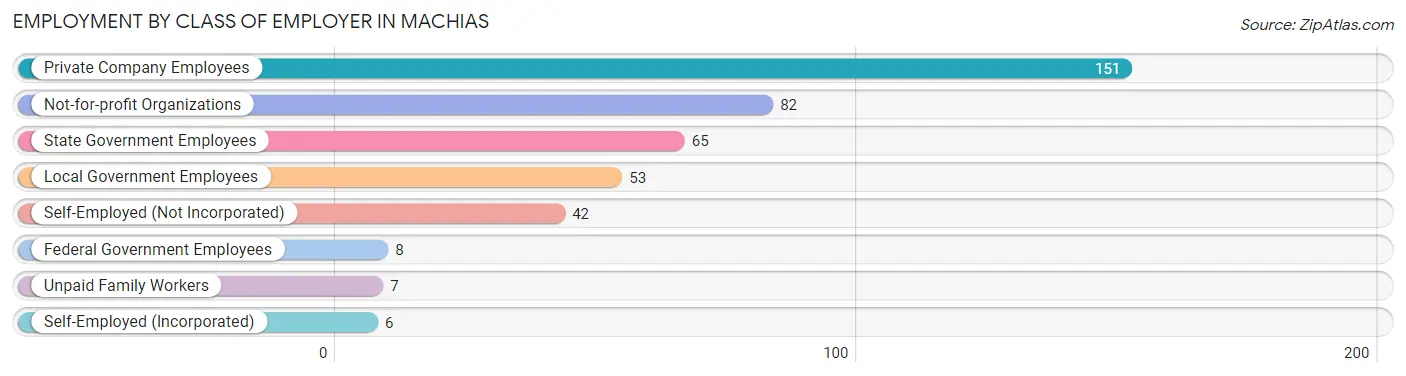
| Employer Class | # Employees | % Employees |
| Private Company Employees | 151 | 36.5% |
| Self-Employed (Incorporated) | 6 | 1.5% |
| Self-Employed (Not Incorporated) | 42 | 10.1% |
| Not-for-profit Organizations | 82 | 19.8% |
| Local Government Employees | 53 | 12.8% |
| State Government Employees | 65 | 15.7% |
| Federal Government Employees | 8 | 1.9% |
| Unpaid Family Workers | 7 | 1.7% |
| Total | 414 | 100.0% |
Employment Status by Age in Machias
According to the labor force statistics for Machias, out of the total population over 16 years of age (1,186), 40.0% or 474 individuals are in the labor force, with 8.6% or 41 of them unemployed. The age group with the highest labor force participation rate is 30 to 34 years, with 82.5% or 52 individuals in the labor force. Within the labor force, the 20 to 24 years age range has the highest percentage of unemployed individuals, with 53.2% or 25 of them being unemployed.
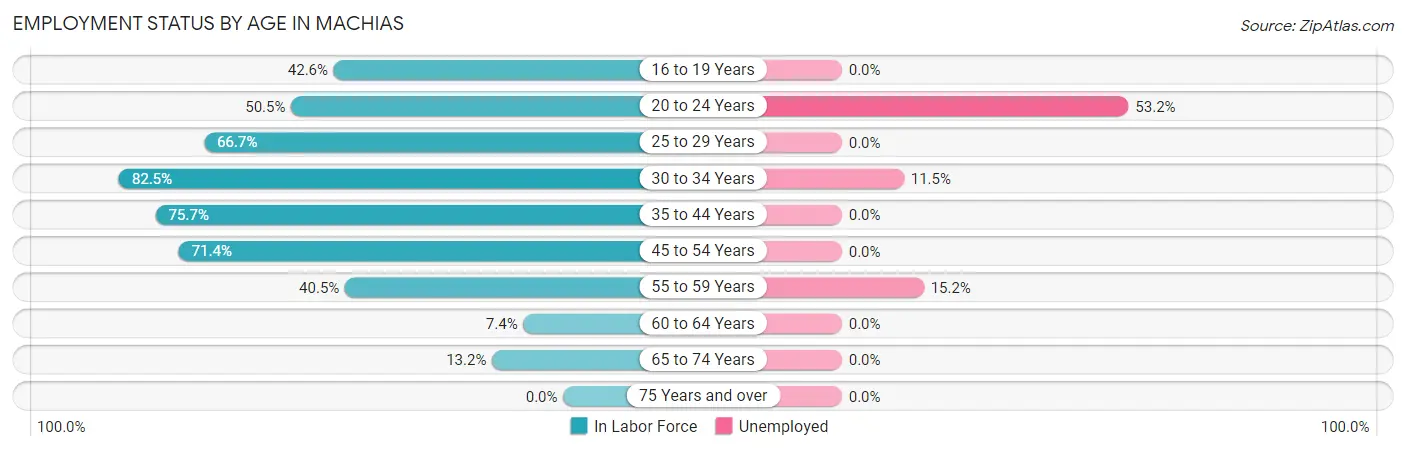
| Age Bracket | In Labor Force | Unemployed |
| 16 to 19 Years | 55 (42.6%) | 0 (0.0%) |
| 20 to 24 Years | 47 (50.5%) | 25 (53.2%) |
| 25 to 29 Years | 20 (66.7%) | 0 (0.0%) |
| 30 to 34 Years | 52 (82.5%) | 6 (11.5%) |
| 35 to 44 Years | 131 (75.7%) | 0 (0.0%) |
| 45 to 54 Years | 80 (71.4%) | 0 (0.0%) |
| 55 to 59 Years | 66 (40.5%) | 10 (15.2%) |
| 60 to 64 Years | 6 (7.4%) | 0 (0.0%) |
| 65 to 74 Years | 17 (13.2%) | 0 (0.0%) |
| 75 Years and over | 0 (0.0%) | 0 (0.0%) |
| Total | 474 (40.0%) | 41 (8.6%) |
Employment Status by Educational Attainment in Machias
According to labor force statistics for Machias, 57.1% of individuals (355) out of the total population between 25 and 64 years of age (622) are in the labor force, with 4.5% or 16 of them being unemployed. The group with the highest labor force participation rate are those with the educational attainment of bachelor's degree or higher, with 85.3% or 99 individuals in the labor force. Within the labor force, individuals with high school diploma education have the highest percentage of unemployment, with 7.4% or 10 of them being unemployed.
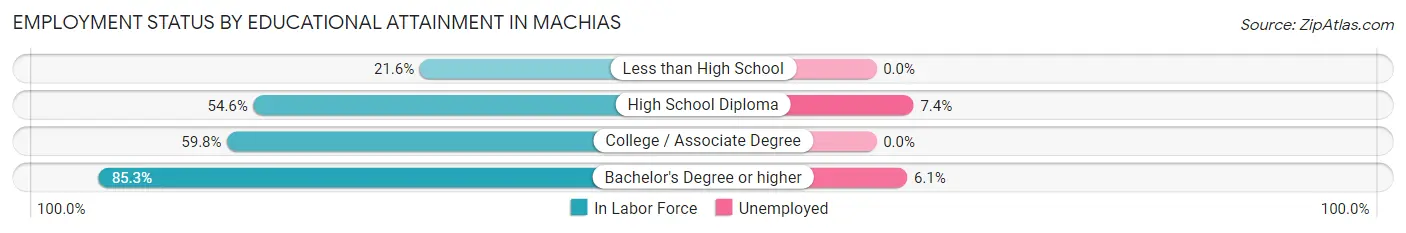
| Educational Attainment | In Labor Force | Unemployed |
| Less than High School | 19 (21.6%) | 0 (0.0%) |
| High School Diploma | 136 (54.6%) | 18 (7.4%) |
| College / Associate Degree | 101 (59.8%) | 0 (0.0%) |
| Bachelor's Degree or higher | 99 (85.3%) | 7 (6.1%) |
| Total | 355 (57.1%) | 28 (4.5%) |
Employment Occupations by Sex in Machias
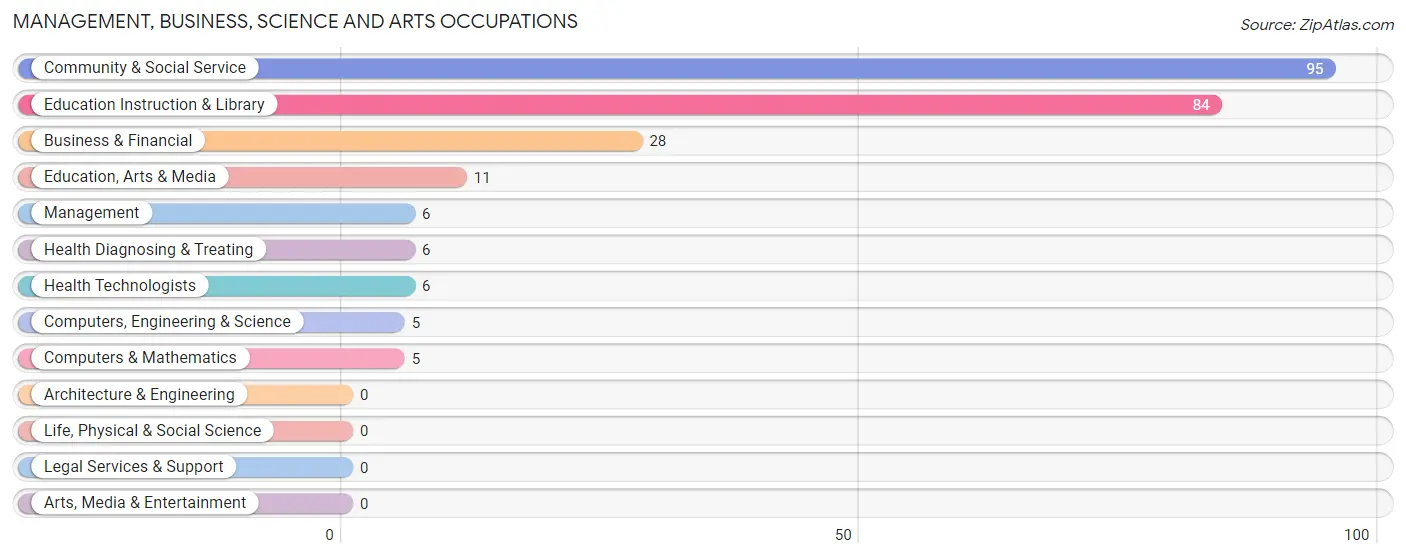
Management, Business, Science and Arts Occupations
The most common Management, Business, Science and Arts occupations in Machias are Community & Social Service (95 | 21.9%), Education Instruction & Library (84 | 19.4%), Business & Financial (28 | 6.5%), Education, Arts & Media (11 | 2.5%), and Management (6 | 1.4%).
Management, Business, Science and Arts Occupations by Sex
Within the Management, Business, Science and Arts occupations in Machias, the most male-oriented occupations are Education Instruction & Library (42.9%), Community & Social Service (37.9%), and Business & Financial (21.4%), while the most female-oriented occupations are Management (100.0%), Computers, Engineering & Science (100.0%), and Computers & Mathematics (100.0%).
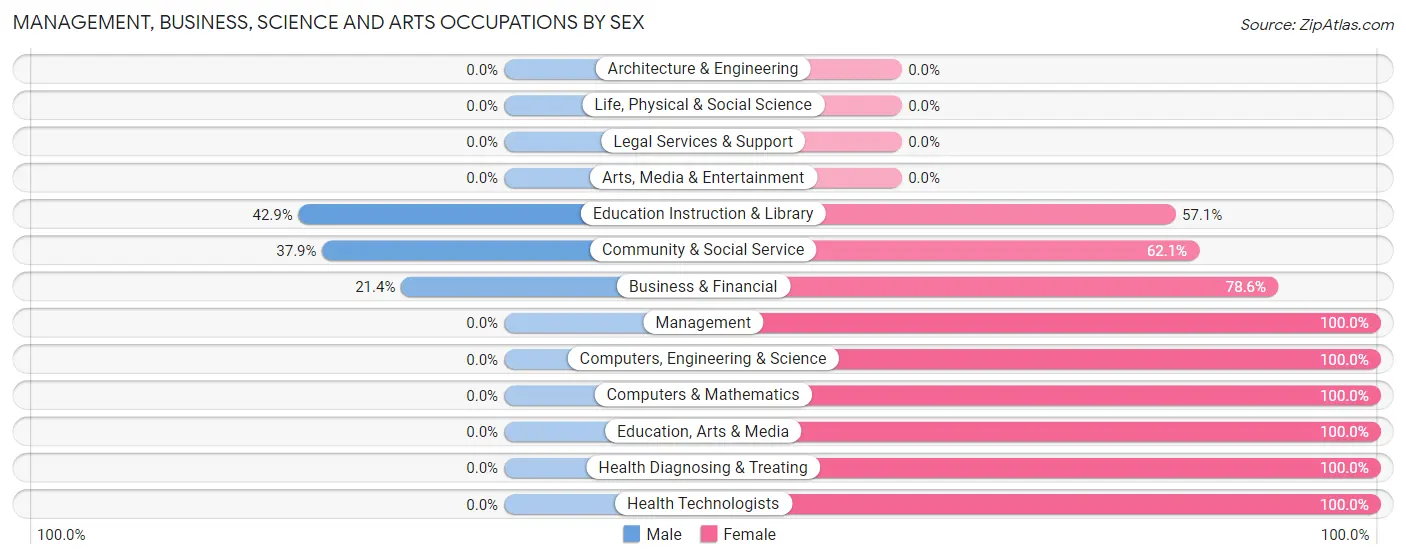
| Occupation | Male | Female |
| Management | 0 (0.0%) | 6 (100.0%) |
| Business & Financial | 6 (21.4%) | 22 (78.6%) |
| Computers, Engineering & Science | 0 (0.0%) | 5 (100.0%) |
| Computers & Mathematics | 0 (0.0%) | 5 (100.0%) |
| Architecture & Engineering | 0 (0.0%) | 0 (0.0%) |
| Life, Physical & Social Science | 0 (0.0%) | 0 (0.0%) |
| Community & Social Service | 36 (37.9%) | 59 (62.1%) |
| Education, Arts & Media | 0 (0.0%) | 11 (100.0%) |
| Legal Services & Support | 0 (0.0%) | 0 (0.0%) |
| Education Instruction & Library | 36 (42.9%) | 48 (57.1%) |
| Arts, Media & Entertainment | 0 (0.0%) | 0 (0.0%) |
| Health Diagnosing & Treating | 0 (0.0%) | 6 (100.0%) |
| Health Technologists | 0 (0.0%) | 6 (100.0%) |
| Total (Category) | 42 (30.0%) | 98 (70.0%) |
| Total (Overall) | 207 (47.8%) | 226 (52.2%) |
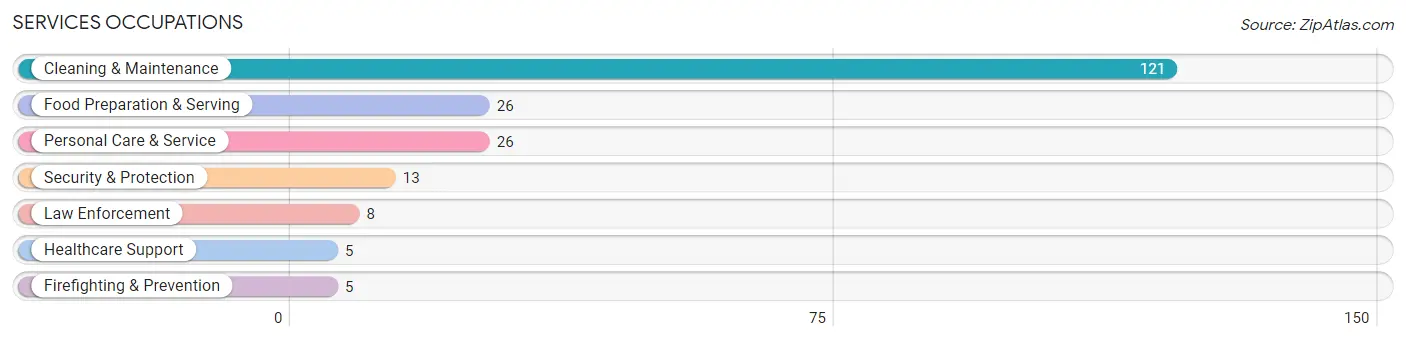
Services Occupations
The most common Services occupations in Machias are Cleaning & Maintenance (121 | 27.9%), Food Preparation & Serving (26 | 6.0%), Personal Care & Service (26 | 6.0%), Security & Protection (13 | 3.0%), and Law Enforcement (8 | 1.8%).
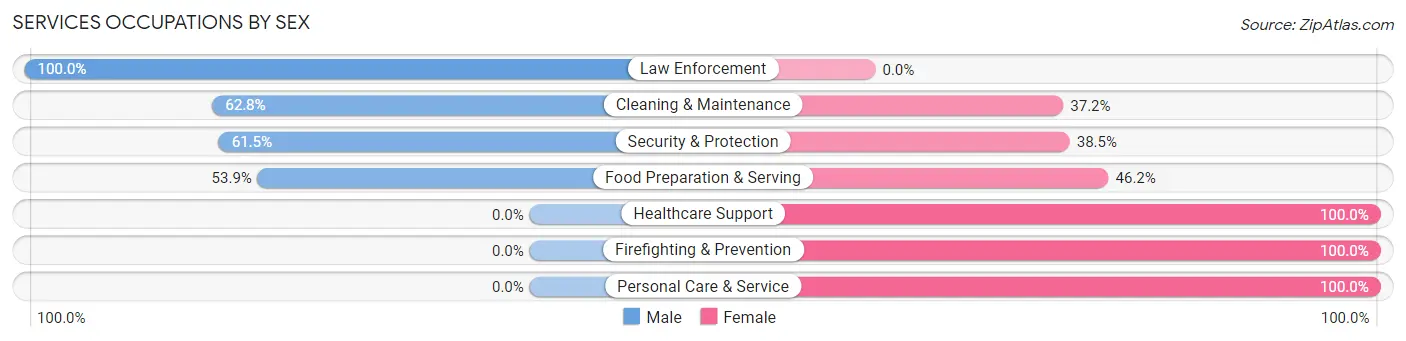
Services Occupations by Sex
Within the Services occupations in Machias, the most male-oriented occupations are Law Enforcement (100.0%), Cleaning & Maintenance (62.8%), and Security & Protection (61.5%), while the most female-oriented occupations are Healthcare Support (100.0%), Firefighting & Prevention (100.0%), and Personal Care & Service (100.0%).
| Occupation | Male | Female |
| Healthcare Support | 0 (0.0%) | 5 (100.0%) |
| Security & Protection | 8 (61.5%) | 5 (38.5%) |
| Firefighting & Prevention | 0 (0.0%) | 5 (100.0%) |
| Law Enforcement | 8 (100.0%) | 0 (0.0%) |
| Food Preparation & Serving | 14 (53.8%) | 12 (46.2%) |
| Cleaning & Maintenance | 76 (62.8%) | 45 (37.2%) |
| Personal Care & Service | 0 (0.0%) | 26 (100.0%) |
| Total (Category) | 98 (51.3%) | 93 (48.7%) |
| Total (Overall) | 207 (47.8%) | 226 (52.2%) |
Sales and Office Occupations
The most common Sales and Office occupations in Machias are Office & Administration (34 | 7.9%), and Sales & Related (21 | 4.9%).

Sales and Office Occupations by Sex

| Occupation | Male | Female |
| Sales & Related | 21 (100.0%) | 0 (0.0%) |
| Office & Administration | 4 (11.8%) | 30 (88.2%) |
| Total (Category) | 25 (45.5%) | 30 (54.5%) |
| Total (Overall) | 207 (47.8%) | 226 (52.2%) |
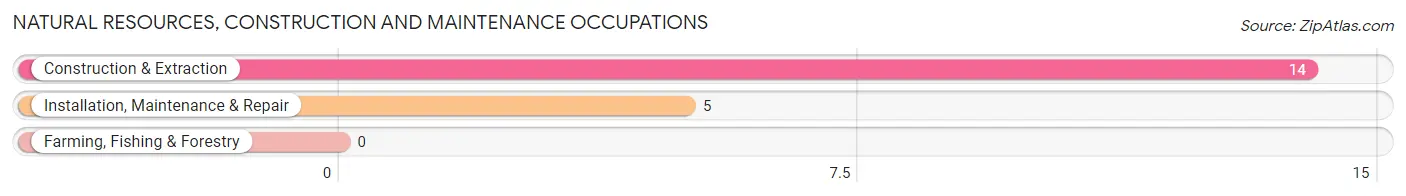
Natural Resources, Construction and Maintenance Occupations
The most common Natural Resources, Construction and Maintenance occupations in Machias are Construction & Extraction (14 | 3.2%), and Installation, Maintenance & Repair (5 | 1.1%).
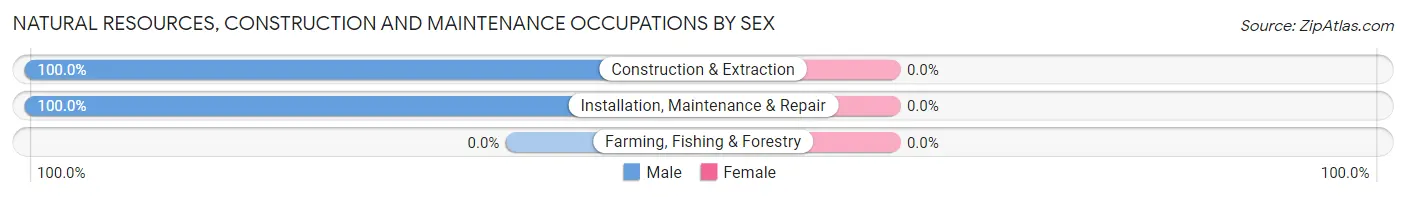
Natural Resources, Construction and Maintenance Occupations by Sex
| Occupation | Male | Female |
| Farming, Fishing & Forestry | 0 (0.0%) | 0 (0.0%) |
| Construction & Extraction | 14 (100.0%) | 0 (0.0%) |
| Installation, Maintenance & Repair | 5 (100.0%) | 0 (0.0%) |
| Total (Category) | 19 (100.0%) | 0 (0.0%) |
| Total (Overall) | 207 (47.8%) | 226 (52.2%) |
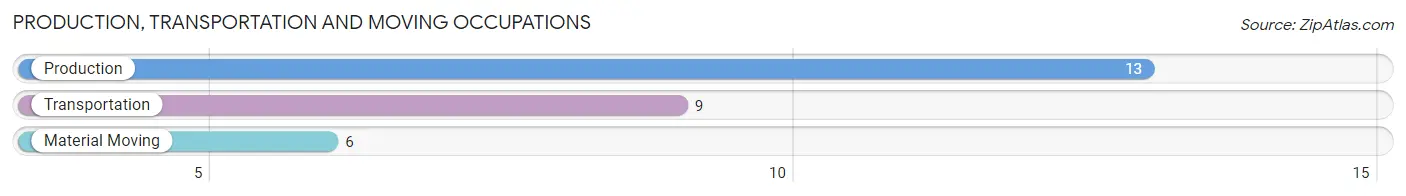
Production, Transportation and Moving Occupations
The most common Production, Transportation and Moving occupations in Machias are Production (13 | 3.0%), Transportation (9 | 2.1%), and Material Moving (6 | 1.4%).
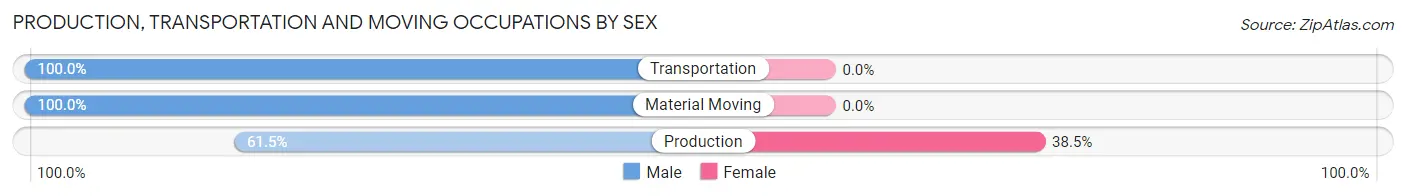
Production, Transportation and Moving Occupations by Sex
| Occupation | Male | Female |
| Production | 8 (61.5%) | 5 (38.5%) |
| Transportation | 9 (100.0%) | 0 (0.0%) |
| Material Moving | 6 (100.0%) | 0 (0.0%) |
| Total (Category) | 23 (82.1%) | 5 (17.9%) |
| Total (Overall) | 207 (47.8%) | 226 (52.2%) |
Employment Industries by Sex in Machias
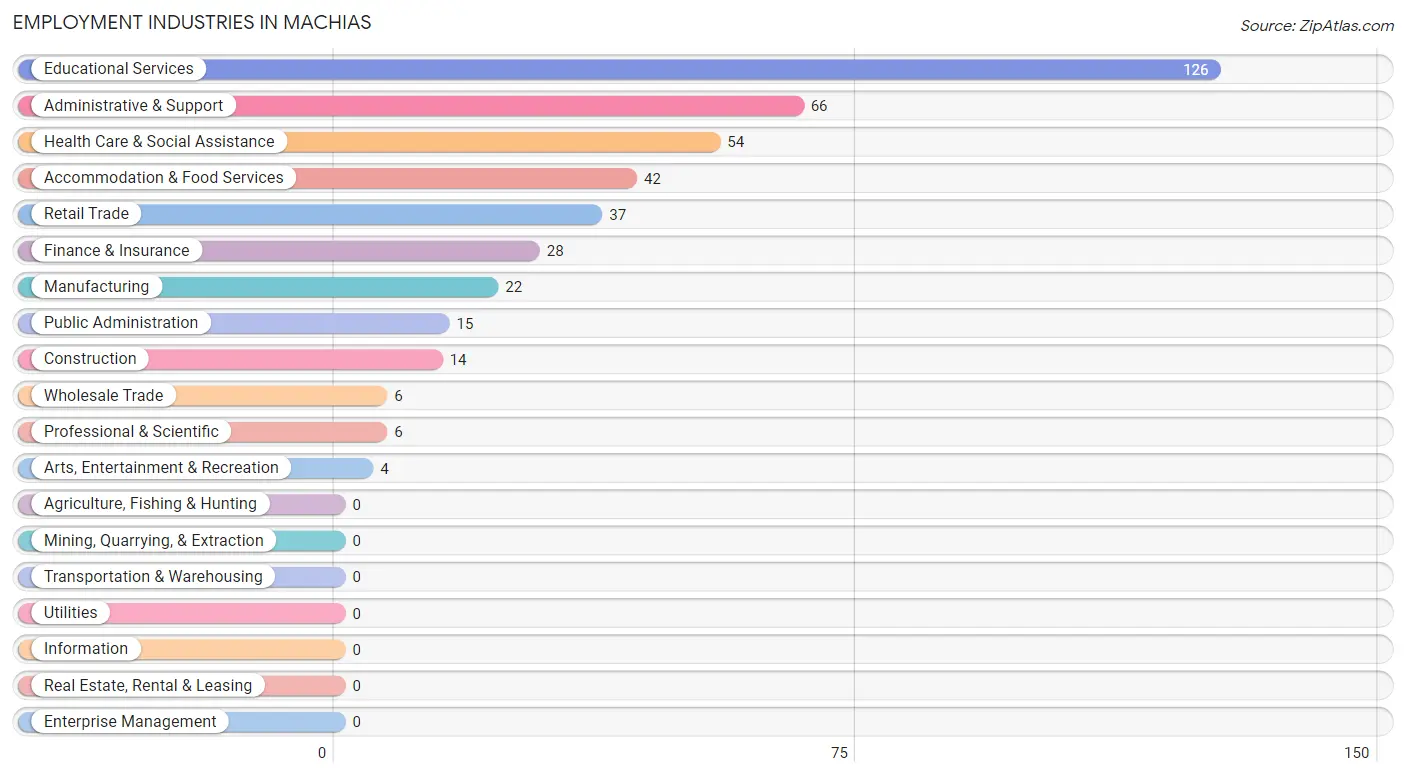
Employment Industries in Machias
The major employment industries in Machias include Educational Services (126 | 29.1%), Administrative & Support (66 | 15.2%), Health Care & Social Assistance (54 | 12.5%), Accommodation & Food Services (42 | 9.7%), and Retail Trade (37 | 8.6%).
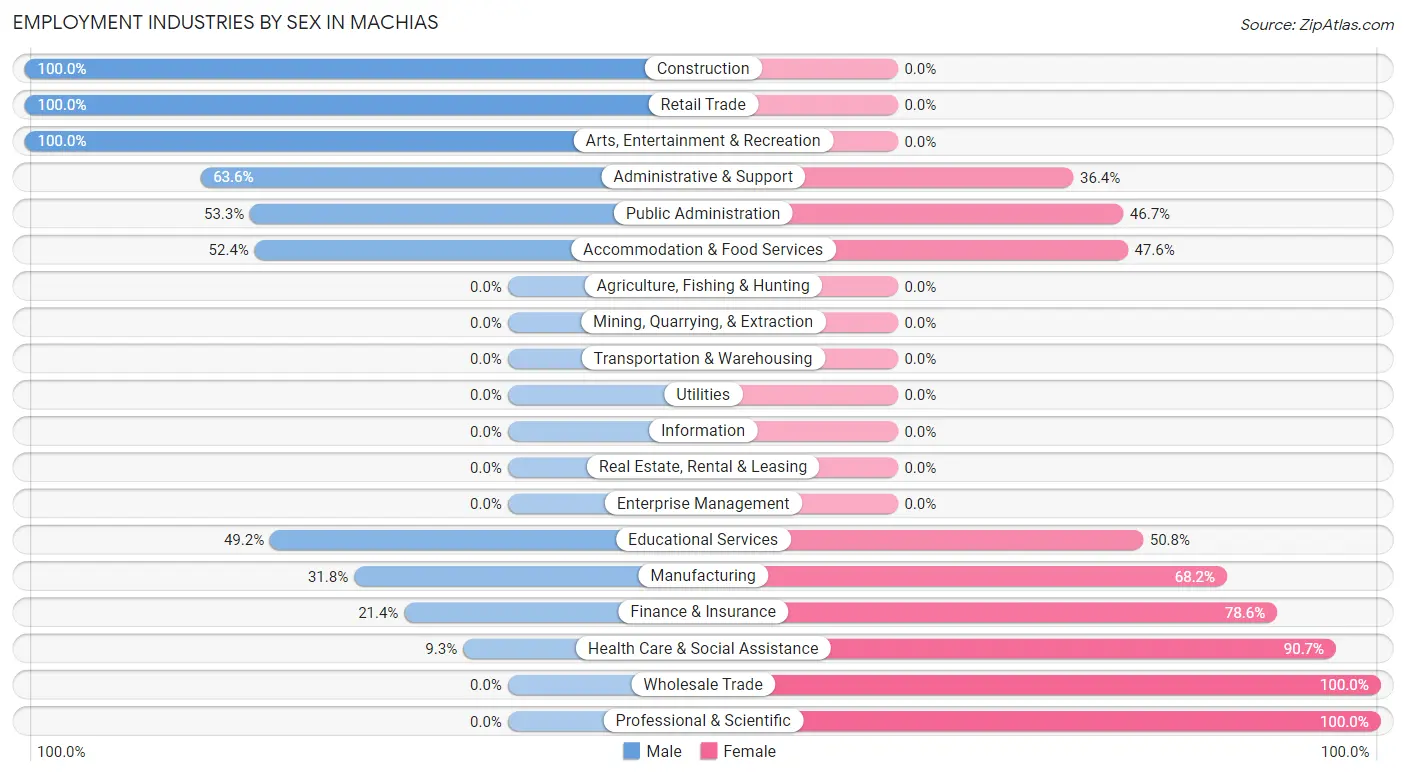
Employment Industries by Sex in Machias
The Machias industries that see more men than women are Construction (100.0%), Retail Trade (100.0%), and Arts, Entertainment & Recreation (100.0%), whereas the industries that tend to have a higher number of women are Wholesale Trade (100.0%), Professional & Scientific (100.0%), and Health Care & Social Assistance (90.7%).
| Industry | Male | Female |
| Agriculture, Fishing & Hunting | 0 (0.0%) | 0 (0.0%) |
| Mining, Quarrying, & Extraction | 0 (0.0%) | 0 (0.0%) |
| Construction | 14 (100.0%) | 0 (0.0%) |
| Manufacturing | 7 (31.8%) | 15 (68.2%) |
| Wholesale Trade | 0 (0.0%) | 6 (100.0%) |
| Retail Trade | 37 (100.0%) | 0 (0.0%) |
| Transportation & Warehousing | 0 (0.0%) | 0 (0.0%) |
| Utilities | 0 (0.0%) | 0 (0.0%) |
| Information | 0 (0.0%) | 0 (0.0%) |
| Finance & Insurance | 6 (21.4%) | 22 (78.6%) |
| Real Estate, Rental & Leasing | 0 (0.0%) | 0 (0.0%) |
| Professional & Scientific | 0 (0.0%) | 6 (100.0%) |
| Enterprise Management | 0 (0.0%) | 0 (0.0%) |
| Administrative & Support | 42 (63.6%) | 24 (36.4%) |
| Educational Services | 62 (49.2%) | 64 (50.8%) |
| Health Care & Social Assistance | 5 (9.3%) | 49 (90.7%) |
| Arts, Entertainment & Recreation | 4 (100.0%) | 0 (0.0%) |
| Accommodation & Food Services | 22 (52.4%) | 20 (47.6%) |
| Public Administration | 8 (53.3%) | 7 (46.7%) |
| Total | 207 (47.8%) | 226 (52.2%) |
Education in Machias
School Enrollment in Machias
The most common levels of schooling among the 322 students in Machias are college / undergraduate (187 | 58.1%), elementary school (53 | 16.5%), and middle school (42 | 13.0%).
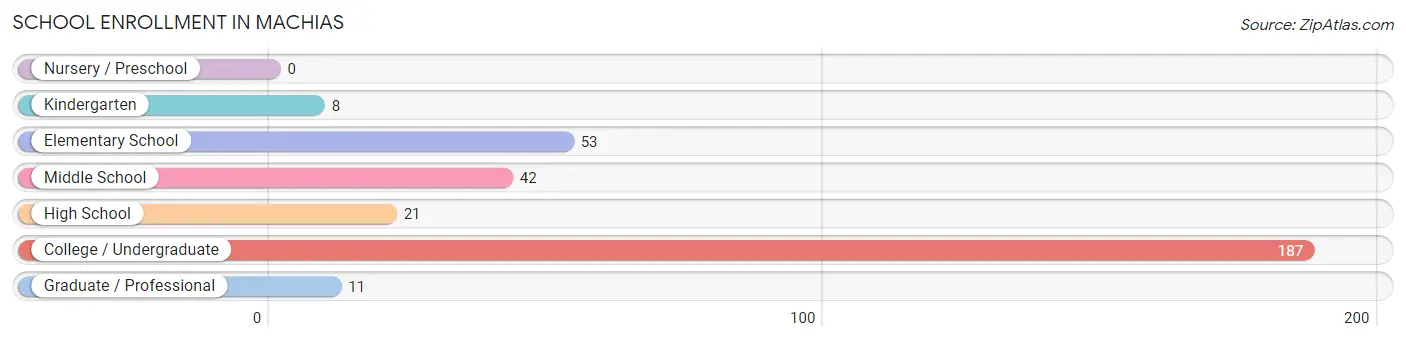
| School Level | # Students | % Students |
| Nursery / Preschool | 0 | 0.0% |
| Kindergarten | 8 | 2.5% |
| Elementary School | 53 | 16.5% |
| Middle School | 42 | 13.0% |
| High School | 21 | 6.5% |
| College / Undergraduate | 187 | 58.1% |
| Graduate / Professional | 11 | 3.4% |
| Total | 322 | 100.0% |
School Enrollment by Age by Funding Source in Machias
Out of a total of 322 students who are enrolled in schools in Machias, 40 (12.4%) attend a private institution, while the remaining 282 (87.6%) are enrolled in public schools. The age group of 18 to 19 year olds has the highest likelihood of being enrolled in private schools, with 30 (27.3% in the age bracket) enrolled. Conversely, the age group of 5 to 9 year old has the lowest likelihood of being enrolled in a private school, with 61 (100.0% in the age bracket) attending a public institution.
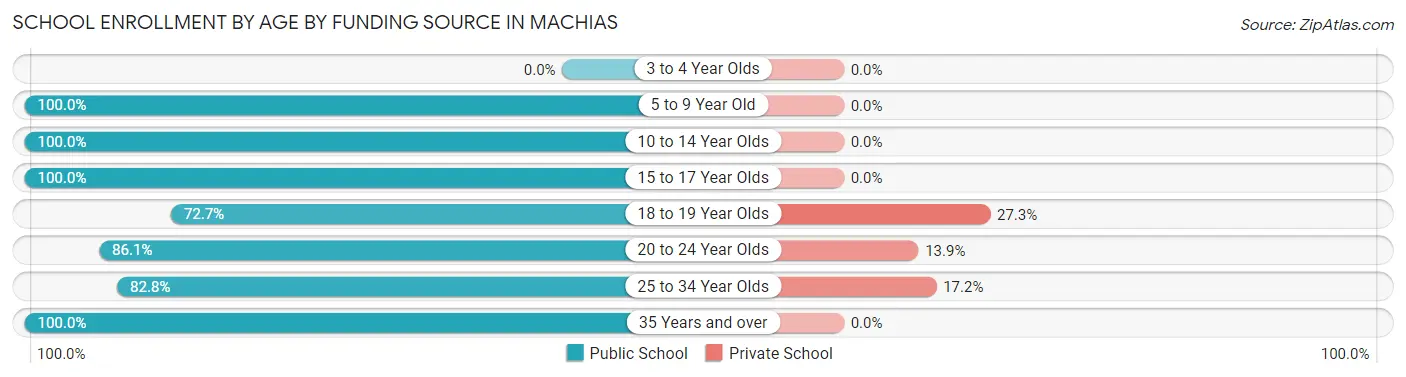
| Age Bracket | Public School | Private School |
| 3 to 4 Year Olds | 0 (0.0%) | 0 (0.0%) |
| 5 to 9 Year Old | 61 (100.0%) | 0 (0.0%) |
| 10 to 14 Year Olds | 57 (100.0%) | 0 (0.0%) |
| 15 to 17 Year Olds | 11 (100.0%) | 0 (0.0%) |
| 18 to 19 Year Olds | 80 (72.7%) | 30 (27.3%) |
| 20 to 24 Year Olds | 31 (86.1%) | 5 (13.9%) |
| 25 to 34 Year Olds | 24 (82.8%) | 5 (17.2%) |
| 35 Years and over | 18 (100.0%) | 0 (0.0%) |
| Total | 282 (87.6%) | 40 (12.4%) |
Educational Attainment by Field of Study in Machias
Social sciences (56 | 21.7%), literature & languages (37 | 14.3%), engineering (33 | 12.8%), bio, nature & agricultural (27 | 10.5%), and multidisciplinary studies (23 | 8.9%) are the most common fields of study among 258 individuals in Machias who have obtained a bachelor's degree or higher.
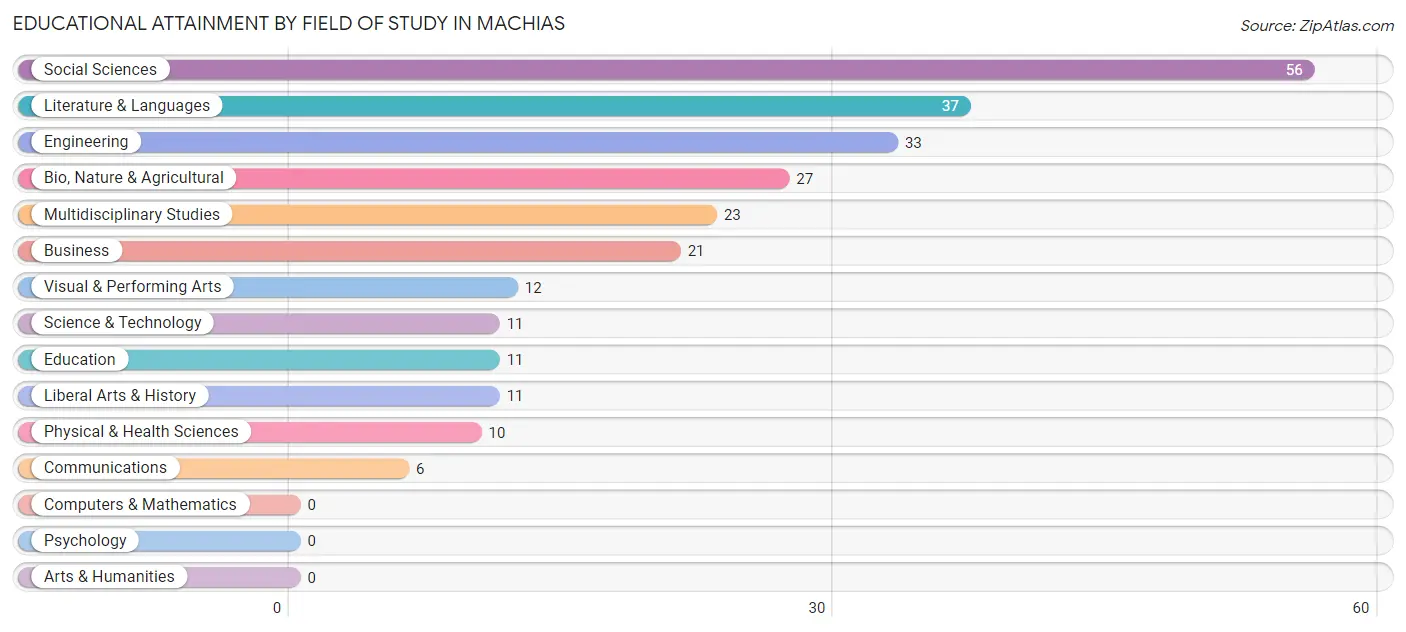
| Field of Study | # Graduates | % Graduates |
| Computers & Mathematics | 0 | 0.0% |
| Bio, Nature & Agricultural | 27 | 10.5% |
| Physical & Health Sciences | 10 | 3.9% |
| Psychology | 0 | 0.0% |
| Social Sciences | 56 | 21.7% |
| Engineering | 33 | 12.8% |
| Multidisciplinary Studies | 23 | 8.9% |
| Science & Technology | 11 | 4.3% |
| Business | 21 | 8.1% |
| Education | 11 | 4.3% |
| Literature & Languages | 37 | 14.3% |
| Liberal Arts & History | 11 | 4.3% |
| Visual & Performing Arts | 12 | 4.6% |
| Communications | 6 | 2.3% |
| Arts & Humanities | 0 | 0.0% |
| Total | 258 | 100.0% |
Transportation & Commute in Machias
Vehicle Availability by Sex in Machias
The most prevalent vehicle ownership categories in Machias are males with 2 vehicles (85, accounting for 49.4%) and females with 2 vehicles (107, making up 43.1%).
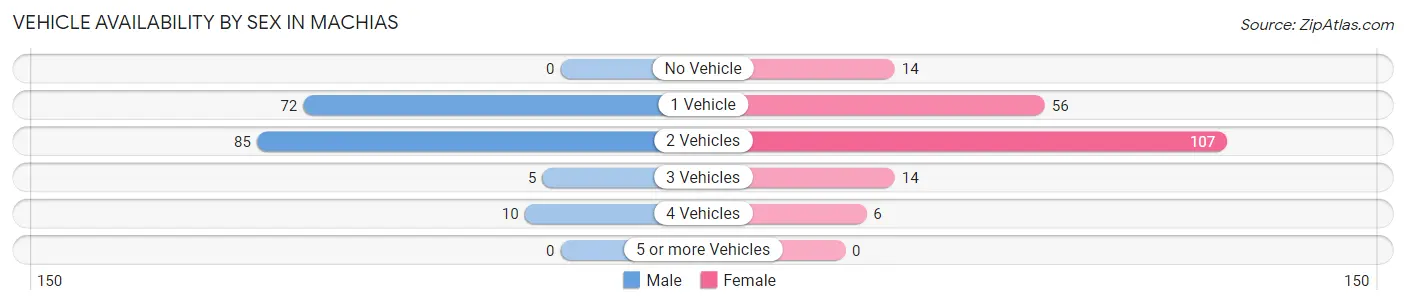
| Vehicles Available | Male | Female |
| No Vehicle | 0 (0.0%) | 14 (7.1%) |
| 1 Vehicle | 72 (41.9%) | 56 (28.4%) |
| 2 Vehicles | 85 (49.4%) | 107 (54.3%) |
| 3 Vehicles | 5 (2.9%) | 14 (7.1%) |
| 4 Vehicles | 10 (5.8%) | 6 (3.0%) |
| 5 or more Vehicles | 0 (0.0%) | 0 (0.0%) |
| Total | 172 (100.0%) | 197 (100.0%) |
Commute Time in Machias
The most frequently occuring commute durations in Machias are less than 5 minutes (126 commuters, 34.1%), 5 to 9 minutes (114 commuters, 30.8%), and 10 to 14 minutes (53 commuters, 14.3%).
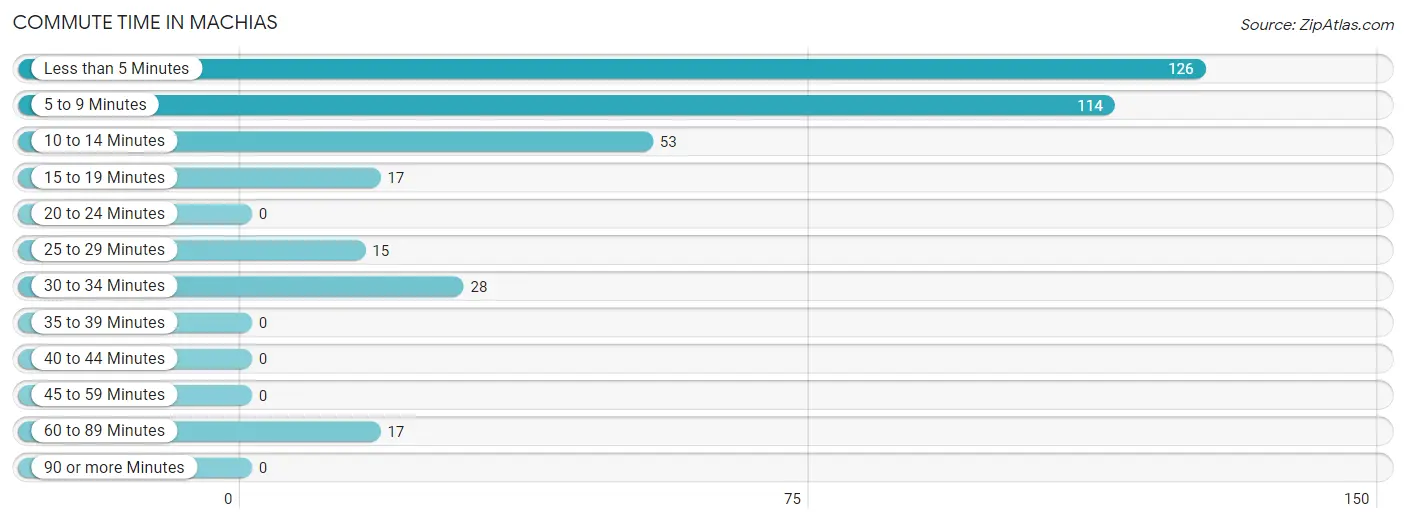
| Commute Time | # Commuters | % Commuters |
| Less than 5 Minutes | 126 | 34.1% |
| 5 to 9 Minutes | 114 | 30.8% |
| 10 to 14 Minutes | 53 | 14.3% |
| 15 to 19 Minutes | 17 | 4.6% |
| 20 to 24 Minutes | 0 | 0.0% |
| 25 to 29 Minutes | 15 | 4.1% |
| 30 to 34 Minutes | 28 | 7.6% |
| 35 to 39 Minutes | 0 | 0.0% |
| 40 to 44 Minutes | 0 | 0.0% |
| 45 to 59 Minutes | 0 | 0.0% |
| 60 to 89 Minutes | 17 | 4.6% |
| 90 or more Minutes | 0 | 0.0% |
Commute Time by Sex in Machias
The most common commute times in Machias are less than 5 minutes (83 commuters, 43.2%) for males and 5 to 9 minutes (74 commuters, 41.6%) for females.
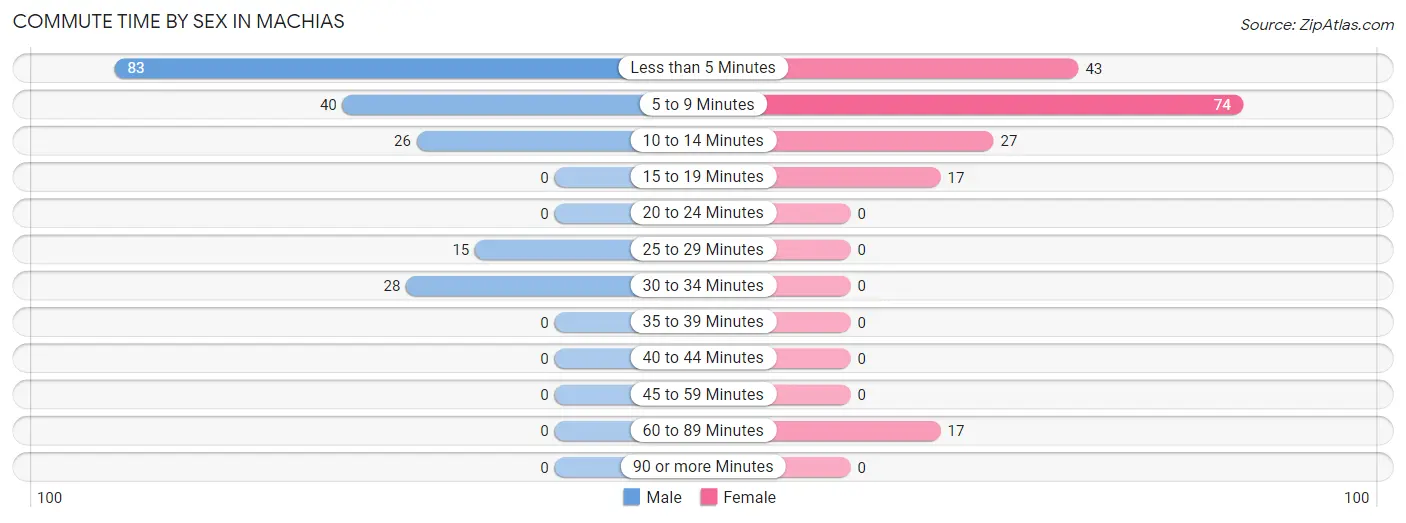
| Commute Time | Male | Female |
| Less than 5 Minutes | 83 (43.2%) | 43 (24.2%) |
| 5 to 9 Minutes | 40 (20.8%) | 74 (41.6%) |
| 10 to 14 Minutes | 26 (13.5%) | 27 (15.2%) |
| 15 to 19 Minutes | 0 (0.0%) | 17 (9.6%) |
| 20 to 24 Minutes | 0 (0.0%) | 0 (0.0%) |
| 25 to 29 Minutes | 15 (7.8%) | 0 (0.0%) |
| 30 to 34 Minutes | 28 (14.6%) | 0 (0.0%) |
| 35 to 39 Minutes | 0 (0.0%) | 0 (0.0%) |
| 40 to 44 Minutes | 0 (0.0%) | 0 (0.0%) |
| 45 to 59 Minutes | 0 (0.0%) | 0 (0.0%) |
| 60 to 89 Minutes | 0 (0.0%) | 17 (9.6%) |
| 90 or more Minutes | 0 (0.0%) | 0 (0.0%) |
Time of Departure to Work by Sex in Machias
The most frequent times of departure to work in Machias are 4:00 PM to 11:59 PM (42, 21.9%) for males and 7:30 AM to 7:59 AM (43, 24.2%) for females.
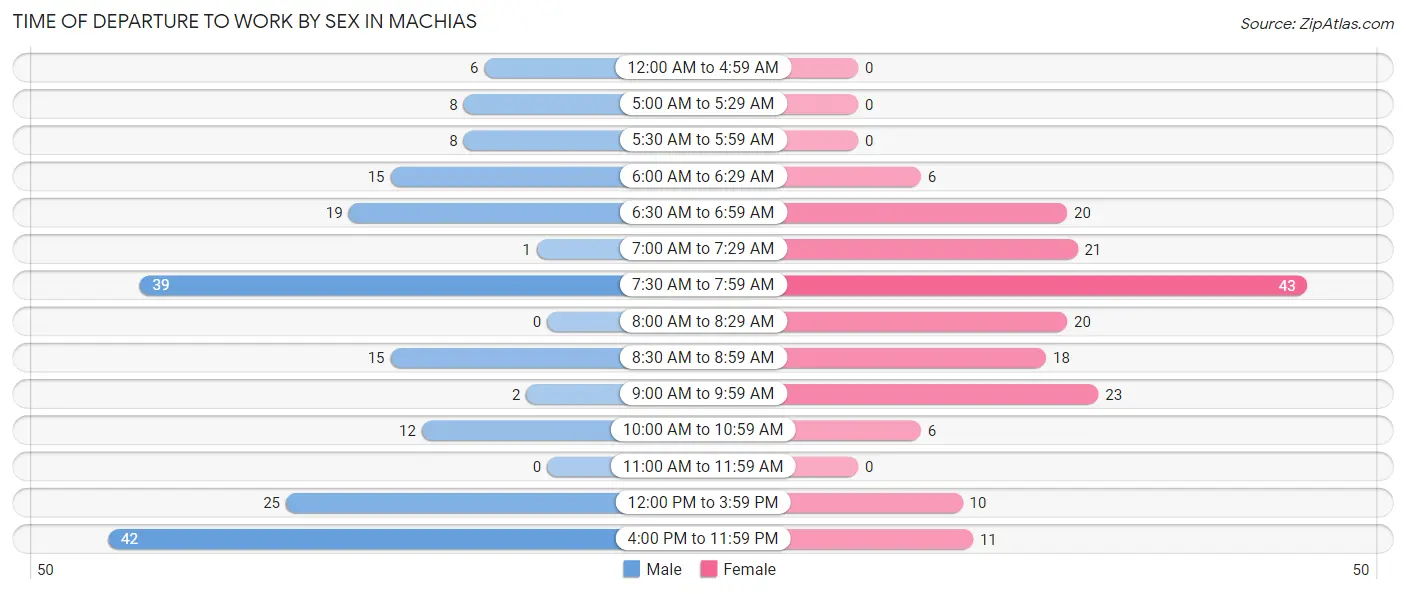
| Time of Departure | Male | Female |
| 12:00 AM to 4:59 AM | 6 (3.1%) | 0 (0.0%) |
| 5:00 AM to 5:29 AM | 8 (4.2%) | 0 (0.0%) |
| 5:30 AM to 5:59 AM | 8 (4.2%) | 0 (0.0%) |
| 6:00 AM to 6:29 AM | 15 (7.8%) | 6 (3.4%) |
| 6:30 AM to 6:59 AM | 19 (9.9%) | 20 (11.2%) |
| 7:00 AM to 7:29 AM | 1 (0.5%) | 21 (11.8%) |
| 7:30 AM to 7:59 AM | 39 (20.3%) | 43 (24.2%) |
| 8:00 AM to 8:29 AM | 0 (0.0%) | 20 (11.2%) |
| 8:30 AM to 8:59 AM | 15 (7.8%) | 18 (10.1%) |
| 9:00 AM to 9:59 AM | 2 (1.0%) | 23 (12.9%) |
| 10:00 AM to 10:59 AM | 12 (6.2%) | 6 (3.4%) |
| 11:00 AM to 11:59 AM | 0 (0.0%) | 0 (0.0%) |
| 12:00 PM to 3:59 PM | 25 (13.0%) | 10 (5.6%) |
| 4:00 PM to 11:59 PM | 42 (21.9%) | 11 (6.2%) |
| Total | 192 (100.0%) | 178 (100.0%) |
Housing Occupancy in Machias
Occupancy by Ownership in Machias
Of the total 584 dwellings in Machias, owner-occupied units account for 238 (40.7%), while renter-occupied units make up 346 (59.3%).
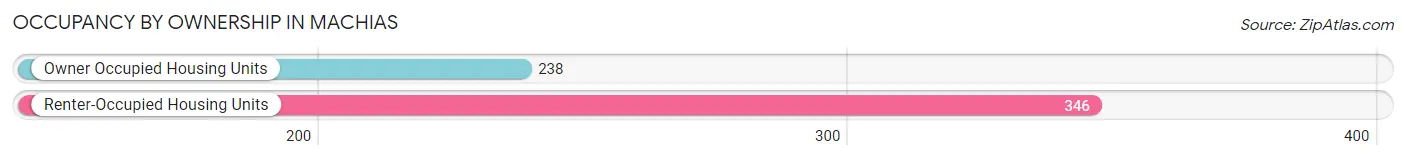
| Occupancy | # Housing Units | % Housing Units |
| Owner Occupied Housing Units | 238 | 40.7% |
| Renter-Occupied Housing Units | 346 | 59.3% |
| Total Occupied Housing Units | 584 | 100.0% |
Occupancy by Household Size in Machias
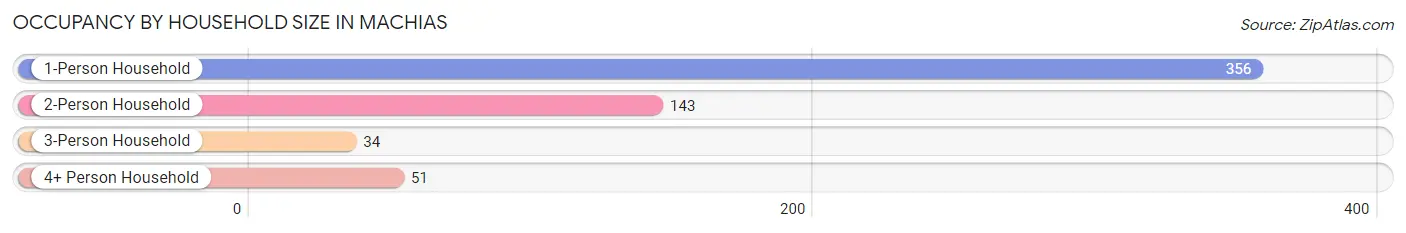
| Household Size | # Housing Units | % Housing Units |
| 1-Person Household | 356 | 61.0% |
| 2-Person Household | 143 | 24.5% |
| 3-Person Household | 34 | 5.8% |
| 4+ Person Household | 51 | 8.7% |
| Total Housing Units | 584 | 100.0% |
Occupancy by Ownership by Household Size in Machias
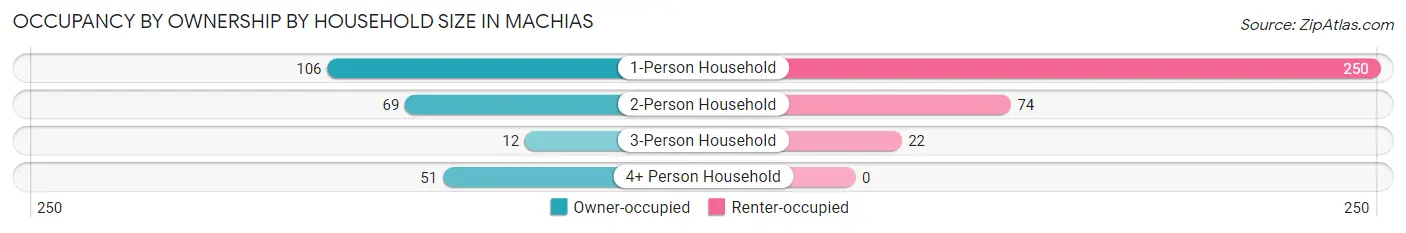
| Household Size | Owner-occupied | Renter-occupied |
| 1-Person Household | 106 (29.8%) | 250 (70.2%) |
| 2-Person Household | 69 (48.2%) | 74 (51.7%) |
| 3-Person Household | 12 (35.3%) | 22 (64.7%) |
| 4+ Person Household | 51 (100.0%) | 0 (0.0%) |
| Total Housing Units | 238 (40.7%) | 346 (59.3%) |
Occupancy by Educational Attainment in Machias
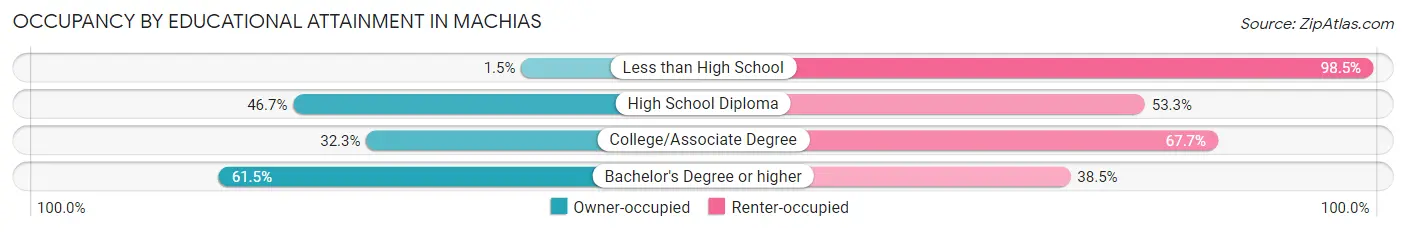
| Household Size | Owner-occupied | Renter-occupied |
| Less than High School | 1 (1.5%) | 65 (98.5%) |
| High School Diploma | 86 (46.7%) | 98 (53.3%) |
| College/Associate Degree | 60 (32.3%) | 126 (67.7%) |
| Bachelor's Degree or higher | 91 (61.5%) | 57 (38.5%) |
Occupancy by Age of Householder in Machias
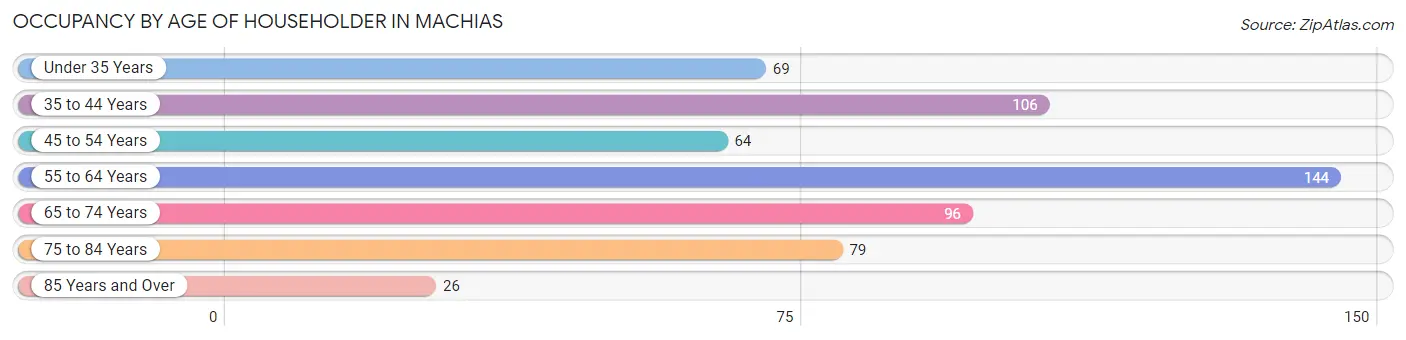
| Age Bracket | # Households | % Households |
| Under 35 Years | 69 | 11.8% |
| 35 to 44 Years | 106 | 18.1% |
| 45 to 54 Years | 64 | 11.0% |
| 55 to 64 Years | 144 | 24.7% |
| 65 to 74 Years | 96 | 16.4% |
| 75 to 84 Years | 79 | 13.5% |
| 85 Years and Over | 26 | 4.4% |
| Total | 584 | 100.0% |
Housing Finances in Machias
Median Income by Occupancy in Machias
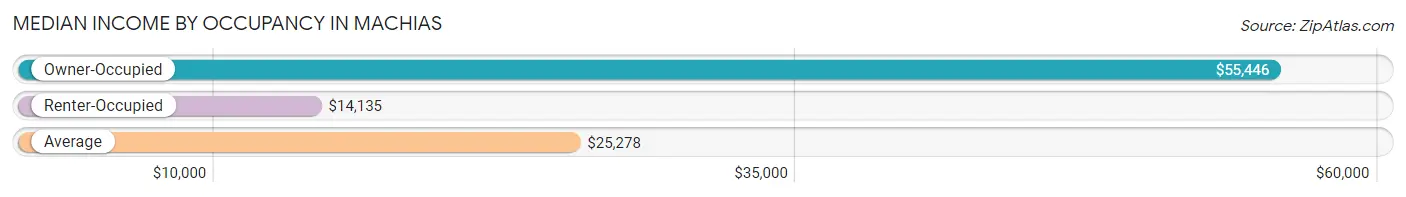
| Occupancy Type | # Households | Median Income |
| Owner-Occupied | 238 (40.7%) | $55,446 |
| Renter-Occupied | 346 (59.3%) | $14,135 |
| Average | 584 (100.0%) | $25,278 |
Occupancy by Householder Income Bracket in Machias
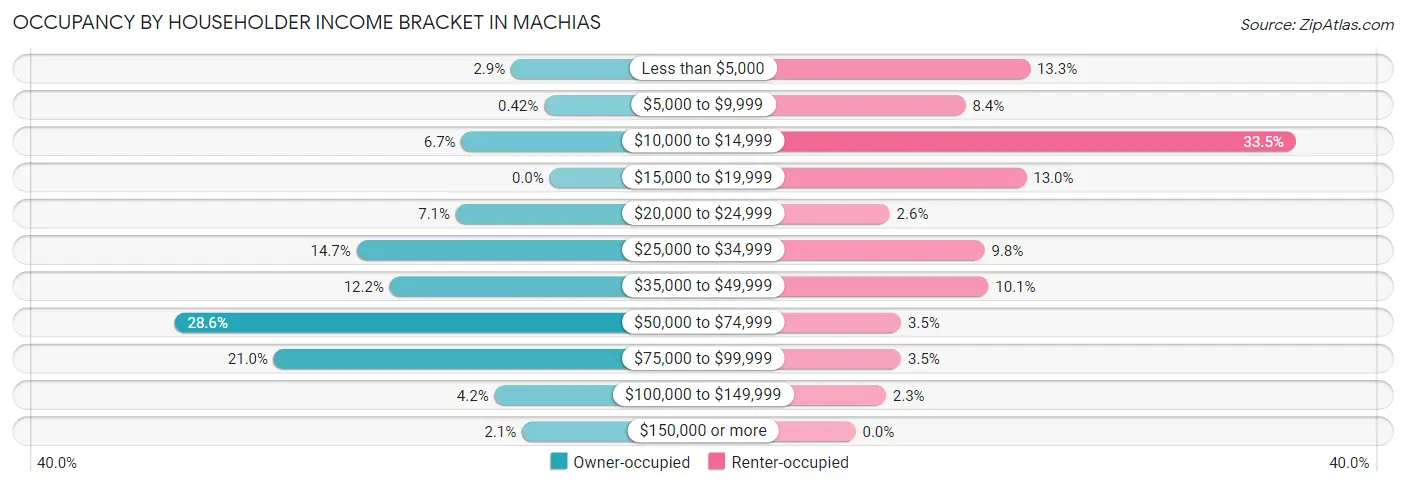
| Income Bracket | Owner-occupied | Renter-occupied |
| Less than $5,000 | 7 (2.9%) | 46 (13.3%) |
| $5,000 to $9,999 | 1 (0.4%) | 29 (8.4%) |
| $10,000 to $14,999 | 16 (6.7%) | 116 (33.5%) |
| $15,000 to $19,999 | 0 (0.0%) | 45 (13.0%) |
| $20,000 to $24,999 | 17 (7.1%) | 9 (2.6%) |
| $25,000 to $34,999 | 35 (14.7%) | 34 (9.8%) |
| $35,000 to $49,999 | 29 (12.2%) | 35 (10.1%) |
| $50,000 to $74,999 | 68 (28.6%) | 12 (3.5%) |
| $75,000 to $99,999 | 50 (21.0%) | 12 (3.5%) |
| $100,000 to $149,999 | 10 (4.2%) | 8 (2.3%) |
| $150,000 or more | 5 (2.1%) | 0 (0.0%) |
| Total | 238 (100.0%) | 346 (100.0%) |
Monthly Housing Cost Tiers in Machias
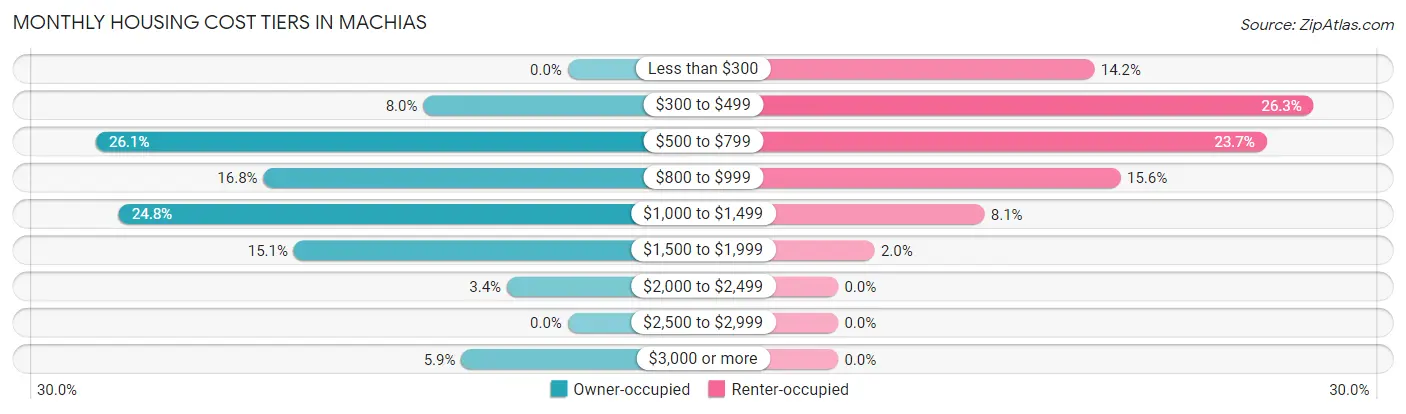
| Monthly Cost | Owner-occupied | Renter-occupied |
| Less than $300 | 0 (0.0%) | 49 (14.2%) |
| $300 to $499 | 19 (8.0%) | 91 (26.3%) |
| $500 to $799 | 62 (26.1%) | 82 (23.7%) |
| $800 to $999 | 40 (16.8%) | 54 (15.6%) |
| $1,000 to $1,499 | 59 (24.8%) | 28 (8.1%) |
| $1,500 to $1,999 | 36 (15.1%) | 7 (2.0%) |
| $2,000 to $2,499 | 8 (3.4%) | 0 (0.0%) |
| $2,500 to $2,999 | 0 (0.0%) | 0 (0.0%) |
| $3,000 or more | 14 (5.9%) | 0 (0.0%) |
| Total | 238 (100.0%) | 346 (100.0%) |
Physical Housing Characteristics in Machias
Housing Structures in Machias

| Structure Type | # Housing Units | % Housing Units |
| Single Unit, Detached | 264 | 45.2% |
| Single Unit, Attached | 0 | 0.0% |
| 2 Unit Apartments | 17 | 2.9% |
| 3 or 4 Unit Apartments | 79 | 13.5% |
| 5 to 9 Unit Apartments | 137 | 23.5% |
| 10 or more Apartments | 62 | 10.6% |
| Mobile Home / Other | 25 | 4.3% |
| Total | 584 | 100.0% |
Housing Structures by Occupancy in Machias
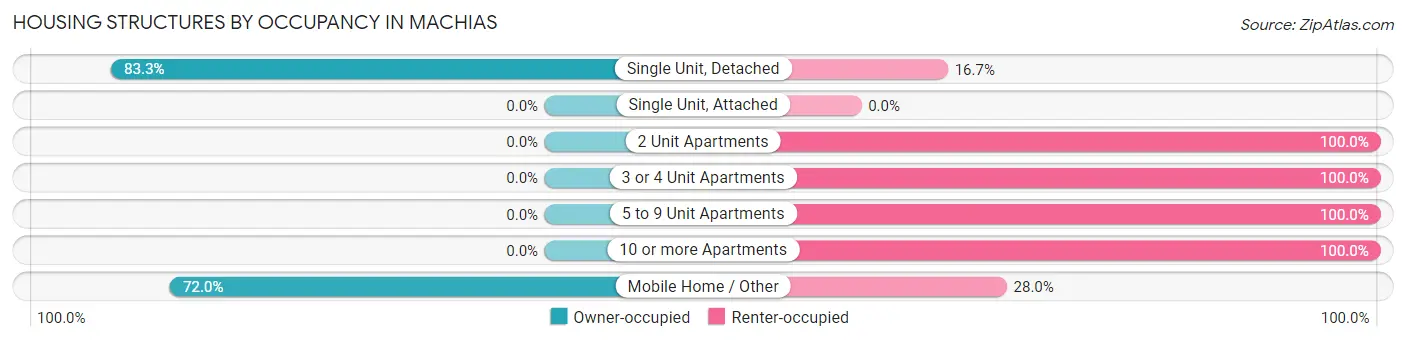
| Structure Type | Owner-occupied | Renter-occupied |
| Single Unit, Detached | 220 (83.3%) | 44 (16.7%) |
| Single Unit, Attached | 0 (0.0%) | 0 (0.0%) |
| 2 Unit Apartments | 0 (0.0%) | 17 (100.0%) |
| 3 or 4 Unit Apartments | 0 (0.0%) | 79 (100.0%) |
| 5 to 9 Unit Apartments | 0 (0.0%) | 137 (100.0%) |
| 10 or more Apartments | 0 (0.0%) | 62 (100.0%) |
| Mobile Home / Other | 18 (72.0%) | 7 (28.0%) |
| Total | 238 (40.7%) | 346 (59.3%) |
Housing Structures by Number of Rooms in Machias
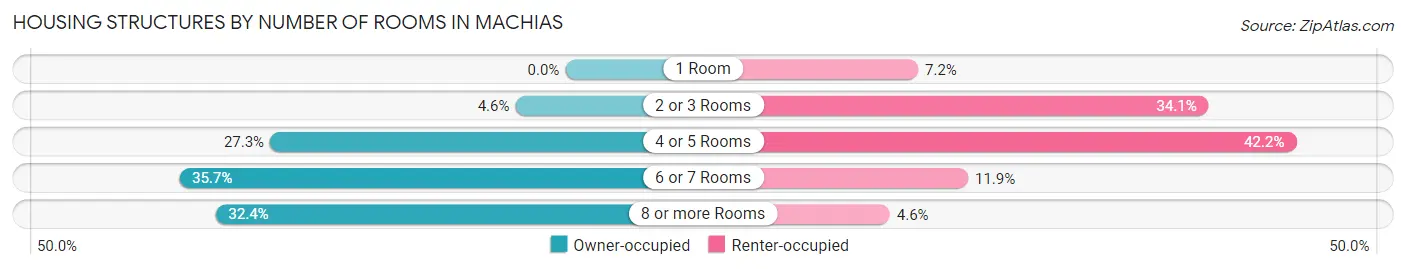
| Number of Rooms | Owner-occupied | Renter-occupied |
| 1 Room | 0 (0.0%) | 25 (7.2%) |
| 2 or 3 Rooms | 11 (4.6%) | 118 (34.1%) |
| 4 or 5 Rooms | 65 (27.3%) | 146 (42.2%) |
| 6 or 7 Rooms | 85 (35.7%) | 41 (11.8%) |
| 8 or more Rooms | 77 (32.4%) | 16 (4.6%) |
| Total | 238 (100.0%) | 346 (100.0%) |
Housing Structure by Heating Type in Machias
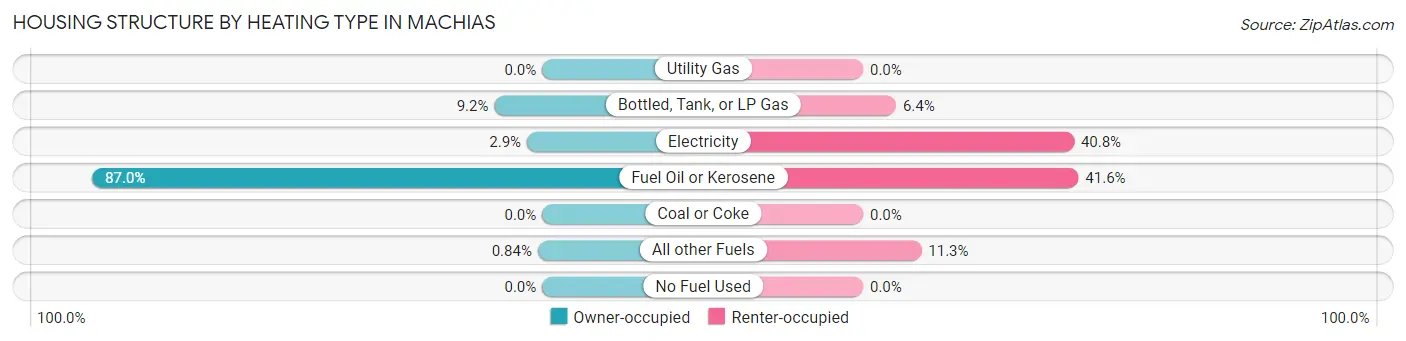
| Heating Type | Owner-occupied | Renter-occupied |
| Utility Gas | 0 (0.0%) | 0 (0.0%) |
| Bottled, Tank, or LP Gas | 22 (9.2%) | 22 (6.4%) |
| Electricity | 7 (2.9%) | 141 (40.7%) |
| Fuel Oil or Kerosene | 207 (87.0%) | 144 (41.6%) |
| Coal or Coke | 0 (0.0%) | 0 (0.0%) |
| All other Fuels | 2 (0.8%) | 39 (11.3%) |
| No Fuel Used | 0 (0.0%) | 0 (0.0%) |
| Total | 238 (100.0%) | 346 (100.0%) |
Household Vehicle Usage in Machias
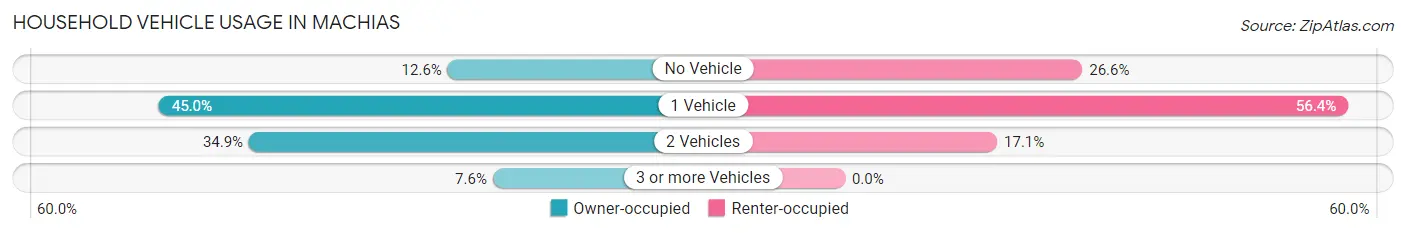
| Vehicles per Household | Owner-occupied | Renter-occupied |
| No Vehicle | 30 (12.6%) | 92 (26.6%) |
| 1 Vehicle | 107 (45.0%) | 195 (56.4%) |
| 2 Vehicles | 83 (34.9%) | 59 (17.1%) |
| 3 or more Vehicles | 18 (7.6%) | 0 (0.0%) |
| Total | 238 (100.0%) | 346 (100.0%) |
Real Estate & Mortgages in Machias
Real Estate and Mortgage Overview in Machias
| Characteristic | Without Mortgage | With Mortgage |
| Housing Units | 71 | 167 |
| Median Property Value | $115,600 | $98,800 |
| Median Household Income | $56,406 | $5 |
| Monthly Housing Costs | $761 | $14 |
| Real Estate Taxes | $1,875 | $0 |
Property Value by Mortgage Status in Machias
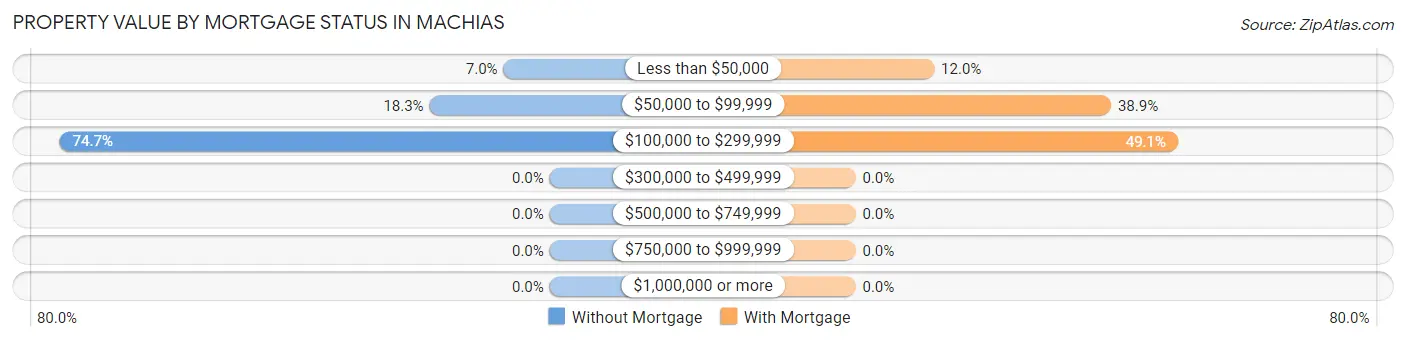
| Property Value | Without Mortgage | With Mortgage |
| Less than $50,000 | 5 (7.0%) | 20 (12.0%) |
| $50,000 to $99,999 | 13 (18.3%) | 65 (38.9%) |
| $100,000 to $299,999 | 53 (74.7%) | 82 (49.1%) |
| $300,000 to $499,999 | 0 (0.0%) | 0 (0.0%) |
| $500,000 to $749,999 | 0 (0.0%) | 0 (0.0%) |
| $750,000 to $999,999 | 0 (0.0%) | 0 (0.0%) |
| $1,000,000 or more | 0 (0.0%) | 0 (0.0%) |
| Total | 71 (100.0%) | 167 (100.0%) |
Household Income by Mortgage Status in Machias
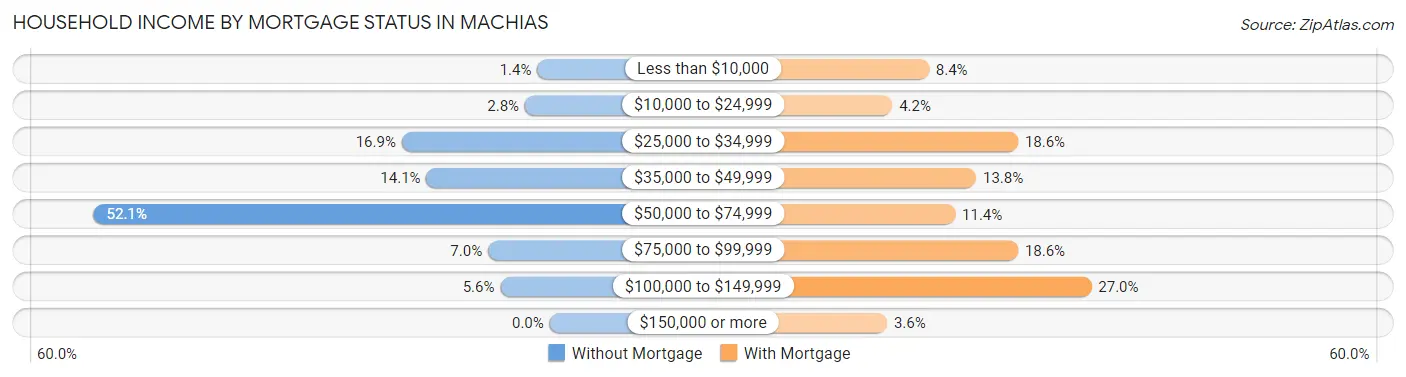
| Household Income | Without Mortgage | With Mortgage |
| Less than $10,000 | 1 (1.4%) | 14 (8.4%) |
| $10,000 to $24,999 | 2 (2.8%) | 7 (4.2%) |
| $25,000 to $34,999 | 12 (16.9%) | 31 (18.6%) |
| $35,000 to $49,999 | 10 (14.1%) | 23 (13.8%) |
| $50,000 to $74,999 | 37 (52.1%) | 19 (11.4%) |
| $75,000 to $99,999 | 5 (7.0%) | 31 (18.6%) |
| $100,000 to $149,999 | 4 (5.6%) | 45 (27.0%) |
| $150,000 or more | 0 (0.0%) | 6 (3.6%) |
| Total | 71 (100.0%) | 167 (100.0%) |
Property Value to Household Income Ratio in Machias
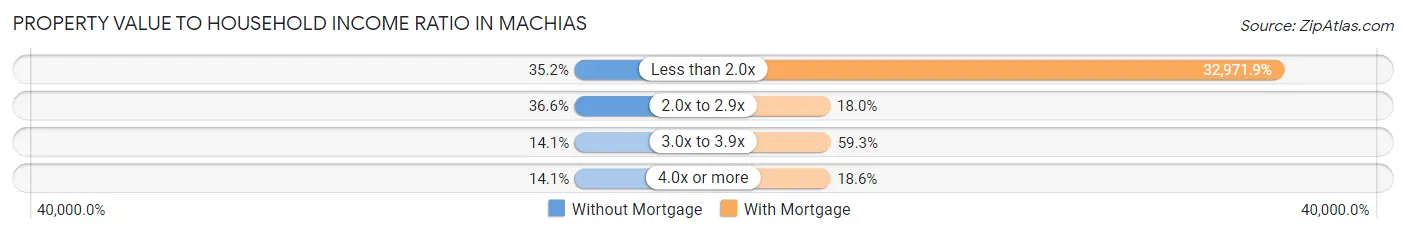
| Value-to-Income Ratio | Without Mortgage | With Mortgage |
| Less than 2.0x | 25 (35.2%) | 55,063 (32,971.9%) |
| 2.0x to 2.9x | 26 (36.6%) | 30 (18.0%) |
| 3.0x to 3.9x | 10 (14.1%) | 99 (59.3%) |
| 4.0x or more | 10 (14.1%) | 31 (18.6%) |
| Total | 71 (100.0%) | 167 (100.0%) |
Real Estate Taxes by Mortgage Status in Machias
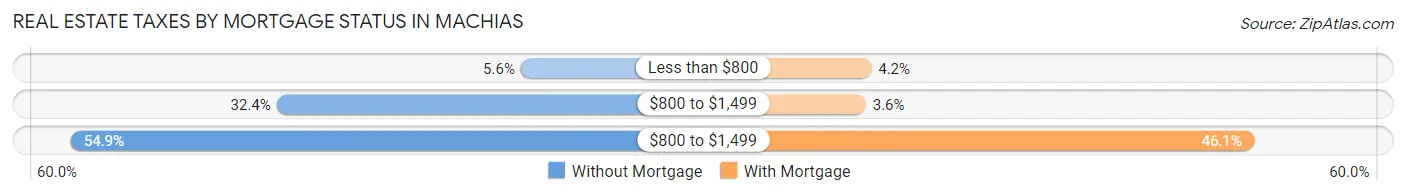
| Property Taxes | Without Mortgage | With Mortgage |
| Less than $800 | 4 (5.6%) | 7 (4.2%) |
| $800 to $1,499 | 23 (32.4%) | 6 (3.6%) |
| $800 to $1,499 | 39 (54.9%) | 77 (46.1%) |
| Total | 71 (100.0%) | 167 (100.0%) |
Health & Disability in Machias
Health Insurance Coverage by Age in Machias
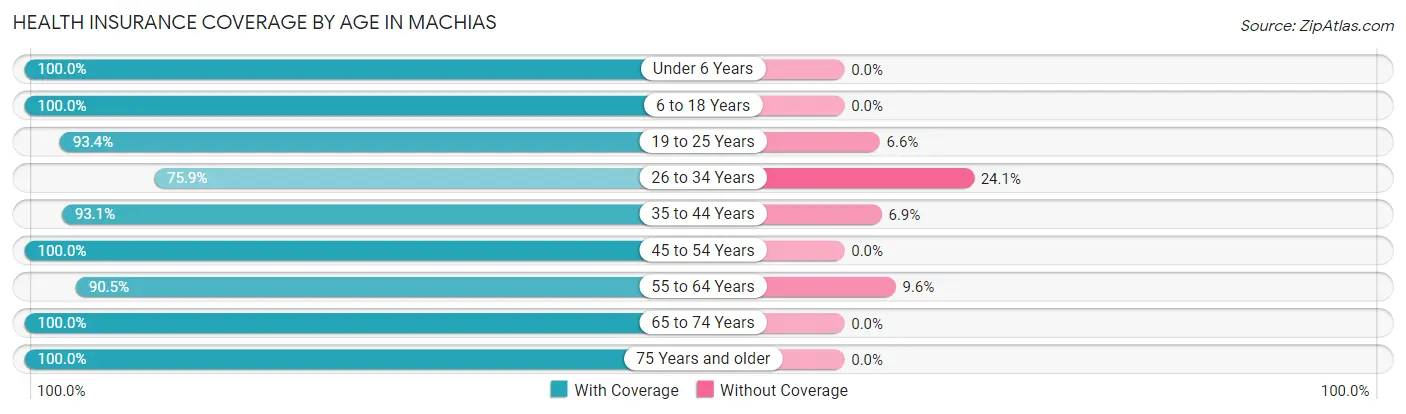
| Age Bracket | With Coverage | Without Coverage |
| Under 6 Years | 35 (100.0%) | 0 (0.0%) |
| 6 to 18 Years | 176 (100.0%) | 0 (0.0%) |
| 19 to 25 Years | 142 (93.4%) | 10 (6.6%) |
| 26 to 34 Years | 66 (75.9%) | 21 (24.1%) |
| 35 to 44 Years | 161 (93.1%) | 12 (6.9%) |
| 45 to 54 Years | 112 (100.0%) | 0 (0.0%) |
| 55 to 64 Years | 199 (90.4%) | 21 (9.6%) |
| 65 to 74 Years | 126 (100.0%) | 0 (0.0%) |
| 75 Years and older | 126 (100.0%) | 0 (0.0%) |
| Total | 1,143 (94.7%) | 64 (5.3%) |
Health Insurance Coverage by Citizenship Status in Machias
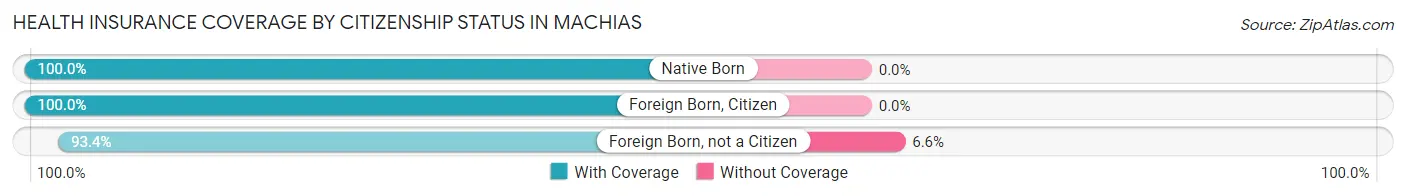
| Citizenship Status | With Coverage | Without Coverage |
| Native Born | 35 (100.0%) | 0 (0.0%) |
| Foreign Born, Citizen | 176 (100.0%) | 0 (0.0%) |
| Foreign Born, not a Citizen | 142 (93.4%) | 10 (6.6%) |
Health Insurance Coverage by Household Income in Machias
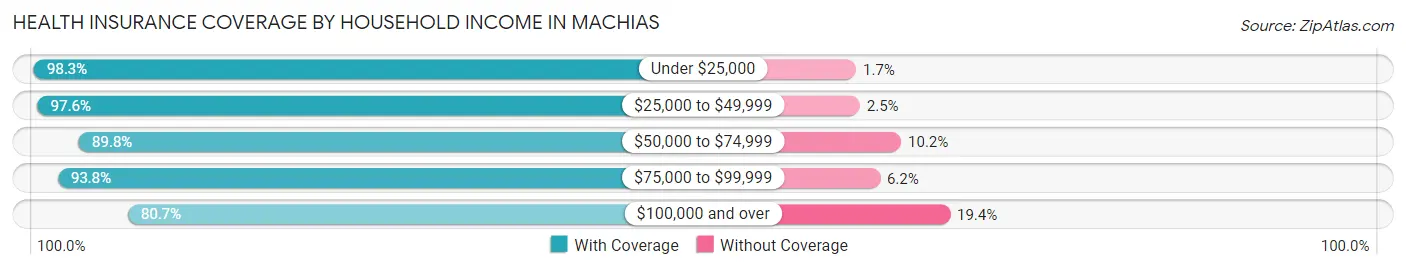
| Household Income | With Coverage | Without Coverage |
| Under $25,000 | 338 (98.3%) | 6 (1.7%) |
| $25,000 to $49,999 | 239 (97.6%) | 6 (2.5%) |
| $50,000 to $74,999 | 150 (89.8%) | 17 (10.2%) |
| $75,000 to $99,999 | 196 (93.8%) | 13 (6.2%) |
| $100,000 and over | 50 (80.6%) | 12 (19.4%) |
Public vs Private Health Insurance Coverage by Age in Machias
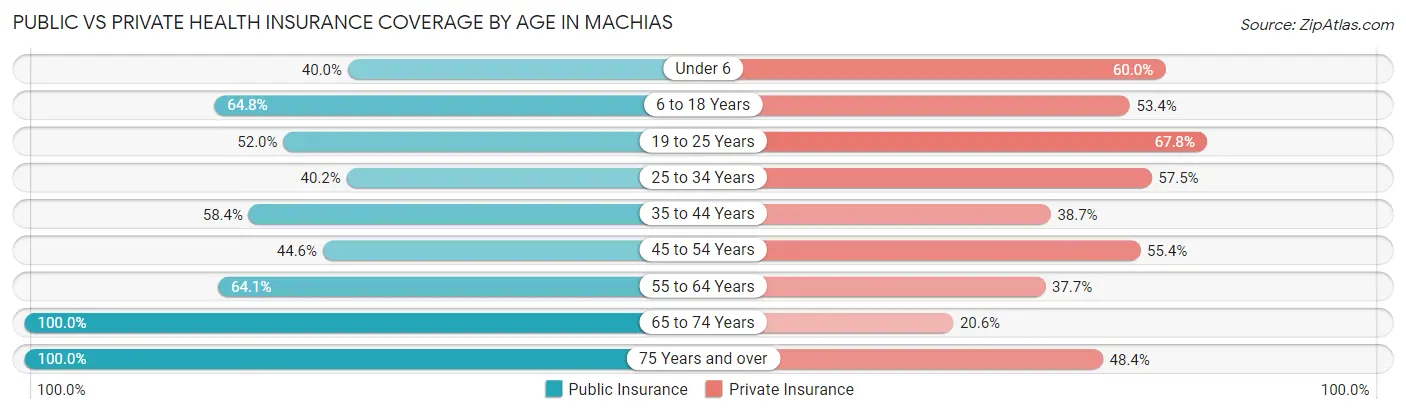
| Age Bracket | Public Insurance | Private Insurance |
| Under 6 | 14 (40.0%) | 21 (60.0%) |
| 6 to 18 Years | 114 (64.8%) | 94 (53.4%) |
| 19 to 25 Years | 79 (52.0%) | 103 (67.8%) |
| 25 to 34 Years | 35 (40.2%) | 50 (57.5%) |
| 35 to 44 Years | 101 (58.4%) | 67 (38.7%) |
| 45 to 54 Years | 50 (44.6%) | 62 (55.4%) |
| 55 to 64 Years | 141 (64.1%) | 83 (37.7%) |
| 65 to 74 Years | 126 (100.0%) | 26 (20.6%) |
| 75 Years and over | 126 (100.0%) | 61 (48.4%) |
| Total | 786 (65.1%) | 567 (47.0%) |
Disability Status by Sex by Age in Machias
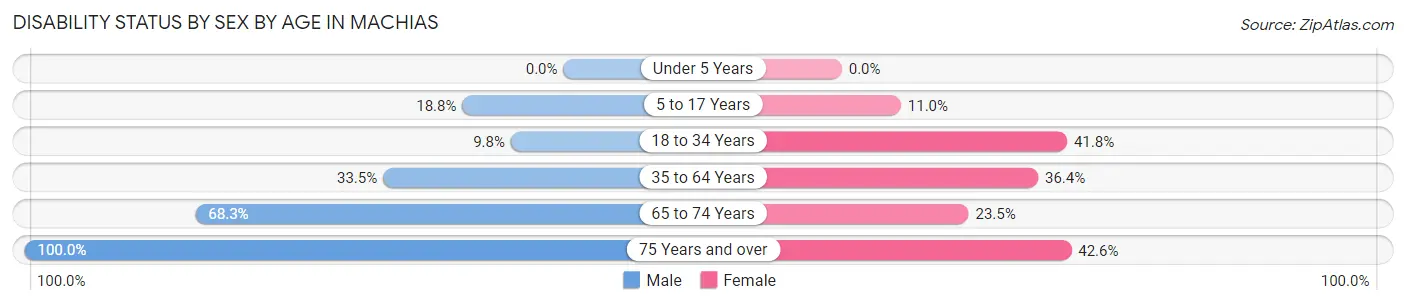
| Age Bracket | Male | Female |
| Under 5 Years | 0 (0.0%) | 0 (0.0%) |
| 5 to 17 Years | 12 (18.8%) | 8 (11.0%) |
| 18 to 34 Years | 16 (9.8%) | 51 (41.8%) |
| 35 to 64 Years | 79 (33.5%) | 98 (36.4%) |
| 65 to 74 Years | 28 (68.3%) | 20 (23.5%) |
| 75 Years and over | 18 (100.0%) | 46 (42.6%) |
Disability Class by Sex by Age in Machias
Disability Class: Hearing Difficulty
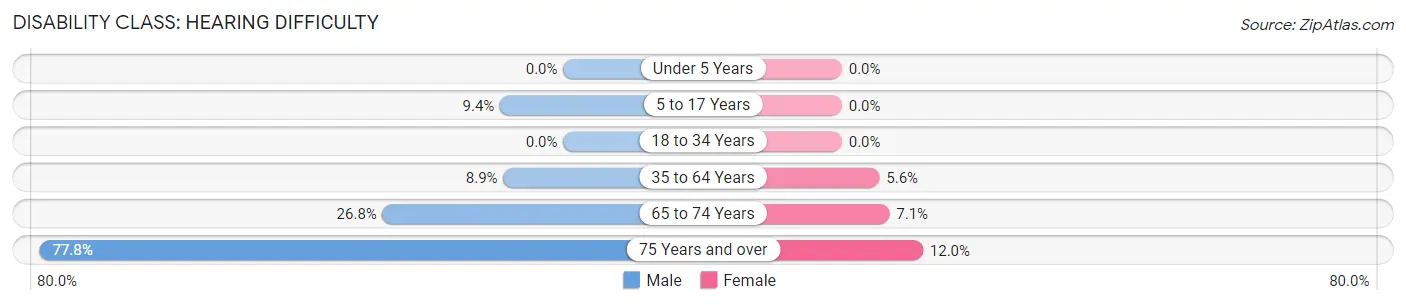
| Age Bracket | Male | Female |
| Under 5 Years | 0 (0.0%) | 0 (0.0%) |
| 5 to 17 Years | 6 (9.4%) | 0 (0.0%) |
| 18 to 34 Years | 0 (0.0%) | 0 (0.0%) |
| 35 to 64 Years | 21 (8.9%) | 15 (5.6%) |
| 65 to 74 Years | 11 (26.8%) | 6 (7.1%) |
| 75 Years and over | 14 (77.8%) | 13 (12.0%) |
Disability Class: Vision Difficulty
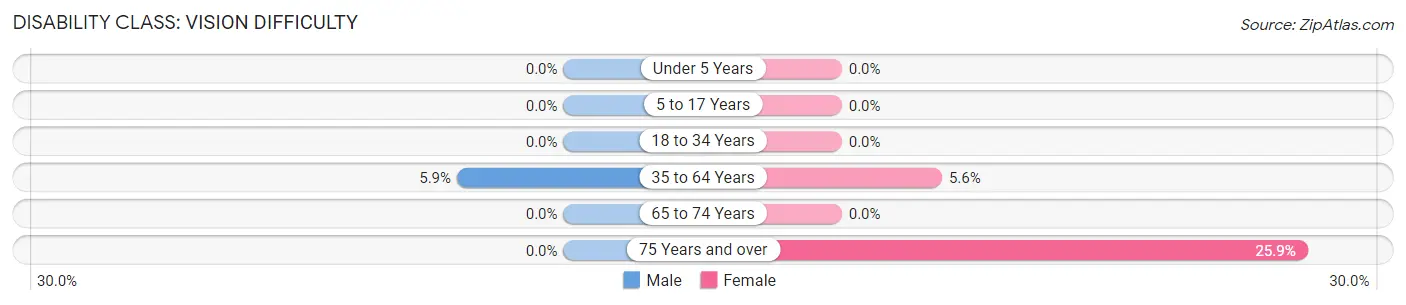
| Age Bracket | Male | Female |
| Under 5 Years | 0 (0.0%) | 0 (0.0%) |
| 5 to 17 Years | 0 (0.0%) | 0 (0.0%) |
| 18 to 34 Years | 0 (0.0%) | 0 (0.0%) |
| 35 to 64 Years | 14 (5.9%) | 15 (5.6%) |
| 65 to 74 Years | 0 (0.0%) | 0 (0.0%) |
| 75 Years and over | 0 (0.0%) | 28 (25.9%) |
Disability Class: Cognitive Difficulty
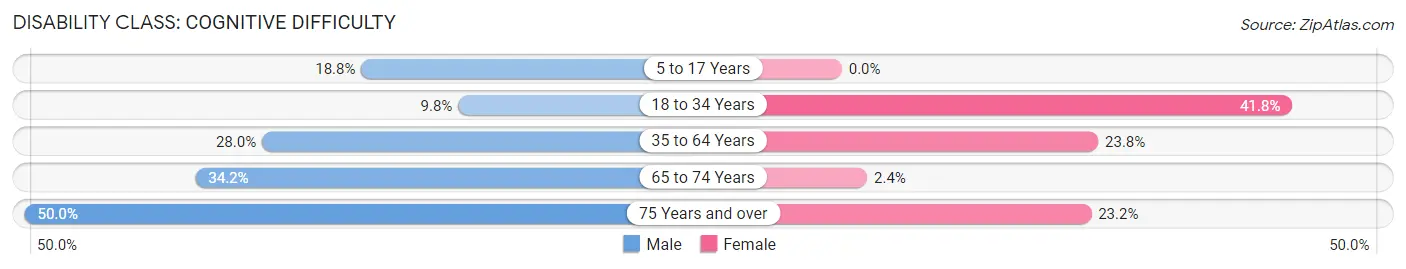
| Age Bracket | Male | Female |
| 5 to 17 Years | 12 (18.8%) | 0 (0.0%) |
| 18 to 34 Years | 16 (9.8%) | 51 (41.8%) |
| 35 to 64 Years | 66 (28.0%) | 64 (23.8%) |
| 65 to 74 Years | 14 (34.2%) | 2 (2.4%) |
| 75 Years and over | 9 (50.0%) | 25 (23.2%) |
Disability Class: Ambulatory Difficulty
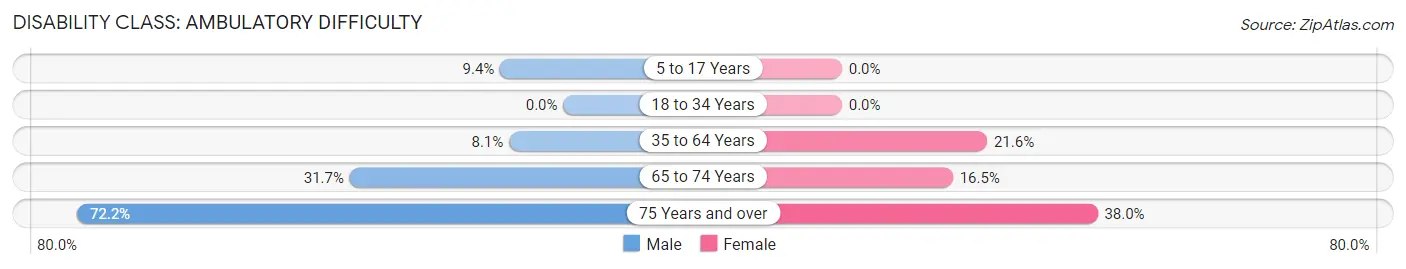
| Age Bracket | Male | Female |
| 5 to 17 Years | 6 (9.4%) | 0 (0.0%) |
| 18 to 34 Years | 0 (0.0%) | 0 (0.0%) |
| 35 to 64 Years | 19 (8.1%) | 58 (21.6%) |
| 65 to 74 Years | 13 (31.7%) | 14 (16.5%) |
| 75 Years and over | 13 (72.2%) | 41 (38.0%) |
Disability Class: Self-Care Difficulty
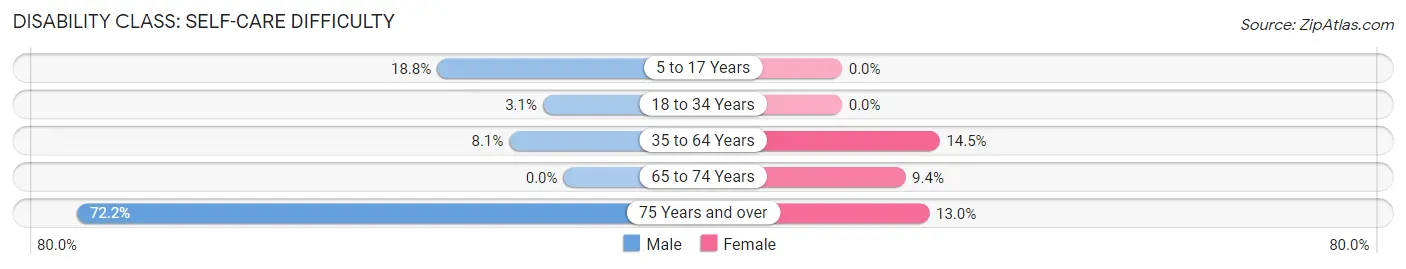
| Age Bracket | Male | Female |
| 5 to 17 Years | 12 (18.8%) | 0 (0.0%) |
| 18 to 34 Years | 5 (3.0%) | 0 (0.0%) |
| 35 to 64 Years | 19 (8.1%) | 39 (14.5%) |
| 65 to 74 Years | 0 (0.0%) | 8 (9.4%) |
| 75 Years and over | 13 (72.2%) | 14 (13.0%) |
Technology Access in Machias
Computing Device Access in Machias
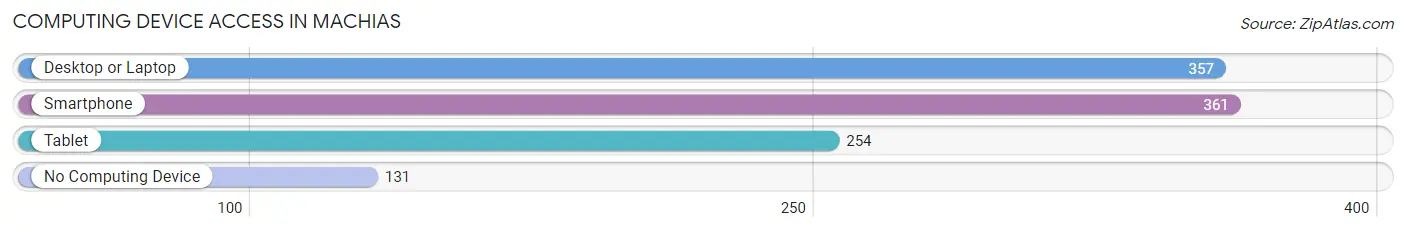
| Device Type | # Households | % Households |
| Desktop or Laptop | 357 | 61.1% |
| Smartphone | 361 | 61.8% |
| Tablet | 254 | 43.5% |
| No Computing Device | 131 | 22.4% |
| Total | 584 | 100.0% |
Internet Access in Machias
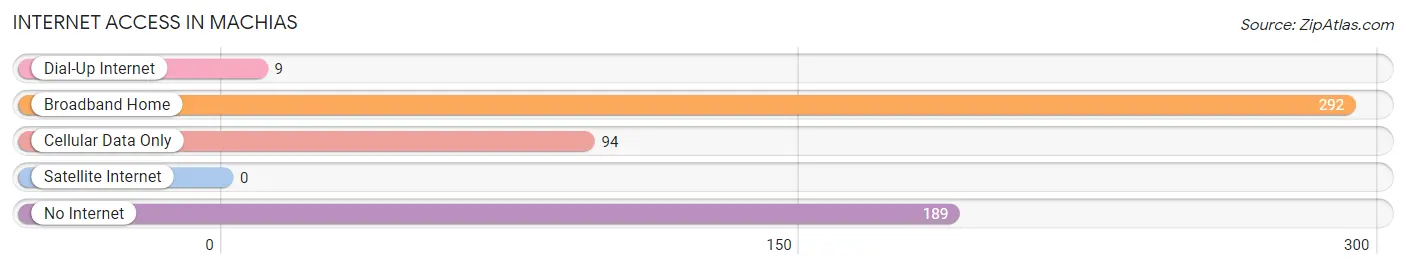
| Internet Type | # Households | % Households |
| Dial-Up Internet | 9 | 1.5% |
| Broadband Home | 292 | 50.0% |
| Cellular Data Only | 94 | 16.1% |
| Satellite Internet | 0 | 0.0% |
| No Internet | 189 | 32.4% |
| Total | 584 | 100.0% |
Machias Summary
History
The town of Machias, Maine is located in Washington County and is the county seat. It is situated on the Machias River, which is a tributary of the larger Narraguagus River. The town was first settled in 1763 by a group of settlers from Massachusetts, led by Captain Benjamin Church. The town was named after the river, which was named after the Native American tribe that lived in the area, the Machias.
The town was an important port during the Revolutionary War, as it was the site of the Battle of Machias, which was the first naval battle of the war. The town was also the site of the first naval victory of the war, when the colonists captured the British schooner Margaretta.
The town was incorporated in 1786 and has since grown to a population of over 2,000 people. The town is home to the University of Maine at Machias, which was founded in 1891.
Geography
Machias is located in the eastern part of Washington County, in the state of Maine. It is situated on the Machias River, which is a tributary of the larger Narraguagus River. The town is bordered by the towns of East Machias, Cutler, and Whiting.
The town has a total area of 24.2 square miles, of which 23.7 square miles is land and 0.5 square miles is water. The town is located in a rural area, with the majority of the land being used for farming and forestry.
Economy
The economy of Machias is largely based on agriculture and forestry. The town is home to several farms, which produce a variety of crops, including potatoes, corn, and hay. The town is also home to several sawmills, which produce lumber for the local market.
The town is also home to several businesses, including a grocery store, a hardware store, and a few restaurants. The town is also home to the University of Maine at Machias, which provides employment for many of the town's residents.
Demographics
As of the 2010 census, the town of Machias had a population of 2,221 people. The racial makeup of the town was 97.2% White, 0.7% African American, 0.3% Native American, 0.3% Asian, 0.1% Pacific Islander, 0.2% from other races, and 1.3% from two or more races. Hispanic or Latino of any race were 0.9% of the population.
The median income for a household in the town was $35,938, and the median income for a family was $45,000. The per capita income for the town was $18,945. About 16.2% of families and 22.2% of the population were below the poverty line, including 28.3% of those under age 18 and 11.2% of those age 65 or over.
Common Questions
What is Per Capita Income in Machias?
Per Capita income in Machias is $17,371.
What is the Median Family Income in Machias?
Median Family Income in Machias is $41,688.
What is the Median Household income in Machias?
Median Household Income in Machias is $25,278.
What is Income or Wage Gap in Machias?
Income or Wage Gap in Machias is 37.9%.
Women in Machias earn 62.1 cents for every dollar earned by a man.
What is Inequality or Gini Index in Machias?
Inequality or Gini Index in Machias is 0.48.
What is the Total Population of Machias?
Total Population of Machias is 1,331.
What is the Total Male Population of Machias?
Total Male Population of Machias is 618.
What is the Total Female Population of Machias?
Total Female Population of Machias is 713.
What is the Ratio of Males per 100 Females in Machias?
There are 86.68 Males per 100 Females in Machias.
What is the Ratio of Females per 100 Males in Machias?
There are 115.37 Females per 100 Males in Machias.
What is the Median Population Age in Machias?
Median Population Age in Machias is 52.2 Years.
What is the Average Family Size in Machias
Average Family Size in Machias is 2.8 People.
What is the Average Household Size in Machias
Average Household Size in Machias is 1.8 People.
How Large is the Labor Force in Machias?
There are 474 People in the Labor Forcein in Machias.
What is the Percentage of People in the Labor Force in Machias?
40.0% of People are in the Labor Force in Machias.
What is the Unemployment Rate in Machias?
Unemployment Rate in Machias is 8.6%.