Topsham, ME Map & Demographics
Topsham Map
Topsham Overview
$45,738
PER CAPITA INCOME
$97,377
AVG FAMILY INCOME
$75,801
AVG HOUSEHOLD INCOME
20.9%
WAGE / INCOME GAP [ % ]
79.1¢/ $1
WAGE / INCOME GAP [ $ ]
0.47
INEQUALITY / GINI INDEX
6,813
TOTAL POPULATION
3,151
MALE POPULATION
3,662
FEMALE POPULATION
86.05
MALES / 100 FEMALES
116.22
FEMALES / 100 MALES
46.6
MEDIAN AGE
2.9
AVG FAMILY SIZE
2.3
AVG HOUSEHOLD SIZE
3,589
LABOR FORCE [ PEOPLE ]
62.6%
PERCENT IN LABOR FORCE
5.4%
UNEMPLOYMENT RATE
Topsham Zip Codes
Topsham Area Codes
Income in Topsham
Income Overview in Topsham
Per Capita Income in Topsham is $45,738, while median incomes of families and households are $97,377 and $75,801 respectively.
| Characteristic | Number | Measure |
| Per Capita Income | 6,813 | $45,738 |
| Median Family Income | 1,792 | $97,377 |
| Mean Family Income | 1,792 | $133,366 |
| Median Household Income | 2,972 | $75,801 |
| Mean Household Income | 2,972 | $103,116 |
| Income Deficit | 1,792 | $0 |
| Wage / Income Gap (%) | 6,813 | 20.94% |
| Wage / Income Gap ($) | 6,813 | 79.06¢ per $1 |
| Gini / Inequality Index | 6,813 | 0.47 |
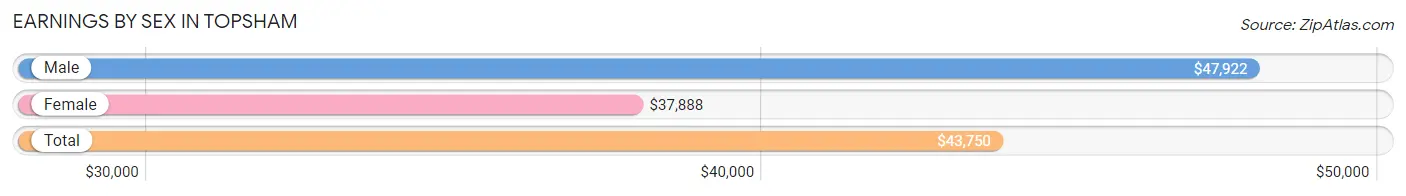
Earnings by Sex in Topsham
Average Earnings in Topsham are $43,750, $47,922 for men and $37,888 for women, a difference of 20.9%.
| Sex | Number | Average Earnings |
| Male | 1,873 (50.3%) | $47,922 |
| Female | 1,847 (49.6%) | $37,888 |
| Total | 3,720 (100.0%) | $43,750 |
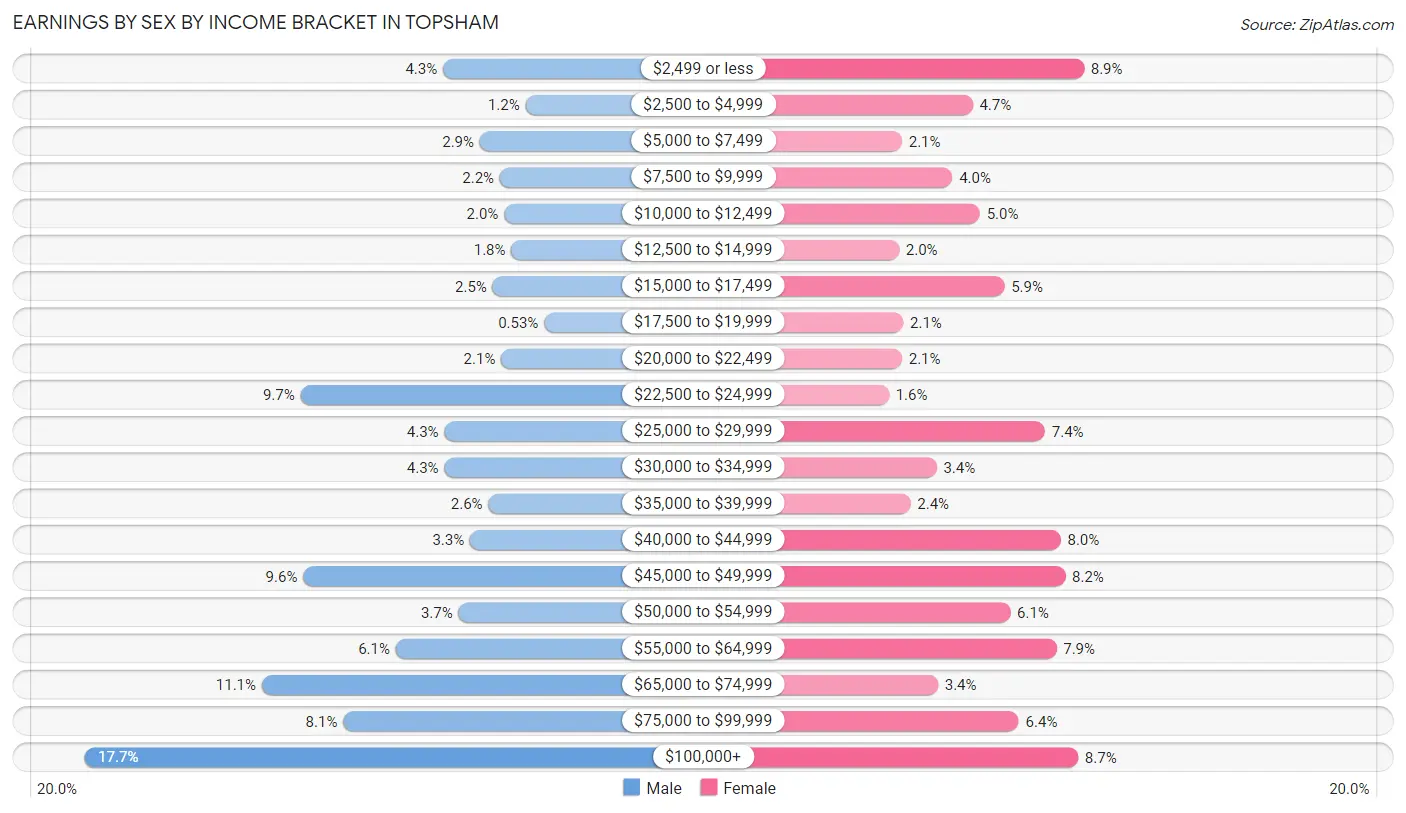
Earnings by Sex by Income Bracket in Topsham
The most common earnings brackets in Topsham are $100,000+ for men (332 | 17.7%) and $2,499 or less for women (164 | 8.9%).
| Income | Male | Female |
| $2,499 or less | 81 (4.3%) | 164 (8.9%) |
| $2,500 to $4,999 | 23 (1.2%) | 87 (4.7%) |
| $5,000 to $7,499 | 55 (2.9%) | 38 (2.1%) |
| $7,500 to $9,999 | 41 (2.2%) | 73 (4.0%) |
| $10,000 to $12,499 | 38 (2.0%) | 92 (5.0%) |
| $12,500 to $14,999 | 33 (1.8%) | 36 (1.9%) |
| $15,000 to $17,499 | 46 (2.5%) | 109 (5.9%) |
| $17,500 to $19,999 | 10 (0.5%) | 39 (2.1%) |
| $20,000 to $22,499 | 40 (2.1%) | 38 (2.1%) |
| $22,500 to $24,999 | 181 (9.7%) | 29 (1.6%) |
| $25,000 to $29,999 | 80 (4.3%) | 137 (7.4%) |
| $30,000 to $34,999 | 80 (4.3%) | 62 (3.4%) |
| $35,000 to $39,999 | 49 (2.6%) | 44 (2.4%) |
| $40,000 to $44,999 | 62 (3.3%) | 148 (8.0%) |
| $45,000 to $49,999 | 179 (9.6%) | 151 (8.2%) |
| $50,000 to $54,999 | 70 (3.7%) | 113 (6.1%) |
| $55,000 to $64,999 | 114 (6.1%) | 145 (7.9%) |
| $65,000 to $74,999 | 208 (11.1%) | 63 (3.4%) |
| $75,000 to $99,999 | 151 (8.1%) | 119 (6.4%) |
| $100,000+ | 332 (17.7%) | 160 (8.7%) |
| Total | 1,873 (100.0%) | 1,847 (100.0%) |
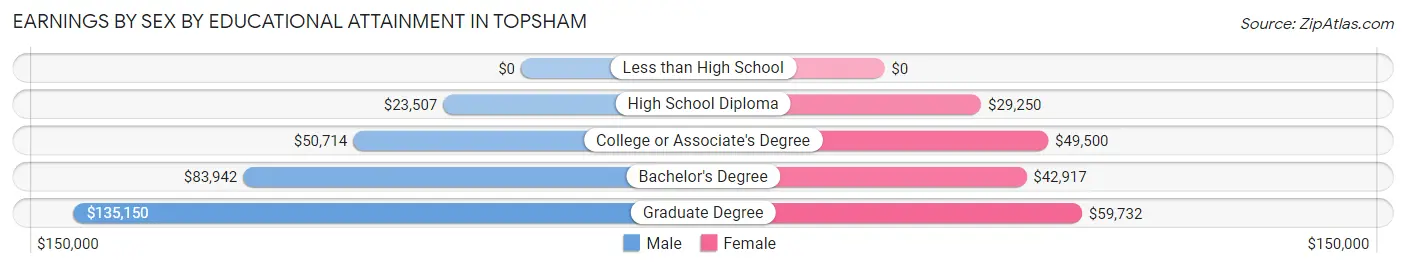
Earnings by Sex by Educational Attainment in Topsham
Average earnings in Topsham are $50,714 for men and $44,922 for women, a difference of 11.4%. Men with an educational attainment of graduate degree enjoy the highest average annual earnings of $135,150, while those with high school diploma education earn the least with $23,507. Women with an educational attainment of graduate degree earn the most with the average annual earnings of $59,732, while those with high school diploma education have the smallest earnings of $29,250.
| Educational Attainment | Male Income | Female Income |
| Less than High School | - | - |
| High School Diploma | $23,507 | $29,250 |
| College or Associate's Degree | $50,714 | $49,500 |
| Bachelor's Degree | $83,942 | $42,917 |
| Graduate Degree | $135,150 | $59,732 |
| Total | $50,714 | $44,922 |
Family Income in Topsham
Family Income Brackets in Topsham
According to the Topsham family income data, there are 444 families falling into the $100,000 to $149,999 income range, which is the most common income bracket and makes up 24.8% of all families. Conversely, the $15,000 to $24,999 income bracket is the least frequent group with only 16 families (0.9%) belonging to this category.
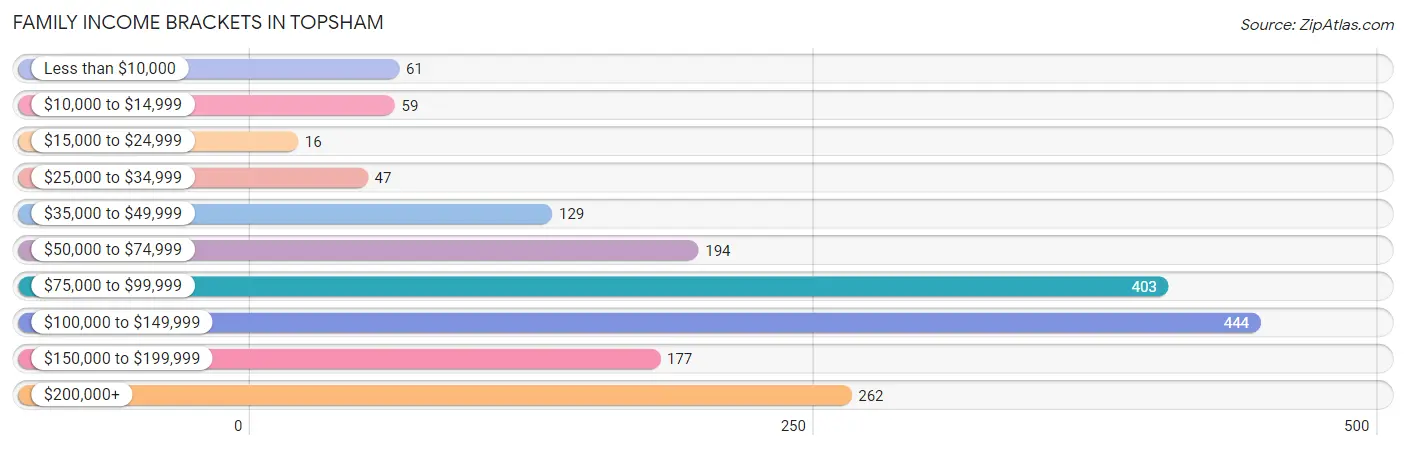
| Income Bracket | # Families | % Families |
| Less than $10,000 | 61 | 3.4% |
| $10,000 to $14,999 | 59 | 3.3% |
| $15,000 to $24,999 | 16 | 0.9% |
| $25,000 to $34,999 | 47 | 2.6% |
| $35,000 to $49,999 | 129 | 7.2% |
| $50,000 to $74,999 | 194 | 10.8% |
| $75,000 to $99,999 | 403 | 22.5% |
| $100,000 to $149,999 | 444 | 24.8% |
| $150,000 to $199,999 | 177 | 9.9% |
| $200,000+ | 262 | 14.6% |
Family Income by Famaliy Size in Topsham
3-person families (540 | 30.1%) account for the highest median family income in Topsham with $113,221 per family, while 2-person families (900 | 50.2%) have the highest median income of $50,086 per family member.
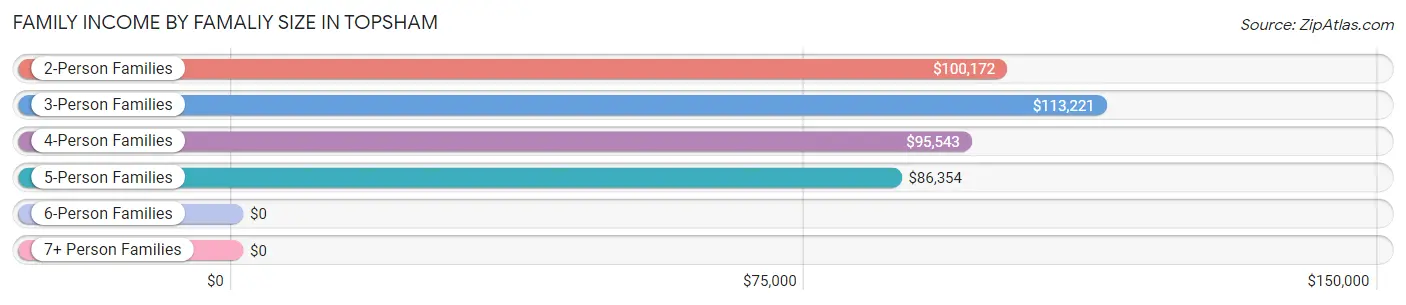
| Income Bracket | # Families | Median Income |
| 2-Person Families | 900 (50.2%) | $100,172 |
| 3-Person Families | 540 (30.1%) | $113,221 |
| 4-Person Families | 278 (15.5%) | $95,543 |
| 5-Person Families | 52 (2.9%) | $86,354 |
| 6-Person Families | 22 (1.2%) | $0 |
| 7+ Person Families | 0 (0.0%) | $0 |
| Total | 1,792 (100.0%) | $97,377 |
Family Income by Number of Earners in Topsham
The median family income in Topsham is $97,377, with families comprising 3+ earners (265) having the highest median family income of $215,417, while families with no earners (455) have the lowest median family income of $78,527, accounting for 14.8% and 25.4% of families, respectively.
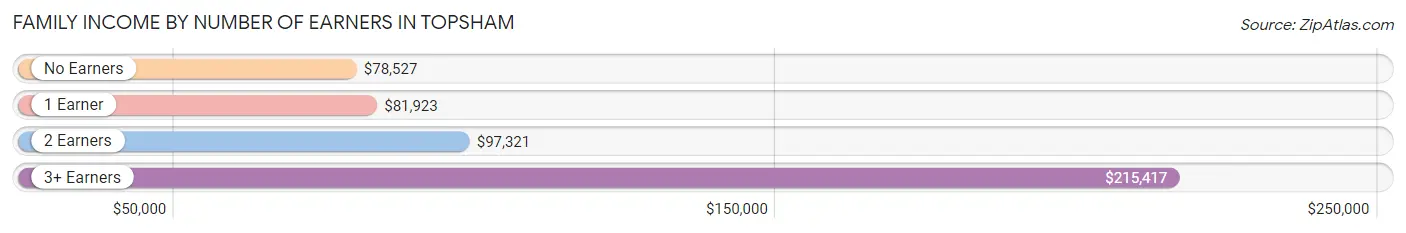
| Number of Earners | # Families | Median Income |
| No Earners | 455 (25.4%) | $78,527 |
| 1 Earner | 362 (20.2%) | $81,923 |
| 2 Earners | 710 (39.6%) | $97,321 |
| 3+ Earners | 265 (14.8%) | $215,417 |
| Total | 1,792 (100.0%) | $97,377 |
Household Income in Topsham
Household Income Brackets in Topsham
With 520 households falling in the category, the $50,000 to $74,999 income range is the most frequent in Topsham, accounting for 17.5% of all households. In contrast, only 125 households (4.2%) fall into the less than $10,000 income bracket, making it the least populous group.
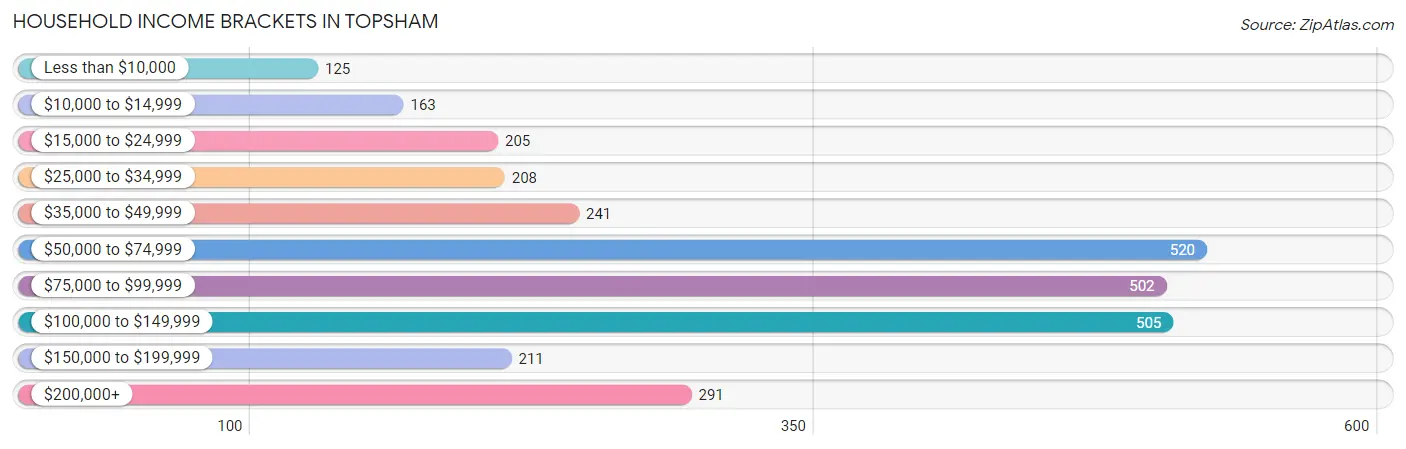
| Income Bracket | # Households | % Households |
| Less than $10,000 | 125 | 4.2% |
| $10,000 to $14,999 | 163 | 5.5% |
| $15,000 to $24,999 | 205 | 6.9% |
| $25,000 to $34,999 | 208 | 7.0% |
| $35,000 to $49,999 | 241 | 8.1% |
| $50,000 to $74,999 | 520 | 17.5% |
| $75,000 to $99,999 | 502 | 16.9% |
| $100,000 to $149,999 | 505 | 17.0% |
| $150,000 to $199,999 | 211 | 7.1% |
| $200,000+ | 291 | 9.8% |
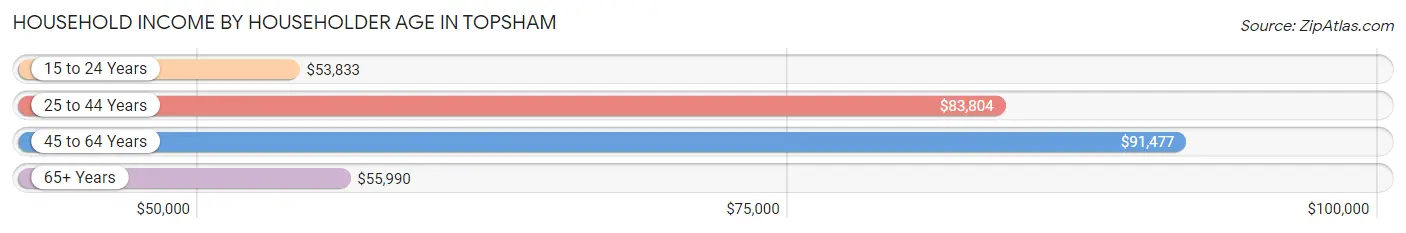
Household Income by Householder Age in Topsham
The median household income in Topsham is $75,801, with the highest median household income of $91,477 found in the 45 to 64 years age bracket for the primary householder. A total of 1,111 households (37.4%) fall into this category. Meanwhile, the 15 to 24 years age bracket for the primary householder has the lowest median household income of $53,833, with 32 households (1.1%) in this group.
| Income Bracket | # Households | Median Income |
| 15 to 24 Years | 32 (1.1%) | $53,833 |
| 25 to 44 Years | 726 (24.4%) | $83,804 |
| 45 to 64 Years | 1,111 (37.4%) | $91,477 |
| 65+ Years | 1,103 (37.1%) | $55,990 |
| Total | 2,972 (100.0%) | $75,801 |
Poverty in Topsham
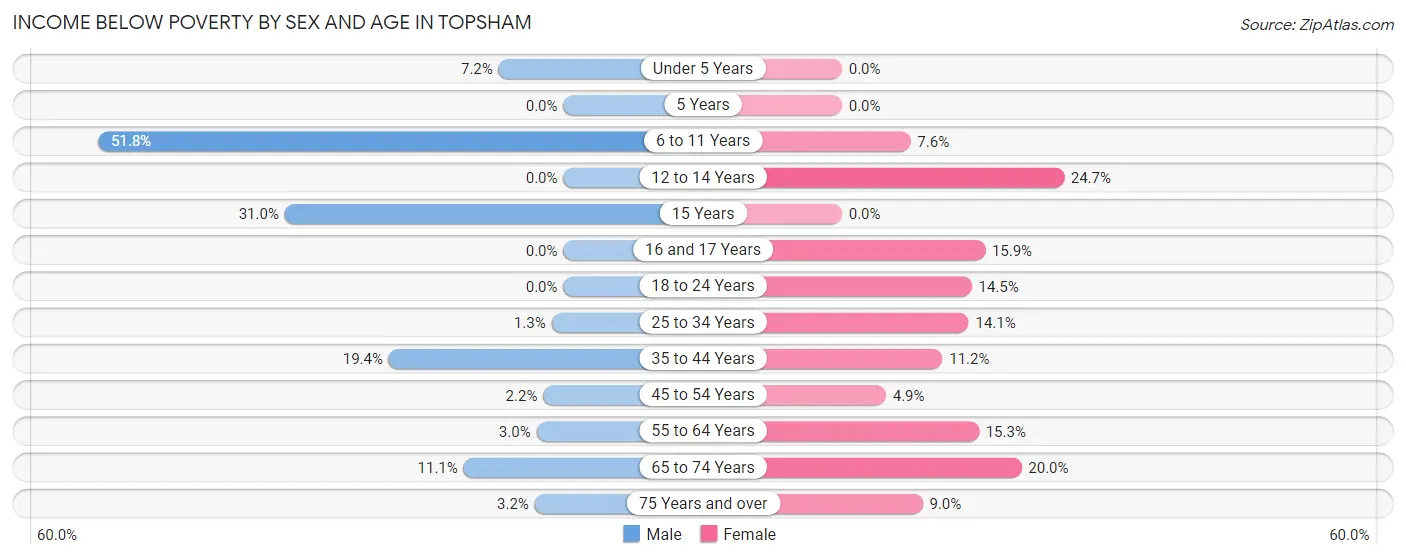
Income Below Poverty by Sex and Age in Topsham
With 9.3% poverty level for males and 11.5% for females among the residents of Topsham, 6 to 11 year old males and 12 to 14 year old females are the most vulnerable to poverty, with 113 males (51.8%) and 22 females (24.7%) in their respective age groups living below the poverty level.
| Age Bracket | Male | Female |
| Under 5 Years | 8 (7.2%) | 0 (0.0%) |
| 5 Years | 0 (0.0%) | 0 (0.0%) |
| 6 to 11 Years | 113 (51.8%) | 11 (7.6%) |
| 12 to 14 Years | 0 (0.0%) | 22 (24.7%) |
| 15 Years | 18 (31.0%) | 0 (0.0%) |
| 16 and 17 Years | 0 (0.0%) | 33 (15.9%) |
| 18 to 24 Years | 0 (0.0%) | 24 (14.5%) |
| 25 to 34 Years | 6 (1.3%) | 61 (14.1%) |
| 35 to 44 Years | 83 (19.4%) | 32 (11.2%) |
| 45 to 54 Years | 11 (2.2%) | 24 (4.9%) |
| 55 to 64 Years | 9 (3.0%) | 79 (15.2%) |
| 65 to 74 Years | 30 (11.1%) | 73 (20.0%) |
| 75 Years and over | 14 (3.2%) | 51 (9.0%) |
| Total | 292 (9.3%) | 410 (11.5%) |
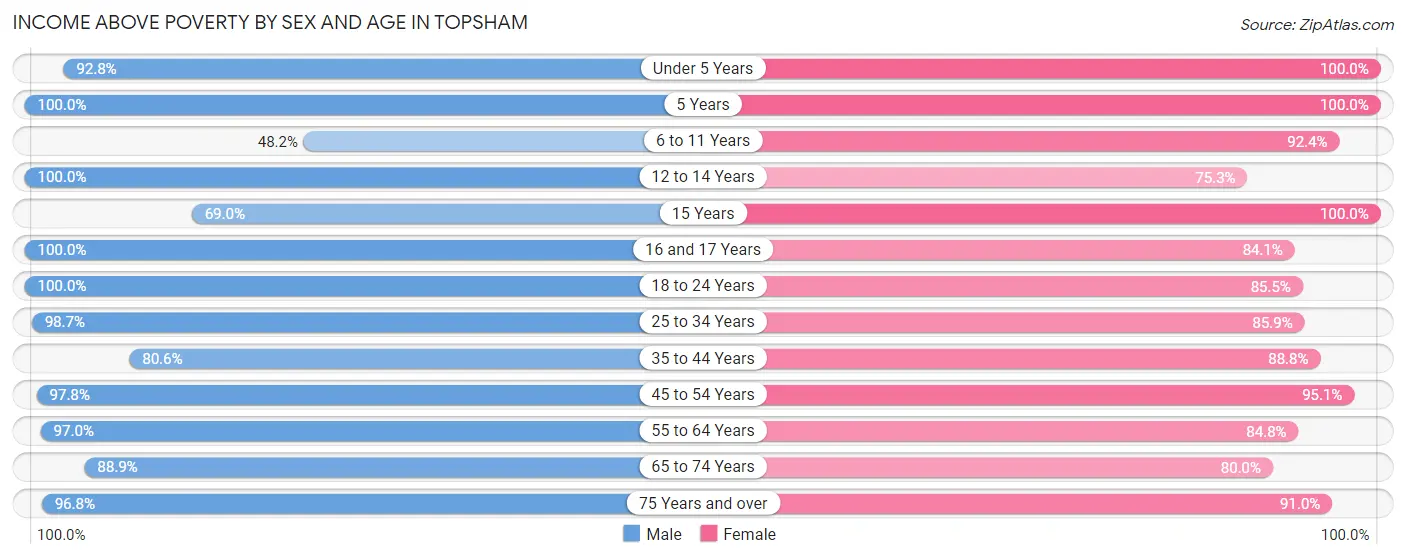
Income Above Poverty by Sex and Age in Topsham
According to the poverty statistics in Topsham, males aged 5 years and females aged under 5 years are the age groups that are most secure financially, with 100.0% of males and 100.0% of females in these age groups living above the poverty line.
| Age Bracket | Male | Female |
| Under 5 Years | 103 (92.8%) | 166 (100.0%) |
| 5 Years | 16 (100.0%) | 83 (100.0%) |
| 6 to 11 Years | 105 (48.2%) | 133 (92.4%) |
| 12 to 14 Years | 65 (100.0%) | 67 (75.3%) |
| 15 Years | 40 (69.0%) | 51 (100.0%) |
| 16 and 17 Years | 140 (100.0%) | 174 (84.1%) |
| 18 to 24 Years | 133 (100.0%) | 142 (85.5%) |
| 25 to 34 Years | 450 (98.7%) | 371 (85.9%) |
| 35 to 44 Years | 344 (80.6%) | 254 (88.8%) |
| 45 to 54 Years | 481 (97.8%) | 466 (95.1%) |
| 55 to 64 Years | 292 (97.0%) | 439 (84.8%) |
| 65 to 74 Years | 240 (88.9%) | 292 (80.0%) |
| 75 Years and over | 425 (96.8%) | 516 (91.0%) |
| Total | 2,834 (90.7%) | 3,154 (88.5%) |
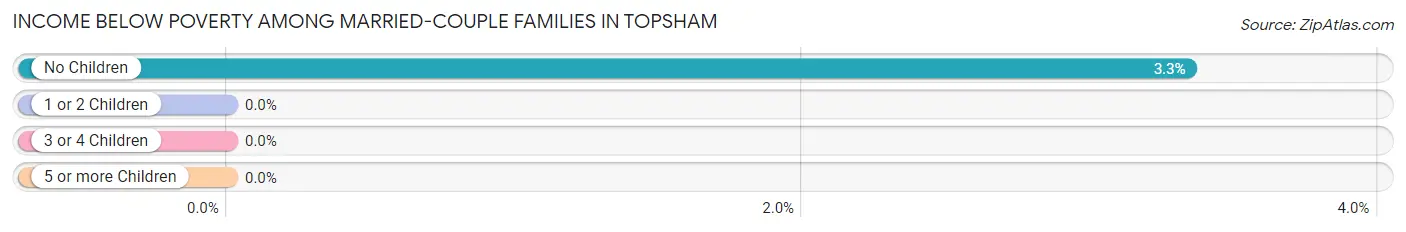
Income Below Poverty Among Married-Couple Families in Topsham
The poverty statistics for married-couple families in Topsham show that 2.0% or 30 of the total 1,483 families live below the poverty line. Families with no children have the highest poverty rate of 3.3%, comprising of 30 families. On the other hand, families with 1 or 2 children have the lowest poverty rate of 0.0%, which includes 0 families.
| Children | Above Poverty | Below Poverty |
| No Children | 868 (96.7%) | 30 (3.3%) |
| 1 or 2 Children | 526 (100.0%) | 0 (0.0%) |
| 3 or 4 Children | 59 (100.0%) | 0 (0.0%) |
| 5 or more Children | 0 (0.0%) | 0 (0.0%) |
| Total | 1,453 (98.0%) | 30 (2.0%) |
Income Below Poverty Among Single-Parent Households in Topsham
According to the poverty data in Topsham, 50.5% or 50 single-father households and 26.7% or 56 single-mother households are living below the poverty line. Among single-father households, those with 1 or 2 children have the highest poverty rate, with 50 households (61.0%) experiencing poverty. Likewise, among single-mother households, those with 1 or 2 children have the highest poverty rate, with 56 households (46.3%) falling below the poverty line.
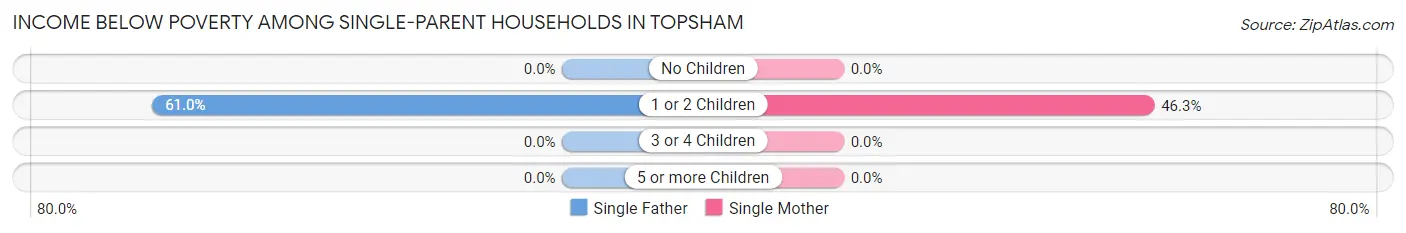
| Children | Single Father | Single Mother |
| No Children | 0 (0.0%) | 0 (0.0%) |
| 1 or 2 Children | 50 (61.0%) | 56 (46.3%) |
| 3 or 4 Children | 0 (0.0%) | 0 (0.0%) |
| 5 or more Children | 0 (0.0%) | 0 (0.0%) |
| Total | 50 (50.5%) | 56 (26.7%) |
Income Below Poverty Among Married-Couple vs Single-Parent Households in Topsham
The poverty data for Topsham shows that 30 of the married-couple family households (2.0%) and 106 of the single-parent households (34.3%) are living below the poverty level. Within the married-couple family households, those with no children have the highest poverty rate, with 30 households (3.3%) falling below the poverty line. Among the single-parent households, those with 1 or 2 children have the highest poverty rate, with 106 household (52.2%) living below poverty.
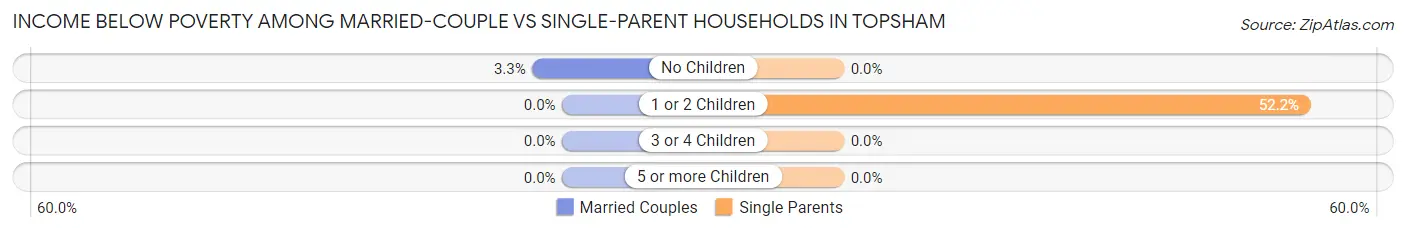
| Children | Married-Couple Families | Single-Parent Households |
| No Children | 30 (3.3%) | 0 (0.0%) |
| 1 or 2 Children | 0 (0.0%) | 106 (52.2%) |
| 3 or 4 Children | 0 (0.0%) | 0 (0.0%) |
| 5 or more Children | 0 (0.0%) | 0 (0.0%) |
| Total | 30 (2.0%) | 106 (34.3%) |
Race in Topsham
The most populous races in Topsham are White / Caucasian (6,480 | 95.1%), Two or more Races (193 | 2.8%), and Hispanic or Latino (103 | 1.5%).
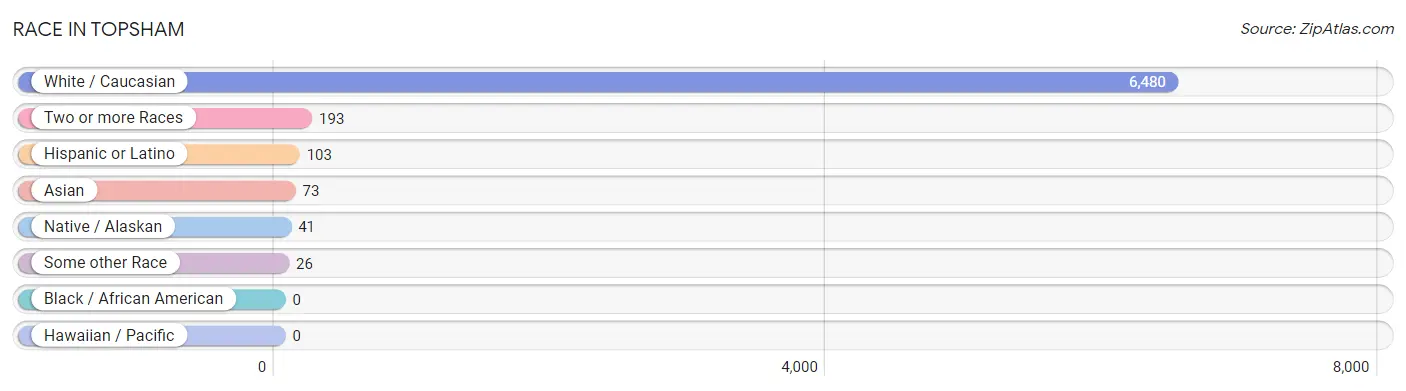
| Race | # Population | % Population |
| Asian | 73 | 1.1% |
| Black / African American | 0 | 0.0% |
| Hawaiian / Pacific | 0 | 0.0% |
| Hispanic or Latino | 103 | 1.5% |
| Native / Alaskan | 41 | 0.6% |
| White / Caucasian | 6,480 | 95.1% |
| Two or more Races | 193 | 2.8% |
| Some other Race | 26 | 0.4% |
| Total | 6,813 | 100.0% |
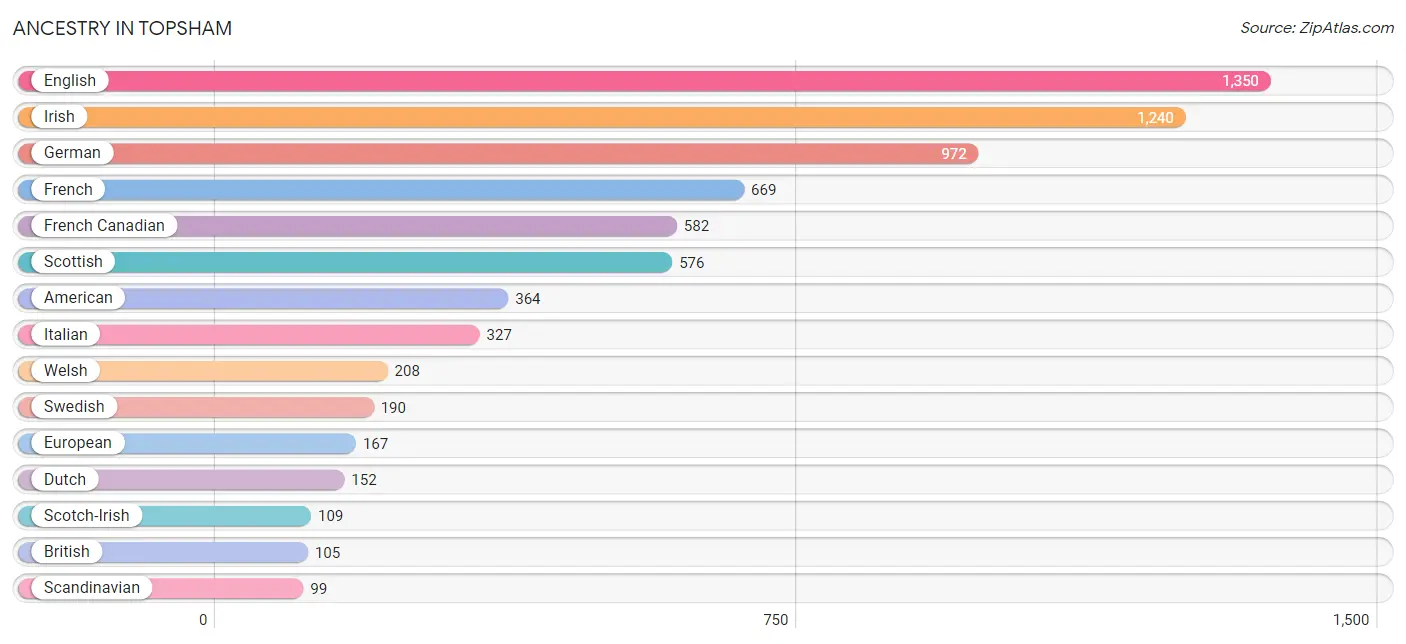
Ancestry in Topsham
The most populous ancestries reported in Topsham are English (1,350 | 19.8%), Irish (1,240 | 18.2%), German (972 | 14.3%), French (669 | 9.8%), and French Canadian (582 | 8.5%), together accounting for 70.6% of all Topsham residents.
| Ancestry | # Population | % Population |
| African | 28 | 0.4% |
| American | 364 | 5.3% |
| Austrian | 3 | 0.0% |
| Belgian | 6 | 0.1% |
| Bhutanese | 3 | 0.0% |
| British | 105 | 1.5% |
| Canadian | 64 | 0.9% |
| Central American | 27 | 0.4% |
| Central American Indian | 27 | 0.4% |
| Danish | 20 | 0.3% |
| Dutch | 152 | 2.2% |
| Eastern European | 47 | 0.7% |
| English | 1,350 | 19.8% |
| European | 167 | 2.5% |
| French | 669 | 9.8% |
| French Canadian | 582 | 8.5% |
| German | 972 | 14.3% |
| Greek | 7 | 0.1% |
| Guatemalan | 27 | 0.4% |
| Hungarian | 12 | 0.2% |
| Indian (Asian) | 82 | 1.2% |
| Irish | 1,240 | 18.2% |
| Italian | 327 | 4.8% |
| Korean | 2 | 0.0% |
| Latvian | 6 | 0.1% |
| Mexican | 63 | 0.9% |
| Mexican American Indian | 14 | 0.2% |
| Northern European | 40 | 0.6% |
| Norwegian | 88 | 1.3% |
| Peruvian | 12 | 0.2% |
| Polish | 56 | 0.8% |
| Portuguese | 32 | 0.5% |
| Puerto Rican | 1 | 0.0% |
| Russian | 18 | 0.3% |
| Scandinavian | 99 | 1.5% |
| Scotch-Irish | 109 | 1.6% |
| Scottish | 576 | 8.5% |
| Slavic | 8 | 0.1% |
| Slovak | 25 | 0.4% |
| South American | 12 | 0.2% |
| Subsaharan African | 28 | 0.4% |
| Swedish | 190 | 2.8% |
| Swiss | 25 | 0.4% |
| Turkish | 17 | 0.3% |
| Welsh | 208 | 3.0% | View All 45 Rows |
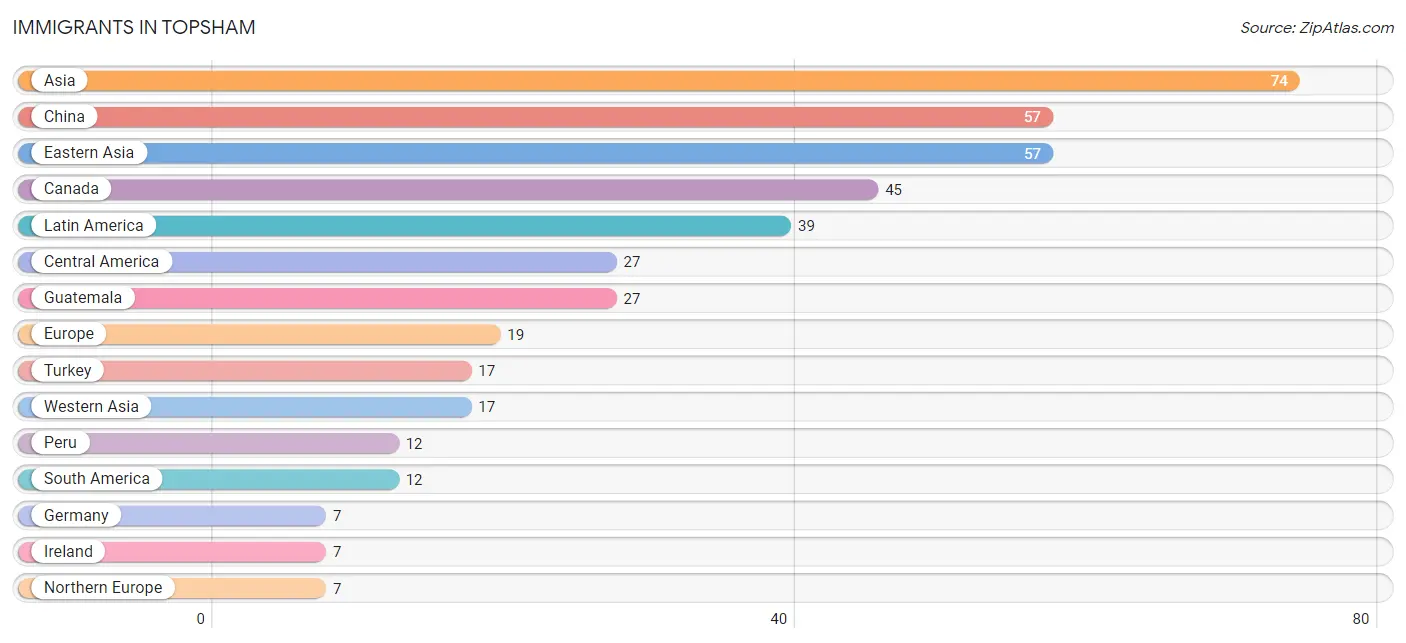
Immigrants in Topsham
The most numerous immigrant groups reported in Topsham came from Asia (74 | 1.1%), China (57 | 0.8%), Eastern Asia (57 | 0.8%), Canada (45 | 0.7%), and Latin America (39 | 0.6%), together accounting for 4.0% of all Topsham residents.
| Immigration Origin | # Population | % Population |
| Asia | 74 | 1.1% |
| Canada | 45 | 0.7% |
| Central America | 27 | 0.4% |
| China | 57 | 0.8% |
| Eastern Asia | 57 | 0.8% |
| Eastern Europe | 5 | 0.1% |
| Europe | 19 | 0.3% |
| Germany | 7 | 0.1% |
| Guatemala | 27 | 0.4% |
| Ireland | 7 | 0.1% |
| Latin America | 39 | 0.6% |
| Northern Europe | 7 | 0.1% |
| Peru | 12 | 0.2% |
| Poland | 5 | 0.1% |
| South America | 12 | 0.2% |
| Turkey | 17 | 0.3% |
| Western Asia | 17 | 0.3% |
| Western Europe | 7 | 0.1% | View All 18 Rows |
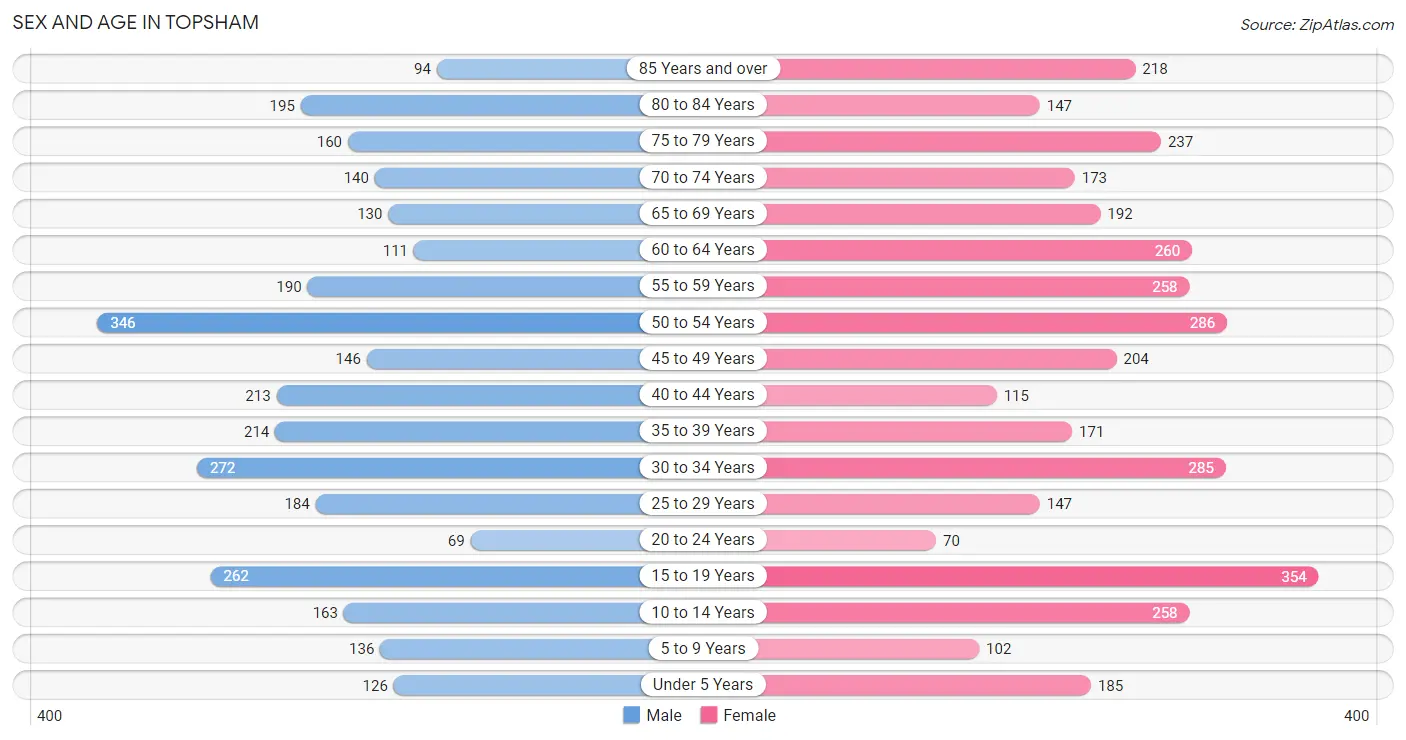
Sex and Age in Topsham
Sex and Age in Topsham
The most populous age groups in Topsham are 50 to 54 Years (346 | 11.0%) for men and 15 to 19 Years (354 | 9.7%) for women.
| Age Bracket | Male | Female |
| Under 5 Years | 126 (4.0%) | 185 (5.1%) |
| 5 to 9 Years | 136 (4.3%) | 102 (2.8%) |
| 10 to 14 Years | 163 (5.2%) | 258 (7.0%) |
| 15 to 19 Years | 262 (8.3%) | 354 (9.7%) |
| 20 to 24 Years | 69 (2.2%) | 70 (1.9%) |
| 25 to 29 Years | 184 (5.8%) | 147 (4.0%) |
| 30 to 34 Years | 272 (8.6%) | 285 (7.8%) |
| 35 to 39 Years | 214 (6.8%) | 171 (4.7%) |
| 40 to 44 Years | 213 (6.8%) | 115 (3.1%) |
| 45 to 49 Years | 146 (4.6%) | 204 (5.6%) |
| 50 to 54 Years | 346 (11.0%) | 286 (7.8%) |
| 55 to 59 Years | 190 (6.0%) | 258 (7.0%) |
| 60 to 64 Years | 111 (3.5%) | 260 (7.1%) |
| 65 to 69 Years | 130 (4.1%) | 192 (5.2%) |
| 70 to 74 Years | 140 (4.4%) | 173 (4.7%) |
| 75 to 79 Years | 160 (5.1%) | 237 (6.5%) |
| 80 to 84 Years | 195 (6.2%) | 147 (4.0%) |
| 85 Years and over | 94 (3.0%) | 218 (5.9%) |
| Total | 3,151 (100.0%) | 3,662 (100.0%) |
Families and Households in Topsham
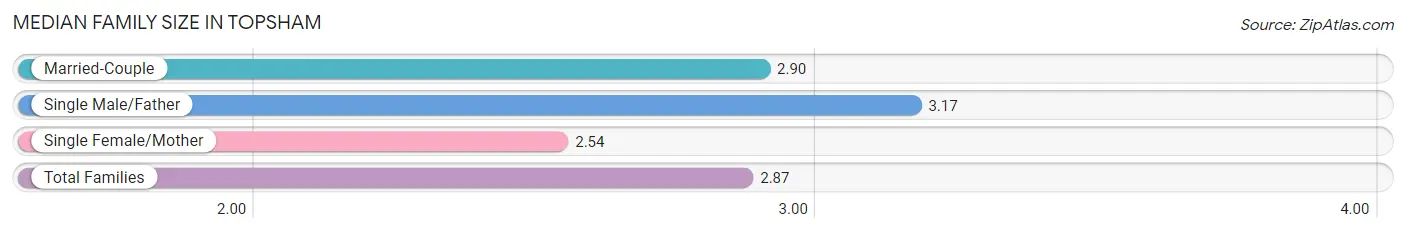
Median Family Size in Topsham
The median family size in Topsham is 2.87 persons per family, with single male/father families (99 | 5.5%) accounting for the largest median family size of 3.17 persons per family. On the other hand, single female/mother families (210 | 11.7%) represent the smallest median family size with 2.54 persons per family.
| Family Type | # Families | Family Size |
| Married-Couple | 1,483 (82.8%) | 2.90 |
| Single Male/Father | 99 (5.5%) | 3.17 |
| Single Female/Mother | 210 (11.7%) | 2.54 |
| Total Families | 1,792 (100.0%) | 2.87 |
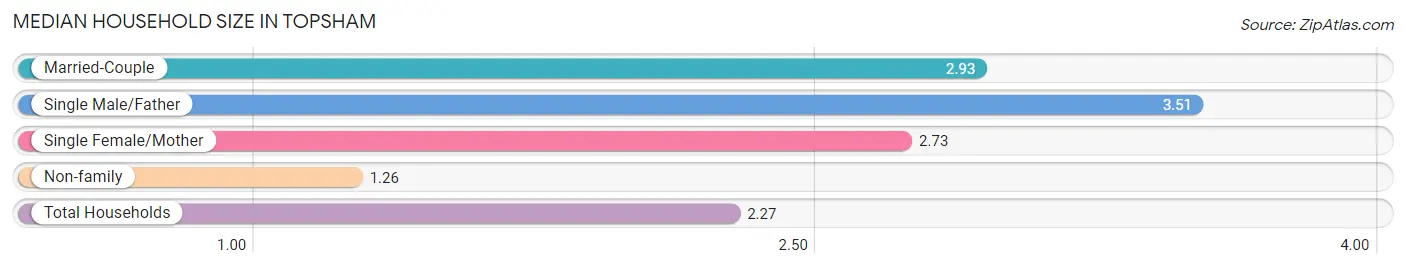
Median Household Size in Topsham
The median household size in Topsham is 2.27 persons per household, with single male/father households (99 | 3.3%) accounting for the largest median household size of 3.51 persons per household. non-family households (1,180 | 39.7%) represent the smallest median household size with 1.26 persons per household.
| Household Type | # Households | Household Size |
| Married-Couple | 1,483 (49.9%) | 2.93 |
| Single Male/Father | 99 (3.3%) | 3.51 |
| Single Female/Mother | 210 (7.1%) | 2.73 |
| Non-family | 1,180 (39.7%) | 1.26 |
| Total Households | 2,972 (100.0%) | 2.27 |
Household Size by Marriage Status in Topsham
Out of a total of 2,972 households in Topsham, 1,792 (60.3%) are family households, while 1,180 (39.7%) are nonfamily households. The most numerous type of family households are 2-person households, comprising 853, and the most common type of nonfamily households are 1-person households, comprising 893.
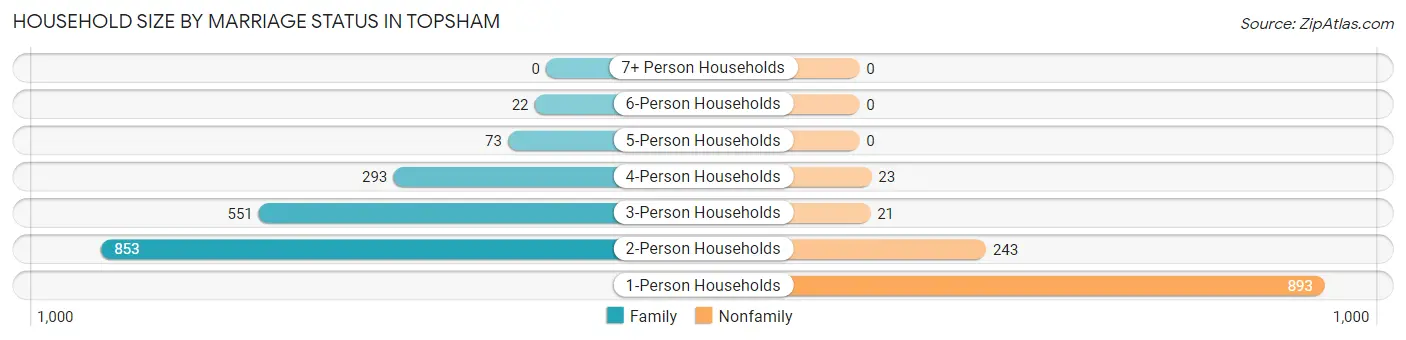
| Household Size | Family Households | Nonfamily Households |
| 1-Person Households | - | 893 (30.0%) |
| 2-Person Households | 853 (28.7%) | 243 (8.2%) |
| 3-Person Households | 551 (18.5%) | 21 (0.7%) |
| 4-Person Households | 293 (9.9%) | 23 (0.8%) |
| 5-Person Households | 73 (2.5%) | 0 (0.0%) |
| 6-Person Households | 22 (0.7%) | 0 (0.0%) |
| 7+ Person Households | 0 (0.0%) | 0 (0.0%) |
| Total | 1,792 (60.3%) | 1,180 (39.7%) |
Female Fertility in Topsham
Fertility by Age in Topsham
Average fertility rate in Topsham is 28.0 births per 1,000 women. Women in the age bracket of 35 to 50 years have the highest fertility rate with 37.0 births per 1,000 women. Women in the age bracket of 35 to 50 years acount for 56.1% of all women with births.
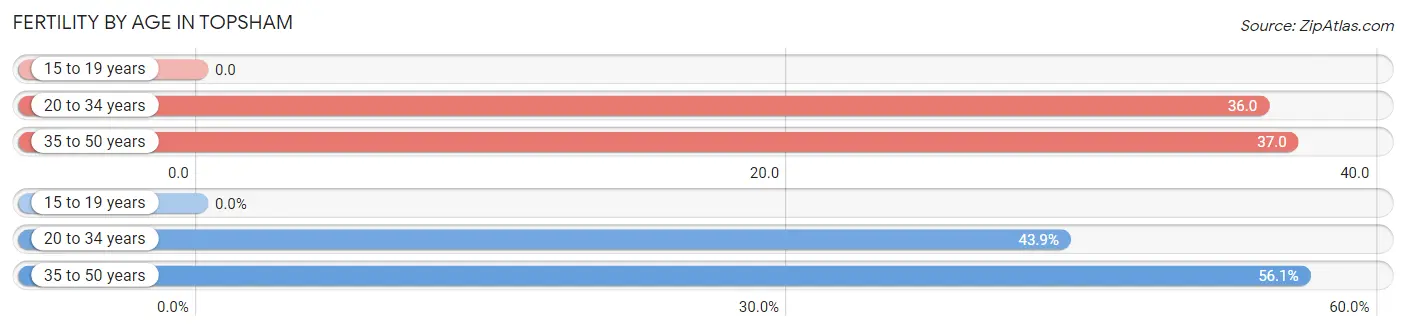
| Age Bracket | Women with Births | Births / 1,000 Women |
| 15 to 19 years | 0 (0.0%) | 0.0 |
| 20 to 34 years | 18 (43.9%) | 36.0 |
| 35 to 50 years | 23 (56.1%) | 37.0 |
| Total | 41 (100.0%) | 28.0 |
Fertility by Age by Marriage Status in Topsham
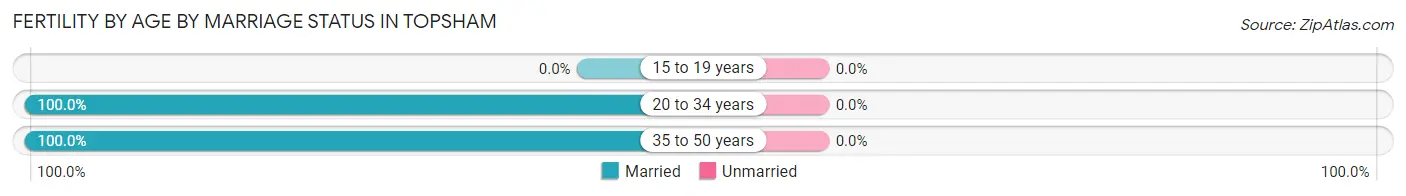
| Age Bracket | Married | Unmarried |
| 15 to 19 years | 0 (0.0%) | 0 (0.0%) |
| 20 to 34 years | 18 (100.0%) | 0 (0.0%) |
| 35 to 50 years | 23 (100.0%) | 0 (0.0%) |
| Total | 41 (100.0%) | 0 (0.0%) |
Fertility by Education in Topsham
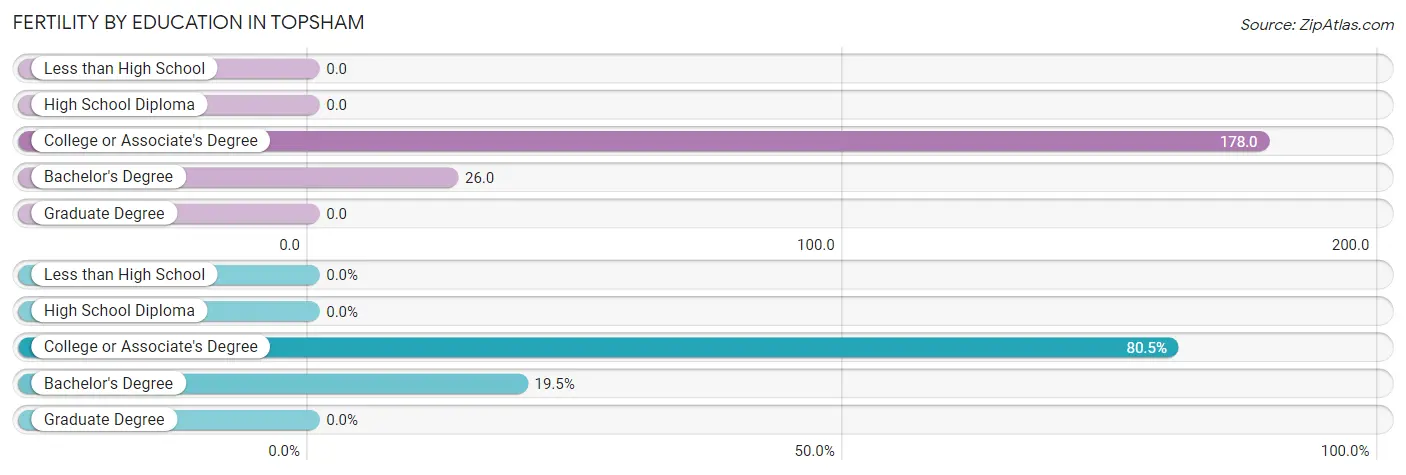
| Educational Attainment | Women with Births | Births / 1,000 Women |
| Less than High School | 0 (0.0%) | 0.0 |
| High School Diploma | 0 (0.0%) | 0.0 |
| College or Associate's Degree | 33 (80.5%) | 178.0 |
| Bachelor's Degree | 8 (19.5%) | 26.0 |
| Graduate Degree | 0 (0.0%) | 0.0 |
| Total | 41 (100.0%) | 28.0 |
Fertility by Education by Marriage Status in Topsham
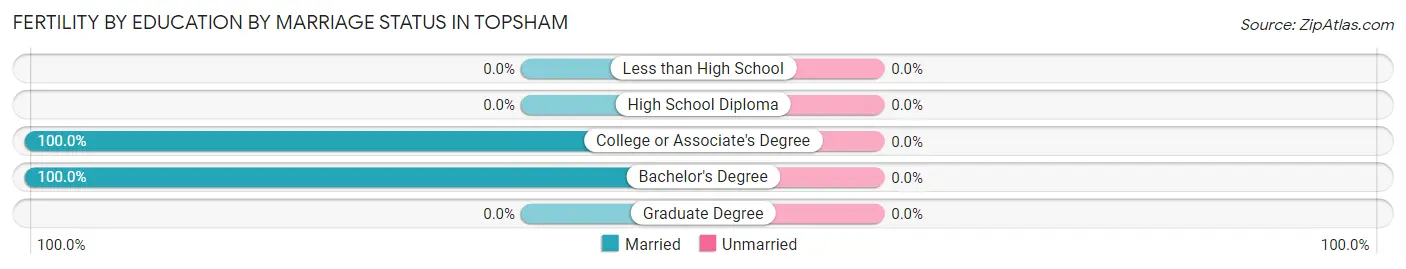
| Educational Attainment | Married | Unmarried |
| Less than High School | 0 (0.0%) | 0 (0.0%) |
| High School Diploma | 0 (0.0%) | 0 (0.0%) |
| College or Associate's Degree | 33 (100.0%) | 0 (0.0%) |
| Bachelor's Degree | 8 (100.0%) | 0 (0.0%) |
| Graduate Degree | 0 (0.0%) | 0 (0.0%) |
| Total | 41 (100.0%) | 0 (0.0%) |
Employment Characteristics in Topsham
Employment by Class of Employer in Topsham
Among the 3,180 employed individuals in Topsham, private company employees (2,020 | 63.5%), not-for-profit organizations (316 | 9.9%), and self-employed (not incorporated) (302 | 9.5%) make up the most common classes of employment.
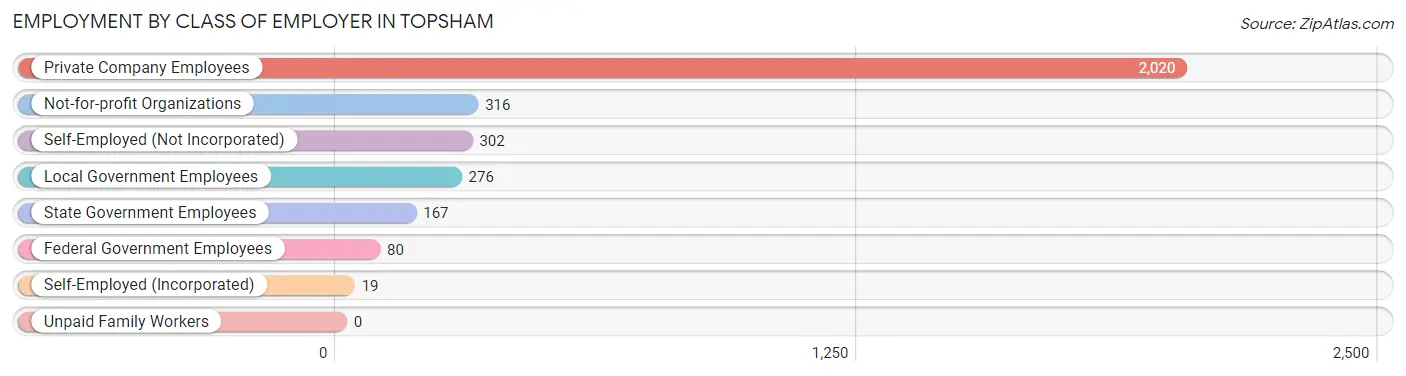
| Employer Class | # Employees | % Employees |
| Private Company Employees | 2,020 | 63.5% |
| Self-Employed (Incorporated) | 19 | 0.6% |
| Self-Employed (Not Incorporated) | 302 | 9.5% |
| Not-for-profit Organizations | 316 | 9.9% |
| Local Government Employees | 276 | 8.7% |
| State Government Employees | 167 | 5.2% |
| Federal Government Employees | 80 | 2.5% |
| Unpaid Family Workers | 0 | 0.0% |
| Total | 3,180 | 100.0% |
Employment Status by Age in Topsham
According to the labor force statistics for Topsham, out of the total population over 16 years of age (5,734), 62.6% or 3,589 individuals are in the labor force, with 5.4% or 194 of them unemployed. The age group with the highest labor force participation rate is 30 to 34 years, with 95.2% or 530 individuals in the labor force. Within the labor force, the 35 to 44 years age range has the highest percentage of unemployed individuals, with 15.1% or 96 of them being unemployed.
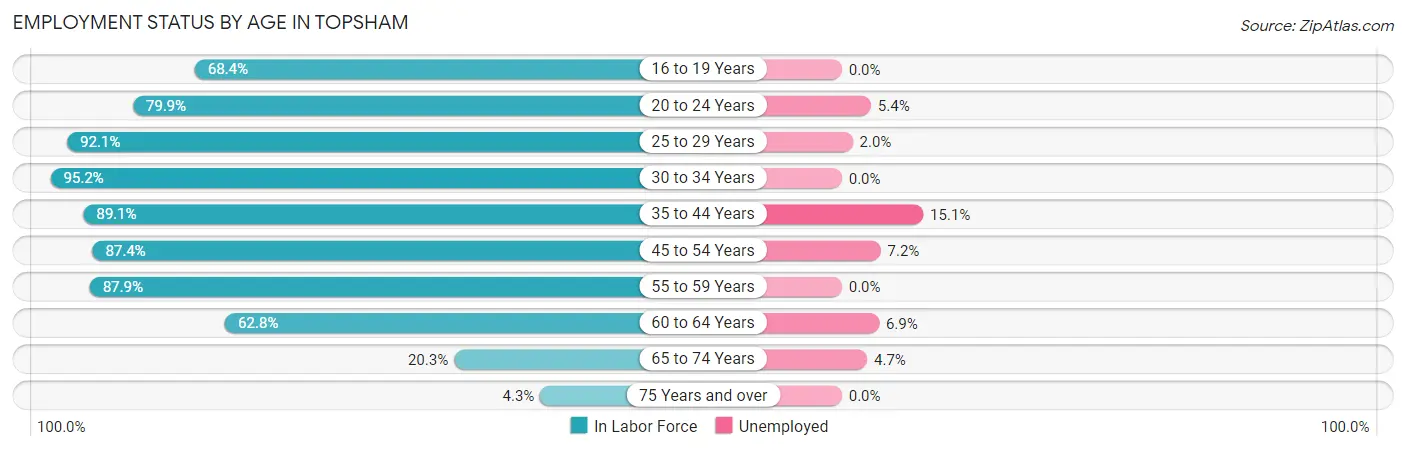
| Age Bracket | In Labor Force | Unemployed |
| 16 to 19 Years | 347 (68.4%) | 0 (0.0%) |
| 20 to 24 Years | 111 (79.9%) | 6 (5.4%) |
| 25 to 29 Years | 305 (92.1%) | 6 (2.0%) |
| 30 to 34 Years | 530 (95.2%) | 0 (0.0%) |
| 35 to 44 Years | 635 (89.1%) | 96 (15.1%) |
| 45 to 54 Years | 858 (87.4%) | 62 (7.2%) |
| 55 to 59 Years | 394 (87.9%) | 0 (0.0%) |
| 60 to 64 Years | 233 (62.8%) | 16 (6.9%) |
| 65 to 74 Years | 129 (20.3%) | 6 (4.7%) |
| 75 Years and over | 45 (4.3%) | 0 (0.0%) |
| Total | 3,589 (62.6%) | 194 (5.4%) |
Employment Status by Educational Attainment in Topsham
According to labor force statistics for Topsham, 86.9% of individuals (2,956) out of the total population between 25 and 64 years of age (3,402) are in the labor force, with 6.1% or 180 of them being unemployed. The group with the highest labor force participation rate are those with the educational attainment of college / associate degree, with 93.3% or 865 individuals in the labor force. Within the labor force, individuals with college / associate degree education have the highest percentage of unemployment, with 8.2% or 71 of them being unemployed.
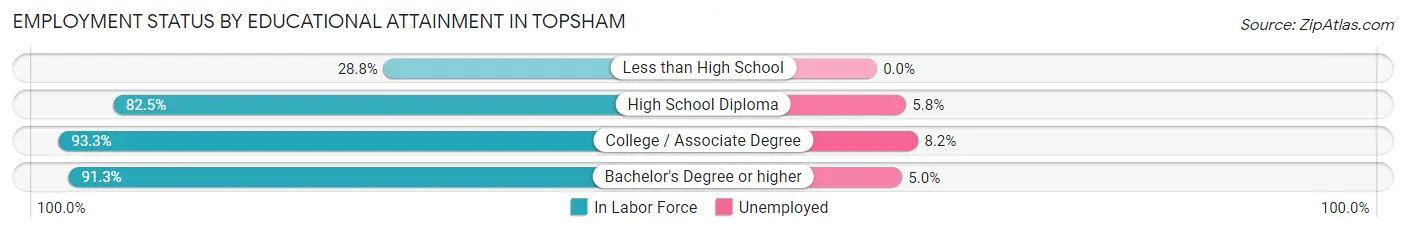
| Educational Attainment | In Labor Force | Unemployed |
| Less than High School | 38 (28.8%) | 0 (0.0%) |
| High School Diploma | 810 (82.5%) | 57 (5.8%) |
| College / Associate Degree | 865 (93.3%) | 76 (8.2%) |
| Bachelor's Degree or higher | 1,243 (91.3%) | 68 (5.0%) |
| Total | 2,956 (86.9%) | 208 (6.1%) |
Employment Occupations by Sex in Topsham
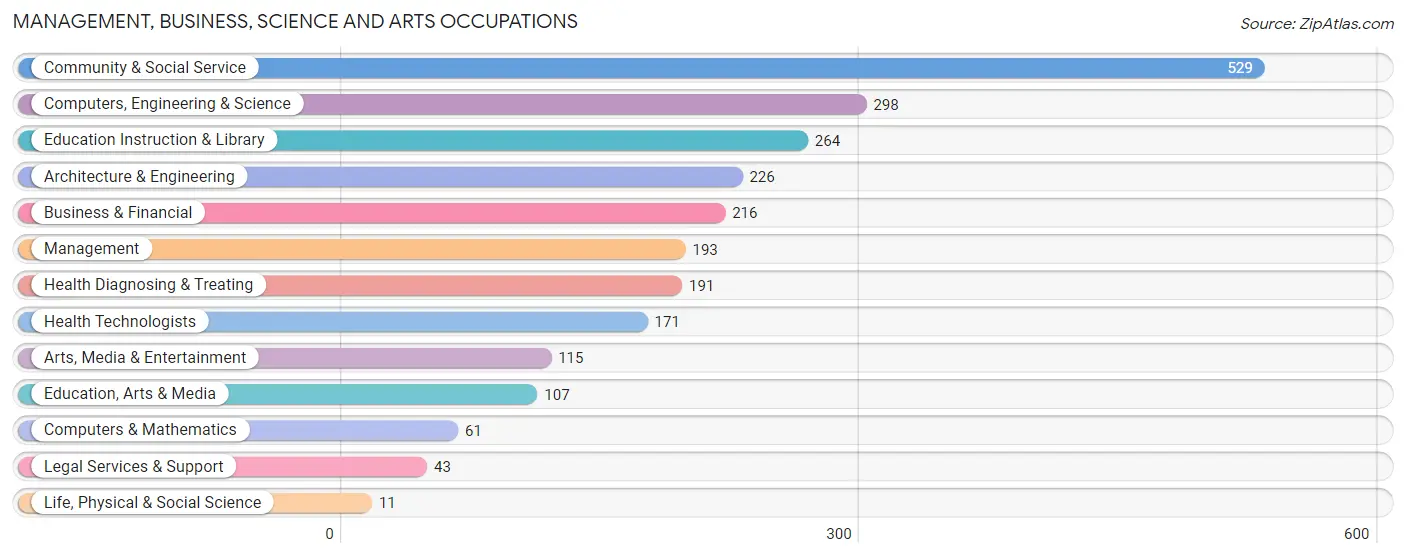
Management, Business, Science and Arts Occupations
The most common Management, Business, Science and Arts occupations in Topsham are Community & Social Service (529 | 15.6%), Computers, Engineering & Science (298 | 8.8%), Education Instruction & Library (264 | 7.8%), Architecture & Engineering (226 | 6.7%), and Business & Financial (216 | 6.4%).
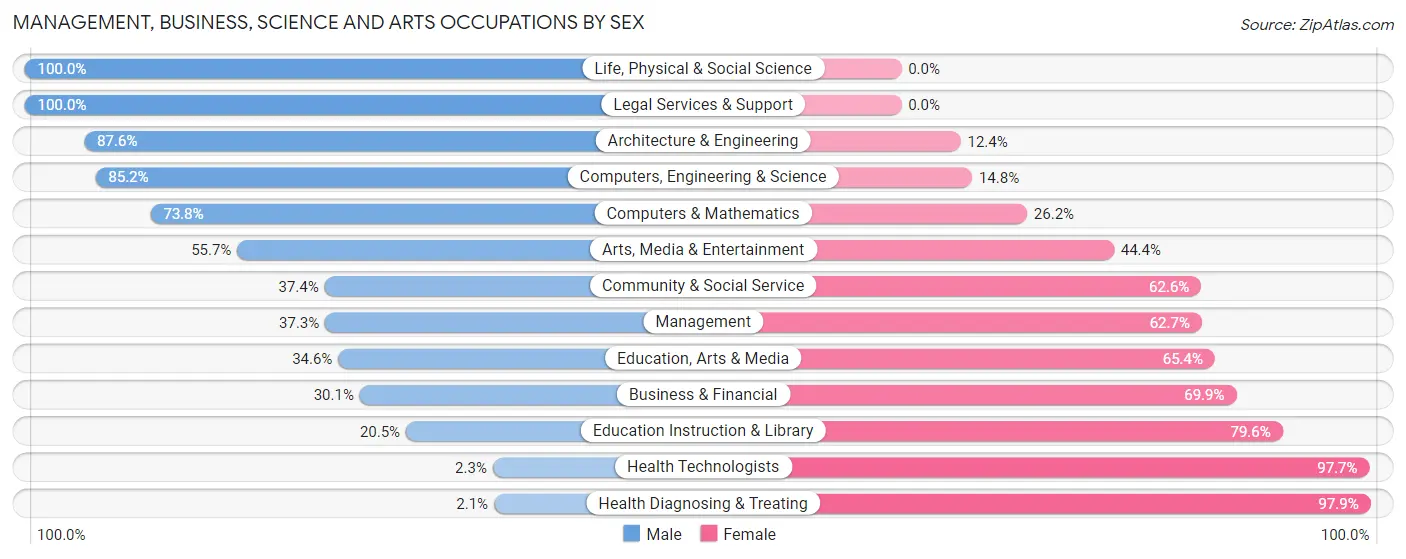
Management, Business, Science and Arts Occupations by Sex
Within the Management, Business, Science and Arts occupations in Topsham, the most male-oriented occupations are Life, Physical & Social Science (100.0%), Legal Services & Support (100.0%), and Architecture & Engineering (87.6%), while the most female-oriented occupations are Health Diagnosing & Treating (97.9%), Health Technologists (97.7%), and Education Instruction & Library (79.5%).
| Occupation | Male | Female |
| Management | 72 (37.3%) | 121 (62.7%) |
| Business & Financial | 65 (30.1%) | 151 (69.9%) |
| Computers, Engineering & Science | 254 (85.2%) | 44 (14.8%) |
| Computers & Mathematics | 45 (73.8%) | 16 (26.2%) |
| Architecture & Engineering | 198 (87.6%) | 28 (12.4%) |
| Life, Physical & Social Science | 11 (100.0%) | 0 (0.0%) |
| Community & Social Service | 198 (37.4%) | 331 (62.6%) |
| Education, Arts & Media | 37 (34.6%) | 70 (65.4%) |
| Legal Services & Support | 43 (100.0%) | 0 (0.0%) |
| Education Instruction & Library | 54 (20.4%) | 210 (79.5%) |
| Arts, Media & Entertainment | 64 (55.6%) | 51 (44.4%) |
| Health Diagnosing & Treating | 4 (2.1%) | 187 (97.9%) |
| Health Technologists | 4 (2.3%) | 167 (97.7%) |
| Total (Category) | 593 (41.6%) | 834 (58.4%) |
| Total (Overall) | 1,689 (49.7%) | 1,706 (50.2%) |
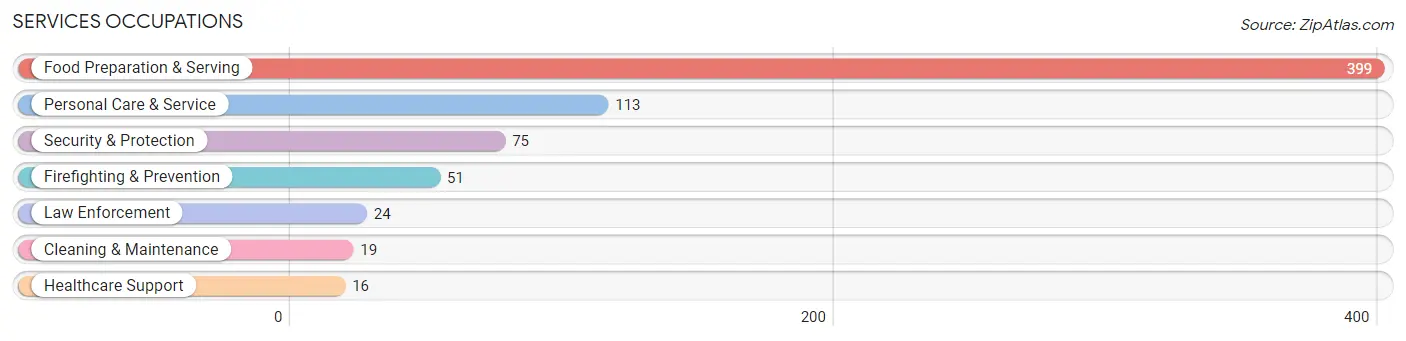
Services Occupations
The most common Services occupations in Topsham are Food Preparation & Serving (399 | 11.7%), Personal Care & Service (113 | 3.3%), Security & Protection (75 | 2.2%), Firefighting & Prevention (51 | 1.5%), and Law Enforcement (24 | 0.7%).
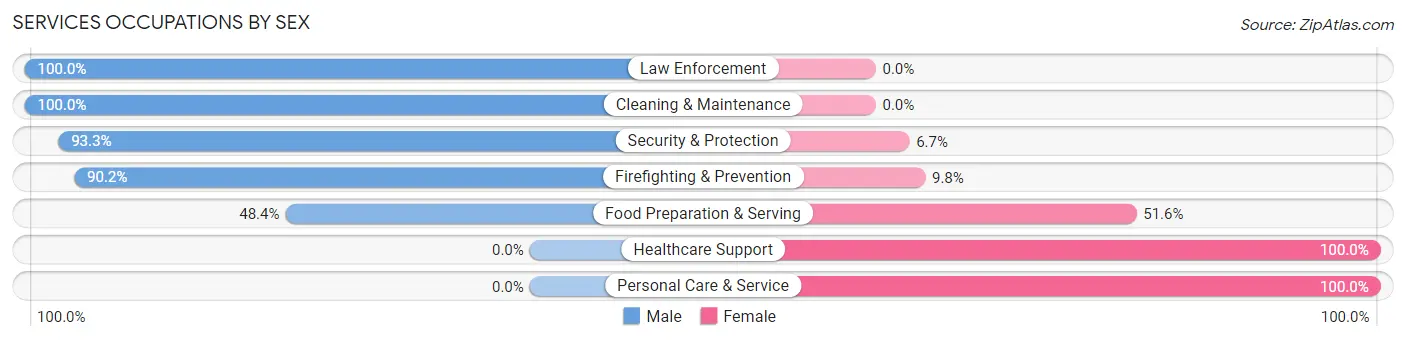
Services Occupations by Sex
Within the Services occupations in Topsham, the most male-oriented occupations are Law Enforcement (100.0%), Cleaning & Maintenance (100.0%), and Security & Protection (93.3%), while the most female-oriented occupations are Healthcare Support (100.0%), Personal Care & Service (100.0%), and Food Preparation & Serving (51.6%).
| Occupation | Male | Female |
| Healthcare Support | 0 (0.0%) | 16 (100.0%) |
| Security & Protection | 70 (93.3%) | 5 (6.7%) |
| Firefighting & Prevention | 46 (90.2%) | 5 (9.8%) |
| Law Enforcement | 24 (100.0%) | 0 (0.0%) |
| Food Preparation & Serving | 193 (48.4%) | 206 (51.6%) |
| Cleaning & Maintenance | 19 (100.0%) | 0 (0.0%) |
| Personal Care & Service | 0 (0.0%) | 113 (100.0%) |
| Total (Category) | 282 (45.3%) | 340 (54.7%) |
| Total (Overall) | 1,689 (49.7%) | 1,706 (50.2%) |
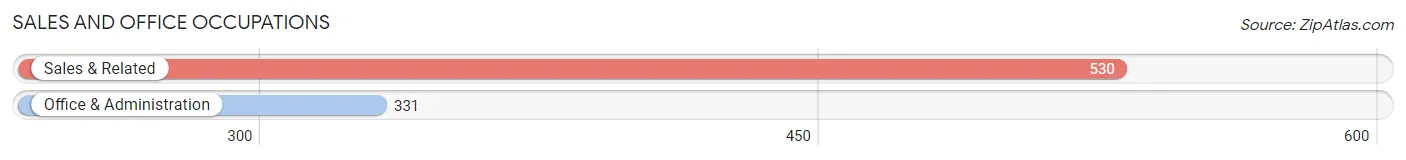
Sales and Office Occupations
The most common Sales and Office occupations in Topsham are Sales & Related (530 | 15.6%), and Office & Administration (331 | 9.8%).
Sales and Office Occupations by Sex
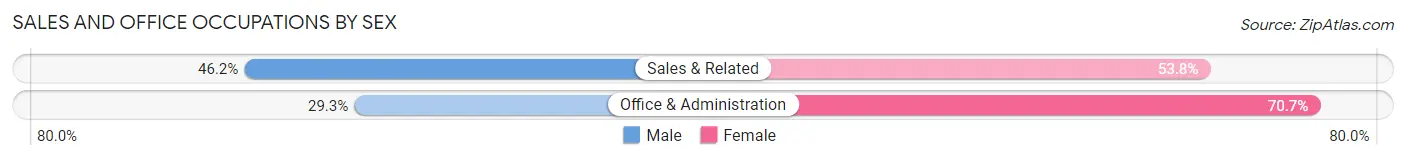
| Occupation | Male | Female |
| Sales & Related | 245 (46.2%) | 285 (53.8%) |
| Office & Administration | 97 (29.3%) | 234 (70.7%) |
| Total (Category) | 342 (39.7%) | 519 (60.3%) |
| Total (Overall) | 1,689 (49.7%) | 1,706 (50.2%) |
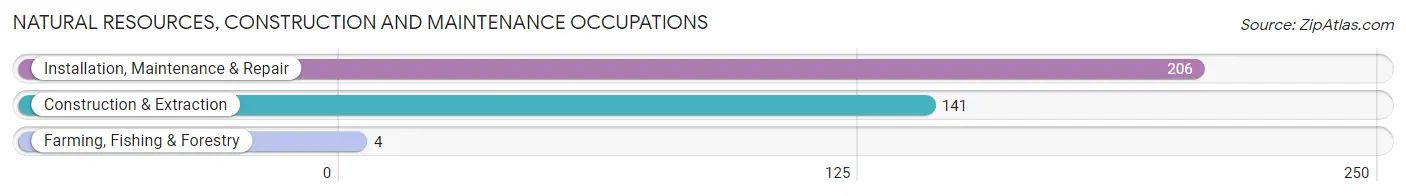
Natural Resources, Construction and Maintenance Occupations
The most common Natural Resources, Construction and Maintenance occupations in Topsham are Installation, Maintenance & Repair (206 | 6.1%), Construction & Extraction (141 | 4.2%), and Farming, Fishing & Forestry (4 | 0.1%).
Natural Resources, Construction and Maintenance Occupations by Sex
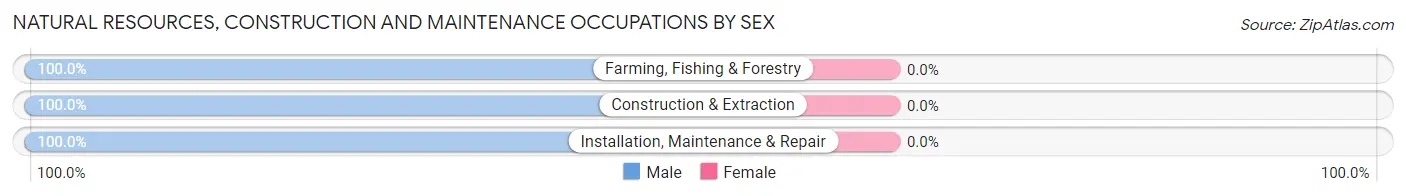
| Occupation | Male | Female |
| Farming, Fishing & Forestry | 4 (100.0%) | 0 (0.0%) |
| Construction & Extraction | 141 (100.0%) | 0 (0.0%) |
| Installation, Maintenance & Repair | 206 (100.0%) | 0 (0.0%) |
| Total (Category) | 351 (100.0%) | 0 (0.0%) |
| Total (Overall) | 1,689 (49.7%) | 1,706 (50.2%) |
Production, Transportation and Moving Occupations
The most common Production, Transportation and Moving occupations in Topsham are Production (82 | 2.4%), Material Moving (47 | 1.4%), and Transportation (5 | 0.2%).
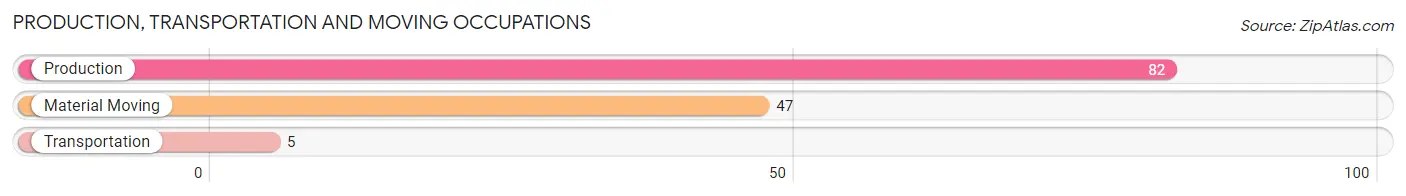
Production, Transportation and Moving Occupations by Sex
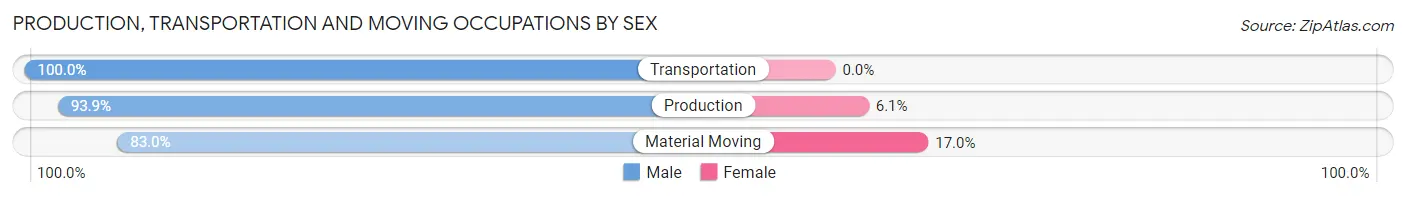
| Occupation | Male | Female |
| Production | 77 (93.9%) | 5 (6.1%) |
| Transportation | 5 (100.0%) | 0 (0.0%) |
| Material Moving | 39 (83.0%) | 8 (17.0%) |
| Total (Category) | 121 (90.3%) | 13 (9.7%) |
| Total (Overall) | 1,689 (49.7%) | 1,706 (50.2%) |
Employment Industries by Sex in Topsham
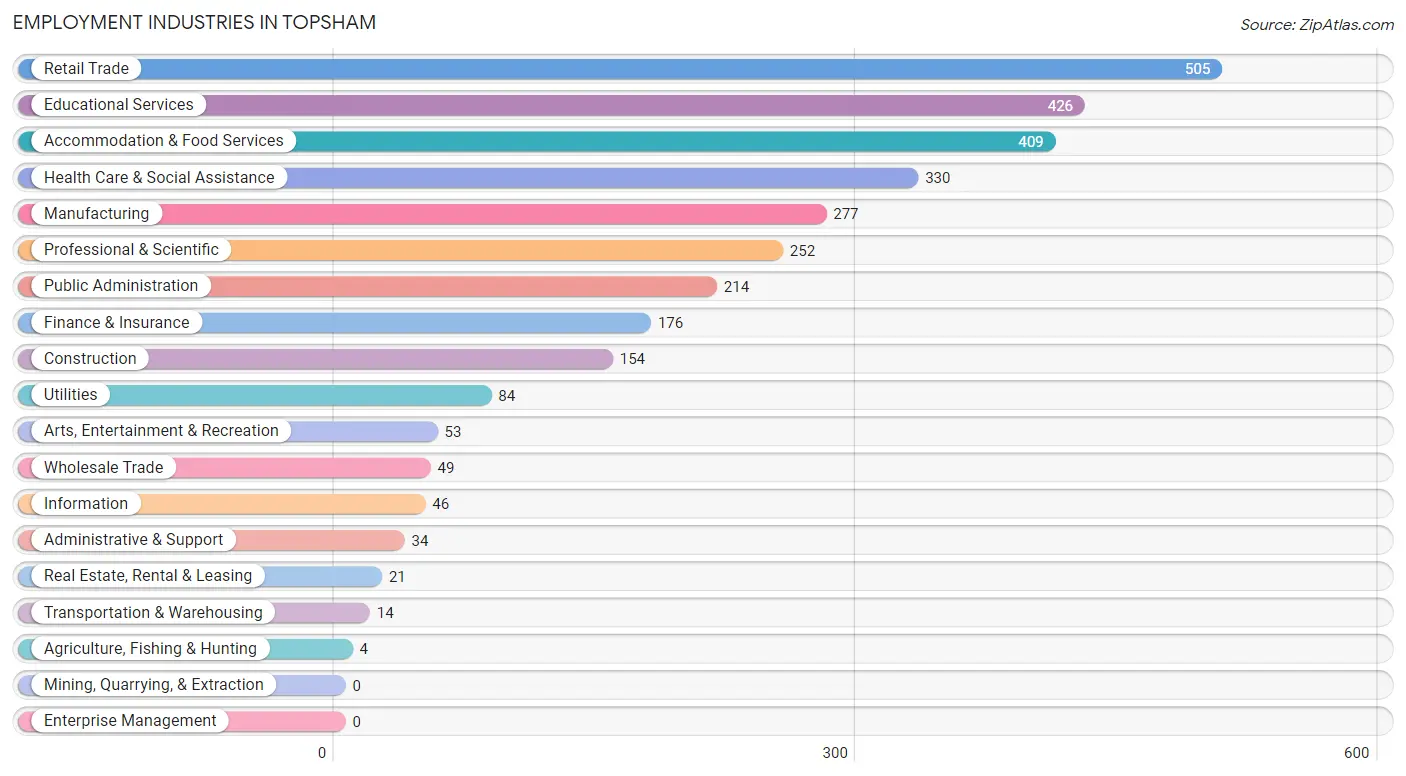
Employment Industries in Topsham
The major employment industries in Topsham include Retail Trade (505 | 14.9%), Educational Services (426 | 12.6%), Accommodation & Food Services (409 | 12.0%), Health Care & Social Assistance (330 | 9.7%), and Manufacturing (277 | 8.2%).
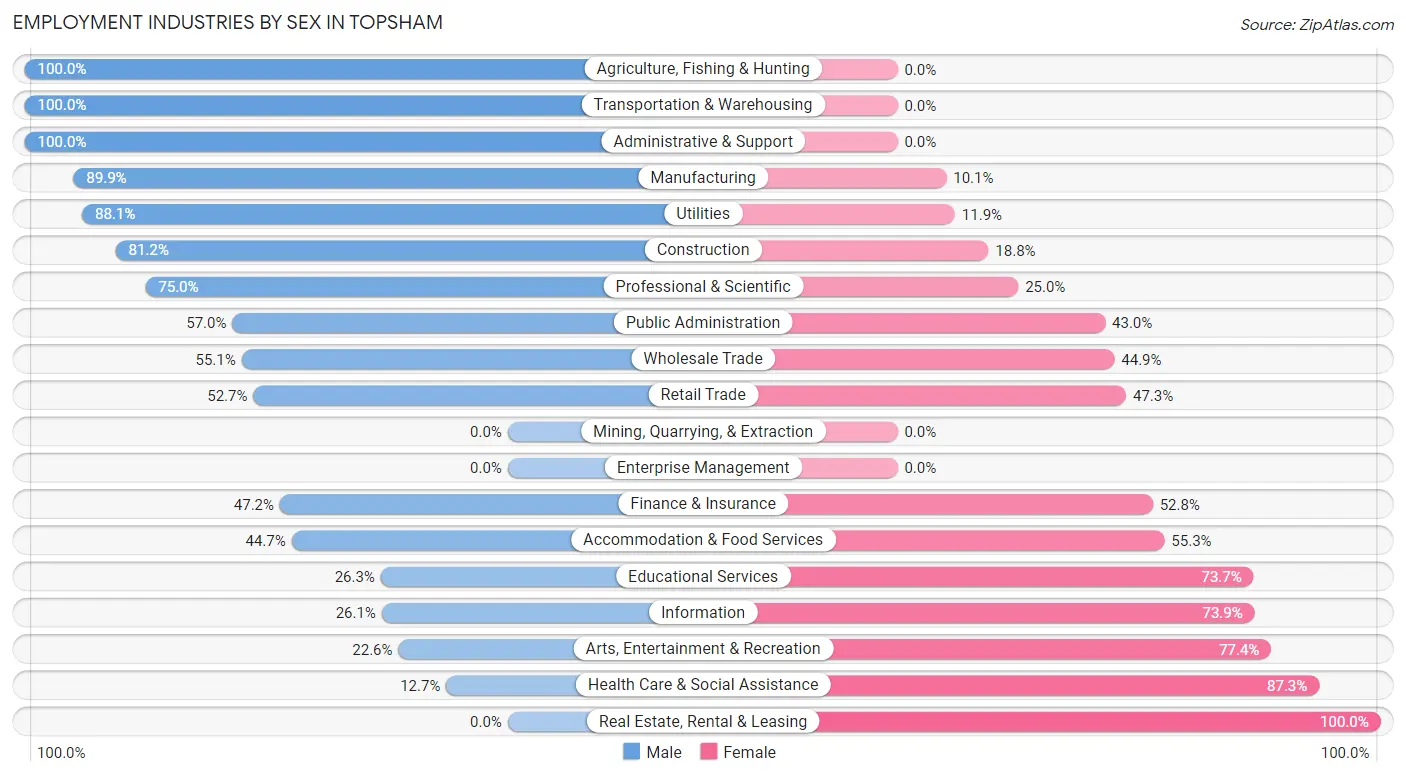
Employment Industries by Sex in Topsham
The Topsham industries that see more men than women are Agriculture, Fishing & Hunting (100.0%), Transportation & Warehousing (100.0%), and Administrative & Support (100.0%), whereas the industries that tend to have a higher number of women are Real Estate, Rental & Leasing (100.0%), Health Care & Social Assistance (87.3%), and Arts, Entertainment & Recreation (77.4%).
| Industry | Male | Female |
| Agriculture, Fishing & Hunting | 4 (100.0%) | 0 (0.0%) |
| Mining, Quarrying, & Extraction | 0 (0.0%) | 0 (0.0%) |
| Construction | 125 (81.2%) | 29 (18.8%) |
| Manufacturing | 249 (89.9%) | 28 (10.1%) |
| Wholesale Trade | 27 (55.1%) | 22 (44.9%) |
| Retail Trade | 266 (52.7%) | 239 (47.3%) |
| Transportation & Warehousing | 14 (100.0%) | 0 (0.0%) |
| Utilities | 74 (88.1%) | 10 (11.9%) |
| Information | 12 (26.1%) | 34 (73.9%) |
| Finance & Insurance | 83 (47.2%) | 93 (52.8%) |
| Real Estate, Rental & Leasing | 0 (0.0%) | 21 (100.0%) |
| Professional & Scientific | 189 (75.0%) | 63 (25.0%) |
| Enterprise Management | 0 (0.0%) | 0 (0.0%) |
| Administrative & Support | 34 (100.0%) | 0 (0.0%) |
| Educational Services | 112 (26.3%) | 314 (73.7%) |
| Health Care & Social Assistance | 42 (12.7%) | 288 (87.3%) |
| Arts, Entertainment & Recreation | 12 (22.6%) | 41 (77.4%) |
| Accommodation & Food Services | 183 (44.7%) | 226 (55.3%) |
| Public Administration | 122 (57.0%) | 92 (43.0%) |
| Total | 1,689 (49.7%) | 1,706 (50.2%) |
Education in Topsham
School Enrollment in Topsham
The most common levels of schooling among the 1,555 students in Topsham are high school (525 | 33.8%), middle school (365 | 23.5%), and college / undergraduate (256 | 16.5%).
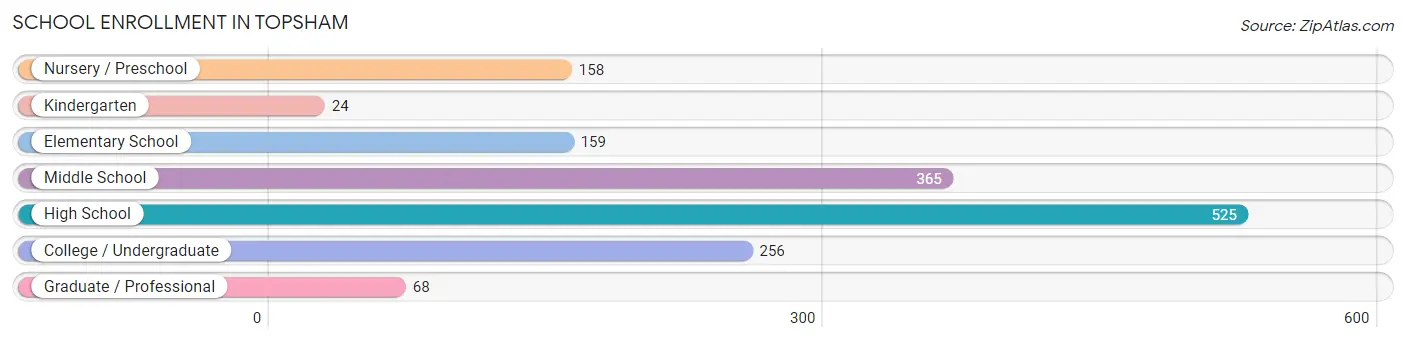
| School Level | # Students | % Students |
| Nursery / Preschool | 158 | 10.2% |
| Kindergarten | 24 | 1.5% |
| Elementary School | 159 | 10.2% |
| Middle School | 365 | 23.5% |
| High School | 525 | 33.8% |
| College / Undergraduate | 256 | 16.5% |
| Graduate / Professional | 68 | 4.4% |
| Total | 1,555 | 100.0% |
School Enrollment by Age by Funding Source in Topsham
Out of a total of 1,555 students who are enrolled in schools in Topsham, 302 (19.4%) attend a private institution, while the remaining 1,253 (80.6%) are enrolled in public schools. The age group of 3 to 4 year olds has the highest likelihood of being enrolled in private schools, with 56 (87.5% in the age bracket) enrolled. Conversely, the age group of 18 to 19 year olds has the lowest likelihood of being enrolled in a private school, with 84 (100.0% in the age bracket) attending a public institution.
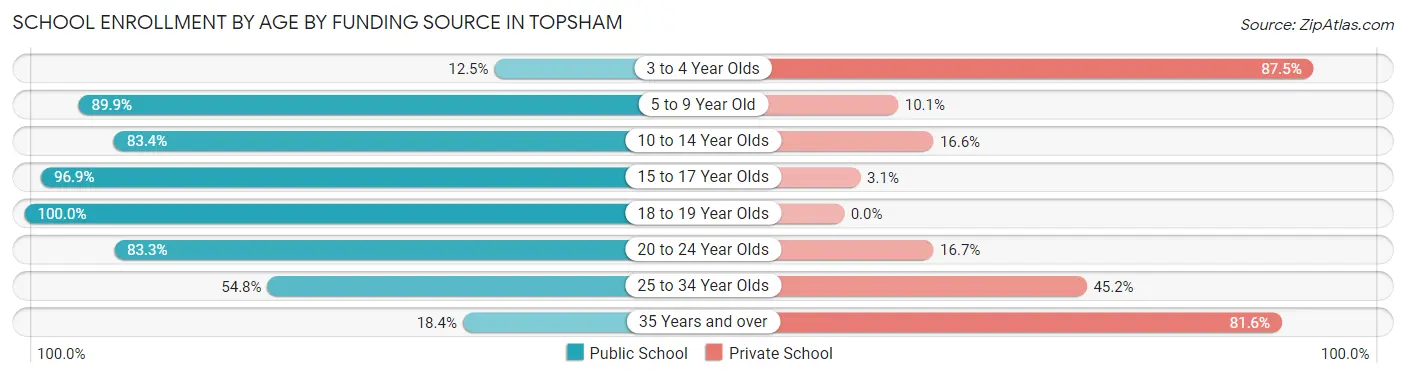
| Age Bracket | Public School | Private School |
| 3 to 4 Year Olds | 8 (12.5%) | 56 (87.5%) |
| 5 to 9 Year Old | 214 (89.9%) | 24 (10.1%) |
| 10 to 14 Year Olds | 351 (83.4%) | 70 (16.6%) |
| 15 to 17 Year Olds | 442 (96.9%) | 14 (3.1%) |
| 18 to 19 Year Olds | 84 (100.0%) | 0 (0.0%) |
| 20 to 24 Year Olds | 75 (83.3%) | 15 (16.7%) |
| 25 to 34 Year Olds | 63 (54.8%) | 52 (45.2%) |
| 35 Years and over | 16 (18.4%) | 71 (81.6%) |
| Total | 1,253 (80.6%) | 302 (19.4%) |
Educational Attainment by Field of Study in Topsham
Education (288 | 11.8%), science & technology (281 | 11.5%), social sciences (263 | 10.7%), business (240 | 9.8%), and liberal arts & history (196 | 8.0%) are the most common fields of study among 2,447 individuals in Topsham who have obtained a bachelor's degree or higher.
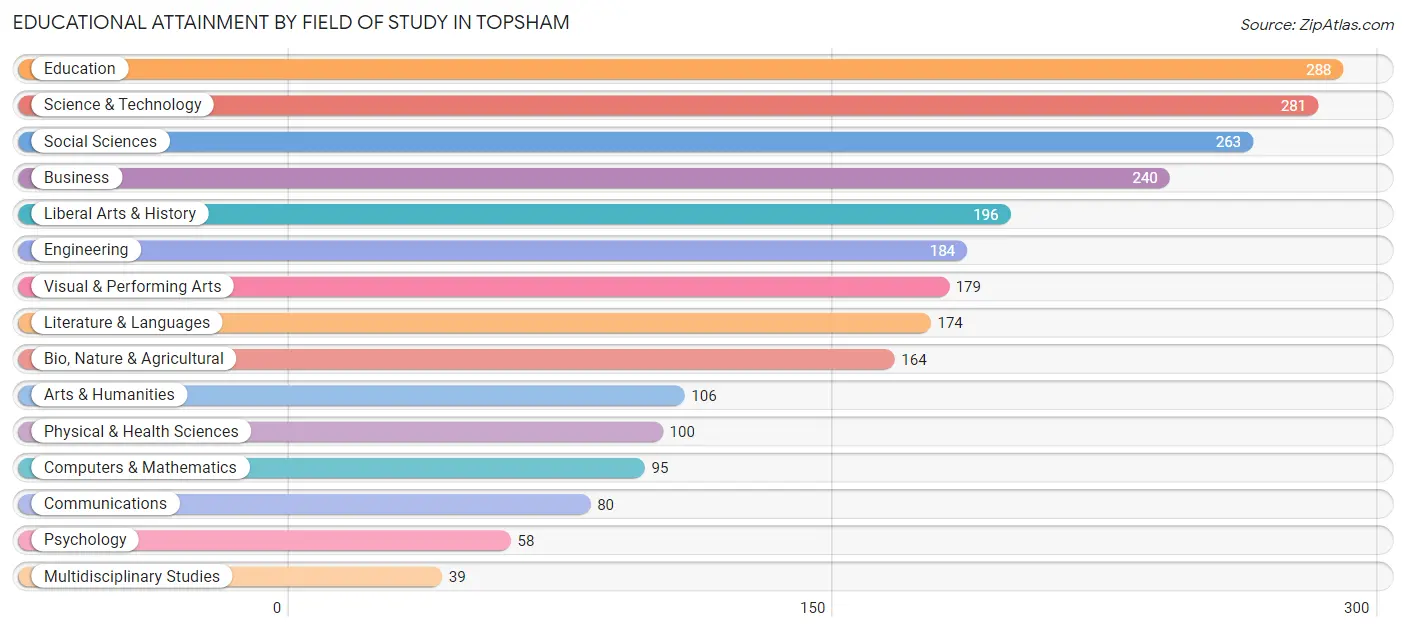
| Field of Study | # Graduates | % Graduates |
| Computers & Mathematics | 95 | 3.9% |
| Bio, Nature & Agricultural | 164 | 6.7% |
| Physical & Health Sciences | 100 | 4.1% |
| Psychology | 58 | 2.4% |
| Social Sciences | 263 | 10.7% |
| Engineering | 184 | 7.5% |
| Multidisciplinary Studies | 39 | 1.6% |
| Science & Technology | 281 | 11.5% |
| Business | 240 | 9.8% |
| Education | 288 | 11.8% |
| Literature & Languages | 174 | 7.1% |
| Liberal Arts & History | 196 | 8.0% |
| Visual & Performing Arts | 179 | 7.3% |
| Communications | 80 | 3.3% |
| Arts & Humanities | 106 | 4.3% |
| Total | 2,447 | 100.0% |
Transportation & Commute in Topsham
Vehicle Availability by Sex in Topsham
The most prevalent vehicle ownership categories in Topsham are males with 2 vehicles (812, accounting for 53.0%) and females with 2 vehicles (742, making up 49.4%).
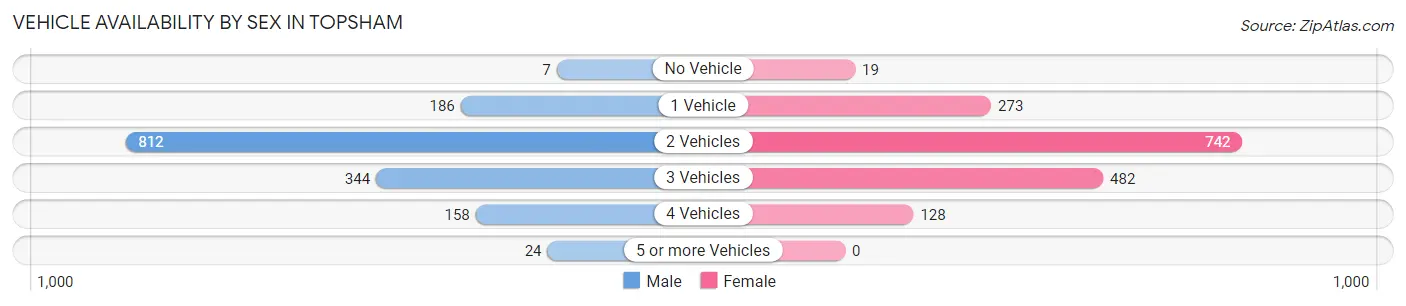
| Vehicles Available | Male | Female |
| No Vehicle | 7 (0.5%) | 19 (1.2%) |
| 1 Vehicle | 186 (12.1%) | 273 (16.6%) |
| 2 Vehicles | 812 (53.0%) | 742 (45.1%) |
| 3 Vehicles | 344 (22.5%) | 482 (29.3%) |
| 4 Vehicles | 158 (10.3%) | 128 (7.8%) |
| 5 or more Vehicles | 24 (1.6%) | 0 (0.0%) |
| Total | 1,531 (100.0%) | 1,644 (100.0%) |
Commute Time in Topsham
The most frequently occuring commute durations in Topsham are 10 to 14 minutes (624 commuters, 22.0%), 15 to 19 minutes (473 commuters, 16.7%), and 5 to 9 minutes (393 commuters, 13.8%).
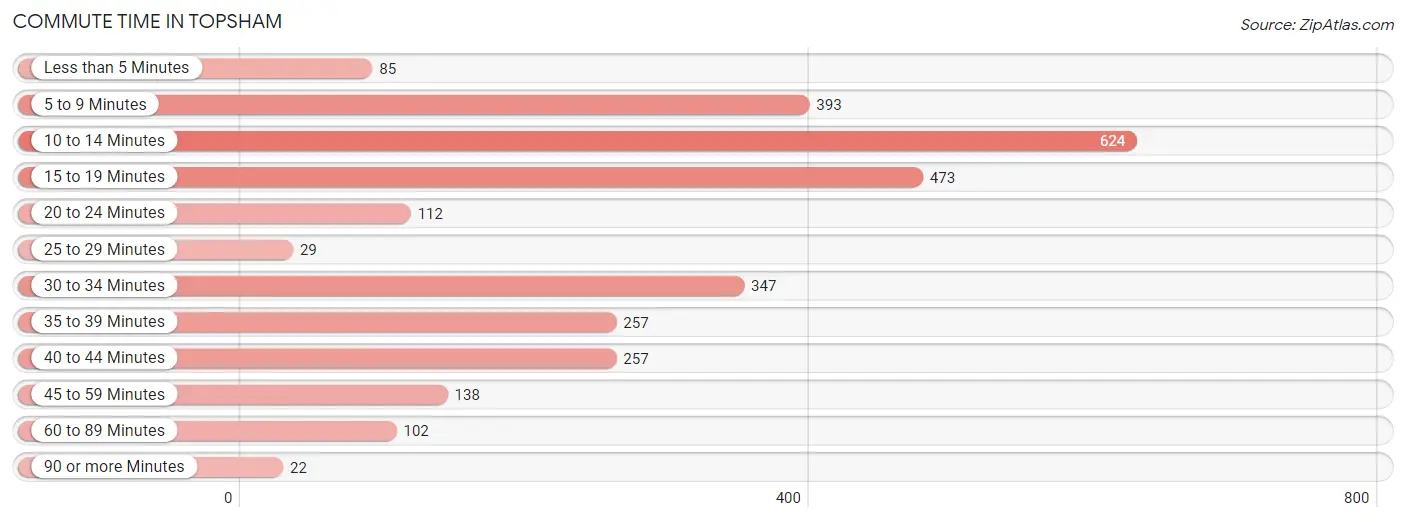
| Commute Time | # Commuters | % Commuters |
| Less than 5 Minutes | 85 | 3.0% |
| 5 to 9 Minutes | 393 | 13.8% |
| 10 to 14 Minutes | 624 | 22.0% |
| 15 to 19 Minutes | 473 | 16.7% |
| 20 to 24 Minutes | 112 | 4.0% |
| 25 to 29 Minutes | 29 | 1.0% |
| 30 to 34 Minutes | 347 | 12.2% |
| 35 to 39 Minutes | 257 | 9.0% |
| 40 to 44 Minutes | 257 | 9.0% |
| 45 to 59 Minutes | 138 | 4.9% |
| 60 to 89 Minutes | 102 | 3.6% |
| 90 or more Minutes | 22 | 0.8% |
Commute Time by Sex in Topsham
The most common commute times in Topsham are 10 to 14 minutes (291 commuters, 20.9%) for males and 10 to 14 minutes (333 commuters, 23.0%) for females.
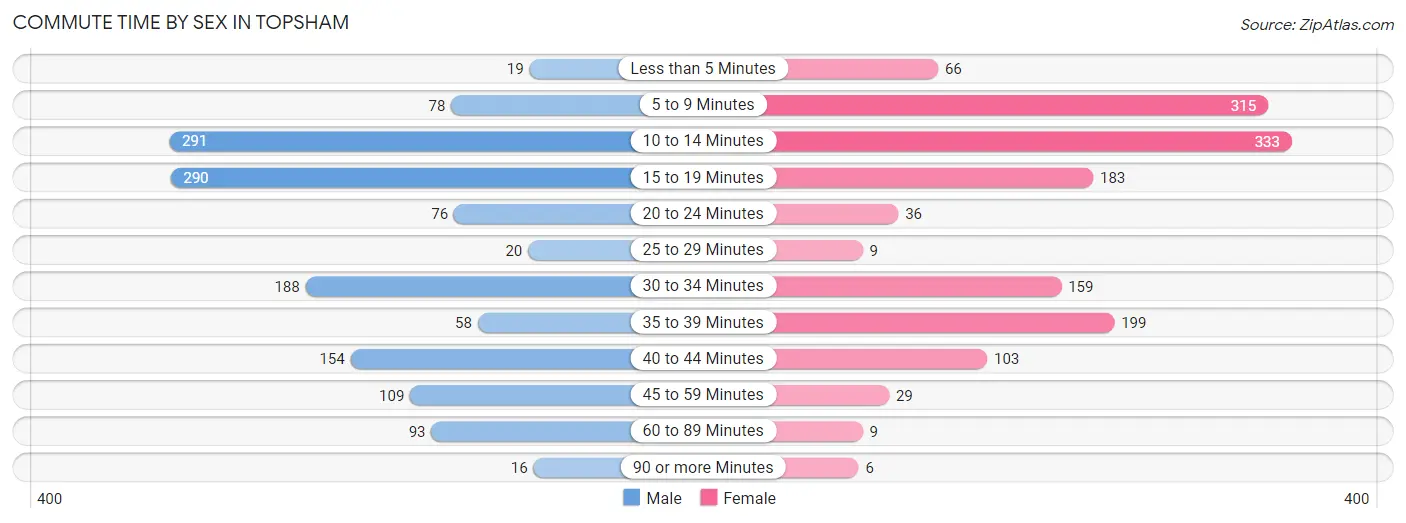
| Commute Time | Male | Female |
| Less than 5 Minutes | 19 (1.4%) | 66 (4.6%) |
| 5 to 9 Minutes | 78 (5.6%) | 315 (21.8%) |
| 10 to 14 Minutes | 291 (20.9%) | 333 (23.0%) |
| 15 to 19 Minutes | 290 (20.8%) | 183 (12.7%) |
| 20 to 24 Minutes | 76 (5.5%) | 36 (2.5%) |
| 25 to 29 Minutes | 20 (1.4%) | 9 (0.6%) |
| 30 to 34 Minutes | 188 (13.5%) | 159 (11.0%) |
| 35 to 39 Minutes | 58 (4.2%) | 199 (13.8%) |
| 40 to 44 Minutes | 154 (11.1%) | 103 (7.1%) |
| 45 to 59 Minutes | 109 (7.8%) | 29 (2.0%) |
| 60 to 89 Minutes | 93 (6.7%) | 9 (0.6%) |
| 90 or more Minutes | 16 (1.1%) | 6 (0.4%) |
Time of Departure to Work by Sex in Topsham
The most frequent times of departure to work in Topsham are 6:00 AM to 6:29 AM (223, 16.0%) for males and 7:30 AM to 7:59 AM (271, 18.7%) for females.
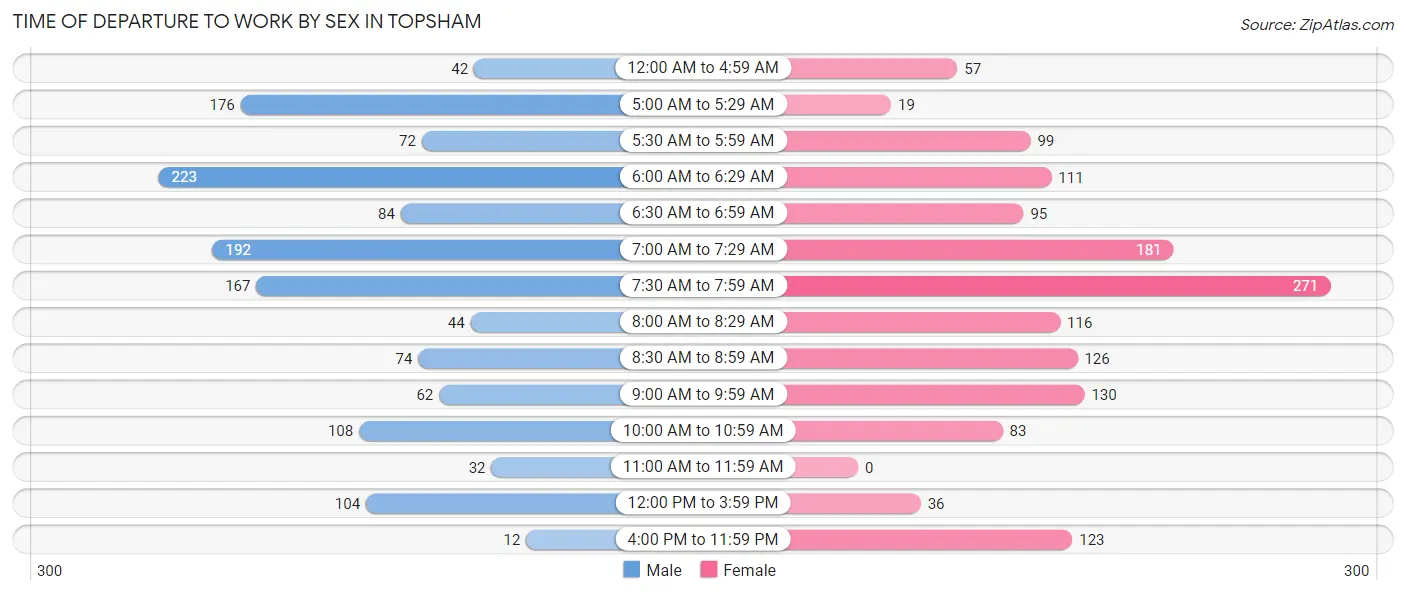
| Time of Departure | Male | Female |
| 12:00 AM to 4:59 AM | 42 (3.0%) | 57 (3.9%) |
| 5:00 AM to 5:29 AM | 176 (12.6%) | 19 (1.3%) |
| 5:30 AM to 5:59 AM | 72 (5.2%) | 99 (6.8%) |
| 6:00 AM to 6:29 AM | 223 (16.0%) | 111 (7.7%) |
| 6:30 AM to 6:59 AM | 84 (6.0%) | 95 (6.6%) |
| 7:00 AM to 7:29 AM | 192 (13.8%) | 181 (12.5%) |
| 7:30 AM to 7:59 AM | 167 (12.0%) | 271 (18.7%) |
| 8:00 AM to 8:29 AM | 44 (3.2%) | 116 (8.0%) |
| 8:30 AM to 8:59 AM | 74 (5.3%) | 126 (8.7%) |
| 9:00 AM to 9:59 AM | 62 (4.4%) | 130 (9.0%) |
| 10:00 AM to 10:59 AM | 108 (7.8%) | 83 (5.7%) |
| 11:00 AM to 11:59 AM | 32 (2.3%) | 0 (0.0%) |
| 12:00 PM to 3:59 PM | 104 (7.5%) | 36 (2.5%) |
| 4:00 PM to 11:59 PM | 12 (0.9%) | 123 (8.5%) |
| Total | 1,392 (100.0%) | 1,447 (100.0%) |
Housing Occupancy in Topsham
Occupancy by Ownership in Topsham
Of the total 2,972 dwellings in Topsham, owner-occupied units account for 2,146 (72.2%), while renter-occupied units make up 826 (27.8%).
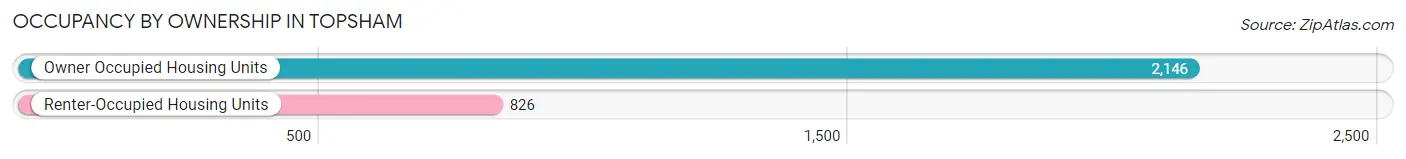
| Occupancy | # Housing Units | % Housing Units |
| Owner Occupied Housing Units | 2,146 | 72.2% |
| Renter-Occupied Housing Units | 826 | 27.8% |
| Total Occupied Housing Units | 2,972 | 100.0% |
Occupancy by Household Size in Topsham
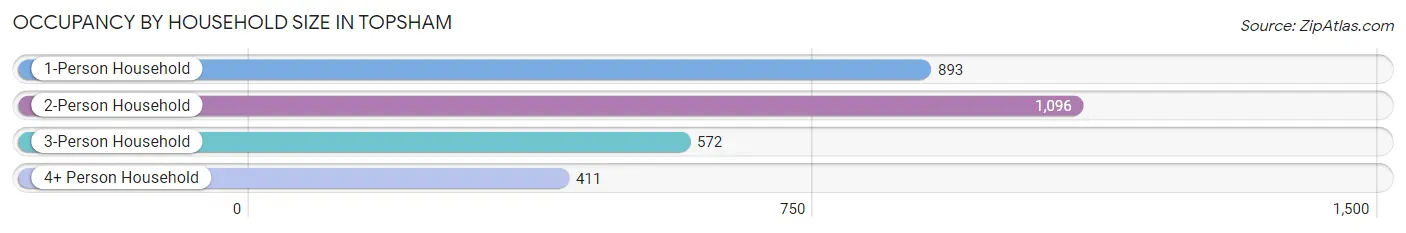
| Household Size | # Housing Units | % Housing Units |
| 1-Person Household | 893 | 30.0% |
| 2-Person Household | 1,096 | 36.9% |
| 3-Person Household | 572 | 19.3% |
| 4+ Person Household | 411 | 13.8% |
| Total Housing Units | 2,972 | 100.0% |
Occupancy by Ownership by Household Size in Topsham
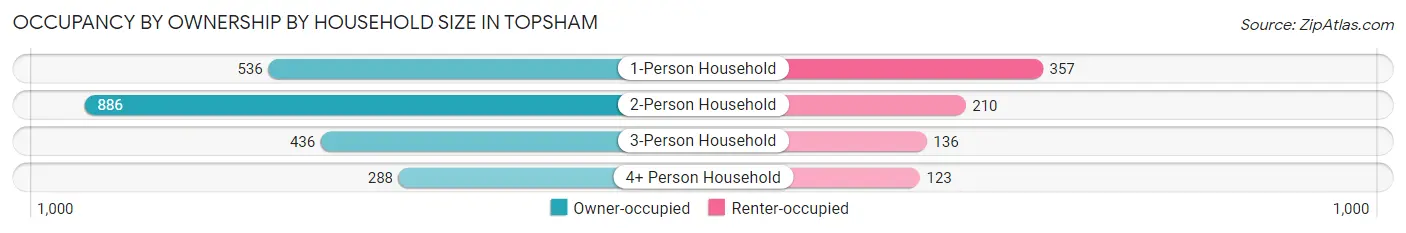
| Household Size | Owner-occupied | Renter-occupied |
| 1-Person Household | 536 (60.0%) | 357 (40.0%) |
| 2-Person Household | 886 (80.8%) | 210 (19.2%) |
| 3-Person Household | 436 (76.2%) | 136 (23.8%) |
| 4+ Person Household | 288 (70.1%) | 123 (29.9%) |
| Total Housing Units | 2,146 (72.2%) | 826 (27.8%) |
Occupancy by Educational Attainment in Topsham
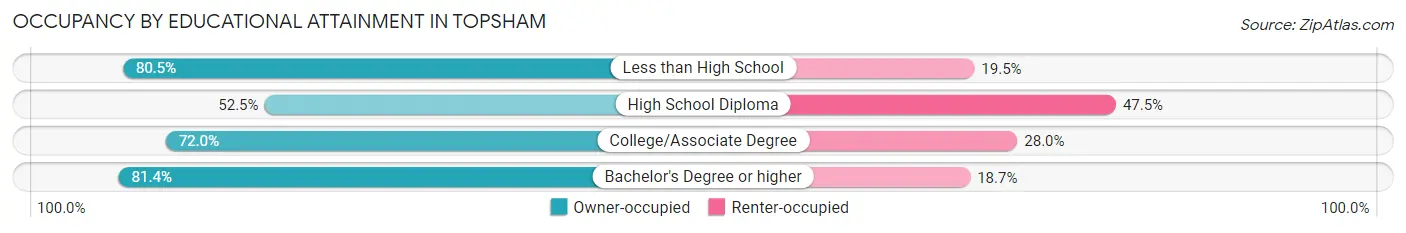
| Household Size | Owner-occupied | Renter-occupied |
| Less than High School | 62 (80.5%) | 15 (19.5%) |
| High School Diploma | 362 (52.5%) | 328 (47.5%) |
| College/Associate Degree | 553 (72.0%) | 215 (28.0%) |
| Bachelor's Degree or higher | 1,169 (81.4%) | 268 (18.6%) |
Occupancy by Age of Householder in Topsham
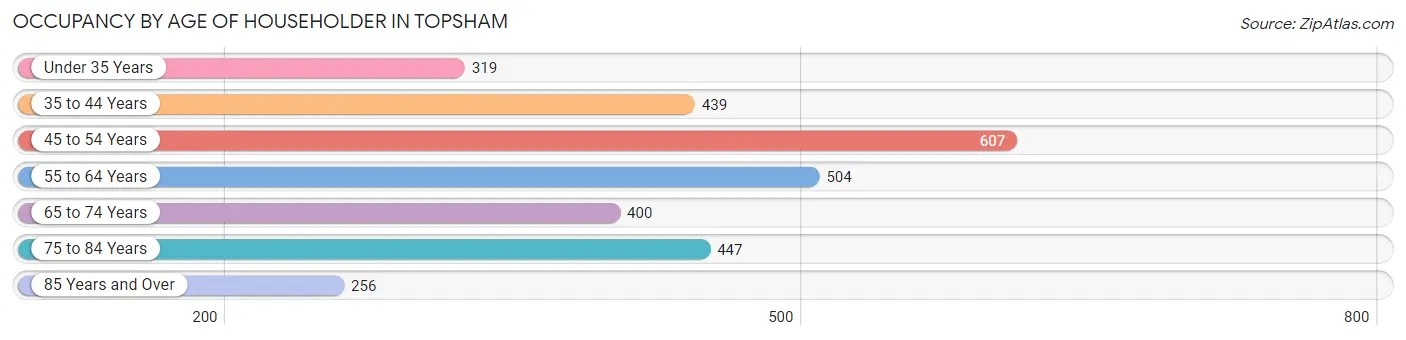
| Age Bracket | # Households | % Households |
| Under 35 Years | 319 | 10.7% |
| 35 to 44 Years | 439 | 14.8% |
| 45 to 54 Years | 607 | 20.4% |
| 55 to 64 Years | 504 | 17.0% |
| 65 to 74 Years | 400 | 13.5% |
| 75 to 84 Years | 447 | 15.0% |
| 85 Years and Over | 256 | 8.6% |
| Total | 2,972 | 100.0% |
Housing Finances in Topsham
Median Income by Occupancy in Topsham
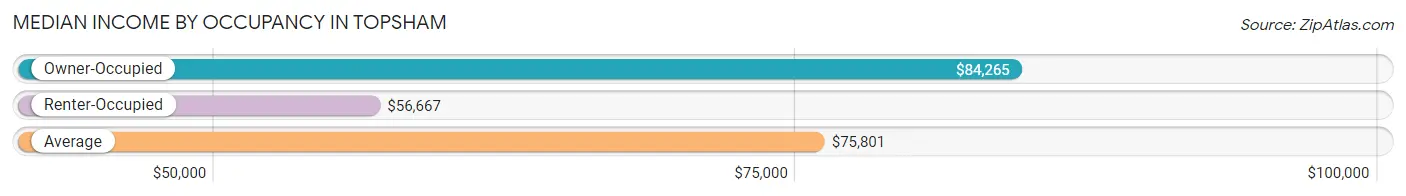
| Occupancy Type | # Households | Median Income |
| Owner-Occupied | 2,146 (72.2%) | $84,265 |
| Renter-Occupied | 826 (27.8%) | $56,667 |
| Average | 2,972 (100.0%) | $75,801 |
Occupancy by Householder Income Bracket in Topsham
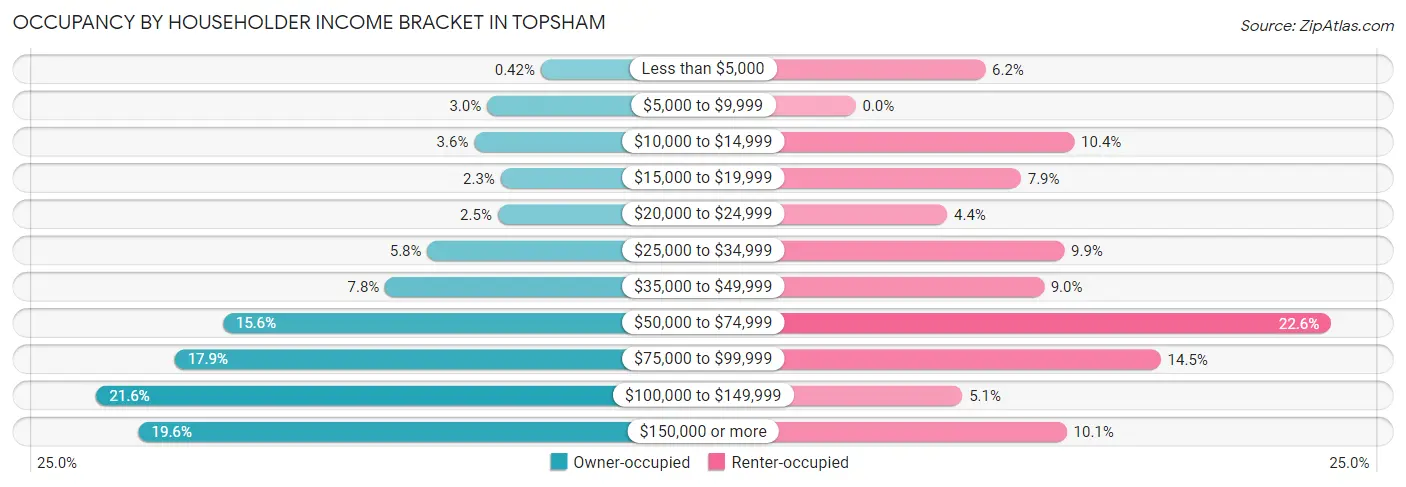
| Income Bracket | Owner-occupied | Renter-occupied |
| Less than $5,000 | 9 (0.4%) | 51 (6.2%) |
| $5,000 to $9,999 | 64 (3.0%) | 0 (0.0%) |
| $10,000 to $14,999 | 77 (3.6%) | 86 (10.4%) |
| $15,000 to $19,999 | 50 (2.3%) | 65 (7.9%) |
| $20,000 to $24,999 | 53 (2.5%) | 36 (4.4%) |
| $25,000 to $34,999 | 125 (5.8%) | 82 (9.9%) |
| $35,000 to $49,999 | 168 (7.8%) | 74 (9.0%) |
| $50,000 to $74,999 | 334 (15.6%) | 187 (22.6%) |
| $75,000 to $99,999 | 383 (17.8%) | 120 (14.5%) |
| $100,000 to $149,999 | 463 (21.6%) | 42 (5.1%) |
| $150,000 or more | 420 (19.6%) | 83 (10.1%) |
| Total | 2,146 (100.0%) | 826 (100.0%) |
Monthly Housing Cost Tiers in Topsham
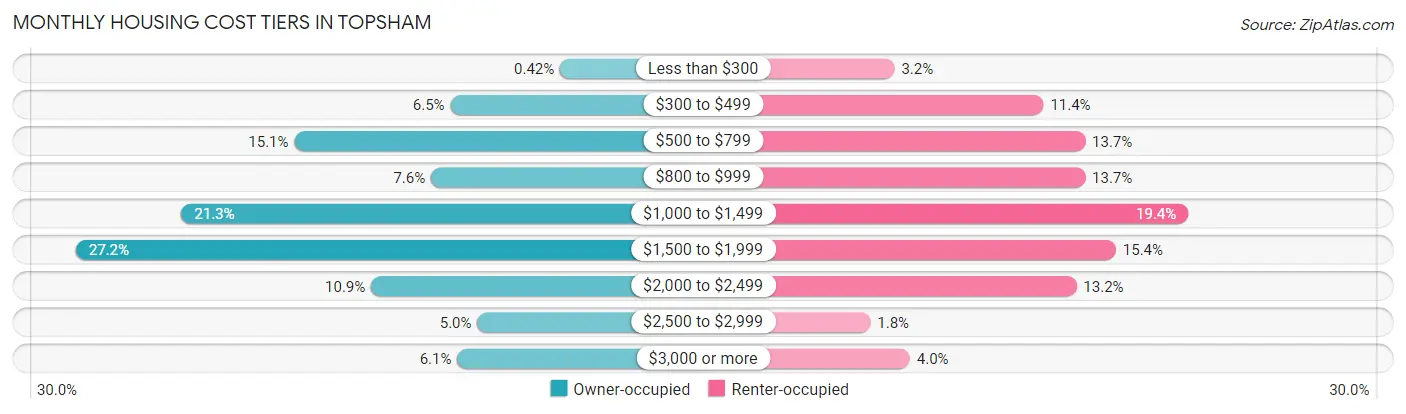
| Monthly Cost | Owner-occupied | Renter-occupied |
| Less than $300 | 9 (0.4%) | 26 (3.2%) |
| $300 to $499 | 139 (6.5%) | 94 (11.4%) |
| $500 to $799 | 324 (15.1%) | 113 (13.7%) |
| $800 to $999 | 162 (7.5%) | 113 (13.7%) |
| $1,000 to $1,499 | 458 (21.3%) | 160 (19.4%) |
| $1,500 to $1,999 | 583 (27.2%) | 127 (15.4%) |
| $2,000 to $2,499 | 233 (10.9%) | 109 (13.2%) |
| $2,500 to $2,999 | 107 (5.0%) | 15 (1.8%) |
| $3,000 or more | 131 (6.1%) | 33 (4.0%) |
| Total | 2,146 (100.0%) | 826 (100.0%) |
Physical Housing Characteristics in Topsham
Housing Structures in Topsham
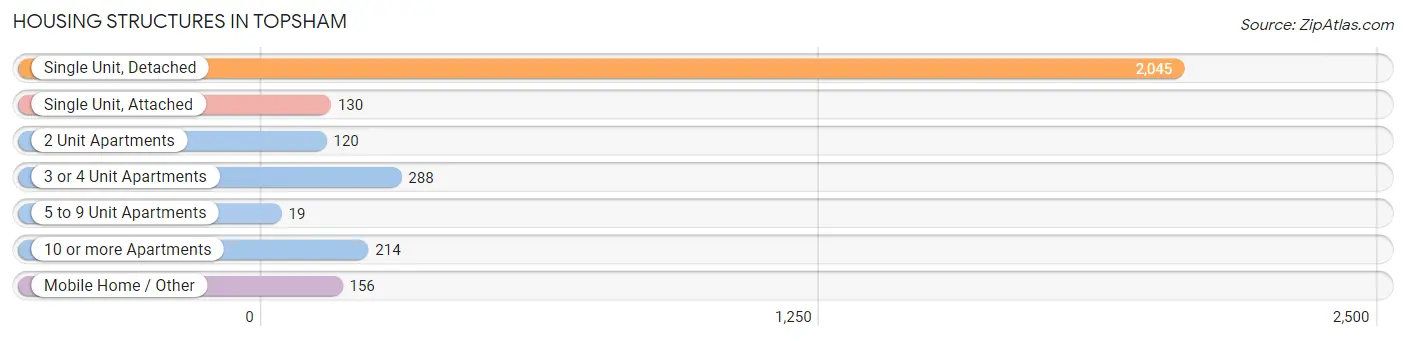
| Structure Type | # Housing Units | % Housing Units |
| Single Unit, Detached | 2,045 | 68.8% |
| Single Unit, Attached | 130 | 4.4% |
| 2 Unit Apartments | 120 | 4.0% |
| 3 or 4 Unit Apartments | 288 | 9.7% |
| 5 to 9 Unit Apartments | 19 | 0.6% |
| 10 or more Apartments | 214 | 7.2% |
| Mobile Home / Other | 156 | 5.2% |
| Total | 2,972 | 100.0% |
Housing Structures by Occupancy in Topsham
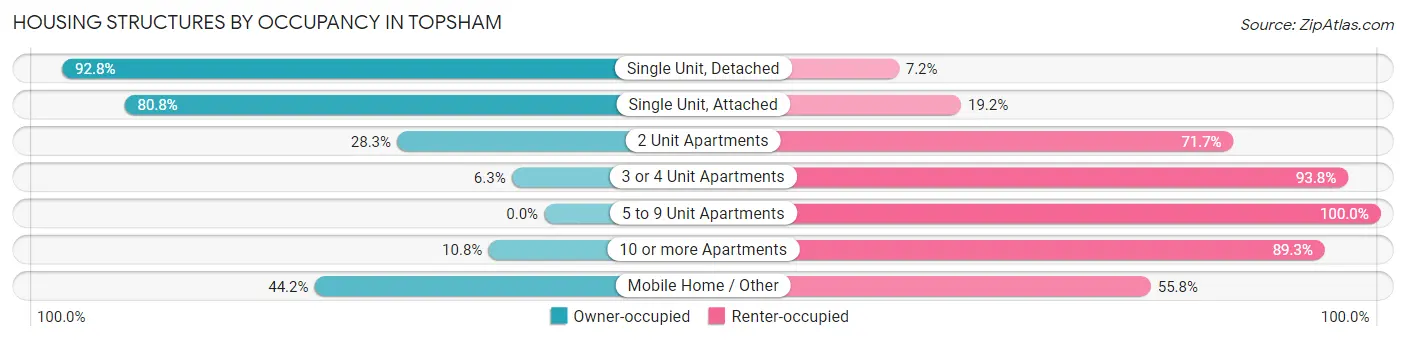
| Structure Type | Owner-occupied | Renter-occupied |
| Single Unit, Detached | 1,897 (92.8%) | 148 (7.2%) |
| Single Unit, Attached | 105 (80.8%) | 25 (19.2%) |
| 2 Unit Apartments | 34 (28.3%) | 86 (71.7%) |
| 3 or 4 Unit Apartments | 18 (6.2%) | 270 (93.8%) |
| 5 to 9 Unit Apartments | 0 (0.0%) | 19 (100.0%) |
| 10 or more Apartments | 23 (10.7%) | 191 (89.2%) |
| Mobile Home / Other | 69 (44.2%) | 87 (55.8%) |
| Total | 2,146 (72.2%) | 826 (27.8%) |
Housing Structures by Number of Rooms in Topsham
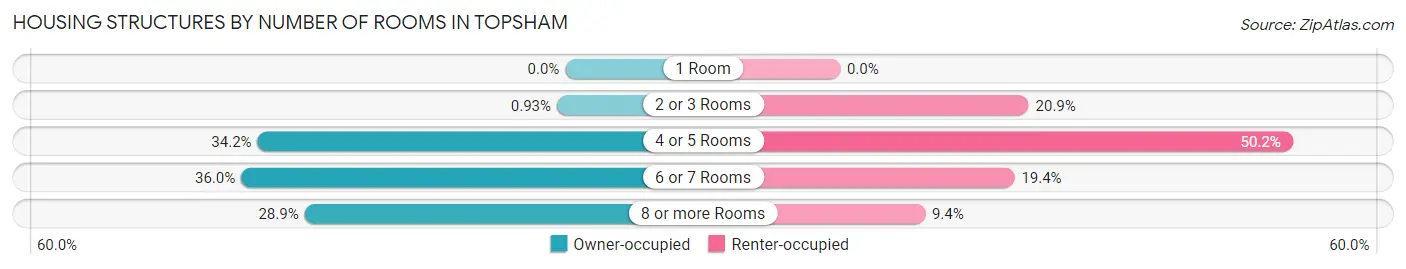
| Number of Rooms | Owner-occupied | Renter-occupied |
| 1 Room | 0 (0.0%) | 0 (0.0%) |
| 2 or 3 Rooms | 20 (0.9%) | 173 (20.9%) |
| 4 or 5 Rooms | 733 (34.2%) | 415 (50.2%) |
| 6 or 7 Rooms | 772 (36.0%) | 160 (19.4%) |
| 8 or more Rooms | 621 (28.9%) | 78 (9.4%) |
| Total | 2,146 (100.0%) | 826 (100.0%) |
Housing Structure by Heating Type in Topsham
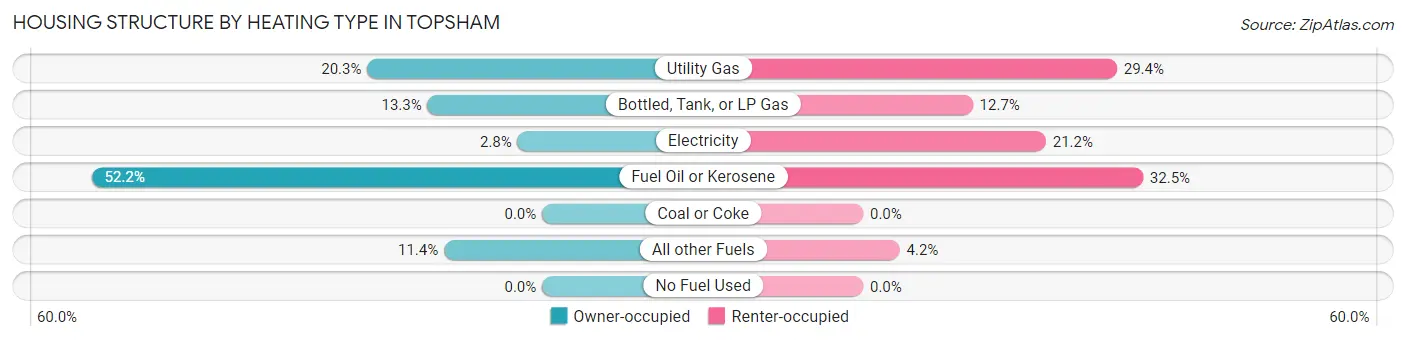
| Heating Type | Owner-occupied | Renter-occupied |
| Utility Gas | 435 (20.3%) | 243 (29.4%) |
| Bottled, Tank, or LP Gas | 285 (13.3%) | 105 (12.7%) |
| Electricity | 61 (2.8%) | 175 (21.2%) |
| Fuel Oil or Kerosene | 1,121 (52.2%) | 268 (32.5%) |
| Coal or Coke | 0 (0.0%) | 0 (0.0%) |
| All other Fuels | 244 (11.4%) | 35 (4.2%) |
| No Fuel Used | 0 (0.0%) | 0 (0.0%) |
| Total | 2,146 (100.0%) | 826 (100.0%) |
Household Vehicle Usage in Topsham
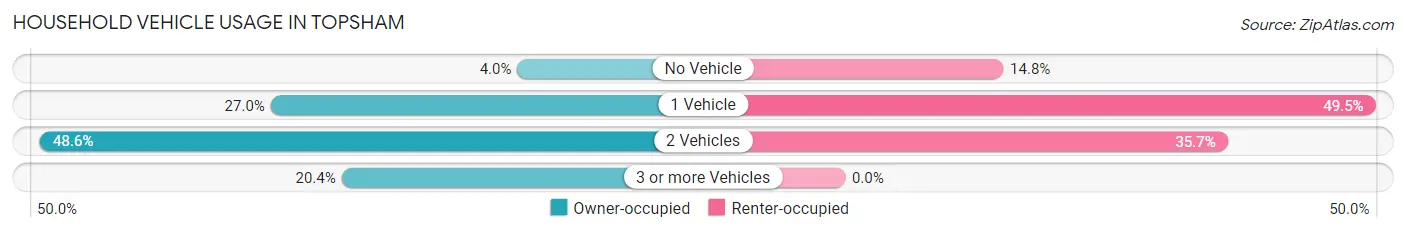
| Vehicles per Household | Owner-occupied | Renter-occupied |
| No Vehicle | 86 (4.0%) | 122 (14.8%) |
| 1 Vehicle | 580 (27.0%) | 409 (49.5%) |
| 2 Vehicles | 1,042 (48.6%) | 295 (35.7%) |
| 3 or more Vehicles | 438 (20.4%) | 0 (0.0%) |
| Total | 2,146 (100.0%) | 826 (100.0%) |
Real Estate & Mortgages in Topsham
Real Estate and Mortgage Overview in Topsham
| Characteristic | Without Mortgage | With Mortgage |
| Housing Units | 740 | 1,406 |
| Median Property Value | $331,800 | $307,500 |
| Median Household Income | $60,536 | $274 |
| Monthly Housing Costs | $735 | $101 |
| Real Estate Taxes | $4,049 | $0 |
Property Value by Mortgage Status in Topsham
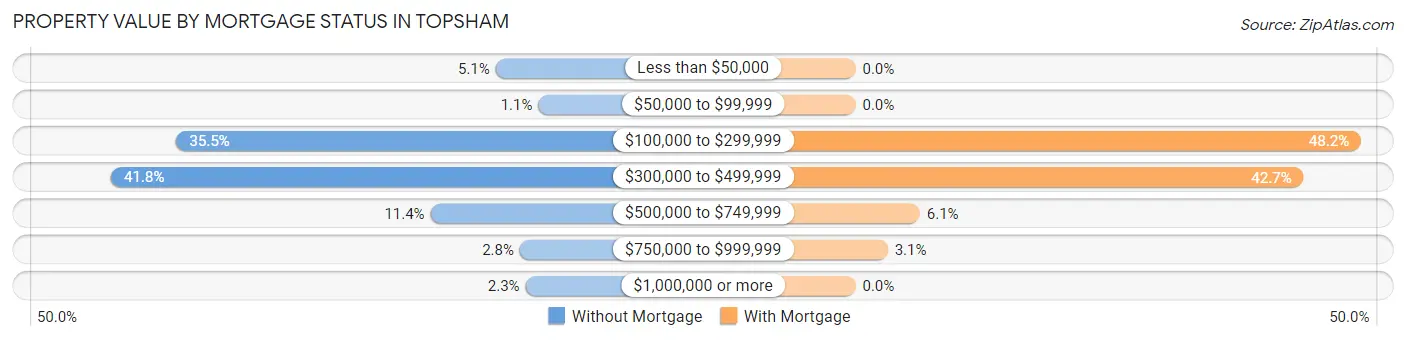
| Property Value | Without Mortgage | With Mortgage |
| Less than $50,000 | 38 (5.1%) | 0 (0.0%) |
| $50,000 to $99,999 | 8 (1.1%) | 0 (0.0%) |
| $100,000 to $299,999 | 263 (35.5%) | 677 (48.1%) |
| $300,000 to $499,999 | 309 (41.8%) | 600 (42.7%) |
| $500,000 to $749,999 | 84 (11.4%) | 86 (6.1%) |
| $750,000 to $999,999 | 21 (2.8%) | 43 (3.1%) |
| $1,000,000 or more | 17 (2.3%) | 0 (0.0%) |
| Total | 740 (100.0%) | 1,406 (100.0%) |
Household Income by Mortgage Status in Topsham
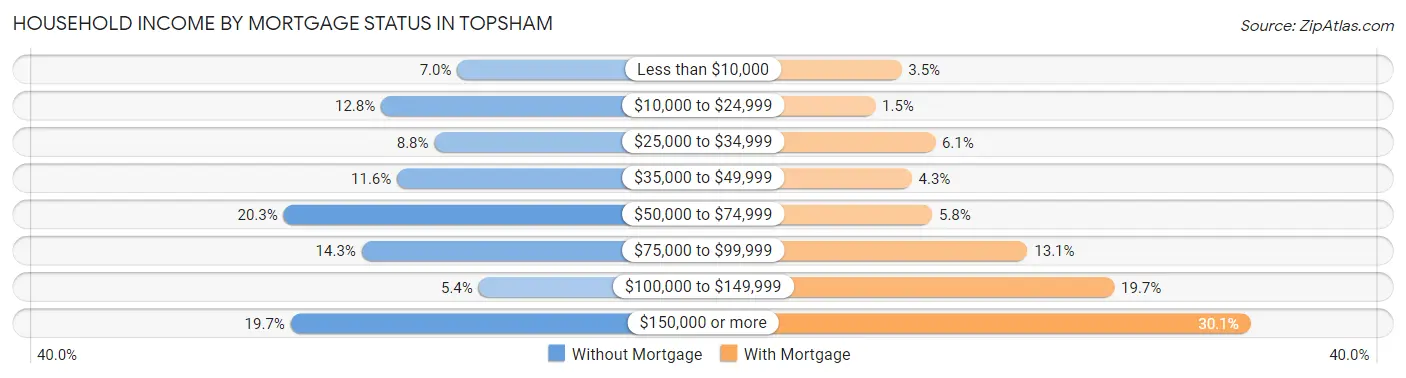
| Household Income | Without Mortgage | With Mortgage |
| Less than $10,000 | 52 (7.0%) | 49 (3.5%) |
| $10,000 to $24,999 | 95 (12.8%) | 21 (1.5%) |
| $25,000 to $34,999 | 65 (8.8%) | 85 (6.0%) |
| $35,000 to $49,999 | 86 (11.6%) | 60 (4.3%) |
| $50,000 to $74,999 | 150 (20.3%) | 82 (5.8%) |
| $75,000 to $99,999 | 106 (14.3%) | 184 (13.1%) |
| $100,000 to $149,999 | 40 (5.4%) | 277 (19.7%) |
| $150,000 or more | 146 (19.7%) | 423 (30.1%) |
| Total | 740 (100.0%) | 1,406 (100.0%) |
Property Value to Household Income Ratio in Topsham
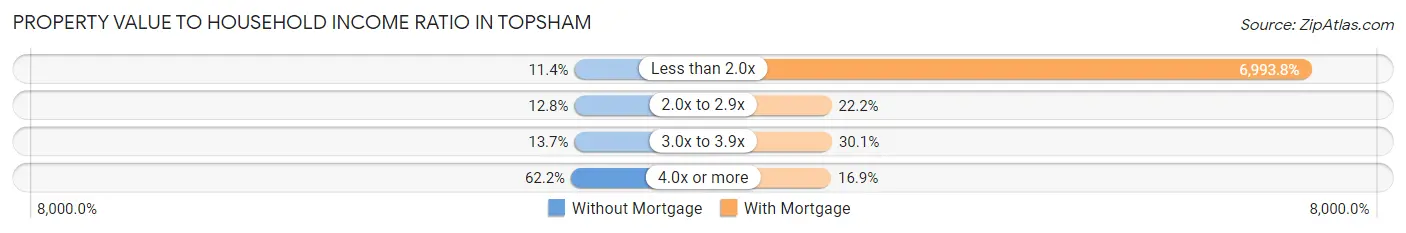
| Value-to-Income Ratio | Without Mortgage | With Mortgage |
| Less than 2.0x | 84 (11.4%) | 98,333 (6,993.8%) |
| 2.0x to 2.9x | 95 (12.8%) | 312 (22.2%) |
| 3.0x to 3.9x | 101 (13.7%) | 423 (30.1%) |
| 4.0x or more | 460 (62.2%) | 237 (16.9%) |
| Total | 740 (100.0%) | 1,406 (100.0%) |
Real Estate Taxes by Mortgage Status in Topsham
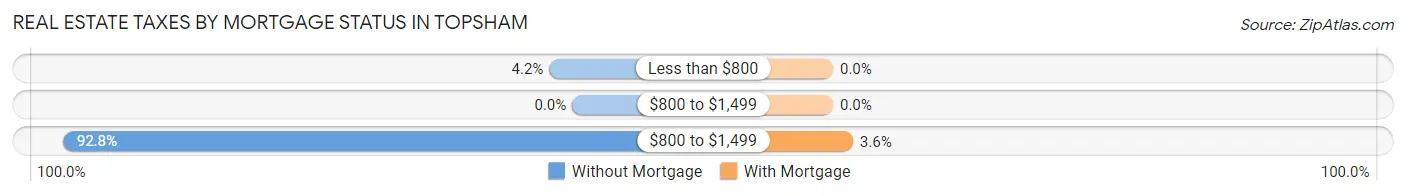
| Property Taxes | Without Mortgage | With Mortgage |
| Less than $800 | 31 (4.2%) | 0 (0.0%) |
| $800 to $1,499 | 0 (0.0%) | 0 (0.0%) |
| $800 to $1,499 | 687 (92.8%) | 51 (3.6%) |
| Total | 740 (100.0%) | 1,406 (100.0%) |
Health & Disability in Topsham
Health Insurance Coverage by Age in Topsham
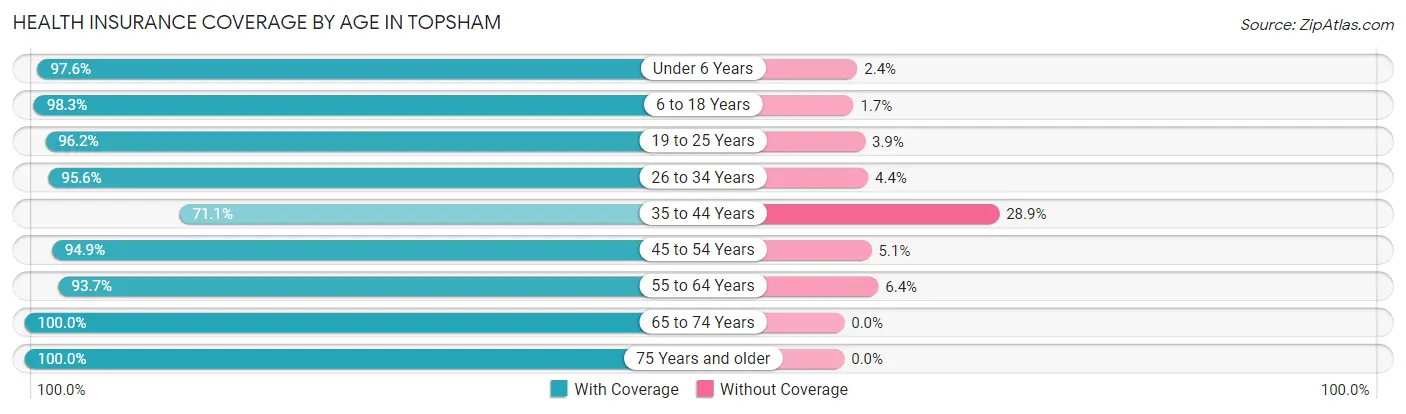
| Age Bracket | With Coverage | Without Coverage |
| Under 6 Years | 400 (97.6%) | 10 (2.4%) |
| 6 to 18 Years | 1,087 (98.3%) | 19 (1.7%) |
| 19 to 25 Years | 275 (96.2%) | 11 (3.8%) |
| 26 to 34 Years | 775 (95.6%) | 36 (4.4%) |
| 35 to 44 Years | 507 (71.1%) | 206 (28.9%) |
| 45 to 54 Years | 932 (94.9%) | 50 (5.1%) |
| 55 to 64 Years | 767 (93.6%) | 52 (6.4%) |
| 65 to 74 Years | 635 (100.0%) | 0 (0.0%) |
| 75 Years and older | 1,006 (100.0%) | 0 (0.0%) |
| Total | 6,384 (94.3%) | 384 (5.7%) |
Health Insurance Coverage by Citizenship Status in Topsham
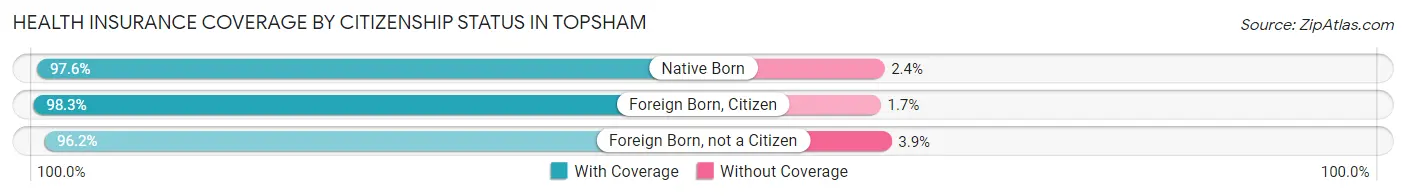
| Citizenship Status | With Coverage | Without Coverage |
| Native Born | 400 (97.6%) | 10 (2.4%) |
| Foreign Born, Citizen | 1,087 (98.3%) | 19 (1.7%) |
| Foreign Born, not a Citizen | 275 (96.2%) | 11 (3.8%) |
Health Insurance Coverage by Household Income in Topsham
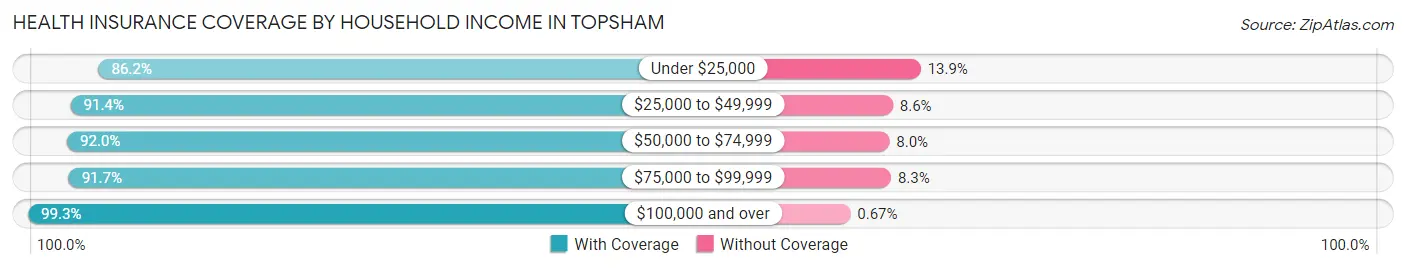
| Household Income | With Coverage | Without Coverage |
| Under $25,000 | 653 (86.2%) | 105 (13.9%) |
| $25,000 to $49,999 | 667 (91.4%) | 63 (8.6%) |
| $50,000 to $74,999 | 981 (92.0%) | 85 (8.0%) |
| $75,000 to $99,999 | 1,241 (91.7%) | 112 (8.3%) |
| $100,000 and over | 2,821 (99.3%) | 19 (0.7%) |
Public vs Private Health Insurance Coverage by Age in Topsham
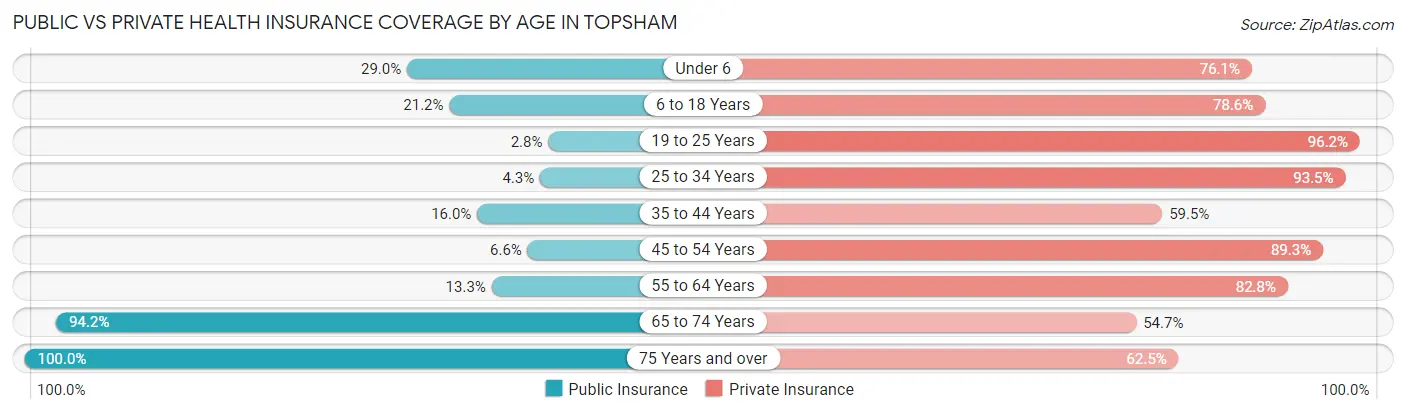
| Age Bracket | Public Insurance | Private Insurance |
| Under 6 | 119 (29.0%) | 312 (76.1%) |
| 6 to 18 Years | 234 (21.2%) | 869 (78.6%) |
| 19 to 25 Years | 8 (2.8%) | 275 (96.2%) |
| 25 to 34 Years | 35 (4.3%) | 758 (93.5%) |
| 35 to 44 Years | 114 (16.0%) | 424 (59.5%) |
| 45 to 54 Years | 65 (6.6%) | 877 (89.3%) |
| 55 to 64 Years | 109 (13.3%) | 678 (82.8%) |
| 65 to 74 Years | 598 (94.2%) | 347 (54.6%) |
| 75 Years and over | 1,006 (100.0%) | 629 (62.5%) |
| Total | 2,288 (33.8%) | 5,169 (76.4%) |
Disability Status by Sex by Age in Topsham
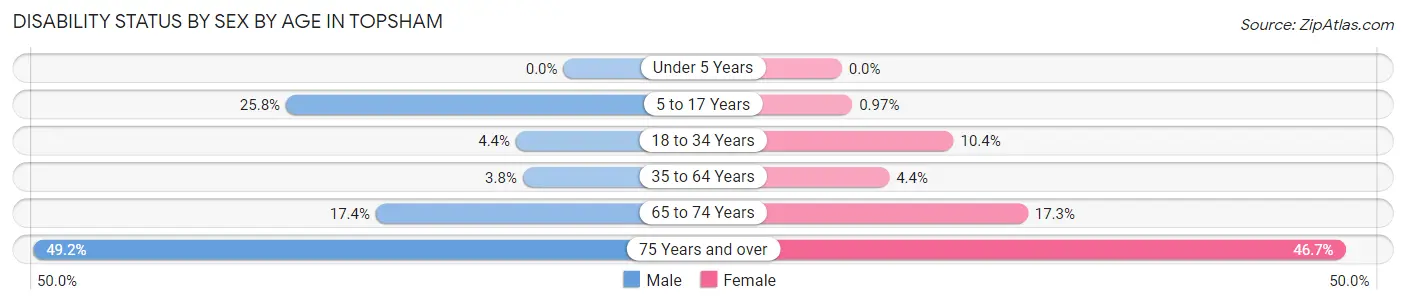
| Age Bracket | Male | Female |
| Under 5 Years | 0 (0.0%) | 0 (0.0%) |
| 5 to 17 Years | 128 (25.8%) | 6 (1.0%) |
| 18 to 34 Years | 26 (4.4%) | 62 (10.4%) |
| 35 to 64 Years | 46 (3.8%) | 57 (4.4%) |
| 65 to 74 Years | 47 (17.4%) | 63 (17.3%) |
| 75 Years and over | 216 (49.2%) | 265 (46.7%) |
Disability Class by Sex by Age in Topsham
Disability Class: Hearing Difficulty
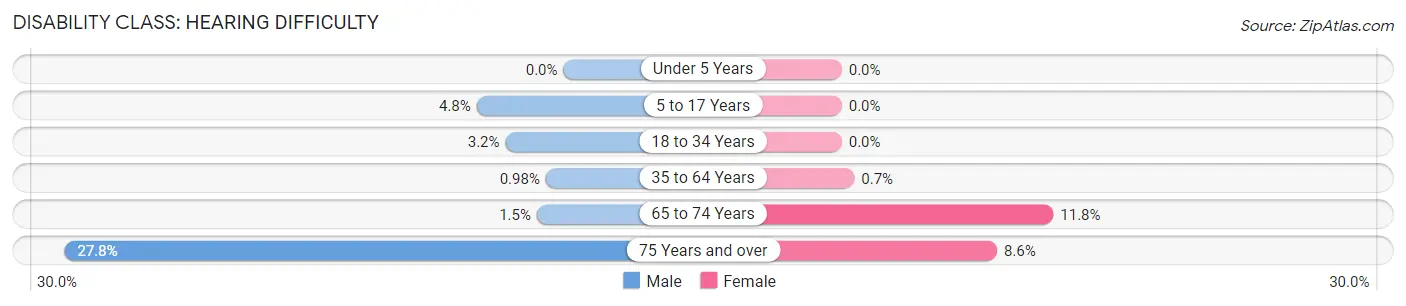
| Age Bracket | Male | Female |
| Under 5 Years | 0 (0.0%) | 0 (0.0%) |
| 5 to 17 Years | 24 (4.8%) | 0 (0.0%) |
| 18 to 34 Years | 19 (3.2%) | 0 (0.0%) |
| 35 to 64 Years | 12 (1.0%) | 9 (0.7%) |
| 65 to 74 Years | 4 (1.5%) | 43 (11.8%) |
| 75 Years and over | 122 (27.8%) | 49 (8.6%) |
Disability Class: Vision Difficulty
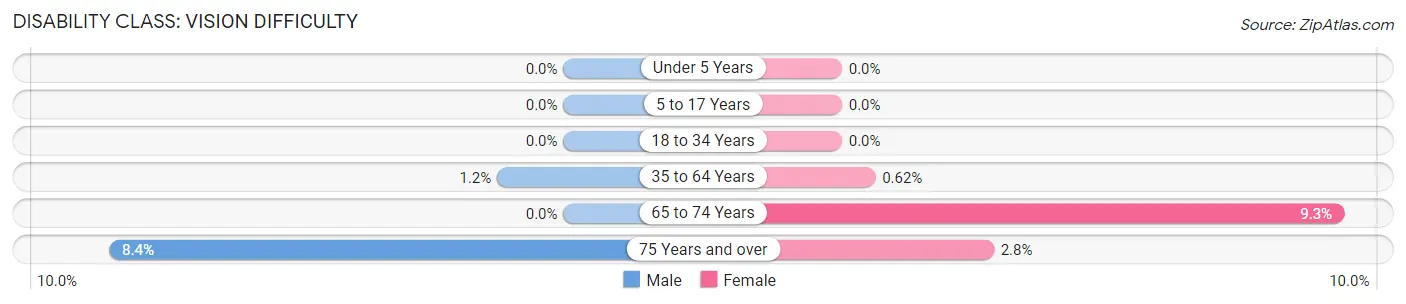
| Age Bracket | Male | Female |
| Under 5 Years | 0 (0.0%) | 0 (0.0%) |
| 5 to 17 Years | 0 (0.0%) | 0 (0.0%) |
| 18 to 34 Years | 0 (0.0%) | 0 (0.0%) |
| 35 to 64 Years | 15 (1.2%) | 8 (0.6%) |
| 65 to 74 Years | 0 (0.0%) | 34 (9.3%) |
| 75 Years and over | 37 (8.4%) | 16 (2.8%) |
Disability Class: Cognitive Difficulty
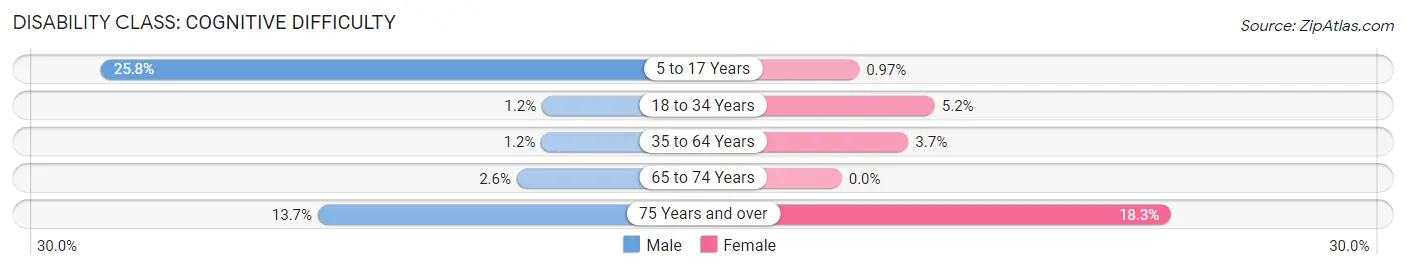
| Age Bracket | Male | Female |
| 5 to 17 Years | 128 (25.8%) | 6 (1.0%) |
| 18 to 34 Years | 7 (1.2%) | 31 (5.2%) |
| 35 to 64 Years | 15 (1.2%) | 48 (3.7%) |
| 65 to 74 Years | 7 (2.6%) | 0 (0.0%) |
| 75 Years and over | 60 (13.7%) | 104 (18.3%) |
Disability Class: Ambulatory Difficulty
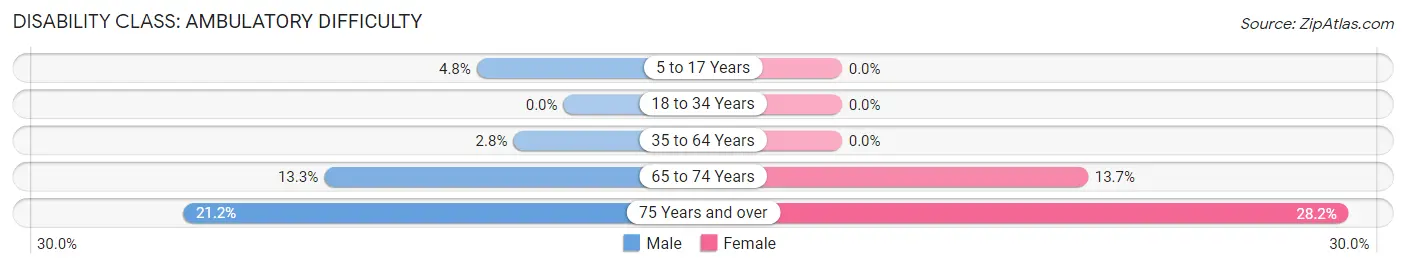
| Age Bracket | Male | Female |
| 5 to 17 Years | 24 (4.8%) | 0 (0.0%) |
| 18 to 34 Years | 0 (0.0%) | 0 (0.0%) |
| 35 to 64 Years | 34 (2.8%) | 0 (0.0%) |
| 65 to 74 Years | 36 (13.3%) | 50 (13.7%) |
| 75 Years and over | 93 (21.2%) | 160 (28.2%) |
Disability Class: Self-Care Difficulty
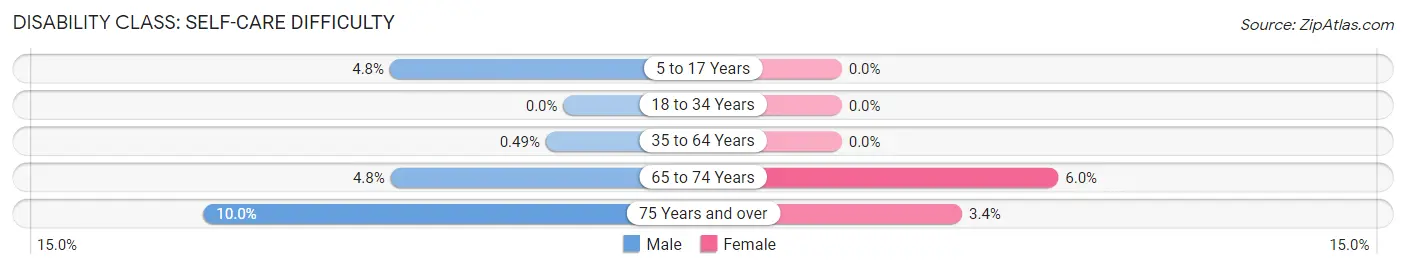
| Age Bracket | Male | Female |
| 5 to 17 Years | 24 (4.8%) | 0 (0.0%) |
| 18 to 34 Years | 0 (0.0%) | 0 (0.0%) |
| 35 to 64 Years | 6 (0.5%) | 0 (0.0%) |
| 65 to 74 Years | 13 (4.8%) | 22 (6.0%) |
| 75 Years and over | 44 (10.0%) | 19 (3.4%) |
Technology Access in Topsham
Computing Device Access in Topsham
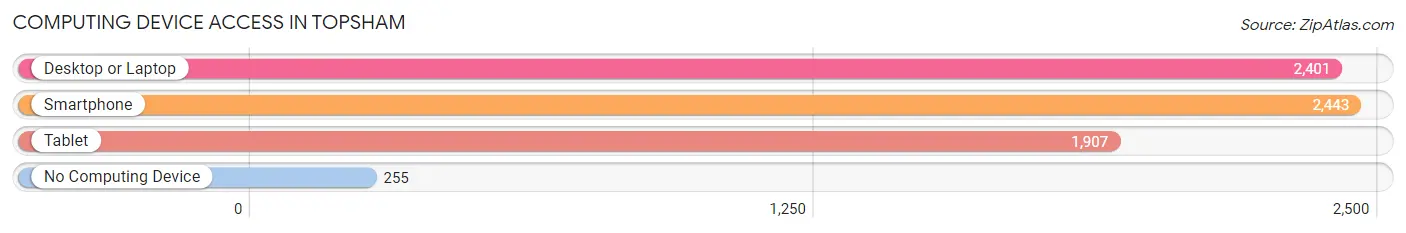
| Device Type | # Households | % Households |
| Desktop or Laptop | 2,401 | 80.8% |
| Smartphone | 2,443 | 82.2% |
| Tablet | 1,907 | 64.2% |
| No Computing Device | 255 | 8.6% |
| Total | 2,972 | 100.0% |
Internet Access in Topsham
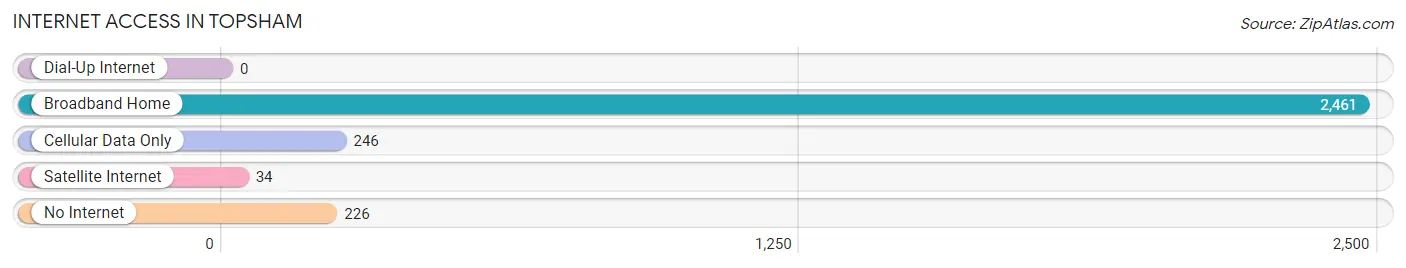
| Internet Type | # Households | % Households |
| Dial-Up Internet | 0 | 0.0% |
| Broadband Home | 2,461 | 82.8% |
| Cellular Data Only | 246 | 8.3% |
| Satellite Internet | 34 | 1.1% |
| No Internet | 226 | 7.6% |
| Total | 2,972 | 100.0% |
Topsham Summary
Topsham is a town located in Sagadahoc County, Maine, United States. It is situated on the Androscoggin River, approximately 12 miles (19 km) northeast of the state capital of Augusta. As of the 2010 census, the town had a population of 8,784.
History
The area that is now Topsham was originally inhabited by the Abenaki people. The first European settlers arrived in the area in the late 1600s, and the town was incorporated in 1764. The town was named after Topsham, England, which was the hometown of one of the original settlers.
In the early 1800s, Topsham was a thriving shipbuilding center, with several shipyards located along the Androscoggin River. The town was also home to several sawmills and gristmills, which provided lumber and grain for the local economy.
In the mid-1800s, Topsham was a popular summer resort destination, with several hotels and inns located along the river. The town was also home to several factories, including a woolen mill, a paper mill, and a shoe factory.
Geography
Topsham is located at 44°7′N 69°59′W (44.1167, -69.9833). According to the United States Census Bureau, the town has a total area of 28.2 square miles (73.1 km2), of which, 27.7 square miles (71.6 km2) of it is land and 0.5 square miles (1.3 km2) of it (1.77%) is water.
The town is situated on the Androscoggin River, and is bordered by the towns of Bowdoinham to the north, Brunswick to the east, Harpswell to the south, and West Bath to the west.
Economy
Topsham is home to several businesses, including a variety of retail stores, restaurants, and professional services. The town is also home to several manufacturing companies, including a paper mill, a printing company, and a plastics manufacturer.
The town is also home to several educational institutions, including the University of Maine at Augusta, the Maine Maritime Academy, and the Maine College of Art.
Demographics
As of the 2010 census, there were 8,784 people, 3,541 households, and 2,323 families residing in the town. The population density was 317.7 people per square mile (122.7/km2). There were 3,845 housing units at an average density of 138.9 per square mile (53.6/km2). The racial makeup of the town was 95.2% White, 0.7% African American, 0.5% Native American, 1.2% Asian, 0.1% Pacific Islander, 0.7% from other races, and 1.7% from two or more races. Hispanic or Latino of any race were 1.9% of the population.
There were 3,541 households, out of which 30.2% had children under the age of 18 living with them, 51.2% were married couples living together, 10.2% had a female householder with no husband present, and 34.2% were non-families. 27.2% of all households were made up of individuals, and 10.2% had someone living alone who was 65 years of age or older. The average household size was 2.44 and the average family size was 2.96.
In the town, the population was spread out, with 24.2% under the age of 18, 8.2% from 18 to 24, 28.2% from 25 to 44, 25.2% from 45 to 64, and 14.2% who were 65 years of age or older. The median age was 38 years. For every 100 females, there were 94.2 males. For every 100 females age 18 and over, there were 91.2 males.
The median income for a household in the town was $45,938, and the median income for a family was $54,821. Males had a median income of $40,945 versus $30,917 for females. The per capita income for the town was $23,945. About 6.2% of families and 8.7% of the population were below the poverty line, including 11.2% of those under age 18 and 6.2% of those age 65 or over.
Common Questions
What is Per Capita Income in Topsham?
Per Capita income in Topsham is $45,738.
What is the Median Family Income in Topsham?
Median Family Income in Topsham is $97,377.
What is the Median Household income in Topsham?
Median Household Income in Topsham is $75,801.
What is Income or Wage Gap in Topsham?
Income or Wage Gap in Topsham is 20.9%.
Women in Topsham earn 79.1 cents for every dollar earned by a man.
What is Inequality or Gini Index in Topsham?
Inequality or Gini Index in Topsham is 0.47.
What is the Total Population of Topsham?
Total Population of Topsham is 6,813.
What is the Total Male Population of Topsham?
Total Male Population of Topsham is 3,151.
What is the Total Female Population of Topsham?
Total Female Population of Topsham is 3,662.
What is the Ratio of Males per 100 Females in Topsham?
There are 86.05 Males per 100 Females in Topsham.
What is the Ratio of Females per 100 Males in Topsham?
There are 116.22 Females per 100 Males in Topsham.
What is the Median Population Age in Topsham?
Median Population Age in Topsham is 46.6 Years.
What is the Average Family Size in Topsham
Average Family Size in Topsham is 2.9 People.
What is the Average Household Size in Topsham
Average Household Size in Topsham is 2.3 People.
How Large is the Labor Force in Topsham?
There are 3,589 People in the Labor Forcein in Topsham.
What is the Percentage of People in the Labor Force in Topsham?
62.6% of People are in the Labor Force in Topsham.
What is the Unemployment Rate in Topsham?
Unemployment Rate in Topsham is 5.4%.