Calais, ME Map & Demographics
Calais Map
Calais Overview
$32,378
PER CAPITA INCOME
$74,394
AVG FAMILY INCOME
$45,250
AVG HOUSEHOLD INCOME
35.9%
WAGE / INCOME GAP [ % ]
64.1¢/ $1
WAGE / INCOME GAP [ $ ]
0.45
INEQUALITY / GINI INDEX
3,078
TOTAL POPULATION
1,475
MALE POPULATION
1,603
FEMALE POPULATION
92.01
MALES / 100 FEMALES
108.68
FEMALES / 100 MALES
49.9
MEDIAN AGE
2.4
AVG FAMILY SIZE
1.8
AVG HOUSEHOLD SIZE
1,482
LABOR FORCE [ PEOPLE ]
54.4%
PERCENT IN LABOR FORCE
9.8%
UNEMPLOYMENT RATE
Calais Zip Codes
Calais Area Codes
Income in Calais
Income Overview in Calais
Per Capita Income in Calais is $32,378, while median incomes of families and households are $74,394 and $45,250 respectively.
| Characteristic | Number | Measure |
| Per Capita Income | 3,078 | $32,378 |
| Median Family Income | 890 | $74,394 |
| Mean Family Income | 890 | $82,964 |
| Median Household Income | 1,595 | $45,250 |
| Mean Household Income | 1,595 | $62,356 |
| Income Deficit | 890 | $0 |
| Wage / Income Gap (%) | 3,078 | 35.88% |
| Wage / Income Gap ($) | 3,078 | 64.12¢ per $1 |
| Gini / Inequality Index | 3,078 | 0.45 |
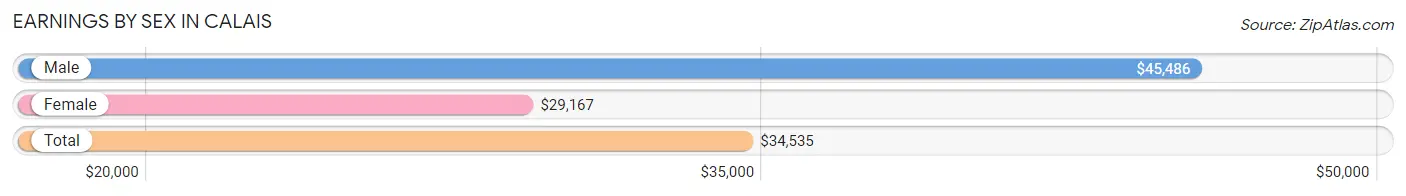
Earnings by Sex in Calais
Average Earnings in Calais are $34,535, $45,486 for men and $29,167 for women, a difference of 35.9%.
| Sex | Number | Average Earnings |
| Male | 706 (47.1%) | $45,486 |
| Female | 792 (52.9%) | $29,167 |
| Total | 1,498 (100.0%) | $34,535 |
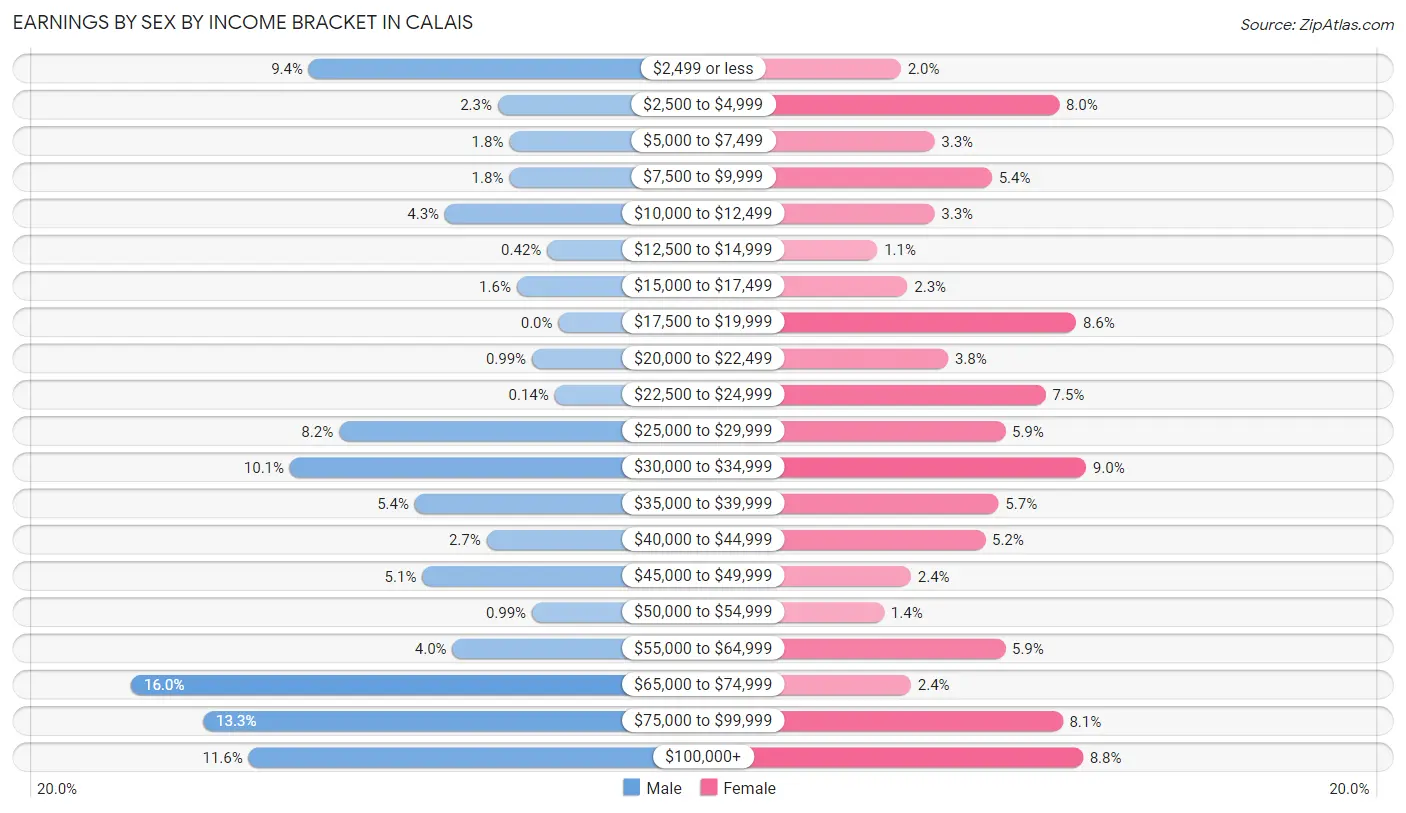
Earnings by Sex by Income Bracket in Calais
The most common earnings brackets in Calais are $65,000 to $74,999 for men (113 | 16.0%) and $30,000 to $34,999 for women (71 | 9.0%).
| Income | Male | Female |
| $2,499 or less | 66 (9.3%) | 16 (2.0%) |
| $2,500 to $4,999 | 16 (2.3%) | 63 (8.0%) |
| $5,000 to $7,499 | 13 (1.8%) | 26 (3.3%) |
| $7,500 to $9,999 | 13 (1.8%) | 43 (5.4%) |
| $10,000 to $12,499 | 30 (4.3%) | 26 (3.3%) |
| $12,500 to $14,999 | 3 (0.4%) | 9 (1.1%) |
| $15,000 to $17,499 | 11 (1.6%) | 18 (2.3%) |
| $17,500 to $19,999 | 0 (0.0%) | 68 (8.6%) |
| $20,000 to $22,499 | 7 (1.0%) | 30 (3.8%) |
| $22,500 to $24,999 | 1 (0.1%) | 59 (7.4%) |
| $25,000 to $29,999 | 58 (8.2%) | 47 (5.9%) |
| $30,000 to $34,999 | 71 (10.1%) | 71 (9.0%) |
| $35,000 to $39,999 | 38 (5.4%) | 45 (5.7%) |
| $40,000 to $44,999 | 19 (2.7%) | 41 (5.2%) |
| $45,000 to $49,999 | 36 (5.1%) | 19 (2.4%) |
| $50,000 to $54,999 | 7 (1.0%) | 11 (1.4%) |
| $55,000 to $64,999 | 28 (4.0%) | 47 (5.9%) |
| $65,000 to $74,999 | 113 (16.0%) | 19 (2.4%) |
| $75,000 to $99,999 | 94 (13.3%) | 64 (8.1%) |
| $100,000+ | 82 (11.6%) | 70 (8.8%) |
| Total | 706 (100.0%) | 792 (100.0%) |
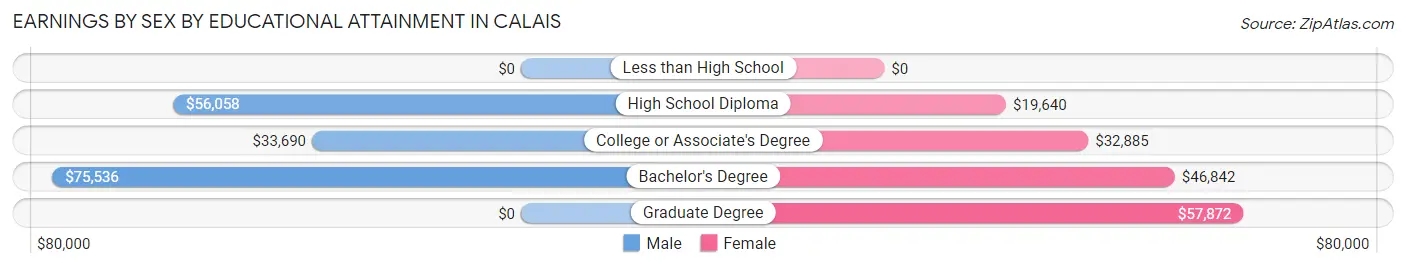
Earnings by Sex by Educational Attainment in Calais
Average earnings in Calais are $62,583 for men and $32,870 for women, a difference of 47.5%. Men with an educational attainment of bachelor's degree enjoy the highest average annual earnings of $75,536, while those with college or associate's degree education earn the least with $33,690. Women with an educational attainment of graduate degree earn the most with the average annual earnings of $57,872, while those with high school diploma education have the smallest earnings of $19,640.
| Educational Attainment | Male Income | Female Income |
| Less than High School | - | - |
| High School Diploma | $56,058 | $19,640 |
| College or Associate's Degree | $33,690 | $32,885 |
| Bachelor's Degree | $75,536 | $46,842 |
| Graduate Degree | - | - |
| Total | $62,583 | $32,870 |
Family Income in Calais
Family Income Brackets in Calais
According to the Calais family income data, there are 165 families falling into the $75,000 to $99,999 income range, which is the most common income bracket and makes up 18.5% of all families.
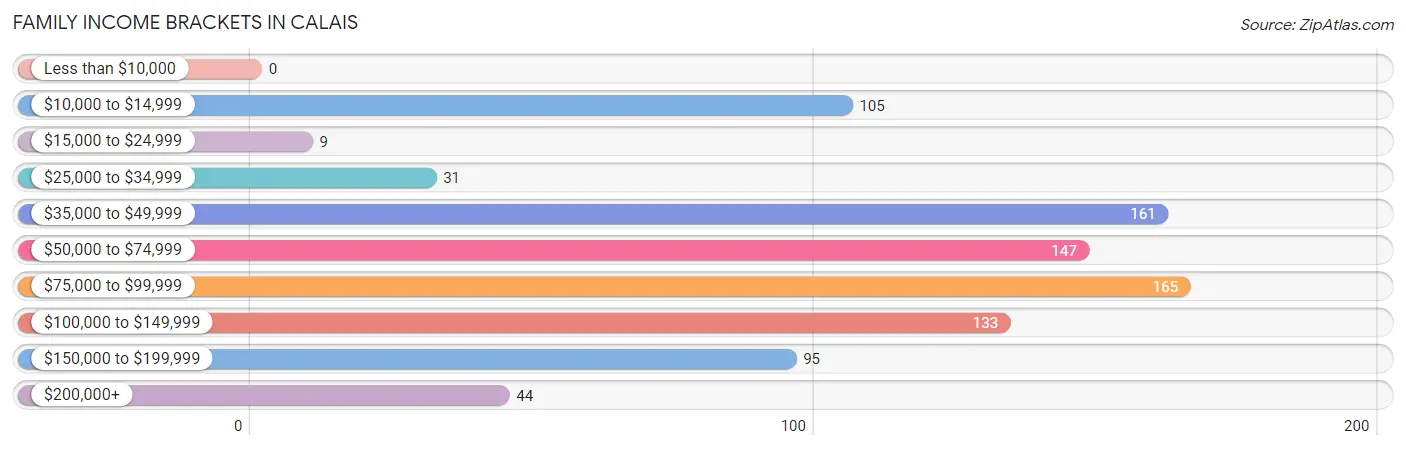
| Income Bracket | # Families | % Families |
| Less than $10,000 | 0 | 0.0% |
| $10,000 to $14,999 | 105 | 11.8% |
| $15,000 to $24,999 | 9 | 1.0% |
| $25,000 to $34,999 | 31 | 3.5% |
| $35,000 to $49,999 | 161 | 18.1% |
| $50,000 to $74,999 | 147 | 16.5% |
| $75,000 to $99,999 | 165 | 18.5% |
| $100,000 to $149,999 | 133 | 14.9% |
| $150,000 to $199,999 | 95 | 10.7% |
| $200,000+ | 44 | 4.9% |
Family Income by Famaliy Size in Calais
3-person families (149 | 16.7%) account for the highest median family income in Calais with $133,850 per family, while 3-person families (149 | 16.7%) have the highest median income of $44,617 per family member.
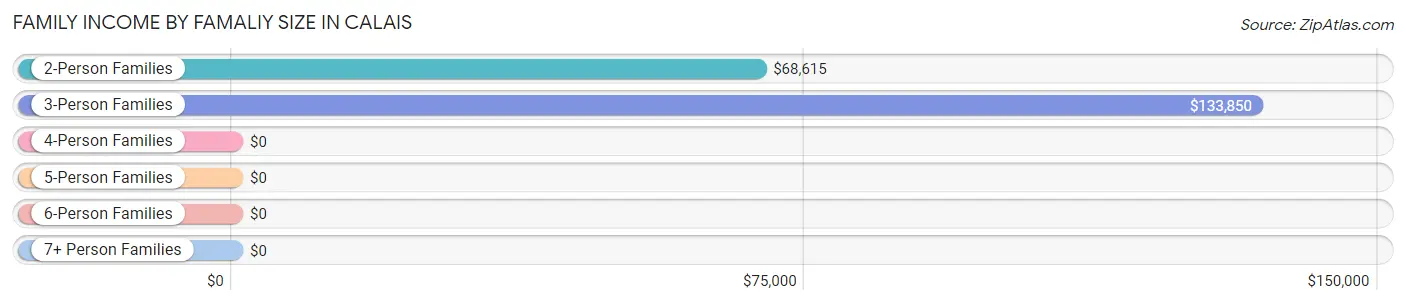
| Income Bracket | # Families | Median Income |
| 2-Person Families | 645 (72.5%) | $68,615 |
| 3-Person Families | 149 (16.7%) | $133,850 |
| 4-Person Families | 47 (5.3%) | $0 |
| 5-Person Families | 38 (4.3%) | $0 |
| 6-Person Families | 11 (1.2%) | $0 |
| 7+ Person Families | 0 (0.0%) | $0 |
| Total | 890 (100.0%) | $74,394 |
Family Income by Number of Earners in Calais
The median family income in Calais is $74,394, with families comprising 3+ earners (69) having the highest median family income of $141,250, while families with no earners (185) have the lowest median family income of $49,583, accounting for 7.7% and 20.8% of families, respectively.
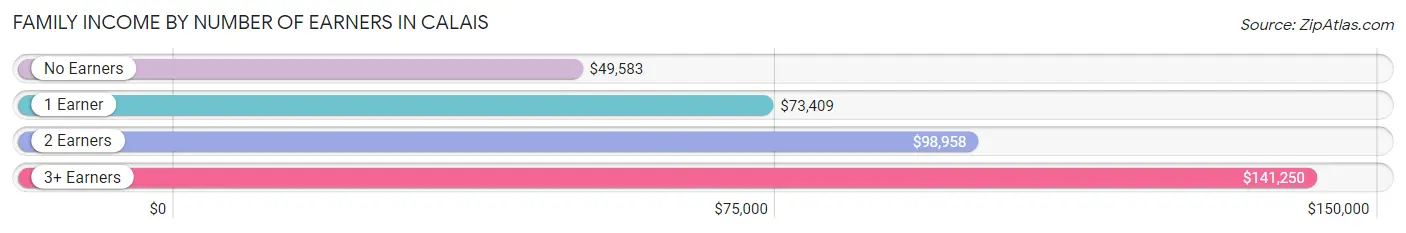
| Number of Earners | # Families | Median Income |
| No Earners | 185 (20.8%) | $49,583 |
| 1 Earner | 406 (45.6%) | $73,409 |
| 2 Earners | 230 (25.8%) | $98,958 |
| 3+ Earners | 69 (7.7%) | $141,250 |
| Total | 890 (100.0%) | $74,394 |
Household Income in Calais
Household Income Brackets in Calais
With 246 households falling in the category, the $10,000 to $14,999 income range is the most frequent in Calais, accounting for 15.4% of all households. In contrast, only 33 households (2.1%) fall into the less than $10,000 income bracket, making it the least populous group.
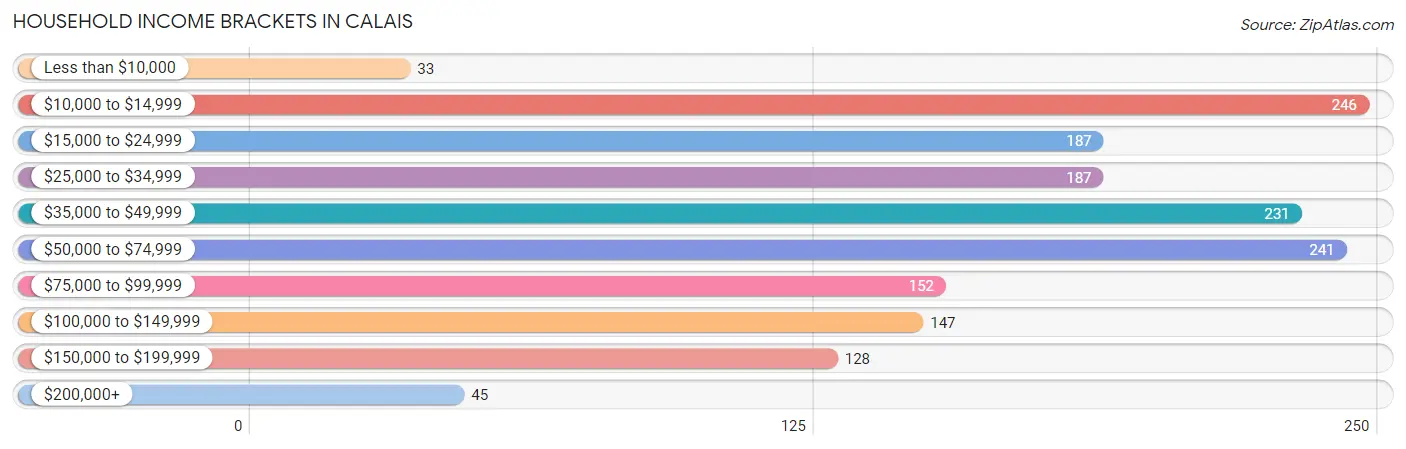
| Income Bracket | # Households | % Households |
| Less than $10,000 | 33 | 2.1% |
| $10,000 to $14,999 | 246 | 15.4% |
| $15,000 to $24,999 | 187 | 11.7% |
| $25,000 to $34,999 | 187 | 11.7% |
| $35,000 to $49,999 | 231 | 14.5% |
| $50,000 to $74,999 | 241 | 15.1% |
| $75,000 to $99,999 | 152 | 9.5% |
| $100,000 to $149,999 | 147 | 9.2% |
| $150,000 to $199,999 | 128 | 8.0% |
| $200,000+ | 45 | 2.8% |
Household Income by Householder Age in Calais
The median household income in Calais is $45,250, with the highest median household income of $66,696 found in the 45 to 64 years age bracket for the primary householder. A total of 567 households (35.5%) fall into this category. Meanwhile, the 15 to 24 years age bracket for the primary householder has the lowest median household income of $0, with 57 households (3.6%) in this group.
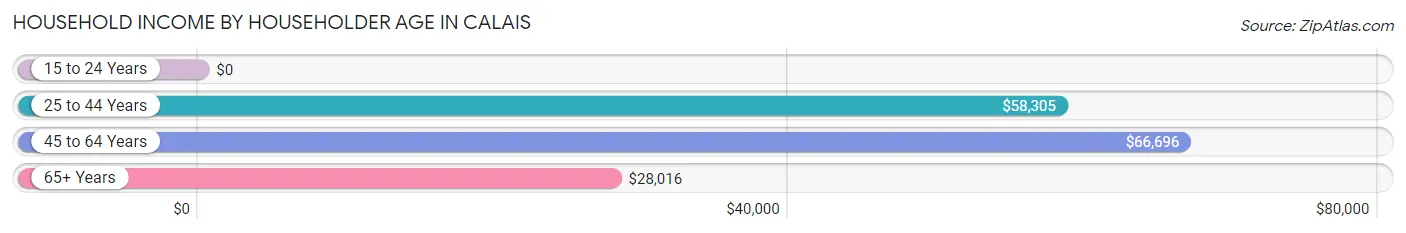
| Income Bracket | # Households | Median Income |
| 15 to 24 Years | 57 (3.6%) | $0 |
| 25 to 44 Years | 346 (21.7%) | $58,305 |
| 45 to 64 Years | 567 (35.5%) | $66,696 |
| 65+ Years | 625 (39.2%) | $28,016 |
| Total | 1,595 (100.0%) | $45,250 |
Poverty in Calais
Income Below Poverty by Sex and Age in Calais
With 10.3% poverty level for males and 21.6% for females among the residents of Calais, 25 to 34 year old males and under 5 year old females are the most vulnerable to poverty, with 76 males (35.8%) and 70 females (67.3%) in their respective age groups living below the poverty level.
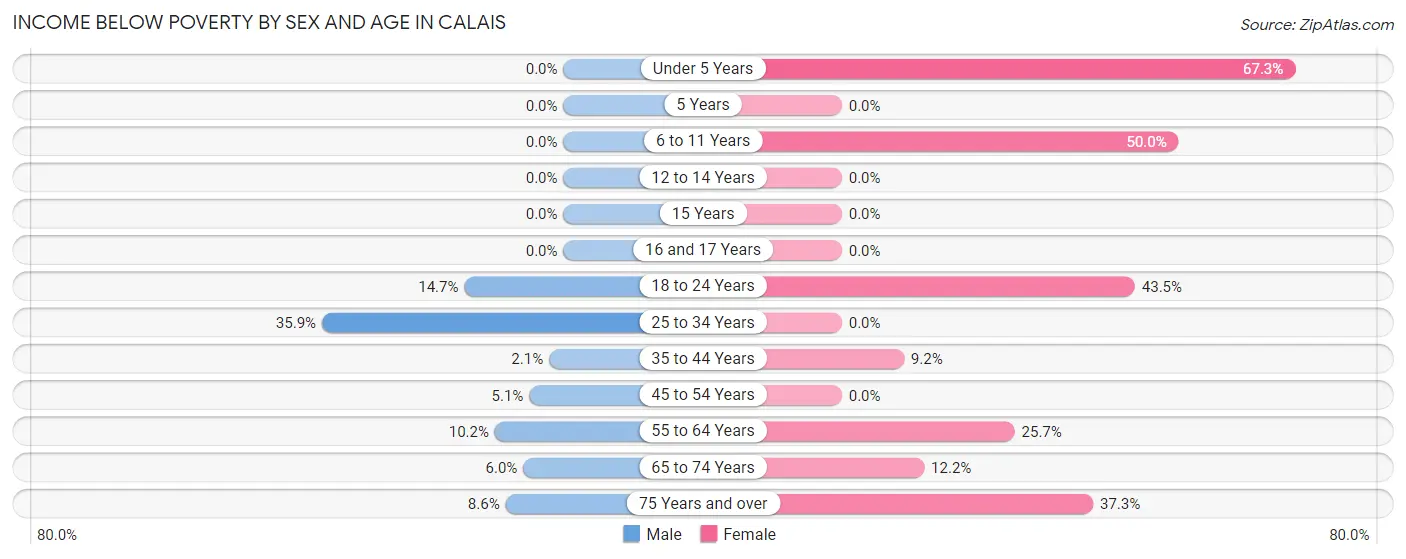
| Age Bracket | Male | Female |
| Under 5 Years | 0 (0.0%) | 70 (67.3%) |
| 5 Years | 0 (0.0%) | 0 (0.0%) |
| 6 to 11 Years | 0 (0.0%) | 12 (50.0%) |
| 12 to 14 Years | 0 (0.0%) | 0 (0.0%) |
| 15 Years | 0 (0.0%) | 0 (0.0%) |
| 16 and 17 Years | 0 (0.0%) | 0 (0.0%) |
| 18 to 24 Years | 10 (14.7%) | 47 (43.5%) |
| 25 to 34 Years | 76 (35.8%) | 0 (0.0%) |
| 35 to 44 Years | 2 (2.1%) | 20 (9.2%) |
| 45 to 54 Years | 11 (5.1%) | 0 (0.0%) |
| 55 to 64 Years | 17 (10.2%) | 68 (25.7%) |
| 65 to 74 Years | 12 (6.0%) | 23 (12.2%) |
| 75 Years and over | 17 (8.6%) | 97 (37.3%) |
| Total | 145 (10.3%) | 337 (21.6%) |
Income Above Poverty by Sex and Age in Calais
According to the poverty statistics in Calais, males aged under 5 years and females aged 12 to 14 years are the age groups that are most secure financially, with 100.0% of males and 100.0% of females in these age groups living above the poverty line.
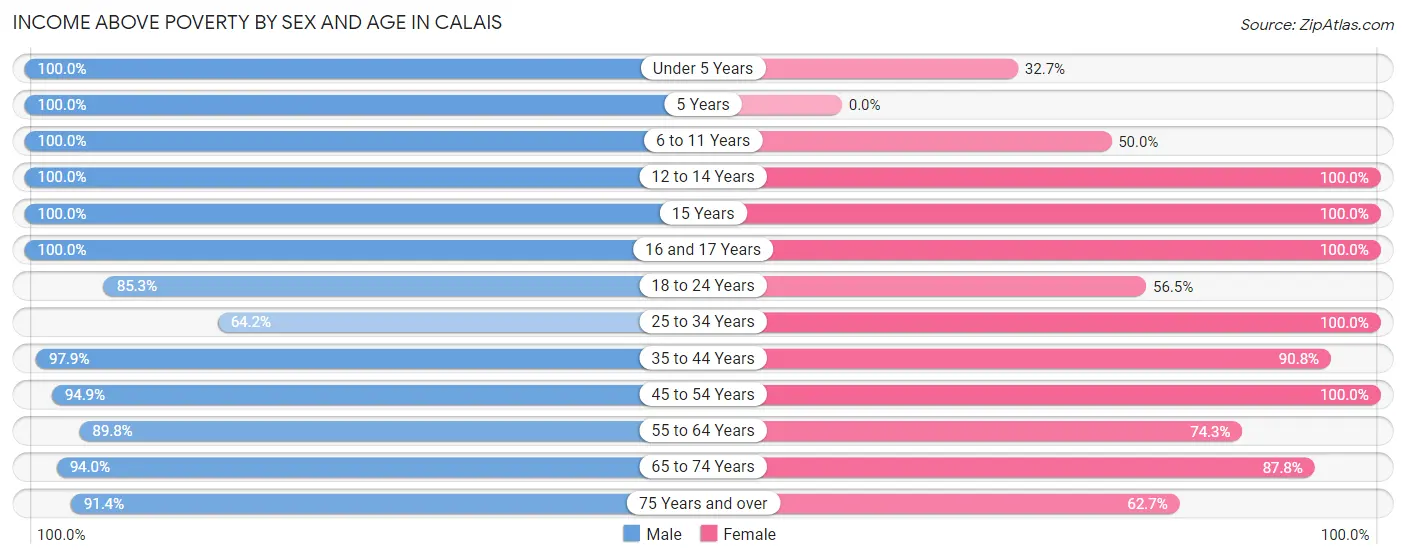
| Age Bracket | Male | Female |
| Under 5 Years | 106 (100.0%) | 34 (32.7%) |
| 5 Years | 18 (100.0%) | 0 (0.0%) |
| 6 to 11 Years | 43 (100.0%) | 12 (50.0%) |
| 12 to 14 Years | 12 (100.0%) | 28 (100.0%) |
| 15 Years | 10 (100.0%) | 7 (100.0%) |
| 16 and 17 Years | 58 (100.0%) | 22 (100.0%) |
| 18 to 24 Years | 58 (85.3%) | 61 (56.5%) |
| 25 to 34 Years | 136 (64.1%) | 165 (100.0%) |
| 35 to 44 Years | 92 (97.9%) | 197 (90.8%) |
| 45 to 54 Years | 206 (94.9%) | 171 (100.0%) |
| 55 to 64 Years | 150 (89.8%) | 197 (74.3%) |
| 65 to 74 Years | 189 (94.0%) | 165 (87.8%) |
| 75 Years and over | 181 (91.4%) | 163 (62.7%) |
| Total | 1,259 (89.7%) | 1,222 (78.4%) |
Income Below Poverty Among Married-Couple Families in Calais
The poverty statistics for married-couple families in Calais show that 4.2% or 26 of the total 621 families live below the poverty line. Families with no children have the highest poverty rate of 5.6%, comprising of 26 families. On the other hand, families with 1 or 2 children have the lowest poverty rate of 0.0%, which includes 0 families.
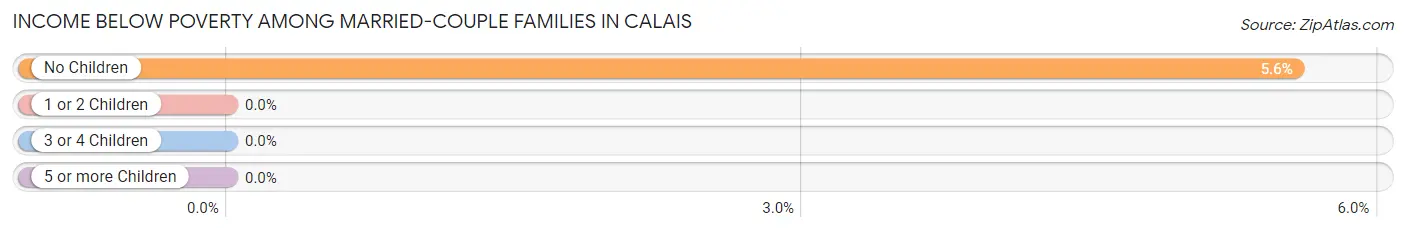
| Children | Above Poverty | Below Poverty |
| No Children | 441 (94.4%) | 26 (5.6%) |
| 1 or 2 Children | 142 (100.0%) | 0 (0.0%) |
| 3 or 4 Children | 12 (100.0%) | 0 (0.0%) |
| 5 or more Children | 0 (0.0%) | 0 (0.0%) |
| Total | 595 (95.8%) | 26 (4.2%) |
Income Below Poverty Among Single-Parent Households in Calais
According to the poverty data in Calais, 50.0% or 61 single-father households and 18.4% or 27 single-mother households are living below the poverty line. Among single-father households, those with 1 or 2 children have the highest poverty rate, with 61 households (59.2%) experiencing poverty. Likewise, among single-mother households, those with 1 or 2 children have the highest poverty rate, with 27 households (24.1%) falling below the poverty line.
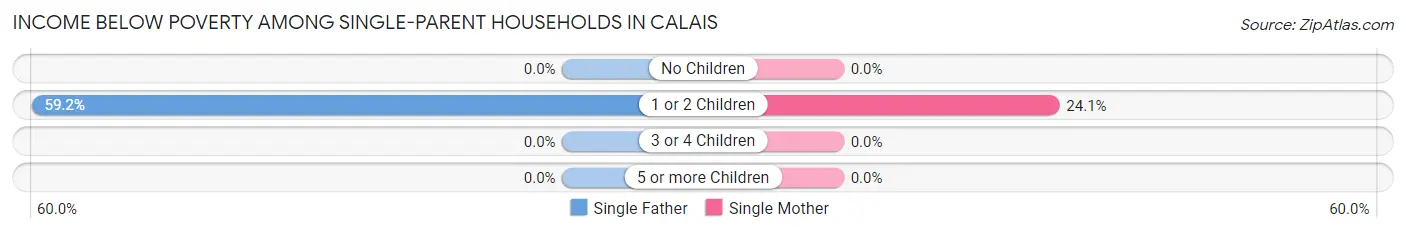
| Children | Single Father | Single Mother |
| No Children | 0 (0.0%) | 0 (0.0%) |
| 1 or 2 Children | 61 (59.2%) | 27 (24.1%) |
| 3 or 4 Children | 0 (0.0%) | 0 (0.0%) |
| 5 or more Children | 0 (0.0%) | 0 (0.0%) |
| Total | 61 (50.0%) | 27 (18.4%) |
Income Below Poverty Among Married-Couple vs Single-Parent Households in Calais
The poverty data for Calais shows that 26 of the married-couple family households (4.2%) and 88 of the single-parent households (32.7%) are living below the poverty level. Within the married-couple family households, those with no children have the highest poverty rate, with 26 households (5.6%) falling below the poverty line. Among the single-parent households, those with 1 or 2 children have the highest poverty rate, with 88 household (40.9%) living below poverty.
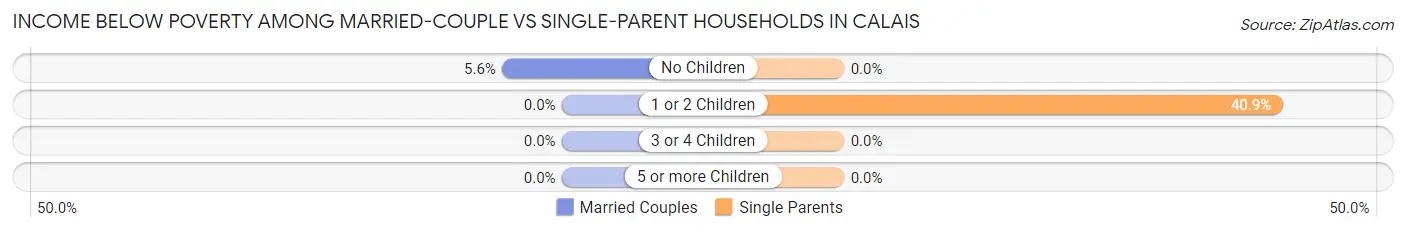
| Children | Married-Couple Families | Single-Parent Households |
| No Children | 26 (5.6%) | 0 (0.0%) |
| 1 or 2 Children | 0 (0.0%) | 88 (40.9%) |
| 3 or 4 Children | 0 (0.0%) | 0 (0.0%) |
| 5 or more Children | 0 (0.0%) | 0 (0.0%) |
| Total | 26 (4.2%) | 88 (32.7%) |
Race in Calais
The most populous races in Calais are White / Caucasian (2,887 | 93.8%), Black / African American (75 | 2.4%), and Two or more Races (55 | 1.8%).
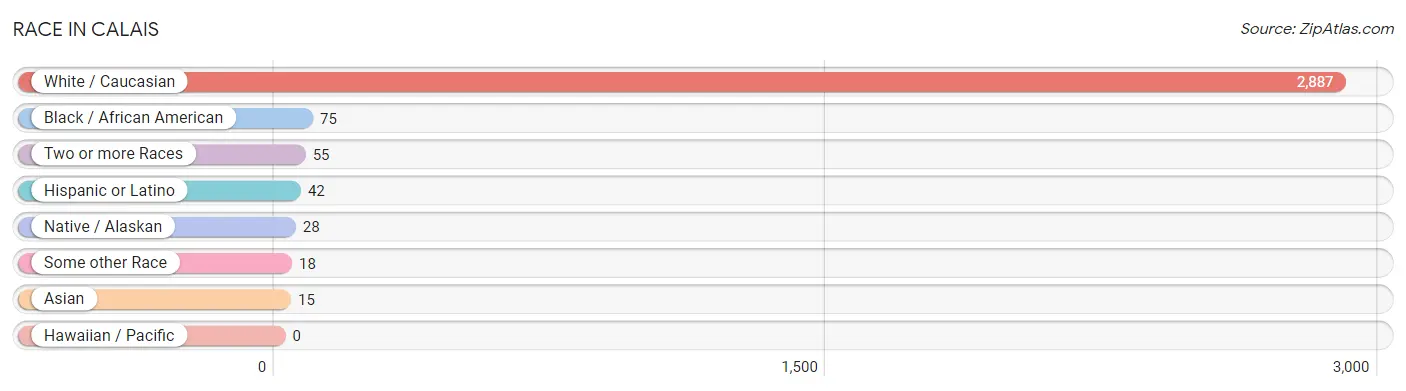
| Race | # Population | % Population |
| Asian | 15 | 0.5% |
| Black / African American | 75 | 2.4% |
| Hawaiian / Pacific | 0 | 0.0% |
| Hispanic or Latino | 42 | 1.4% |
| Native / Alaskan | 28 | 0.9% |
| White / Caucasian | 2,887 | 93.8% |
| Two or more Races | 55 | 1.8% |
| Some other Race | 18 | 0.6% |
| Total | 3,078 | 100.0% |
Ancestry in Calais
The most populous ancestries reported in Calais are English (799 | 26.0%), Irish (368 | 12.0%), German (247 | 8.0%), French (160 | 5.2%), and Scottish (158 | 5.1%), together accounting for 56.3% of all Calais residents.
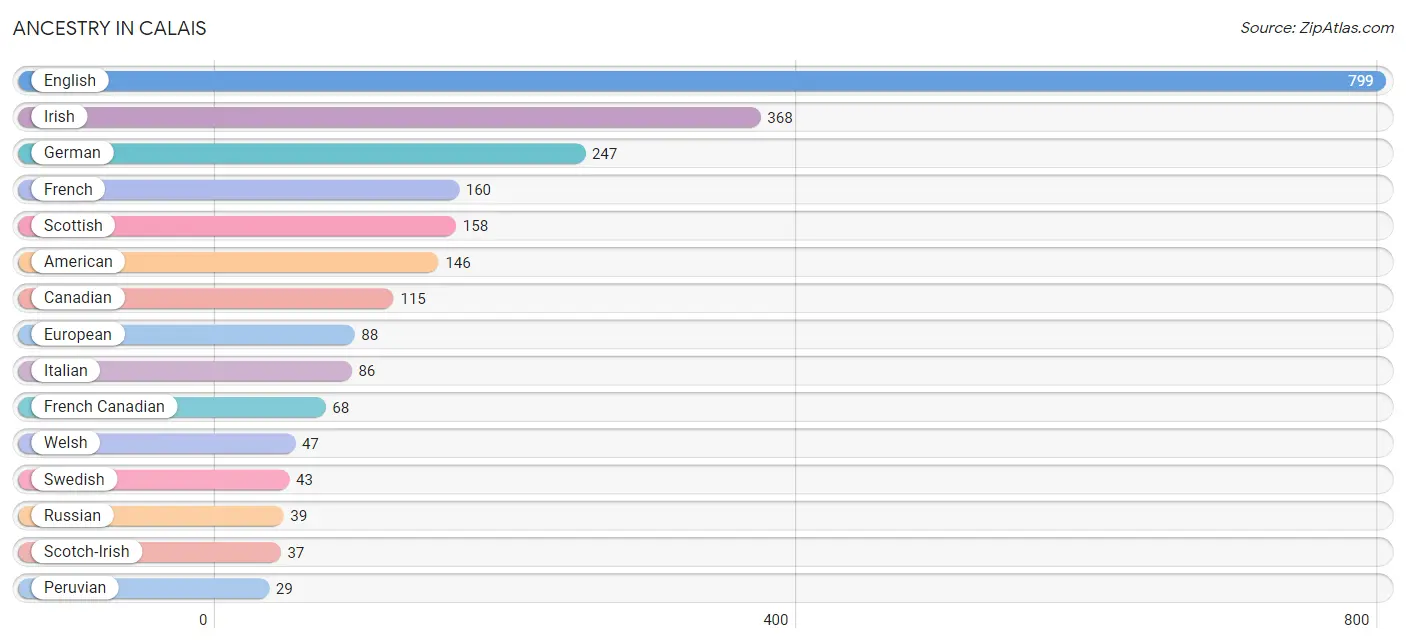
| Ancestry | # Population | % Population |
| American | 146 | 4.7% |
| Arab | 22 | 0.7% |
| Austrian | 10 | 0.3% |
| Belgian | 2 | 0.1% |
| British | 10 | 0.3% |
| Canadian | 115 | 3.7% |
| Cherokee | 1 | 0.0% |
| Croatian | 10 | 0.3% |
| Cuban | 13 | 0.4% |
| Dutch | 15 | 0.5% |
| English | 799 | 26.0% |
| European | 88 | 2.9% |
| French | 160 | 5.2% |
| French American Indian | 10 | 0.3% |
| French Canadian | 68 | 2.2% |
| German | 247 | 8.0% |
| Indian (Asian) | 1 | 0.0% |
| Irish | 368 | 12.0% |
| Italian | 86 | 2.8% |
| Korean | 6 | 0.2% |
| Lebanese | 12 | 0.4% |
| Norwegian | 4 | 0.1% |
| Peruvian | 29 | 0.9% |
| Polish | 21 | 0.7% |
| Portuguese | 12 | 0.4% |
| Russian | 39 | 1.3% |
| Scandinavian | 2 | 0.1% |
| Scotch-Irish | 37 | 1.2% |
| Scottish | 158 | 5.1% |
| Somali | 3 | 0.1% |
| South American | 29 | 0.9% |
| Sri Lankan | 8 | 0.3% |
| Subsaharan African | 3 | 0.1% |
| Swedish | 43 | 1.4% |
| Welsh | 47 | 1.5% | View All 35 Rows |
Immigrants in Calais
The most numerous immigrant groups reported in Calais came from Canada (136 | 4.4%), Latin America (31 | 1.0%), Europe (28 | 0.9%), South America (18 | 0.6%), and Asia (14 | 0.4%), together accounting for 7.4% of all Calais residents.
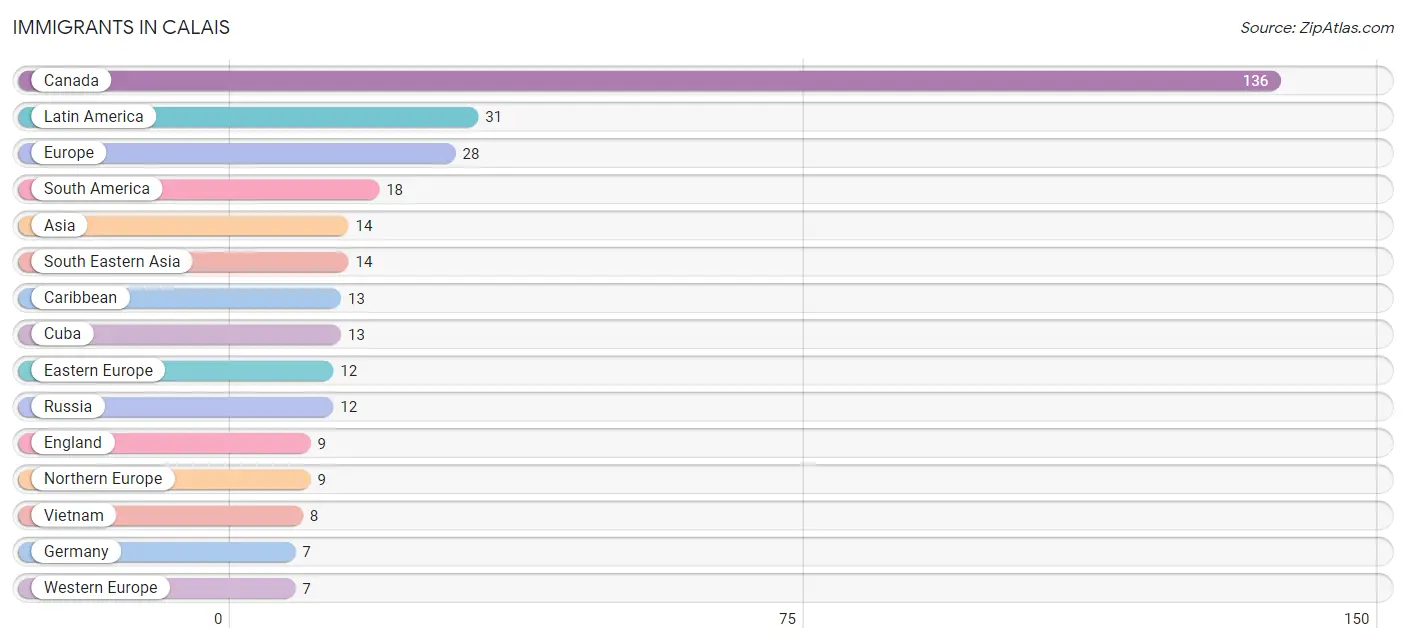
| Immigration Origin | # Population | % Population |
| Africa | 3 | 0.1% |
| Asia | 14 | 0.4% |
| Canada | 136 | 4.4% |
| Caribbean | 13 | 0.4% |
| Cuba | 13 | 0.4% |
| Eastern Africa | 3 | 0.1% |
| Eastern Europe | 12 | 0.4% |
| England | 9 | 0.3% |
| Europe | 28 | 0.9% |
| Germany | 7 | 0.2% |
| Latin America | 31 | 1.0% |
| Northern Europe | 9 | 0.3% |
| Philippines | 6 | 0.2% |
| Russia | 12 | 0.4% |
| Somalia | 3 | 0.1% |
| South America | 18 | 0.6% |
| South Eastern Asia | 14 | 0.4% |
| Vietnam | 8 | 0.3% |
| Western Europe | 7 | 0.2% | View All 19 Rows |
Sex and Age in Calais
Sex and Age in Calais
The most populous age groups in Calais are 25 to 29 Years (144 | 9.8%) for men and 60 to 64 Years (160 | 10.0%) for women.
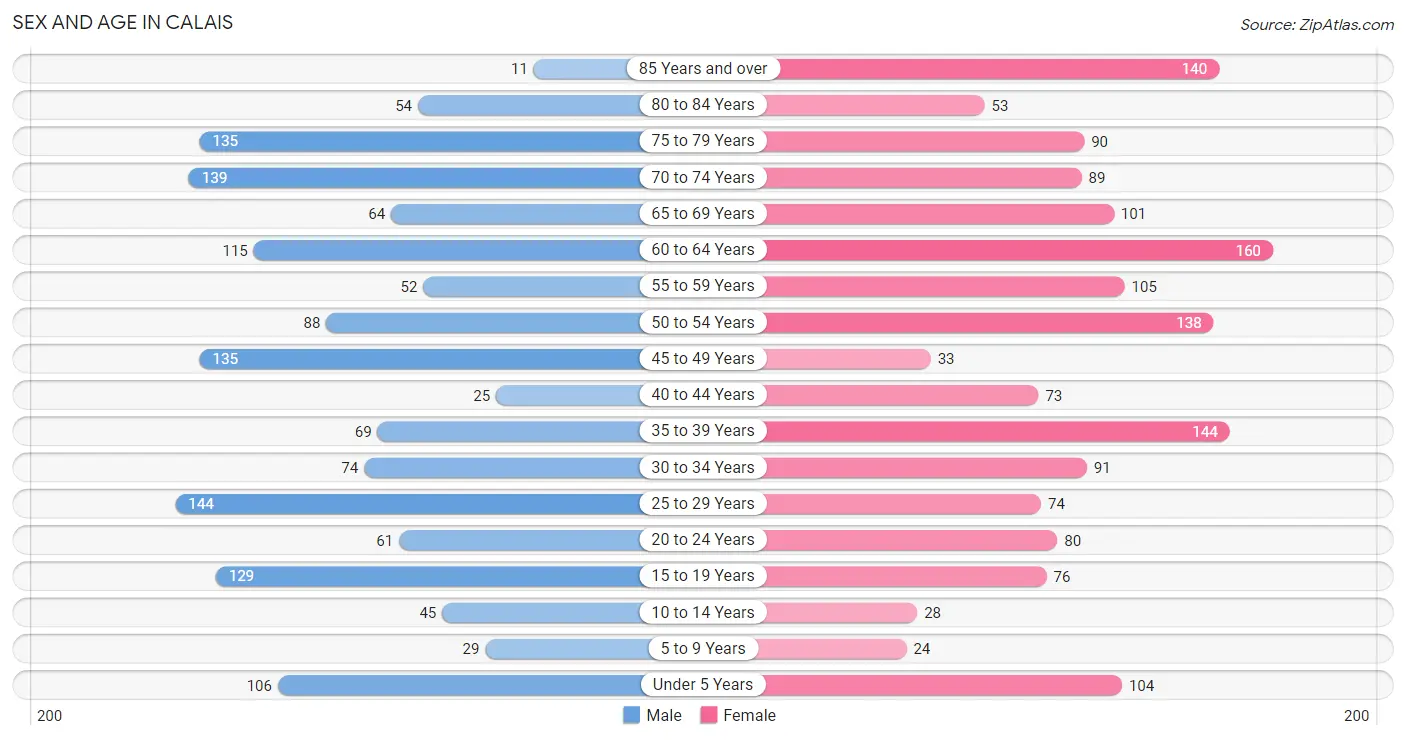
| Age Bracket | Male | Female |
| Under 5 Years | 106 (7.2%) | 104 (6.5%) |
| 5 to 9 Years | 29 (2.0%) | 24 (1.5%) |
| 10 to 14 Years | 45 (3.0%) | 28 (1.8%) |
| 15 to 19 Years | 129 (8.7%) | 76 (4.7%) |
| 20 to 24 Years | 61 (4.1%) | 80 (5.0%) |
| 25 to 29 Years | 144 (9.8%) | 74 (4.6%) |
| 30 to 34 Years | 74 (5.0%) | 91 (5.7%) |
| 35 to 39 Years | 69 (4.7%) | 144 (9.0%) |
| 40 to 44 Years | 25 (1.7%) | 73 (4.5%) |
| 45 to 49 Years | 135 (9.1%) | 33 (2.1%) |
| 50 to 54 Years | 88 (6.0%) | 138 (8.6%) |
| 55 to 59 Years | 52 (3.5%) | 105 (6.6%) |
| 60 to 64 Years | 115 (7.8%) | 160 (10.0%) |
| 65 to 69 Years | 64 (4.3%) | 101 (6.3%) |
| 70 to 74 Years | 139 (9.4%) | 89 (5.6%) |
| 75 to 79 Years | 135 (9.1%) | 90 (5.6%) |
| 80 to 84 Years | 54 (3.7%) | 53 (3.3%) |
| 85 Years and over | 11 (0.7%) | 140 (8.7%) |
| Total | 1,475 (100.0%) | 1,603 (100.0%) |
Families and Households in Calais
Median Family Size in Calais
The median family size in Calais is 2.36 persons per family, with single female/mother families (147 | 16.5%) accounting for the largest median family size of 2.66 persons per family. On the other hand, single male/father families (122 | 13.7%) represent the smallest median family size with 1.94 persons per family.

| Family Type | # Families | Family Size |
| Married-Couple | 621 (69.8%) | 2.37 |
| Single Male/Father | 122 (13.7%) | 1.94 |
| Single Female/Mother | 147 (16.5%) | 2.66 |
| Total Families | 890 (100.0%) | 2.36 |
Median Household Size in Calais
The median household size in Calais is 1.84 persons per household, with single female/mother households (147 | 9.2%) accounting for the largest median household size of 3.12 persons per household. non-family households (705 | 44.2%) represent the smallest median household size with 1.05 persons per household.
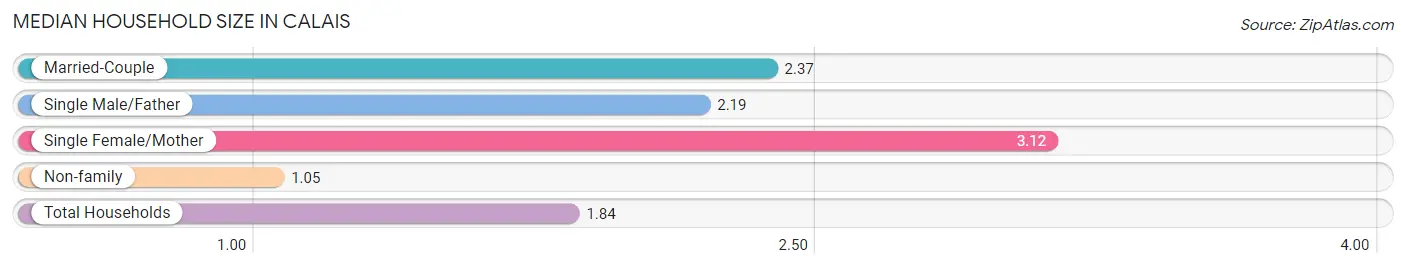
| Household Type | # Households | Household Size |
| Married-Couple | 621 (38.9%) | 2.37 |
| Single Male/Father | 122 (7.6%) | 2.19 |
| Single Female/Mother | 147 (9.2%) | 3.12 |
| Non-family | 705 (44.2%) | 1.05 |
| Total Households | 1,595 (100.0%) | 1.84 |
Household Size by Marriage Status in Calais
Out of a total of 1,595 households in Calais, 890 (55.8%) are family households, while 705 (44.2%) are nonfamily households. The most numerous type of family households are 2-person households, comprising 571, and the most common type of nonfamily households are 1-person households, comprising 671.
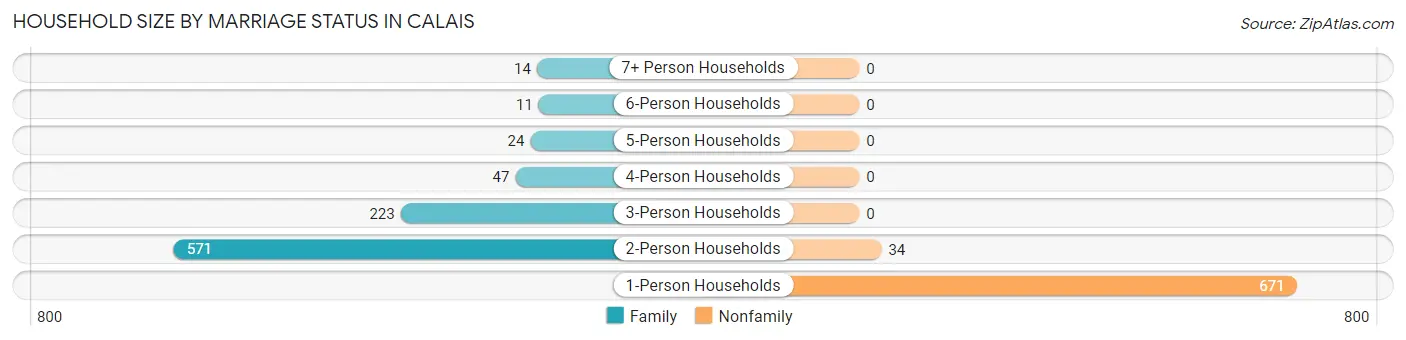
| Household Size | Family Households | Nonfamily Households |
| 1-Person Households | - | 671 (42.1%) |
| 2-Person Households | 571 (35.8%) | 34 (2.1%) |
| 3-Person Households | 223 (14.0%) | 0 (0.0%) |
| 4-Person Households | 47 (2.9%) | 0 (0.0%) |
| 5-Person Households | 24 (1.5%) | 0 (0.0%) |
| 6-Person Households | 11 (0.7%) | 0 (0.0%) |
| 7+ Person Households | 14 (0.9%) | 0 (0.0%) |
| Total | 890 (55.8%) | 705 (44.2%) |
Female Fertility in Calais
Fertility by Age in Calais
Average fertility rate in Calais is 95.0 births per 1,000 women. Women in the age bracket of 20 to 34 years have the highest fertility rate with 249.0 births per 1,000 women. Women in the age bracket of 20 to 34 years acount for 100.0% of all women with births.
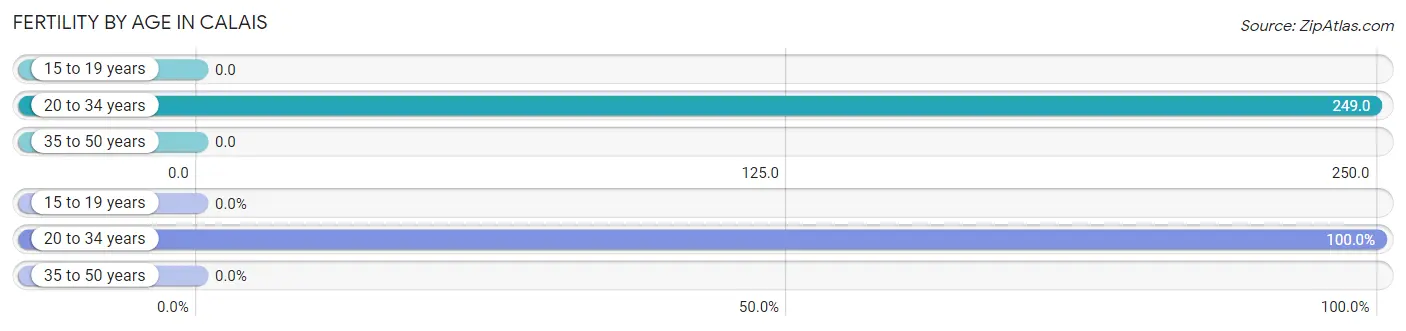
| Age Bracket | Women with Births | Births / 1,000 Women |
| 15 to 19 years | 0 (0.0%) | 0.0 |
| 20 to 34 years | 61 (100.0%) | 249.0 |
| 35 to 50 years | 0 (0.0%) | 0.0 |
| Total | 61 (100.0%) | 95.0 |
Fertility by Age by Marriage Status in Calais
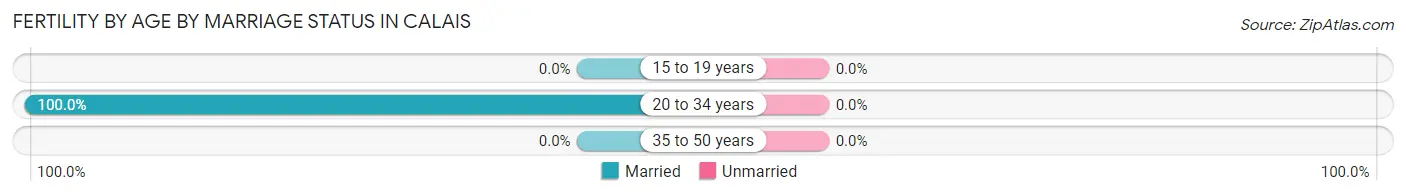
| Age Bracket | Married | Unmarried |
| 15 to 19 years | 0 (0.0%) | 0 (0.0%) |
| 20 to 34 years | 61 (100.0%) | 0 (0.0%) |
| 35 to 50 years | 0 (0.0%) | 0 (0.0%) |
| Total | 61 (100.0%) | 0 (0.0%) |
Fertility by Education in Calais
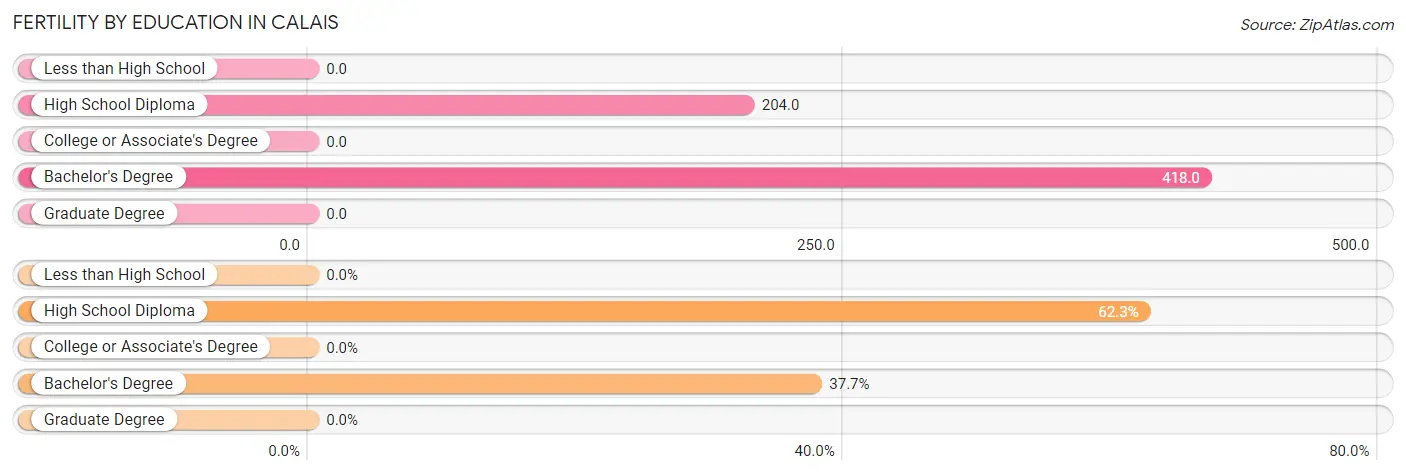
| Educational Attainment | Women with Births | Births / 1,000 Women |
| Less than High School | 0 (0.0%) | 0.0 |
| High School Diploma | 38 (62.3%) | 204.0 |
| College or Associate's Degree | 0 (0.0%) | 0.0 |
| Bachelor's Degree | 23 (37.7%) | 418.0 |
| Graduate Degree | 0 (0.0%) | 0.0 |
| Total | 61 (100.0%) | 95.0 |
Fertility by Education by Marriage Status in Calais
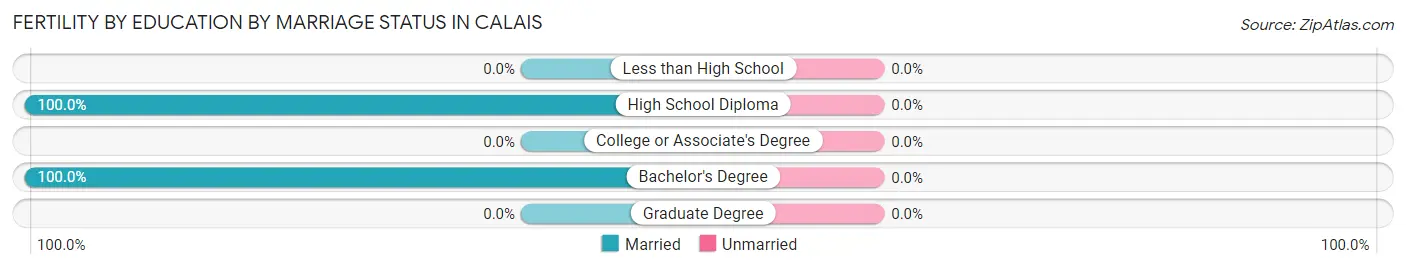
| Educational Attainment | Married | Unmarried |
| Less than High School | 0 (0.0%) | 0 (0.0%) |
| High School Diploma | 38 (100.0%) | 0 (0.0%) |
| College or Associate's Degree | 0 (0.0%) | 0 (0.0%) |
| Bachelor's Degree | 23 (100.0%) | 0 (0.0%) |
| Graduate Degree | 0 (0.0%) | 0 (0.0%) |
| Total | 61 (100.0%) | 0 (0.0%) |
Employment Characteristics in Calais
Employment by Class of Employer in Calais
Among the 1,284 employed individuals in Calais, private company employees (776 | 60.4%), not-for-profit organizations (201 | 15.7%), and federal government employees (138 | 10.7%) make up the most common classes of employment.
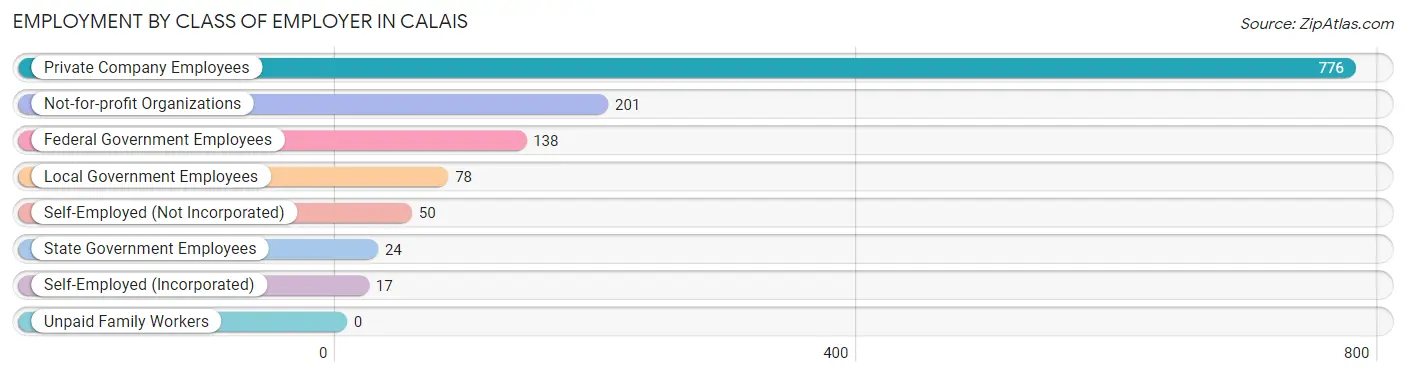
| Employer Class | # Employees | % Employees |
| Private Company Employees | 776 | 60.4% |
| Self-Employed (Incorporated) | 17 | 1.3% |
| Self-Employed (Not Incorporated) | 50 | 3.9% |
| Not-for-profit Organizations | 201 | 15.7% |
| Local Government Employees | 78 | 6.1% |
| State Government Employees | 24 | 1.9% |
| Federal Government Employees | 138 | 10.7% |
| Unpaid Family Workers | 0 | 0.0% |
| Total | 1,284 | 100.0% |
Employment Status by Age in Calais
According to the labor force statistics for Calais, out of the total population over 16 years of age (2,724), 54.4% or 1,482 individuals are in the labor force, with 9.8% or 145 of them unemployed. The age group with the highest labor force participation rate is 35 to 44 years, with 93.6% or 291 individuals in the labor force. Within the labor force, the 75 years and over age range has the highest percentage of unemployed individuals, with 82.2% or 37 of them being unemployed.
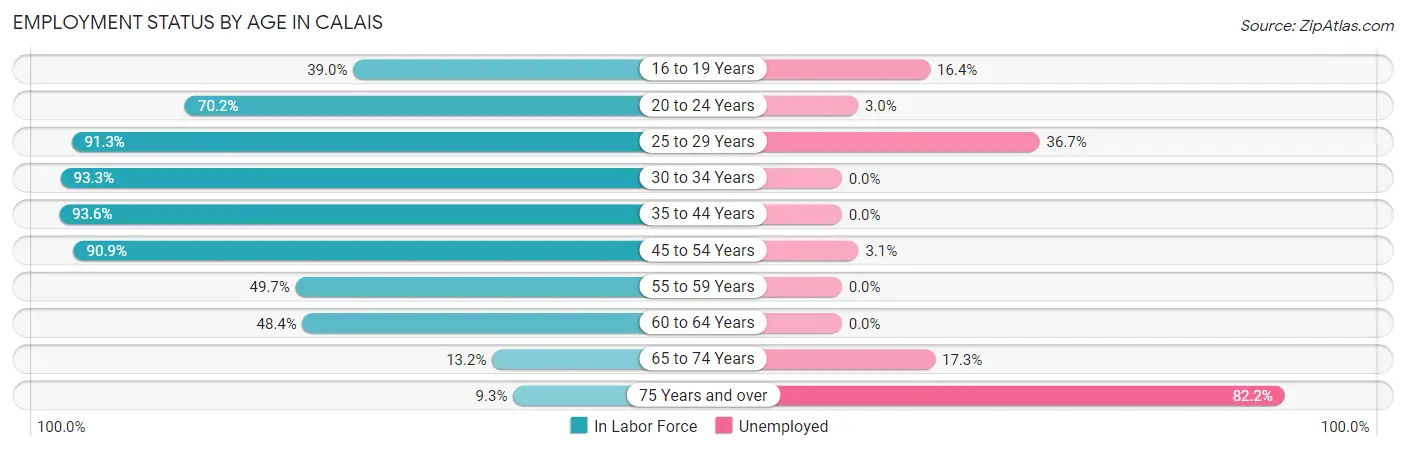
| Age Bracket | In Labor Force | Unemployed |
| 16 to 19 Years | 73 (39.0%) | 12 (16.4%) |
| 20 to 24 Years | 99 (70.2%) | 3 (3.0%) |
| 25 to 29 Years | 199 (91.3%) | 73 (36.7%) |
| 30 to 34 Years | 154 (93.3%) | 0 (0.0%) |
| 35 to 44 Years | 291 (93.6%) | 0 (0.0%) |
| 45 to 54 Years | 358 (90.9%) | 11 (3.1%) |
| 55 to 59 Years | 78 (49.7%) | 0 (0.0%) |
| 60 to 64 Years | 133 (48.4%) | 0 (0.0%) |
| 65 to 74 Years | 52 (13.2%) | 9 (17.3%) |
| 75 Years and over | 45 (9.3%) | 37 (82.2%) |
| Total | 1,482 (54.4%) | 145 (9.8%) |
Employment Status by Educational Attainment in Calais
According to labor force statistics for Calais, 79.8% of individuals (1,213) out of the total population between 25 and 64 years of age (1,520) are in the labor force, with 6.9% or 84 of them being unemployed. The group with the highest labor force participation rate are those with the educational attainment of college / associate degree, with 84.1% or 512 individuals in the labor force. Within the labor force, individuals with college / associate degree education have the highest percentage of unemployment, with 11.9% or 61 of them being unemployed.
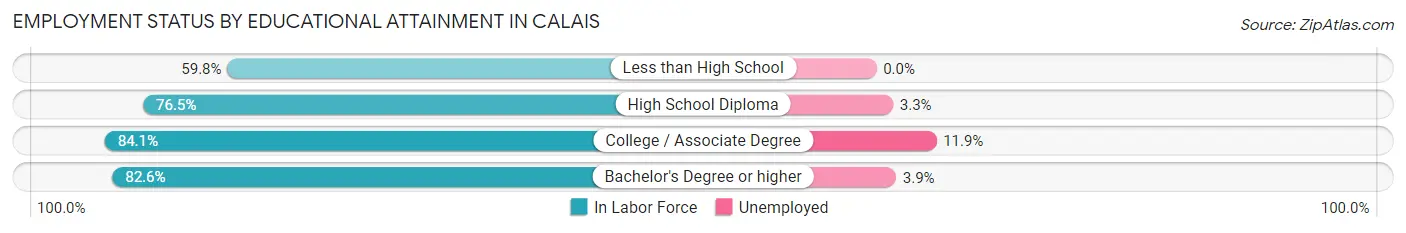
| Educational Attainment | In Labor Force | Unemployed |
| Less than High School | 61 (59.8%) | 0 (0.0%) |
| High School Diploma | 359 (76.5%) | 15 (3.3%) |
| College / Associate Degree | 512 (84.1%) | 72 (11.9%) |
| Bachelor's Degree or higher | 281 (82.6%) | 13 (3.9%) |
| Total | 1,213 (79.8%) | 105 (6.9%) |
Employment Occupations by Sex in Calais
Management, Business, Science and Arts Occupations
The most common Management, Business, Science and Arts occupations in Calais are Community & Social Service (179 | 13.4%), Management (157 | 11.7%), Education, Arts & Media (102 | 7.6%), Business & Financial (78 | 5.8%), and Computers, Engineering & Science (56 | 4.2%).
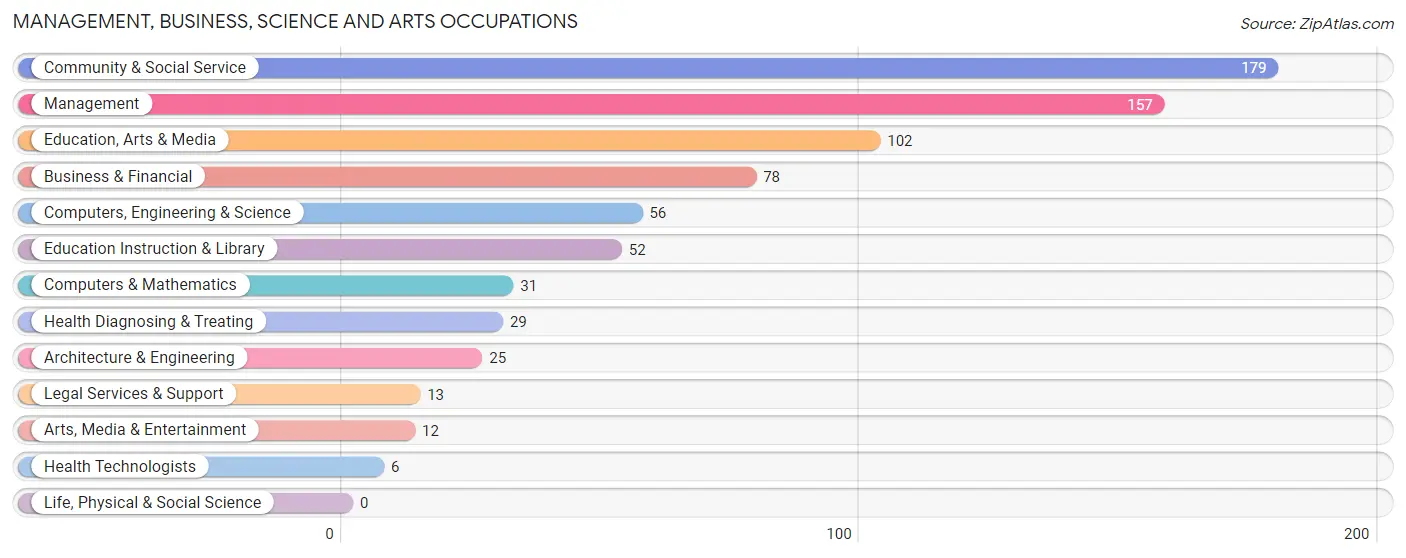
Management, Business, Science and Arts Occupations by Sex
Within the Management, Business, Science and Arts occupations in Calais, the most male-oriented occupations are Architecture & Engineering (100.0%), Legal Services & Support (100.0%), and Computers, Engineering & Science (96.4%), while the most female-oriented occupations are Education Instruction & Library (100.0%), Arts, Media & Entertainment (100.0%), and Health Diagnosing & Treating (100.0%).
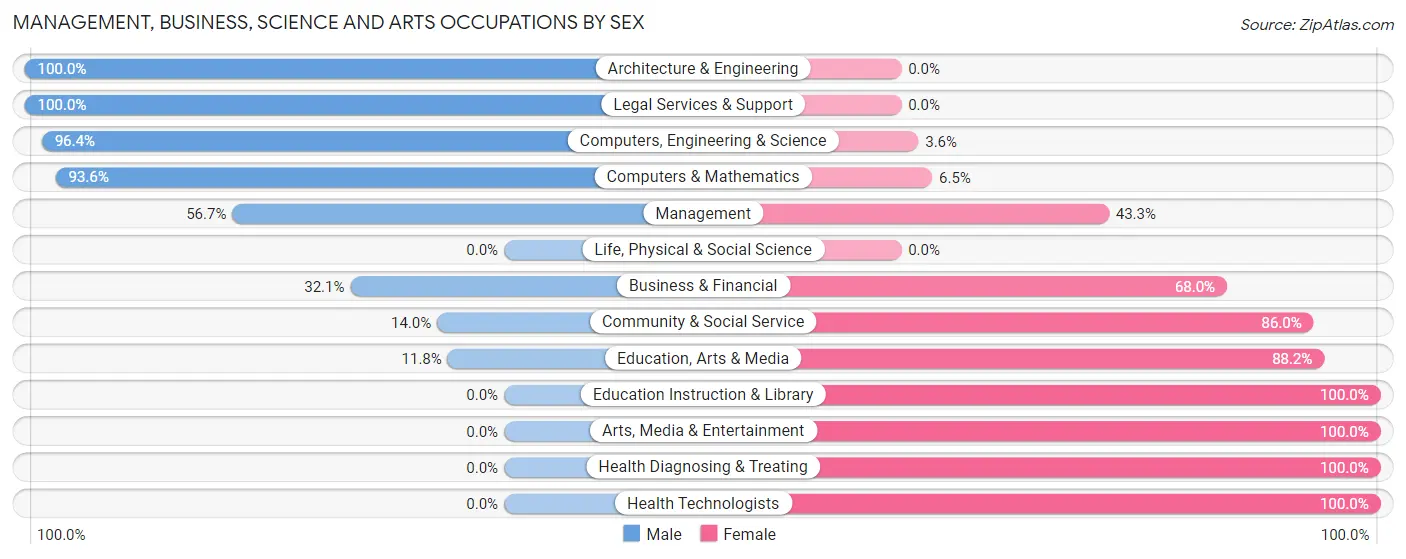
| Occupation | Male | Female |
| Management | 89 (56.7%) | 68 (43.3%) |
| Business & Financial | 25 (32.1%) | 53 (67.9%) |
| Computers, Engineering & Science | 54 (96.4%) | 2 (3.6%) |
| Computers & Mathematics | 29 (93.5%) | 2 (6.5%) |
| Architecture & Engineering | 25 (100.0%) | 0 (0.0%) |
| Life, Physical & Social Science | 0 (0.0%) | 0 (0.0%) |
| Community & Social Service | 25 (14.0%) | 154 (86.0%) |
| Education, Arts & Media | 12 (11.8%) | 90 (88.2%) |
| Legal Services & Support | 13 (100.0%) | 0 (0.0%) |
| Education Instruction & Library | 0 (0.0%) | 52 (100.0%) |
| Arts, Media & Entertainment | 0 (0.0%) | 12 (100.0%) |
| Health Diagnosing & Treating | 0 (0.0%) | 29 (100.0%) |
| Health Technologists | 0 (0.0%) | 6 (100.0%) |
| Total (Category) | 193 (38.7%) | 306 (61.3%) |
| Total (Overall) | 566 (42.3%) | 771 (57.7%) |
Services Occupations
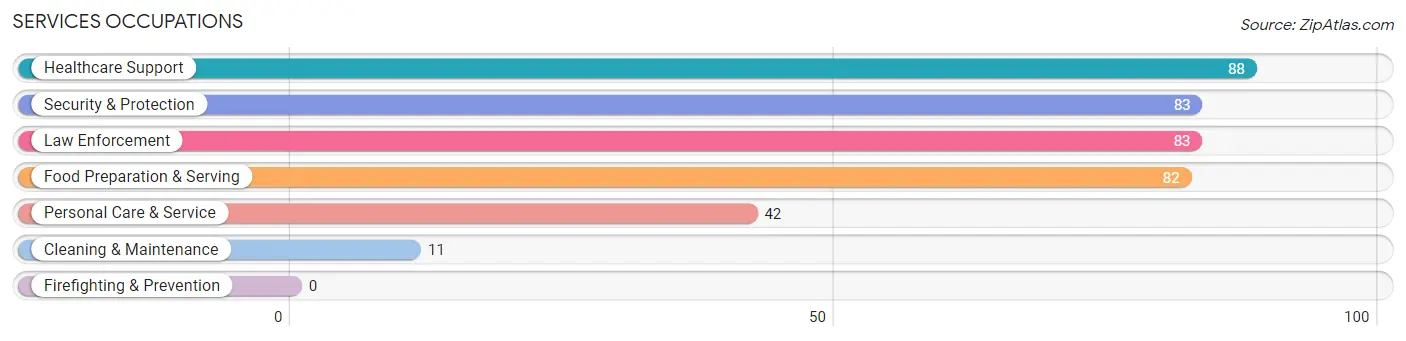
The most common Services occupations in Calais are Healthcare Support (88 | 6.6%), Security & Protection (83 | 6.2%), Law Enforcement (83 | 6.2%), Food Preparation & Serving (82 | 6.1%), and Personal Care & Service (42 | 3.1%).
Services Occupations by Sex
Within the Services occupations in Calais, the most male-oriented occupations are Security & Protection (85.5%), Law Enforcement (85.5%), and Personal Care & Service (61.9%), while the most female-oriented occupations are Healthcare Support (100.0%), Cleaning & Maintenance (100.0%), and Food Preparation & Serving (56.1%).
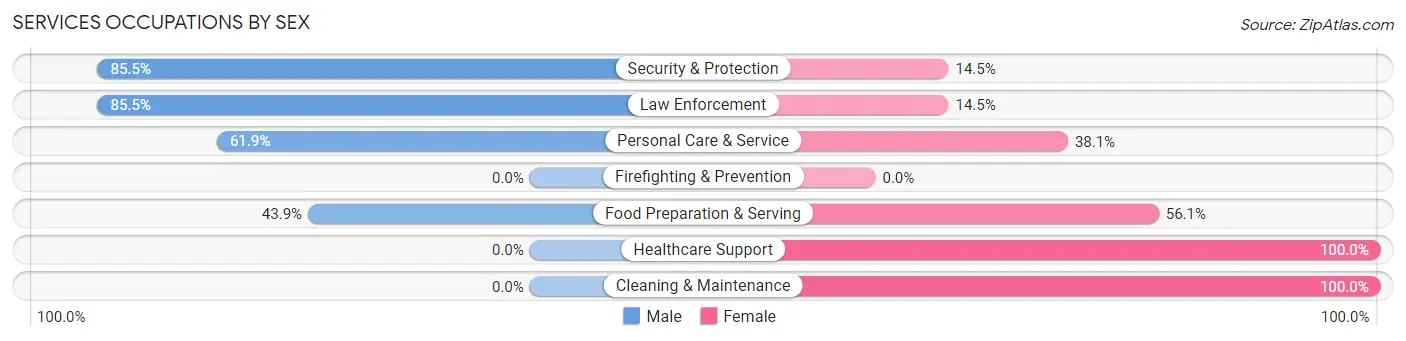
| Occupation | Male | Female |
| Healthcare Support | 0 (0.0%) | 88 (100.0%) |
| Security & Protection | 71 (85.5%) | 12 (14.5%) |
| Firefighting & Prevention | 0 (0.0%) | 0 (0.0%) |
| Law Enforcement | 71 (85.5%) | 12 (14.5%) |
| Food Preparation & Serving | 36 (43.9%) | 46 (56.1%) |
| Cleaning & Maintenance | 0 (0.0%) | 11 (100.0%) |
| Personal Care & Service | 26 (61.9%) | 16 (38.1%) |
| Total (Category) | 133 (43.5%) | 173 (56.5%) |
| Total (Overall) | 566 (42.3%) | 771 (57.7%) |
Sales and Office Occupations
The most common Sales and Office occupations in Calais are Sales & Related (214 | 16.0%), and Office & Administration (127 | 9.5%).

Sales and Office Occupations by Sex

| Occupation | Male | Female |
| Sales & Related | 49 (22.9%) | 165 (77.1%) |
| Office & Administration | 0 (0.0%) | 127 (100.0%) |
| Total (Category) | 49 (14.4%) | 292 (85.6%) |
| Total (Overall) | 566 (42.3%) | 771 (57.7%) |
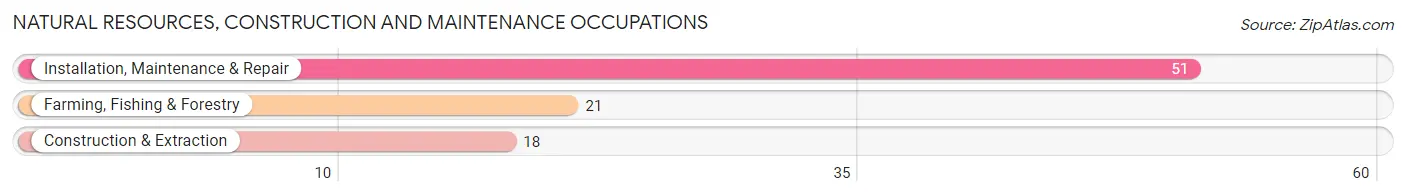
Natural Resources, Construction and Maintenance Occupations
The most common Natural Resources, Construction and Maintenance occupations in Calais are Installation, Maintenance & Repair (51 | 3.8%), Farming, Fishing & Forestry (21 | 1.6%), and Construction & Extraction (18 | 1.3%).
Natural Resources, Construction and Maintenance Occupations by Sex
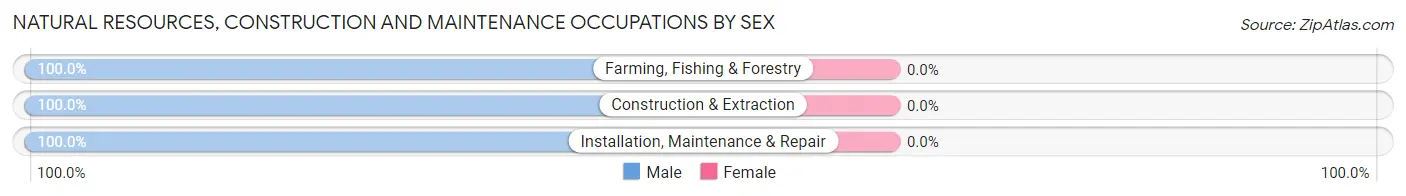
| Occupation | Male | Female |
| Farming, Fishing & Forestry | 21 (100.0%) | 0 (0.0%) |
| Construction & Extraction | 18 (100.0%) | 0 (0.0%) |
| Installation, Maintenance & Repair | 51 (100.0%) | 0 (0.0%) |
| Total (Category) | 90 (100.0%) | 0 (0.0%) |
| Total (Overall) | 566 (42.3%) | 771 (57.7%) |
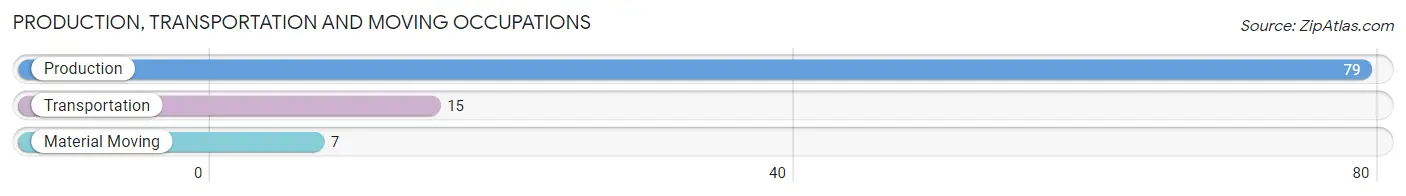
Production, Transportation and Moving Occupations
The most common Production, Transportation and Moving occupations in Calais are Production (79 | 5.9%), Transportation (15 | 1.1%), and Material Moving (7 | 0.5%).
Production, Transportation and Moving Occupations by Sex
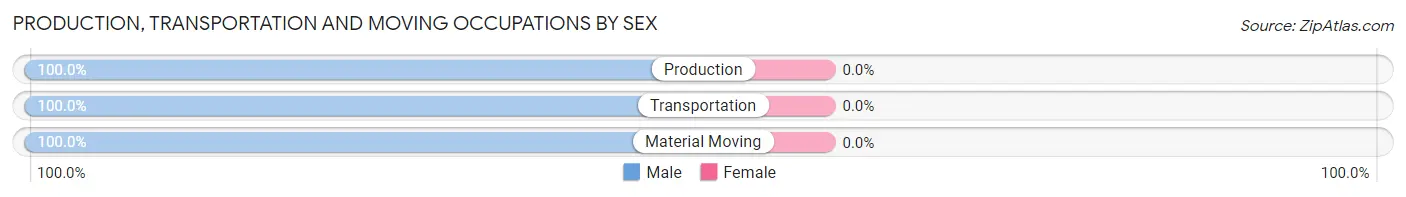
| Occupation | Male | Female |
| Production | 79 (100.0%) | 0 (0.0%) |
| Transportation | 15 (100.0%) | 0 (0.0%) |
| Material Moving | 7 (100.0%) | 0 (0.0%) |
| Total (Category) | 101 (100.0%) | 0 (0.0%) |
| Total (Overall) | 566 (42.3%) | 771 (57.7%) |
Employment Industries by Sex in Calais
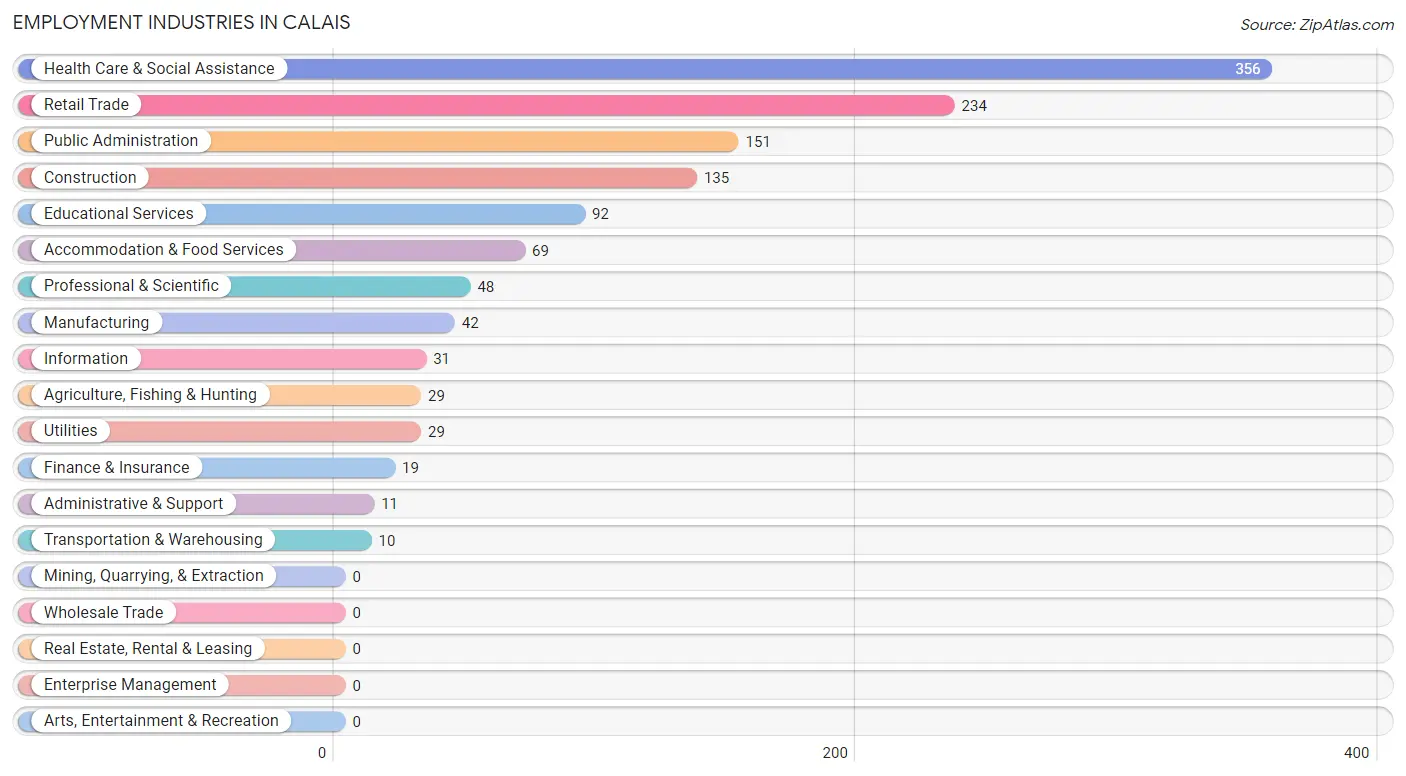
Employment Industries in Calais
The major employment industries in Calais include Health Care & Social Assistance (356 | 26.6%), Retail Trade (234 | 17.5%), Public Administration (151 | 11.3%), Construction (135 | 10.1%), and Educational Services (92 | 6.9%).
Employment Industries by Sex in Calais
The Calais industries that see more men than women are Manufacturing (100.0%), Utilities (100.0%), and Professional & Scientific (100.0%), whereas the industries that tend to have a higher number of women are Transportation & Warehousing (100.0%), Finance & Insurance (100.0%), and Administrative & Support (100.0%).
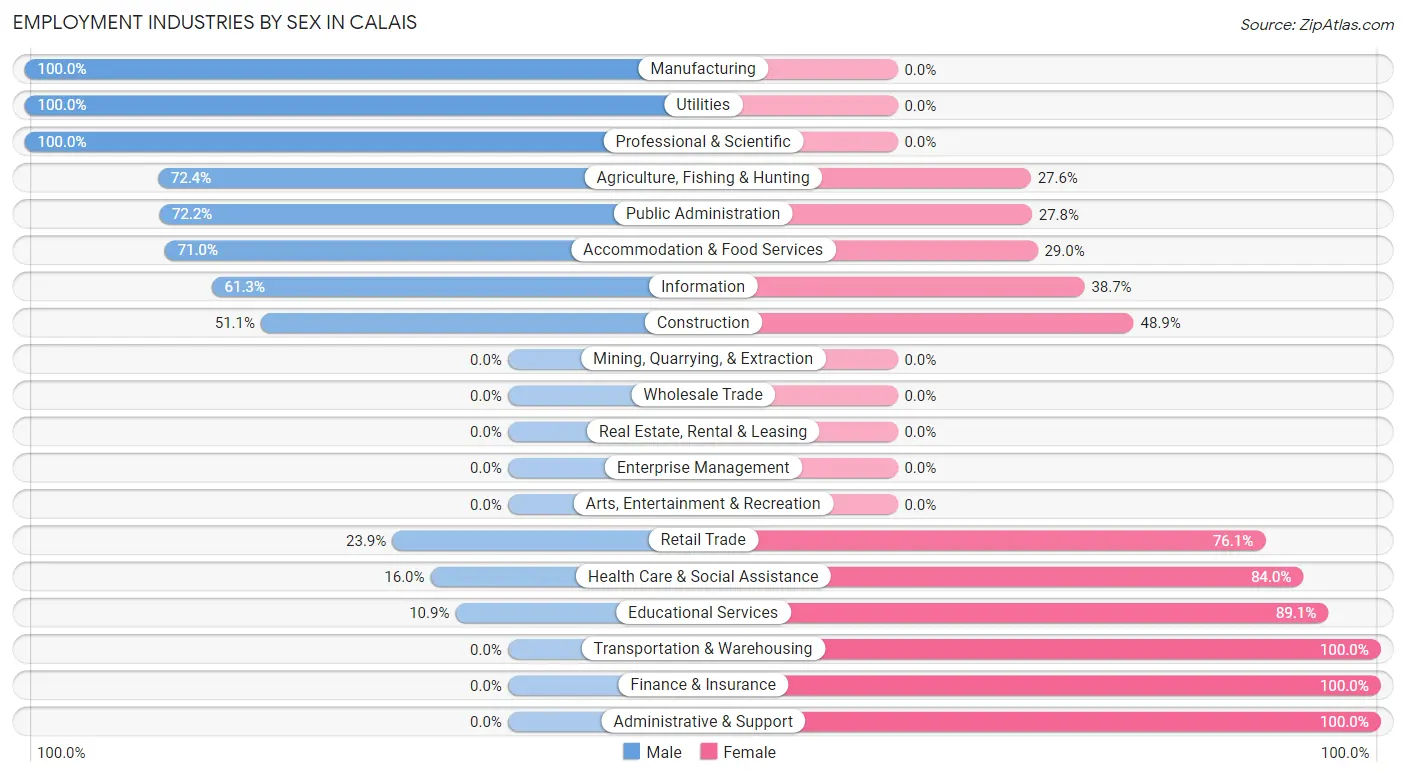
| Industry | Male | Female |
| Agriculture, Fishing & Hunting | 21 (72.4%) | 8 (27.6%) |
| Mining, Quarrying, & Extraction | 0 (0.0%) | 0 (0.0%) |
| Construction | 69 (51.1%) | 66 (48.9%) |
| Manufacturing | 42 (100.0%) | 0 (0.0%) |
| Wholesale Trade | 0 (0.0%) | 0 (0.0%) |
| Retail Trade | 56 (23.9%) | 178 (76.1%) |
| Transportation & Warehousing | 0 (0.0%) | 10 (100.0%) |
| Utilities | 29 (100.0%) | 0 (0.0%) |
| Information | 19 (61.3%) | 12 (38.7%) |
| Finance & Insurance | 0 (0.0%) | 19 (100.0%) |
| Real Estate, Rental & Leasing | 0 (0.0%) | 0 (0.0%) |
| Professional & Scientific | 48 (100.0%) | 0 (0.0%) |
| Enterprise Management | 0 (0.0%) | 0 (0.0%) |
| Administrative & Support | 0 (0.0%) | 11 (100.0%) |
| Educational Services | 10 (10.9%) | 82 (89.1%) |
| Health Care & Social Assistance | 57 (16.0%) | 299 (84.0%) |
| Arts, Entertainment & Recreation | 0 (0.0%) | 0 (0.0%) |
| Accommodation & Food Services | 49 (71.0%) | 20 (29.0%) |
| Public Administration | 109 (72.2%) | 42 (27.8%) |
| Total | 566 (42.3%) | 771 (57.7%) |
Education in Calais
School Enrollment in Calais
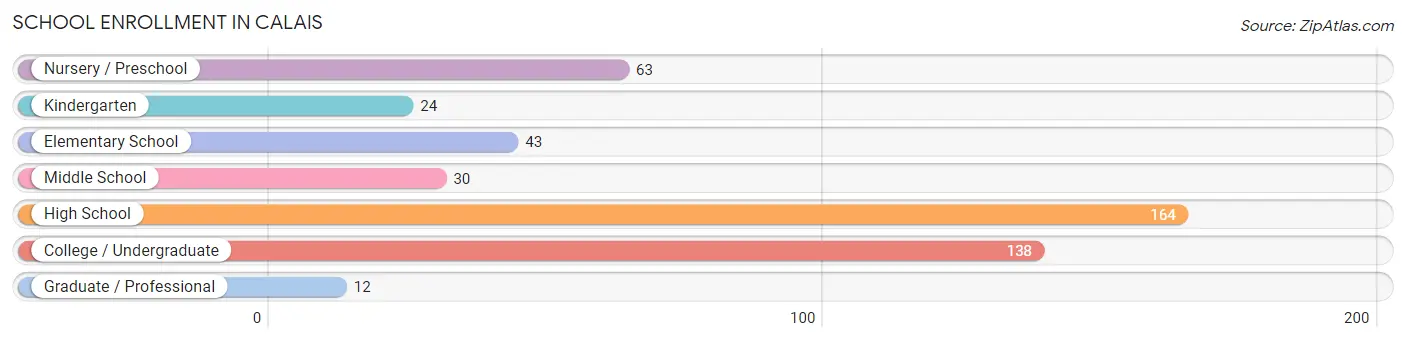
The most common levels of schooling among the 474 students in Calais are high school (164 | 34.6%), college / undergraduate (138 | 29.1%), and nursery / preschool (63 | 13.3%).
| School Level | # Students | % Students |
| Nursery / Preschool | 63 | 13.3% |
| Kindergarten | 24 | 5.1% |
| Elementary School | 43 | 9.1% |
| Middle School | 30 | 6.3% |
| High School | 164 | 34.6% |
| College / Undergraduate | 138 | 29.1% |
| Graduate / Professional | 12 | 2.5% |
| Total | 474 | 100.0% |
School Enrollment by Age by Funding Source in Calais
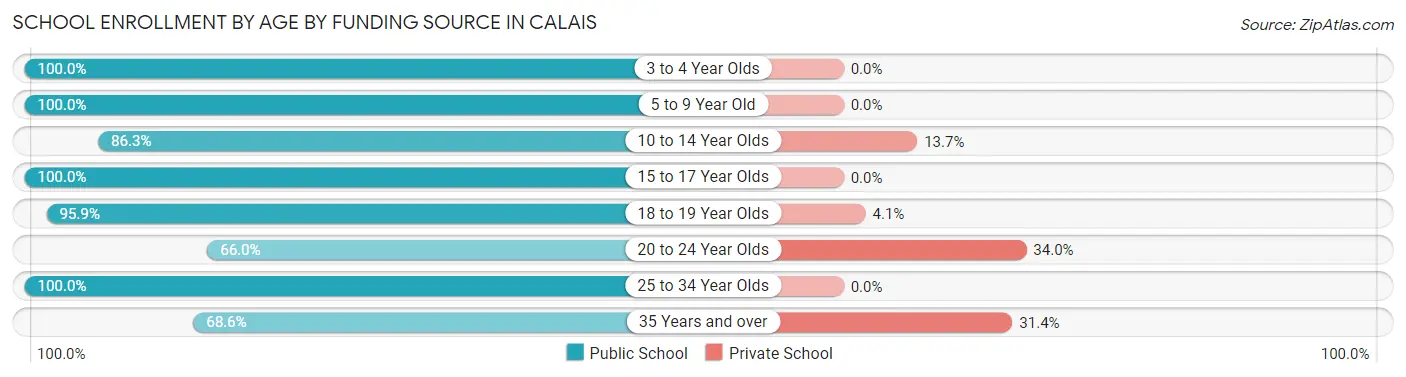
Out of a total of 474 students who are enrolled in schools in Calais, 41 (8.6%) attend a private institution, while the remaining 433 (91.4%) are enrolled in public schools. The age group of 20 to 24 year olds has the highest likelihood of being enrolled in private schools, with 16 (34.0% in the age bracket) enrolled. Conversely, the age group of 3 to 4 year olds has the lowest likelihood of being enrolled in a private school, with 57 (100.0% in the age bracket) attending a public institution.
| Age Bracket | Public School | Private School |
| 3 to 4 Year Olds | 57 (100.0%) | 0 (0.0%) |
| 5 to 9 Year Old | 41 (100.0%) | 0 (0.0%) |
| 10 to 14 Year Olds | 63 (86.3%) | 10 (13.7%) |
| 15 to 17 Year Olds | 100 (100.0%) | 0 (0.0%) |
| 18 to 19 Year Olds | 94 (95.9%) | 4 (4.1%) |
| 20 to 24 Year Olds | 31 (66.0%) | 16 (34.0%) |
| 25 to 34 Year Olds | 23 (100.0%) | 0 (0.0%) |
| 35 Years and over | 24 (68.6%) | 11 (31.4%) |
| Total | 433 (91.4%) | 41 (8.6%) |
Educational Attainment by Field of Study in Calais
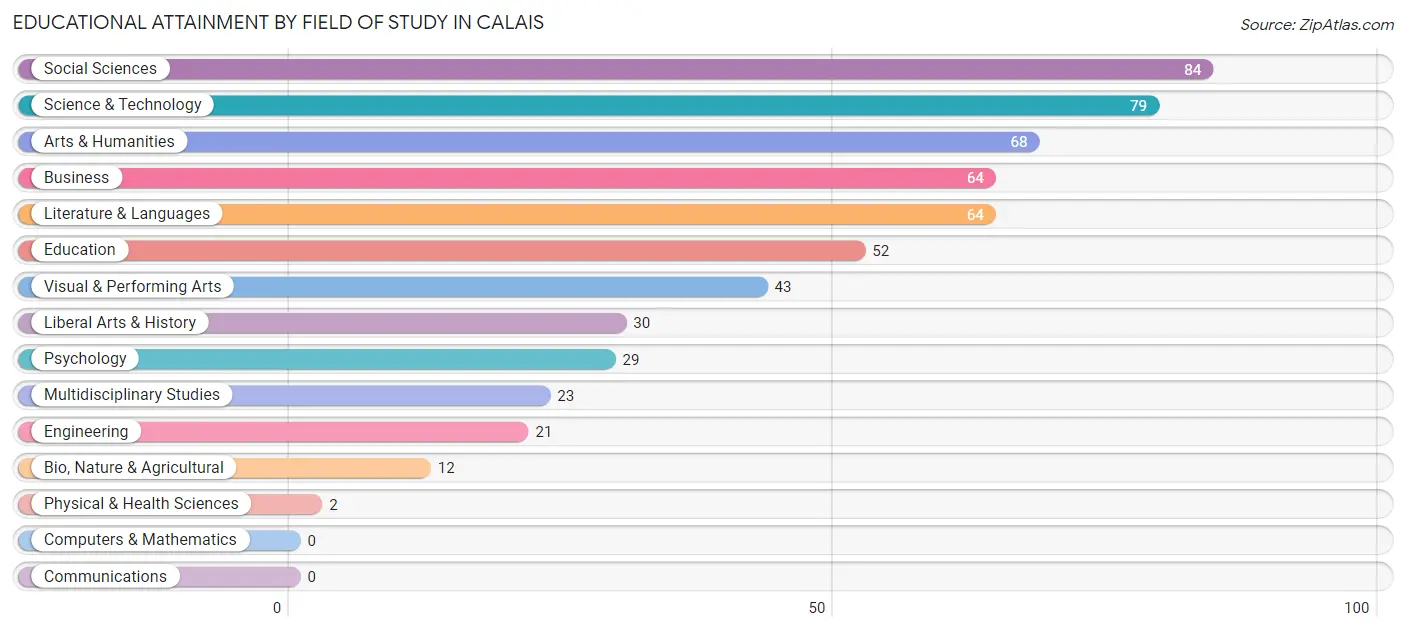
Social sciences (84 | 14.7%), science & technology (79 | 13.8%), arts & humanities (68 | 11.9%), business (64 | 11.2%), and literature & languages (64 | 11.2%) are the most common fields of study among 571 individuals in Calais who have obtained a bachelor's degree or higher.
| Field of Study | # Graduates | % Graduates |
| Computers & Mathematics | 0 | 0.0% |
| Bio, Nature & Agricultural | 12 | 2.1% |
| Physical & Health Sciences | 2 | 0.4% |
| Psychology | 29 | 5.1% |
| Social Sciences | 84 | 14.7% |
| Engineering | 21 | 3.7% |
| Multidisciplinary Studies | 23 | 4.0% |
| Science & Technology | 79 | 13.8% |
| Business | 64 | 11.2% |
| Education | 52 | 9.1% |
| Literature & Languages | 64 | 11.2% |
| Liberal Arts & History | 30 | 5.2% |
| Visual & Performing Arts | 43 | 7.5% |
| Communications | 0 | 0.0% |
| Arts & Humanities | 68 | 11.9% |
| Total | 571 | 100.0% |
Transportation & Commute in Calais
Vehicle Availability by Sex in Calais
The most prevalent vehicle ownership categories in Calais are males with 2 vehicles (286, accounting for 52.5%) and females with 2 vehicles (313, making up 39.8%).
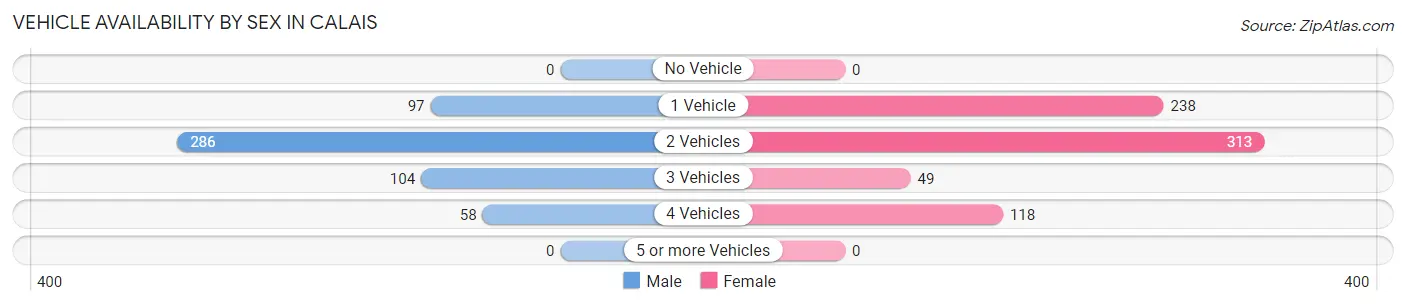
| Vehicles Available | Male | Female |
| No Vehicle | 0 (0.0%) | 0 (0.0%) |
| 1 Vehicle | 97 (17.8%) | 238 (33.2%) |
| 2 Vehicles | 286 (52.5%) | 313 (43.6%) |
| 3 Vehicles | 104 (19.1%) | 49 (6.8%) |
| 4 Vehicles | 58 (10.6%) | 118 (16.4%) |
| 5 or more Vehicles | 0 (0.0%) | 0 (0.0%) |
| Total | 545 (100.0%) | 718 (100.0%) |
Commute Time in Calais
The most frequently occuring commute durations in Calais are less than 5 minutes (303 commuters, 23.9%), 5 to 9 minutes (291 commuters, 23.0%), and 10 to 14 minutes (285 commuters, 22.5%).
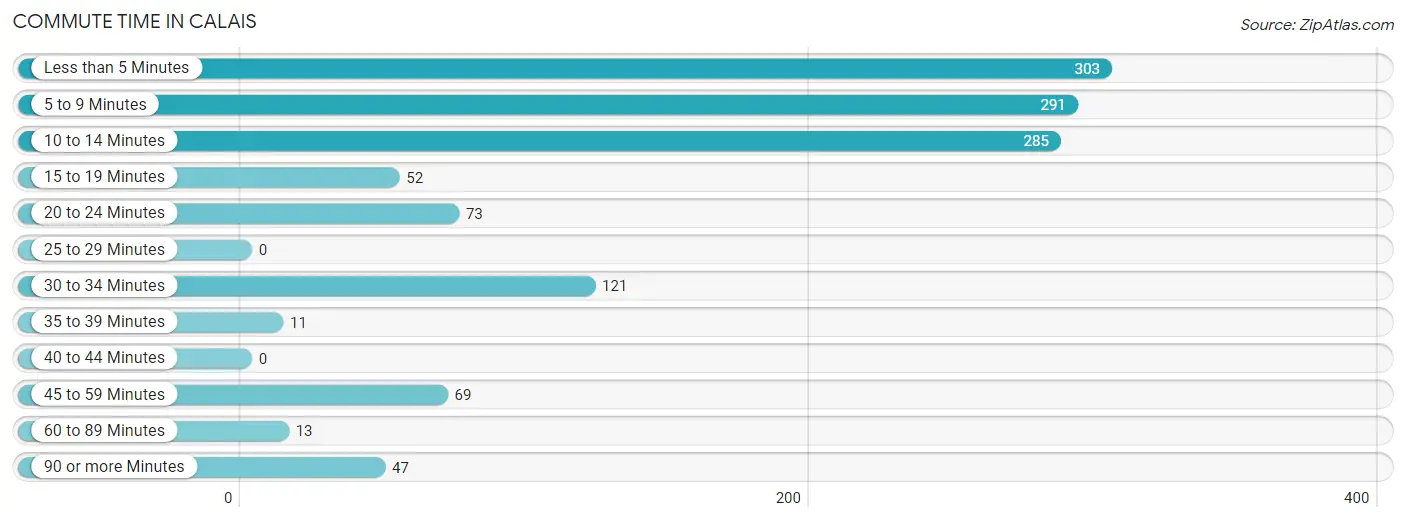
| Commute Time | # Commuters | % Commuters |
| Less than 5 Minutes | 303 | 23.9% |
| 5 to 9 Minutes | 291 | 23.0% |
| 10 to 14 Minutes | 285 | 22.5% |
| 15 to 19 Minutes | 52 | 4.1% |
| 20 to 24 Minutes | 73 | 5.8% |
| 25 to 29 Minutes | 0 | 0.0% |
| 30 to 34 Minutes | 121 | 9.6% |
| 35 to 39 Minutes | 11 | 0.9% |
| 40 to 44 Minutes | 0 | 0.0% |
| 45 to 59 Minutes | 69 | 5.4% |
| 60 to 89 Minutes | 13 | 1.0% |
| 90 or more Minutes | 47 | 3.7% |
Commute Time by Sex in Calais
The most common commute times in Calais are 5 to 9 minutes (154 commuters, 28.1%) for males and less than 5 minutes (217 commuters, 30.3%) for females.
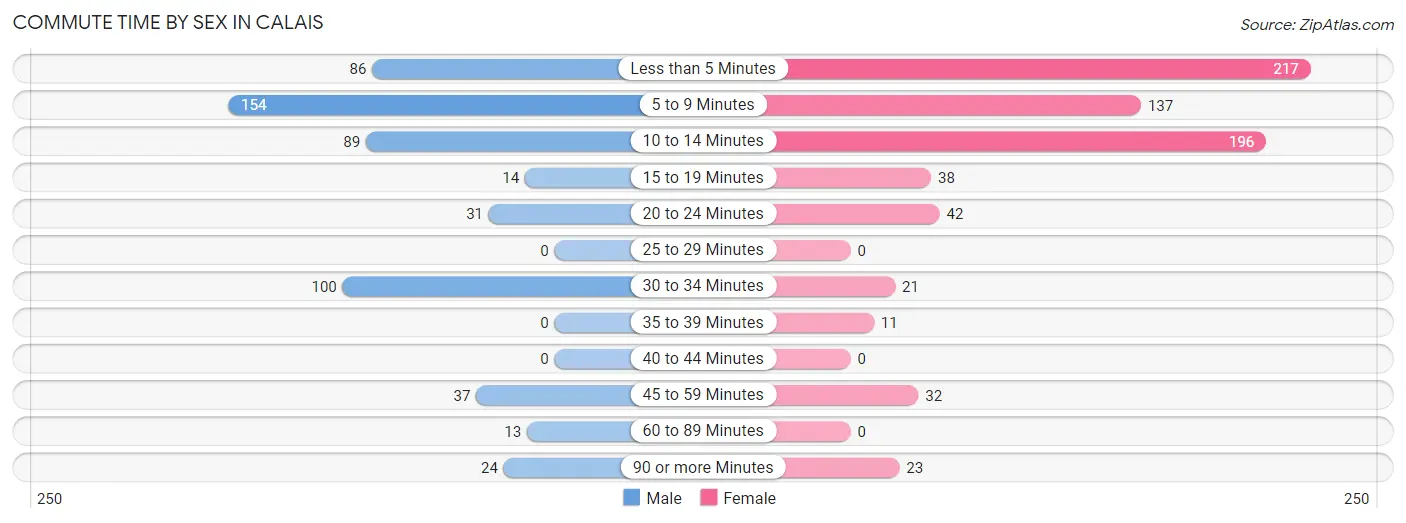
| Commute Time | Male | Female |
| Less than 5 Minutes | 86 (15.7%) | 217 (30.3%) |
| 5 to 9 Minutes | 154 (28.1%) | 137 (19.1%) |
| 10 to 14 Minutes | 89 (16.2%) | 196 (27.3%) |
| 15 to 19 Minutes | 14 (2.5%) | 38 (5.3%) |
| 20 to 24 Minutes | 31 (5.7%) | 42 (5.9%) |
| 25 to 29 Minutes | 0 (0.0%) | 0 (0.0%) |
| 30 to 34 Minutes | 100 (18.2%) | 21 (2.9%) |
| 35 to 39 Minutes | 0 (0.0%) | 11 (1.5%) |
| 40 to 44 Minutes | 0 (0.0%) | 0 (0.0%) |
| 45 to 59 Minutes | 37 (6.8%) | 32 (4.5%) |
| 60 to 89 Minutes | 13 (2.4%) | 0 (0.0%) |
| 90 or more Minutes | 24 (4.4%) | 23 (3.2%) |
Time of Departure to Work by Sex in Calais
The most frequent times of departure to work in Calais are 7:30 AM to 7:59 AM (112, 20.4%) for males and 6:30 AM to 6:59 AM (191, 26.6%) for females.
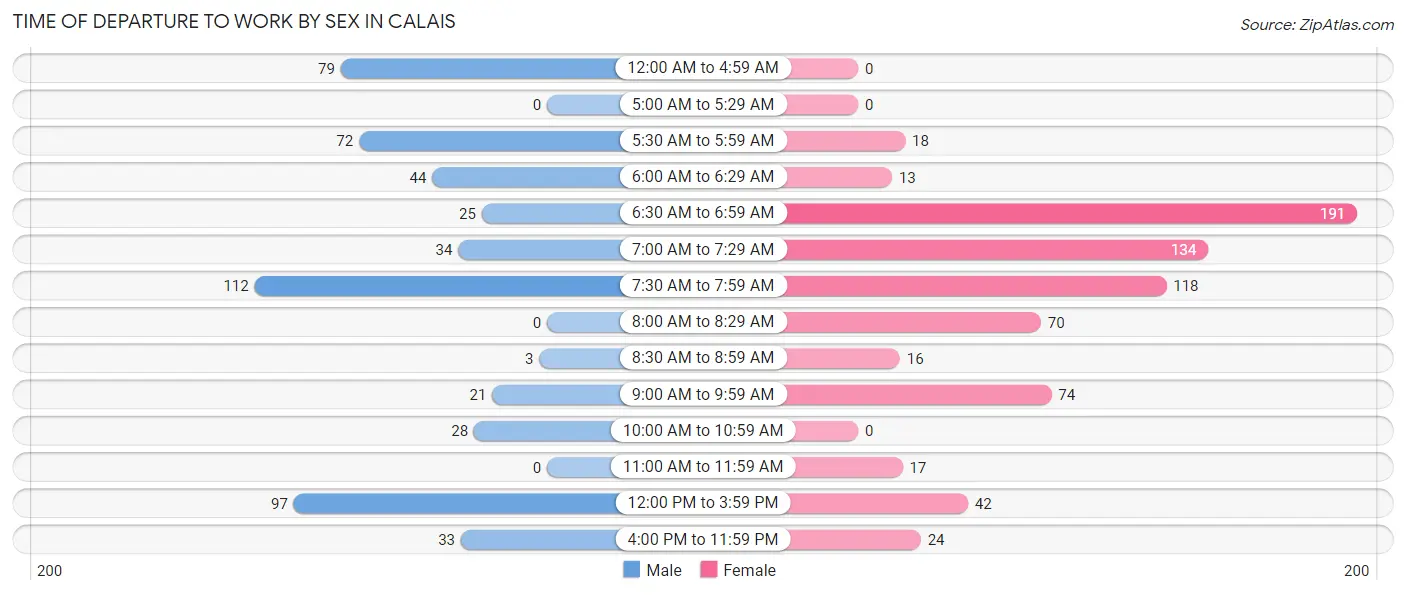
| Time of Departure | Male | Female |
| 12:00 AM to 4:59 AM | 79 (14.4%) | 0 (0.0%) |
| 5:00 AM to 5:29 AM | 0 (0.0%) | 0 (0.0%) |
| 5:30 AM to 5:59 AM | 72 (13.1%) | 18 (2.5%) |
| 6:00 AM to 6:29 AM | 44 (8.0%) | 13 (1.8%) |
| 6:30 AM to 6:59 AM | 25 (4.6%) | 191 (26.6%) |
| 7:00 AM to 7:29 AM | 34 (6.2%) | 134 (18.7%) |
| 7:30 AM to 7:59 AM | 112 (20.4%) | 118 (16.5%) |
| 8:00 AM to 8:29 AM | 0 (0.0%) | 70 (9.8%) |
| 8:30 AM to 8:59 AM | 3 (0.5%) | 16 (2.2%) |
| 9:00 AM to 9:59 AM | 21 (3.8%) | 74 (10.3%) |
| 10:00 AM to 10:59 AM | 28 (5.1%) | 0 (0.0%) |
| 11:00 AM to 11:59 AM | 0 (0.0%) | 17 (2.4%) |
| 12:00 PM to 3:59 PM | 97 (17.7%) | 42 (5.9%) |
| 4:00 PM to 11:59 PM | 33 (6.0%) | 24 (3.4%) |
| Total | 548 (100.0%) | 717 (100.0%) |
Housing Occupancy in Calais
Occupancy by Ownership in Calais
Of the total 1,595 dwellings in Calais, owner-occupied units account for 1,046 (65.6%), while renter-occupied units make up 549 (34.4%).
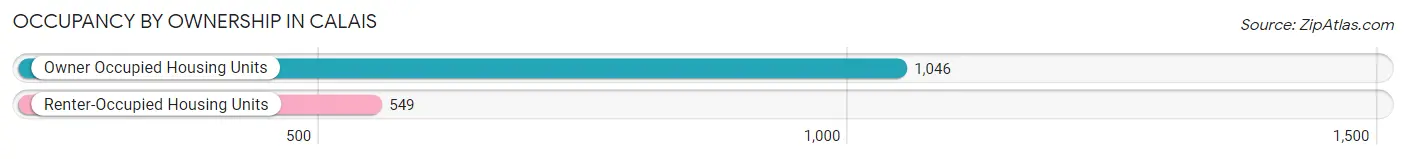
| Occupancy | # Housing Units | % Housing Units |
| Owner Occupied Housing Units | 1,046 | 65.6% |
| Renter-Occupied Housing Units | 549 | 34.4% |
| Total Occupied Housing Units | 1,595 | 100.0% |
Occupancy by Household Size in Calais
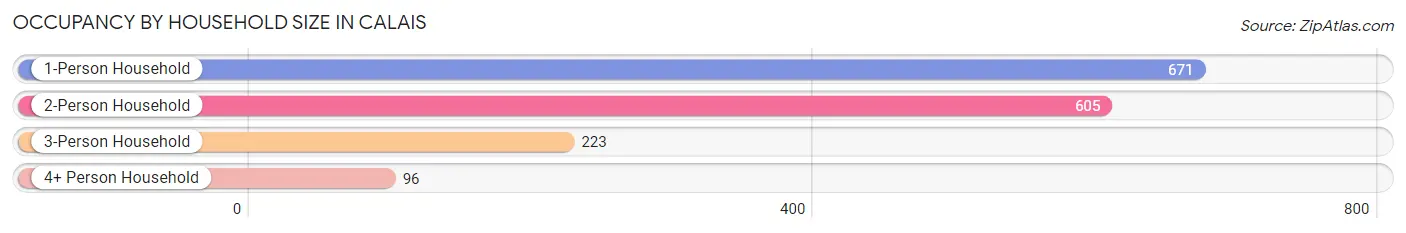
| Household Size | # Housing Units | % Housing Units |
| 1-Person Household | 671 | 42.1% |
| 2-Person Household | 605 | 37.9% |
| 3-Person Household | 223 | 14.0% |
| 4+ Person Household | 96 | 6.0% |
| Total Housing Units | 1,595 | 100.0% |
Occupancy by Ownership by Household Size in Calais
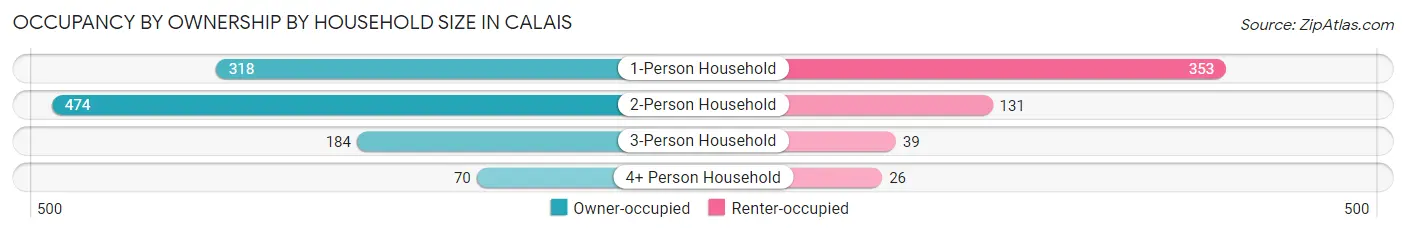
| Household Size | Owner-occupied | Renter-occupied |
| 1-Person Household | 318 (47.4%) | 353 (52.6%) |
| 2-Person Household | 474 (78.3%) | 131 (21.6%) |
| 3-Person Household | 184 (82.5%) | 39 (17.5%) |
| 4+ Person Household | 70 (72.9%) | 26 (27.1%) |
| Total Housing Units | 1,046 (65.6%) | 549 (34.4%) |
Occupancy by Educational Attainment in Calais
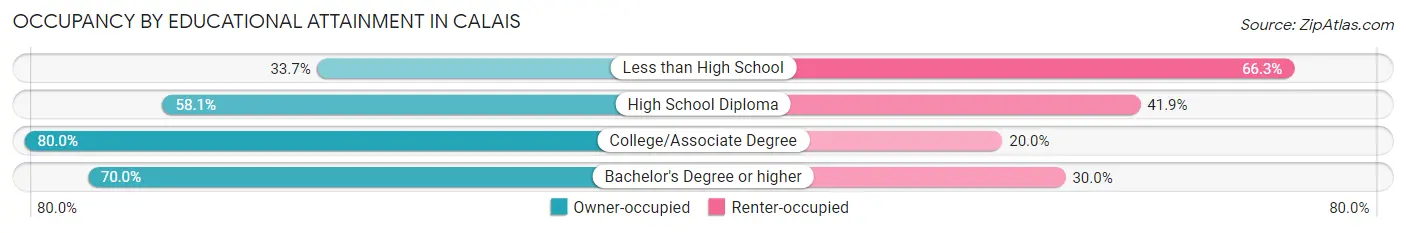
| Household Size | Owner-occupied | Renter-occupied |
| Less than High School | 61 (33.7%) | 120 (66.3%) |
| High School Diploma | 294 (58.1%) | 212 (41.9%) |
| College/Associate Degree | 444 (80.0%) | 111 (20.0%) |
| Bachelor's Degree or higher | 247 (70.0%) | 106 (30.0%) |
Occupancy by Age of Householder in Calais
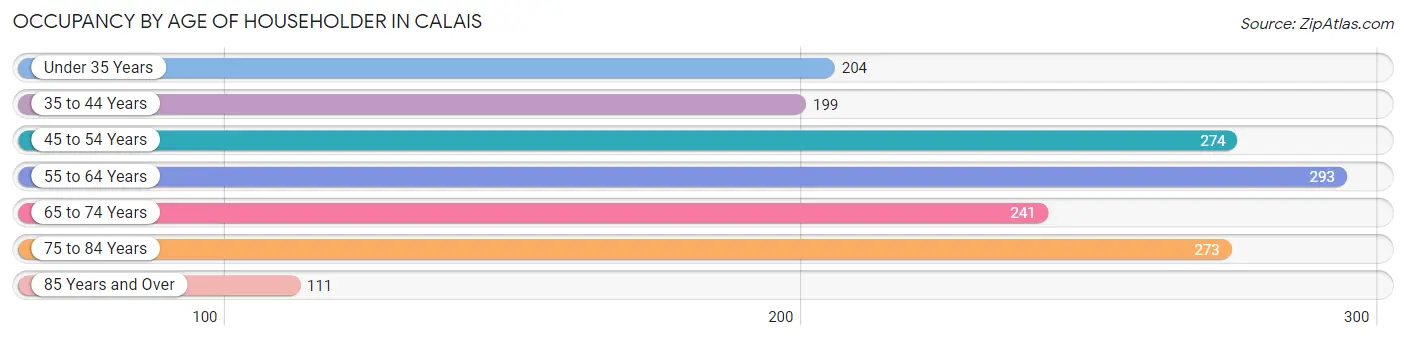
| Age Bracket | # Households | % Households |
| Under 35 Years | 204 | 12.8% |
| 35 to 44 Years | 199 | 12.5% |
| 45 to 54 Years | 274 | 17.2% |
| 55 to 64 Years | 293 | 18.4% |
| 65 to 74 Years | 241 | 15.1% |
| 75 to 84 Years | 273 | 17.1% |
| 85 Years and Over | 111 | 7.0% |
| Total | 1,595 | 100.0% |
Housing Finances in Calais
Median Income by Occupancy in Calais
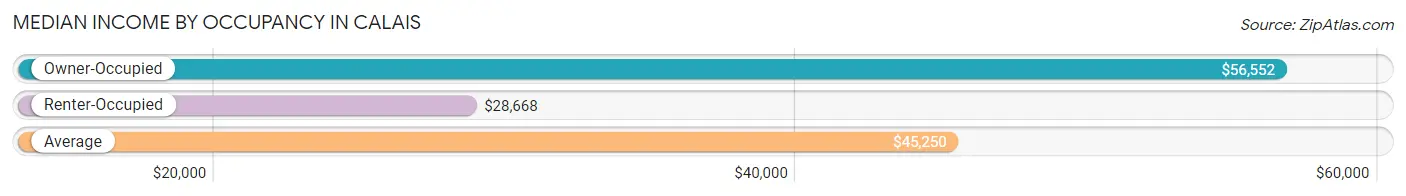
| Occupancy Type | # Households | Median Income |
| Owner-Occupied | 1,046 (65.6%) | $56,552 |
| Renter-Occupied | 549 (34.4%) | $28,668 |
| Average | 1,595 (100.0%) | $45,250 |
Occupancy by Householder Income Bracket in Calais
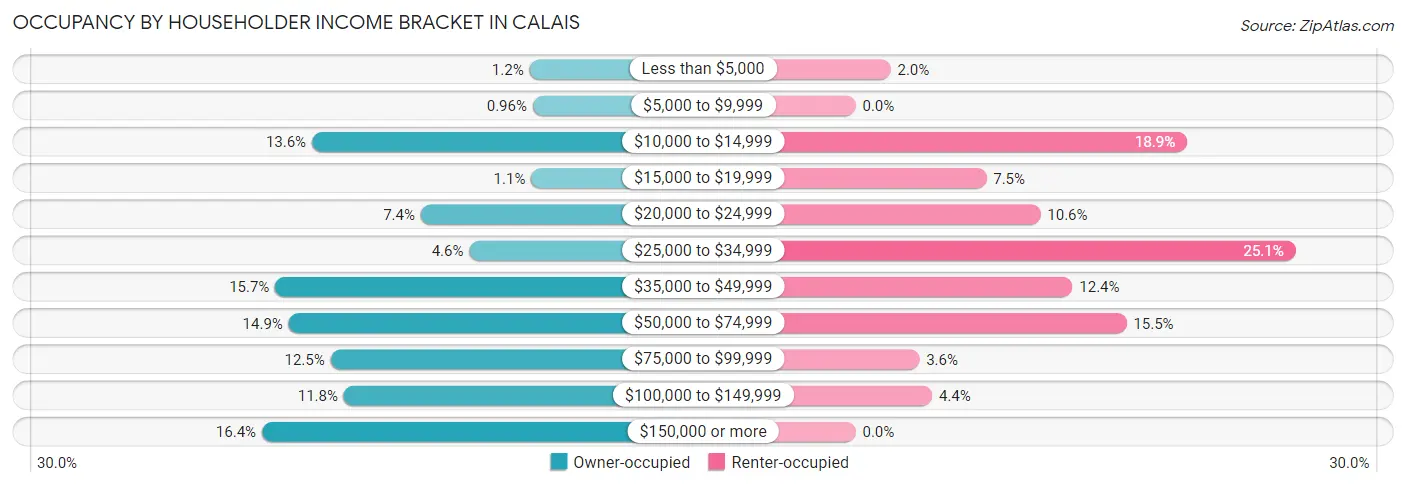
| Income Bracket | Owner-occupied | Renter-occupied |
| Less than $5,000 | 12 (1.1%) | 11 (2.0%) |
| $5,000 to $9,999 | 10 (1.0%) | 0 (0.0%) |
| $10,000 to $14,999 | 142 (13.6%) | 104 (18.9%) |
| $15,000 to $19,999 | 11 (1.1%) | 41 (7.5%) |
| $20,000 to $24,999 | 77 (7.4%) | 58 (10.6%) |
| $25,000 to $34,999 | 48 (4.6%) | 138 (25.1%) |
| $35,000 to $49,999 | 164 (15.7%) | 68 (12.4%) |
| $50,000 to $74,999 | 156 (14.9%) | 85 (15.5%) |
| $75,000 to $99,999 | 131 (12.5%) | 20 (3.6%) |
| $100,000 to $149,999 | 123 (11.8%) | 24 (4.4%) |
| $150,000 or more | 172 (16.4%) | 0 (0.0%) |
| Total | 1,046 (100.0%) | 549 (100.0%) |
Monthly Housing Cost Tiers in Calais
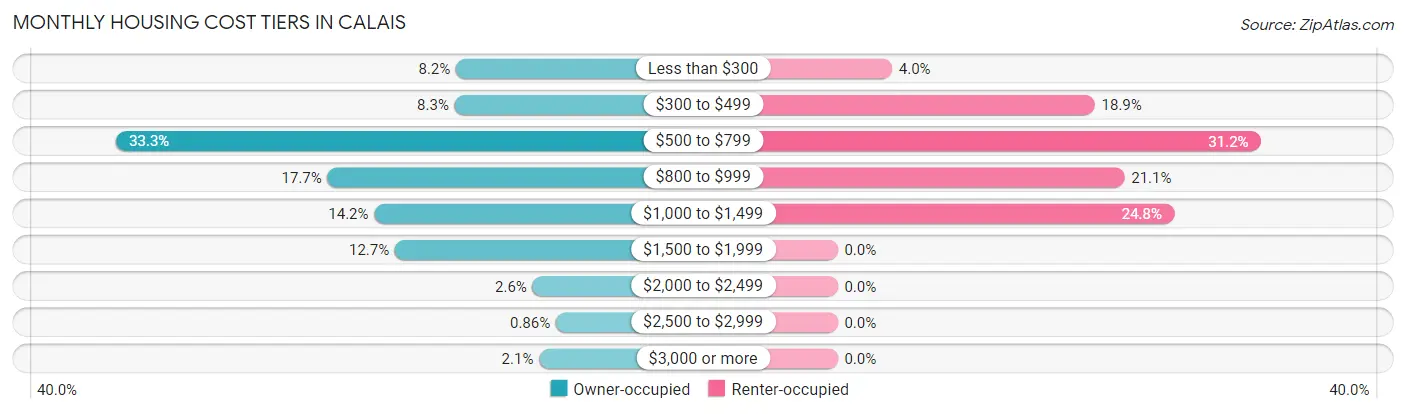
| Monthly Cost | Owner-occupied | Renter-occupied |
| Less than $300 | 86 (8.2%) | 22 (4.0%) |
| $300 to $499 | 87 (8.3%) | 104 (18.9%) |
| $500 to $799 | 348 (33.3%) | 171 (31.1%) |
| $800 to $999 | 185 (17.7%) | 116 (21.1%) |
| $1,000 to $1,499 | 149 (14.2%) | 136 (24.8%) |
| $1,500 to $1,999 | 133 (12.7%) | 0 (0.0%) |
| $2,000 to $2,499 | 27 (2.6%) | 0 (0.0%) |
| $2,500 to $2,999 | 9 (0.9%) | 0 (0.0%) |
| $3,000 or more | 22 (2.1%) | 0 (0.0%) |
| Total | 1,046 (100.0%) | 549 (100.0%) |
Physical Housing Characteristics in Calais
Housing Structures in Calais
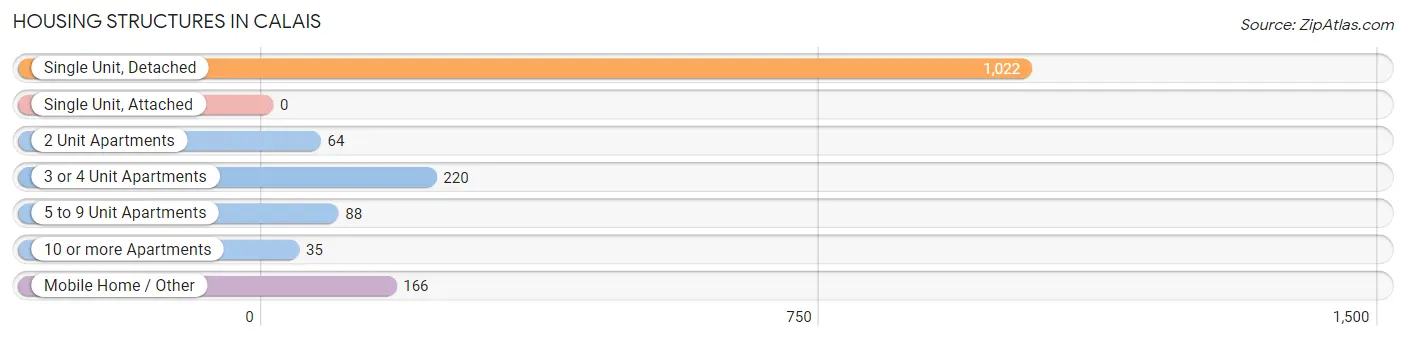
| Structure Type | # Housing Units | % Housing Units |
| Single Unit, Detached | 1,022 | 64.1% |
| Single Unit, Attached | 0 | 0.0% |
| 2 Unit Apartments | 64 | 4.0% |
| 3 or 4 Unit Apartments | 220 | 13.8% |
| 5 to 9 Unit Apartments | 88 | 5.5% |
| 10 or more Apartments | 35 | 2.2% |
| Mobile Home / Other | 166 | 10.4% |
| Total | 1,595 | 100.0% |
Housing Structures by Occupancy in Calais
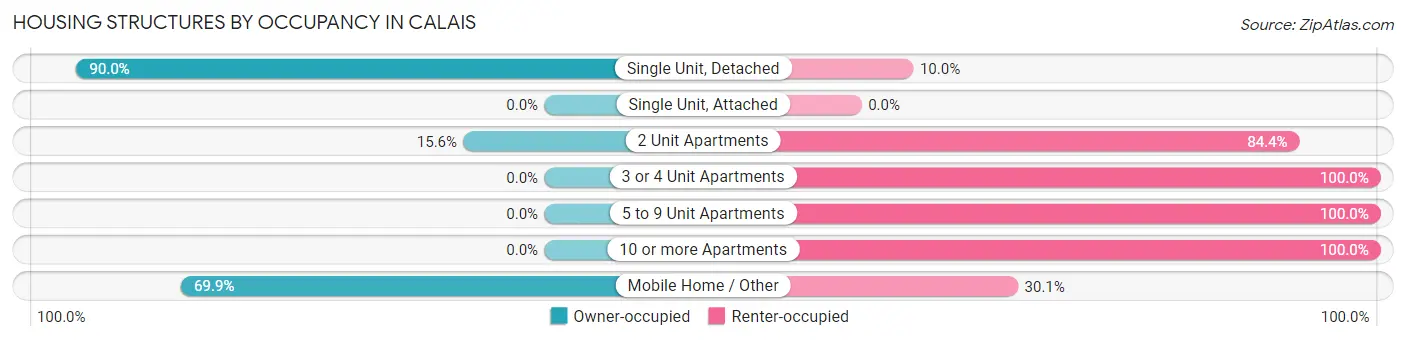
| Structure Type | Owner-occupied | Renter-occupied |
| Single Unit, Detached | 920 (90.0%) | 102 (10.0%) |
| Single Unit, Attached | 0 (0.0%) | 0 (0.0%) |
| 2 Unit Apartments | 10 (15.6%) | 54 (84.4%) |
| 3 or 4 Unit Apartments | 0 (0.0%) | 220 (100.0%) |
| 5 to 9 Unit Apartments | 0 (0.0%) | 88 (100.0%) |
| 10 or more Apartments | 0 (0.0%) | 35 (100.0%) |
| Mobile Home / Other | 116 (69.9%) | 50 (30.1%) |
| Total | 1,046 (65.6%) | 549 (34.4%) |
Housing Structures by Number of Rooms in Calais
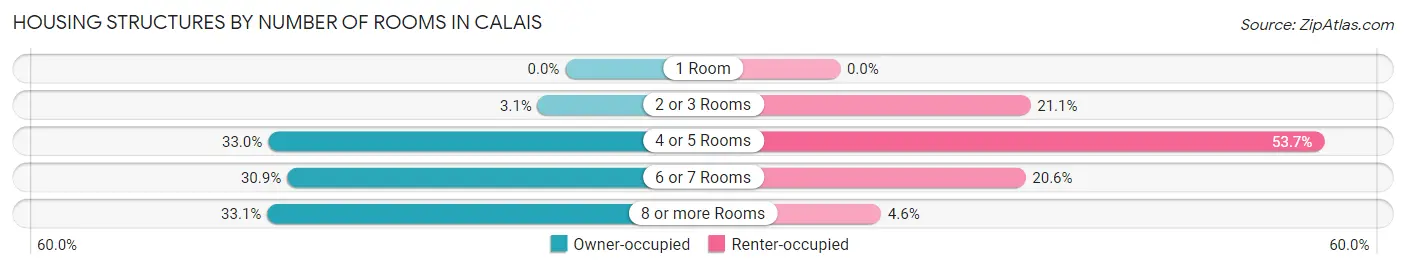
| Number of Rooms | Owner-occupied | Renter-occupied |
| 1 Room | 0 (0.0%) | 0 (0.0%) |
| 2 or 3 Rooms | 32 (3.1%) | 116 (21.1%) |
| 4 or 5 Rooms | 345 (33.0%) | 295 (53.7%) |
| 6 or 7 Rooms | 323 (30.9%) | 113 (20.6%) |
| 8 or more Rooms | 346 (33.1%) | 25 (4.5%) |
| Total | 1,046 (100.0%) | 549 (100.0%) |
Housing Structure by Heating Type in Calais
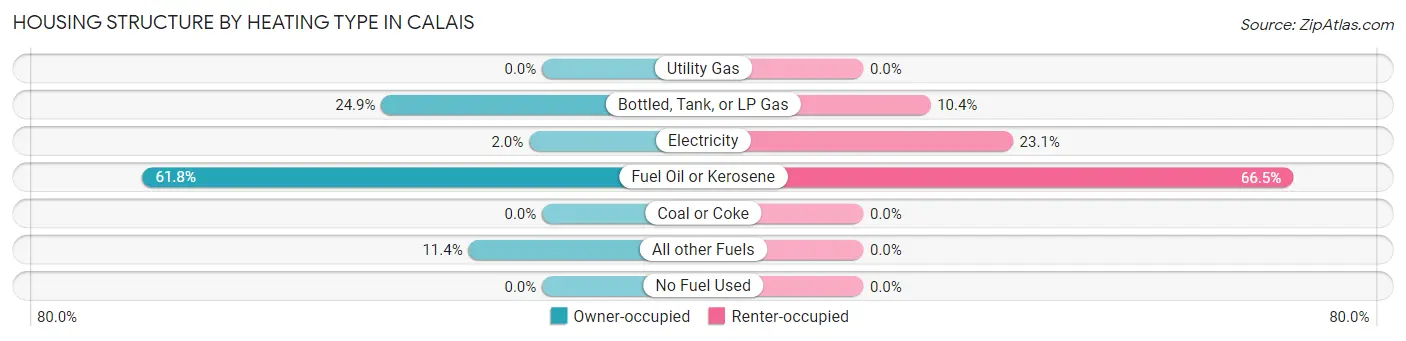
| Heating Type | Owner-occupied | Renter-occupied |
| Utility Gas | 0 (0.0%) | 0 (0.0%) |
| Bottled, Tank, or LP Gas | 260 (24.9%) | 57 (10.4%) |
| Electricity | 21 (2.0%) | 127 (23.1%) |
| Fuel Oil or Kerosene | 646 (61.8%) | 365 (66.5%) |
| Coal or Coke | 0 (0.0%) | 0 (0.0%) |
| All other Fuels | 119 (11.4%) | 0 (0.0%) |
| No Fuel Used | 0 (0.0%) | 0 (0.0%) |
| Total | 1,046 (100.0%) | 549 (100.0%) |
Household Vehicle Usage in Calais
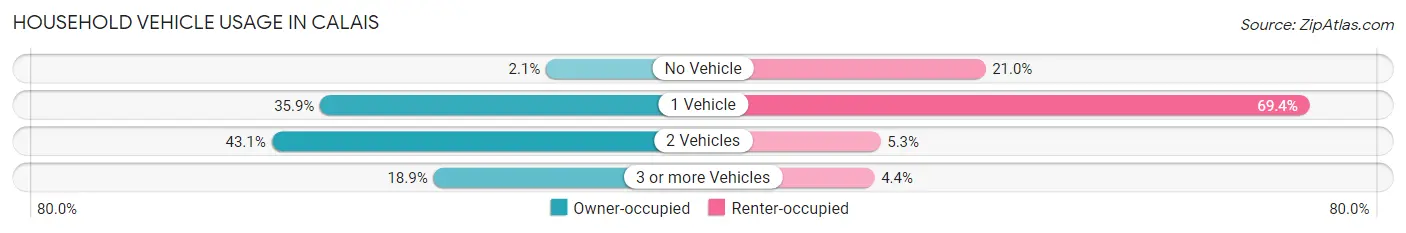
| Vehicles per Household | Owner-occupied | Renter-occupied |
| No Vehicle | 22 (2.1%) | 115 (20.9%) |
| 1 Vehicle | 375 (35.8%) | 381 (69.4%) |
| 2 Vehicles | 451 (43.1%) | 29 (5.3%) |
| 3 or more Vehicles | 198 (18.9%) | 24 (4.4%) |
| Total | 1,046 (100.0%) | 549 (100.0%) |
Real Estate & Mortgages in Calais
Real Estate and Mortgage Overview in Calais
| Characteristic | Without Mortgage | With Mortgage |
| Housing Units | 532 | 514 |
| Median Property Value | $79,700 | $117,800 |
| Median Household Income | $54,833 | $122 |
| Monthly Housing Costs | $616 | $22 |
| Real Estate Taxes | $1,215 | $0 |
Property Value by Mortgage Status in Calais
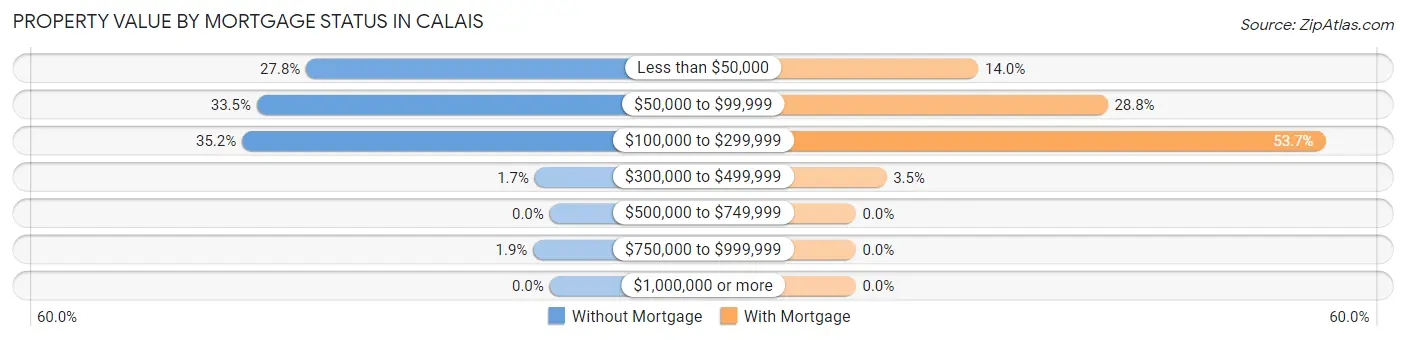
| Property Value | Without Mortgage | With Mortgage |
| Less than $50,000 | 148 (27.8%) | 72 (14.0%) |
| $50,000 to $99,999 | 178 (33.5%) | 148 (28.8%) |
| $100,000 to $299,999 | 187 (35.1%) | 276 (53.7%) |
| $300,000 to $499,999 | 9 (1.7%) | 18 (3.5%) |
| $500,000 to $749,999 | 0 (0.0%) | 0 (0.0%) |
| $750,000 to $999,999 | 10 (1.9%) | 0 (0.0%) |
| $1,000,000 or more | 0 (0.0%) | 0 (0.0%) |
| Total | 532 (100.0%) | 514 (100.0%) |
Household Income by Mortgage Status in Calais
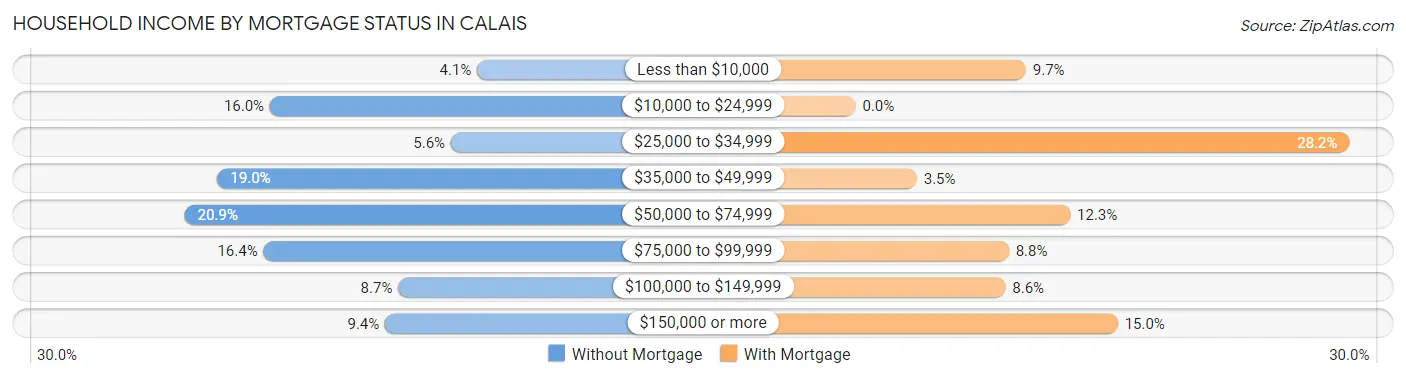
| Household Income | Without Mortgage | With Mortgage |
| Less than $10,000 | 22 (4.1%) | 50 (9.7%) |
| $10,000 to $24,999 | 85 (16.0%) | 0 (0.0%) |
| $25,000 to $34,999 | 30 (5.6%) | 145 (28.2%) |
| $35,000 to $49,999 | 101 (19.0%) | 18 (3.5%) |
| $50,000 to $74,999 | 111 (20.9%) | 63 (12.3%) |
| $75,000 to $99,999 | 87 (16.4%) | 45 (8.7%) |
| $100,000 to $149,999 | 46 (8.6%) | 44 (8.6%) |
| $150,000 or more | 50 (9.4%) | 77 (15.0%) |
| Total | 532 (100.0%) | 514 (100.0%) |
Property Value to Household Income Ratio in Calais
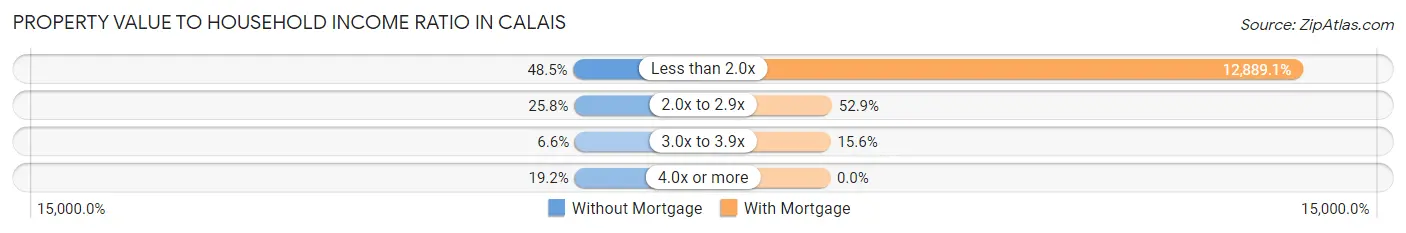
| Value-to-Income Ratio | Without Mortgage | With Mortgage |
| Less than 2.0x | 258 (48.5%) | 66,250 (12,889.1%) |
| 2.0x to 2.9x | 137 (25.8%) | 272 (52.9%) |
| 3.0x to 3.9x | 35 (6.6%) | 80 (15.6%) |
| 4.0x or more | 102 (19.2%) | 0 (0.0%) |
| Total | 532 (100.0%) | 514 (100.0%) |
Real Estate Taxes by Mortgage Status in Calais
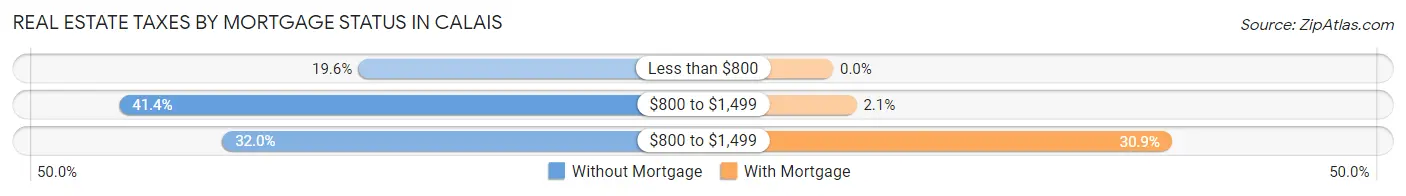
| Property Taxes | Without Mortgage | With Mortgage |
| Less than $800 | 104 (19.6%) | 0 (0.0%) |
| $800 to $1,499 | 220 (41.3%) | 11 (2.1%) |
| $800 to $1,499 | 170 (32.0%) | 159 (30.9%) |
| Total | 532 (100.0%) | 514 (100.0%) |
Health & Disability in Calais
Health Insurance Coverage by Age in Calais
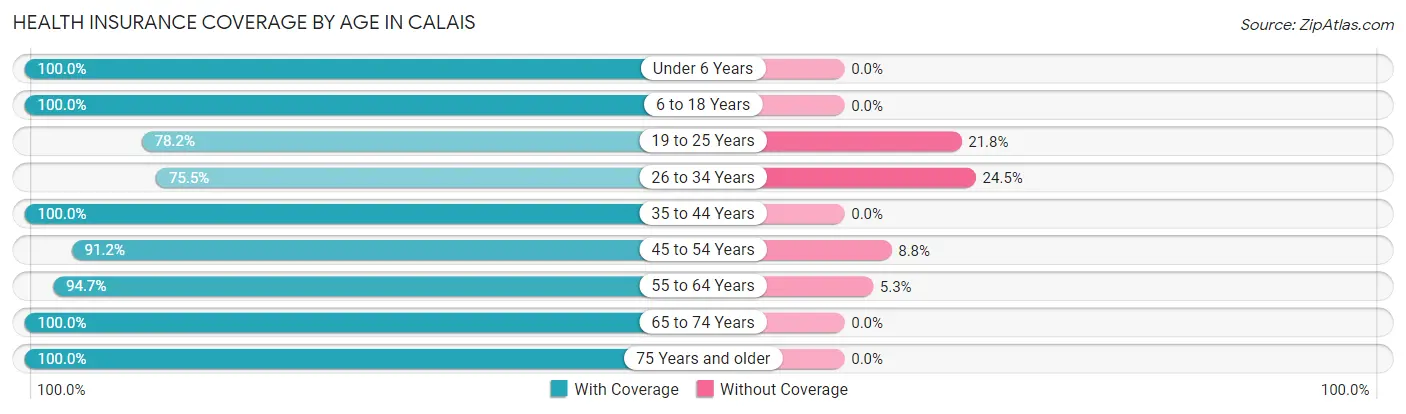
| Age Bracket | With Coverage | Without Coverage |
| Under 6 Years | 228 (100.0%) | 0 (0.0%) |
| 6 to 18 Years | 261 (100.0%) | 0 (0.0%) |
| 19 to 25 Years | 172 (78.2%) | 48 (21.8%) |
| 26 to 34 Years | 262 (75.5%) | 85 (24.5%) |
| 35 to 44 Years | 311 (100.0%) | 0 (0.0%) |
| 45 to 54 Years | 354 (91.2%) | 34 (8.8%) |
| 55 to 64 Years | 409 (94.7%) | 23 (5.3%) |
| 65 to 74 Years | 389 (100.0%) | 0 (0.0%) |
| 75 Years and older | 458 (100.0%) | 0 (0.0%) |
| Total | 2,844 (93.7%) | 190 (6.3%) |
Health Insurance Coverage by Citizenship Status in Calais
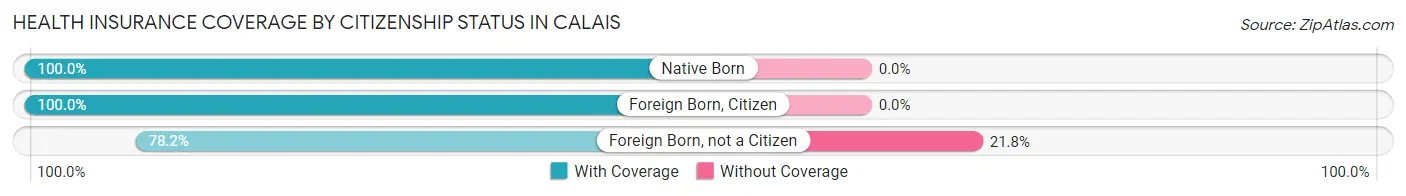
| Citizenship Status | With Coverage | Without Coverage |
| Native Born | 228 (100.0%) | 0 (0.0%) |
| Foreign Born, Citizen | 261 (100.0%) | 0 (0.0%) |
| Foreign Born, not a Citizen | 172 (78.2%) | 48 (21.8%) |
Health Insurance Coverage by Household Income in Calais
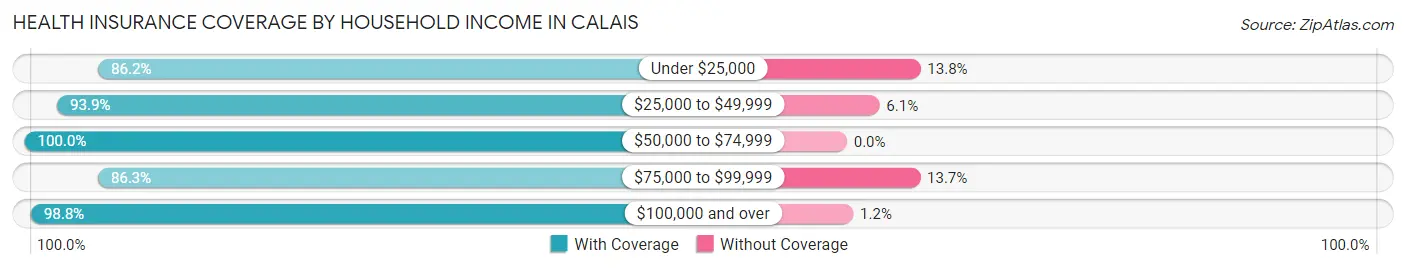
| Household Income | With Coverage | Without Coverage |
| Under $25,000 | 519 (86.2%) | 83 (13.8%) |
| $25,000 to $49,999 | 630 (93.9%) | 41 (6.1%) |
| $50,000 to $74,999 | 433 (100.0%) | 0 (0.0%) |
| $75,000 to $99,999 | 264 (86.3%) | 42 (13.7%) |
| $100,000 and over | 916 (98.8%) | 11 (1.2%) |
Public vs Private Health Insurance Coverage by Age in Calais
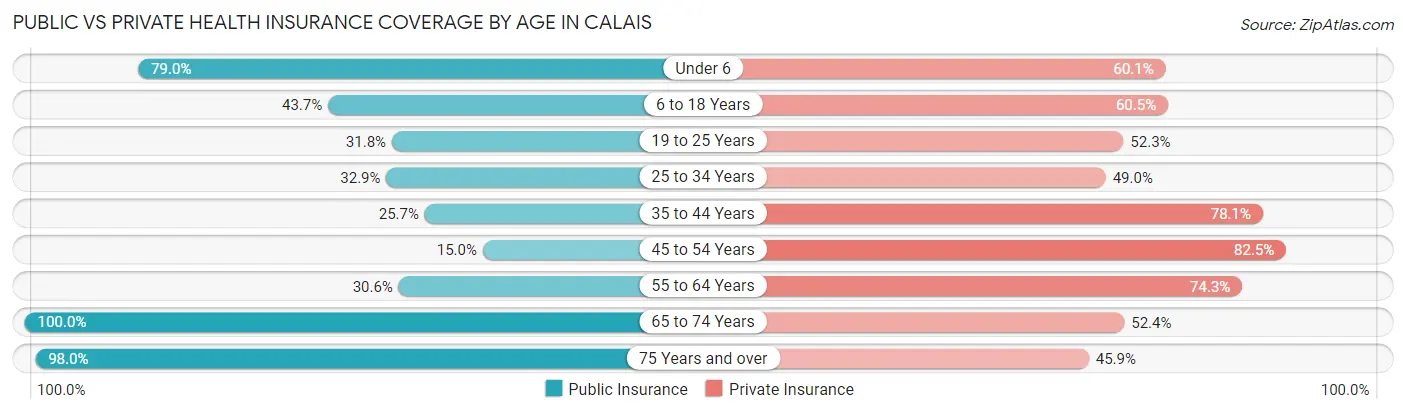
| Age Bracket | Public Insurance | Private Insurance |
| Under 6 | 180 (78.9%) | 137 (60.1%) |
| 6 to 18 Years | 114 (43.7%) | 158 (60.5%) |
| 19 to 25 Years | 70 (31.8%) | 115 (52.3%) |
| 25 to 34 Years | 114 (32.9%) | 170 (49.0%) |
| 35 to 44 Years | 80 (25.7%) | 243 (78.1%) |
| 45 to 54 Years | 58 (14.9%) | 320 (82.5%) |
| 55 to 64 Years | 132 (30.6%) | 321 (74.3%) |
| 65 to 74 Years | 389 (100.0%) | 204 (52.4%) |
| 75 Years and over | 449 (98.0%) | 210 (45.9%) |
| Total | 1,586 (52.3%) | 1,878 (61.9%) |
Disability Status by Sex by Age in Calais
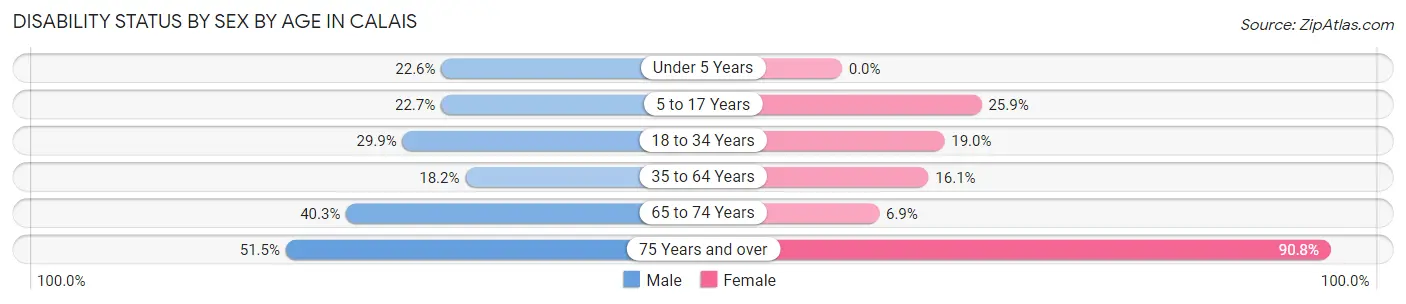
| Age Bracket | Male | Female |
| Under 5 Years | 24 (22.6%) | 0 (0.0%) |
| 5 to 17 Years | 32 (22.7%) | 21 (25.9%) |
| 18 to 34 Years | 100 (29.8%) | 55 (19.0%) |
| 35 to 64 Years | 87 (18.2%) | 105 (16.1%) |
| 65 to 74 Years | 81 (40.3%) | 13 (6.9%) |
| 75 Years and over | 102 (51.5%) | 236 (90.8%) |
Disability Class by Sex by Age in Calais
Disability Class: Hearing Difficulty
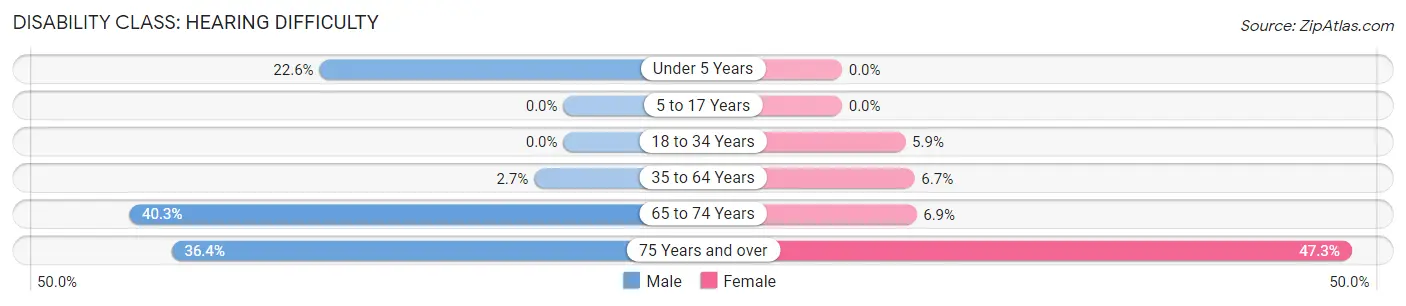
| Age Bracket | Male | Female |
| Under 5 Years | 24 (22.6%) | 0 (0.0%) |
| 5 to 17 Years | 0 (0.0%) | 0 (0.0%) |
| 18 to 34 Years | 0 (0.0%) | 17 (5.9%) |
| 35 to 64 Years | 13 (2.7%) | 44 (6.7%) |
| 65 to 74 Years | 81 (40.3%) | 13 (6.9%) |
| 75 Years and over | 72 (36.4%) | 123 (47.3%) |
Disability Class: Vision Difficulty
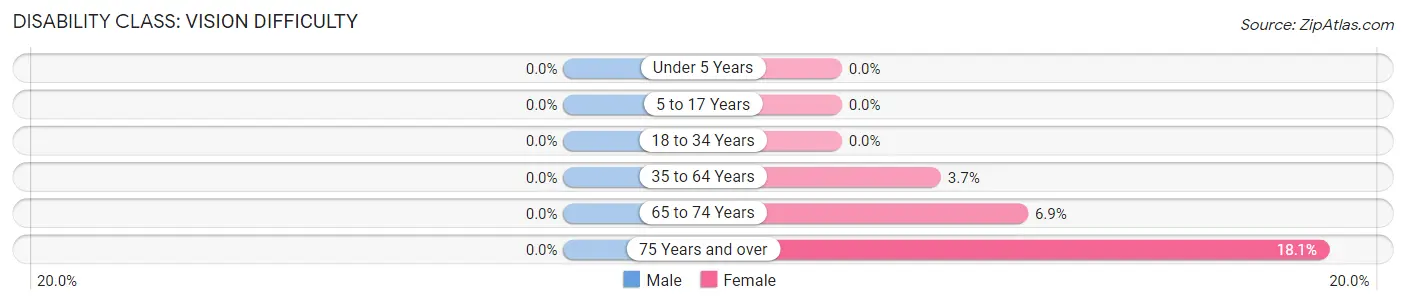
| Age Bracket | Male | Female |
| Under 5 Years | 0 (0.0%) | 0 (0.0%) |
| 5 to 17 Years | 0 (0.0%) | 0 (0.0%) |
| 18 to 34 Years | 0 (0.0%) | 0 (0.0%) |
| 35 to 64 Years | 0 (0.0%) | 24 (3.7%) |
| 65 to 74 Years | 0 (0.0%) | 13 (6.9%) |
| 75 Years and over | 0 (0.0%) | 47 (18.1%) |
Disability Class: Cognitive Difficulty
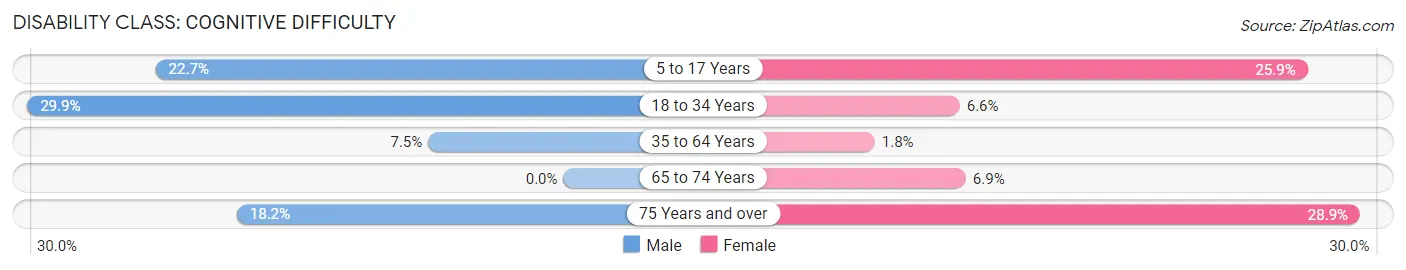
| Age Bracket | Male | Female |
| 5 to 17 Years | 32 (22.7%) | 21 (25.9%) |
| 18 to 34 Years | 100 (29.8%) | 19 (6.6%) |
| 35 to 64 Years | 36 (7.5%) | 12 (1.8%) |
| 65 to 74 Years | 0 (0.0%) | 13 (6.9%) |
| 75 Years and over | 36 (18.2%) | 75 (28.8%) |
Disability Class: Ambulatory Difficulty
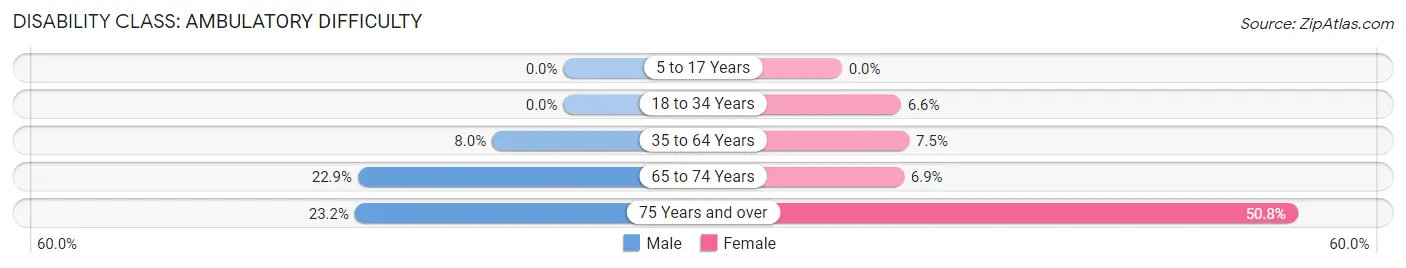
| Age Bracket | Male | Female |
| 5 to 17 Years | 0 (0.0%) | 0 (0.0%) |
| 18 to 34 Years | 0 (0.0%) | 19 (6.6%) |
| 35 to 64 Years | 38 (8.0%) | 49 (7.5%) |
| 65 to 74 Years | 46 (22.9%) | 13 (6.9%) |
| 75 Years and over | 46 (23.2%) | 132 (50.8%) |
Disability Class: Self-Care Difficulty
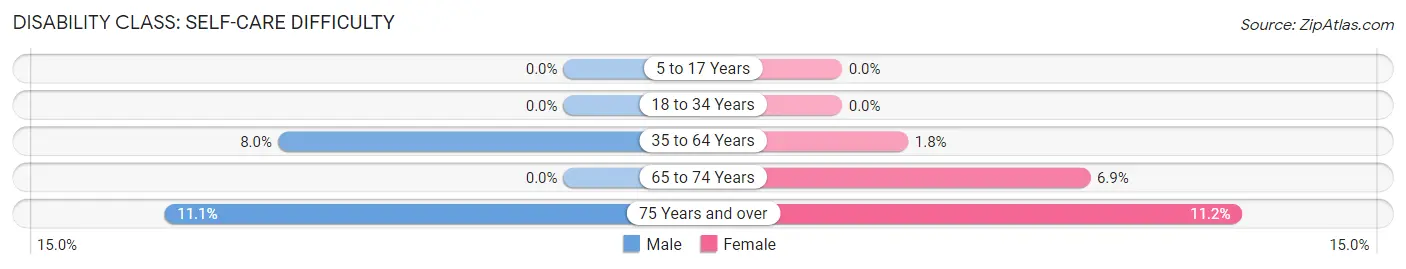
| Age Bracket | Male | Female |
| 5 to 17 Years | 0 (0.0%) | 0 (0.0%) |
| 18 to 34 Years | 0 (0.0%) | 0 (0.0%) |
| 35 to 64 Years | 38 (8.0%) | 12 (1.8%) |
| 65 to 74 Years | 0 (0.0%) | 13 (6.9%) |
| 75 Years and over | 22 (11.1%) | 29 (11.2%) |
Technology Access in Calais
Computing Device Access in Calais
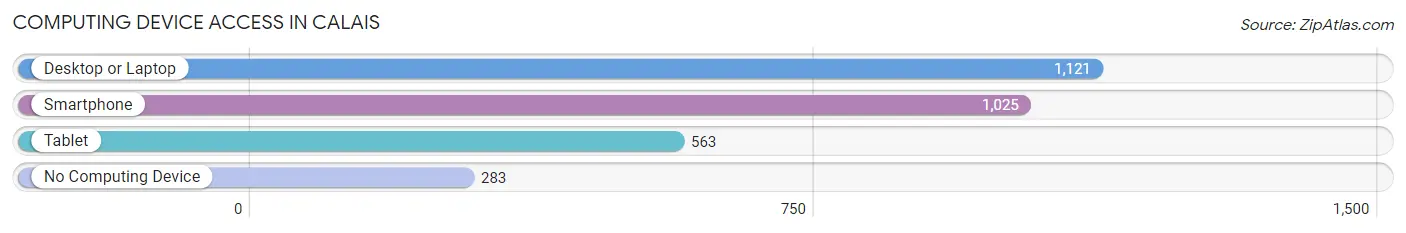
| Device Type | # Households | % Households |
| Desktop or Laptop | 1,121 | 70.3% |
| Smartphone | 1,025 | 64.3% |
| Tablet | 563 | 35.3% |
| No Computing Device | 283 | 17.7% |
| Total | 1,595 | 100.0% |
Internet Access in Calais
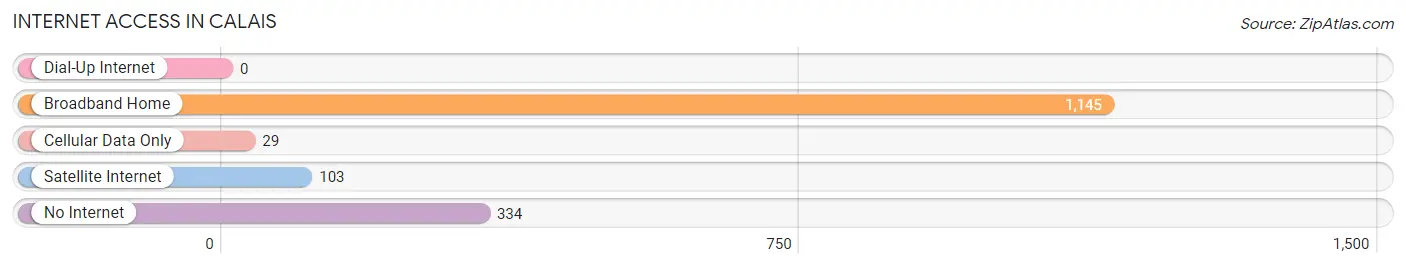
| Internet Type | # Households | % Households |
| Dial-Up Internet | 0 | 0.0% |
| Broadband Home | 1,145 | 71.8% |
| Cellular Data Only | 29 | 1.8% |
| Satellite Internet | 103 | 6.5% |
| No Internet | 334 | 20.9% |
| Total | 1,595 | 100.0% |
Calais Summary
Calais is a city located in Washington County, Maine, United States. It is the county seat of Washington County and is located on the St. Croix River, which forms the border between Maine and New Brunswick, Canada. The population was 3,123 at the 2010 census.
History
Calais was first settled in 1779 by a group of settlers from Machias, Maine. The town was named after the French city of Calais, which was the nearest port to England at the time. The town was incorporated in 1809.
In the 19th century, Calais was an important port for the lumber industry. The city was also a major center for shipbuilding and the manufacture of woodenware. In the early 20th century, the city was a major center for the production of sardines.
Geography
Calais is located at the confluence of the St. Croix River and the Passamaquoddy Bay. The city is located on the eastern side of the St. Croix River, which forms the border between Maine and New Brunswick, Canada. The city is located approximately 40 miles (64 km) east of Bangor, Maine and approximately 80 miles (129 km) west of Saint John, New Brunswick.
The city has a total area of 8.2 square miles (21.2 km2), of which 7.9 square miles (20.5 km2) is land and 0.3 square miles (0.7 km2) is water.
Economy
Calais is the county seat of Washington County and is the economic center of the region. The city is home to a variety of businesses, including manufacturing, retail, and service industries. The city is also home to a number of government offices, including the Washington County Courthouse.
The city is home to a number of manufacturing companies, including a paper mill, a wood products plant, and a sardine cannery. The city is also home to a number of retail stores, including a Walmart Supercenter, a Kmart, and a variety of other stores.
Demographics
As of the 2010 census, there were 3,123 people, 1,323 households, and 809 families residing in the city. The population density was 393.7 people per square mile (152.1/km2). There were 1,521 housing units at an average density of 191.9 per square mile (74.0/km2). The racial makeup of the city was 97.2% White, 0.3% African American, 0.7% Native American, 0.3% Asian, 0.1% Pacific Islander, 0.3% from other races, and 1.2% from two or more races. Hispanic or Latino of any race were 1.2% of the population.
There were 1,323 households, out of which 28.2% had children under the age of 18 living with them, 43.2% were married couples living together, 13.7% had a female householder with no husband present, and 37.7% were non-families. 32.2% of all households were made up of individuals, and 14.2% had someone living alone who was 65 years of age or older. The average household size was 2.30 and the average family size was 2.88.
In the city, the population was spread out, with 24.2% under the age of 18, 8.2% from 18 to 24, 25.7% from 25 to 44, 24.2% from 45 to 64, and 17.7% who were 65 years of age or older. The median age was 39 years. For every 100 females, there were 91.2 males. For every 100 females age 18 and over, there were 87.2 males.
The median income for a household in the city was $30,938, and the median income for a family was $37,917. Males had a median income of $30,000 versus $21,964 for females. The per capita income for the city was $17,845. About 11.3% of families and 14.2% of the population were below the poverty line, including 19.2% of those under age 18 and 11.2% of those age 65 or over.
Common Questions
What is Per Capita Income in Calais?
Per Capita income in Calais is $32,378.
What is the Median Family Income in Calais?
Median Family Income in Calais is $74,394.
What is the Median Household income in Calais?
Median Household Income in Calais is $45,250.
What is Income or Wage Gap in Calais?
Income or Wage Gap in Calais is 35.9%.
Women in Calais earn 64.1 cents for every dollar earned by a man.
What is Inequality or Gini Index in Calais?
Inequality or Gini Index in Calais is 0.45.
What is the Total Population of Calais?
Total Population of Calais is 3,078.
What is the Total Male Population of Calais?
Total Male Population of Calais is 1,475.
What is the Total Female Population of Calais?
Total Female Population of Calais is 1,603.
What is the Ratio of Males per 100 Females in Calais?
There are 92.01 Males per 100 Females in Calais.
What is the Ratio of Females per 100 Males in Calais?
There are 108.68 Females per 100 Males in Calais.
What is the Median Population Age in Calais?
Median Population Age in Calais is 49.9 Years.
What is the Average Family Size in Calais
Average Family Size in Calais is 2.4 People.
What is the Average Household Size in Calais
Average Household Size in Calais is 1.8 People.
How Large is the Labor Force in Calais?
There are 1,482 People in the Labor Forcein in Calais.
What is the Percentage of People in the Labor Force in Calais?
54.4% of People are in the Labor Force in Calais.
What is the Unemployment Rate in Calais?
Unemployment Rate in Calais is 9.8%.