Madison, ME Map & Demographics
Madison Map
Madison Overview
$26,115
PER CAPITA INCOME
$55,903
AVG FAMILY INCOME
$39,695
AVG HOUSEHOLD INCOME
8.3%
WAGE / INCOME GAP [ % ]
91.7¢/ $1
WAGE / INCOME GAP [ $ ]
0.46
INEQUALITY / GINI INDEX
2,100
TOTAL POPULATION
887
MALE POPULATION
1,213
FEMALE POPULATION
73.12
MALES / 100 FEMALES
136.75
FEMALES / 100 MALES
49.6
MEDIAN AGE
2.7
AVG FAMILY SIZE
2.0
AVG HOUSEHOLD SIZE
1,080
LABOR FORCE [ PEOPLE ]
56.1%
PERCENT IN LABOR FORCE
1.9%
UNEMPLOYMENT RATE
Madison Zip Codes
Madison Area Codes
Income in Madison
Income Overview in Madison
Per Capita Income in Madison is $26,115, while median incomes of families and households are $55,903 and $39,695 respectively.
| Characteristic | Number | Measure |
| Per Capita Income | 2,100 | $26,115 |
| Median Family Income | 523 | $55,903 |
| Mean Family Income | 523 | $78,578 |
| Median Household Income | 1,004 | $39,695 |
| Mean Household Income | 1,004 | $54,413 |
| Income Deficit | 523 | $0 |
| Wage / Income Gap (%) | 2,100 | 8.33% |
| Wage / Income Gap ($) | 2,100 | 91.67¢ per $1 |
| Gini / Inequality Index | 2,100 | 0.46 |
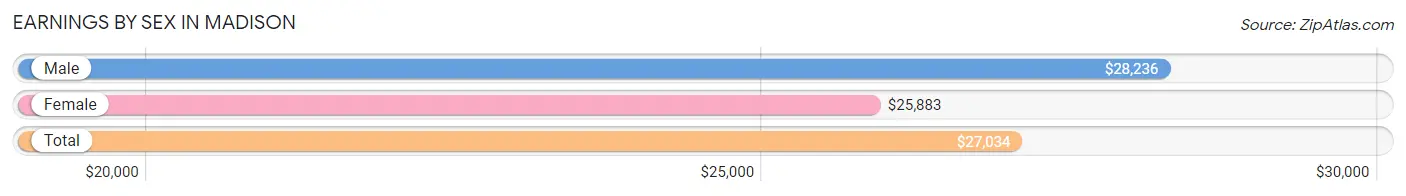
Earnings by Sex in Madison
Average Earnings in Madison are $27,034, $28,236 for men and $25,883 for women, a difference of 8.3%.
| Sex | Number | Average Earnings |
| Male | 629 (49.0%) | $28,236 |
| Female | 655 (51.0%) | $25,883 |
| Total | 1,284 (100.0%) | $27,034 |
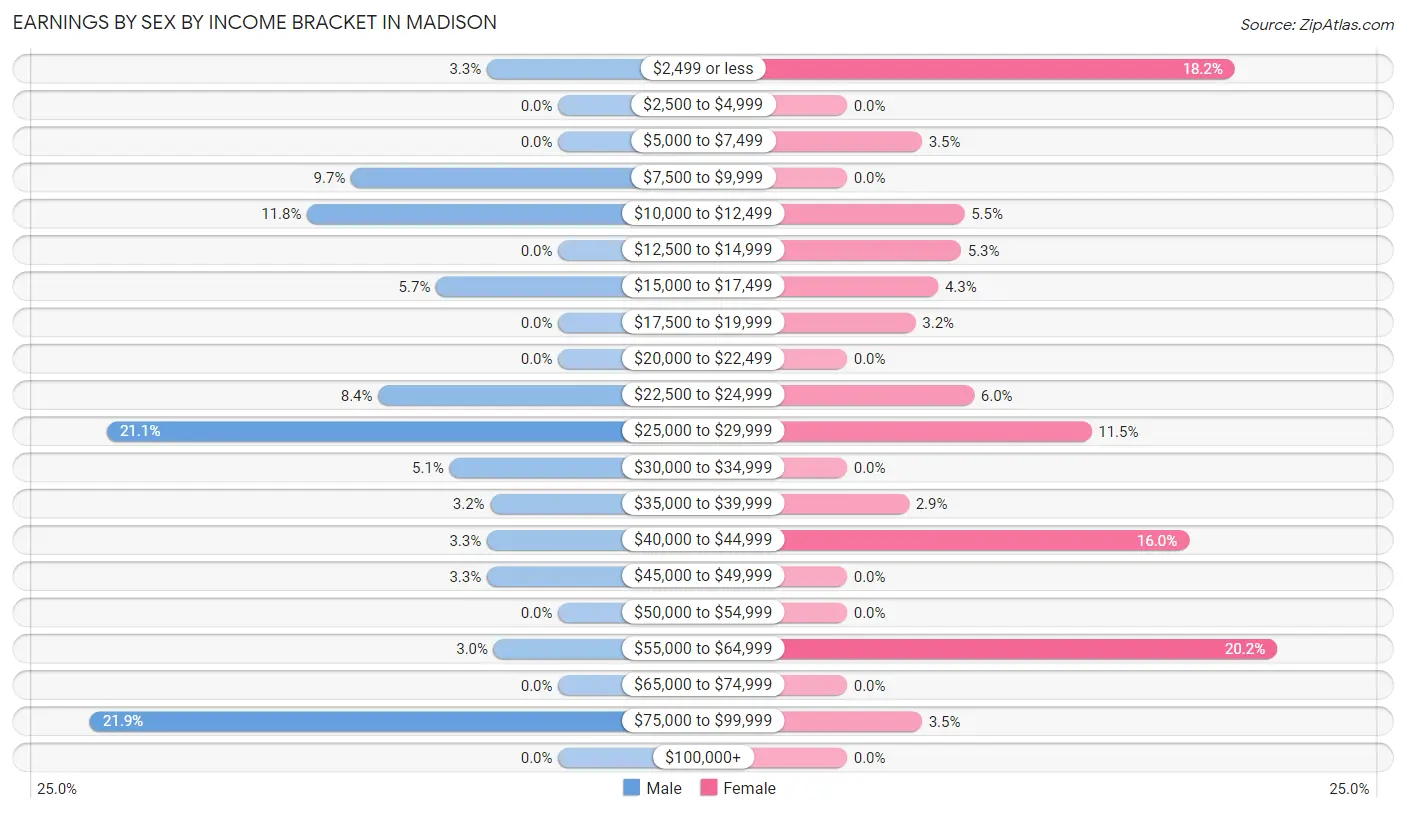
Earnings by Sex by Income Bracket in Madison
The most common earnings brackets in Madison are $75,000 to $99,999 for men (138 | 21.9%) and $55,000 to $64,999 for women (132 | 20.2%).
| Income | Male | Female |
| $2,499 or less | 21 (3.3%) | 119 (18.2%) |
| $2,500 to $4,999 | 0 (0.0%) | 0 (0.0%) |
| $5,000 to $7,499 | 0 (0.0%) | 23 (3.5%) |
| $7,500 to $9,999 | 61 (9.7%) | 0 (0.0%) |
| $10,000 to $12,499 | 74 (11.8%) | 36 (5.5%) |
| $12,500 to $14,999 | 0 (0.0%) | 35 (5.3%) |
| $15,000 to $17,499 | 36 (5.7%) | 28 (4.3%) |
| $17,500 to $19,999 | 0 (0.0%) | 21 (3.2%) |
| $20,000 to $22,499 | 0 (0.0%) | 0 (0.0%) |
| $22,500 to $24,999 | 53 (8.4%) | 39 (5.9%) |
| $25,000 to $29,999 | 133 (21.1%) | 75 (11.5%) |
| $30,000 to $34,999 | 32 (5.1%) | 0 (0.0%) |
| $35,000 to $39,999 | 20 (3.2%) | 19 (2.9%) |
| $40,000 to $44,999 | 21 (3.3%) | 105 (16.0%) |
| $45,000 to $49,999 | 21 (3.3%) | 0 (0.0%) |
| $50,000 to $54,999 | 0 (0.0%) | 0 (0.0%) |
| $55,000 to $64,999 | 19 (3.0%) | 132 (20.2%) |
| $65,000 to $74,999 | 0 (0.0%) | 0 (0.0%) |
| $75,000 to $99,999 | 138 (21.9%) | 23 (3.5%) |
| $100,000+ | 0 (0.0%) | 0 (0.0%) |
| Total | 629 (100.0%) | 655 (100.0%) |
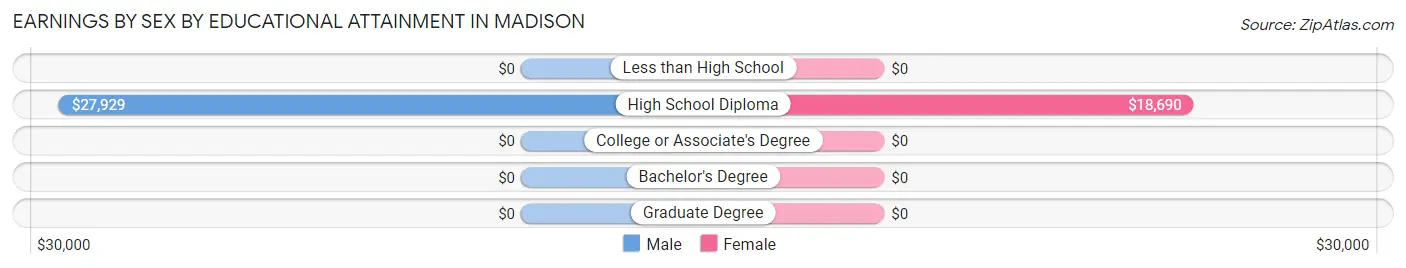
Earnings by Sex by Educational Attainment in Madison
Average earnings in Madison are $28,528 for men and $18,333 for women, a difference of 35.7%. Men with an educational attainment of high school diploma enjoy the highest average annual earnings of $27,929, while those with high school diploma education earn the least with $27,929. Women with an educational attainment of high school diploma earn the most with the average annual earnings of $18,690, while those with high school diploma education have the smallest earnings of $18,690.
| Educational Attainment | Male Income | Female Income |
| Less than High School | - | - |
| High School Diploma | $27,929 | $18,690 |
| College or Associate's Degree | - | - |
| Bachelor's Degree | - | - |
| Graduate Degree | - | - |
| Total | $28,528 | $18,333 |
Family Income in Madison
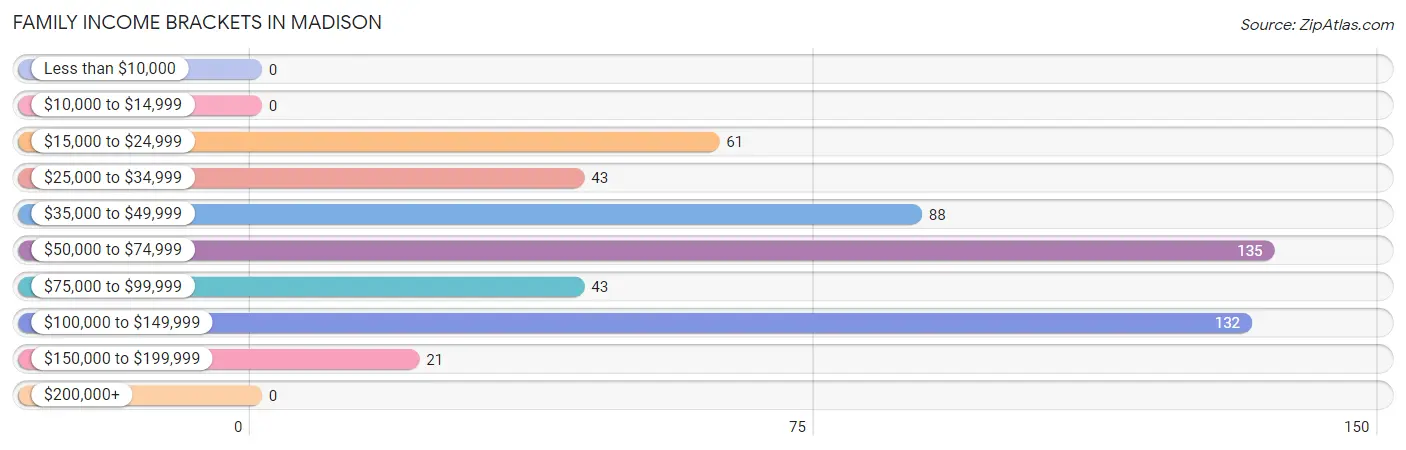
Family Income Brackets in Madison
According to the Madison family income data, there are 135 families falling into the $50,000 to $74,999 income range, which is the most common income bracket and makes up 25.8% of all families.
| Income Bracket | # Families | % Families |
| Less than $10,000 | 0 | 0.0% |
| $10,000 to $14,999 | 0 | 0.0% |
| $15,000 to $24,999 | 61 | 11.7% |
| $25,000 to $34,999 | 43 | 8.2% |
| $35,000 to $49,999 | 88 | 16.8% |
| $50,000 to $74,999 | 135 | 25.8% |
| $75,000 to $99,999 | 43 | 8.2% |
| $100,000 to $149,999 | 132 | 25.2% |
| $150,000 to $199,999 | 21 | 4.0% |
| $200,000+ | 0 | 0.0% |
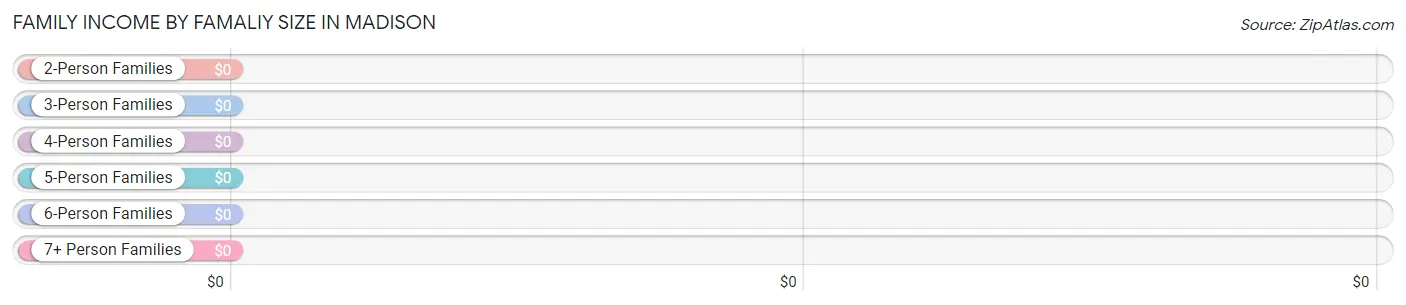
Family Income by Famaliy Size in Madison
| Income Bracket | # Families | Median Income |
| 2-Person Families | 347 (66.3%) | $0 |
| 3-Person Families | 62 (11.8%) | $0 |
| 4-Person Families | 71 (13.6%) | $0 |
| 5-Person Families | 43 (8.2%) | $0 |
| 6-Person Families | 0 (0.0%) | $0 |
| 7+ Person Families | 0 (0.0%) | $0 |
| Total | 523 (100.0%) | $55,903 |
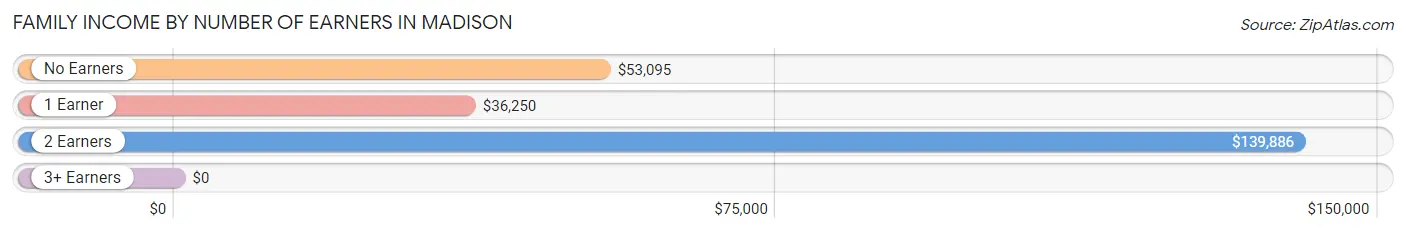
Family Income by Number of Earners in Madison
| Number of Earners | # Families | Median Income |
| No Earners | 68 (13.0%) | $53,095 |
| 1 Earner | 62 (11.8%) | $36,250 |
| 2 Earners | 264 (50.5%) | $139,886 |
| 3+ Earners | 129 (24.7%) | $0 |
| Total | 523 (100.0%) | $55,903 |
Household Income in Madison
Household Income Brackets in Madison
With 233 households falling in the category, the $50,000 to $74,999 income range is the most frequent in Madison, accounting for 23.2% of all households.
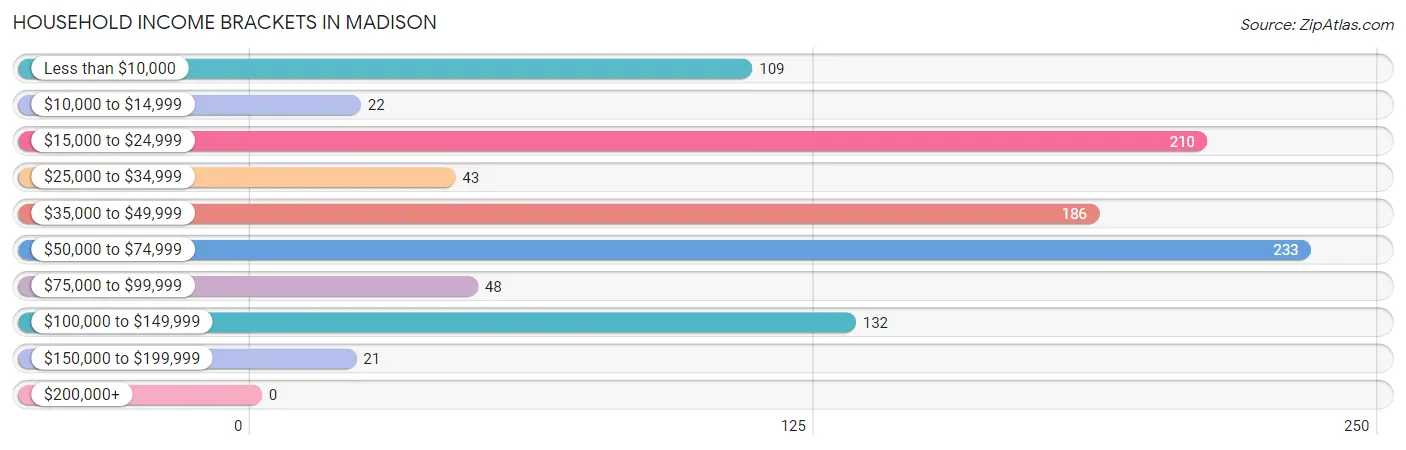
| Income Bracket | # Households | % Households |
| Less than $10,000 | 109 | 10.9% |
| $10,000 to $14,999 | 22 | 2.2% |
| $15,000 to $24,999 | 210 | 20.9% |
| $25,000 to $34,999 | 43 | 4.3% |
| $35,000 to $49,999 | 186 | 18.5% |
| $50,000 to $74,999 | 233 | 23.2% |
| $75,000 to $99,999 | 48 | 4.8% |
| $100,000 to $149,999 | 132 | 13.1% |
| $150,000 to $199,999 | 21 | 2.1% |
| $200,000+ | 0 | 0.0% |
Household Income by Householder Age in Madison
The median household income in Madison is $39,695, with the highest median household income of $92,558 found in the 45 to 64 years age bracket for the primary householder. A total of 390 households (38.8%) fall into this category. Meanwhile, the 15 to 24 years age bracket for the primary householder has the lowest median household income of $0, with 84 households (8.4%) in this group.
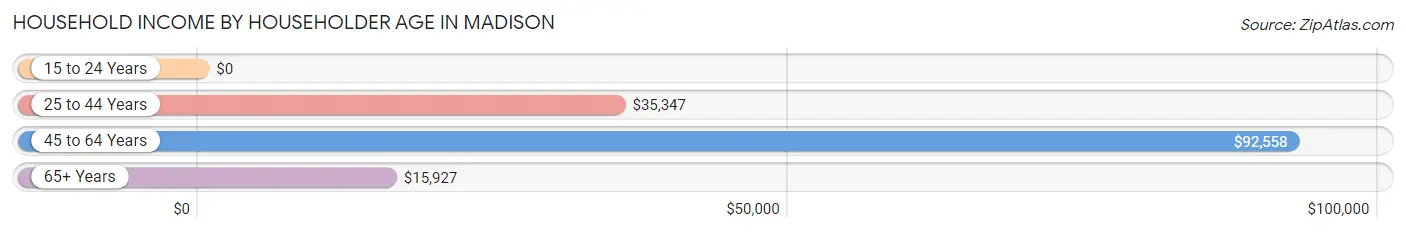
| Income Bracket | # Households | Median Income |
| 15 to 24 Years | 84 (8.4%) | $0 |
| 25 to 44 Years | 199 (19.8%) | $35,347 |
| 45 to 64 Years | 390 (38.8%) | $92,558 |
| 65+ Years | 331 (33.0%) | $15,927 |
| Total | 1,004 (100.0%) | $39,695 |
Poverty in Madison
Income Below Poverty by Sex and Age in Madison
With 16.7% poverty level for males and 30.8% for females among the residents of Madison, 35 to 44 year old males and 5 year old females are the most vulnerable to poverty, with 70 males (56.9%) and 72 females (100.0%) in their respective age groups living below the poverty level.
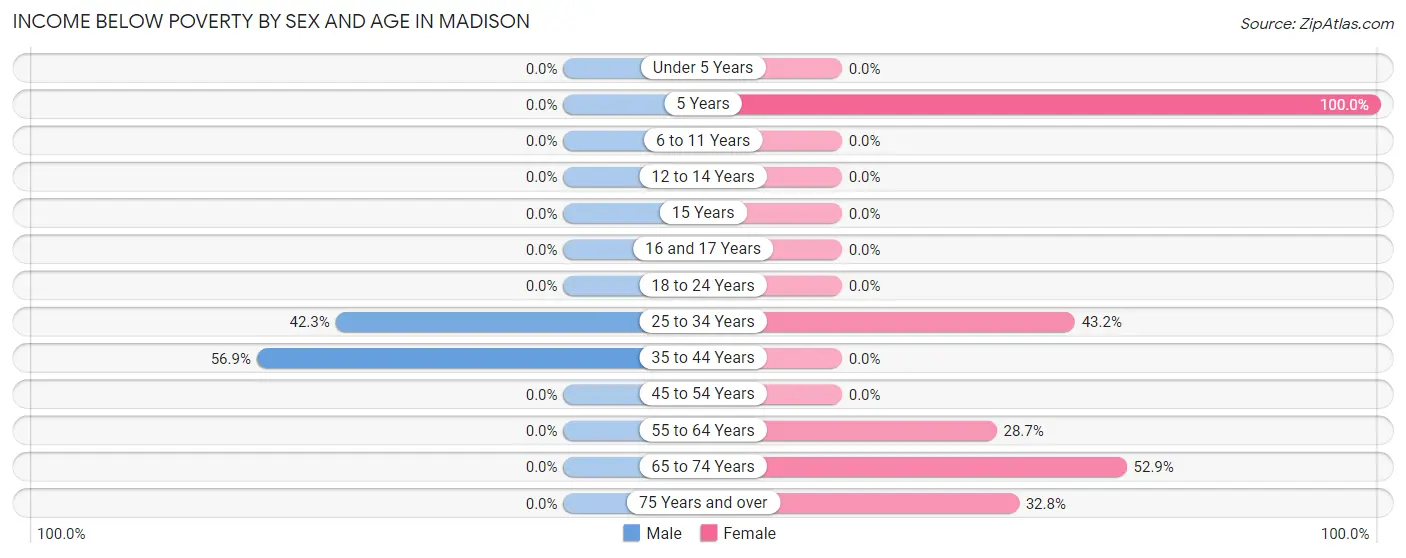
| Age Bracket | Male | Female |
| Under 5 Years | 0 (0.0%) | 0 (0.0%) |
| 5 Years | 0 (0.0%) | 72 (100.0%) |
| 6 to 11 Years | 0 (0.0%) | 0 (0.0%) |
| 12 to 14 Years | 0 (0.0%) | 0 (0.0%) |
| 15 Years | 0 (0.0%) | 0 (0.0%) |
| 16 and 17 Years | 0 (0.0%) | 0 (0.0%) |
| 18 to 24 Years | 0 (0.0%) | 0 (0.0%) |
| 25 to 34 Years | 74 (42.3%) | 80 (43.2%) |
| 35 to 44 Years | 70 (56.9%) | 0 (0.0%) |
| 45 to 54 Years | 0 (0.0%) | 0 (0.0%) |
| 55 to 64 Years | 0 (0.0%) | 56 (28.7%) |
| 65 to 74 Years | 0 (0.0%) | 129 (52.9%) |
| 75 Years and over | 0 (0.0%) | 22 (32.8%) |
| Total | 144 (16.7%) | 359 (30.8%) |
Income Above Poverty by Sex and Age in Madison
According to the poverty statistics in Madison, males aged under 5 years and females aged 6 to 11 years are the age groups that are most secure financially, with 100.0% of males and 100.0% of females in these age groups living above the poverty line.
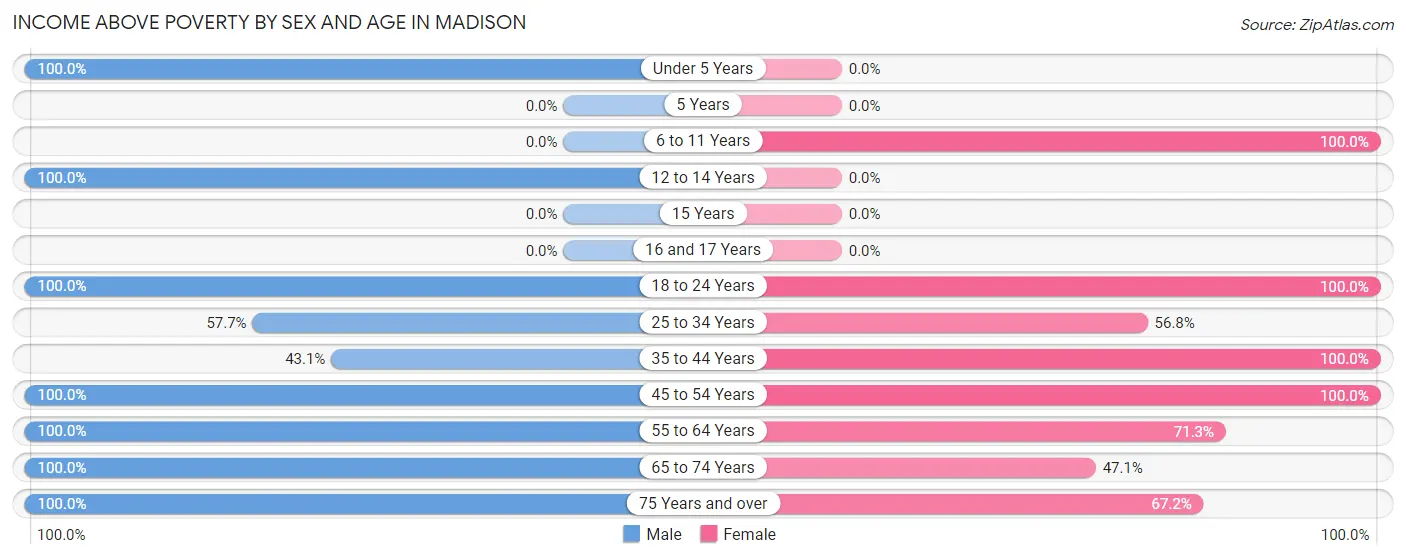
| Age Bracket | Male | Female |
| Under 5 Years | 34 (100.0%) | 0 (0.0%) |
| 5 Years | 0 (0.0%) | 0 (0.0%) |
| 6 to 11 Years | 0 (0.0%) | 11 (100.0%) |
| 12 to 14 Years | 57 (100.0%) | 0 (0.0%) |
| 15 Years | 0 (0.0%) | 0 (0.0%) |
| 16 and 17 Years | 0 (0.0%) | 0 (0.0%) |
| 18 to 24 Years | 21 (100.0%) | 159 (100.0%) |
| 25 to 34 Years | 101 (57.7%) | 105 (56.8%) |
| 35 to 44 Years | 53 (43.1%) | 58 (100.0%) |
| 45 to 54 Years | 209 (100.0%) | 175 (100.0%) |
| 55 to 64 Years | 85 (100.0%) | 139 (71.3%) |
| 65 to 74 Years | 139 (100.0%) | 115 (47.1%) |
| 75 Years and over | 18 (100.0%) | 45 (67.2%) |
| Total | 717 (83.3%) | 807 (69.2%) |
Income Below Poverty Among Married-Couple Families in Madison
The poverty statistics for married-couple families in Madison show that 12.7% or 61 of the total 482 families live below the poverty line. Families with 1 or 2 children have the highest poverty rate of 46.2%, comprising of 61 families. On the other hand, families with no children have the lowest poverty rate of 0.0%, which includes 0 families.
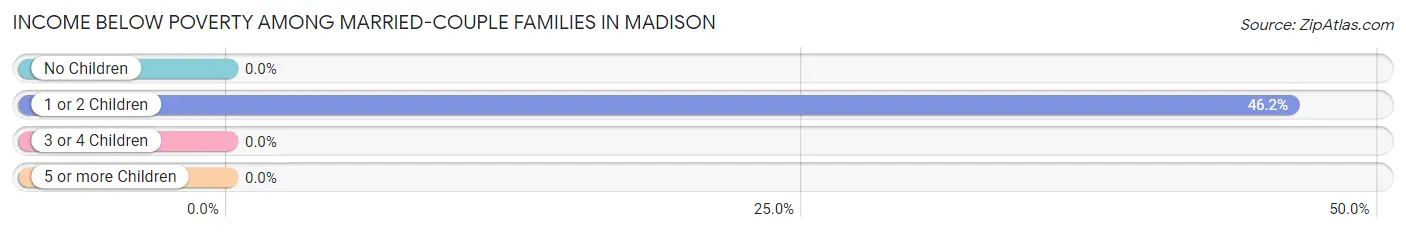
| Children | Above Poverty | Below Poverty |
| No Children | 350 (100.0%) | 0 (0.0%) |
| 1 or 2 Children | 71 (53.8%) | 61 (46.2%) |
| 3 or 4 Children | 0 (0.0%) | 0 (0.0%) |
| 5 or more Children | 0 (0.0%) | 0 (0.0%) |
| Total | 421 (87.3%) | 61 (12.7%) |
Income Below Poverty Among Single-Parent Households in Madison
| Children | Single Father | Single Mother |
| No Children | 0 (0.0%) | 0 (0.0%) |
| 1 or 2 Children | 0 (0.0%) | 0 (0.0%) |
| 3 or 4 Children | 0 (0.0%) | 0 (0.0%) |
| 5 or more Children | 0 (0.0%) | 0 (0.0%) |
| Total | 0 (0.0%) | 0 (0.0%) |
Income Below Poverty Among Married-Couple vs Single-Parent Households in Madison
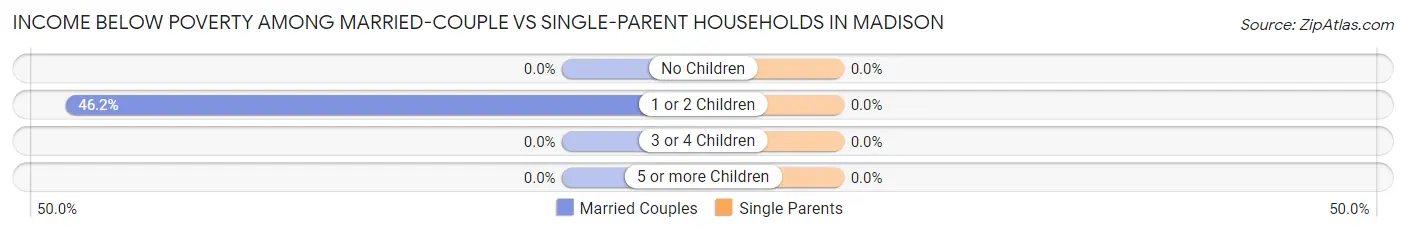
| Children | Married-Couple Families | Single-Parent Households |
| No Children | 0 (0.0%) | 0 (0.0%) |
| 1 or 2 Children | 61 (46.2%) | 0 (0.0%) |
| 3 or 4 Children | 0 (0.0%) | 0 (0.0%) |
| 5 or more Children | 0 (0.0%) | 0 (0.0%) |
| Total | 61 (12.7%) | 0 (0.0%) |
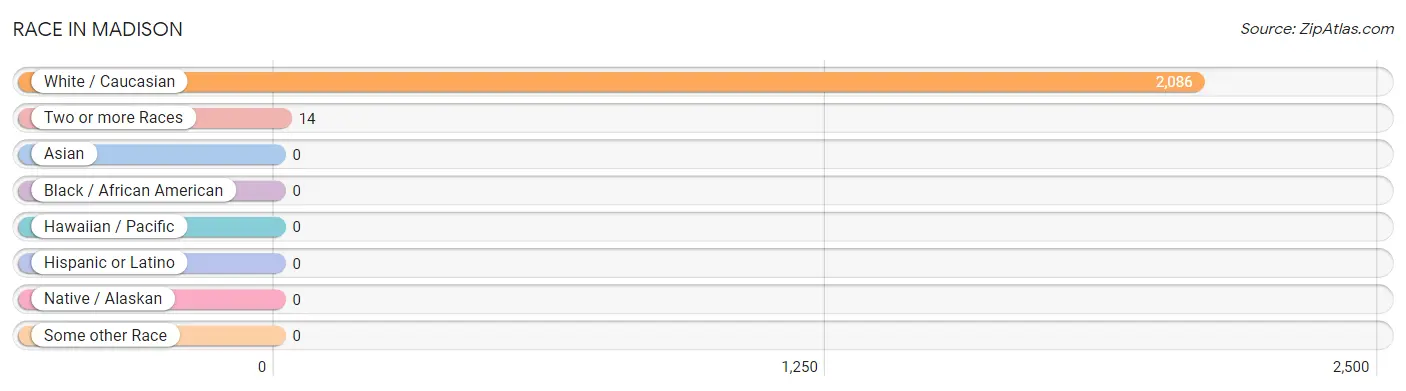
Race in Madison
The most populous races in Madison are White / Caucasian (2,086 | 99.3%), and Two or more Races (14 | 0.7%).
| Race | # Population | % Population |
| Asian | 0 | 0.0% |
| Black / African American | 0 | 0.0% |
| Hawaiian / Pacific | 0 | 0.0% |
| Hispanic or Latino | 0 | 0.0% |
| Native / Alaskan | 0 | 0.0% |
| White / Caucasian | 2,086 | 99.3% |
| Two or more Races | 14 | 0.7% |
| Some other Race | 0 | 0.0% |
| Total | 2,100 | 100.0% |
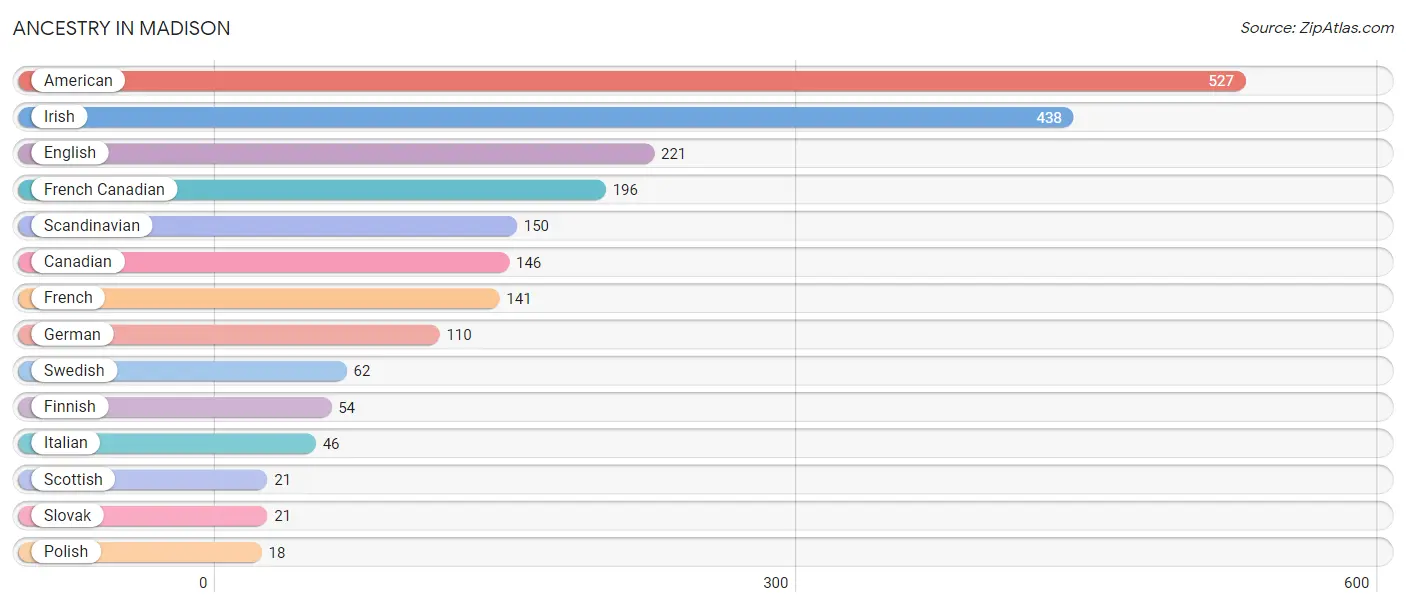
Ancestry in Madison
The most populous ancestries reported in Madison are American (527 | 25.1%), Irish (438 | 20.9%), English (221 | 10.5%), French Canadian (196 | 9.3%), and Scandinavian (150 | 7.1%), together accounting for 72.9% of all Madison residents.
| Ancestry | # Population | % Population |
| American | 527 | 25.1% |
| Canadian | 146 | 7.0% |
| English | 221 | 10.5% |
| Finnish | 54 | 2.6% |
| French | 141 | 6.7% |
| French Canadian | 196 | 9.3% |
| German | 110 | 5.2% |
| Irish | 438 | 20.9% |
| Italian | 46 | 2.2% |
| Polish | 18 | 0.9% |
| Scandinavian | 150 | 7.1% |
| Scottish | 21 | 1.0% |
| Slovak | 21 | 1.0% |
| Swedish | 62 | 2.9% | View All 14 Rows |
Immigrants in Madison

| Immigration Origin | # Population | % Population | View All 0 Rows |
Sex and Age in Madison
Sex and Age in Madison
The most populous age groups in Madison are 45 to 49 Years (160 | 18.0%) for men and 20 to 24 Years (159 | 13.1%) for women.
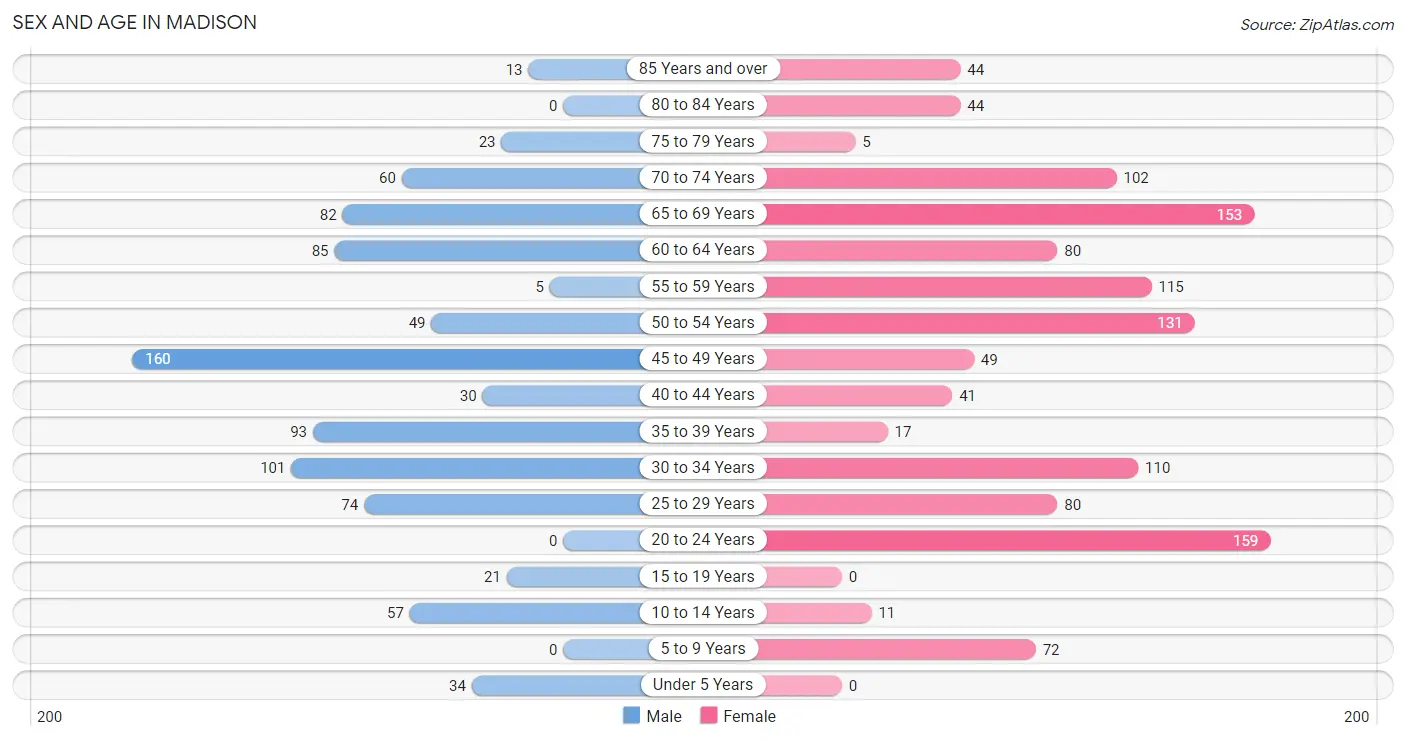
| Age Bracket | Male | Female |
| Under 5 Years | 34 (3.8%) | 0 (0.0%) |
| 5 to 9 Years | 0 (0.0%) | 72 (5.9%) |
| 10 to 14 Years | 57 (6.4%) | 11 (0.9%) |
| 15 to 19 Years | 21 (2.4%) | 0 (0.0%) |
| 20 to 24 Years | 0 (0.0%) | 159 (13.1%) |
| 25 to 29 Years | 74 (8.3%) | 80 (6.6%) |
| 30 to 34 Years | 101 (11.4%) | 110 (9.1%) |
| 35 to 39 Years | 93 (10.5%) | 17 (1.4%) |
| 40 to 44 Years | 30 (3.4%) | 41 (3.4%) |
| 45 to 49 Years | 160 (18.0%) | 49 (4.0%) |
| 50 to 54 Years | 49 (5.5%) | 131 (10.8%) |
| 55 to 59 Years | 5 (0.6%) | 115 (9.5%) |
| 60 to 64 Years | 85 (9.6%) | 80 (6.6%) |
| 65 to 69 Years | 82 (9.2%) | 153 (12.6%) |
| 70 to 74 Years | 60 (6.8%) | 102 (8.4%) |
| 75 to 79 Years | 23 (2.6%) | 5 (0.4%) |
| 80 to 84 Years | 0 (0.0%) | 44 (3.6%) |
| 85 Years and over | 13 (1.5%) | 44 (3.6%) |
| Total | 887 (100.0%) | 1,213 (100.0%) |
Families and Households in Madison
Median Family Size in Madison
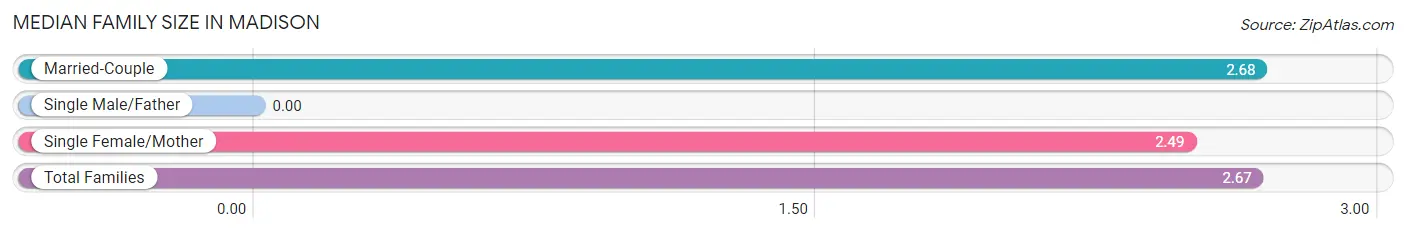
| Family Type | # Families | Family Size |
| Married-Couple | 482 (92.2%) | 2.68 |
| Single Male/Father | 0 (0.0%) | - |
| Single Female/Mother | 41 (7.8%) | 2.49 |
| Total Families | 523 (100.0%) | 2.67 |
Median Household Size in Madison
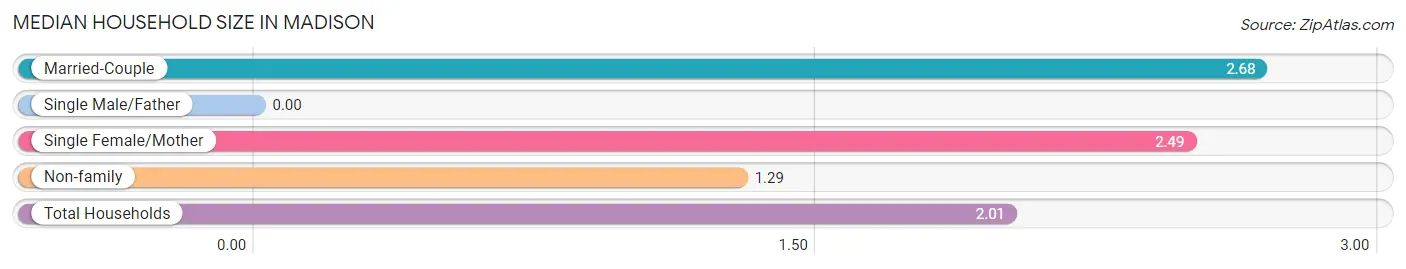
| Household Type | # Households | Household Size |
| Married-Couple | 482 (48.0%) | 2.68 |
| Single Male/Father | 0 (0.0%) | - |
| Single Female/Mother | 41 (4.1%) | 2.49 |
| Non-family | 481 (47.9%) | 1.29 |
| Total Households | 1,004 (100.0%) | 2.01 |
Household Size by Marriage Status in Madison
Out of a total of 1,004 households in Madison, 523 (52.1%) are family households, while 481 (47.9%) are nonfamily households. The most numerous type of family households are 2-person households, comprising 347, and the most common type of nonfamily households are 1-person households, comprising 327.
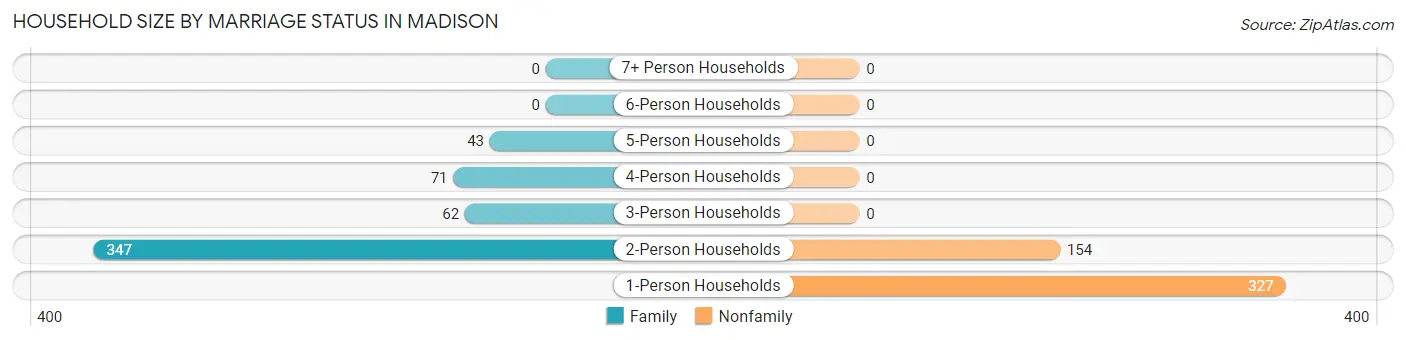
| Household Size | Family Households | Nonfamily Households |
| 1-Person Households | - | 327 (32.6%) |
| 2-Person Households | 347 (34.6%) | 154 (15.3%) |
| 3-Person Households | 62 (6.2%) | 0 (0.0%) |
| 4-Person Households | 71 (7.1%) | 0 (0.0%) |
| 5-Person Households | 43 (4.3%) | 0 (0.0%) |
| 6-Person Households | 0 (0.0%) | 0 (0.0%) |
| 7+ Person Households | 0 (0.0%) | 0 (0.0%) |
| Total | 523 (52.1%) | 481 (47.9%) |
Female Fertility in Madison
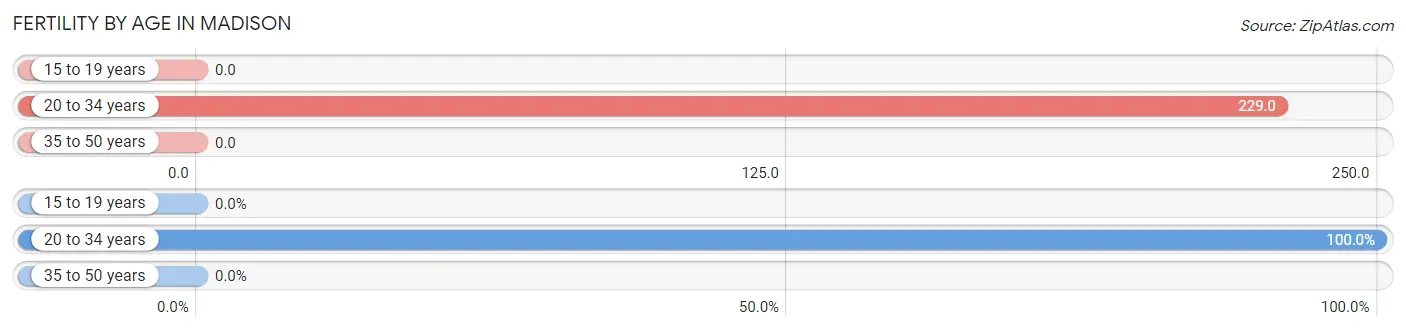
Fertility by Age in Madison
Average fertility rate in Madison is 175.0 births per 1,000 women. Women in the age bracket of 20 to 34 years have the highest fertility rate with 229.0 births per 1,000 women. Women in the age bracket of 20 to 34 years acount for 100.0% of all women with births.
| Age Bracket | Women with Births | Births / 1,000 Women |
| 15 to 19 years | 0 (0.0%) | 0.0 |
| 20 to 34 years | 80 (100.0%) | 229.0 |
| 35 to 50 years | 0 (0.0%) | 0.0 |
| Total | 80 (100.0%) | 175.0 |
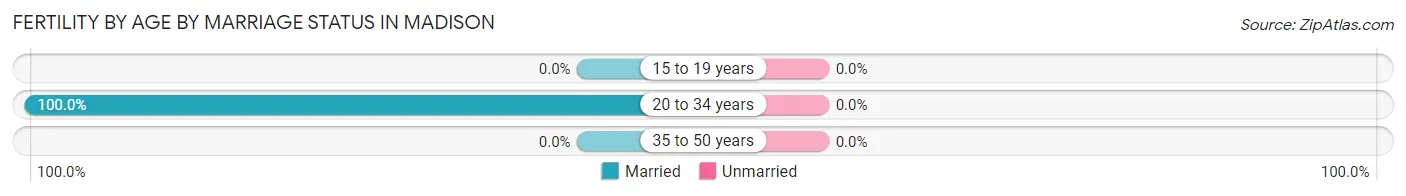
Fertility by Age by Marriage Status in Madison
| Age Bracket | Married | Unmarried |
| 15 to 19 years | 0 (0.0%) | 0 (0.0%) |
| 20 to 34 years | 80 (100.0%) | 0 (0.0%) |
| 35 to 50 years | 0 (0.0%) | 0 (0.0%) |
| Total | 80 (100.0%) | 0 (0.0%) |
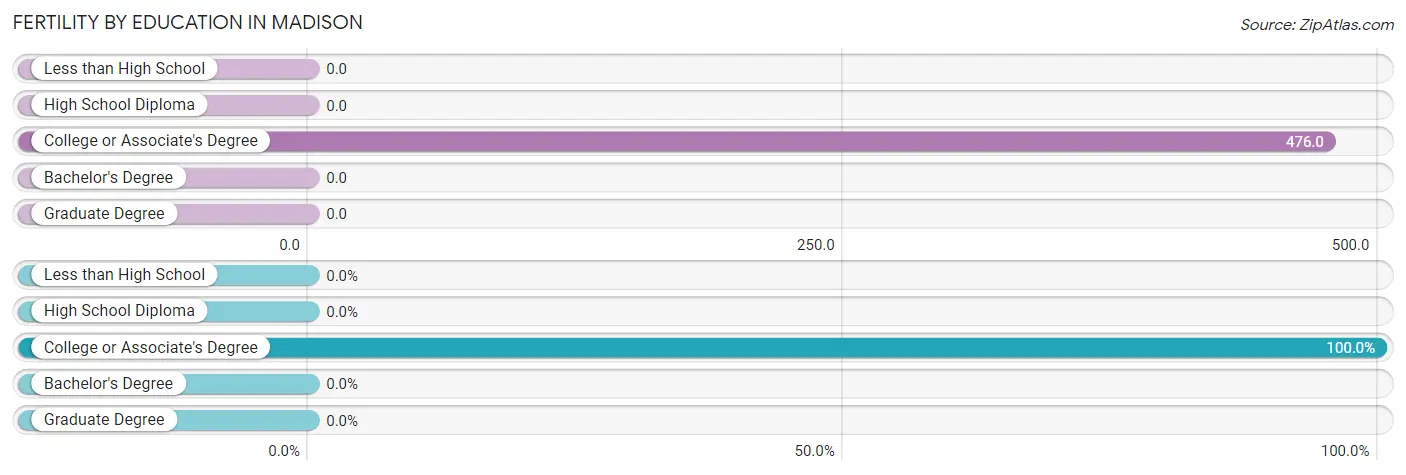
Fertility by Education in Madison
| Educational Attainment | Women with Births | Births / 1,000 Women |
| Less than High School | 0 (0.0%) | 0.0 |
| High School Diploma | 0 (0.0%) | 0.0 |
| College or Associate's Degree | 80 (100.0%) | 476.0 |
| Bachelor's Degree | 0 (0.0%) | 0.0 |
| Graduate Degree | 0 (0.0%) | 0.0 |
| Total | 80 (100.0%) | 175.0 |
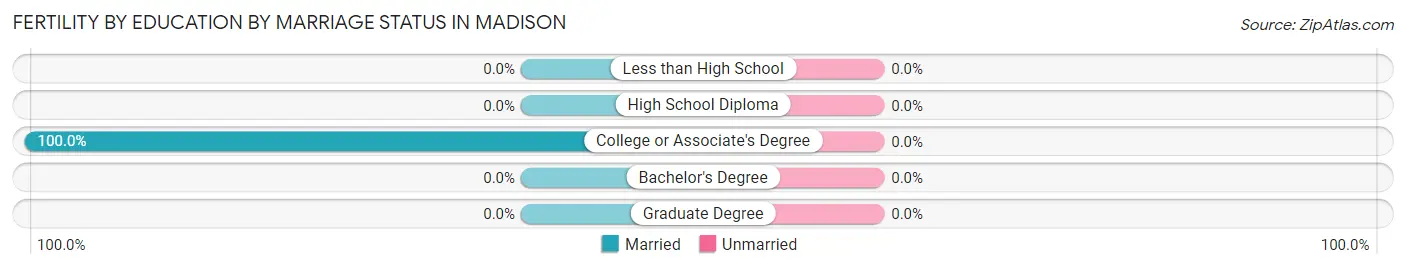
Fertility by Education by Marriage Status in Madison
| Educational Attainment | Married | Unmarried |
| Less than High School | 0 (0.0%) | 0 (0.0%) |
| High School Diploma | 0 (0.0%) | 0 (0.0%) |
| College or Associate's Degree | 80 (100.0%) | 0 (0.0%) |
| Bachelor's Degree | 0 (0.0%) | 0 (0.0%) |
| Graduate Degree | 0 (0.0%) | 0 (0.0%) |
| Total | 80 (100.0%) | 0 (0.0%) |
Employment Characteristics in Madison
Employment by Class of Employer in Madison
Among the 1,039 employed individuals in Madison, private company employees (684 | 65.8%), federal government employees (179 | 17.2%), and local government employees (82 | 7.9%) make up the most common classes of employment.
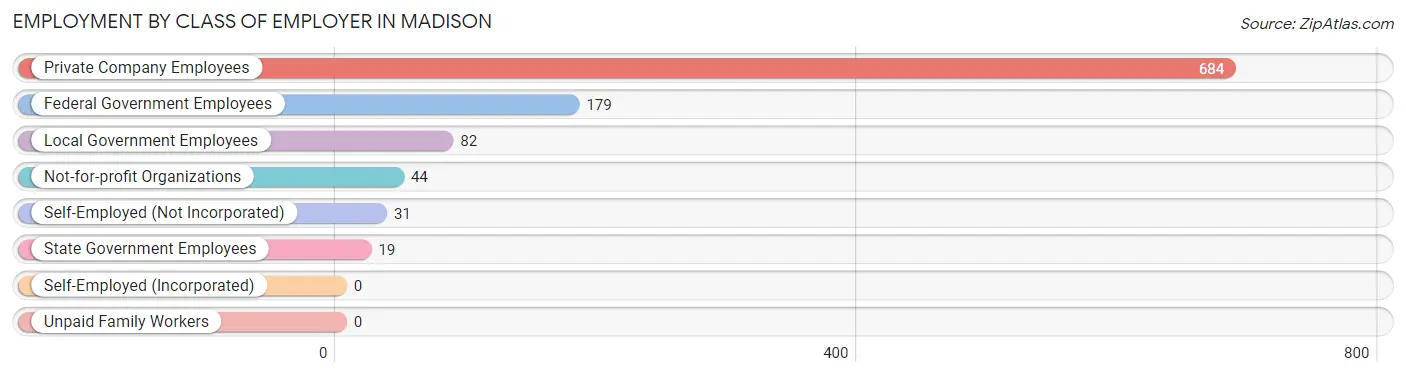
| Employer Class | # Employees | % Employees |
| Private Company Employees | 684 | 65.8% |
| Self-Employed (Incorporated) | 0 | 0.0% |
| Self-Employed (Not Incorporated) | 31 | 3.0% |
| Not-for-profit Organizations | 44 | 4.2% |
| Local Government Employees | 82 | 7.9% |
| State Government Employees | 19 | 1.8% |
| Federal Government Employees | 179 | 17.2% |
| Unpaid Family Workers | 0 | 0.0% |
| Total | 1,039 | 100.0% |
Employment Status by Age in Madison
According to the labor force statistics for Madison, out of the total population over 16 years of age (1,926), 56.1% or 1,080 individuals are in the labor force, with 1.9% or 21 of them unemployed. The age group with the highest labor force participation rate is 16 to 19 years, with 100.0% or 21 individuals in the labor force. Within the labor force, the 45 to 54 years age range has the highest percentage of unemployed individuals, with 5.7% or 20 of them being unemployed.
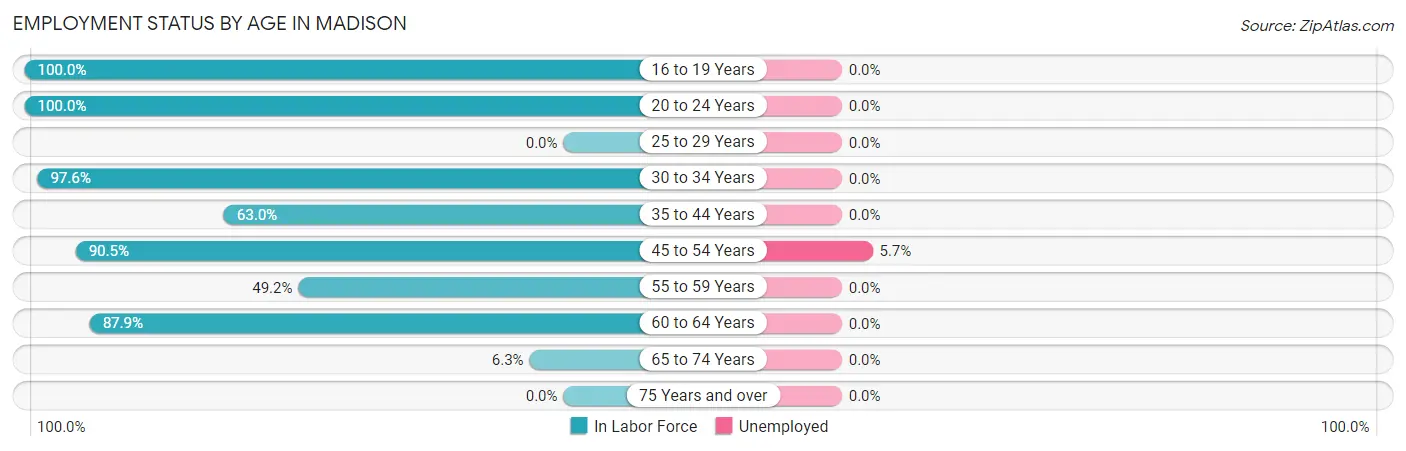
| Age Bracket | In Labor Force | Unemployed |
| 16 to 19 Years | 21 (100.0%) | 0 (0.0%) |
| 20 to 24 Years | 159 (100.0%) | 0 (0.0%) |
| 25 to 29 Years | 0 (0.0%) | 0 (0.0%) |
| 30 to 34 Years | 206 (97.6%) | 0 (0.0%) |
| 35 to 44 Years | 114 (63.0%) | 0 (0.0%) |
| 45 to 54 Years | 352 (90.5%) | 20 (5.7%) |
| 55 to 59 Years | 59 (49.2%) | 0 (0.0%) |
| 60 to 64 Years | 145 (87.9%) | 0 (0.0%) |
| 65 to 74 Years | 25 (6.3%) | 0 (0.0%) |
| 75 Years and over | 0 (0.0%) | 0 (0.0%) |
| Total | 1,080 (56.1%) | 21 (1.9%) |
Employment Status by Educational Attainment in Madison
According to labor force statistics for Madison, 71.8% of individuals (876) out of the total population between 25 and 64 years of age (1,220) are in the labor force, with 2.3% or 20 of them being unemployed. The group with the highest labor force participation rate are those with the educational attainment of bachelor's degree or higher, with 86.3% or 170 individuals in the labor force. Within the labor force, individuals with high school diploma education have the highest percentage of unemployment, with 9.1% or 20 of them being unemployed.
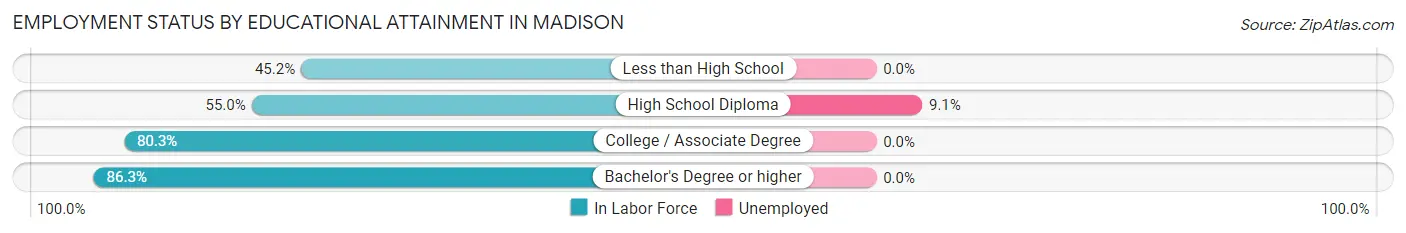
| Educational Attainment | In Labor Force | Unemployed |
| Less than High School | 19 (45.2%) | 0 (0.0%) |
| High School Diploma | 219 (55.0%) | 36 (9.1%) |
| College / Associate Degree | 468 (80.3%) | 0 (0.0%) |
| Bachelor's Degree or higher | 170 (86.3%) | 0 (0.0%) |
| Total | 876 (71.8%) | 28 (2.3%) |
Employment Occupations by Sex in Madison
Management, Business, Science and Arts Occupations
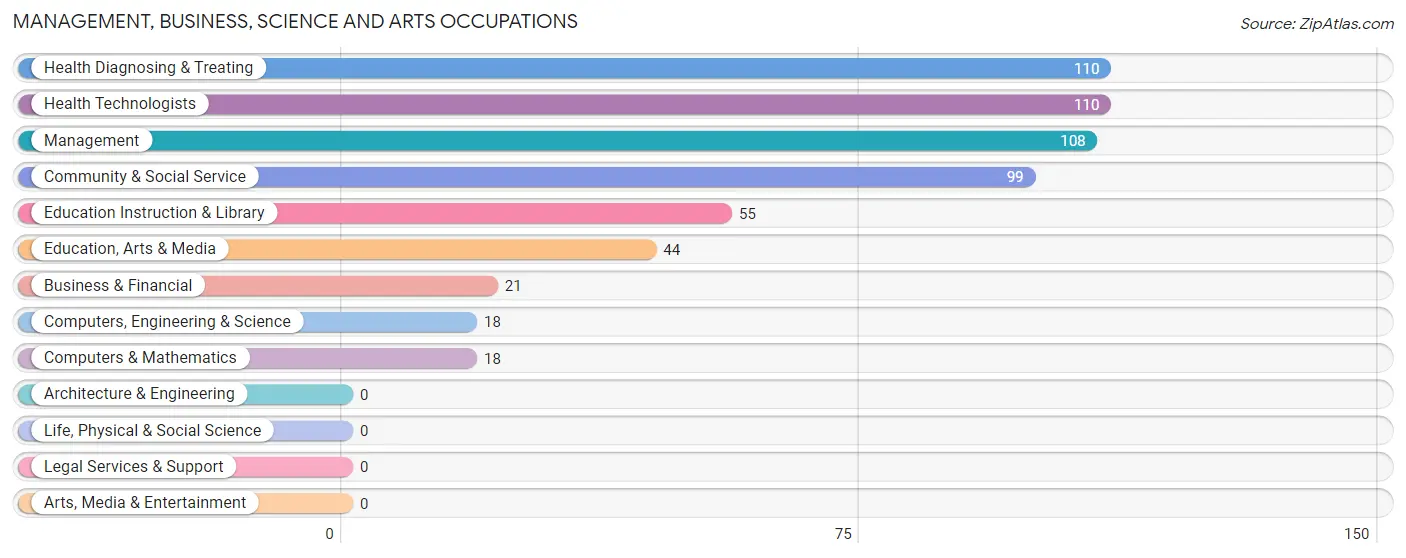
The most common Management, Business, Science and Arts occupations in Madison are Health Diagnosing & Treating (110 | 10.4%), Health Technologists (110 | 10.4%), Management (108 | 10.2%), Community & Social Service (99 | 9.3%), and Education Instruction & Library (55 | 5.2%).
Management, Business, Science and Arts Occupations by Sex
Within the Management, Business, Science and Arts occupations in Madison, the most male-oriented occupations are Business & Financial (100.0%), Community & Social Service (100.0%), and Education, Arts & Media (100.0%), while the most female-oriented occupations are Management (100.0%), Computers, Engineering & Science (100.0%), and Computers & Mathematics (100.0%).
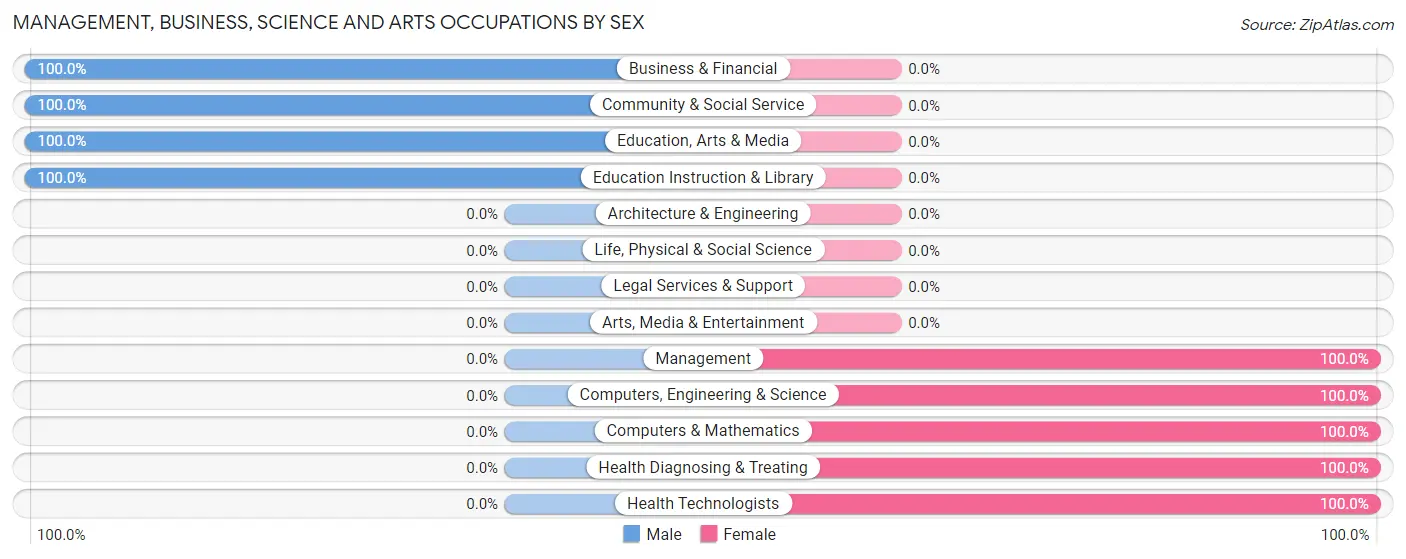
| Occupation | Male | Female |
| Management | 0 (0.0%) | 108 (100.0%) |
| Business & Financial | 21 (100.0%) | 0 (0.0%) |
| Computers, Engineering & Science | 0 (0.0%) | 18 (100.0%) |
| Computers & Mathematics | 0 (0.0%) | 18 (100.0%) |
| Architecture & Engineering | 0 (0.0%) | 0 (0.0%) |
| Life, Physical & Social Science | 0 (0.0%) | 0 (0.0%) |
| Community & Social Service | 99 (100.0%) | 0 (0.0%) |
| Education, Arts & Media | 44 (100.0%) | 0 (0.0%) |
| Legal Services & Support | 0 (0.0%) | 0 (0.0%) |
| Education Instruction & Library | 55 (100.0%) | 0 (0.0%) |
| Arts, Media & Entertainment | 0 (0.0%) | 0 (0.0%) |
| Health Diagnosing & Treating | 0 (0.0%) | 110 (100.0%) |
| Health Technologists | 0 (0.0%) | 110 (100.0%) |
| Total (Category) | 120 (33.7%) | 236 (66.3%) |
| Total (Overall) | 525 (49.5%) | 536 (50.5%) |
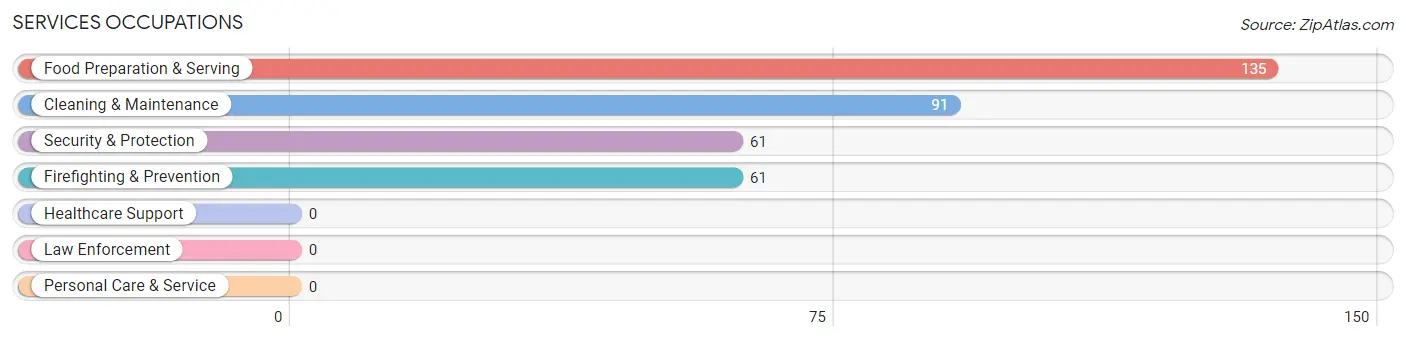
Services Occupations
The most common Services occupations in Madison are Food Preparation & Serving (135 | 12.7%), Cleaning & Maintenance (91 | 8.6%), Security & Protection (61 | 5.8%), and Firefighting & Prevention (61 | 5.8%).
Services Occupations by Sex
Within the Services occupations in Madison, the most male-oriented occupations are Security & Protection (100.0%), Firefighting & Prevention (100.0%), and Cleaning & Maintenance (74.7%), while the most female-oriented occupations are Food Preparation & Serving (100.0%), and Cleaning & Maintenance (25.3%).
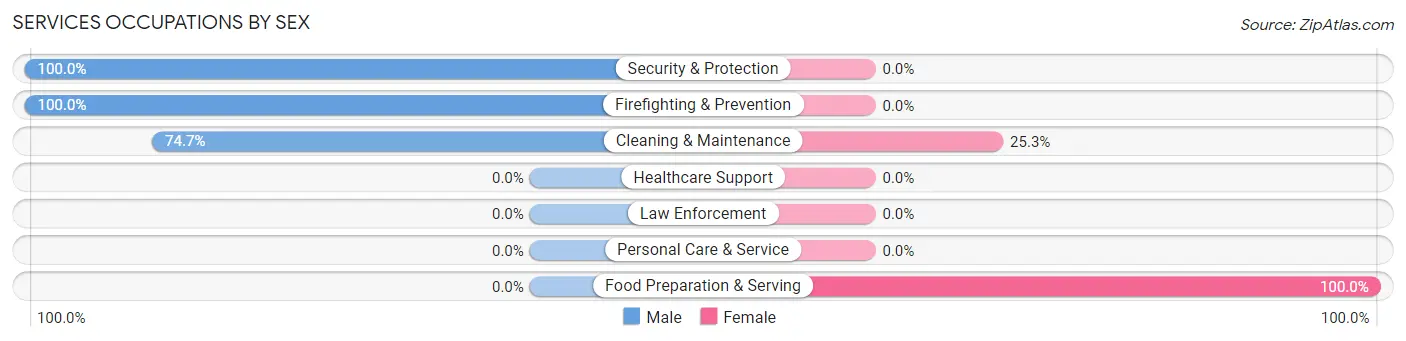
| Occupation | Male | Female |
| Healthcare Support | 0 (0.0%) | 0 (0.0%) |
| Security & Protection | 61 (100.0%) | 0 (0.0%) |
| Firefighting & Prevention | 61 (100.0%) | 0 (0.0%) |
| Law Enforcement | 0 (0.0%) | 0 (0.0%) |
| Food Preparation & Serving | 0 (0.0%) | 135 (100.0%) |
| Cleaning & Maintenance | 68 (74.7%) | 23 (25.3%) |
| Personal Care & Service | 0 (0.0%) | 0 (0.0%) |
| Total (Category) | 129 (45.0%) | 158 (55.0%) |
| Total (Overall) | 525 (49.5%) | 536 (50.5%) |
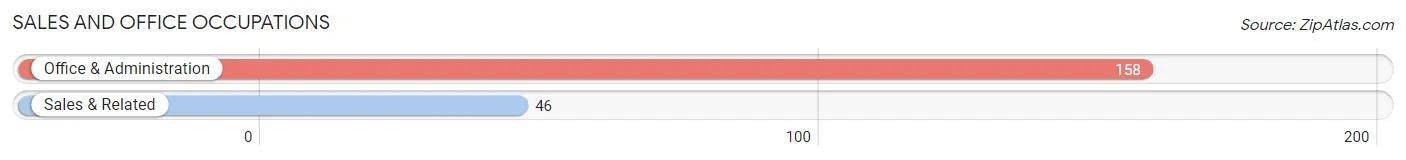
Sales and Office Occupations
The most common Sales and Office occupations in Madison are Office & Administration (158 | 14.9%), and Sales & Related (46 | 4.3%).
Sales and Office Occupations by Sex
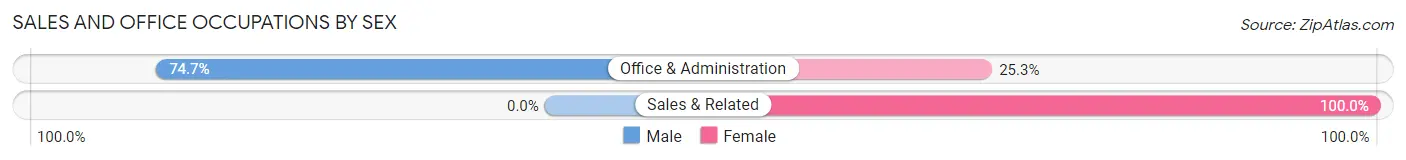
| Occupation | Male | Female |
| Sales & Related | 0 (0.0%) | 46 (100.0%) |
| Office & Administration | 118 (74.7%) | 40 (25.3%) |
| Total (Category) | 118 (57.8%) | 86 (42.2%) |
| Total (Overall) | 525 (49.5%) | 536 (50.5%) |
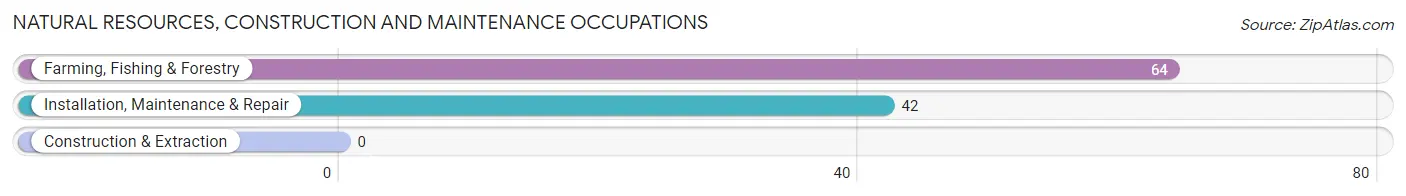
Natural Resources, Construction and Maintenance Occupations
The most common Natural Resources, Construction and Maintenance occupations in Madison are Farming, Fishing & Forestry (64 | 6.0%), and Installation, Maintenance & Repair (42 | 4.0%).
Natural Resources, Construction and Maintenance Occupations by Sex
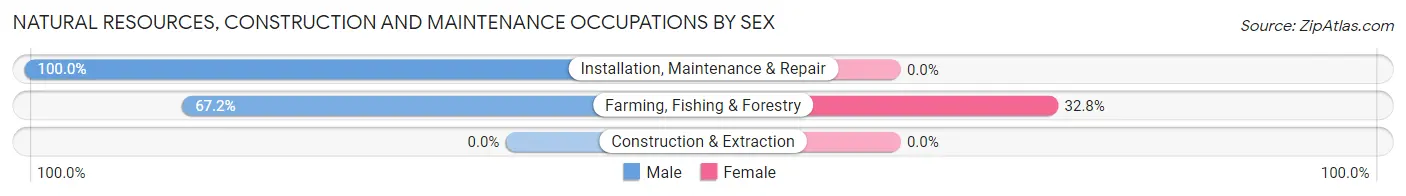
| Occupation | Male | Female |
| Farming, Fishing & Forestry | 43 (67.2%) | 21 (32.8%) |
| Construction & Extraction | 0 (0.0%) | 0 (0.0%) |
| Installation, Maintenance & Repair | 42 (100.0%) | 0 (0.0%) |
| Total (Category) | 85 (80.2%) | 21 (19.8%) |
| Total (Overall) | 525 (49.5%) | 536 (50.5%) |
Production, Transportation and Moving Occupations
The most common Production, Transportation and Moving occupations in Madison are Material Moving (88 | 8.3%), and Production (20 | 1.9%).
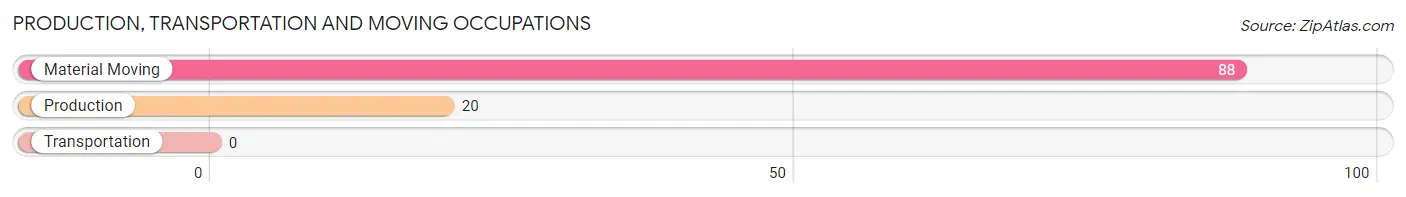
Production, Transportation and Moving Occupations by Sex
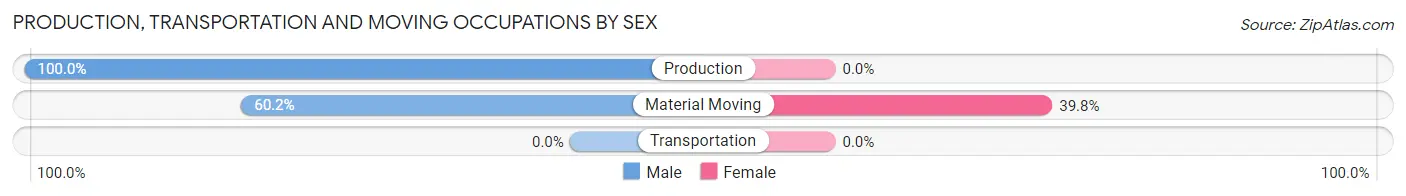
| Occupation | Male | Female |
| Production | 20 (100.0%) | 0 (0.0%) |
| Transportation | 0 (0.0%) | 0 (0.0%) |
| Material Moving | 53 (60.2%) | 35 (39.8%) |
| Total (Category) | 73 (67.6%) | 35 (32.4%) |
| Total (Overall) | 525 (49.5%) | 536 (50.5%) |
Employment Industries by Sex in Madison
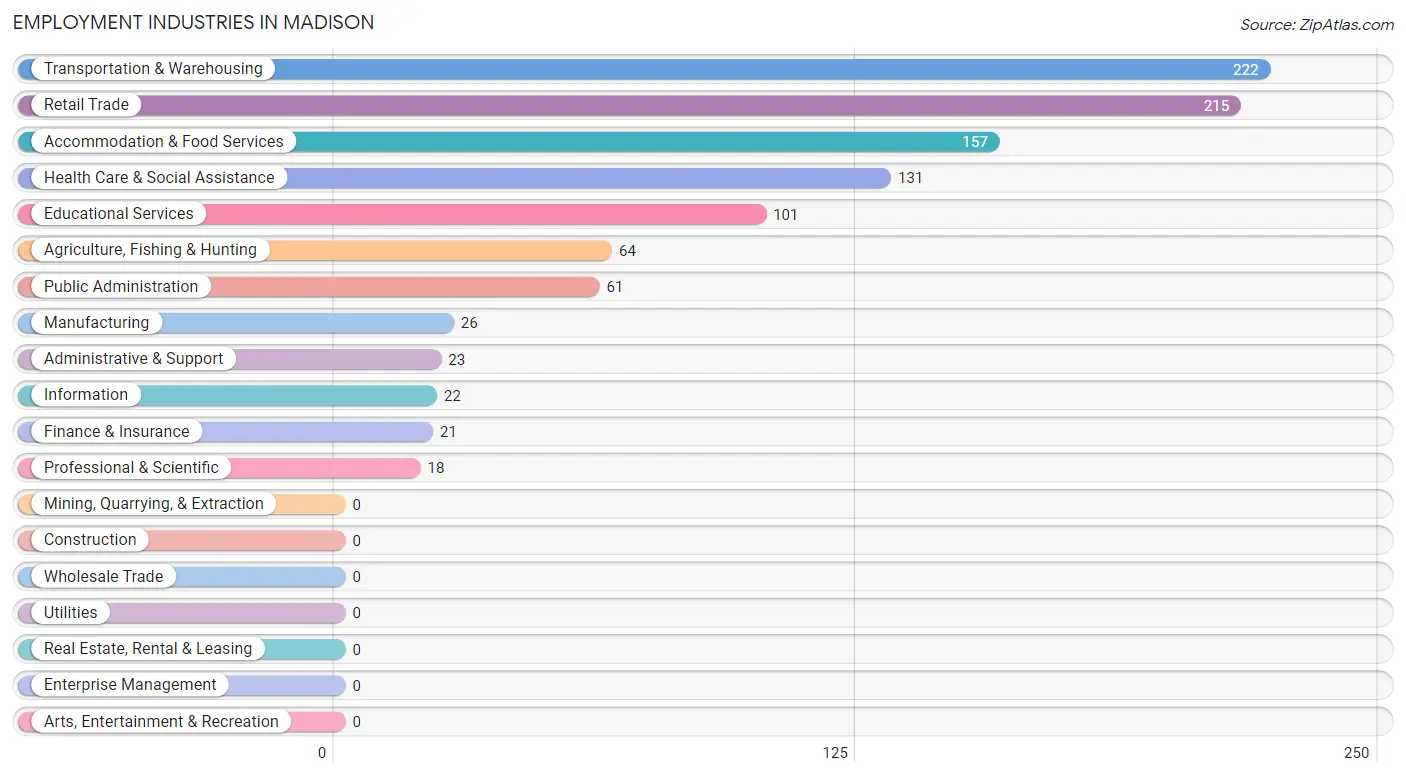
Employment Industries in Madison
The major employment industries in Madison include Transportation & Warehousing (222 | 20.9%), Retail Trade (215 | 20.3%), Accommodation & Food Services (157 | 14.8%), Health Care & Social Assistance (131 | 12.3%), and Educational Services (101 | 9.5%).
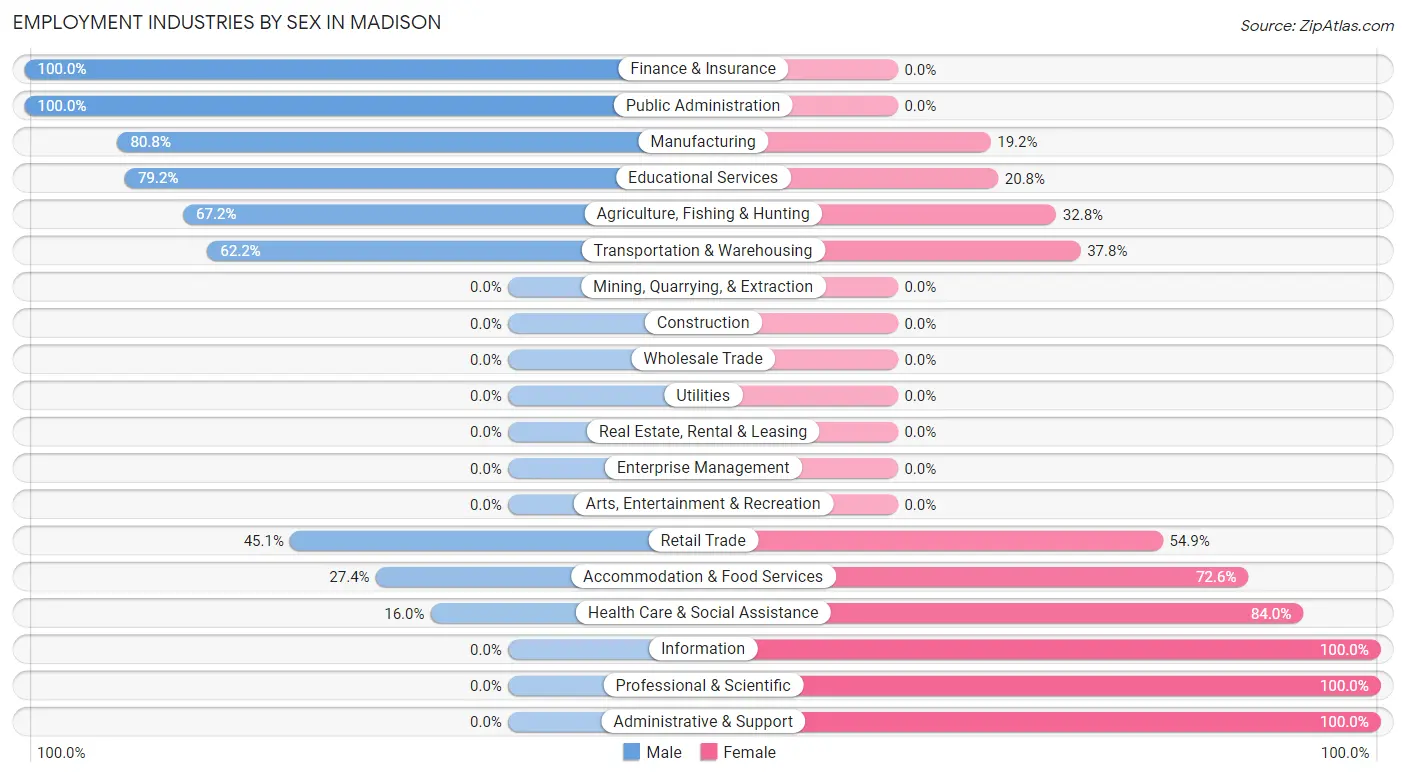
Employment Industries by Sex in Madison
The Madison industries that see more men than women are Finance & Insurance (100.0%), Public Administration (100.0%), and Manufacturing (80.8%), whereas the industries that tend to have a higher number of women are Information (100.0%), Professional & Scientific (100.0%), and Administrative & Support (100.0%).
| Industry | Male | Female |
| Agriculture, Fishing & Hunting | 43 (67.2%) | 21 (32.8%) |
| Mining, Quarrying, & Extraction | 0 (0.0%) | 0 (0.0%) |
| Construction | 0 (0.0%) | 0 (0.0%) |
| Manufacturing | 21 (80.8%) | 5 (19.2%) |
| Wholesale Trade | 0 (0.0%) | 0 (0.0%) |
| Retail Trade | 97 (45.1%) | 118 (54.9%) |
| Transportation & Warehousing | 138 (62.2%) | 84 (37.8%) |
| Utilities | 0 (0.0%) | 0 (0.0%) |
| Information | 0 (0.0%) | 22 (100.0%) |
| Finance & Insurance | 21 (100.0%) | 0 (0.0%) |
| Real Estate, Rental & Leasing | 0 (0.0%) | 0 (0.0%) |
| Professional & Scientific | 0 (0.0%) | 18 (100.0%) |
| Enterprise Management | 0 (0.0%) | 0 (0.0%) |
| Administrative & Support | 0 (0.0%) | 23 (100.0%) |
| Educational Services | 80 (79.2%) | 21 (20.8%) |
| Health Care & Social Assistance | 21 (16.0%) | 110 (84.0%) |
| Arts, Entertainment & Recreation | 0 (0.0%) | 0 (0.0%) |
| Accommodation & Food Services | 43 (27.4%) | 114 (72.6%) |
| Public Administration | 61 (100.0%) | 0 (0.0%) |
| Total | 525 (49.5%) | 536 (50.5%) |
Education in Madison
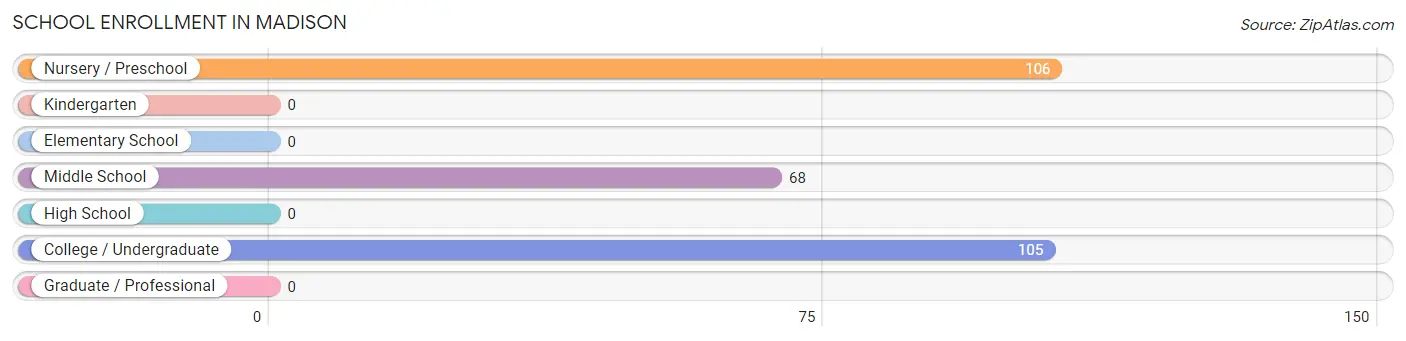
School Enrollment in Madison
The most common levels of schooling among the 279 students in Madison are nursery / preschool (106 | 38.0%), college / undergraduate (105 | 37.6%), and middle school (68 | 24.4%).
| School Level | # Students | % Students |
| Nursery / Preschool | 106 | 38.0% |
| Kindergarten | 0 | 0.0% |
| Elementary School | 0 | 0.0% |
| Middle School | 68 | 24.4% |
| High School | 0 | 0.0% |
| College / Undergraduate | 105 | 37.6% |
| Graduate / Professional | 0 | 0.0% |
| Total | 279 | 100.0% |
School Enrollment by Age by Funding Source in Madison
Out of a total of 279 students who are enrolled in schools in Madison, 34 (12.2%) attend a private institution, while the remaining 245 (87.8%) are enrolled in public schools. The age group of 3 to 4 year olds has the highest likelihood of being enrolled in private schools, with 34 (100.0% in the age bracket) enrolled. Conversely, the age group of 5 to 9 year old has the lowest likelihood of being enrolled in a private school, with 72 (100.0% in the age bracket) attending a public institution.
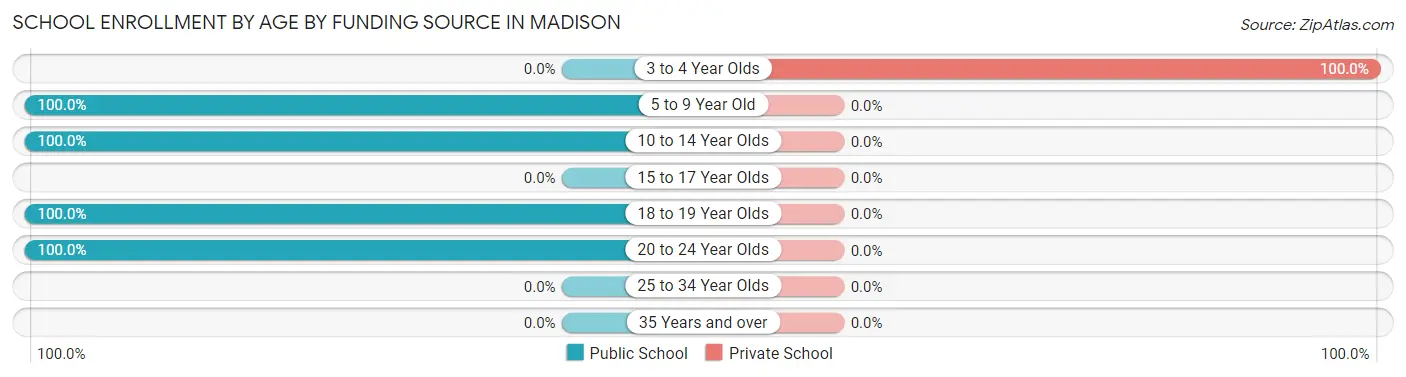
| Age Bracket | Public School | Private School |
| 3 to 4 Year Olds | 0 (0.0%) | 34 (100.0%) |
| 5 to 9 Year Old | 72 (100.0%) | 0 (0.0%) |
| 10 to 14 Year Olds | 68 (100.0%) | 0 (0.0%) |
| 15 to 17 Year Olds | 0 (0.0%) | 0 (0.0%) |
| 18 to 19 Year Olds | 21 (100.0%) | 0 (0.0%) |
| 20 to 24 Year Olds | 84 (100.0%) | 0 (0.0%) |
| 25 to 34 Year Olds | 0 (0.0%) | 0 (0.0%) |
| 35 Years and over | 0 (0.0%) | 0 (0.0%) |
| Total | 245 (87.8%) | 34 (12.2%) |
Educational Attainment by Field of Study in Madison
Science & technology (132 | 51.2%), arts & humanities (61 | 23.6%), education (26 | 10.1%), business (21 | 8.1%), and computers & mathematics (18 | 7.0%) are the most common fields of study among 258 individuals in Madison who have obtained a bachelor's degree or higher.
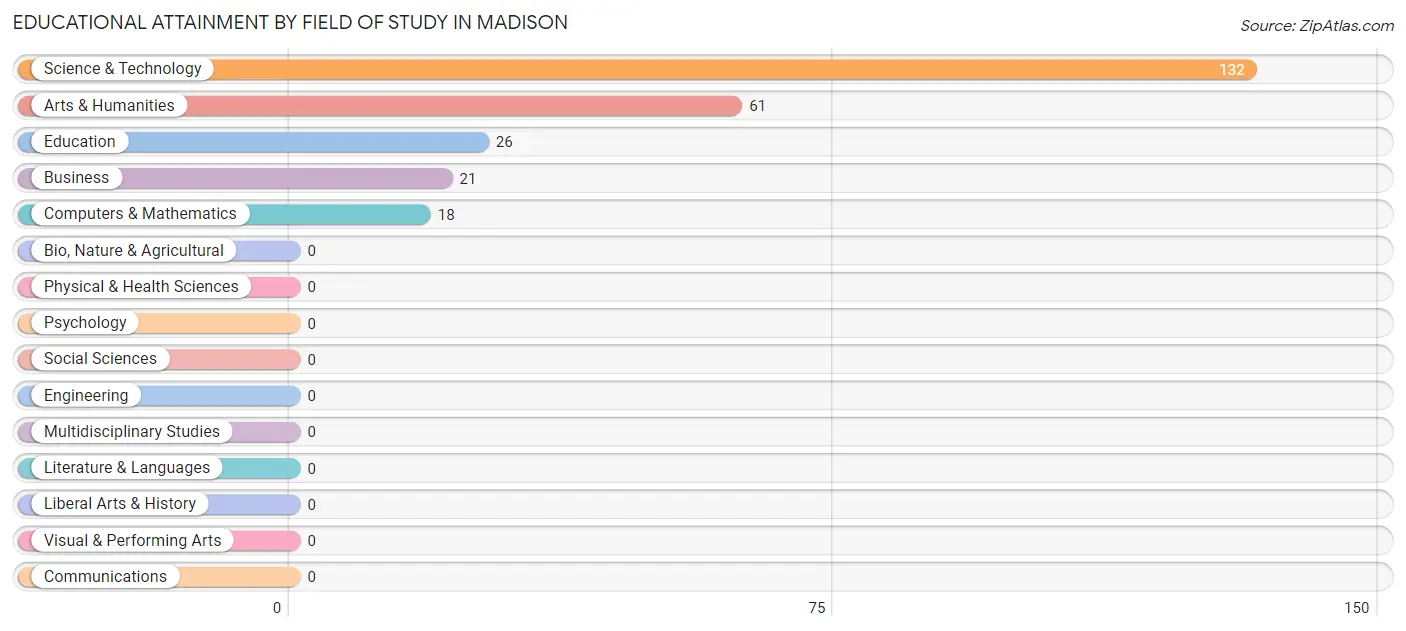
| Field of Study | # Graduates | % Graduates |
| Computers & Mathematics | 18 | 7.0% |
| Bio, Nature & Agricultural | 0 | 0.0% |
| Physical & Health Sciences | 0 | 0.0% |
| Psychology | 0 | 0.0% |
| Social Sciences | 0 | 0.0% |
| Engineering | 0 | 0.0% |
| Multidisciplinary Studies | 0 | 0.0% |
| Science & Technology | 132 | 51.2% |
| Business | 21 | 8.1% |
| Education | 26 | 10.1% |
| Literature & Languages | 0 | 0.0% |
| Liberal Arts & History | 0 | 0.0% |
| Visual & Performing Arts | 0 | 0.0% |
| Communications | 0 | 0.0% |
| Arts & Humanities | 61 | 23.6% |
| Total | 258 | 100.0% |
Transportation & Commute in Madison
Vehicle Availability by Sex in Madison
The most prevalent vehicle ownership categories in Madison are males with 2 vehicles (221, accounting for 43.9%) and females with 2 vehicles (287, making up 41.2%).
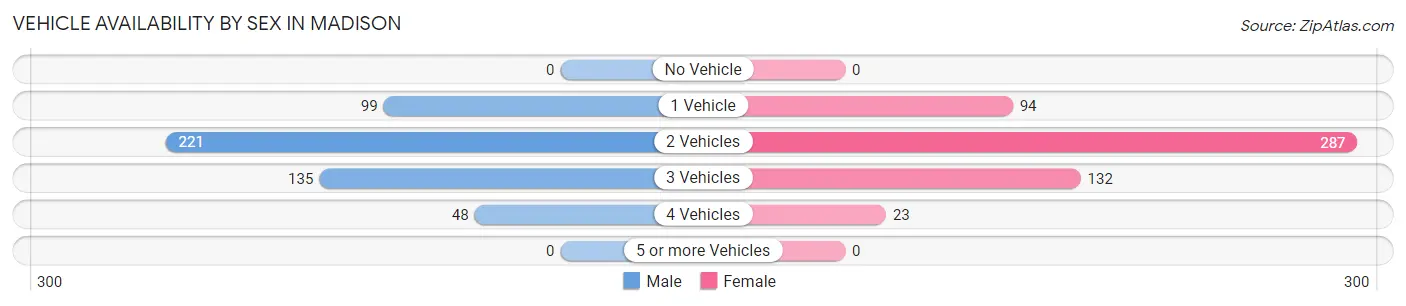
| Vehicles Available | Male | Female |
| No Vehicle | 0 (0.0%) | 0 (0.0%) |
| 1 Vehicle | 99 (19.7%) | 94 (17.5%) |
| 2 Vehicles | 221 (43.9%) | 287 (53.5%) |
| 3 Vehicles | 135 (26.8%) | 132 (24.6%) |
| 4 Vehicles | 48 (9.5%) | 23 (4.3%) |
| 5 or more Vehicles | 0 (0.0%) | 0 (0.0%) |
| Total | 503 (100.0%) | 536 (100.0%) |
Commute Time in Madison
The most frequently occuring commute durations in Madison are 45 to 59 minutes (205 commuters, 27.0%), less than 5 minutes (134 commuters, 17.6%), and 30 to 34 minutes (68 commuters, 8.9%).
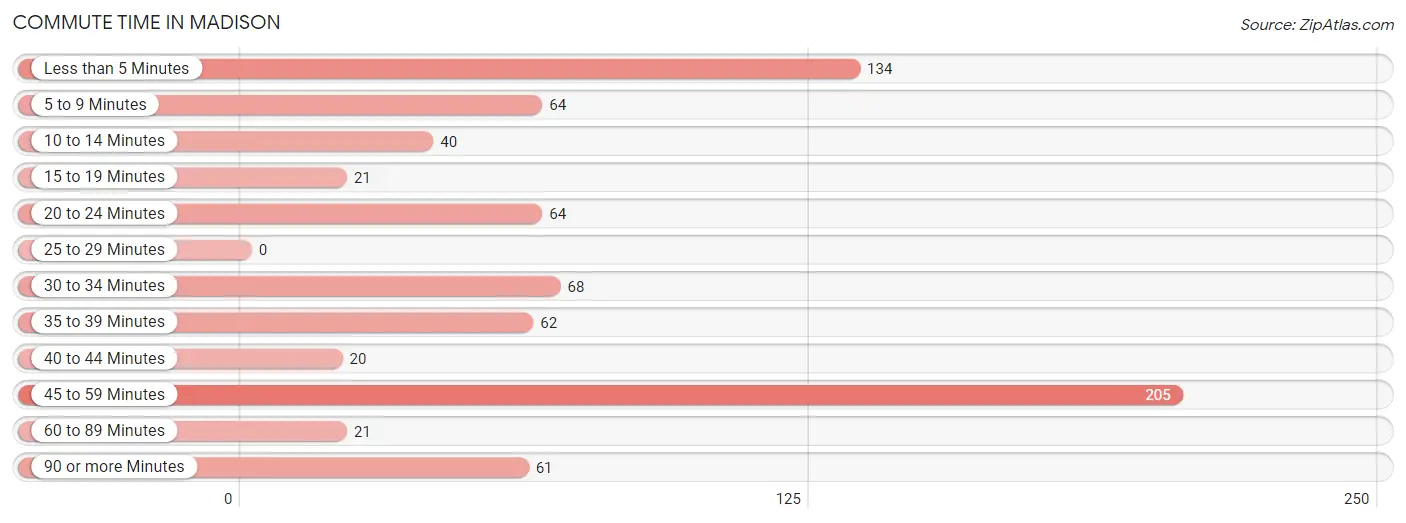
| Commute Time | # Commuters | % Commuters |
| Less than 5 Minutes | 134 | 17.6% |
| 5 to 9 Minutes | 64 | 8.4% |
| 10 to 14 Minutes | 40 | 5.3% |
| 15 to 19 Minutes | 21 | 2.8% |
| 20 to 24 Minutes | 64 | 8.4% |
| 25 to 29 Minutes | 0 | 0.0% |
| 30 to 34 Minutes | 68 | 8.9% |
| 35 to 39 Minutes | 62 | 8.2% |
| 40 to 44 Minutes | 20 | 2.6% |
| 45 to 59 Minutes | 205 | 27.0% |
| 60 to 89 Minutes | 21 | 2.8% |
| 90 or more Minutes | 61 | 8.0% |
Commute Time by Sex in Madison
The most common commute times in Madison are 20 to 24 minutes (64 commuters, 17.7%) for males and 45 to 59 minutes (163 commuters, 40.9%) for females.
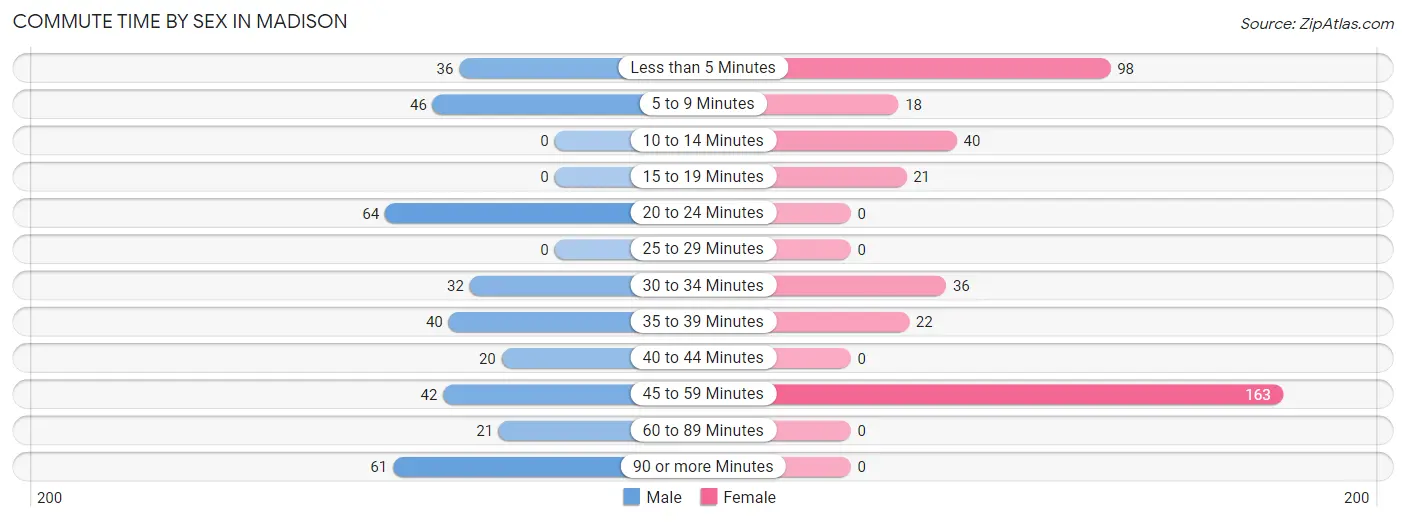
| Commute Time | Male | Female |
| Less than 5 Minutes | 36 (9.9%) | 98 (24.6%) |
| 5 to 9 Minutes | 46 (12.7%) | 18 (4.5%) |
| 10 to 14 Minutes | 0 (0.0%) | 40 (10.1%) |
| 15 to 19 Minutes | 0 (0.0%) | 21 (5.3%) |
| 20 to 24 Minutes | 64 (17.7%) | 0 (0.0%) |
| 25 to 29 Minutes | 0 (0.0%) | 0 (0.0%) |
| 30 to 34 Minutes | 32 (8.8%) | 36 (9.0%) |
| 35 to 39 Minutes | 40 (11.1%) | 22 (5.5%) |
| 40 to 44 Minutes | 20 (5.5%) | 0 (0.0%) |
| 45 to 59 Minutes | 42 (11.6%) | 163 (40.9%) |
| 60 to 89 Minutes | 21 (5.8%) | 0 (0.0%) |
| 90 or more Minutes | 61 (16.9%) | 0 (0.0%) |
Time of Departure to Work by Sex in Madison
The most frequent times of departure to work in Madison are 6:00 AM to 6:29 AM (114, 31.5%) for males and 12:00 AM to 4:59 AM (119, 29.9%) for females.
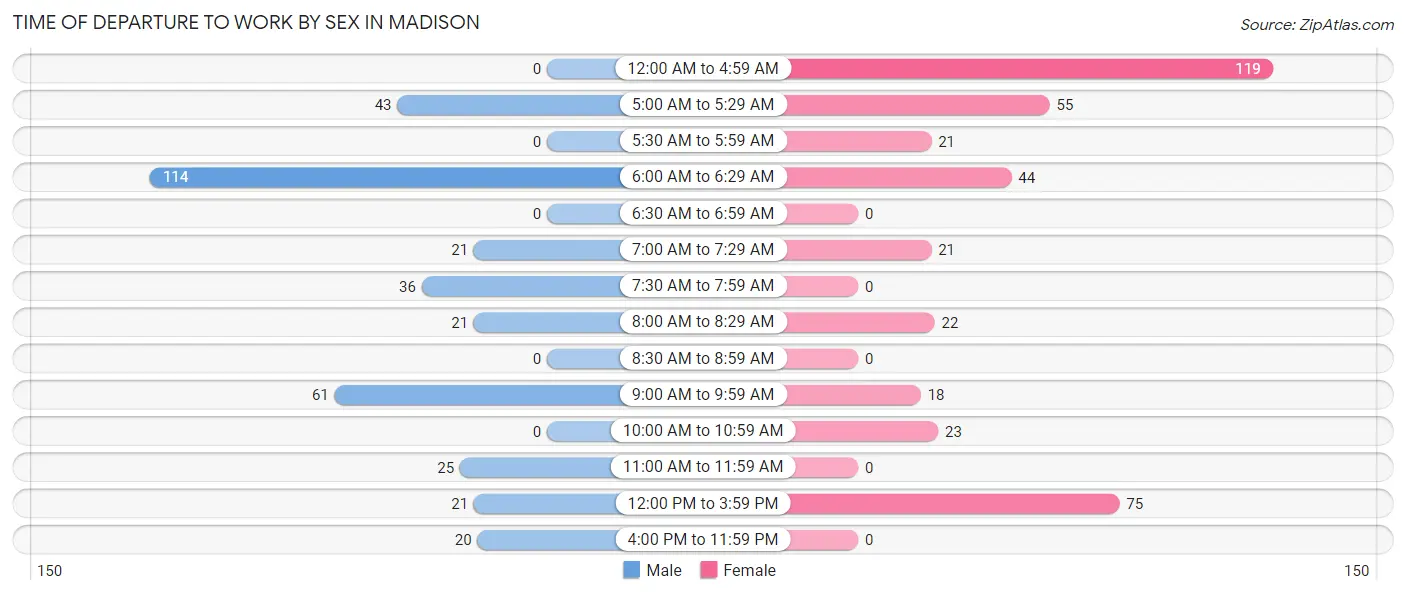
| Time of Departure | Male | Female |
| 12:00 AM to 4:59 AM | 0 (0.0%) | 119 (29.9%) |
| 5:00 AM to 5:29 AM | 43 (11.9%) | 55 (13.8%) |
| 5:30 AM to 5:59 AM | 0 (0.0%) | 21 (5.3%) |
| 6:00 AM to 6:29 AM | 114 (31.5%) | 44 (11.1%) |
| 6:30 AM to 6:59 AM | 0 (0.0%) | 0 (0.0%) |
| 7:00 AM to 7:29 AM | 21 (5.8%) | 21 (5.3%) |
| 7:30 AM to 7:59 AM | 36 (9.9%) | 0 (0.0%) |
| 8:00 AM to 8:29 AM | 21 (5.8%) | 22 (5.5%) |
| 8:30 AM to 8:59 AM | 0 (0.0%) | 0 (0.0%) |
| 9:00 AM to 9:59 AM | 61 (16.9%) | 18 (4.5%) |
| 10:00 AM to 10:59 AM | 0 (0.0%) | 23 (5.8%) |
| 11:00 AM to 11:59 AM | 25 (6.9%) | 0 (0.0%) |
| 12:00 PM to 3:59 PM | 21 (5.8%) | 75 (18.8%) |
| 4:00 PM to 11:59 PM | 20 (5.5%) | 0 (0.0%) |
| Total | 362 (100.0%) | 398 (100.0%) |
Housing Occupancy in Madison
Occupancy by Ownership in Madison
Of the total 1,004 dwellings in Madison, owner-occupied units account for 461 (45.9%), while renter-occupied units make up 543 (54.1%).
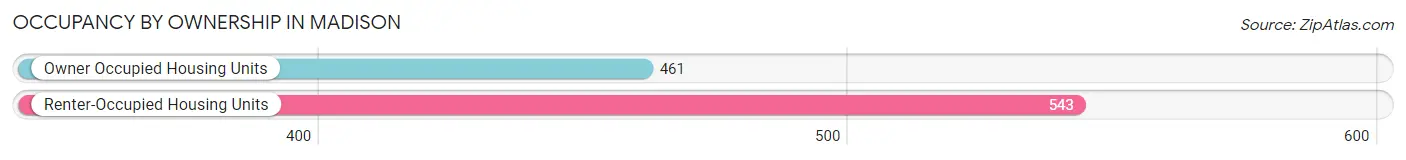
| Occupancy | # Housing Units | % Housing Units |
| Owner Occupied Housing Units | 461 | 45.9% |
| Renter-Occupied Housing Units | 543 | 54.1% |
| Total Occupied Housing Units | 1,004 | 100.0% |
Occupancy by Household Size in Madison
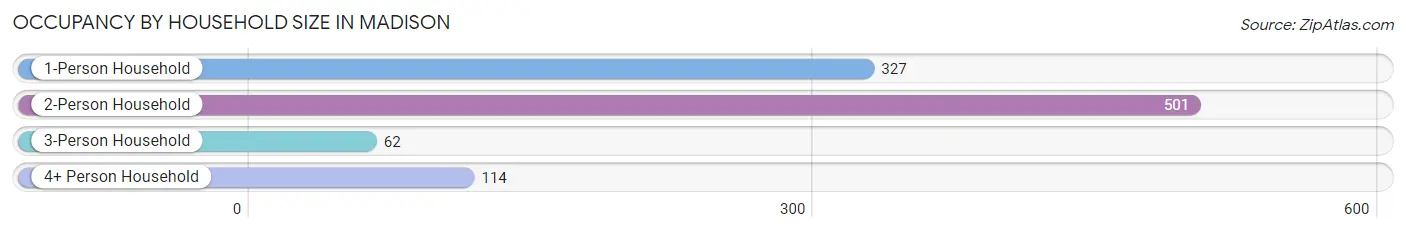
| Household Size | # Housing Units | % Housing Units |
| 1-Person Household | 327 | 32.6% |
| 2-Person Household | 501 | 49.9% |
| 3-Person Household | 62 | 6.2% |
| 4+ Person Household | 114 | 11.4% |
| Total Housing Units | 1,004 | 100.0% |
Occupancy by Ownership by Household Size in Madison
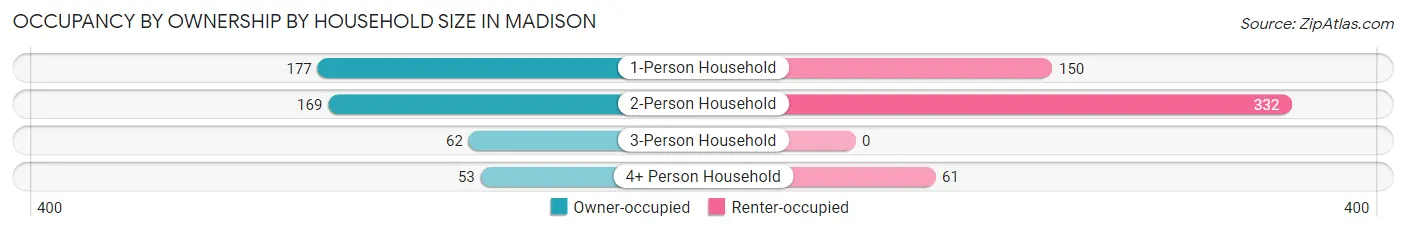
| Household Size | Owner-occupied | Renter-occupied |
| 1-Person Household | 177 (54.1%) | 150 (45.9%) |
| 2-Person Household | 169 (33.7%) | 332 (66.3%) |
| 3-Person Household | 62 (100.0%) | 0 (0.0%) |
| 4+ Person Household | 53 (46.5%) | 61 (53.5%) |
| Total Housing Units | 461 (45.9%) | 543 (54.1%) |
Occupancy by Educational Attainment in Madison
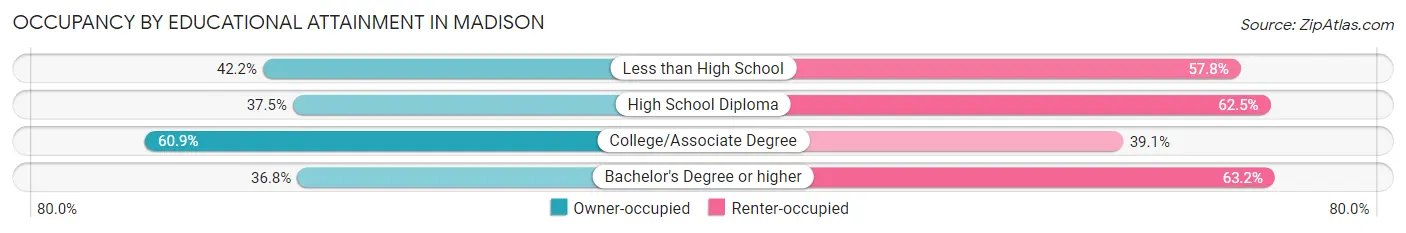
| Household Size | Owner-occupied | Renter-occupied |
| Less than High School | 19 (42.2%) | 26 (57.8%) |
| High School Diploma | 160 (37.5%) | 267 (62.5%) |
| College/Associate Degree | 218 (60.9%) | 140 (39.1%) |
| Bachelor's Degree or higher | 64 (36.8%) | 110 (63.2%) |
Occupancy by Age of Householder in Madison
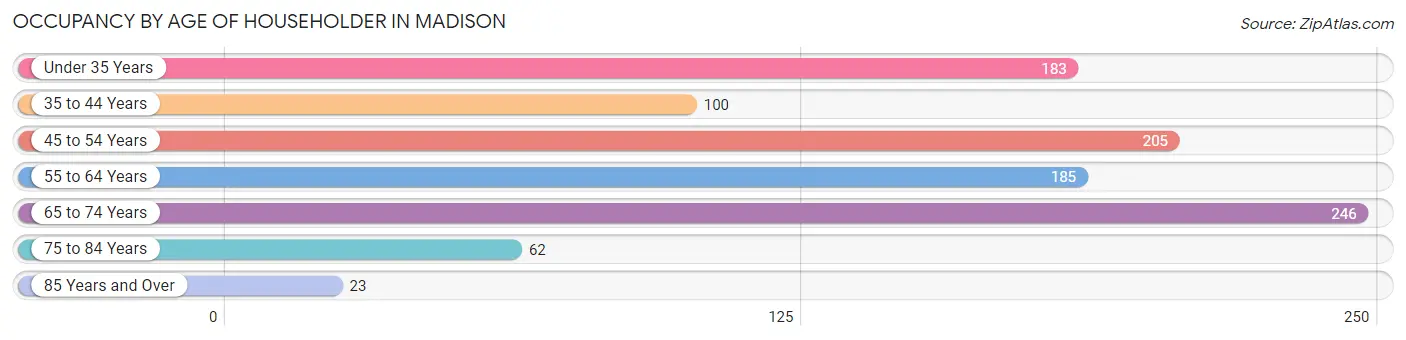
| Age Bracket | # Households | % Households |
| Under 35 Years | 183 | 18.2% |
| 35 to 44 Years | 100 | 10.0% |
| 45 to 54 Years | 205 | 20.4% |
| 55 to 64 Years | 185 | 18.4% |
| 65 to 74 Years | 246 | 24.5% |
| 75 to 84 Years | 62 | 6.2% |
| 85 Years and Over | 23 | 2.3% |
| Total | 1,004 | 100.0% |
Housing Finances in Madison
Median Income by Occupancy in Madison
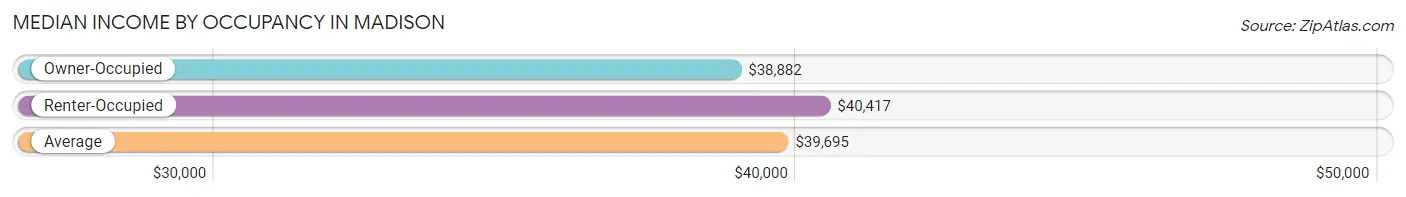
| Occupancy Type | # Households | Median Income |
| Owner-Occupied | 461 (45.9%) | $38,882 |
| Renter-Occupied | 543 (54.1%) | $40,417 |
| Average | 1,004 (100.0%) | $39,695 |
Occupancy by Householder Income Bracket in Madison
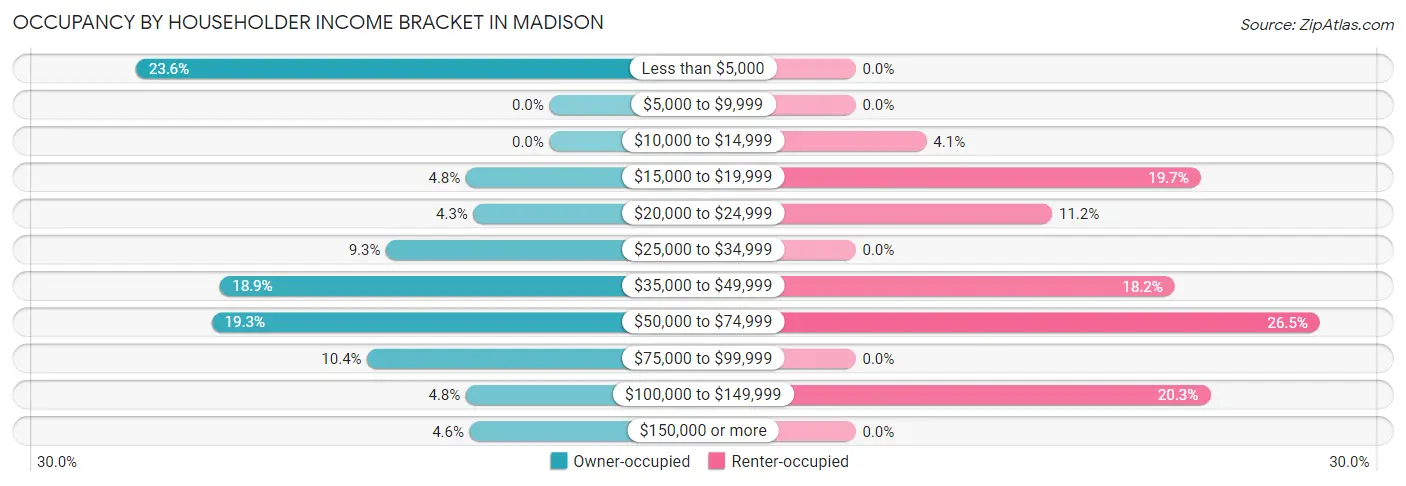
| Income Bracket | Owner-occupied | Renter-occupied |
| Less than $5,000 | 109 (23.6%) | 0 (0.0%) |
| $5,000 to $9,999 | 0 (0.0%) | 0 (0.0%) |
| $10,000 to $14,999 | 0 (0.0%) | 22 (4.1%) |
| $15,000 to $19,999 | 22 (4.8%) | 107 (19.7%) |
| $20,000 to $24,999 | 20 (4.3%) | 61 (11.2%) |
| $25,000 to $34,999 | 43 (9.3%) | 0 (0.0%) |
| $35,000 to $49,999 | 87 (18.9%) | 99 (18.2%) |
| $50,000 to $74,999 | 89 (19.3%) | 144 (26.5%) |
| $75,000 to $99,999 | 48 (10.4%) | 0 (0.0%) |
| $100,000 to $149,999 | 22 (4.8%) | 110 (20.3%) |
| $150,000 or more | 21 (4.6%) | 0 (0.0%) |
| Total | 461 (100.0%) | 543 (100.0%) |
Monthly Housing Cost Tiers in Madison

| Monthly Cost | Owner-occupied | Renter-occupied |
| Less than $300 | 0 (0.0%) | 22 (4.1%) |
| $300 to $499 | 114 (24.7%) | 84 (15.5%) |
| $500 to $799 | 235 (51.0%) | 39 (7.2%) |
| $800 to $999 | 22 (4.8%) | 143 (26.3%) |
| $1,000 to $1,499 | 44 (9.5%) | 145 (26.7%) |
| $1,500 to $1,999 | 25 (5.4%) | 110 (20.3%) |
| $2,000 to $2,499 | 0 (0.0%) | 0 (0.0%) |
| $2,500 to $2,999 | 21 (4.6%) | 0 (0.0%) |
| $3,000 or more | 0 (0.0%) | 0 (0.0%) |
| Total | 461 (100.0%) | 543 (100.0%) |
Physical Housing Characteristics in Madison
Housing Structures in Madison
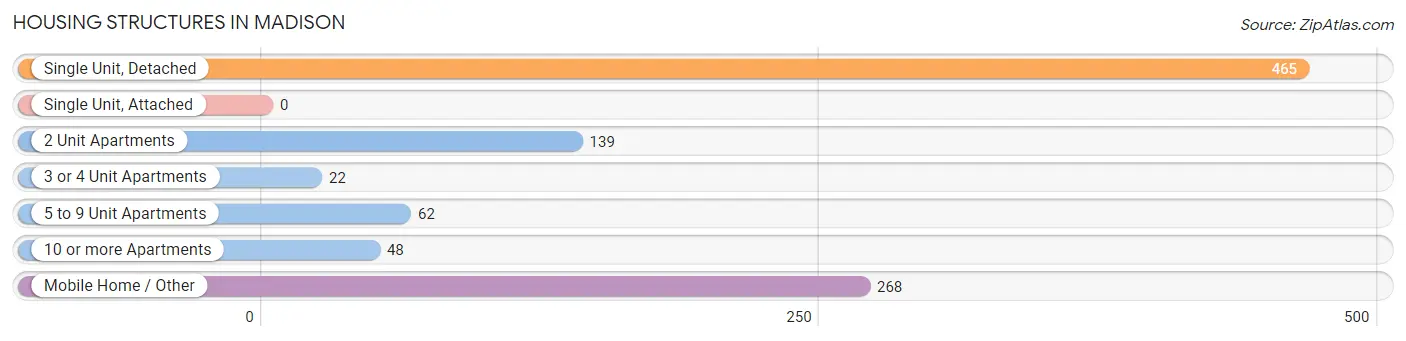
| Structure Type | # Housing Units | % Housing Units |
| Single Unit, Detached | 465 | 46.3% |
| Single Unit, Attached | 0 | 0.0% |
| 2 Unit Apartments | 139 | 13.8% |
| 3 or 4 Unit Apartments | 22 | 2.2% |
| 5 to 9 Unit Apartments | 62 | 6.2% |
| 10 or more Apartments | 48 | 4.8% |
| Mobile Home / Other | 268 | 26.7% |
| Total | 1,004 | 100.0% |
Housing Structures by Occupancy in Madison
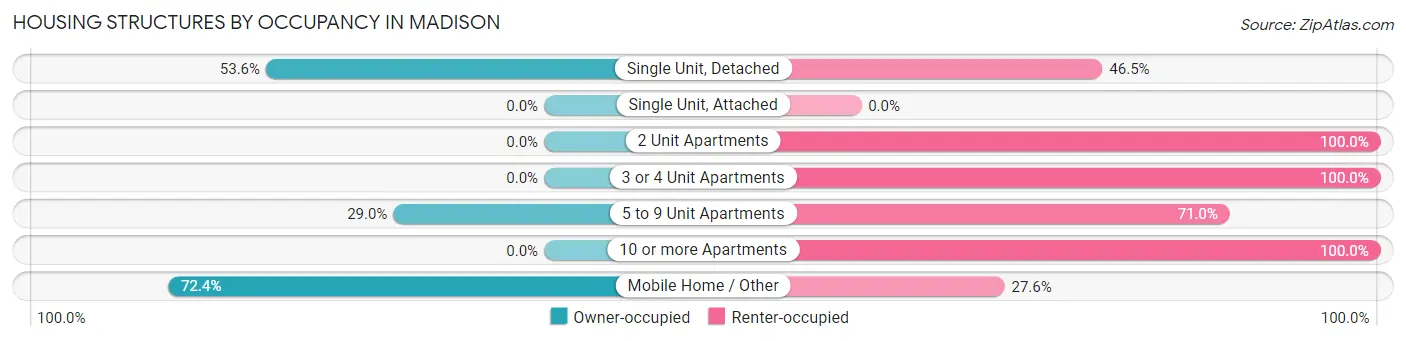
| Structure Type | Owner-occupied | Renter-occupied |
| Single Unit, Detached | 249 (53.5%) | 216 (46.5%) |
| Single Unit, Attached | 0 (0.0%) | 0 (0.0%) |
| 2 Unit Apartments | 0 (0.0%) | 139 (100.0%) |
| 3 or 4 Unit Apartments | 0 (0.0%) | 22 (100.0%) |
| 5 to 9 Unit Apartments | 18 (29.0%) | 44 (71.0%) |
| 10 or more Apartments | 0 (0.0%) | 48 (100.0%) |
| Mobile Home / Other | 194 (72.4%) | 74 (27.6%) |
| Total | 461 (45.9%) | 543 (54.1%) |
Housing Structures by Number of Rooms in Madison
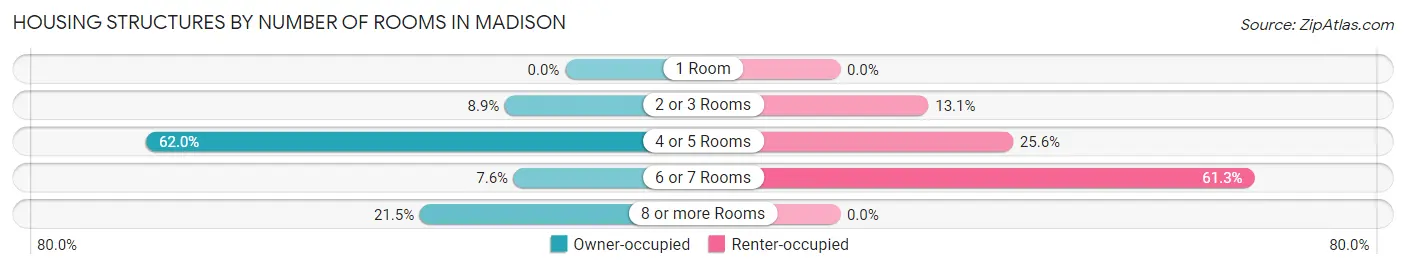
| Number of Rooms | Owner-occupied | Renter-occupied |
| 1 Room | 0 (0.0%) | 0 (0.0%) |
| 2 or 3 Rooms | 41 (8.9%) | 71 (13.1%) |
| 4 or 5 Rooms | 286 (62.0%) | 139 (25.6%) |
| 6 or 7 Rooms | 35 (7.6%) | 333 (61.3%) |
| 8 or more Rooms | 99 (21.5%) | 0 (0.0%) |
| Total | 461 (100.0%) | 543 (100.0%) |
Housing Structure by Heating Type in Madison
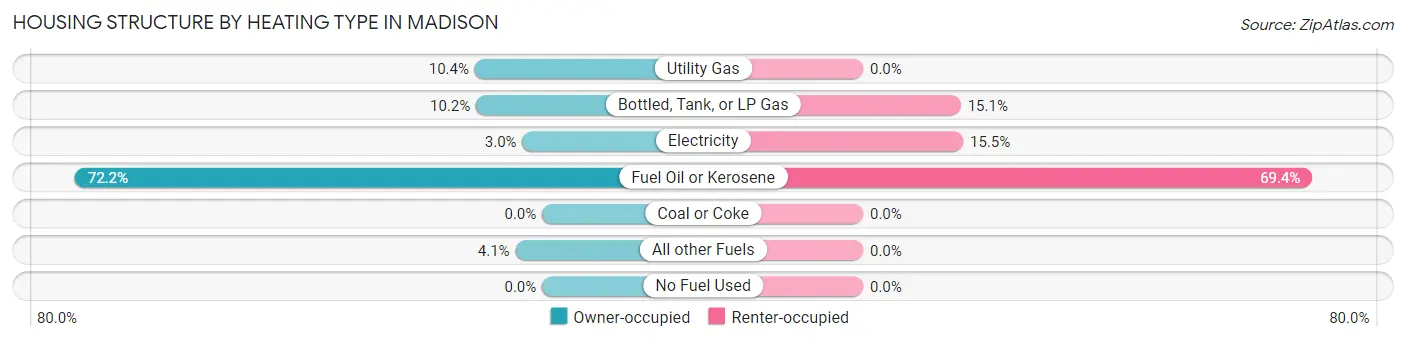
| Heating Type | Owner-occupied | Renter-occupied |
| Utility Gas | 48 (10.4%) | 0 (0.0%) |
| Bottled, Tank, or LP Gas | 47 (10.2%) | 82 (15.1%) |
| Electricity | 14 (3.0%) | 84 (15.5%) |
| Fuel Oil or Kerosene | 333 (72.2%) | 377 (69.4%) |
| Coal or Coke | 0 (0.0%) | 0 (0.0%) |
| All other Fuels | 19 (4.1%) | 0 (0.0%) |
| No Fuel Used | 0 (0.0%) | 0 (0.0%) |
| Total | 461 (100.0%) | 543 (100.0%) |
Household Vehicle Usage in Madison
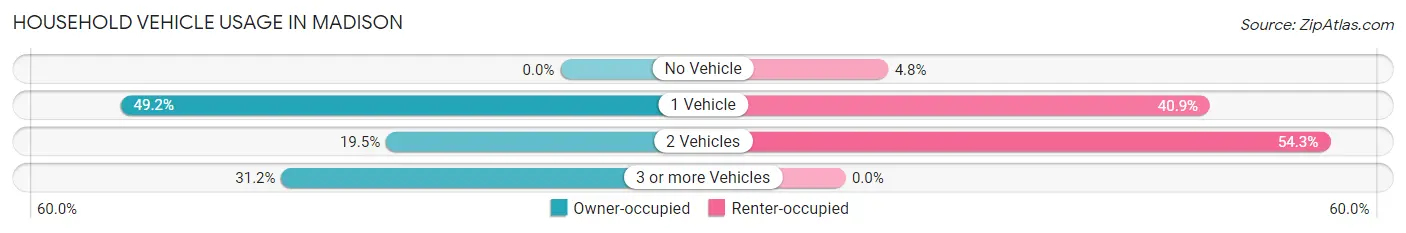
| Vehicles per Household | Owner-occupied | Renter-occupied |
| No Vehicle | 0 (0.0%) | 26 (4.8%) |
| 1 Vehicle | 227 (49.2%) | 222 (40.9%) |
| 2 Vehicles | 90 (19.5%) | 295 (54.3%) |
| 3 or more Vehicles | 144 (31.2%) | 0 (0.0%) |
| Total | 461 (100.0%) | 543 (100.0%) |
Real Estate & Mortgages in Madison
Real Estate and Mortgage Overview in Madison
| Characteristic | Without Mortgage | With Mortgage |
| Housing Units | 215 | 246 |
| Median Property Value | $111,500 | $0 |
| Median Household Income | $47,440 | $21 |
| Monthly Housing Costs | $484 | $0 |
| Real Estate Taxes | $1,824 | $0 |
Property Value by Mortgage Status in Madison
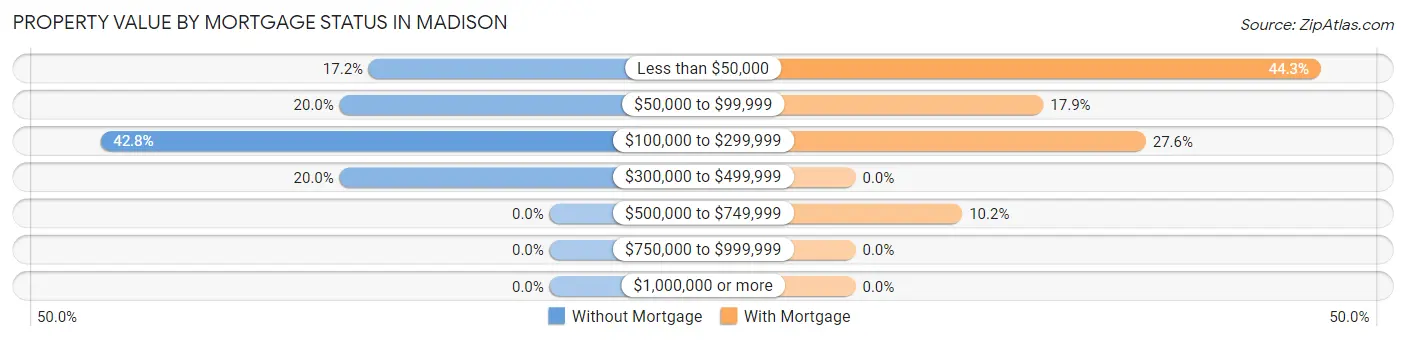
| Property Value | Without Mortgage | With Mortgage |
| Less than $50,000 | 37 (17.2%) | 109 (44.3%) |
| $50,000 to $99,999 | 43 (20.0%) | 44 (17.9%) |
| $100,000 to $299,999 | 92 (42.8%) | 68 (27.6%) |
| $300,000 to $499,999 | 43 (20.0%) | 0 (0.0%) |
| $500,000 to $749,999 | 0 (0.0%) | 25 (10.2%) |
| $750,000 to $999,999 | 0 (0.0%) | 0 (0.0%) |
| $1,000,000 or more | 0 (0.0%) | 0 (0.0%) |
| Total | 215 (100.0%) | 246 (100.0%) |
Household Income by Mortgage Status in Madison
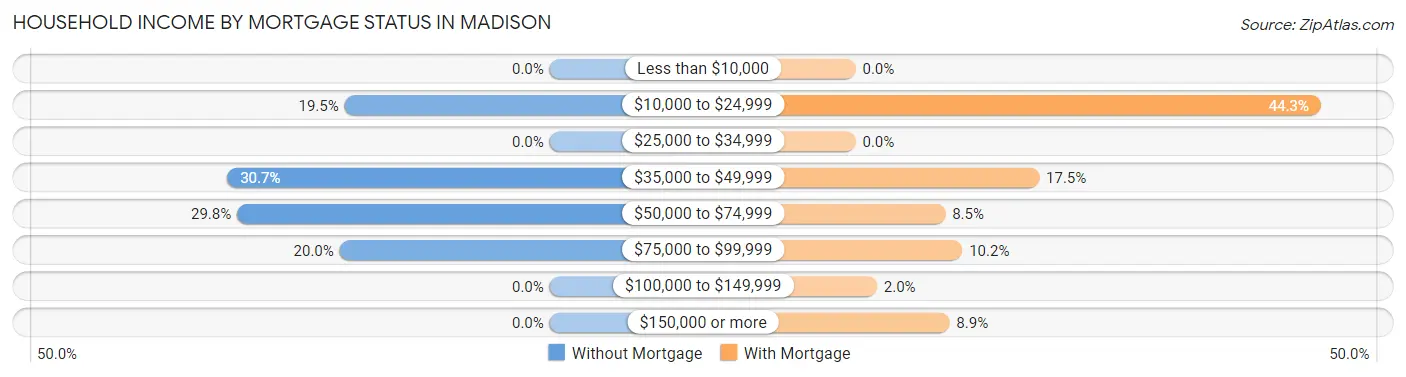
| Household Income | Without Mortgage | With Mortgage |
| Less than $10,000 | 0 (0.0%) | 0 (0.0%) |
| $10,000 to $24,999 | 42 (19.5%) | 109 (44.3%) |
| $25,000 to $34,999 | 0 (0.0%) | 0 (0.0%) |
| $35,000 to $49,999 | 66 (30.7%) | 43 (17.5%) |
| $50,000 to $74,999 | 64 (29.8%) | 21 (8.5%) |
| $75,000 to $99,999 | 43 (20.0%) | 25 (10.2%) |
| $100,000 to $149,999 | 0 (0.0%) | 5 (2.0%) |
| $150,000 or more | 0 (0.0%) | 22 (8.9%) |
| Total | 215 (100.0%) | 246 (100.0%) |
Property Value to Household Income Ratio in Madison
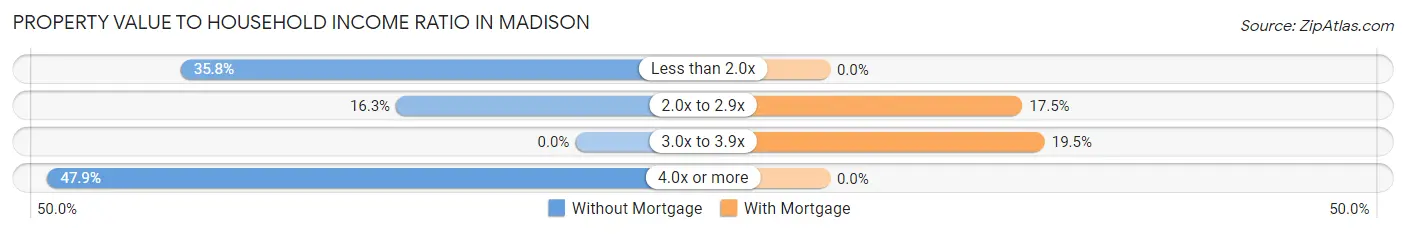
| Value-to-Income Ratio | Without Mortgage | With Mortgage |
| Less than 2.0x | 77 (35.8%) | 0 (0.0%) |
| 2.0x to 2.9x | 35 (16.3%) | 43 (17.5%) |
| 3.0x to 3.9x | 0 (0.0%) | 48 (19.5%) |
| 4.0x or more | 103 (47.9%) | 0 (0.0%) |
| Total | 215 (100.0%) | 246 (100.0%) |
Real Estate Taxes by Mortgage Status in Madison
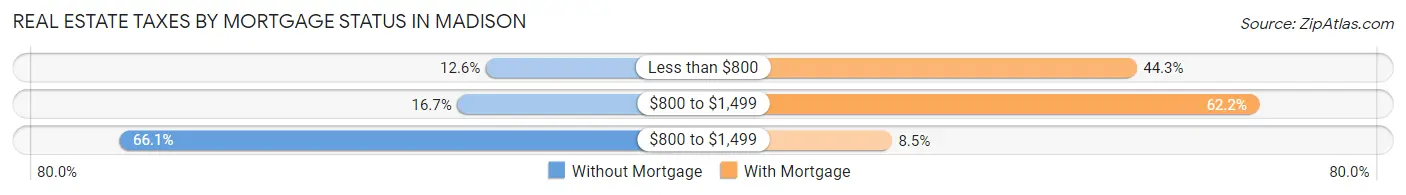
| Property Taxes | Without Mortgage | With Mortgage |
| Less than $800 | 27 (12.6%) | 109 (44.3%) |
| $800 to $1,499 | 36 (16.7%) | 153 (62.2%) |
| $800 to $1,499 | 142 (66.0%) | 21 (8.5%) |
| Total | 215 (100.0%) | 246 (100.0%) |
Health & Disability in Madison
Health Insurance Coverage by Age in Madison
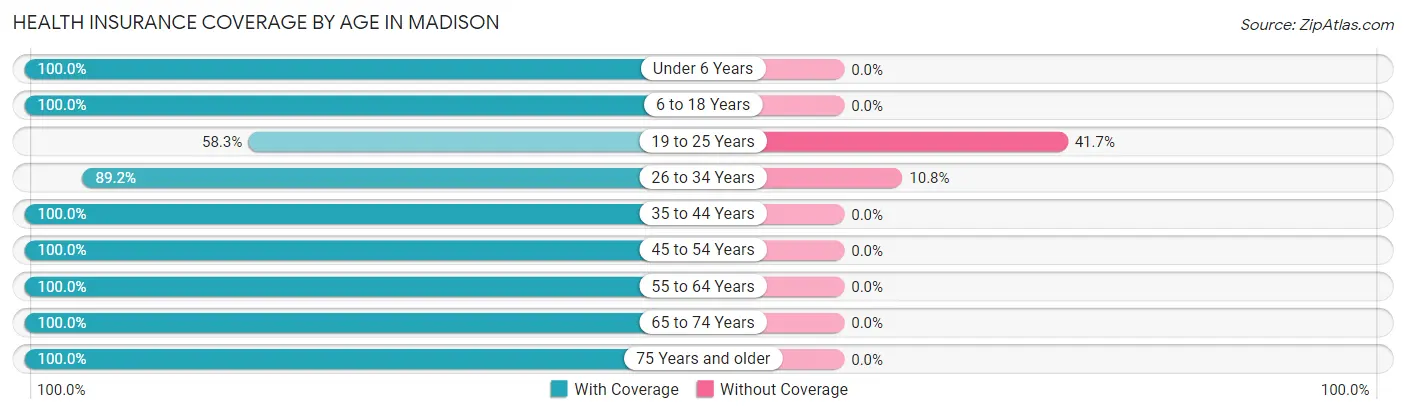
| Age Bracket | With Coverage | Without Coverage |
| Under 6 Years | 106 (100.0%) | 0 (0.0%) |
| 6 to 18 Years | 68 (100.0%) | 0 (0.0%) |
| 19 to 25 Years | 105 (58.3%) | 75 (41.7%) |
| 26 to 34 Years | 321 (89.2%) | 39 (10.8%) |
| 35 to 44 Years | 181 (100.0%) | 0 (0.0%) |
| 45 to 54 Years | 384 (100.0%) | 0 (0.0%) |
| 55 to 64 Years | 280 (100.0%) | 0 (0.0%) |
| 65 to 74 Years | 383 (100.0%) | 0 (0.0%) |
| 75 Years and older | 85 (100.0%) | 0 (0.0%) |
| Total | 1,913 (94.4%) | 114 (5.6%) |
Health Insurance Coverage by Citizenship Status in Madison
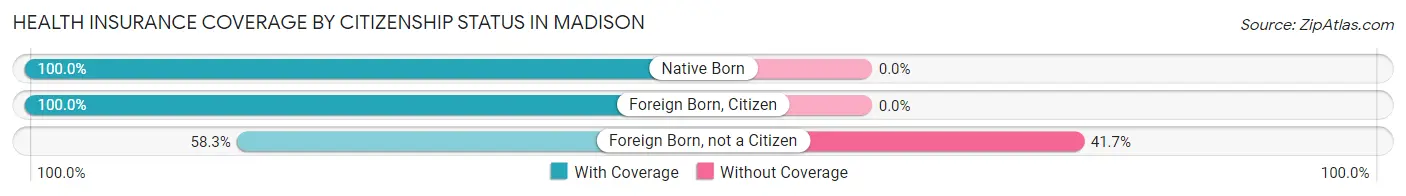
| Citizenship Status | With Coverage | Without Coverage |
| Native Born | 106 (100.0%) | 0 (0.0%) |
| Foreign Born, Citizen | 68 (100.0%) | 0 (0.0%) |
| Foreign Born, not a Citizen | 105 (58.3%) | 75 (41.7%) |
Health Insurance Coverage by Household Income in Madison

| Household Income | With Coverage | Without Coverage |
| Under $25,000 | 567 (100.0%) | 0 (0.0%) |
| $25,000 to $49,999 | 451 (100.0%) | 0 (0.0%) |
| $50,000 to $74,999 | 392 (77.5%) | 114 (22.5%) |
| $75,000 to $99,999 | 185 (100.0%) | 0 (0.0%) |
| $100,000 and over | 309 (100.0%) | 0 (0.0%) |
Public vs Private Health Insurance Coverage by Age in Madison
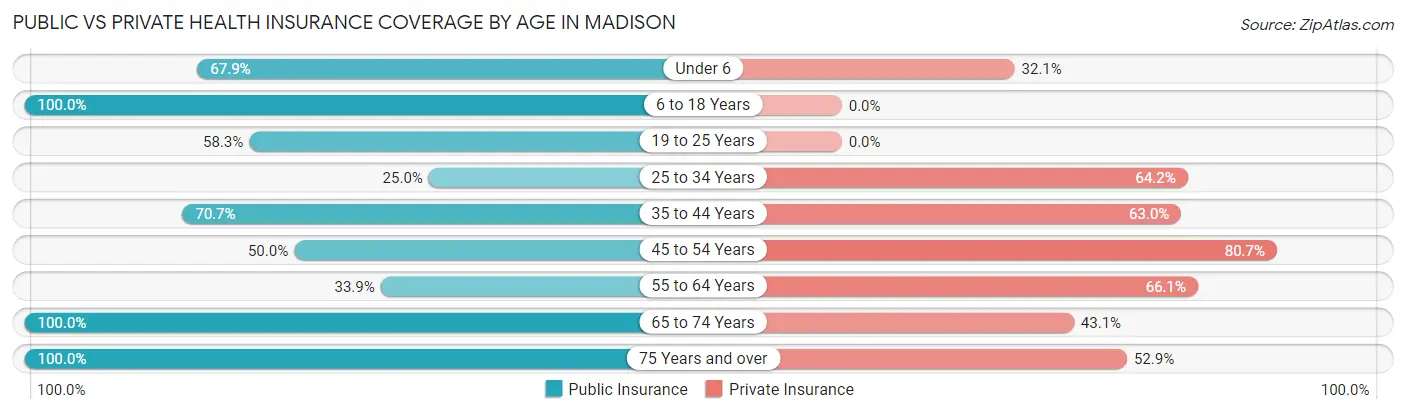
| Age Bracket | Public Insurance | Private Insurance |
| Under 6 | 72 (67.9%) | 34 (32.1%) |
| 6 to 18 Years | 68 (100.0%) | 0 (0.0%) |
| 19 to 25 Years | 105 (58.3%) | 0 (0.0%) |
| 25 to 34 Years | 90 (25.0%) | 231 (64.2%) |
| 35 to 44 Years | 128 (70.7%) | 114 (63.0%) |
| 45 to 54 Years | 192 (50.0%) | 310 (80.7%) |
| 55 to 64 Years | 95 (33.9%) | 185 (66.1%) |
| 65 to 74 Years | 383 (100.0%) | 165 (43.1%) |
| 75 Years and over | 85 (100.0%) | 45 (52.9%) |
| Total | 1,218 (60.1%) | 1,084 (53.5%) |
Disability Status by Sex by Age in Madison
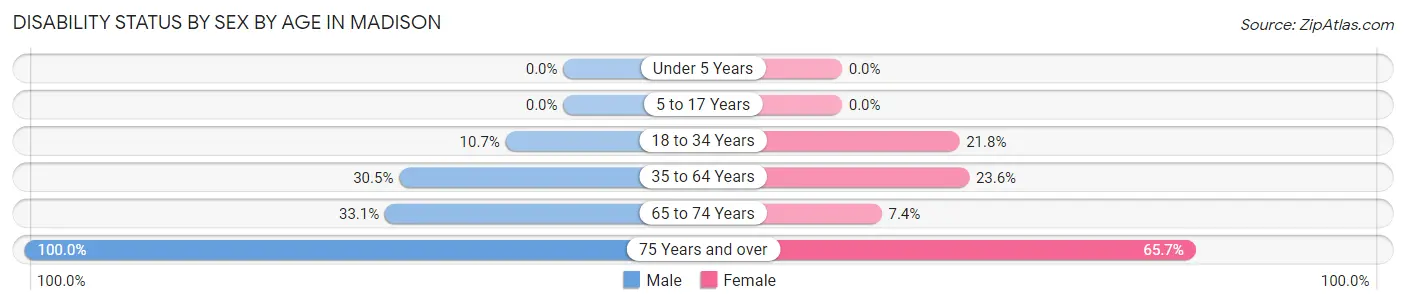
| Age Bracket | Male | Female |
| Under 5 Years | 0 (0.0%) | 0 (0.0%) |
| 5 to 17 Years | 0 (0.0%) | 0 (0.0%) |
| 18 to 34 Years | 21 (10.7%) | 75 (21.8%) |
| 35 to 64 Years | 127 (30.5%) | 101 (23.6%) |
| 65 to 74 Years | 46 (33.1%) | 18 (7.4%) |
| 75 Years and over | 18 (100.0%) | 44 (65.7%) |
Disability Class by Sex by Age in Madison
Disability Class: Hearing Difficulty
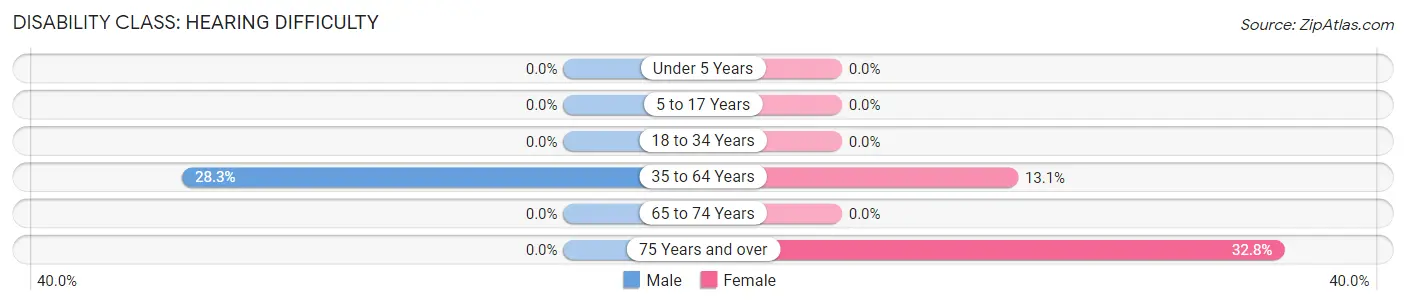
| Age Bracket | Male | Female |
| Under 5 Years | 0 (0.0%) | 0 (0.0%) |
| 5 to 17 Years | 0 (0.0%) | 0 (0.0%) |
| 18 to 34 Years | 0 (0.0%) | 0 (0.0%) |
| 35 to 64 Years | 118 (28.3%) | 56 (13.1%) |
| 65 to 74 Years | 0 (0.0%) | 0 (0.0%) |
| 75 Years and over | 0 (0.0%) | 22 (32.8%) |
Disability Class: Vision Difficulty
| Age Bracket | Male | Female |
| Under 5 Years | 0 (0.0%) | 0 (0.0%) |
| 5 to 17 Years | 0 (0.0%) | 0 (0.0%) |
| 18 to 34 Years | 0 (0.0%) | 0 (0.0%) |
| 35 to 64 Years | 0 (0.0%) | 0 (0.0%) |
| 65 to 74 Years | 0 (0.0%) | 0 (0.0%) |
| 75 Years and over | 0 (0.0%) | 0 (0.0%) |
Disability Class: Cognitive Difficulty
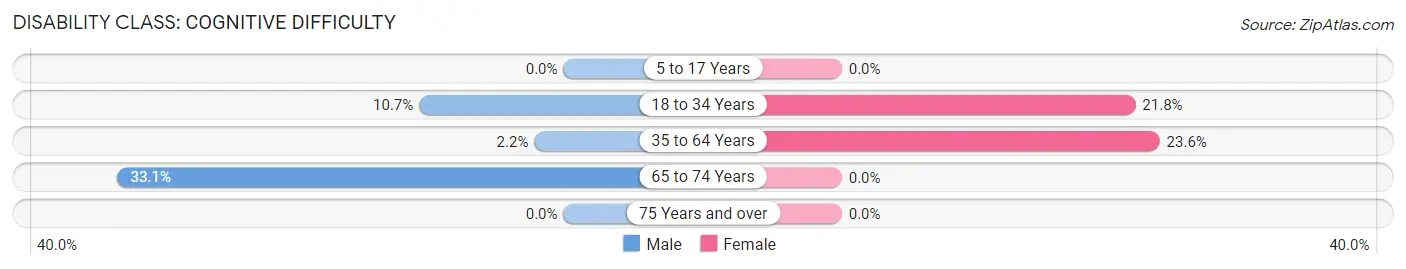
| Age Bracket | Male | Female |
| 5 to 17 Years | 0 (0.0%) | 0 (0.0%) |
| 18 to 34 Years | 21 (10.7%) | 75 (21.8%) |
| 35 to 64 Years | 9 (2.2%) | 101 (23.6%) |
| 65 to 74 Years | 46 (33.1%) | 0 (0.0%) |
| 75 Years and over | 0 (0.0%) | 0 (0.0%) |
Disability Class: Ambulatory Difficulty
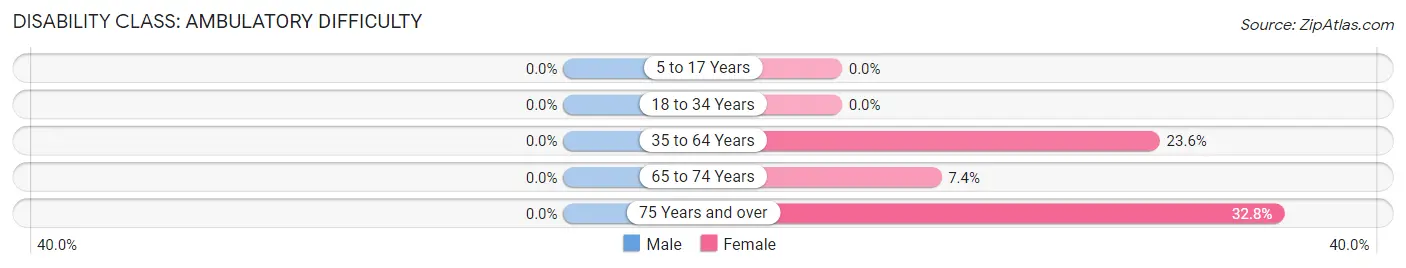
| Age Bracket | Male | Female |
| 5 to 17 Years | 0 (0.0%) | 0 (0.0%) |
| 18 to 34 Years | 0 (0.0%) | 0 (0.0%) |
| 35 to 64 Years | 0 (0.0%) | 101 (23.6%) |
| 65 to 74 Years | 0 (0.0%) | 18 (7.4%) |
| 75 Years and over | 0 (0.0%) | 22 (32.8%) |
Disability Class: Self-Care Difficulty
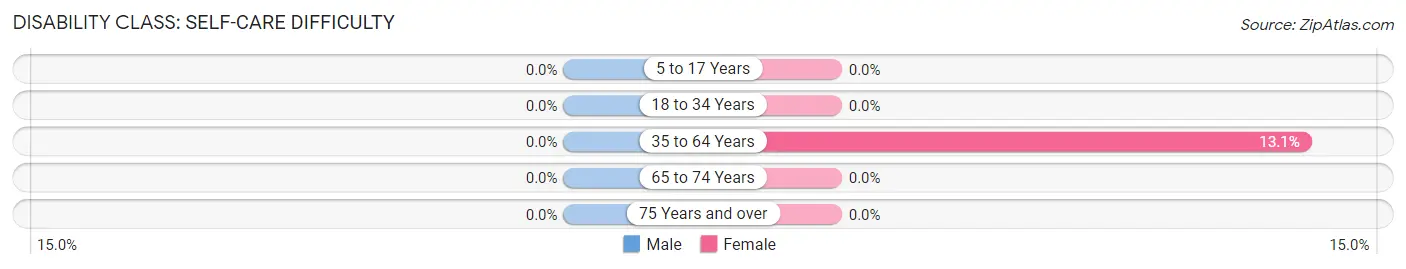
| Age Bracket | Male | Female |
| 5 to 17 Years | 0 (0.0%) | 0 (0.0%) |
| 18 to 34 Years | 0 (0.0%) | 0 (0.0%) |
| 35 to 64 Years | 0 (0.0%) | 56 (13.1%) |
| 65 to 74 Years | 0 (0.0%) | 0 (0.0%) |
| 75 Years and over | 0 (0.0%) | 0 (0.0%) |
Technology Access in Madison
Computing Device Access in Madison
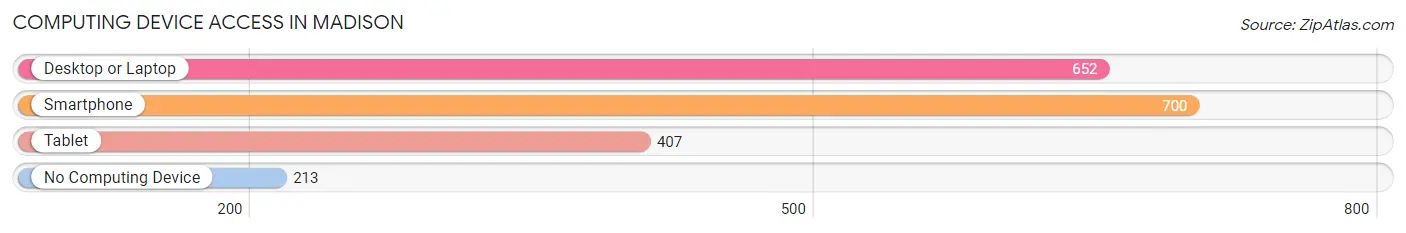
| Device Type | # Households | % Households |
| Desktop or Laptop | 652 | 64.9% |
| Smartphone | 700 | 69.7% |
| Tablet | 407 | 40.5% |
| No Computing Device | 213 | 21.2% |
| Total | 1,004 | 100.0% |
Internet Access in Madison
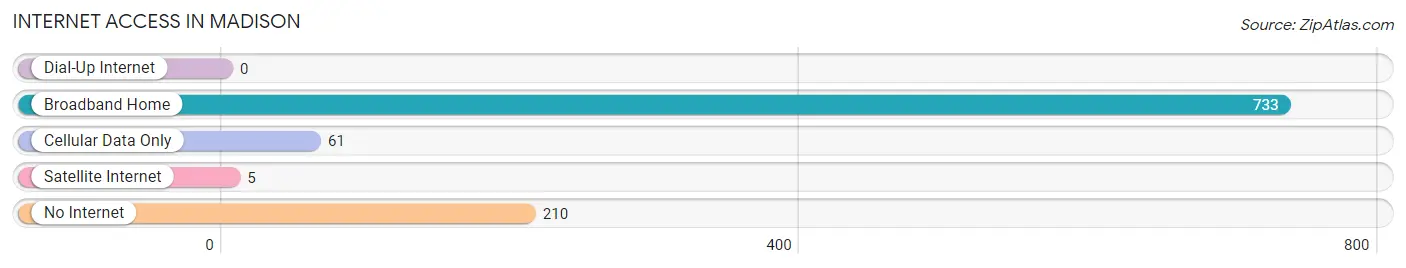
| Internet Type | # Households | % Households |
| Dial-Up Internet | 0 | 0.0% |
| Broadband Home | 733 | 73.0% |
| Cellular Data Only | 61 | 6.1% |
| Satellite Internet | 5 | 0.5% |
| No Internet | 210 | 20.9% |
| Total | 1,004 | 100.0% |
Madison Summary
Madison is a town located in Somerset County, Maine, United States. The population was 1,945 at the 2010 census. It is part of the Skowhegan, Maine Micropolitan Statistical Area.
History
The area that is now Madison was first settled in 1790 by a group of settlers from Massachusetts. The town was incorporated in 1803 and named after President James Madison.
In the early 19th century, Madison was a thriving agricultural community. The town was home to several sawmills, gristmills, and a tannery. The town also had a thriving lumber industry, which provided the town with much of its economic activity.
In the late 19th century, the town began to decline as the lumber industry moved away. The town was also affected by the Great Depression, which caused many of the town's businesses to close.
Geography
Madison is located in the western part of Somerset County, in the state of Maine. The town is bordered by the towns of Anson to the north, Norridgewock to the east, Skowhegan to the south, and Starks to the west.
The town is located in the Kennebec River Valley, which is part of the Appalachian Mountains. The town is located at the confluence of the Kennebec and Sebasticook Rivers.
The town has a total area of 33.2 square miles, of which 32.9 square miles is land and 0.3 square miles is water.
Economy
The economy of Madison is largely based on agriculture and tourism. The town is home to several farms, which produce a variety of crops, including potatoes, corn, hay, and apples.
The town is also home to several small businesses, including a lumber mill, a sawmill, and a gristmill. The town also has several restaurants, a grocery store, and a hardware store.
The town is also home to several tourist attractions, including the Madison Historical Society Museum, the Madison-Anson State Park, and the Sebasticook Valley Railroad.
Demographics
As of the 2010 census, there were 1,945 people, 790 households, and 517 families residing in the town. The population density was 59.2 people per square mile. There were 890 housing units at an average density of 27.2 per square mile.
The racial makeup of the town was 97.2% White, 0.3% African American, 0.2% Native American, 0.2% Asian, 0.1% Pacific Islander, 0.5% from other races, and 1.5% from two or more races. Hispanic or Latino of any race were 1.2% of the population.
There were 790 households, out of which 28.2% had children under the age of 18 living with them, 48.3% were married couples living together, 11.3% had a female householder with no husband present, and 34.6% were non-families. 28.2% of all households were made up of individuals, and 12.3% had someone living alone who was 65 years of age or older. The average household size was 2.45 and the average family size was 2.97.
In the town, the population was spread out, with 24.2% under the age of 18, 7.2% from 18 to 24, 27.2% from 25 to 44, 25.2% from 45 to 64, and 16.2% who were 65 years of age or older. The median age was 39 years. For every 100 females, there were 97.2 males. For every 100 females age 18 and over, there were 94.2 males.
The median income for a household in the town was $33,750, and the median income for a family was $41,250. Males had a median income of $30,000 versus $21,250 for females. The per capita income for the town was $17,845. About 10.2% of families and 13.2% of the population were below the poverty line, including 16.2% of those under age 18 and 10.2% of those age 65 or over.
Common Questions
What is Per Capita Income in Madison?
Per Capita income in Madison is $26,115.
What is the Median Family Income in Madison?
Median Family Income in Madison is $55,903.
What is the Median Household income in Madison?
Median Household Income in Madison is $39,695.
What is Income or Wage Gap in Madison?
Income or Wage Gap in Madison is 8.3%.
Women in Madison earn 91.7 cents for every dollar earned by a man.
What is Inequality or Gini Index in Madison?
Inequality or Gini Index in Madison is 0.46.
What is the Total Population of Madison?
Total Population of Madison is 2,100.
What is the Total Male Population of Madison?
Total Male Population of Madison is 887.
What is the Total Female Population of Madison?
Total Female Population of Madison is 1,213.
What is the Ratio of Males per 100 Females in Madison?
There are 73.12 Males per 100 Females in Madison.
What is the Ratio of Females per 100 Males in Madison?
There are 136.75 Females per 100 Males in Madison.
What is the Median Population Age in Madison?
Median Population Age in Madison is 49.6 Years.
What is the Average Family Size in Madison
Average Family Size in Madison is 2.7 People.
What is the Average Household Size in Madison
Average Household Size in Madison is 2.0 People.
How Large is the Labor Force in Madison?
There are 1,080 People in the Labor Forcein in Madison.
What is the Percentage of People in the Labor Force in Madison?
56.1% of People are in the Labor Force in Madison.
What is the Unemployment Rate in Madison?
Unemployment Rate in Madison is 1.9%.