South Eliot, ME Map & Demographics
South Eliot Map
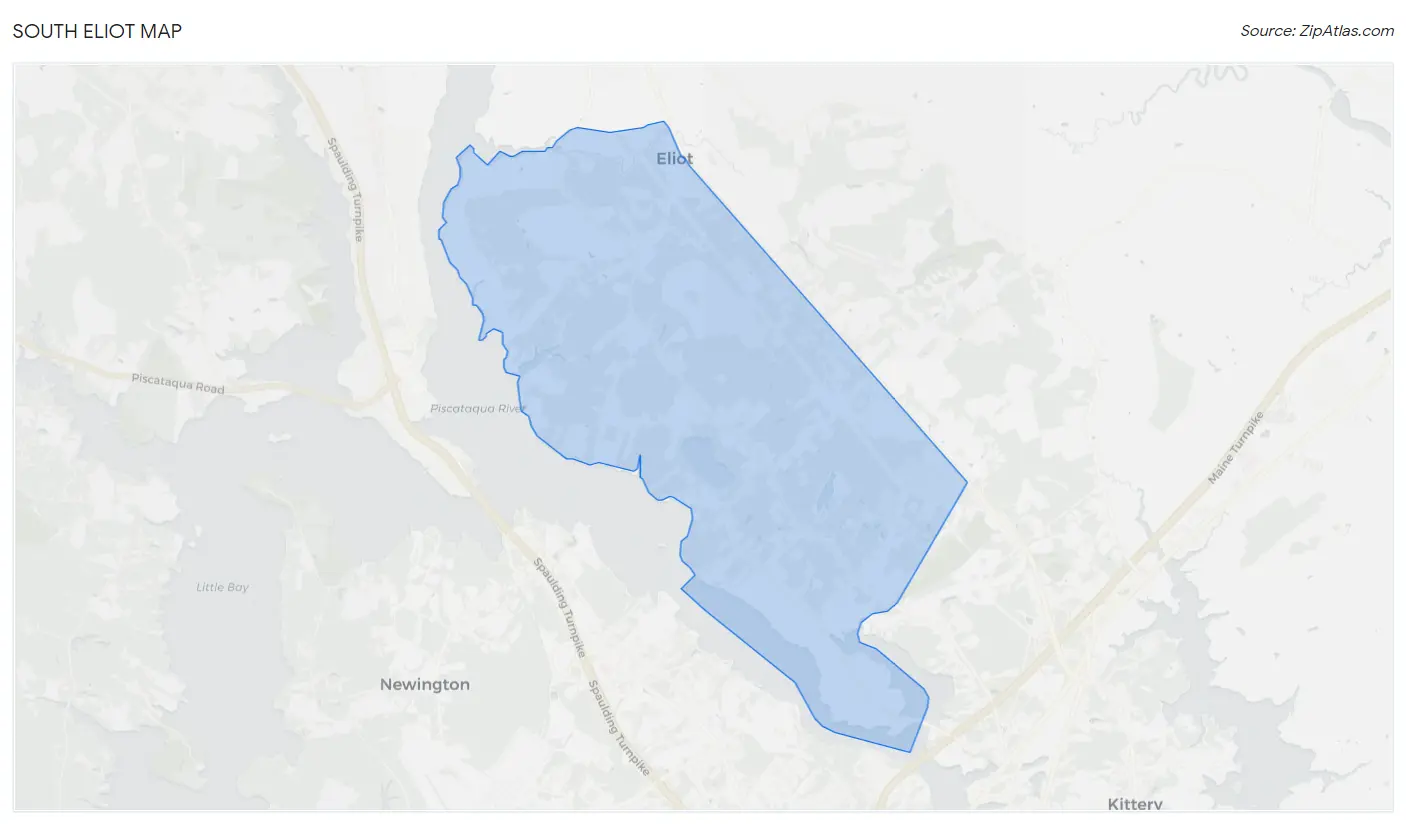
South Eliot Overview
$46,620
PER CAPITA INCOME
$105,924
AVG FAMILY INCOME
$91,457
AVG HOUSEHOLD INCOME
33.8%
WAGE / INCOME GAP [ % ]
66.2¢/ $1
WAGE / INCOME GAP [ $ ]
0.39
INEQUALITY / GINI INDEX
3,686
TOTAL POPULATION
1,810
MALE POPULATION
1,876
FEMALE POPULATION
96.48
MALES / 100 FEMALES
103.65
FEMALES / 100 MALES
53.1
MEDIAN AGE
3.0
AVG FAMILY SIZE
2.5
AVG HOUSEHOLD SIZE
2,037
LABOR FORCE [ PEOPLE ]
64.4%
PERCENT IN LABOR FORCE
2.6%
UNEMPLOYMENT RATE
Income in South Eliot
Income Overview in South Eliot
Per Capita Income in South Eliot is $46,620, while median incomes of families and households are $105,924 and $91,457 respectively.
| Characteristic | Number | Measure |
| Per Capita Income | 3,686 | $46,620 |
| Median Family Income | 1,003 | $105,924 |
| Mean Family Income | 1,003 | $131,799 |
| Median Household Income | 1,478 | $91,457 |
| Mean Household Income | 1,478 | $114,584 |
| Income Deficit | 1,003 | $0 |
| Wage / Income Gap (%) | 3,686 | 33.81% |
| Wage / Income Gap ($) | 3,686 | 66.19¢ per $1 |
| Gini / Inequality Index | 3,686 | 0.39 |
Earnings by Sex in South Eliot
Average Earnings in South Eliot are $46,228, $59,348 for men and $39,280 for women, a difference of 33.8%.
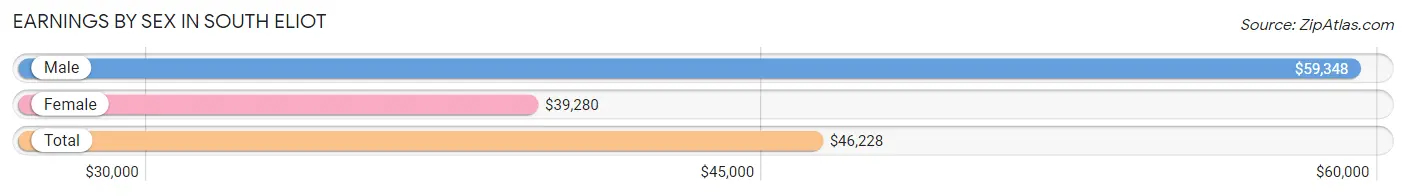
| Sex | Number | Average Earnings |
| Male | 1,126 (54.9%) | $59,348 |
| Female | 925 (45.1%) | $39,280 |
| Total | 2,051 (100.0%) | $46,228 |
Earnings by Sex by Income Bracket in South Eliot
The most common earnings brackets in South Eliot are $100,000+ for men (200 | 17.8%) and $45,000 to $49,999 for women (206 | 22.3%).
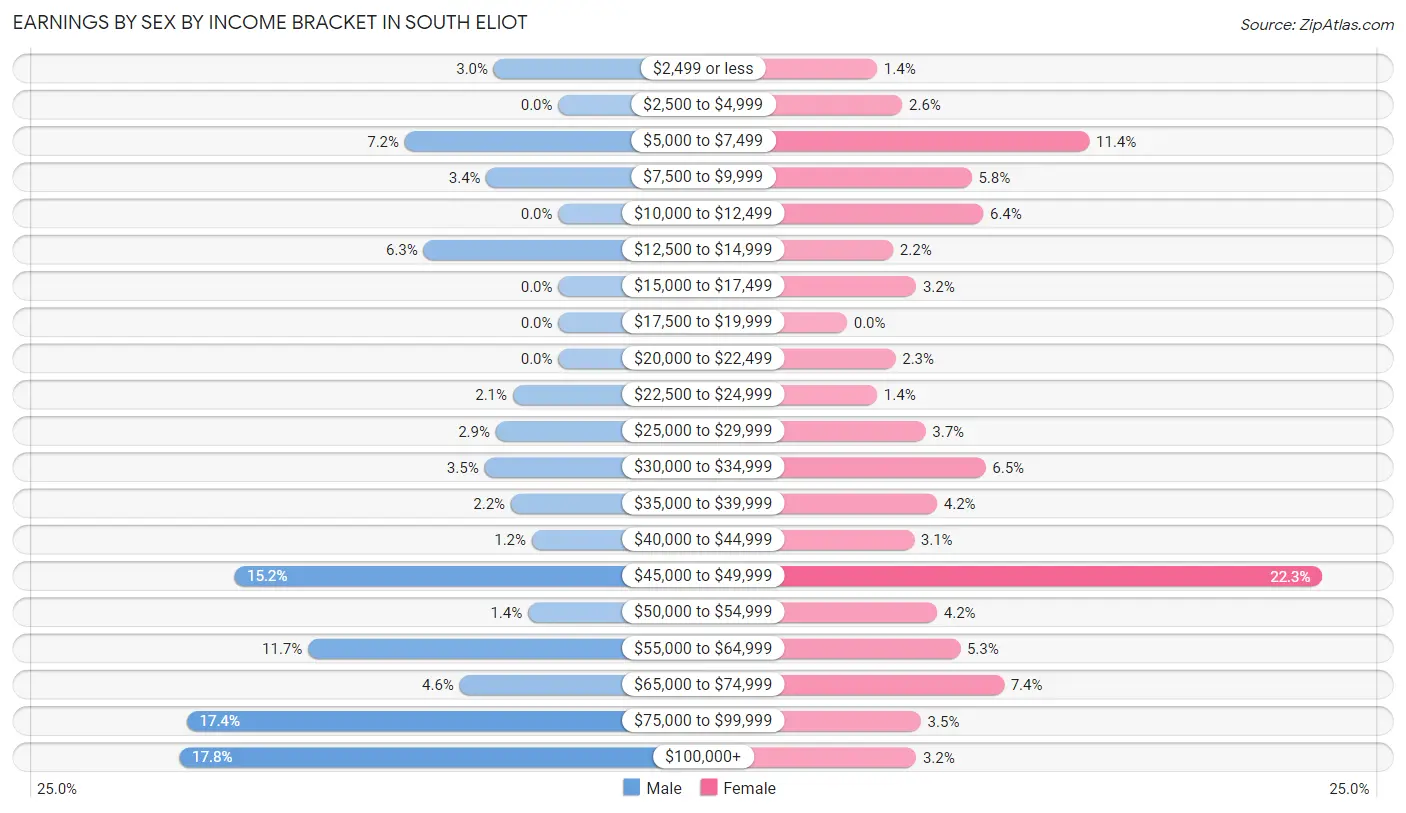
| Income | Male | Female |
| $2,499 or less | 34 (3.0%) | 13 (1.4%) |
| $2,500 to $4,999 | 0 (0.0%) | 24 (2.6%) |
| $5,000 to $7,499 | 81 (7.2%) | 105 (11.4%) |
| $7,500 to $9,999 | 38 (3.4%) | 54 (5.8%) |
| $10,000 to $12,499 | 0 (0.0%) | 59 (6.4%) |
| $12,500 to $14,999 | 71 (6.3%) | 20 (2.2%) |
| $15,000 to $17,499 | 0 (0.0%) | 30 (3.2%) |
| $17,500 to $19,999 | 0 (0.0%) | 0 (0.0%) |
| $20,000 to $22,499 | 0 (0.0%) | 21 (2.3%) |
| $22,500 to $24,999 | 24 (2.1%) | 13 (1.4%) |
| $25,000 to $29,999 | 33 (2.9%) | 34 (3.7%) |
| $30,000 to $34,999 | 39 (3.5%) | 60 (6.5%) |
| $35,000 to $39,999 | 25 (2.2%) | 39 (4.2%) |
| $40,000 to $44,999 | 14 (1.2%) | 29 (3.1%) |
| $45,000 to $49,999 | 171 (15.2%) | 206 (22.3%) |
| $50,000 to $54,999 | 16 (1.4%) | 39 (4.2%) |
| $55,000 to $64,999 | 132 (11.7%) | 49 (5.3%) |
| $65,000 to $74,999 | 52 (4.6%) | 68 (7.3%) |
| $75,000 to $99,999 | 196 (17.4%) | 32 (3.5%) |
| $100,000+ | 200 (17.8%) | 30 (3.2%) |
| Total | 1,126 (100.0%) | 925 (100.0%) |
Earnings by Sex by Educational Attainment in South Eliot
Average earnings in South Eliot are $63,403 for men and $44,698 for women, a difference of 29.5%. Men with an educational attainment of bachelor's degree enjoy the highest average annual earnings of $76,797, while those with high school diploma education earn the least with $46,865. Women with an educational attainment of college or associate's degree earn the most with the average annual earnings of $65,583, while those with bachelor's degree education have the smallest earnings of $31,094.
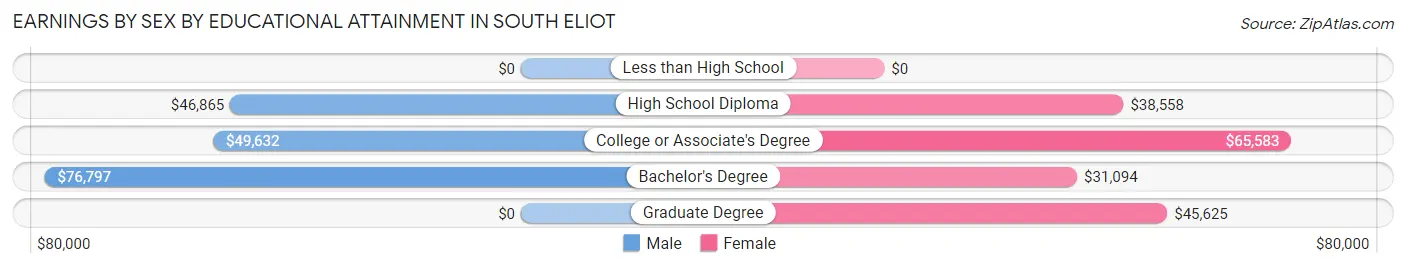
| Educational Attainment | Male Income | Female Income |
| Less than High School | - | - |
| High School Diploma | $46,865 | $38,558 |
| College or Associate's Degree | $49,632 | $65,583 |
| Bachelor's Degree | $76,797 | $31,094 |
| Graduate Degree | - | - |
| Total | $63,403 | $44,698 |
Family Income in South Eliot
Family Income Brackets in South Eliot
According to the South Eliot family income data, there are 238 families falling into the $50,000 to $74,999 income range, which is the most common income bracket and makes up 23.7% of all families.
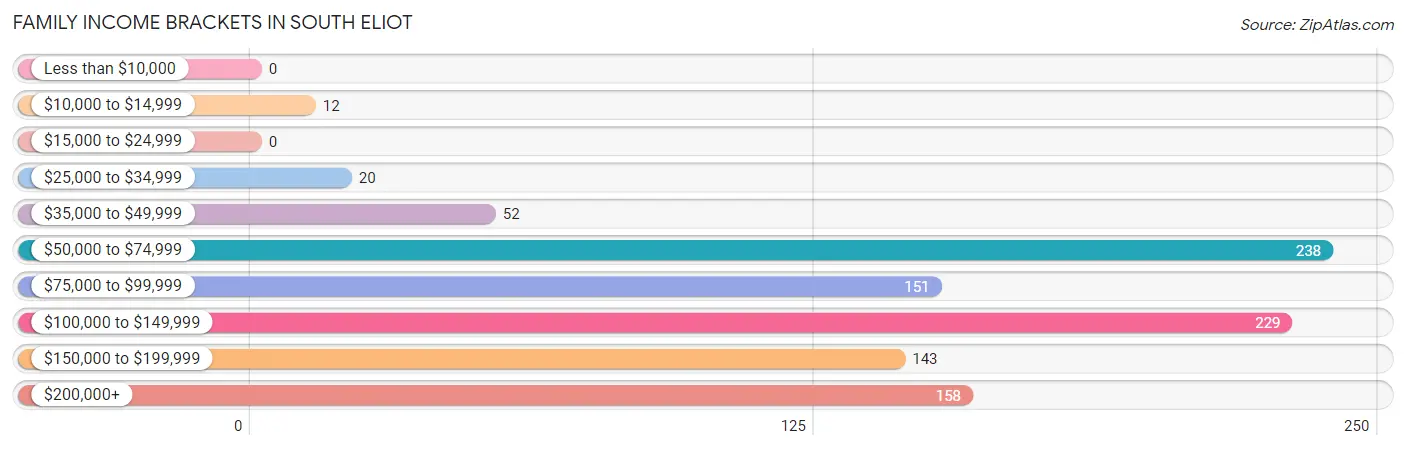
| Income Bracket | # Families | % Families |
| Less than $10,000 | 0 | 0.0% |
| $10,000 to $14,999 | 12 | 1.2% |
| $15,000 to $24,999 | 0 | 0.0% |
| $25,000 to $34,999 | 20 | 2.0% |
| $35,000 to $49,999 | 52 | 5.2% |
| $50,000 to $74,999 | 238 | 23.7% |
| $75,000 to $99,999 | 151 | 15.1% |
| $100,000 to $149,999 | 229 | 22.8% |
| $150,000 to $199,999 | 143 | 14.3% |
| $200,000+ | 158 | 15.8% |
Family Income by Famaliy Size in South Eliot
4-person families (116 | 11.6%) account for the highest median family income in South Eliot with $126,977 per family, while 2-person families (591 | 58.9%) have the highest median income of $45,782 per family member.
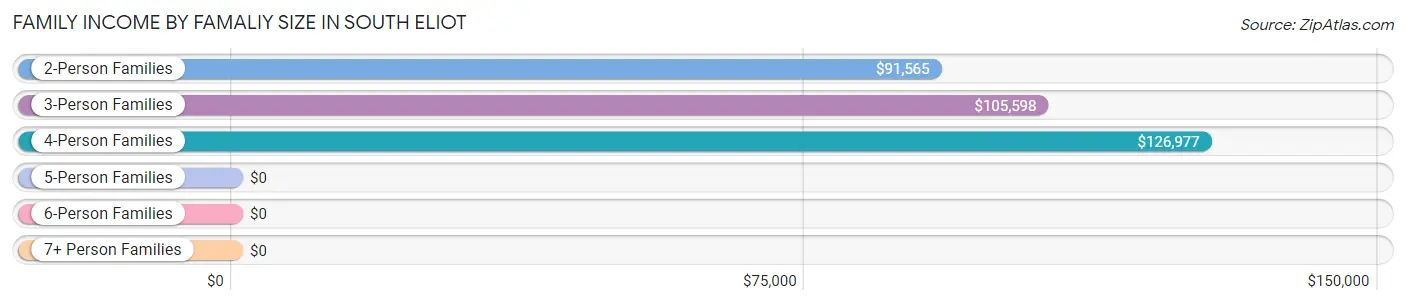
| Income Bracket | # Families | Median Income |
| 2-Person Families | 591 (58.9%) | $91,565 |
| 3-Person Families | 155 (15.4%) | $105,598 |
| 4-Person Families | 116 (11.6%) | $126,977 |
| 5-Person Families | 45 (4.5%) | $0 |
| 6-Person Families | 71 (7.1%) | $0 |
| 7+ Person Families | 25 (2.5%) | $0 |
| Total | 1,003 (100.0%) | $105,924 |
Family Income by Number of Earners in South Eliot
The median family income in South Eliot is $105,924, with families comprising 3+ earners (197) having the highest median family income of $223,346, while families with no earners (261) have the lowest median family income of $66,420, accounting for 19.6% and 26.0% of families, respectively.
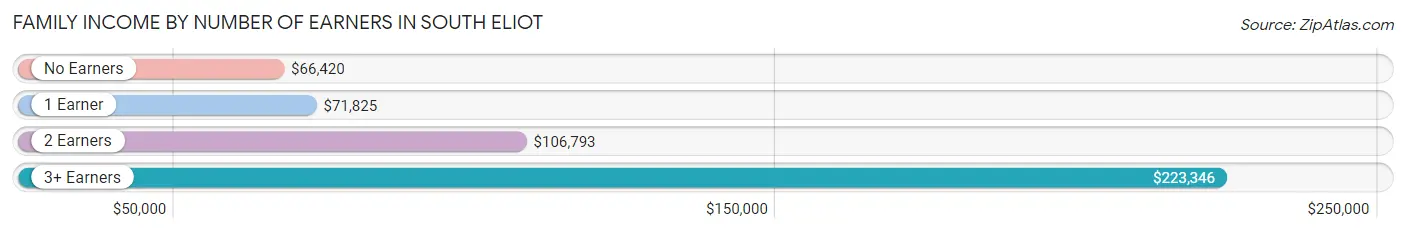
| Number of Earners | # Families | Median Income |
| No Earners | 261 (26.0%) | $66,420 |
| 1 Earner | 186 (18.5%) | $71,825 |
| 2 Earners | 359 (35.8%) | $106,793 |
| 3+ Earners | 197 (19.6%) | $223,346 |
| Total | 1,003 (100.0%) | $105,924 |
Household Income in South Eliot
Household Income Brackets in South Eliot
With 401 households falling in the category, the $50,000 to $74,999 income range is the most frequent in South Eliot, accounting for 27.1% of all households. In contrast, only 12 households (0.8%) fall into the $10,000 to $14,999 income bracket, making it the least populous group.
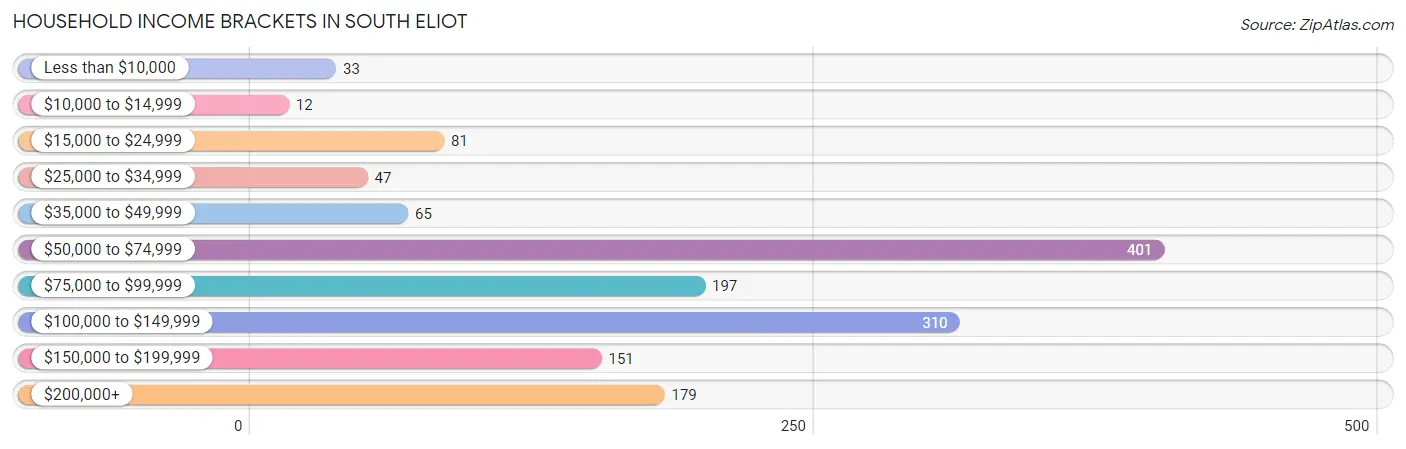
| Income Bracket | # Households | % Households |
| Less than $10,000 | 33 | 2.2% |
| $10,000 to $14,999 | 12 | 0.8% |
| $15,000 to $24,999 | 81 | 5.5% |
| $25,000 to $34,999 | 47 | 3.2% |
| $35,000 to $49,999 | 65 | 4.4% |
| $50,000 to $74,999 | 401 | 27.1% |
| $75,000 to $99,999 | 197 | 13.3% |
| $100,000 to $149,999 | 310 | 21.0% |
| $150,000 to $199,999 | 151 | 10.2% |
| $200,000+ | 179 | 12.1% |
Household Income by Householder Age in South Eliot
The median household income in South Eliot is $91,457, with the highest median household income of $135,341 found in the 45 to 64 years age bracket for the primary householder. A total of 434 households (29.4%) fall into this category. Meanwhile, the 15 to 24 years age bracket for the primary householder has the lowest median household income of $0, with 44 households (3.0%) in this group.
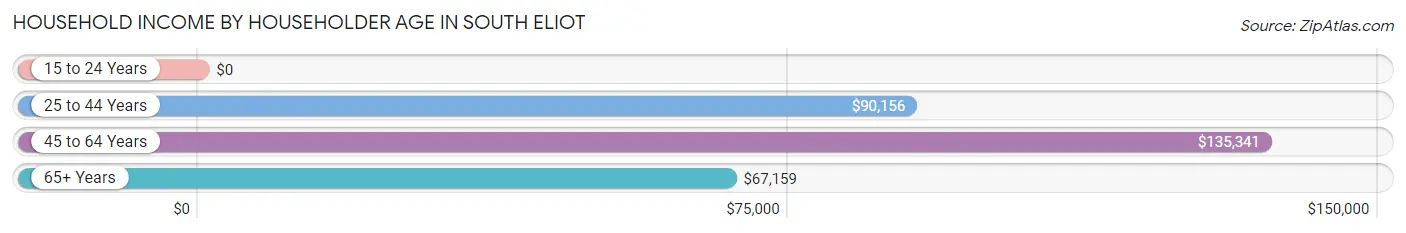
| Income Bracket | # Households | Median Income |
| 15 to 24 Years | 44 (3.0%) | $0 |
| 25 to 44 Years | 268 (18.1%) | $90,156 |
| 45 to 64 Years | 434 (29.4%) | $135,341 |
| 65+ Years | 732 (49.5%) | $67,159 |
| Total | 1,478 (100.0%) | $91,457 |
Poverty in South Eliot
Income Below Poverty by Sex and Age in South Eliot
With 4.0% poverty level for males and 1.6% for females among the residents of South Eliot, 12 to 14 year old males and 25 to 34 year old females are the most vulnerable to poverty, with 8 males (100.0%) and 13 females (7.4%) in their respective age groups living below the poverty level.
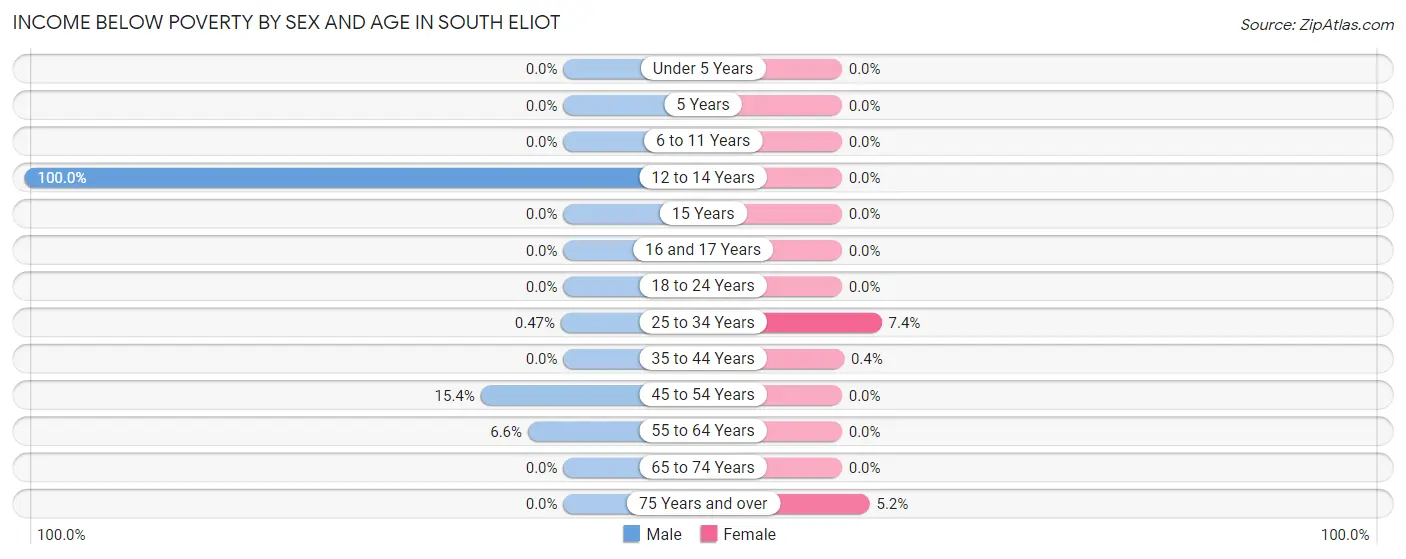
| Age Bracket | Male | Female |
| Under 5 Years | 0 (0.0%) | 0 (0.0%) |
| 5 Years | 0 (0.0%) | 0 (0.0%) |
| 6 to 11 Years | 0 (0.0%) | 0 (0.0%) |
| 12 to 14 Years | 8 (100.0%) | 0 (0.0%) |
| 15 Years | 0 (0.0%) | 0 (0.0%) |
| 16 and 17 Years | 0 (0.0%) | 0 (0.0%) |
| 18 to 24 Years | 0 (0.0%) | 0 (0.0%) |
| 25 to 34 Years | 1 (0.5%) | 13 (7.4%) |
| 35 to 44 Years | 0 (0.0%) | 1 (0.4%) |
| 45 to 54 Years | 43 (15.4%) | 0 (0.0%) |
| 55 to 64 Years | 20 (6.6%) | 0 (0.0%) |
| 65 to 74 Years | 0 (0.0%) | 0 (0.0%) |
| 75 Years and over | 0 (0.0%) | 15 (5.1%) |
| Total | 72 (4.0%) | 29 (1.6%) |
Income Above Poverty by Sex and Age in South Eliot
According to the poverty statistics in South Eliot, males aged under 5 years and females aged under 5 years are the age groups that are most secure financially, with 100.0% of males and 100.0% of females in these age groups living above the poverty line.
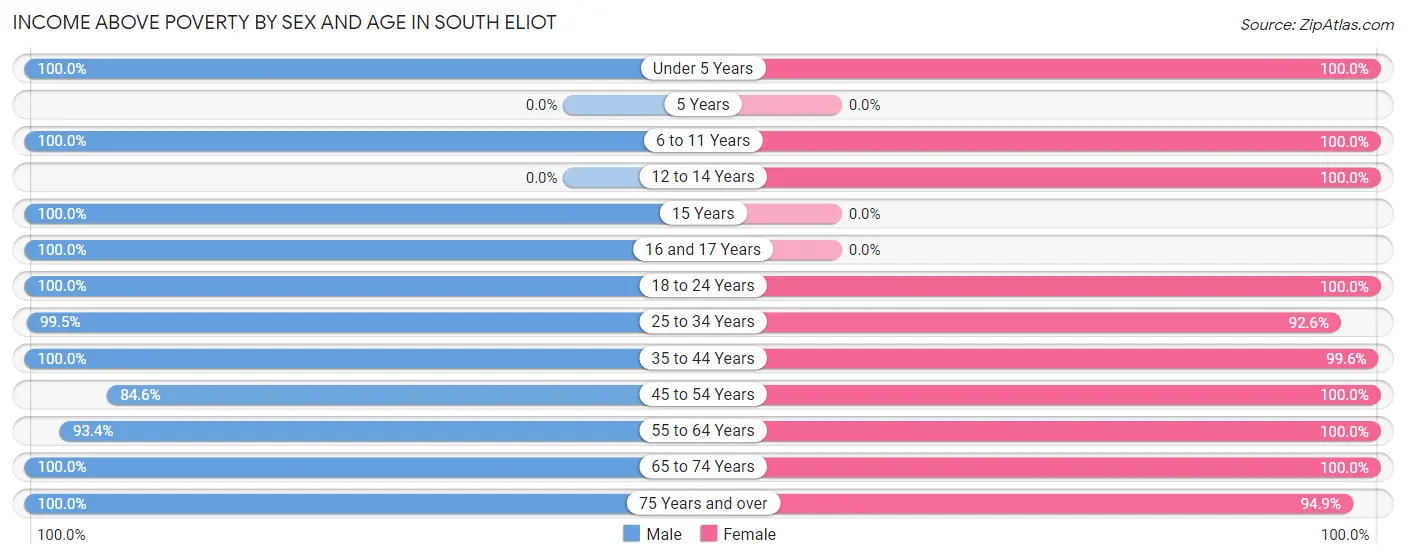
| Age Bracket | Male | Female |
| Under 5 Years | 52 (100.0%) | 162 (100.0%) |
| 5 Years | 0 (0.0%) | 0 (0.0%) |
| 6 to 11 Years | 123 (100.0%) | 28 (100.0%) |
| 12 to 14 Years | 0 (0.0%) | 81 (100.0%) |
| 15 Years | 37 (100.0%) | 0 (0.0%) |
| 16 and 17 Years | 59 (100.0%) | 0 (0.0%) |
| 18 to 24 Years | 154 (100.0%) | 108 (100.0%) |
| 25 to 34 Years | 212 (99.5%) | 163 (92.6%) |
| 35 to 44 Years | 135 (100.0%) | 248 (99.6%) |
| 45 to 54 Years | 237 (84.6%) | 158 (100.0%) |
| 55 to 64 Years | 284 (93.4%) | 231 (100.0%) |
| 65 to 74 Years | 175 (100.0%) | 360 (100.0%) |
| 75 Years and over | 270 (100.0%) | 276 (94.9%) |
| Total | 1,738 (96.0%) | 1,815 (98.4%) |
Income Below Poverty Among Married-Couple Families in South Eliot
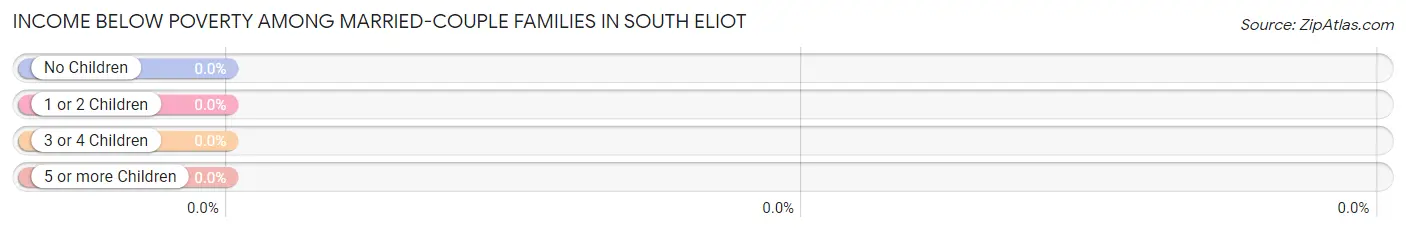
| Children | Above Poverty | Below Poverty |
| No Children | 628 (100.0%) | 0 (0.0%) |
| 1 or 2 Children | 290 (100.0%) | 0 (0.0%) |
| 3 or 4 Children | 0 (0.0%) | 0 (0.0%) |
| 5 or more Children | 25 (100.0%) | 0 (0.0%) |
| Total | 943 (100.0%) | 0 (0.0%) |
Income Below Poverty Among Single-Parent Households in South Eliot
| Children | Single Father | Single Mother |
| No Children | 0 (0.0%) | 0 (0.0%) |
| 1 or 2 Children | 0 (0.0%) | 12 (100.0%) |
| 3 or 4 Children | 0 (0.0%) | 0 (0.0%) |
| 5 or more Children | 0 (0.0%) | 0 (0.0%) |
| Total | 0 (0.0%) | 12 (52.2%) |
Income Below Poverty Among Married-Couple vs Single-Parent Households in South Eliot
| Children | Married-Couple Families | Single-Parent Households |
| No Children | 0 (0.0%) | 0 (0.0%) |
| 1 or 2 Children | 0 (0.0%) | 12 (24.5%) |
| 3 or 4 Children | 0 (0.0%) | 0 (0.0%) |
| 5 or more Children | 0 (0.0%) | 0 (0.0%) |
| Total | 0 (0.0%) | 12 (20.0%) |
Race in South Eliot
The most populous races in South Eliot are White / Caucasian (3,206 | 87.0%), Hispanic or Latino (281 | 7.6%), and Two or more Races (256 | 7.0%).
| Race | # Population | % Population |
| Asian | 1 | 0.0% |
| Black / African American | 87 | 2.4% |
| Hawaiian / Pacific | 0 | 0.0% |
| Hispanic or Latino | 281 | 7.6% |
| Native / Alaskan | 47 | 1.3% |
| White / Caucasian | 3,206 | 87.0% |
| Two or more Races | 256 | 7.0% |
| Some other Race | 89 | 2.4% |
| Total | 3,686 | 100.0% |
Ancestry in South Eliot
The most populous ancestries reported in South Eliot are English (469 | 12.7%), Irish (397 | 10.8%), German (348 | 9.4%), American (306 | 8.3%), and French Canadian (254 | 6.9%), together accounting for 48.1% of all South Eliot residents.
| Ancestry | # Population | % Population |
| American | 306 | 8.3% |
| Belgian | 37 | 1.0% |
| Cherokee | 22 | 0.6% |
| Czech | 2 | 0.1% |
| Czechoslovakian | 22 | 0.6% |
| Dominican | 64 | 1.7% |
| Dutch | 53 | 1.4% |
| English | 469 | 12.7% |
| European | 199 | 5.4% |
| French | 201 | 5.4% |
| French Canadian | 254 | 6.9% |
| German | 348 | 9.4% |
| Greek | 11 | 0.3% |
| Hungarian | 16 | 0.4% |
| Irish | 397 | 10.8% |
| Italian | 239 | 6.5% |
| Mexican | 103 | 2.8% |
| Norwegian | 92 | 2.5% |
| Polish | 62 | 1.7% |
| Portuguese | 21 | 0.6% |
| Scotch-Irish | 43 | 1.2% |
| Scottish | 133 | 3.6% |
| Sioux | 112 | 3.0% |
| Spanish | 110 | 3.0% |
| Sri Lankan | 1 | 0.0% |
| Swedish | 51 | 1.4% |
| Ukrainian | 16 | 0.4% |
| Welsh | 20 | 0.5% | View All 28 Rows |
Immigrants in South Eliot
The most numerous immigrant groups reported in South Eliot came from Latin America (68 | 1.8%), Caribbean (64 | 1.7%), Dominican Republic (64 | 1.7%), Europe (59 | 1.6%), and Belgium (38 | 1.0%), together accounting for 8.0% of all South Eliot residents.
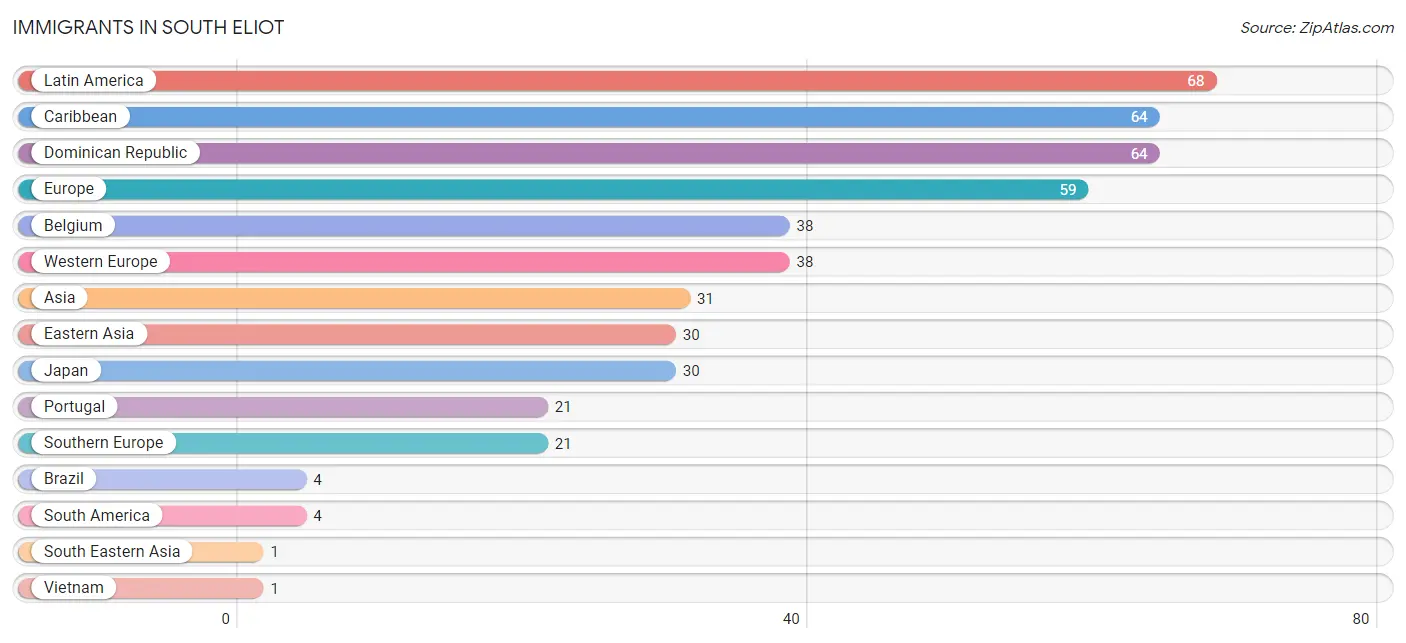
| Immigration Origin | # Population | % Population |
| Asia | 31 | 0.8% |
| Belgium | 38 | 1.0% |
| Brazil | 4 | 0.1% |
| Caribbean | 64 | 1.7% |
| Dominican Republic | 64 | 1.7% |
| Eastern Asia | 30 | 0.8% |
| Europe | 59 | 1.6% |
| Japan | 30 | 0.8% |
| Latin America | 68 | 1.8% |
| Portugal | 21 | 0.6% |
| South America | 4 | 0.1% |
| South Eastern Asia | 1 | 0.0% |
| Southern Europe | 21 | 0.6% |
| Vietnam | 1 | 0.0% |
| Western Europe | 38 | 1.0% | View All 15 Rows |
Sex and Age in South Eliot
Sex and Age in South Eliot
The most populous age groups in South Eliot are 50 to 54 Years (242 | 13.4%) for men and 65 to 69 Years (233 | 12.4%) for women.
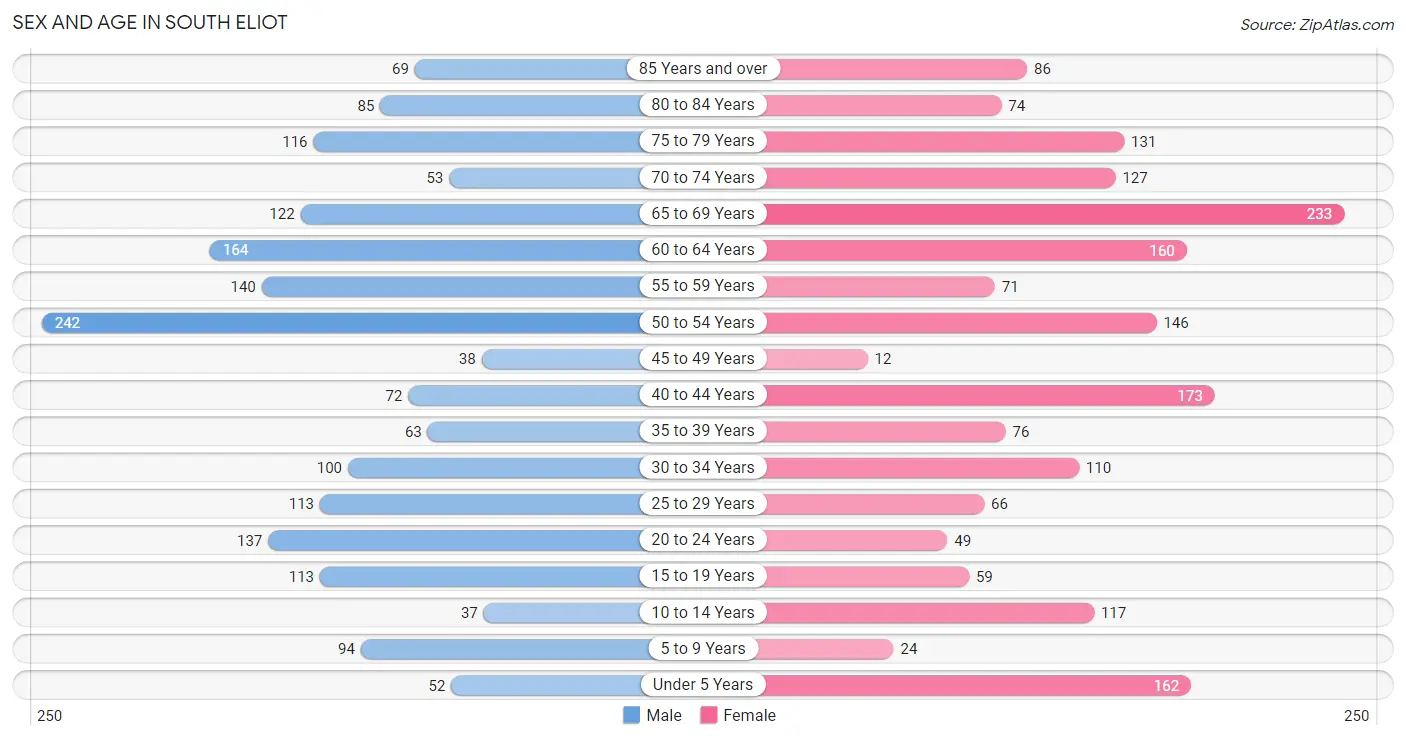
| Age Bracket | Male | Female |
| Under 5 Years | 52 (2.9%) | 162 (8.6%) |
| 5 to 9 Years | 94 (5.2%) | 24 (1.3%) |
| 10 to 14 Years | 37 (2.0%) | 117 (6.2%) |
| 15 to 19 Years | 113 (6.2%) | 59 (3.1%) |
| 20 to 24 Years | 137 (7.6%) | 49 (2.6%) |
| 25 to 29 Years | 113 (6.2%) | 66 (3.5%) |
| 30 to 34 Years | 100 (5.5%) | 110 (5.9%) |
| 35 to 39 Years | 63 (3.5%) | 76 (4.1%) |
| 40 to 44 Years | 72 (4.0%) | 173 (9.2%) |
| 45 to 49 Years | 38 (2.1%) | 12 (0.6%) |
| 50 to 54 Years | 242 (13.4%) | 146 (7.8%) |
| 55 to 59 Years | 140 (7.7%) | 71 (3.8%) |
| 60 to 64 Years | 164 (9.1%) | 160 (8.5%) |
| 65 to 69 Years | 122 (6.7%) | 233 (12.4%) |
| 70 to 74 Years | 53 (2.9%) | 127 (6.8%) |
| 75 to 79 Years | 116 (6.4%) | 131 (7.0%) |
| 80 to 84 Years | 85 (4.7%) | 74 (3.9%) |
| 85 Years and over | 69 (3.8%) | 86 (4.6%) |
| Total | 1,810 (100.0%) | 1,876 (100.0%) |
Families and Households in South Eliot
Median Family Size in South Eliot
The median family size in South Eliot is 2.97 persons per family, with single male/father families (37 | 3.7%) accounting for the largest median family size of 4.03 persons per family. On the other hand, single female/mother families (23 | 2.3%) represent the smallest median family size with 1.78 persons per family.
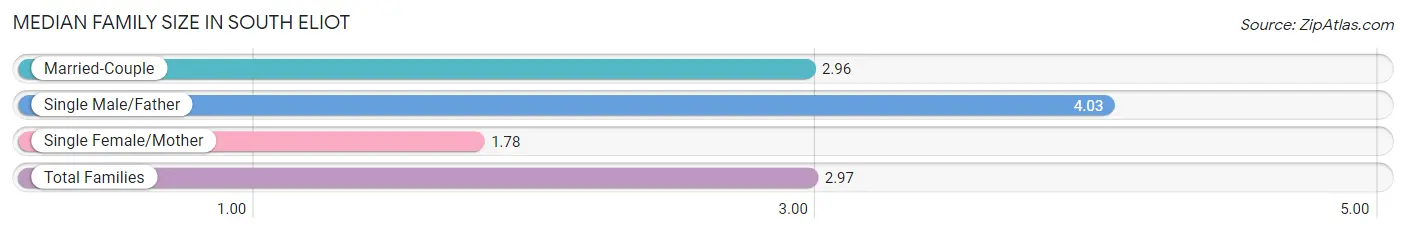
| Family Type | # Families | Family Size |
| Married-Couple | 943 (94.0%) | 2.96 |
| Single Male/Father | 37 (3.7%) | 4.03 |
| Single Female/Mother | 23 (2.3%) | 1.78 |
| Total Families | 1,003 (100.0%) | 2.97 |
Median Household Size in South Eliot
The median household size in South Eliot is 2.49 persons per household, with single male/father households (37 | 2.5%) accounting for the largest median household size of 5.19 persons per household. non-family households (475 | 32.1%) represent the smallest median household size with 1.29 persons per household.
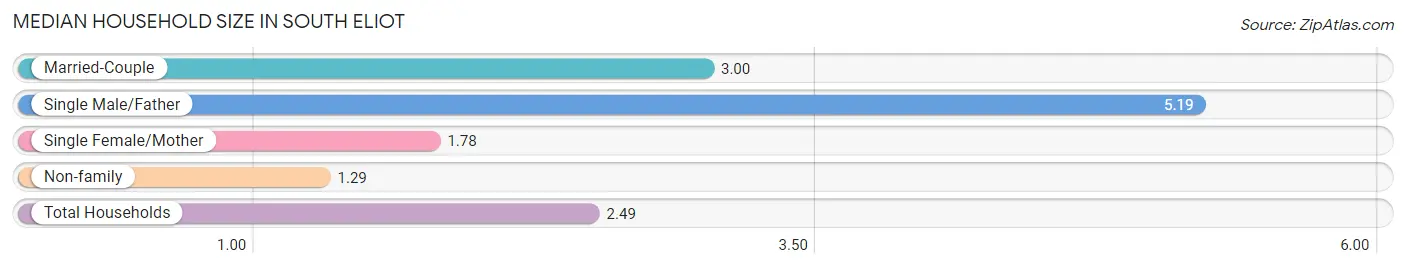
| Household Type | # Households | Household Size |
| Married-Couple | 943 (63.8%) | 3.00 |
| Single Male/Father | 37 (2.5%) | 5.19 |
| Single Female/Mother | 23 (1.6%) | 1.78 |
| Non-family | 475 (32.1%) | 1.29 |
| Total Households | 1,478 (100.0%) | 2.49 |
Household Size by Marriage Status in South Eliot
Out of a total of 1,478 households in South Eliot, 1,003 (67.9%) are family households, while 475 (32.1%) are nonfamily households. The most numerous type of family households are 2-person households, comprising 583, and the most common type of nonfamily households are 1-person households, comprising 361.
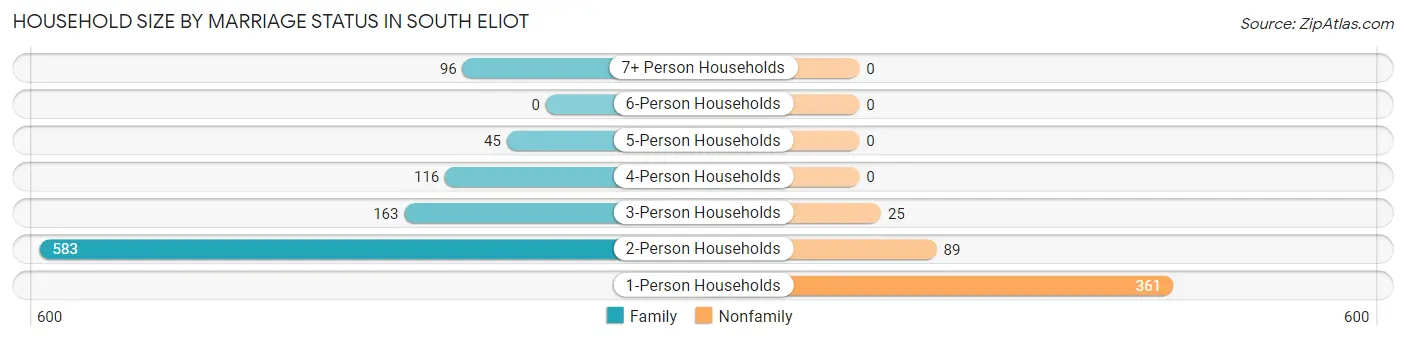
| Household Size | Family Households | Nonfamily Households |
| 1-Person Households | - | 361 (24.4%) |
| 2-Person Households | 583 (39.5%) | 89 (6.0%) |
| 3-Person Households | 163 (11.0%) | 25 (1.7%) |
| 4-Person Households | 116 (7.9%) | 0 (0.0%) |
| 5-Person Households | 45 (3.0%) | 0 (0.0%) |
| 6-Person Households | 0 (0.0%) | 0 (0.0%) |
| 7+ Person Households | 96 (6.5%) | 0 (0.0%) |
| Total | 1,003 (67.9%) | 475 (32.1%) |
Female Fertility in South Eliot
Fertility by Age in South Eliot
Average fertility rate in South Eliot is 75.0 births per 1,000 women. Women in the age bracket of 20 to 34 years have the highest fertility rate with 182.0 births per 1,000 women. Women in the age bracket of 20 to 34 years acount for 100.0% of all women with births.
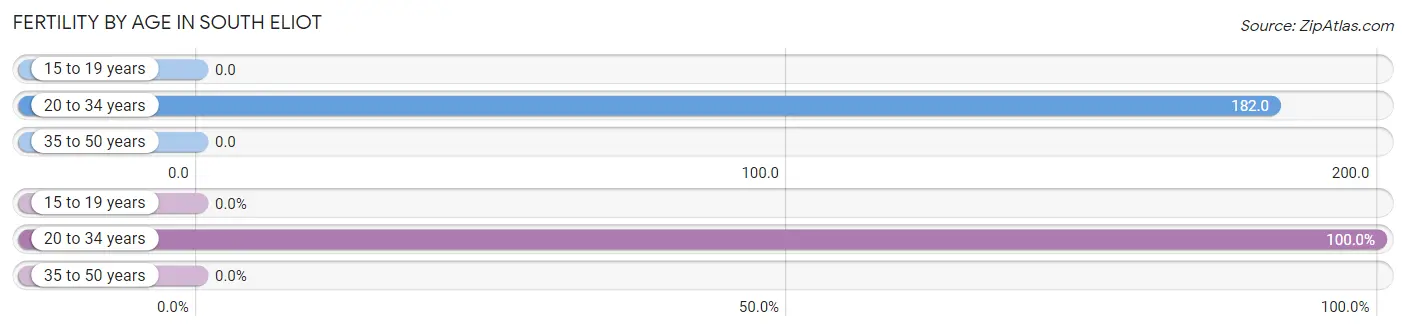
| Age Bracket | Women with Births | Births / 1,000 Women |
| 15 to 19 years | 0 (0.0%) | 0.0 |
| 20 to 34 years | 41 (100.0%) | 182.0 |
| 35 to 50 years | 0 (0.0%) | 0.0 |
| Total | 41 (100.0%) | 75.0 |
Fertility by Age by Marriage Status in South Eliot
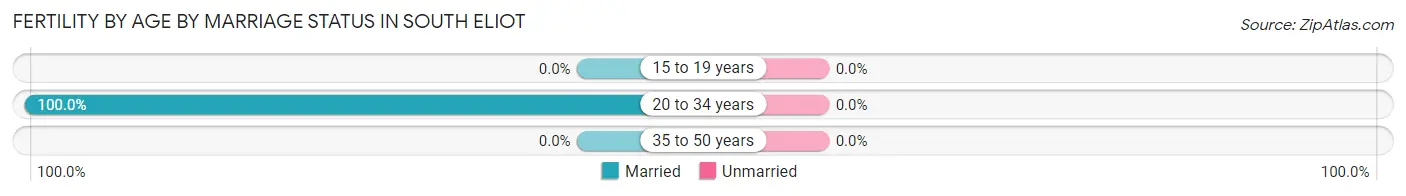
| Age Bracket | Married | Unmarried |
| 15 to 19 years | 0 (0.0%) | 0 (0.0%) |
| 20 to 34 years | 41 (100.0%) | 0 (0.0%) |
| 35 to 50 years | 0 (0.0%) | 0 (0.0%) |
| Total | 41 (100.0%) | 0 (0.0%) |
Fertility by Education in South Eliot
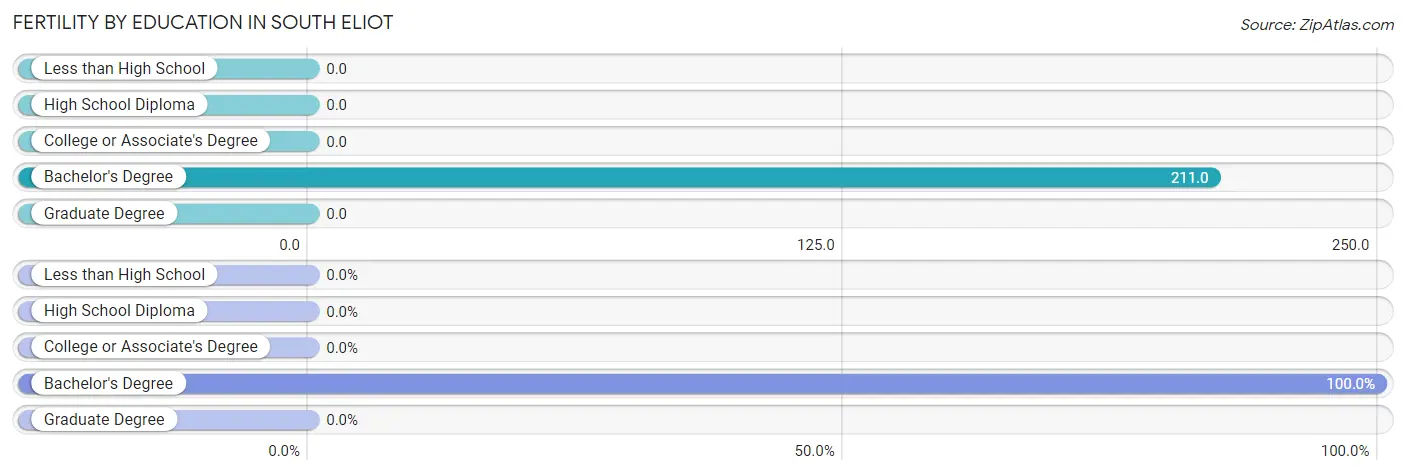
| Educational Attainment | Women with Births | Births / 1,000 Women |
| Less than High School | 0 (0.0%) | 0.0 |
| High School Diploma | 0 (0.0%) | 0.0 |
| College or Associate's Degree | 0 (0.0%) | 0.0 |
| Bachelor's Degree | 41 (100.0%) | 211.0 |
| Graduate Degree | 0 (0.0%) | 0.0 |
| Total | 41 (100.0%) | 75.0 |
Fertility by Education by Marriage Status in South Eliot
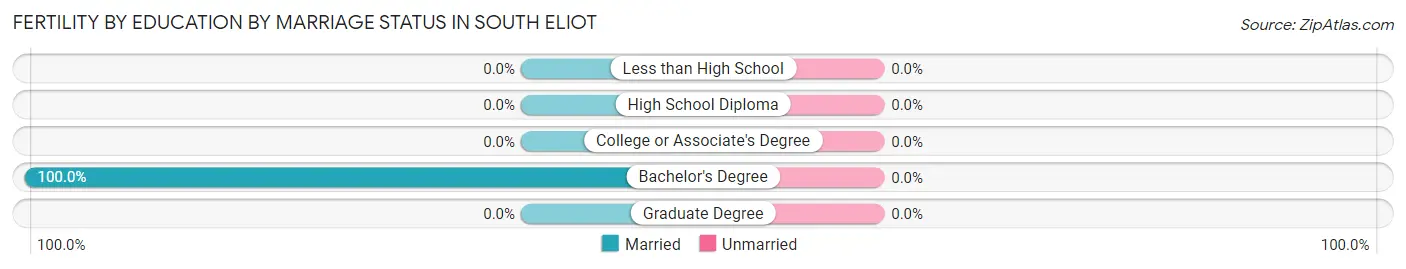
| Educational Attainment | Married | Unmarried |
| Less than High School | 0 (0.0%) | 0 (0.0%) |
| High School Diploma | 0 (0.0%) | 0 (0.0%) |
| College or Associate's Degree | 0 (0.0%) | 0 (0.0%) |
| Bachelor's Degree | 41 (100.0%) | 0 (0.0%) |
| Graduate Degree | 0 (0.0%) | 0 (0.0%) |
| Total | 41 (100.0%) | 0 (0.0%) |
Employment Characteristics in South Eliot
Employment by Class of Employer in South Eliot
Among the 1,970 employed individuals in South Eliot, private company employees (1,225 | 62.2%), federal government employees (293 | 14.9%), and not-for-profit organizations (190 | 9.6%) make up the most common classes of employment.
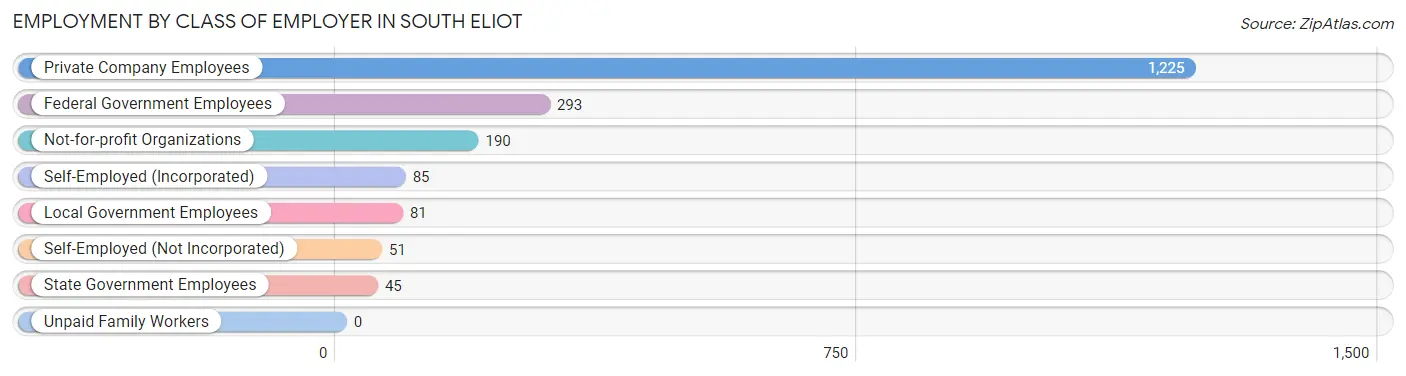
| Employer Class | # Employees | % Employees |
| Private Company Employees | 1,225 | 62.2% |
| Self-Employed (Incorporated) | 85 | 4.3% |
| Self-Employed (Not Incorporated) | 51 | 2.6% |
| Not-for-profit Organizations | 190 | 9.6% |
| Local Government Employees | 81 | 4.1% |
| State Government Employees | 45 | 2.3% |
| Federal Government Employees | 293 | 14.9% |
| Unpaid Family Workers | 0 | 0.0% |
| Total | 1,970 | 100.0% |
Employment Status by Age in South Eliot
According to the labor force statistics for South Eliot, out of the total population over 16 years of age (3,163), 64.4% or 2,037 individuals are in the labor force, with 2.6% or 53 of them unemployed. The age group with the highest labor force participation rate is 20 to 24 years, with 100.0% or 186 individuals in the labor force. Within the labor force, the 60 to 64 years age range has the highest percentage of unemployed individuals, with 10.1% or 30 of them being unemployed.
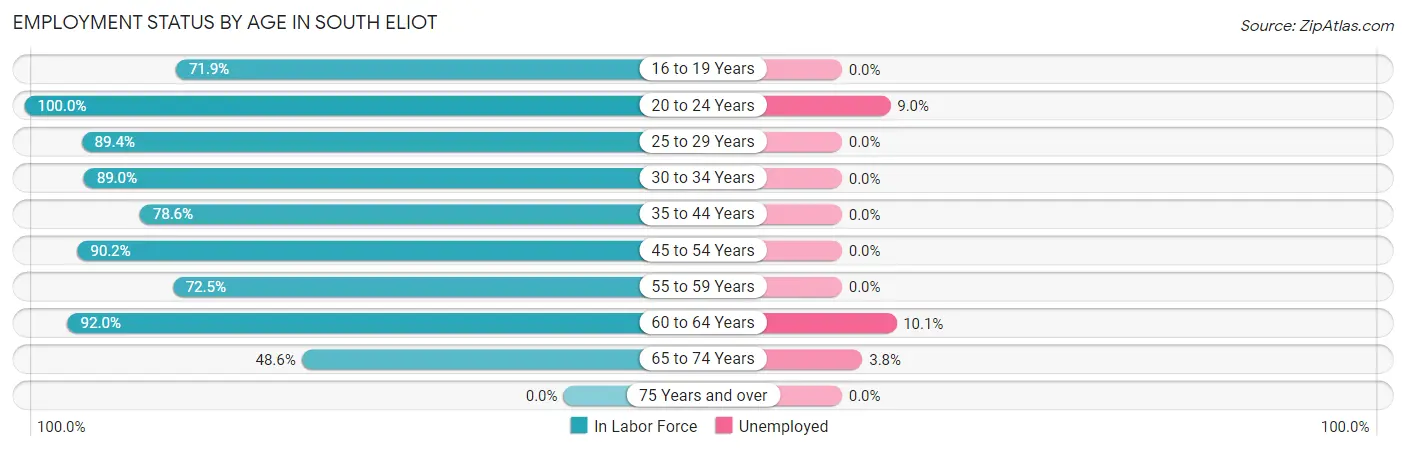
| Age Bracket | In Labor Force | Unemployed |
| 16 to 19 Years | 97 (71.9%) | 0 (0.0%) |
| 20 to 24 Years | 186 (100.0%) | 17 (9.0%) |
| 25 to 29 Years | 160 (89.4%) | 0 (0.0%) |
| 30 to 34 Years | 187 (89.0%) | 0 (0.0%) |
| 35 to 44 Years | 302 (78.6%) | 0 (0.0%) |
| 45 to 54 Years | 395 (90.2%) | 0 (0.0%) |
| 55 to 59 Years | 153 (72.5%) | 0 (0.0%) |
| 60 to 64 Years | 298 (92.0%) | 30 (10.1%) |
| 65 to 74 Years | 260 (48.6%) | 10 (3.8%) |
| 75 Years and over | 0 (0.0%) | 0 (0.0%) |
| Total | 2,037 (64.4%) | 53 (2.6%) |
Employment Status by Educational Attainment in South Eliot
According to labor force statistics for South Eliot, 85.6% of individuals (1,495) out of the total population between 25 and 64 years of age (1,746) are in the labor force, with 2.1% or 31 of them being unemployed. The group with the highest labor force participation rate are those with the educational attainment of less than high school, with 100.0% or 1 individuals in the labor force. Within the labor force, individuals with bachelor's degree or higher education have the highest percentage of unemployment, with 4.1% or 30 of them being unemployed.
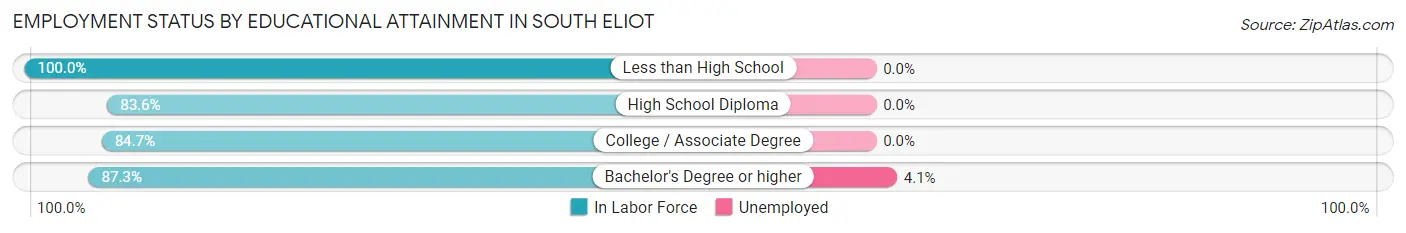
| Educational Attainment | In Labor Force | Unemployed |
| Less than High School | 1 (100.0%) | 0 (0.0%) |
| High School Diploma | 444 (83.6%) | 0 (0.0%) |
| College / Associate Degree | 327 (84.7%) | 0 (0.0%) |
| Bachelor's Degree or higher | 723 (87.3%) | 34 (4.1%) |
| Total | 1,495 (85.6%) | 37 (2.1%) |
Employment Occupations by Sex in South Eliot
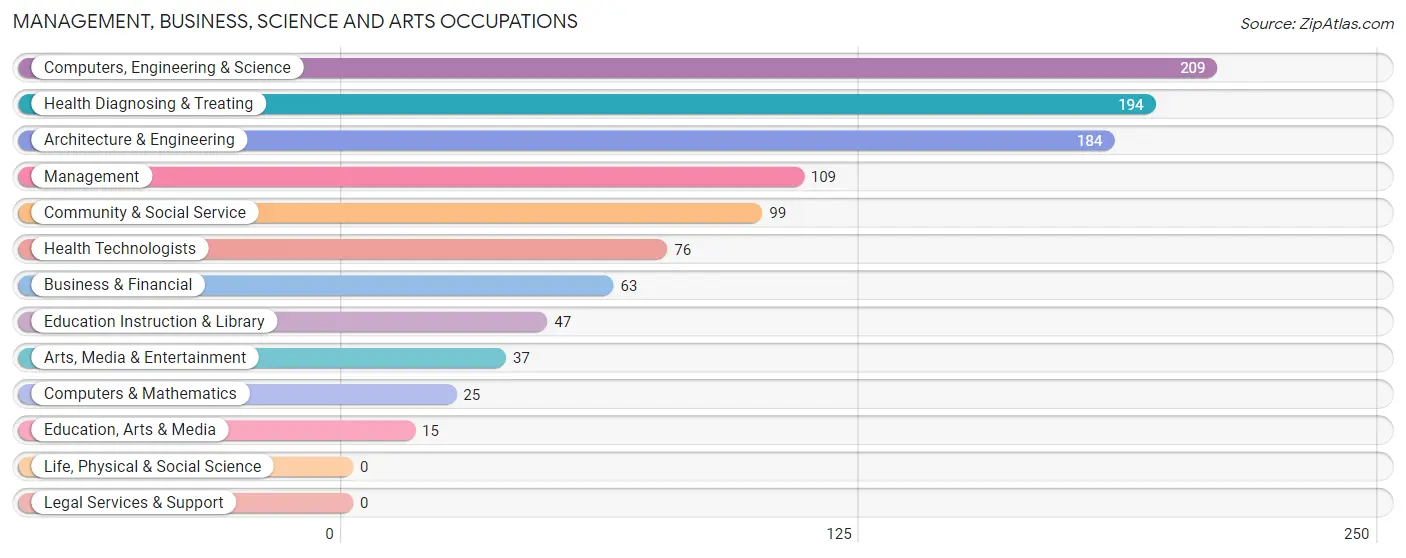
Management, Business, Science and Arts Occupations
The most common Management, Business, Science and Arts occupations in South Eliot are Computers, Engineering & Science (209 | 11.2%), Health Diagnosing & Treating (194 | 10.4%), Architecture & Engineering (184 | 9.9%), Management (109 | 5.9%), and Community & Social Service (99 | 5.3%).
Management, Business, Science and Arts Occupations by Sex
Within the Management, Business, Science and Arts occupations in South Eliot, the most male-oriented occupations are Computers & Mathematics (100.0%), Computers, Engineering & Science (90.9%), and Architecture & Engineering (89.7%), while the most female-oriented occupations are Business & Financial (100.0%), Health Technologists (100.0%), and Education, Arts & Media (86.7%).
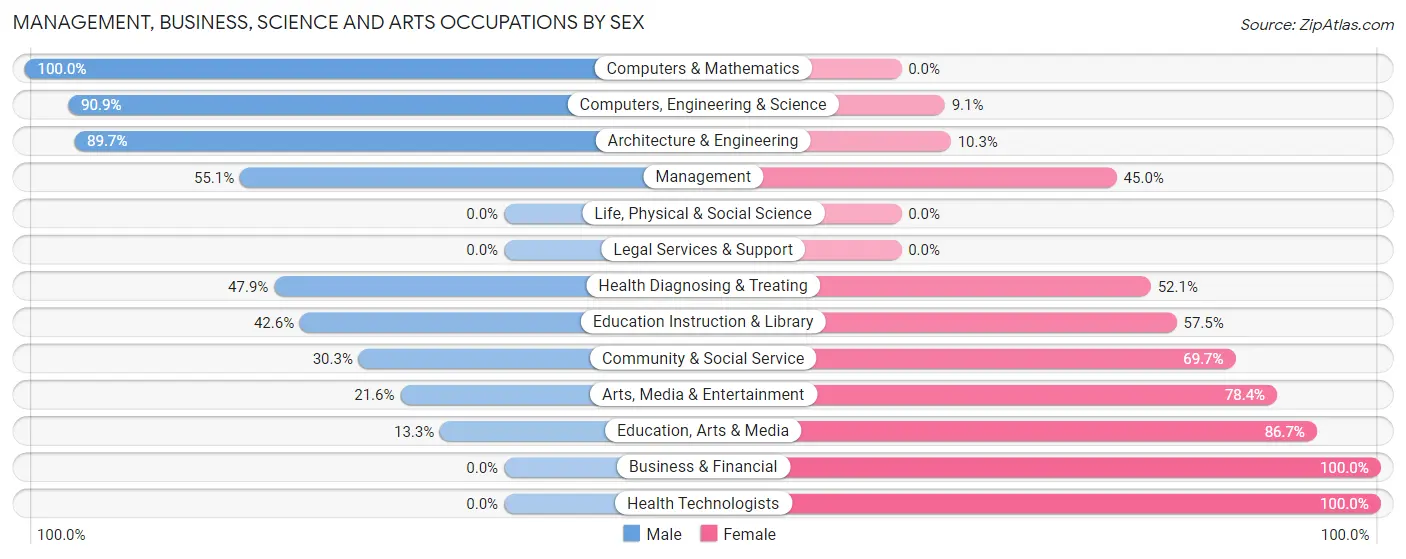
| Occupation | Male | Female |
| Management | 60 (55.0%) | 49 (45.0%) |
| Business & Financial | 0 (0.0%) | 63 (100.0%) |
| Computers, Engineering & Science | 190 (90.9%) | 19 (9.1%) |
| Computers & Mathematics | 25 (100.0%) | 0 (0.0%) |
| Architecture & Engineering | 165 (89.7%) | 19 (10.3%) |
| Life, Physical & Social Science | 0 (0.0%) | 0 (0.0%) |
| Community & Social Service | 30 (30.3%) | 69 (69.7%) |
| Education, Arts & Media | 2 (13.3%) | 13 (86.7%) |
| Legal Services & Support | 0 (0.0%) | 0 (0.0%) |
| Education Instruction & Library | 20 (42.5%) | 27 (57.5%) |
| Arts, Media & Entertainment | 8 (21.6%) | 29 (78.4%) |
| Health Diagnosing & Treating | 93 (47.9%) | 101 (52.1%) |
| Health Technologists | 0 (0.0%) | 76 (100.0%) |
| Total (Category) | 373 (55.3%) | 301 (44.7%) |
| Total (Overall) | 985 (52.9%) | 876 (47.1%) |
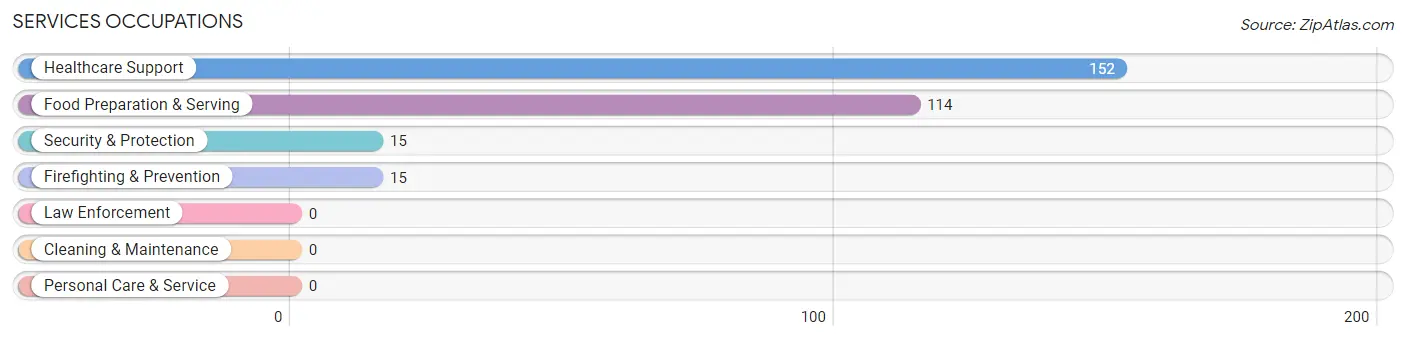
Services Occupations
The most common Services occupations in South Eliot are Healthcare Support (152 | 8.2%), Food Preparation & Serving (114 | 6.1%), Security & Protection (15 | 0.8%), and Firefighting & Prevention (15 | 0.8%).
Services Occupations by Sex
Within the Services occupations in South Eliot, the most male-oriented occupations are Food Preparation & Serving (33.3%), and Healthcare Support (2.6%), while the most female-oriented occupations are Security & Protection (100.0%), Firefighting & Prevention (100.0%), and Healthcare Support (97.4%).
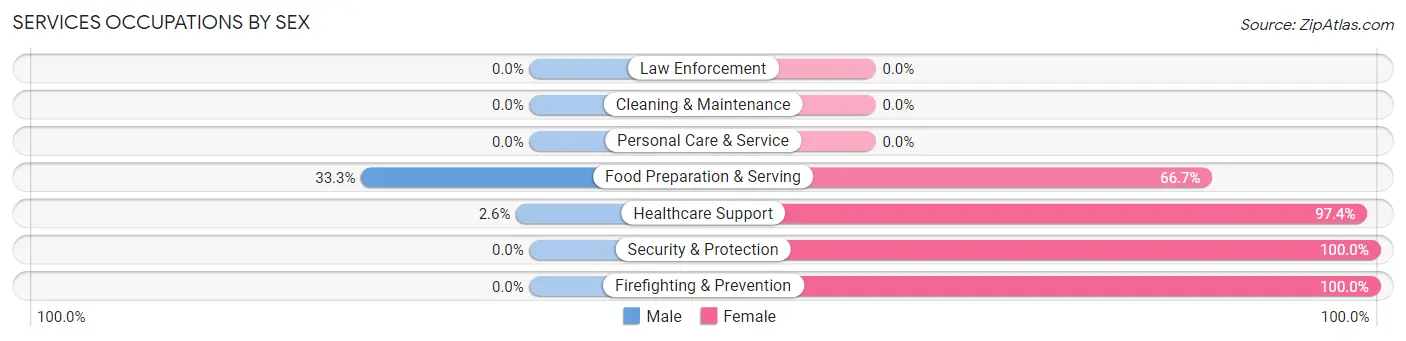
| Occupation | Male | Female |
| Healthcare Support | 4 (2.6%) | 148 (97.4%) |
| Security & Protection | 0 (0.0%) | 15 (100.0%) |
| Firefighting & Prevention | 0 (0.0%) | 15 (100.0%) |
| Law Enforcement | 0 (0.0%) | 0 (0.0%) |
| Food Preparation & Serving | 38 (33.3%) | 76 (66.7%) |
| Cleaning & Maintenance | 0 (0.0%) | 0 (0.0%) |
| Personal Care & Service | 0 (0.0%) | 0 (0.0%) |
| Total (Category) | 42 (14.9%) | 239 (85.1%) |
| Total (Overall) | 985 (52.9%) | 876 (47.1%) |
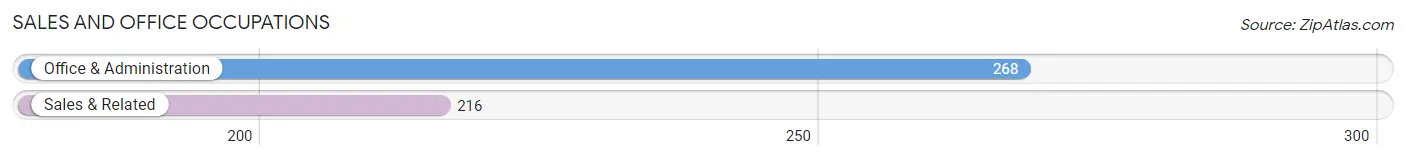
Sales and Office Occupations
The most common Sales and Office occupations in South Eliot are Office & Administration (268 | 14.4%), and Sales & Related (216 | 11.6%).
Sales and Office Occupations by Sex
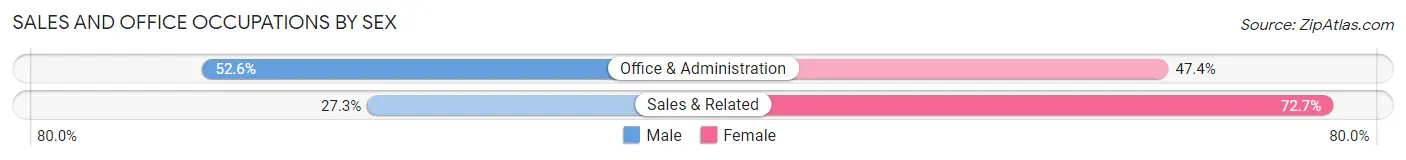
| Occupation | Male | Female |
| Sales & Related | 59 (27.3%) | 157 (72.7%) |
| Office & Administration | 141 (52.6%) | 127 (47.4%) |
| Total (Category) | 200 (41.3%) | 284 (58.7%) |
| Total (Overall) | 985 (52.9%) | 876 (47.1%) |
Natural Resources, Construction and Maintenance Occupations
The most common Natural Resources, Construction and Maintenance occupations in South Eliot are Installation, Maintenance & Repair (122 | 6.6%), and Construction & Extraction (74 | 4.0%).

Natural Resources, Construction and Maintenance Occupations by Sex
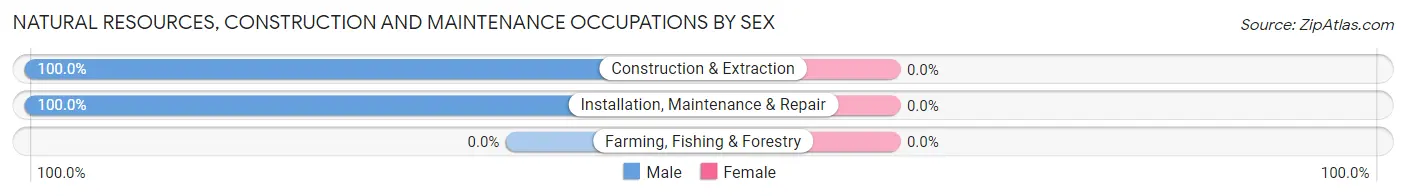
| Occupation | Male | Female |
| Farming, Fishing & Forestry | 0 (0.0%) | 0 (0.0%) |
| Construction & Extraction | 74 (100.0%) | 0 (0.0%) |
| Installation, Maintenance & Repair | 122 (100.0%) | 0 (0.0%) |
| Total (Category) | 196 (100.0%) | 0 (0.0%) |
| Total (Overall) | 985 (52.9%) | 876 (47.1%) |
Production, Transportation and Moving Occupations
The most common Production, Transportation and Moving occupations in South Eliot are Production (113 | 6.1%), Material Moving (93 | 5.0%), and Transportation (20 | 1.1%).
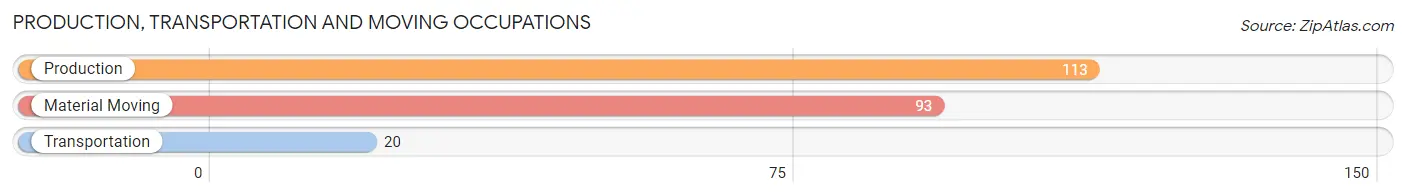
Production, Transportation and Moving Occupations by Sex
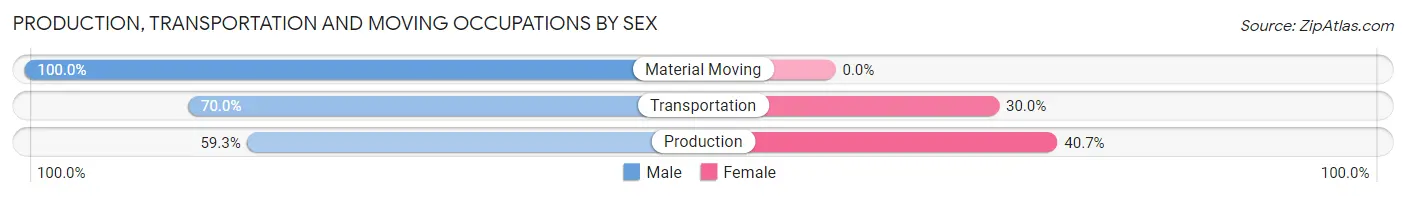
| Occupation | Male | Female |
| Production | 67 (59.3%) | 46 (40.7%) |
| Transportation | 14 (70.0%) | 6 (30.0%) |
| Material Moving | 93 (100.0%) | 0 (0.0%) |
| Total (Category) | 174 (77.0%) | 52 (23.0%) |
| Total (Overall) | 985 (52.9%) | 876 (47.1%) |
Employment Industries by Sex in South Eliot
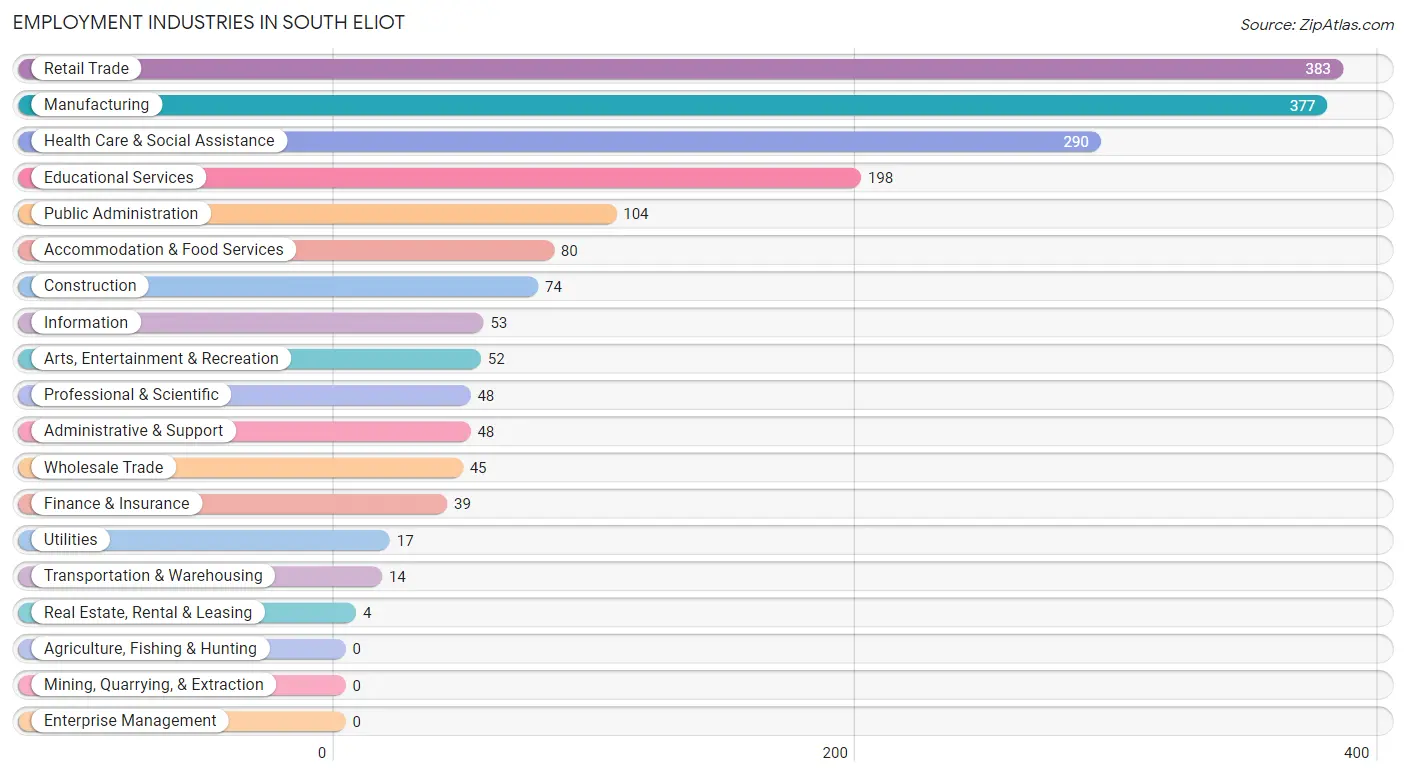
Employment Industries in South Eliot
The major employment industries in South Eliot include Retail Trade (383 | 20.6%), Manufacturing (377 | 20.3%), Health Care & Social Assistance (290 | 15.6%), Educational Services (198 | 10.6%), and Public Administration (104 | 5.6%).
Employment Industries by Sex in South Eliot
The South Eliot industries that see more men than women are Construction (100.0%), Transportation & Warehousing (100.0%), and Utilities (100.0%), whereas the industries that tend to have a higher number of women are Finance & Insurance (100.0%), Real Estate, Rental & Leasing (100.0%), and Arts, Entertainment & Recreation (84.6%).
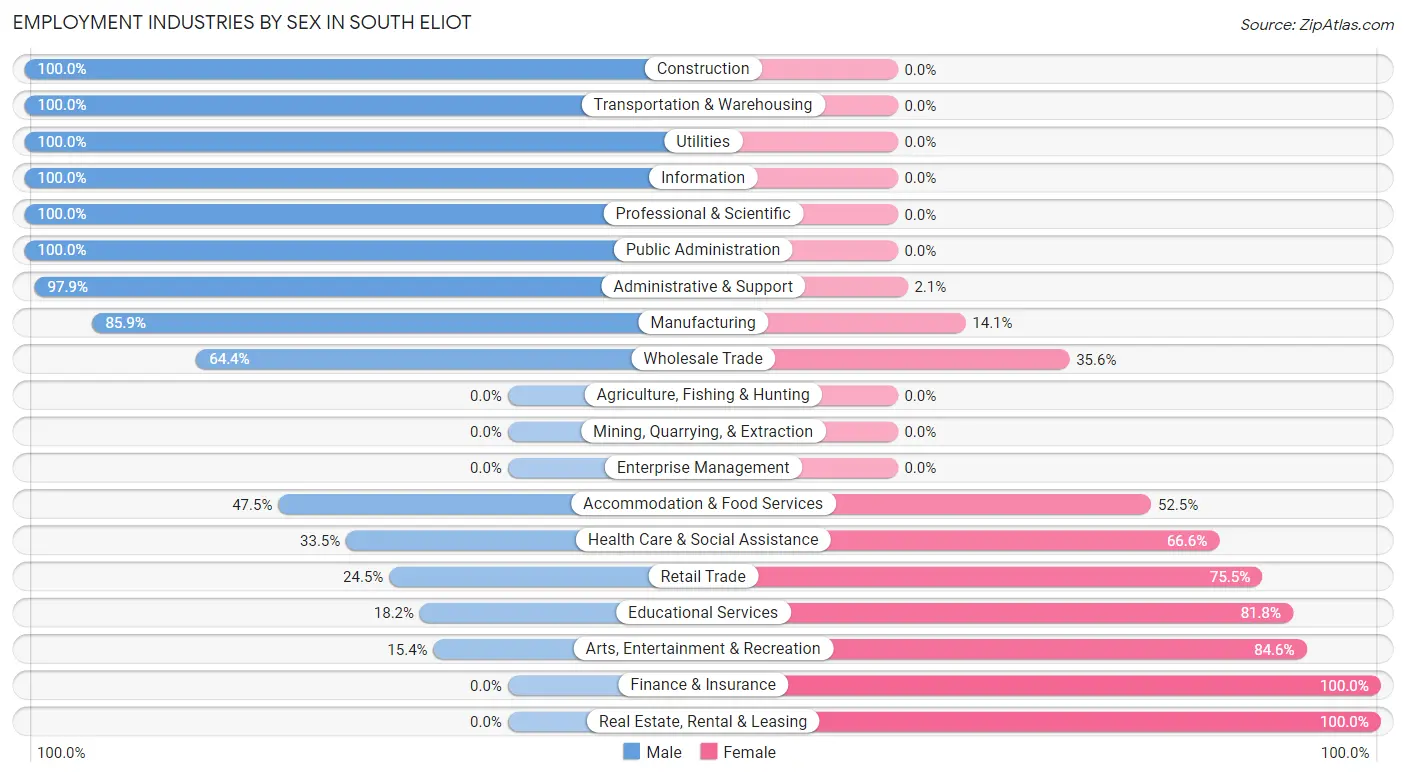
| Industry | Male | Female |
| Agriculture, Fishing & Hunting | 0 (0.0%) | 0 (0.0%) |
| Mining, Quarrying, & Extraction | 0 (0.0%) | 0 (0.0%) |
| Construction | 74 (100.0%) | 0 (0.0%) |
| Manufacturing | 324 (85.9%) | 53 (14.1%) |
| Wholesale Trade | 29 (64.4%) | 16 (35.6%) |
| Retail Trade | 94 (24.5%) | 289 (75.5%) |
| Transportation & Warehousing | 14 (100.0%) | 0 (0.0%) |
| Utilities | 17 (100.0%) | 0 (0.0%) |
| Information | 53 (100.0%) | 0 (0.0%) |
| Finance & Insurance | 0 (0.0%) | 39 (100.0%) |
| Real Estate, Rental & Leasing | 0 (0.0%) | 4 (100.0%) |
| Professional & Scientific | 48 (100.0%) | 0 (0.0%) |
| Enterprise Management | 0 (0.0%) | 0 (0.0%) |
| Administrative & Support | 47 (97.9%) | 1 (2.1%) |
| Educational Services | 36 (18.2%) | 162 (81.8%) |
| Health Care & Social Assistance | 97 (33.5%) | 193 (66.5%) |
| Arts, Entertainment & Recreation | 8 (15.4%) | 44 (84.6%) |
| Accommodation & Food Services | 38 (47.5%) | 42 (52.5%) |
| Public Administration | 104 (100.0%) | 0 (0.0%) |
| Total | 985 (52.9%) | 876 (47.1%) |
Education in South Eliot
School Enrollment in South Eliot
The most common levels of schooling among the 520 students in South Eliot are middle school (163 | 31.4%), elementary school (112 | 21.5%), and high school (100 | 19.2%).
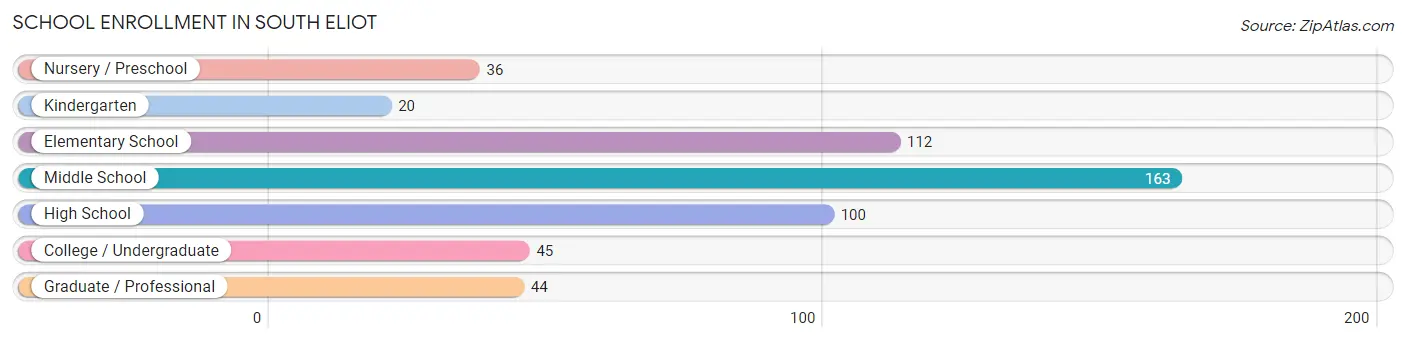
| School Level | # Students | % Students |
| Nursery / Preschool | 36 | 6.9% |
| Kindergarten | 20 | 3.8% |
| Elementary School | 112 | 21.5% |
| Middle School | 163 | 31.4% |
| High School | 100 | 19.2% |
| College / Undergraduate | 45 | 8.6% |
| Graduate / Professional | 44 | 8.5% |
| Total | 520 | 100.0% |
School Enrollment by Age by Funding Source in South Eliot
Out of a total of 520 students who are enrolled in schools in South Eliot, 209 (40.2%) attend a private institution, while the remaining 311 (59.8%) are enrolled in public schools. The age group of 5 to 9 year old has the highest likelihood of being enrolled in private schools, with 75 (63.6% in the age bracket) enrolled. Conversely, the age group of 15 to 17 year olds has the lowest likelihood of being enrolled in a private school, with 96 (100.0% in the age bracket) attending a public institution.
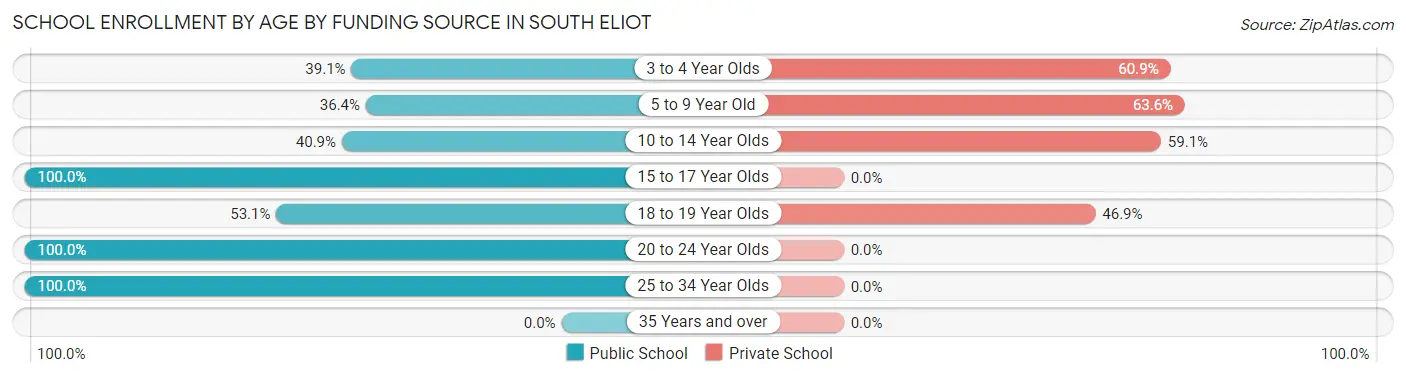
| Age Bracket | Public School | Private School |
| 3 to 4 Year Olds | 18 (39.1%) | 28 (60.9%) |
| 5 to 9 Year Old | 43 (36.4%) | 75 (63.6%) |
| 10 to 14 Year Olds | 63 (40.9%) | 91 (59.1%) |
| 15 to 17 Year Olds | 96 (100.0%) | 0 (0.0%) |
| 18 to 19 Year Olds | 17 (53.1%) | 15 (46.9%) |
| 20 to 24 Year Olds | 30 (100.0%) | 0 (0.0%) |
| 25 to 34 Year Olds | 44 (100.0%) | 0 (0.0%) |
| 35 Years and over | 0 (0.0%) | 0 (0.0%) |
| Total | 311 (59.8%) | 209 (40.2%) |
Educational Attainment by Field of Study in South Eliot
Business (262 | 19.8%), science & technology (175 | 13.2%), education (162 | 12.2%), literature & languages (110 | 8.3%), and bio, nature & agricultural (96 | 7.3%) are the most common fields of study among 1,323 individuals in South Eliot who have obtained a bachelor's degree or higher.
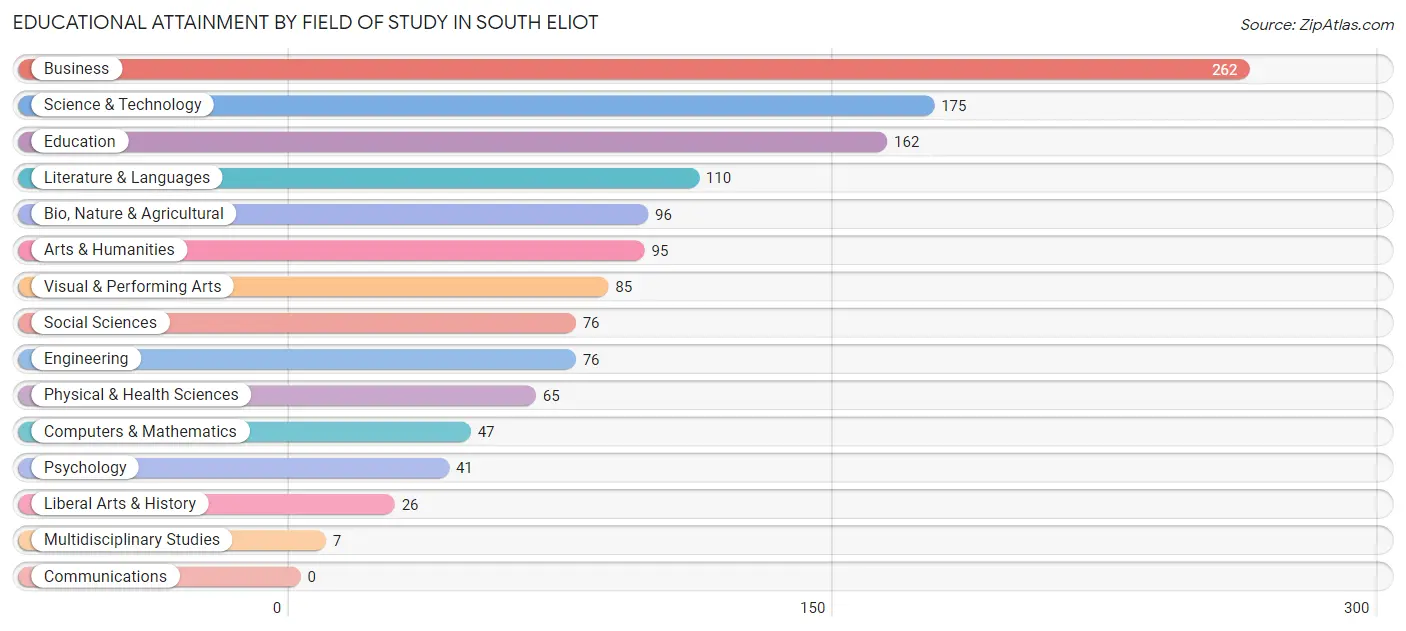
| Field of Study | # Graduates | % Graduates |
| Computers & Mathematics | 47 | 3.5% |
| Bio, Nature & Agricultural | 96 | 7.3% |
| Physical & Health Sciences | 65 | 4.9% |
| Psychology | 41 | 3.1% |
| Social Sciences | 76 | 5.7% |
| Engineering | 76 | 5.7% |
| Multidisciplinary Studies | 7 | 0.5% |
| Science & Technology | 175 | 13.2% |
| Business | 262 | 19.8% |
| Education | 162 | 12.2% |
| Literature & Languages | 110 | 8.3% |
| Liberal Arts & History | 26 | 2.0% |
| Visual & Performing Arts | 85 | 6.4% |
| Communications | 0 | 0.0% |
| Arts & Humanities | 95 | 7.2% |
| Total | 1,323 | 100.0% |
Transportation & Commute in South Eliot
Vehicle Availability by Sex in South Eliot
The most prevalent vehicle ownership categories in South Eliot are males with 2 vehicles (469, accounting for 42.9%) and females with 2 vehicles (526, making up 53.7%).
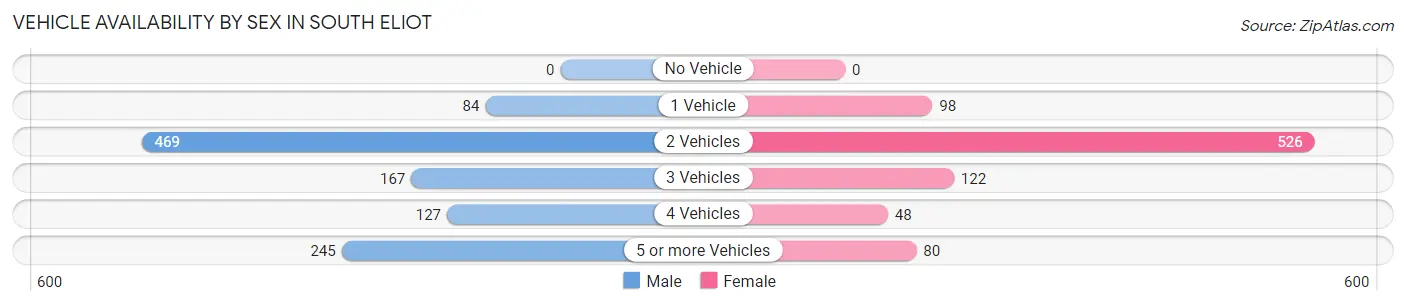
| Vehicles Available | Male | Female |
| No Vehicle | 0 (0.0%) | 0 (0.0%) |
| 1 Vehicle | 84 (7.7%) | 98 (11.2%) |
| 2 Vehicles | 469 (42.9%) | 526 (60.2%) |
| 3 Vehicles | 167 (15.3%) | 122 (14.0%) |
| 4 Vehicles | 127 (11.6%) | 48 (5.5%) |
| 5 or more Vehicles | 245 (22.4%) | 80 (9.1%) |
| Total | 1,092 (100.0%) | 874 (100.0%) |
Commute Time in South Eliot
The most frequently occuring commute durations in South Eliot are 10 to 14 minutes (456 commuters, 25.3%), 5 to 9 minutes (294 commuters, 16.3%), and 15 to 19 minutes (272 commuters, 15.1%).
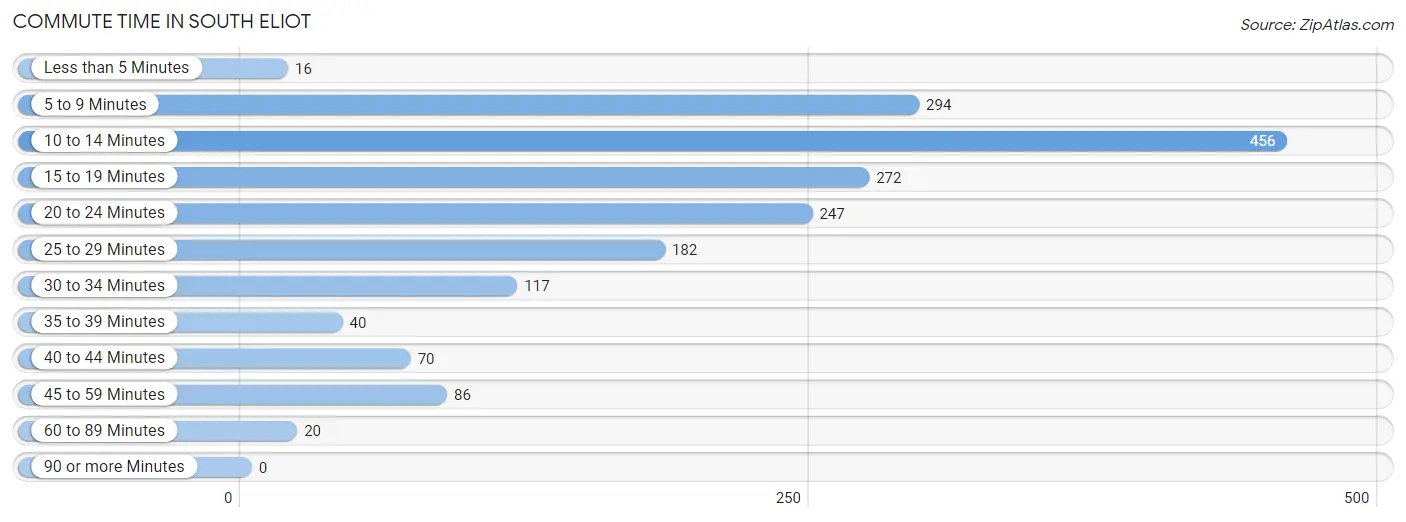
| Commute Time | # Commuters | % Commuters |
| Less than 5 Minutes | 16 | 0.9% |
| 5 to 9 Minutes | 294 | 16.3% |
| 10 to 14 Minutes | 456 | 25.3% |
| 15 to 19 Minutes | 272 | 15.1% |
| 20 to 24 Minutes | 247 | 13.7% |
| 25 to 29 Minutes | 182 | 10.1% |
| 30 to 34 Minutes | 117 | 6.5% |
| 35 to 39 Minutes | 40 | 2.2% |
| 40 to 44 Minutes | 70 | 3.9% |
| 45 to 59 Minutes | 86 | 4.8% |
| 60 to 89 Minutes | 20 | 1.1% |
| 90 or more Minutes | 0 | 0.0% |
Commute Time by Sex in South Eliot
The most common commute times in South Eliot are 10 to 14 minutes (309 commuters, 30.3%) for males and 5 to 9 minutes (193 commuters, 24.7%) for females.
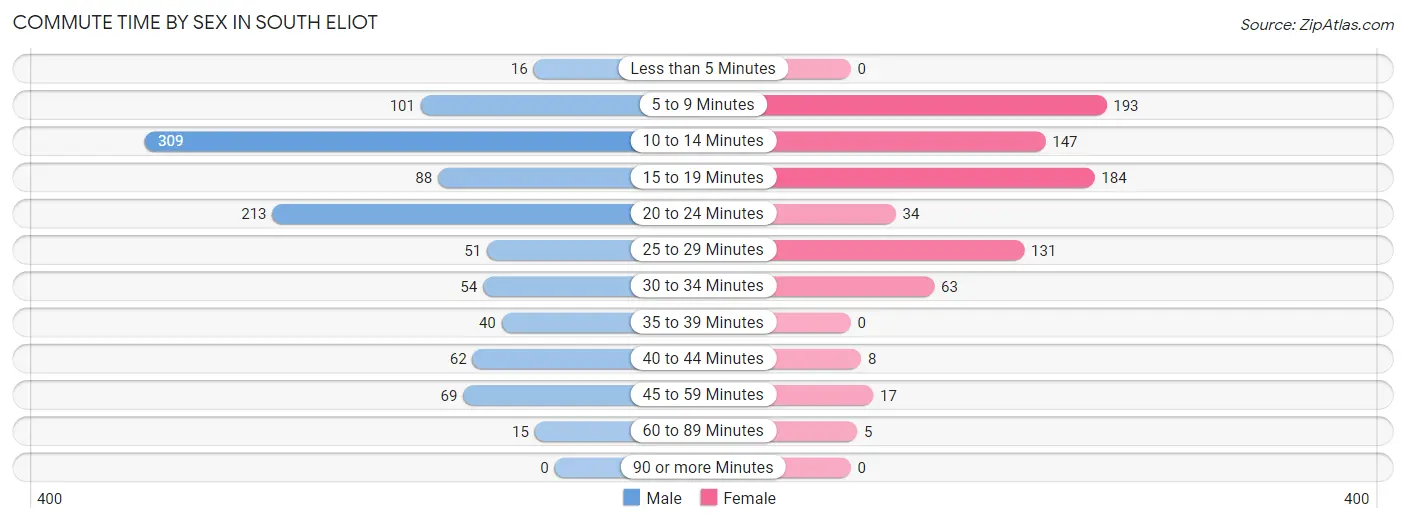
| Commute Time | Male | Female |
| Less than 5 Minutes | 16 (1.6%) | 0 (0.0%) |
| 5 to 9 Minutes | 101 (9.9%) | 193 (24.7%) |
| 10 to 14 Minutes | 309 (30.3%) | 147 (18.8%) |
| 15 to 19 Minutes | 88 (8.6%) | 184 (23.5%) |
| 20 to 24 Minutes | 213 (20.9%) | 34 (4.3%) |
| 25 to 29 Minutes | 51 (5.0%) | 131 (16.8%) |
| 30 to 34 Minutes | 54 (5.3%) | 63 (8.1%) |
| 35 to 39 Minutes | 40 (3.9%) | 0 (0.0%) |
| 40 to 44 Minutes | 62 (6.1%) | 8 (1.0%) |
| 45 to 59 Minutes | 69 (6.8%) | 17 (2.2%) |
| 60 to 89 Minutes | 15 (1.5%) | 5 (0.6%) |
| 90 or more Minutes | 0 (0.0%) | 0 (0.0%) |
Time of Departure to Work by Sex in South Eliot
The most frequent times of departure to work in South Eliot are 7:30 AM to 7:59 AM (201, 19.7%) for males and 8:00 AM to 8:29 AM (221, 28.3%) for females.
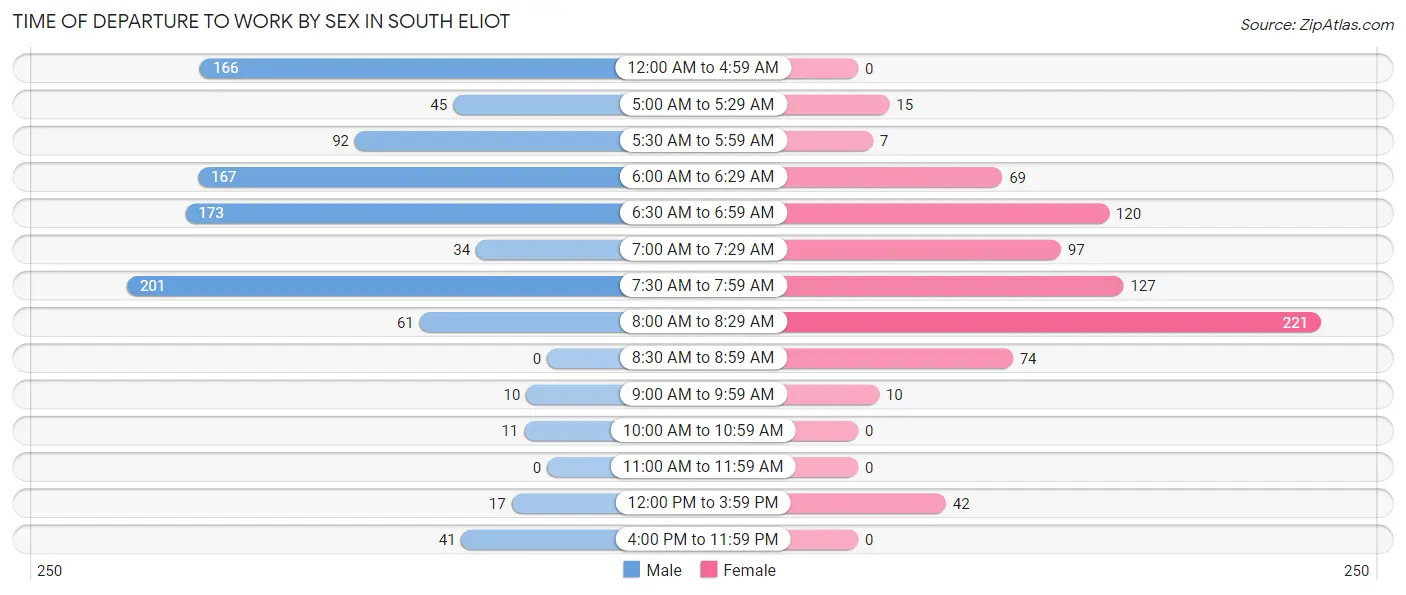
| Time of Departure | Male | Female |
| 12:00 AM to 4:59 AM | 166 (16.3%) | 0 (0.0%) |
| 5:00 AM to 5:29 AM | 45 (4.4%) | 15 (1.9%) |
| 5:30 AM to 5:59 AM | 92 (9.0%) | 7 (0.9%) |
| 6:00 AM to 6:29 AM | 167 (16.4%) | 69 (8.8%) |
| 6:30 AM to 6:59 AM | 173 (17.0%) | 120 (15.3%) |
| 7:00 AM to 7:29 AM | 34 (3.3%) | 97 (12.4%) |
| 7:30 AM to 7:59 AM | 201 (19.7%) | 127 (16.2%) |
| 8:00 AM to 8:29 AM | 61 (6.0%) | 221 (28.3%) |
| 8:30 AM to 8:59 AM | 0 (0.0%) | 74 (9.5%) |
| 9:00 AM to 9:59 AM | 10 (1.0%) | 10 (1.3%) |
| 10:00 AM to 10:59 AM | 11 (1.1%) | 0 (0.0%) |
| 11:00 AM to 11:59 AM | 0 (0.0%) | 0 (0.0%) |
| 12:00 PM to 3:59 PM | 17 (1.7%) | 42 (5.4%) |
| 4:00 PM to 11:59 PM | 41 (4.0%) | 0 (0.0%) |
| Total | 1,018 (100.0%) | 782 (100.0%) |
Housing Occupancy in South Eliot
Occupancy by Ownership in South Eliot
Of the total 1,478 dwellings in South Eliot, owner-occupied units account for 1,212 (82.0%), while renter-occupied units make up 266 (18.0%).
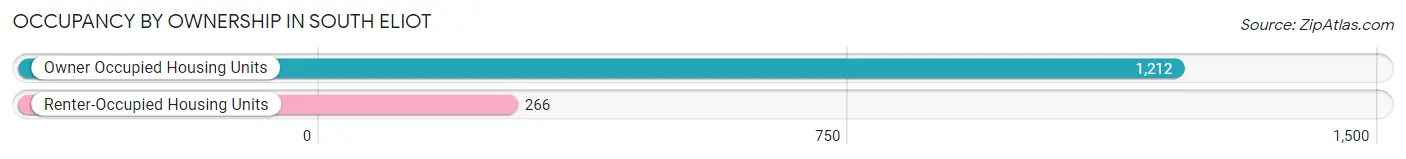
| Occupancy | # Housing Units | % Housing Units |
| Owner Occupied Housing Units | 1,212 | 82.0% |
| Renter-Occupied Housing Units | 266 | 18.0% |
| Total Occupied Housing Units | 1,478 | 100.0% |
Occupancy by Household Size in South Eliot
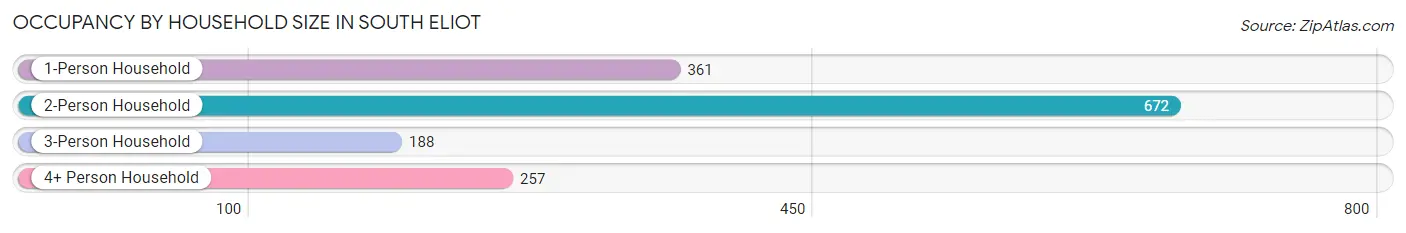
| Household Size | # Housing Units | % Housing Units |
| 1-Person Household | 361 | 24.4% |
| 2-Person Household | 672 | 45.5% |
| 3-Person Household | 188 | 12.7% |
| 4+ Person Household | 257 | 17.4% |
| Total Housing Units | 1,478 | 100.0% |
Occupancy by Ownership by Household Size in South Eliot
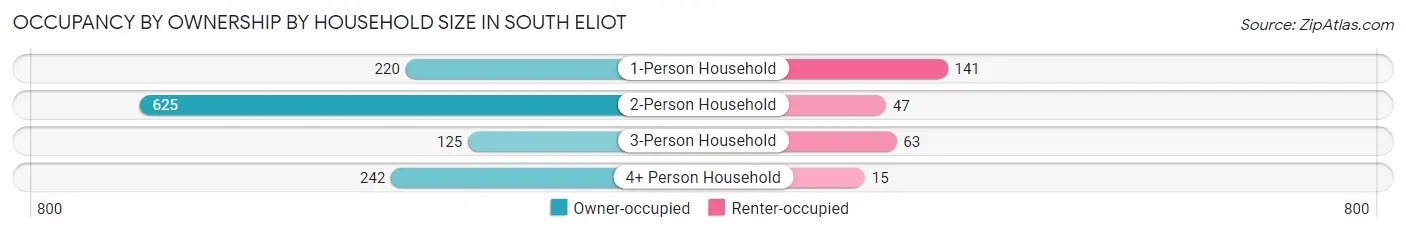
| Household Size | Owner-occupied | Renter-occupied |
| 1-Person Household | 220 (60.9%) | 141 (39.1%) |
| 2-Person Household | 625 (93.0%) | 47 (7.0%) |
| 3-Person Household | 125 (66.5%) | 63 (33.5%) |
| 4+ Person Household | 242 (94.2%) | 15 (5.8%) |
| Total Housing Units | 1,212 (82.0%) | 266 (18.0%) |
Occupancy by Educational Attainment in South Eliot
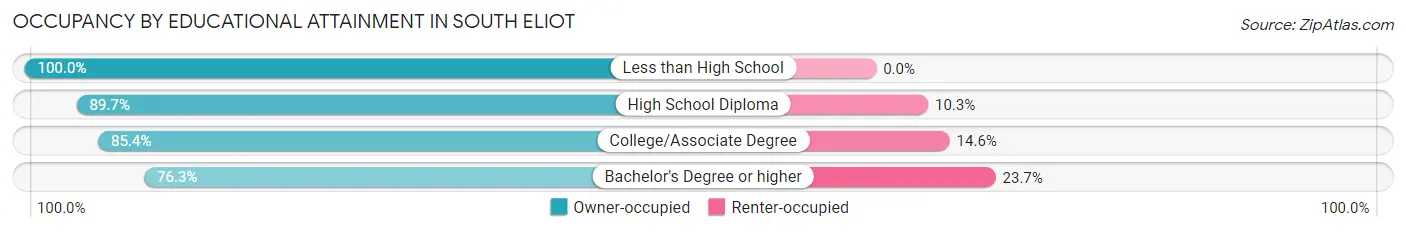
| Household Size | Owner-occupied | Renter-occupied |
| Less than High School | 11 (100.0%) | 0 (0.0%) |
| High School Diploma | 244 (89.7%) | 28 (10.3%) |
| College/Associate Degree | 422 (85.4%) | 72 (14.6%) |
| Bachelor's Degree or higher | 535 (76.3%) | 166 (23.7%) |
Occupancy by Age of Householder in South Eliot
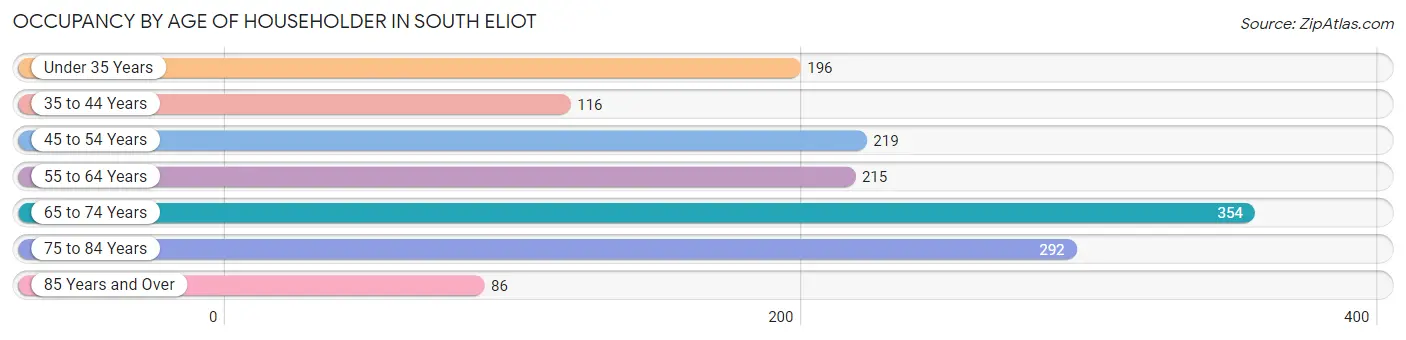
| Age Bracket | # Households | % Households |
| Under 35 Years | 196 | 13.3% |
| 35 to 44 Years | 116 | 7.9% |
| 45 to 54 Years | 219 | 14.8% |
| 55 to 64 Years | 215 | 14.5% |
| 65 to 74 Years | 354 | 23.9% |
| 75 to 84 Years | 292 | 19.8% |
| 85 Years and Over | 86 | 5.8% |
| Total | 1,478 | 100.0% |
Housing Finances in South Eliot
Median Income by Occupancy in South Eliot
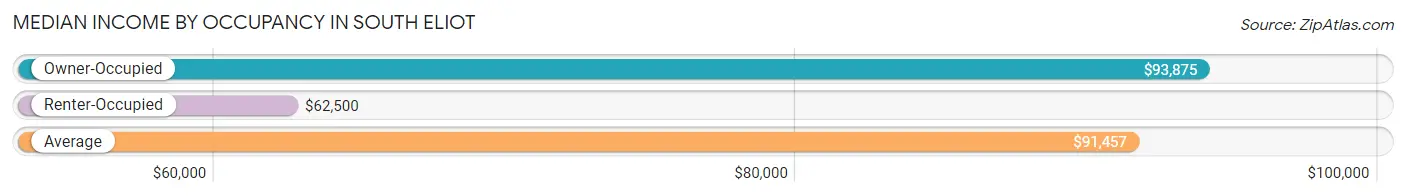
| Occupancy Type | # Households | Median Income |
| Owner-Occupied | 1,212 (82.0%) | $93,875 |
| Renter-Occupied | 266 (18.0%) | $62,500 |
| Average | 1,478 (100.0%) | $91,457 |
Occupancy by Householder Income Bracket in South Eliot
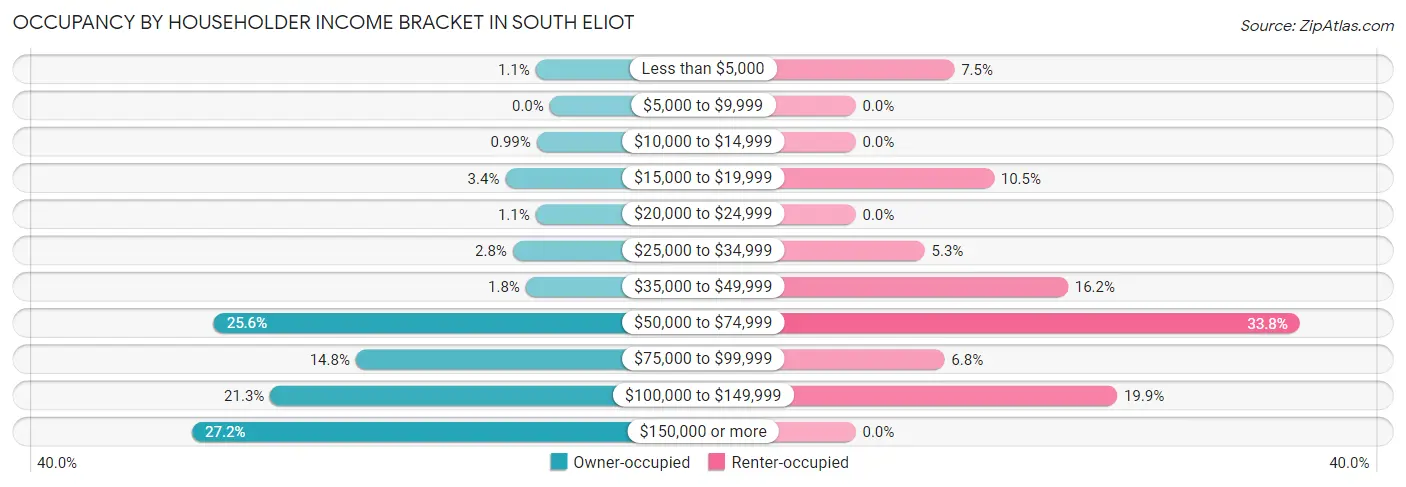
| Income Bracket | Owner-occupied | Renter-occupied |
| Less than $5,000 | 13 (1.1%) | 20 (7.5%) |
| $5,000 to $9,999 | 0 (0.0%) | 0 (0.0%) |
| $10,000 to $14,999 | 12 (1.0%) | 0 (0.0%) |
| $15,000 to $19,999 | 41 (3.4%) | 28 (10.5%) |
| $20,000 to $24,999 | 13 (1.1%) | 0 (0.0%) |
| $25,000 to $34,999 | 34 (2.8%) | 14 (5.3%) |
| $35,000 to $49,999 | 22 (1.8%) | 43 (16.2%) |
| $50,000 to $74,999 | 310 (25.6%) | 90 (33.8%) |
| $75,000 to $99,999 | 179 (14.8%) | 18 (6.8%) |
| $100,000 to $149,999 | 258 (21.3%) | 53 (19.9%) |
| $150,000 or more | 330 (27.2%) | 0 (0.0%) |
| Total | 1,212 (100.0%) | 266 (100.0%) |
Monthly Housing Cost Tiers in South Eliot
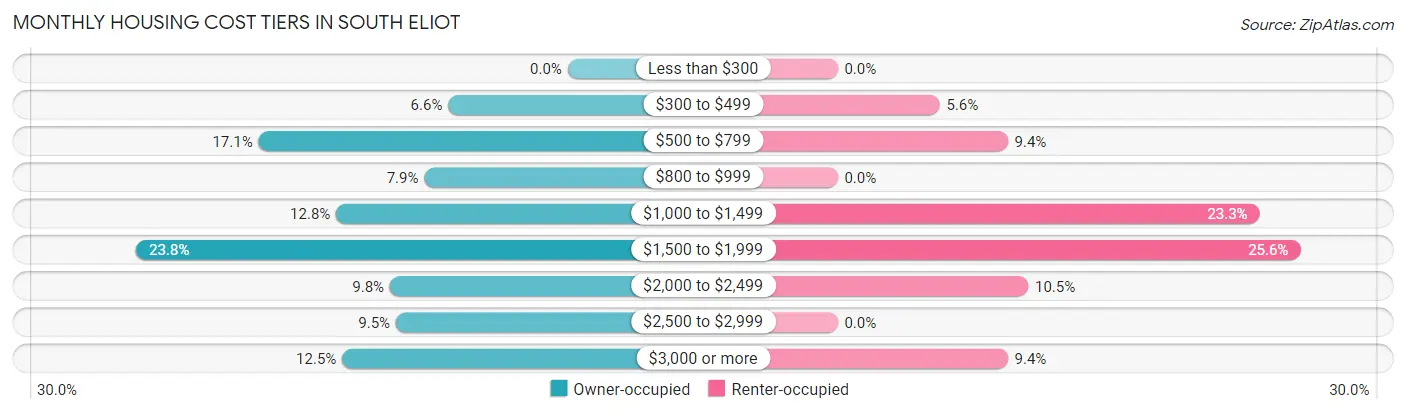
| Monthly Cost | Owner-occupied | Renter-occupied |
| Less than $300 | 0 (0.0%) | 0 (0.0%) |
| $300 to $499 | 80 (6.6%) | 15 (5.6%) |
| $500 to $799 | 207 (17.1%) | 25 (9.4%) |
| $800 to $999 | 96 (7.9%) | 0 (0.0%) |
| $1,000 to $1,499 | 155 (12.8%) | 62 (23.3%) |
| $1,500 to $1,999 | 289 (23.8%) | 68 (25.6%) |
| $2,000 to $2,499 | 119 (9.8%) | 28 (10.5%) |
| $2,500 to $2,999 | 115 (9.5%) | 0 (0.0%) |
| $3,000 or more | 151 (12.5%) | 25 (9.4%) |
| Total | 1,212 (100.0%) | 266 (100.0%) |
Physical Housing Characteristics in South Eliot
Housing Structures in South Eliot
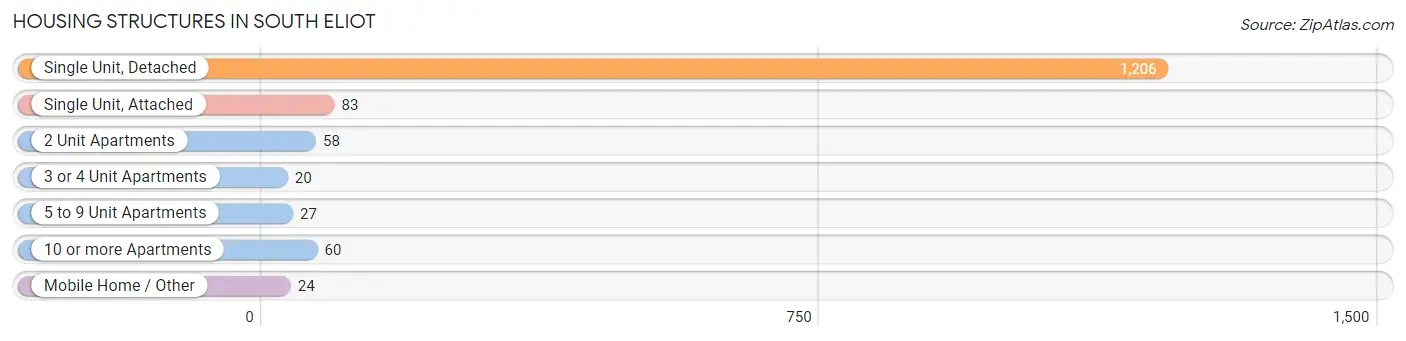
| Structure Type | # Housing Units | % Housing Units |
| Single Unit, Detached | 1,206 | 81.6% |
| Single Unit, Attached | 83 | 5.6% |
| 2 Unit Apartments | 58 | 3.9% |
| 3 or 4 Unit Apartments | 20 | 1.3% |
| 5 to 9 Unit Apartments | 27 | 1.8% |
| 10 or more Apartments | 60 | 4.1% |
| Mobile Home / Other | 24 | 1.6% |
| Total | 1,478 | 100.0% |
Housing Structures by Occupancy in South Eliot
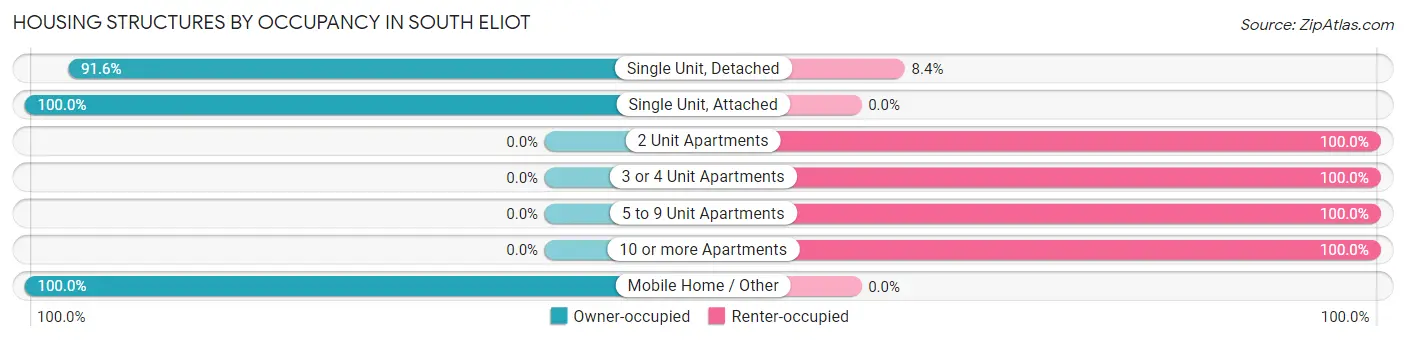
| Structure Type | Owner-occupied | Renter-occupied |
| Single Unit, Detached | 1,105 (91.6%) | 101 (8.4%) |
| Single Unit, Attached | 83 (100.0%) | 0 (0.0%) |
| 2 Unit Apartments | 0 (0.0%) | 58 (100.0%) |
| 3 or 4 Unit Apartments | 0 (0.0%) | 20 (100.0%) |
| 5 to 9 Unit Apartments | 0 (0.0%) | 27 (100.0%) |
| 10 or more Apartments | 0 (0.0%) | 60 (100.0%) |
| Mobile Home / Other | 24 (100.0%) | 0 (0.0%) |
| Total | 1,212 (82.0%) | 266 (18.0%) |
Housing Structures by Number of Rooms in South Eliot
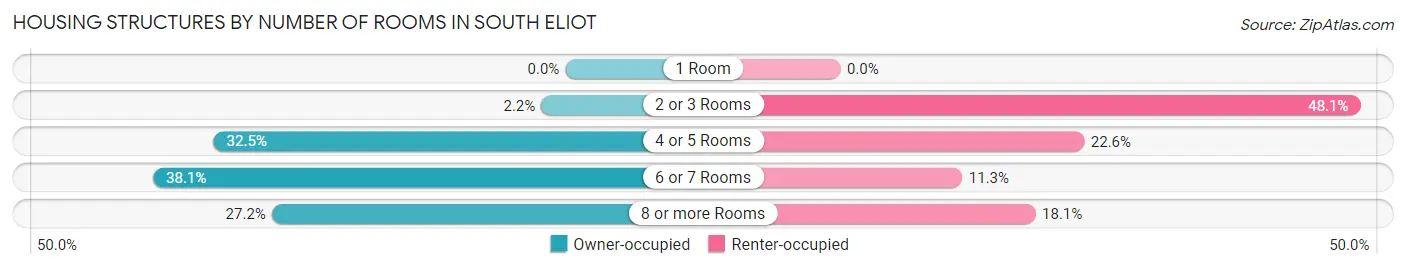
| Number of Rooms | Owner-occupied | Renter-occupied |
| 1 Room | 0 (0.0%) | 0 (0.0%) |
| 2 or 3 Rooms | 27 (2.2%) | 128 (48.1%) |
| 4 or 5 Rooms | 394 (32.5%) | 60 (22.6%) |
| 6 or 7 Rooms | 462 (38.1%) | 30 (11.3%) |
| 8 or more Rooms | 329 (27.2%) | 48 (18.0%) |
| Total | 1,212 (100.0%) | 266 (100.0%) |
Housing Structure by Heating Type in South Eliot
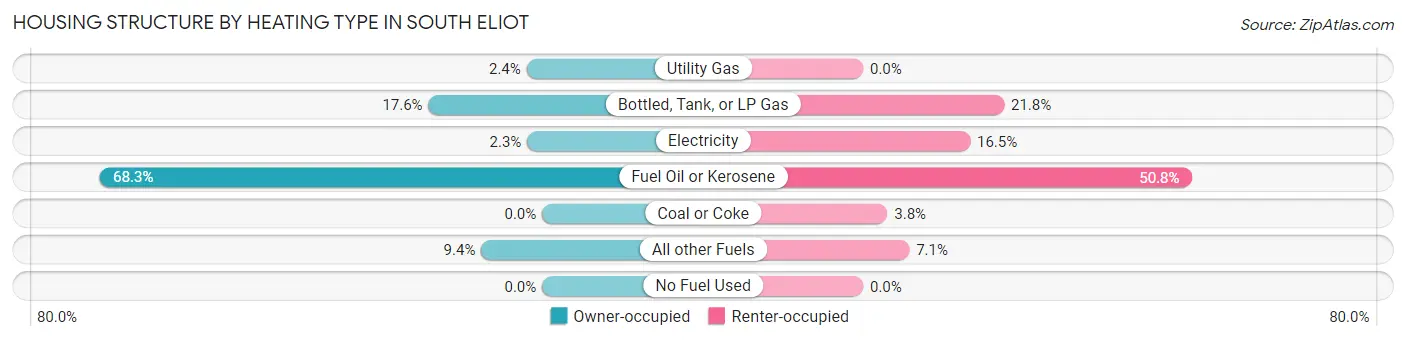
| Heating Type | Owner-occupied | Renter-occupied |
| Utility Gas | 29 (2.4%) | 0 (0.0%) |
| Bottled, Tank, or LP Gas | 213 (17.6%) | 58 (21.8%) |
| Electricity | 28 (2.3%) | 44 (16.5%) |
| Fuel Oil or Kerosene | 828 (68.3%) | 135 (50.7%) |
| Coal or Coke | 0 (0.0%) | 10 (3.8%) |
| All other Fuels | 114 (9.4%) | 19 (7.1%) |
| No Fuel Used | 0 (0.0%) | 0 (0.0%) |
| Total | 1,212 (100.0%) | 266 (100.0%) |
Household Vehicle Usage in South Eliot
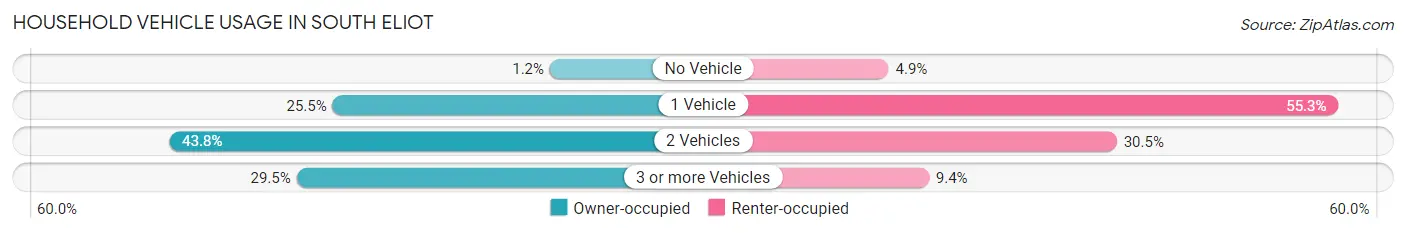
| Vehicles per Household | Owner-occupied | Renter-occupied |
| No Vehicle | 14 (1.2%) | 13 (4.9%) |
| 1 Vehicle | 309 (25.5%) | 147 (55.3%) |
| 2 Vehicles | 531 (43.8%) | 81 (30.4%) |
| 3 or more Vehicles | 358 (29.5%) | 25 (9.4%) |
| Total | 1,212 (100.0%) | 266 (100.0%) |
Real Estate & Mortgages in South Eliot
Real Estate and Mortgage Overview in South Eliot
| Characteristic | Without Mortgage | With Mortgage |
| Housing Units | 499 | 713 |
| Median Property Value | $446,800 | $377,200 |
| Median Household Income | $70,265 | $239 |
| Monthly Housing Costs | $764 | $151 |
| Real Estate Taxes | $4,412 | $0 |
Property Value by Mortgage Status in South Eliot
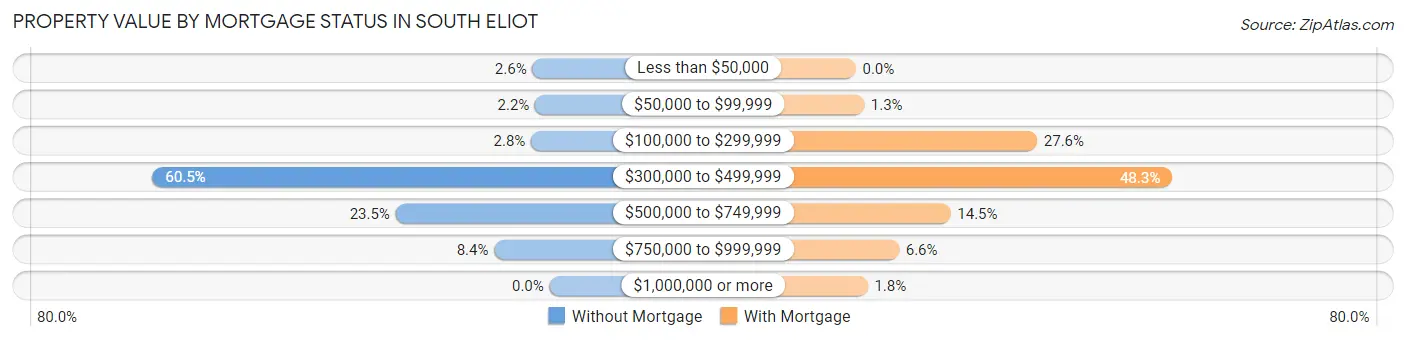
| Property Value | Without Mortgage | With Mortgage |
| Less than $50,000 | 13 (2.6%) | 0 (0.0%) |
| $50,000 to $99,999 | 11 (2.2%) | 9 (1.3%) |
| $100,000 to $299,999 | 14 (2.8%) | 197 (27.6%) |
| $300,000 to $499,999 | 302 (60.5%) | 344 (48.2%) |
| $500,000 to $749,999 | 117 (23.4%) | 103 (14.4%) |
| $750,000 to $999,999 | 42 (8.4%) | 47 (6.6%) |
| $1,000,000 or more | 0 (0.0%) | 13 (1.8%) |
| Total | 499 (100.0%) | 713 (100.0%) |
Household Income by Mortgage Status in South Eliot
| Household Income | Without Mortgage | With Mortgage |
| Less than $10,000 | 13 (2.6%) | 0 (0.0%) |
| $10,000 to $24,999 | 54 (10.8%) | 0 (0.0%) |
| $25,000 to $34,999 | 11 (2.2%) | 12 (1.7%) |
| $35,000 to $49,999 | 11 (2.2%) | 23 (3.2%) |
| $50,000 to $74,999 | 190 (38.1%) | 11 (1.5%) |
| $75,000 to $99,999 | 40 (8.0%) | 120 (16.8%) |
| $100,000 to $149,999 | 89 (17.8%) | 139 (19.5%) |
| $150,000 or more | 91 (18.2%) | 169 (23.7%) |
| Total | 499 (100.0%) | 713 (100.0%) |
Property Value to Household Income Ratio in South Eliot
| Value-to-Income Ratio | Without Mortgage | With Mortgage |
| Less than 2.0x | 39 (7.8%) | 111,875 (15,690.7%) |
| 2.0x to 2.9x | 63 (12.6%) | 113 (15.9%) |
| 3.0x to 3.9x | 96 (19.2%) | 301 (42.2%) |
| 4.0x or more | 288 (57.7%) | 99 (13.9%) |
| Total | 499 (100.0%) | 713 (100.0%) |
Real Estate Taxes by Mortgage Status in South Eliot
| Property Taxes | Without Mortgage | With Mortgage |
| Less than $800 | 15 (3.0%) | 0 (0.0%) |
| $800 to $1,499 | 38 (7.6%) | 9 (1.3%) |
| $800 to $1,499 | 446 (89.4%) | 0 (0.0%) |
| Total | 499 (100.0%) | 713 (100.0%) |
Health & Disability in South Eliot
Health Insurance Coverage by Age in South Eliot
| Age Bracket | With Coverage | Without Coverage |
| Under 6 Years | 214 (100.0%) | 0 (0.0%) |
| 6 to 18 Years | 404 (98.1%) | 8 (1.9%) |
| 19 to 25 Years | 230 (100.0%) | 0 (0.0%) |
| 26 to 34 Years | 196 (78.4%) | 54 (21.6%) |
| 35 to 44 Years | 380 (99.0%) | 4 (1.0%) |
| 45 to 54 Years | 438 (100.0%) | 0 (0.0%) |
| 55 to 64 Years | 507 (94.8%) | 28 (5.2%) |
| 65 to 74 Years | 535 (100.0%) | 0 (0.0%) |
| 75 Years and older | 561 (100.0%) | 0 (0.0%) |
| Total | 3,465 (97.4%) | 94 (2.6%) |
Health Insurance Coverage by Citizenship Status in South Eliot
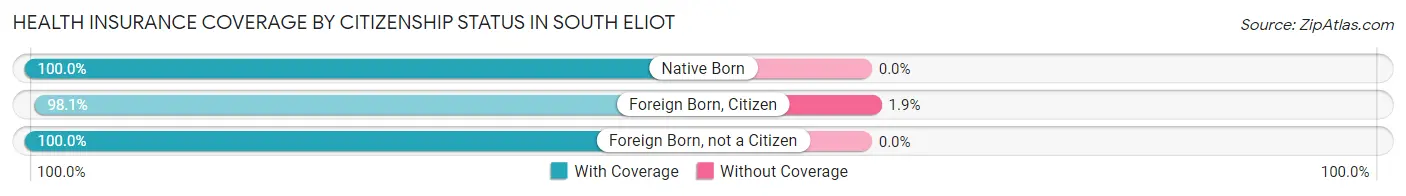
| Citizenship Status | With Coverage | Without Coverage |
| Native Born | 214 (100.0%) | 0 (0.0%) |
| Foreign Born, Citizen | 404 (98.1%) | 8 (1.9%) |
| Foreign Born, not a Citizen | 230 (100.0%) | 0 (0.0%) |
Health Insurance Coverage by Household Income in South Eliot
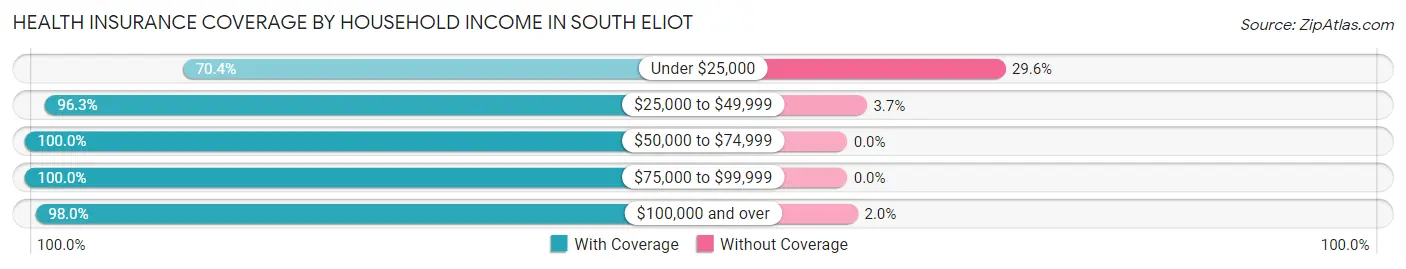
| Household Income | With Coverage | Without Coverage |
| Under $25,000 | 95 (70.4%) | 40 (29.6%) |
| $25,000 to $49,999 | 209 (96.3%) | 8 (3.7%) |
| $50,000 to $74,999 | 573 (100.0%) | 0 (0.0%) |
| $75,000 to $99,999 | 388 (100.0%) | 0 (0.0%) |
| $100,000 and over | 2,192 (98.0%) | 45 (2.0%) |
Public vs Private Health Insurance Coverage by Age in South Eliot
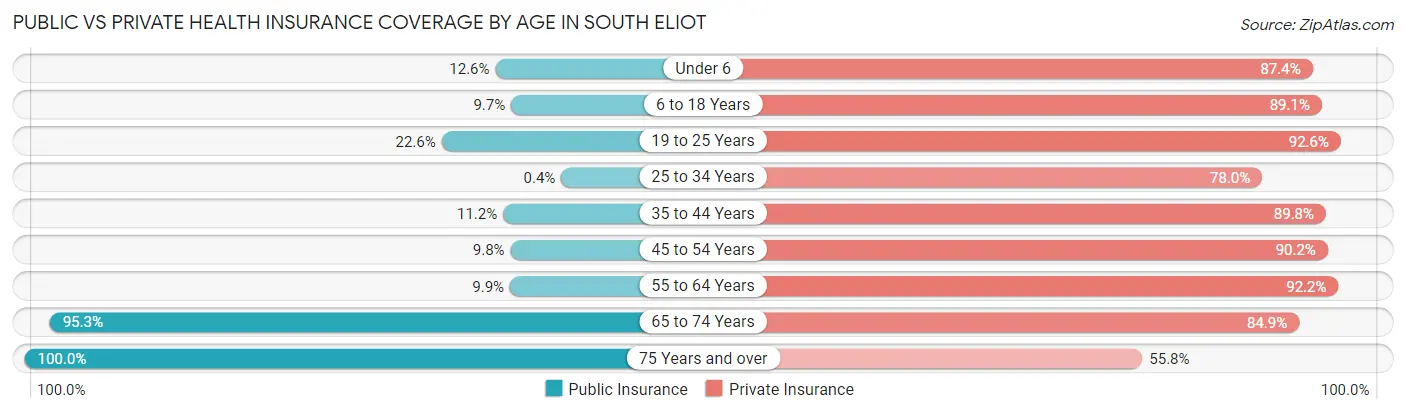
| Age Bracket | Public Insurance | Private Insurance |
| Under 6 | 27 (12.6%) | 187 (87.4%) |
| 6 to 18 Years | 40 (9.7%) | 367 (89.1%) |
| 19 to 25 Years | 52 (22.6%) | 213 (92.6%) |
| 25 to 34 Years | 1 (0.4%) | 195 (78.0%) |
| 35 to 44 Years | 43 (11.2%) | 345 (89.8%) |
| 45 to 54 Years | 43 (9.8%) | 395 (90.2%) |
| 55 to 64 Years | 53 (9.9%) | 493 (92.1%) |
| 65 to 74 Years | 510 (95.3%) | 454 (84.9%) |
| 75 Years and over | 561 (100.0%) | 313 (55.8%) |
| Total | 1,330 (37.4%) | 2,962 (83.2%) |
Disability Status by Sex by Age in South Eliot
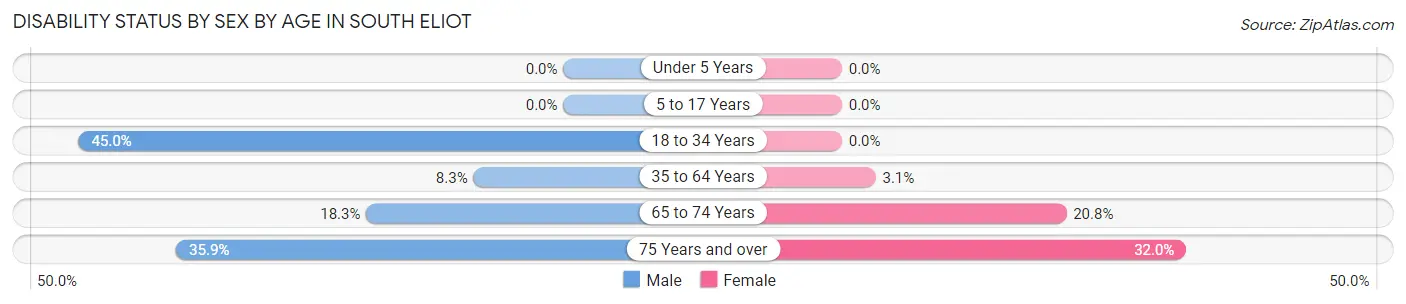
| Age Bracket | Male | Female |
| Under 5 Years | 0 (0.0%) | 0 (0.0%) |
| 5 to 17 Years | 0 (0.0%) | 0 (0.0%) |
| 18 to 34 Years | 108 (45.0%) | 0 (0.0%) |
| 35 to 64 Years | 60 (8.3%) | 20 (3.1%) |
| 65 to 74 Years | 32 (18.3%) | 75 (20.8%) |
| 75 Years and over | 97 (35.9%) | 93 (32.0%) |
Disability Class by Sex by Age in South Eliot
Disability Class: Hearing Difficulty
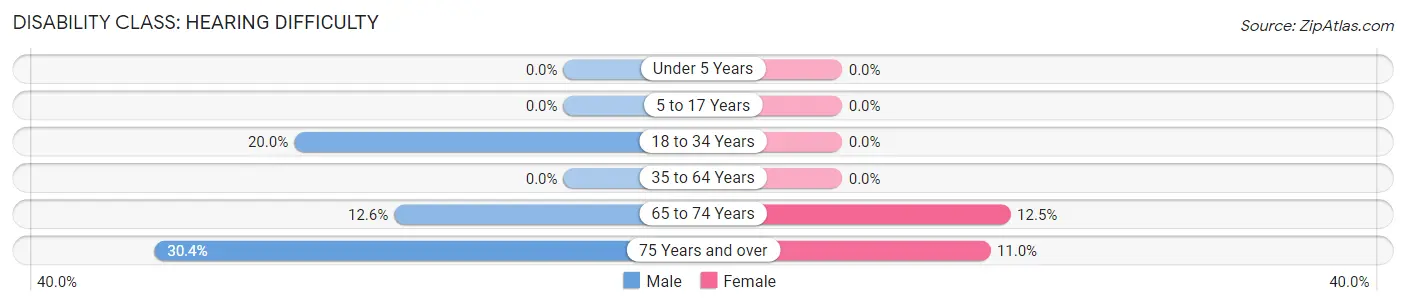
| Age Bracket | Male | Female |
| Under 5 Years | 0 (0.0%) | 0 (0.0%) |
| 5 to 17 Years | 0 (0.0%) | 0 (0.0%) |
| 18 to 34 Years | 48 (20.0%) | 0 (0.0%) |
| 35 to 64 Years | 0 (0.0%) | 0 (0.0%) |
| 65 to 74 Years | 22 (12.6%) | 45 (12.5%) |
| 75 Years and over | 82 (30.4%) | 32 (11.0%) |
Disability Class: Vision Difficulty
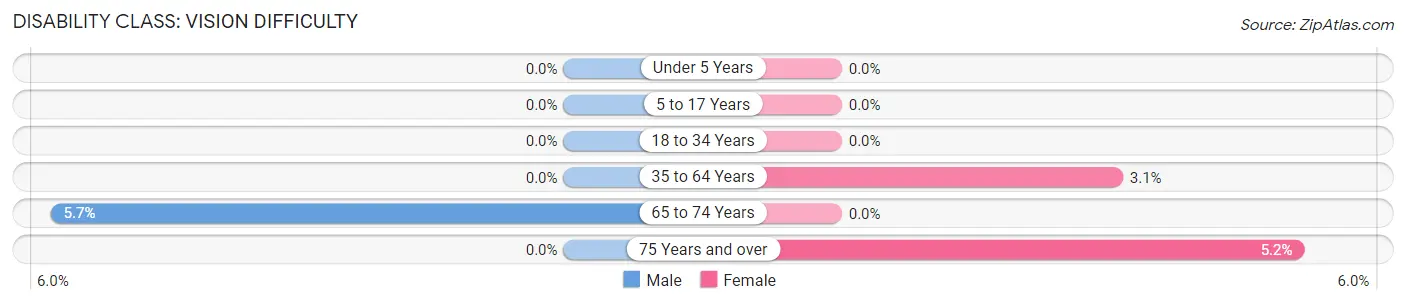
| Age Bracket | Male | Female |
| Under 5 Years | 0 (0.0%) | 0 (0.0%) |
| 5 to 17 Years | 0 (0.0%) | 0 (0.0%) |
| 18 to 34 Years | 0 (0.0%) | 0 (0.0%) |
| 35 to 64 Years | 0 (0.0%) | 20 (3.1%) |
| 65 to 74 Years | 10 (5.7%) | 0 (0.0%) |
| 75 Years and over | 0 (0.0%) | 15 (5.1%) |
Disability Class: Cognitive Difficulty
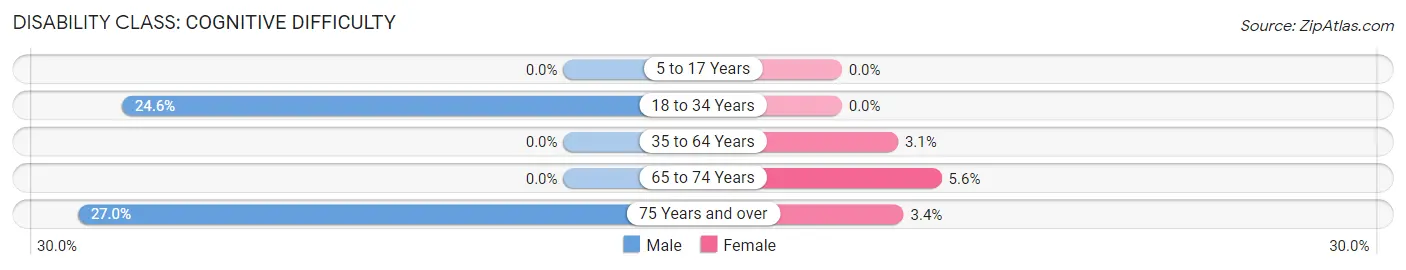
| Age Bracket | Male | Female |
| 5 to 17 Years | 0 (0.0%) | 0 (0.0%) |
| 18 to 34 Years | 59 (24.6%) | 0 (0.0%) |
| 35 to 64 Years | 0 (0.0%) | 20 (3.1%) |
| 65 to 74 Years | 0 (0.0%) | 20 (5.6%) |
| 75 Years and over | 73 (27.0%) | 10 (3.4%) |
Disability Class: Ambulatory Difficulty

| Age Bracket | Male | Female |
| 5 to 17 Years | 0 (0.0%) | 0 (0.0%) |
| 18 to 34 Years | 1 (0.4%) | 0 (0.0%) |
| 35 to 64 Years | 60 (8.3%) | 20 (3.1%) |
| 65 to 74 Years | 11 (6.3%) | 30 (8.3%) |
| 75 Years and over | 21 (7.8%) | 91 (31.3%) |
Disability Class: Self-Care Difficulty
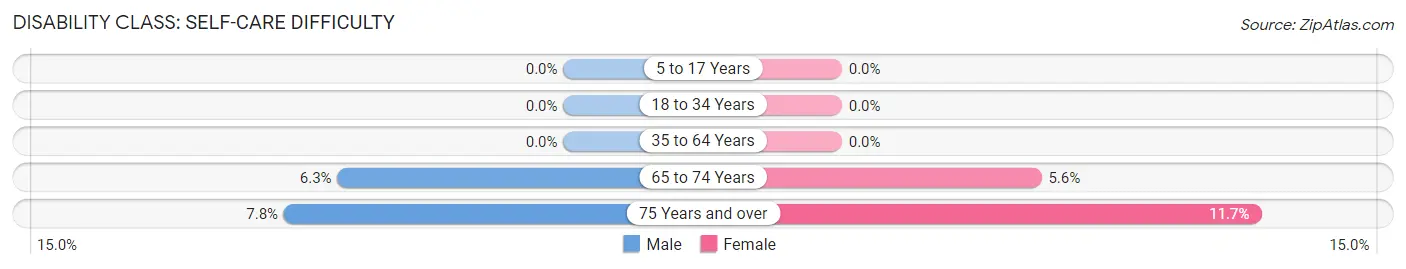
| Age Bracket | Male | Female |
| 5 to 17 Years | 0 (0.0%) | 0 (0.0%) |
| 18 to 34 Years | 0 (0.0%) | 0 (0.0%) |
| 35 to 64 Years | 0 (0.0%) | 0 (0.0%) |
| 65 to 74 Years | 11 (6.3%) | 20 (5.6%) |
| 75 Years and over | 21 (7.8%) | 34 (11.7%) |
Technology Access in South Eliot
Computing Device Access in South Eliot
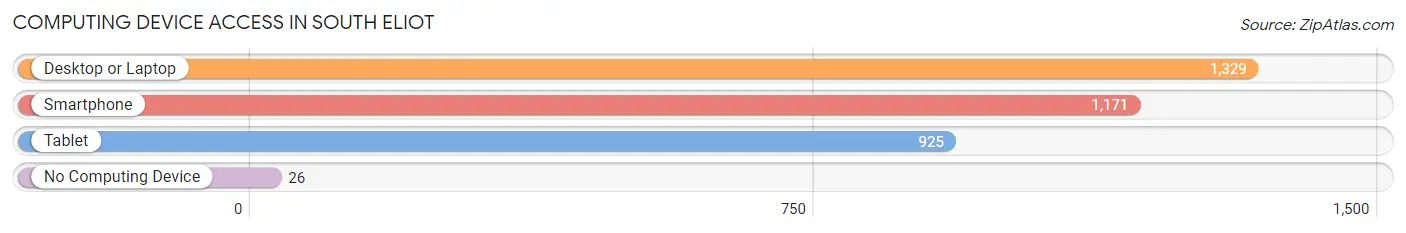
| Device Type | # Households | % Households |
| Desktop or Laptop | 1,329 | 89.9% |
| Smartphone | 1,171 | 79.2% |
| Tablet | 925 | 62.6% |
| No Computing Device | 26 | 1.8% |
| Total | 1,478 | 100.0% |
Internet Access in South Eliot
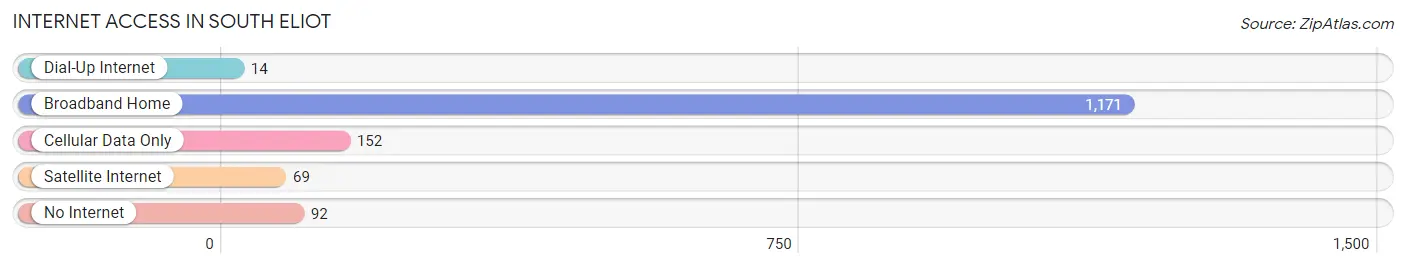
| Internet Type | # Households | % Households |
| Dial-Up Internet | 14 | 0.9% |
| Broadband Home | 1,171 | 79.2% |
| Cellular Data Only | 152 | 10.3% |
| Satellite Internet | 69 | 4.7% |
| No Internet | 92 | 6.2% |
| Total | 1,478 | 100.0% |
South Eliot Summary
History
South Eliot is a small town located in York County, Maine. It is situated on the banks of the Piscataqua River, which separates Maine from New Hampshire. The town was first settled in 1630 by English settlers, who named it Eliot after the Reverend John Eliot, a Puritan missionary. The town was incorporated in 1713 and has remained a small, rural community ever since.
The town has a rich history of shipbuilding, fishing, and farming. In the 19th century, the town was home to several shipyards, which built vessels for the fishing and whaling industries. The town also had a thriving agricultural industry, with dairy farms, apple orchards, and vegetable gardens.
In the 20th century, the town's economy shifted away from agriculture and shipbuilding and towards tourism. The town is now home to several bed and breakfasts, restaurants, and other tourist attractions.
Geography
South Eliot is located in York County, Maine, on the banks of the Piscataqua River. The town is bordered by Eliot to the north, Kittery to the east, and Portsmouth, New Hampshire to the south. The town is situated on a peninsula, with the Piscataqua River to the west and the Atlantic Ocean to the east.
The town has a total area of 8.3 square miles, of which 7.9 square miles is land and 0.4 square miles is water. The town is mostly flat, with some rolling hills in the northern part of town. The highest point in the town is located at the intersection of South Eliot Road and Eliot Road, at an elevation of 85 feet.
Economy
South Eliot's economy is largely based on tourism. The town is home to several bed and breakfasts, restaurants, and other tourist attractions. The town also has a small commercial fishing industry, with several lobster boats operating out of the harbor.
The town also has a small manufacturing sector, with several small businesses producing furniture, clothing, and other goods. The town also has a small agricultural sector, with several small farms producing dairy products, vegetables, and fruits.
Demographics
As of the 2010 census, South Eliot had a population of 1,845. The racial makeup of the town was 97.2% White, 0.7% African American, 0.3% Native American, 0.4% Asian, 0.1% Pacific Islander, 0.2% from other races, and 1.1% from two or more races. Hispanic or Latino of any race were 1.2% of the population.
The median household income in South Eliot was $50,938, and the median family income was $60,938. The per capita income for the town was $25,938. About 5.2% of families and 7.2% of the population were below the poverty line, including 8.2% of those under age 18 and 5.2% of those age 65 or over.
Common Questions
What is Per Capita Income in South Eliot?
Per Capita income in South Eliot is $46,620.
What is the Median Family Income in South Eliot?
Median Family Income in South Eliot is $105,924.
What is the Median Household income in South Eliot?
Median Household Income in South Eliot is $91,457.
What is Income or Wage Gap in South Eliot?
Income or Wage Gap in South Eliot is 33.8%.
Women in South Eliot earn 66.2 cents for every dollar earned by a man.
What is Inequality or Gini Index in South Eliot?
Inequality or Gini Index in South Eliot is 0.39.
What is the Total Population of South Eliot?
Total Population of South Eliot is 3,686.
What is the Total Male Population of South Eliot?
Total Male Population of South Eliot is 1,810.
What is the Total Female Population of South Eliot?
Total Female Population of South Eliot is 1,876.
What is the Ratio of Males per 100 Females in South Eliot?
There are 96.48 Males per 100 Females in South Eliot.
What is the Ratio of Females per 100 Males in South Eliot?
There are 103.65 Females per 100 Males in South Eliot.
What is the Median Population Age in South Eliot?
Median Population Age in South Eliot is 53.1 Years.
What is the Average Family Size in South Eliot
Average Family Size in South Eliot is 3.0 People.
What is the Average Household Size in South Eliot
Average Household Size in South Eliot is 2.5 People.
How Large is the Labor Force in South Eliot?
There are 2,037 People in the Labor Forcein in South Eliot.
What is the Percentage of People in the Labor Force in South Eliot?
64.4% of People are in the Labor Force in South Eliot.
What is the Unemployment Rate in South Eliot?
Unemployment Rate in South Eliot is 2.6%.