Fort Kent, ME Map & Demographics
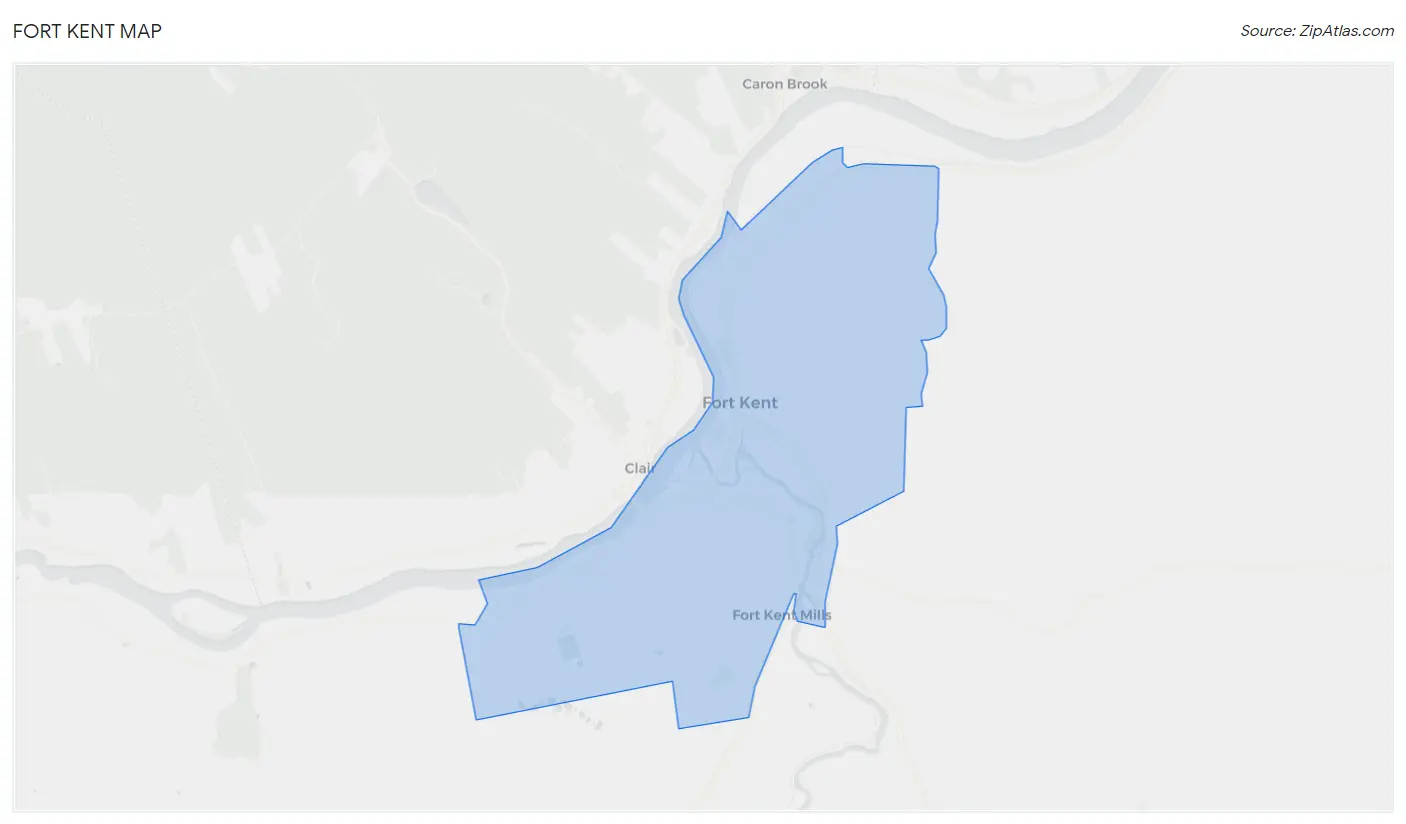
Fort Kent Map
Fort Kent Overview
$48,524
PER CAPITA INCOME
$72,232
AVG FAMILY INCOME
$57,067
AVG HOUSEHOLD INCOME
47.5%
WAGE / INCOME GAP [ % ]
52.5¢/ $1
WAGE / INCOME GAP [ $ ]
0.58
INEQUALITY / GINI INDEX
2,515
TOTAL POPULATION
1,053
MALE POPULATION
1,462
FEMALE POPULATION
72.02
MALES / 100 FEMALES
138.84
FEMALES / 100 MALES
48.4
MEDIAN AGE
2.5
AVG FAMILY SIZE
2.0
AVG HOUSEHOLD SIZE
1,109
LABOR FORCE [ PEOPLE ]
51.9%
PERCENT IN LABOR FORCE
2.8%
UNEMPLOYMENT RATE
Fort Kent Zip Codes
Fort Kent Area Codes
Income in Fort Kent
Income Overview in Fort Kent
Per Capita Income in Fort Kent is $48,524, while median incomes of families and households are $72,232 and $57,067 respectively.
| Characteristic | Number | Measure |
| Per Capita Income | 2,515 | $48,524 |
| Median Family Income | 665 | $72,232 |
| Mean Family Income | 665 | $88,814 |
| Median Household Income | 1,089 | $57,067 |
| Mean Household Income | 1,089 | $104,512 |
| Income Deficit | 665 | $0 |
| Wage / Income Gap (%) | 2,515 | 47.48% |
| Wage / Income Gap ($) | 2,515 | 52.52¢ per $1 |
| Gini / Inequality Index | 2,515 | 0.58 |
Earnings by Sex in Fort Kent
Average Earnings in Fort Kent are $45,750, $59,327 for men and $31,156 for women, a difference of 47.5%.
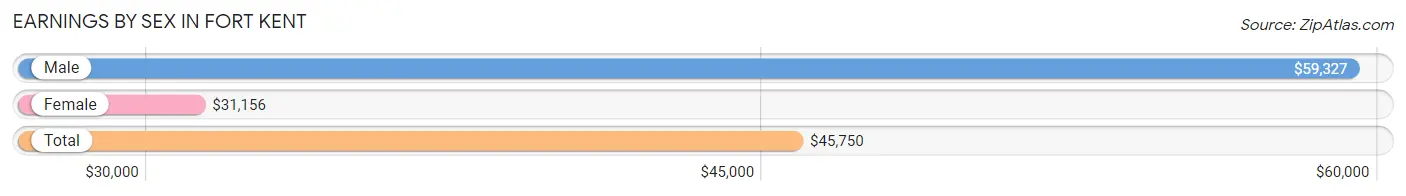
| Sex | Number | Average Earnings |
| Male | 653 (54.8%) | $59,327 |
| Female | 539 (45.2%) | $31,156 |
| Total | 1,192 (100.0%) | $45,750 |
Earnings by Sex by Income Bracket in Fort Kent
The most common earnings brackets in Fort Kent are $75,000 to $99,999 for men (194 | 29.7%) and $45,000 to $49,999 for women (65 | 12.1%).
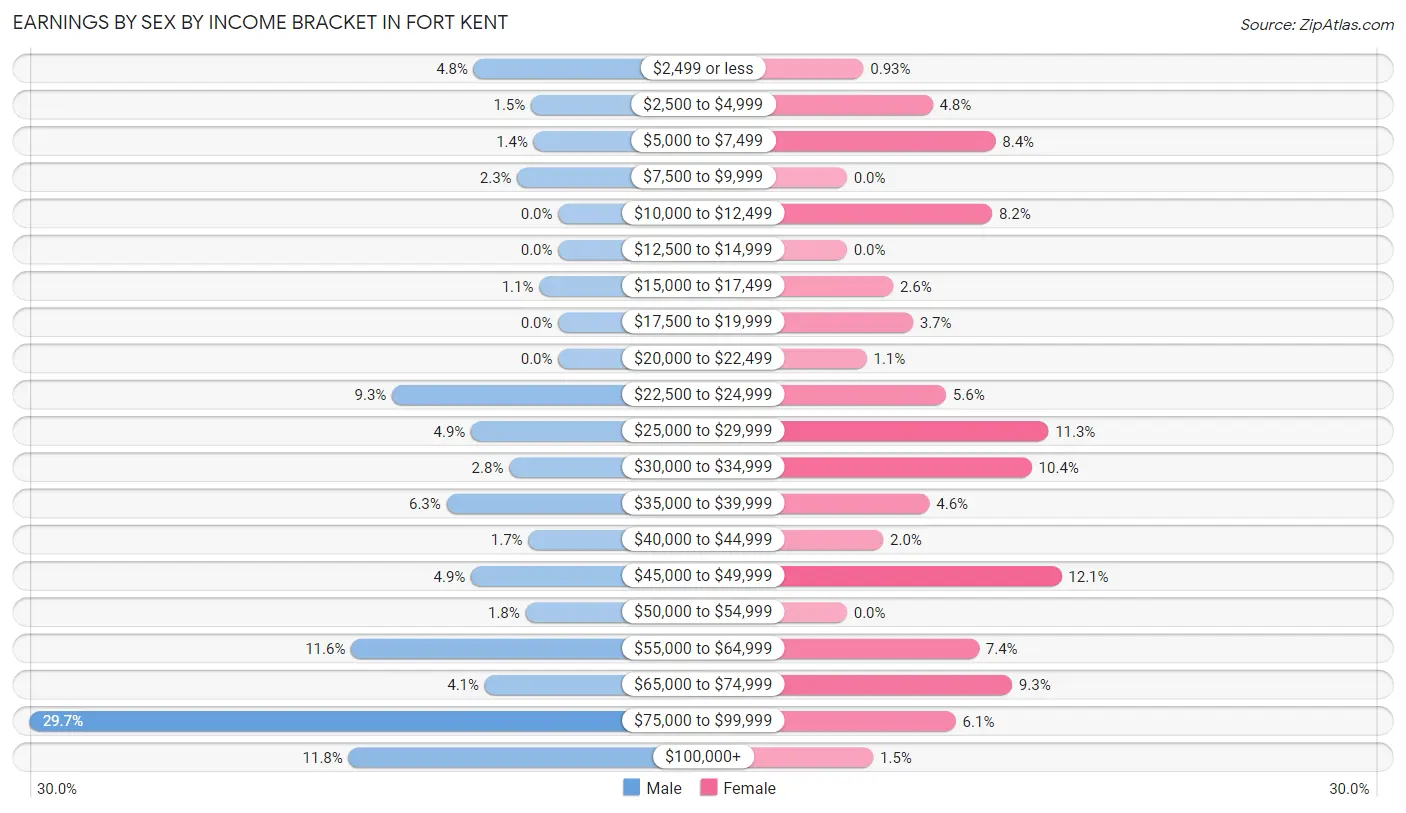
| Income | Male | Female |
| $2,499 or less | 31 (4.8%) | 5 (0.9%) |
| $2,500 to $4,999 | 10 (1.5%) | 26 (4.8%) |
| $5,000 to $7,499 | 9 (1.4%) | 45 (8.4%) |
| $7,500 to $9,999 | 15 (2.3%) | 0 (0.0%) |
| $10,000 to $12,499 | 0 (0.0%) | 44 (8.2%) |
| $12,500 to $14,999 | 0 (0.0%) | 0 (0.0%) |
| $15,000 to $17,499 | 7 (1.1%) | 14 (2.6%) |
| $17,500 to $19,999 | 0 (0.0%) | 20 (3.7%) |
| $20,000 to $22,499 | 0 (0.0%) | 6 (1.1%) |
| $22,500 to $24,999 | 61 (9.3%) | 30 (5.6%) |
| $25,000 to $29,999 | 32 (4.9%) | 61 (11.3%) |
| $30,000 to $34,999 | 18 (2.8%) | 56 (10.4%) |
| $35,000 to $39,999 | 41 (6.3%) | 25 (4.6%) |
| $40,000 to $44,999 | 11 (1.7%) | 11 (2.0%) |
| $45,000 to $49,999 | 32 (4.9%) | 65 (12.1%) |
| $50,000 to $54,999 | 12 (1.8%) | 0 (0.0%) |
| $55,000 to $64,999 | 76 (11.6%) | 40 (7.4%) |
| $65,000 to $74,999 | 27 (4.1%) | 50 (9.3%) |
| $75,000 to $99,999 | 194 (29.7%) | 33 (6.1%) |
| $100,000+ | 77 (11.8%) | 8 (1.5%) |
| Total | 653 (100.0%) | 539 (100.0%) |
Earnings by Sex by Educational Attainment in Fort Kent
Average earnings in Fort Kent are $75,509 for men and $37,813 for women, a difference of 49.9%. Men with an educational attainment of graduate degree enjoy the highest average annual earnings of $92,895, while those with high school diploma education earn the least with $39,637. Women with an educational attainment of bachelor's degree earn the most with the average annual earnings of $66,406, while those with high school diploma education have the smallest earnings of $28,611.
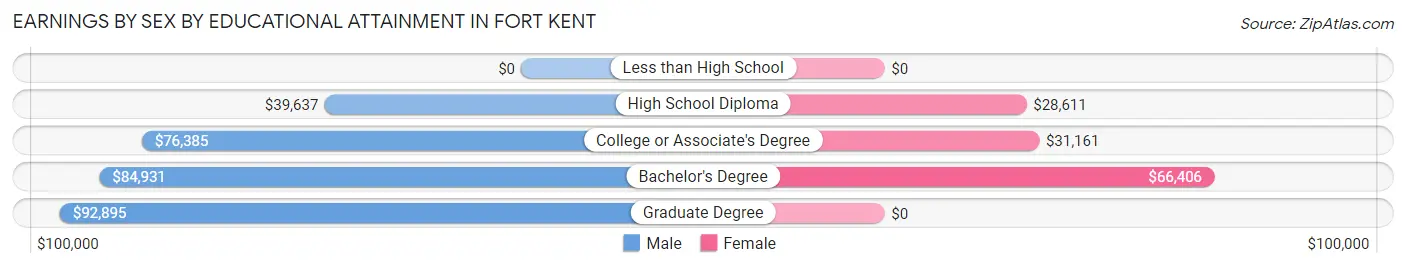
| Educational Attainment | Male Income | Female Income |
| Less than High School | - | - |
| High School Diploma | $39,637 | $28,611 |
| College or Associate's Degree | $76,385 | $31,161 |
| Bachelor's Degree | $84,931 | $66,406 |
| Graduate Degree | $92,895 | $0 |
| Total | $75,509 | $37,813 |
Family Income in Fort Kent
Family Income Brackets in Fort Kent
According to the Fort Kent family income data, there are 134 families falling into the $50,000 to $74,999 income range, which is the most common income bracket and makes up 20.2% of all families. Conversely, the less than $10,000 income bracket is the least frequent group with only 10 families (1.5%) belonging to this category.
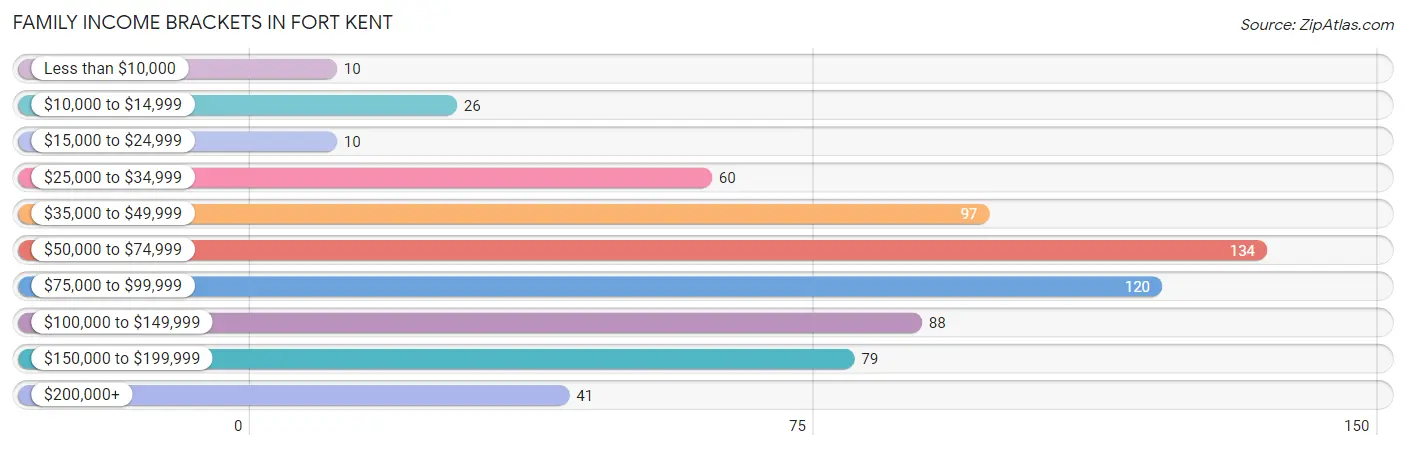
| Income Bracket | # Families | % Families |
| Less than $10,000 | 10 | 1.5% |
| $10,000 to $14,999 | 26 | 3.9% |
| $15,000 to $24,999 | 10 | 1.5% |
| $25,000 to $34,999 | 60 | 9.0% |
| $35,000 to $49,999 | 97 | 14.6% |
| $50,000 to $74,999 | 134 | 20.2% |
| $75,000 to $99,999 | 120 | 18.0% |
| $100,000 to $149,999 | 88 | 13.2% |
| $150,000 to $199,999 | 79 | 11.9% |
| $200,000+ | 41 | 6.2% |
Family Income by Famaliy Size in Fort Kent
3-person families (167 | 25.1%) account for the highest median family income in Fort Kent with $86,793 per family, while 2-person families (459 | 69.0%) have the highest median income of $33,125 per family member.
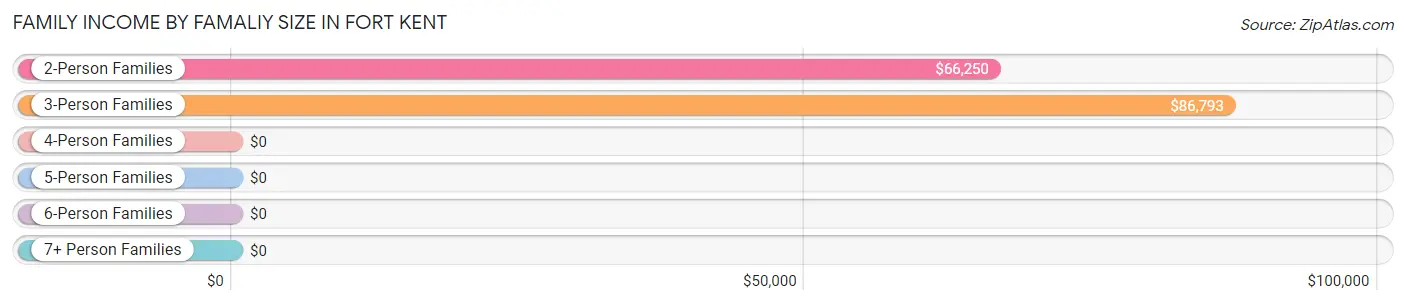
| Income Bracket | # Families | Median Income |
| 2-Person Families | 459 (69.0%) | $66,250 |
| 3-Person Families | 167 (25.1%) | $86,793 |
| 4-Person Families | 7 (1.1%) | $0 |
| 5-Person Families | 9 (1.3%) | $0 |
| 6-Person Families | 23 (3.5%) | $0 |
| 7+ Person Families | 0 (0.0%) | $0 |
| Total | 665 (100.0%) | $72,232 |
Family Income by Number of Earners in Fort Kent
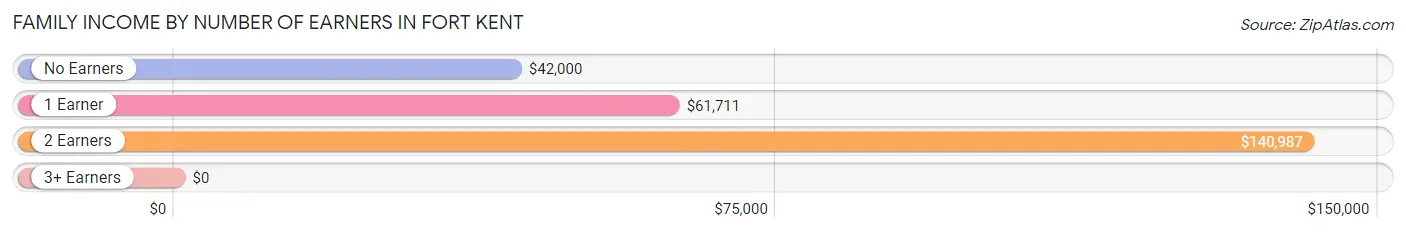
| Number of Earners | # Families | Median Income |
| No Earners | 106 (15.9%) | $42,000 |
| 1 Earner | 332 (49.9%) | $61,711 |
| 2 Earners | 227 (34.1%) | $140,987 |
| 3+ Earners | 0 (0.0%) | $0 |
| Total | 665 (100.0%) | $72,232 |
Household Income in Fort Kent
Household Income Brackets in Fort Kent
With 142 households falling in the category, the $35,000 to $49,999 income range is the most frequent in Fort Kent, accounting for 13.0% of all households. In contrast, only 45 households (4.1%) fall into the less than $10,000 income bracket, making it the least populous group.
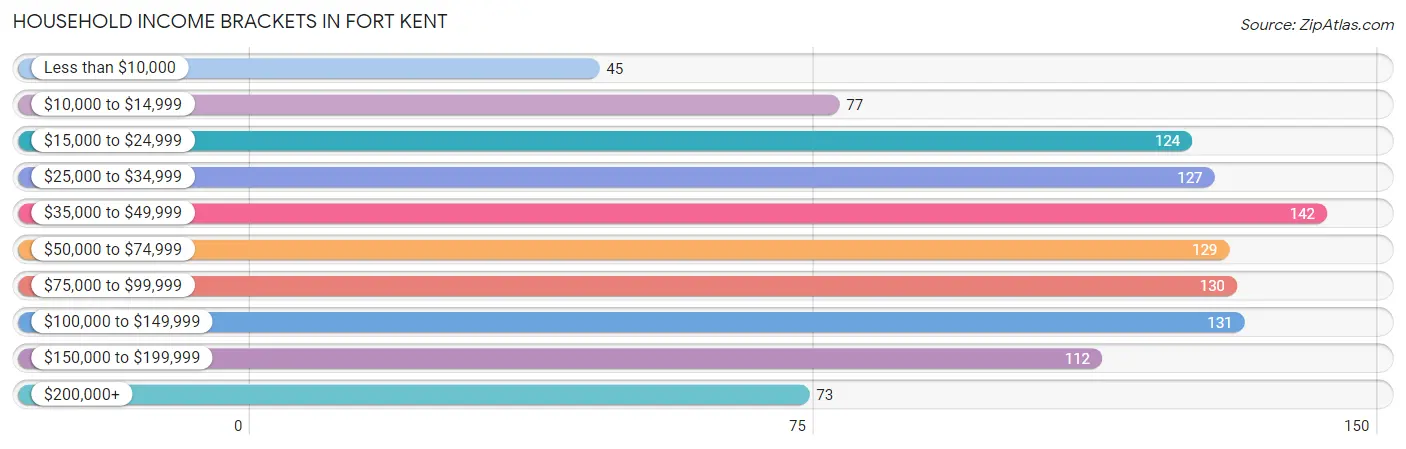
| Income Bracket | # Households | % Households |
| Less than $10,000 | 45 | 4.1% |
| $10,000 to $14,999 | 77 | 7.1% |
| $15,000 to $24,999 | 124 | 11.4% |
| $25,000 to $34,999 | 127 | 11.7% |
| $35,000 to $49,999 | 142 | 13.0% |
| $50,000 to $74,999 | 129 | 11.8% |
| $75,000 to $99,999 | 130 | 11.9% |
| $100,000 to $149,999 | 131 | 12.0% |
| $150,000 to $199,999 | 112 | 10.3% |
| $200,000+ | 73 | 6.7% |
Household Income by Householder Age in Fort Kent
The median household income in Fort Kent is $57,067, with the highest median household income of $130,294 found in the 25 to 44 years age bracket for the primary householder. A total of 268 households (24.6%) fall into this category. Meanwhile, the 15 to 24 years age bracket for the primary householder has the lowest median household income of $0, with 17 households (1.6%) in this group.
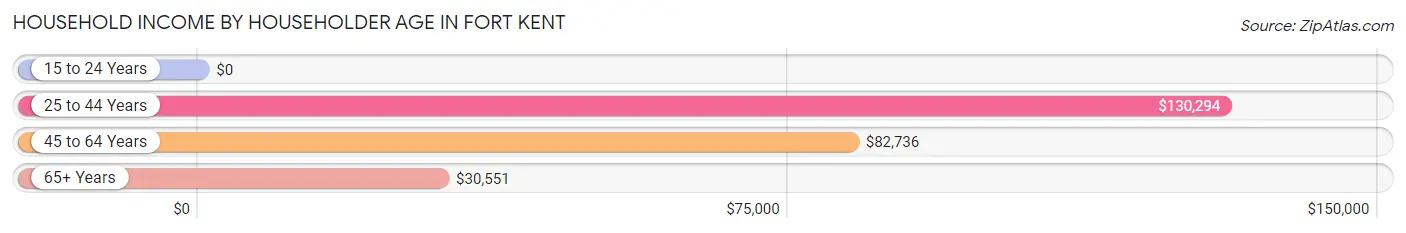
| Income Bracket | # Households | Median Income |
| 15 to 24 Years | 17 (1.6%) | $0 |
| 25 to 44 Years | 268 (24.6%) | $130,294 |
| 45 to 64 Years | 437 (40.1%) | $82,736 |
| 65+ Years | 367 (33.7%) | $30,551 |
| Total | 1,089 (100.0%) | $57,067 |
Poverty in Fort Kent
Income Below Poverty by Sex and Age in Fort Kent
With 10.1% poverty level for males and 10.5% for females among the residents of Fort Kent, 6 to 11 year old males and 55 to 64 year old females are the most vulnerable to poverty, with 14 males (100.0%) and 54 females (24.5%) in their respective age groups living below the poverty level.
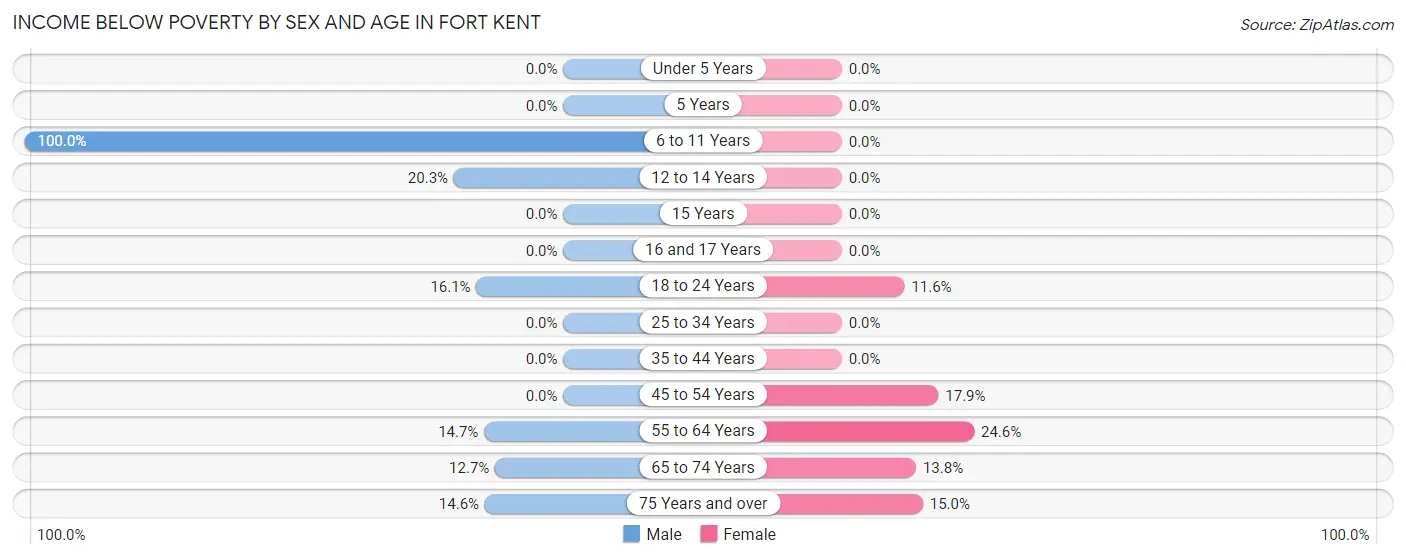
| Age Bracket | Male | Female |
| Under 5 Years | 0 (0.0%) | 0 (0.0%) |
| 5 Years | 0 (0.0%) | 0 (0.0%) |
| 6 to 11 Years | 14 (100.0%) | 0 (0.0%) |
| 12 to 14 Years | 13 (20.3%) | 0 (0.0%) |
| 15 Years | 0 (0.0%) | 0 (0.0%) |
| 16 and 17 Years | 0 (0.0%) | 0 (0.0%) |
| 18 to 24 Years | 15 (16.1%) | 5 (11.6%) |
| 25 to 34 Years | 0 (0.0%) | 0 (0.0%) |
| 35 to 44 Years | 0 (0.0%) | 0 (0.0%) |
| 45 to 54 Years | 0 (0.0%) | 31 (17.9%) |
| 55 to 64 Years | 21 (14.7%) | 54 (24.5%) |
| 65 to 74 Years | 10 (12.7%) | 23 (13.8%) |
| 75 Years and over | 23 (14.6%) | 20 (15.0%) |
| Total | 96 (10.1%) | 133 (10.5%) |
Income Above Poverty by Sex and Age in Fort Kent
According to the poverty statistics in Fort Kent, males aged under 5 years and females aged under 5 years are the age groups that are most secure financially, with 100.0% of males and 100.0% of females in these age groups living above the poverty line.
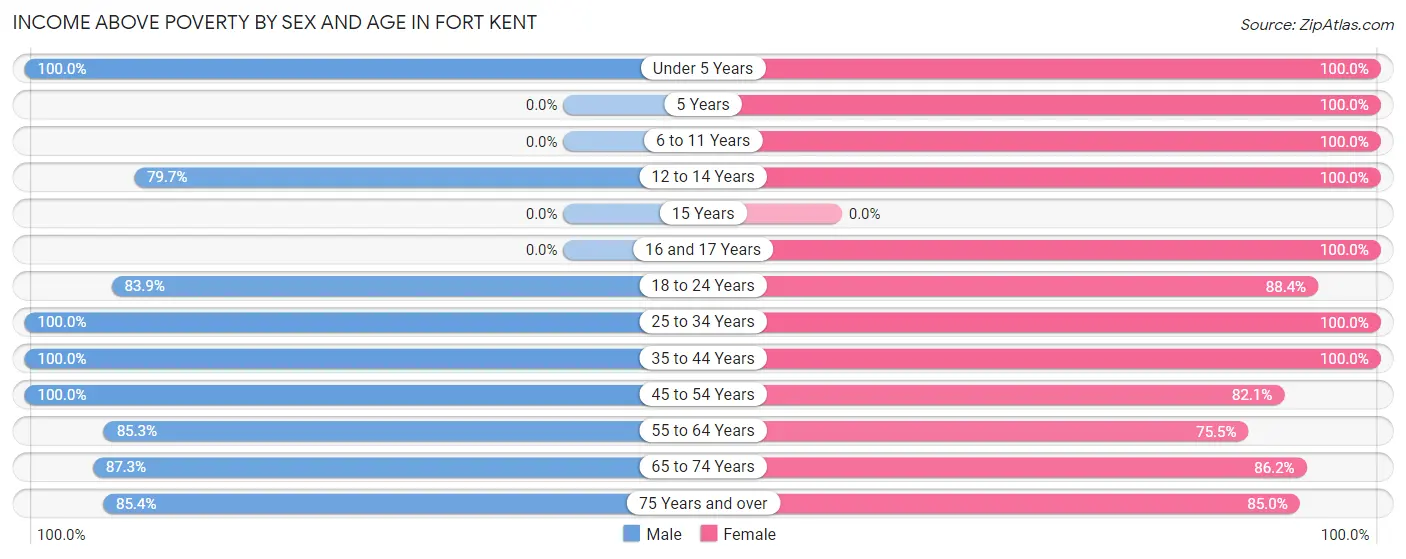
| Age Bracket | Male | Female |
| Under 5 Years | 19 (100.0%) | 59 (100.0%) |
| 5 Years | 0 (0.0%) | 21 (100.0%) |
| 6 to 11 Years | 0 (0.0%) | 104 (100.0%) |
| 12 to 14 Years | 51 (79.7%) | 97 (100.0%) |
| 15 Years | 0 (0.0%) | 0 (0.0%) |
| 16 and 17 Years | 0 (0.0%) | 22 (100.0%) |
| 18 to 24 Years | 78 (83.9%) | 38 (88.4%) |
| 25 to 34 Years | 75 (100.0%) | 108 (100.0%) |
| 35 to 44 Years | 154 (100.0%) | 114 (100.0%) |
| 45 to 54 Years | 149 (100.0%) | 142 (82.1%) |
| 55 to 64 Years | 122 (85.3%) | 166 (75.4%) |
| 65 to 74 Years | 69 (87.3%) | 144 (86.2%) |
| 75 Years and over | 135 (85.4%) | 113 (85.0%) |
| Total | 852 (89.9%) | 1,128 (89.4%) |
Income Below Poverty Among Married-Couple Families in Fort Kent
The poverty statistics for married-couple families in Fort Kent show that 4.4% or 19 of the total 433 families live below the poverty line. Families with no children have the highest poverty rate of 6.0%, comprising of 19 families. On the other hand, families with 1 or 2 children have the lowest poverty rate of 0.0%, which includes 0 families.
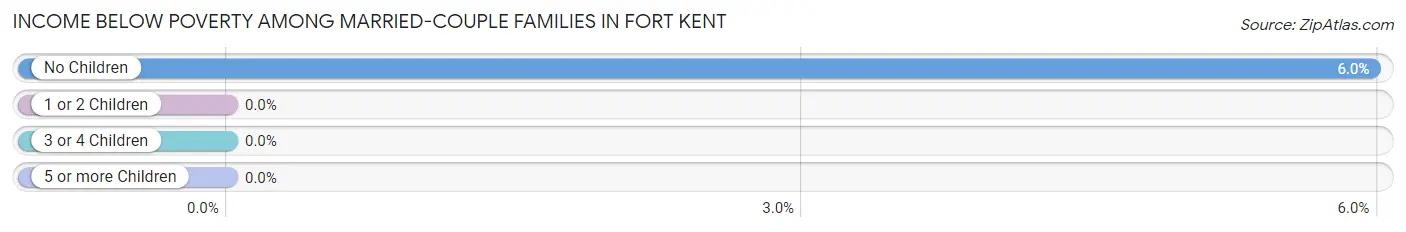
| Children | Above Poverty | Below Poverty |
| No Children | 299 (94.0%) | 19 (6.0%) |
| 1 or 2 Children | 83 (100.0%) | 0 (0.0%) |
| 3 or 4 Children | 32 (100.0%) | 0 (0.0%) |
| 5 or more Children | 0 (0.0%) | 0 (0.0%) |
| Total | 414 (95.6%) | 19 (4.4%) |
Income Below Poverty Among Single-Parent Households in Fort Kent
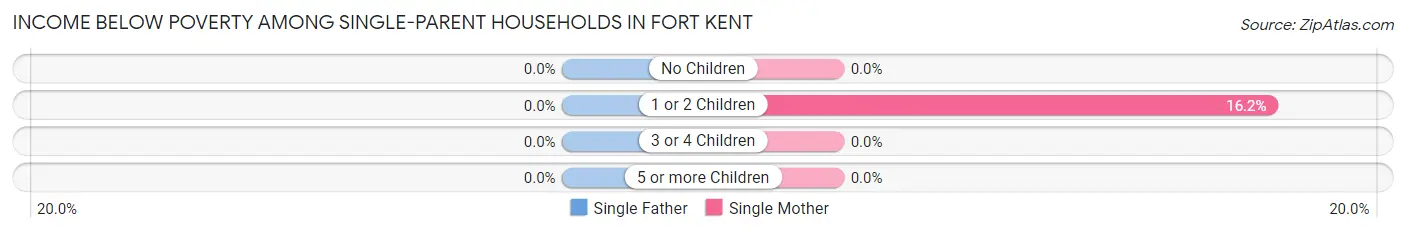
| Children | Single Father | Single Mother |
| No Children | 0 (0.0%) | 0 (0.0%) |
| 1 or 2 Children | 0 (0.0%) | 17 (16.2%) |
| 3 or 4 Children | 0 (0.0%) | 0 (0.0%) |
| 5 or more Children | 0 (0.0%) | 0 (0.0%) |
| Total | 0 (0.0%) | 17 (11.5%) |
Income Below Poverty Among Married-Couple vs Single-Parent Households in Fort Kent
The poverty data for Fort Kent shows that 19 of the married-couple family households (4.4%) and 17 of the single-parent households (7.3%) are living below the poverty level. Within the married-couple family households, those with no children have the highest poverty rate, with 19 households (6.0%) falling below the poverty line. Among the single-parent households, those with 1 or 2 children have the highest poverty rate, with 17 household (9.9%) living below poverty.
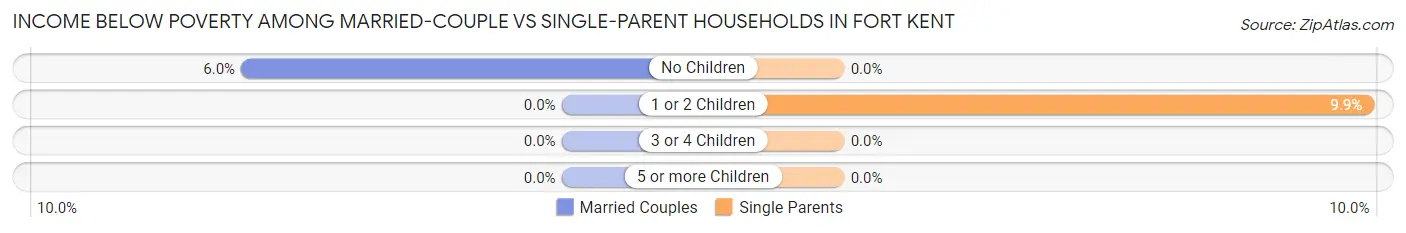
| Children | Married-Couple Families | Single-Parent Households |
| No Children | 19 (6.0%) | 0 (0.0%) |
| 1 or 2 Children | 0 (0.0%) | 17 (9.9%) |
| 3 or 4 Children | 0 (0.0%) | 0 (0.0%) |
| 5 or more Children | 0 (0.0%) | 0 (0.0%) |
| Total | 19 (4.4%) | 17 (7.3%) |
Race in Fort Kent
The most populous races in Fort Kent are White / Caucasian (2,294 | 91.2%), Two or more Races (213 | 8.5%), and Hispanic or Latino (54 | 2.1%).
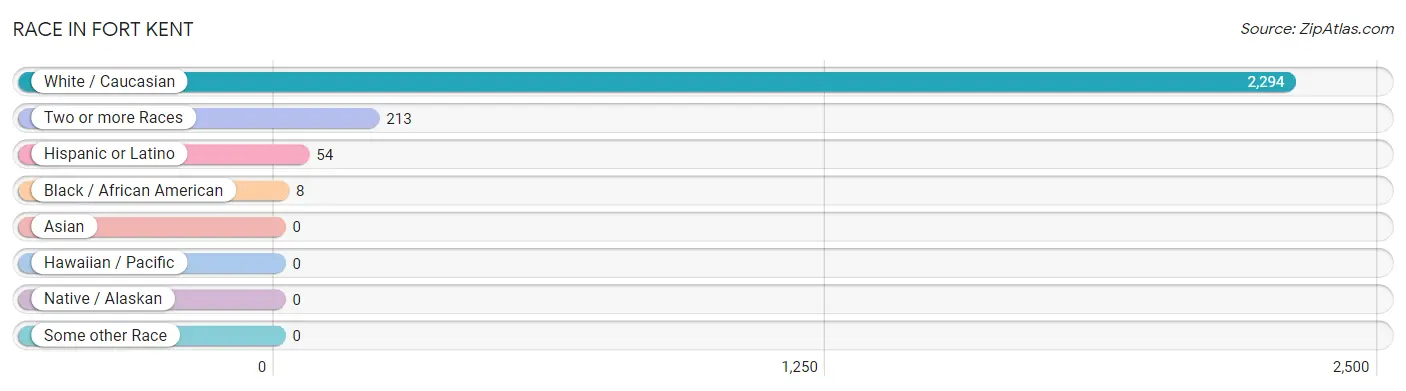
| Race | # Population | % Population |
| Asian | 0 | 0.0% |
| Black / African American | 8 | 0.3% |
| Hawaiian / Pacific | 0 | 0.0% |
| Hispanic or Latino | 54 | 2.1% |
| Native / Alaskan | 0 | 0.0% |
| White / Caucasian | 2,294 | 91.2% |
| Two or more Races | 213 | 8.5% |
| Some other Race | 0 | 0.0% |
| Total | 2,515 | 100.0% |
Ancestry in Fort Kent
The most populous ancestries reported in Fort Kent are French (834 | 33.2%), French Canadian (371 | 14.7%), American (261 | 10.4%), English (136 | 5.4%), and Irish (101 | 4.0%), together accounting for 67.7% of all Fort Kent residents.
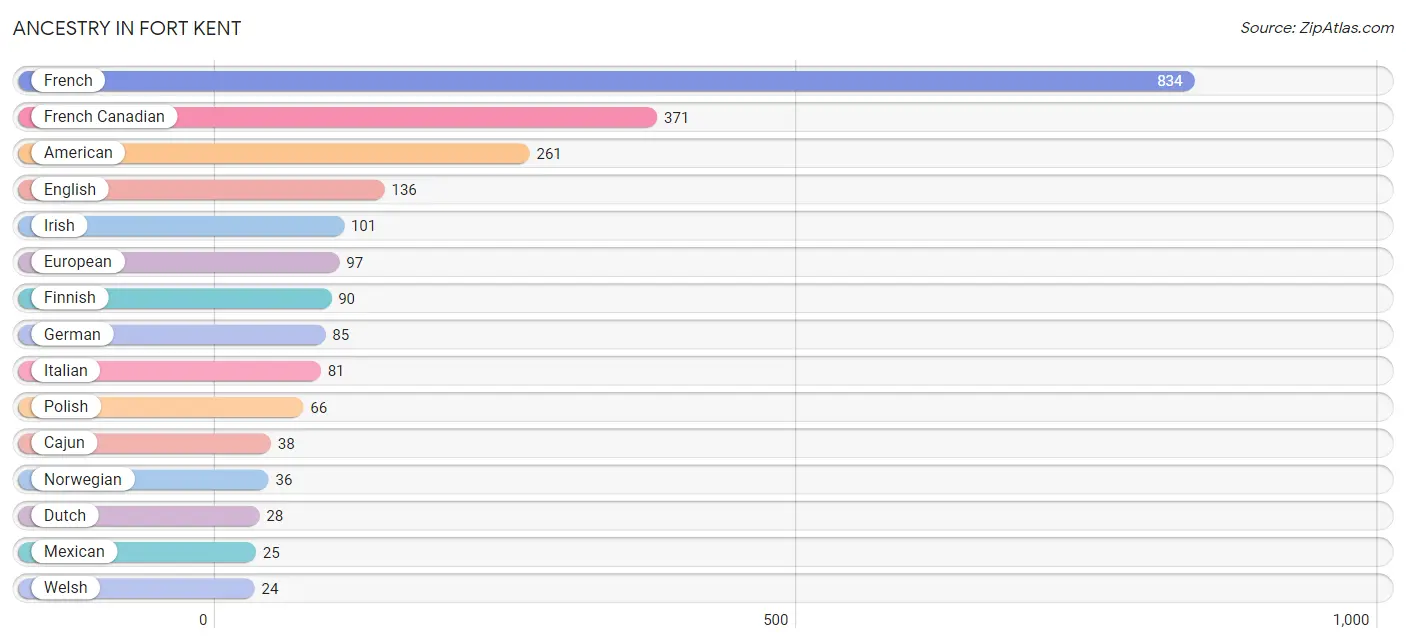
| Ancestry | # Population | % Population |
| American | 261 | 10.4% |
| British | 10 | 0.4% |
| Cajun | 38 | 1.5% |
| Canadian | 8 | 0.3% |
| Cherokee | 9 | 0.4% |
| Cuban | 8 | 0.3% |
| Czech | 7 | 0.3% |
| Dominican | 13 | 0.5% |
| Dutch | 28 | 1.1% |
| English | 136 | 5.4% |
| European | 97 | 3.9% |
| Finnish | 90 | 3.6% |
| French | 834 | 33.2% |
| French Canadian | 371 | 14.7% |
| German | 85 | 3.4% |
| Hungarian | 6 | 0.2% |
| Irish | 101 | 4.0% |
| Italian | 81 | 3.2% |
| Latvian | 18 | 0.7% |
| Mexican | 25 | 1.0% |
| Norwegian | 36 | 1.4% |
| Polish | 66 | 2.6% |
| Russian | 14 | 0.6% |
| Scotch-Irish | 20 | 0.8% |
| Scottish | 21 | 0.8% |
| Welsh | 24 | 0.9% | View All 26 Rows |
Immigrants in Fort Kent
The most numerous immigrant groups reported in Fort Kent came from Canada (177 | 7.0%), Central America (25 | 1.0%), Latin America (25 | 1.0%), Mexico (25 | 1.0%), and Czechoslovakia (7 | 0.3%), together accounting for 10.3% of all Fort Kent residents.
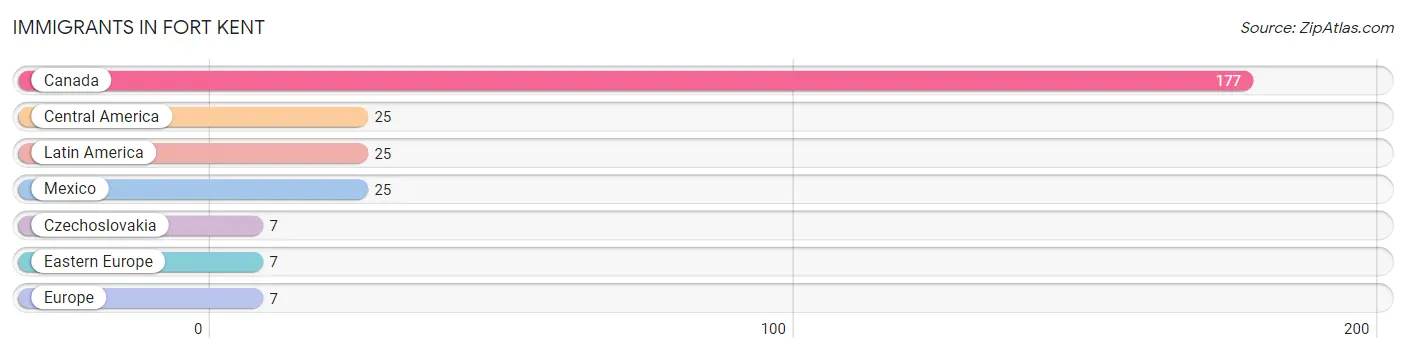
| Immigration Origin | # Population | % Population |
| Canada | 177 | 7.0% |
| Central America | 25 | 1.0% |
| Czechoslovakia | 7 | 0.3% |
| Eastern Europe | 7 | 0.3% |
| Europe | 7 | 0.3% |
| Latin America | 25 | 1.0% |
| Mexico | 25 | 1.0% | View All 7 Rows |
Sex and Age in Fort Kent
Sex and Age in Fort Kent
The most populous age groups in Fort Kent are 60 to 64 Years (121 | 11.5%) for men and 60 to 64 Years (170 | 11.6%) for women.
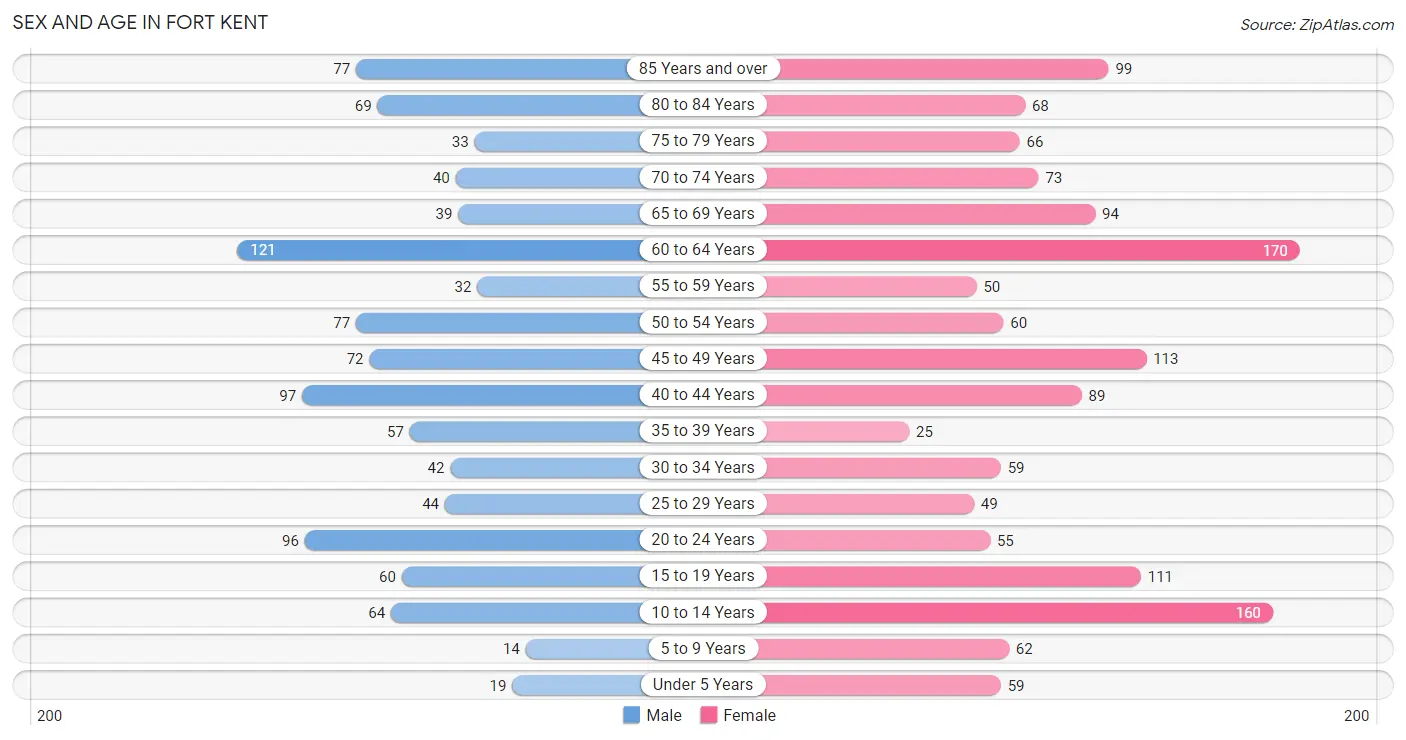
| Age Bracket | Male | Female |
| Under 5 Years | 19 (1.8%) | 59 (4.0%) |
| 5 to 9 Years | 14 (1.3%) | 62 (4.2%) |
| 10 to 14 Years | 64 (6.1%) | 160 (10.9%) |
| 15 to 19 Years | 60 (5.7%) | 111 (7.6%) |
| 20 to 24 Years | 96 (9.1%) | 55 (3.8%) |
| 25 to 29 Years | 44 (4.2%) | 49 (3.4%) |
| 30 to 34 Years | 42 (4.0%) | 59 (4.0%) |
| 35 to 39 Years | 57 (5.4%) | 25 (1.7%) |
| 40 to 44 Years | 97 (9.2%) | 89 (6.1%) |
| 45 to 49 Years | 72 (6.8%) | 113 (7.7%) |
| 50 to 54 Years | 77 (7.3%) | 60 (4.1%) |
| 55 to 59 Years | 32 (3.0%) | 50 (3.4%) |
| 60 to 64 Years | 121 (11.5%) | 170 (11.6%) |
| 65 to 69 Years | 39 (3.7%) | 94 (6.4%) |
| 70 to 74 Years | 40 (3.8%) | 73 (5.0%) |
| 75 to 79 Years | 33 (3.1%) | 66 (4.5%) |
| 80 to 84 Years | 69 (6.6%) | 68 (4.6%) |
| 85 Years and over | 77 (7.3%) | 99 (6.8%) |
| Total | 1,053 (100.0%) | 1,462 (100.0%) |
Families and Households in Fort Kent
Median Family Size in Fort Kent
The median family size in Fort Kent is 2.48 persons per family, with married-couple families (433 | 65.1%) accounting for the largest median family size of 2.58 persons per family. On the other hand, single female/mother families (148 | 22.3%) represent the smallest median family size with 2.24 persons per family.
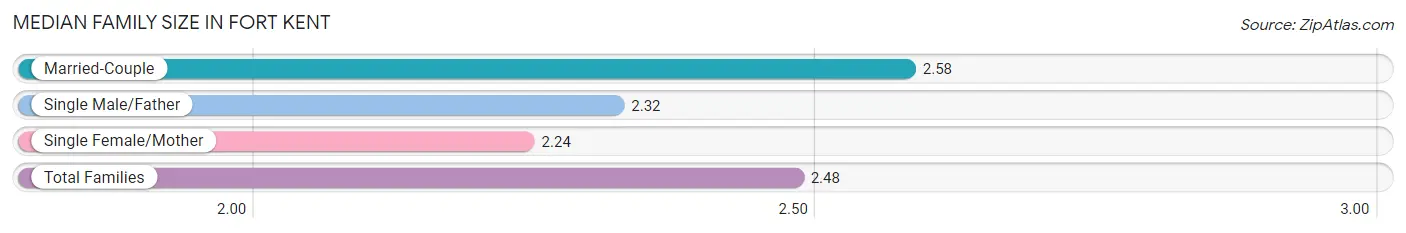
| Family Type | # Families | Family Size |
| Married-Couple | 433 (65.1%) | 2.58 |
| Single Male/Father | 84 (12.6%) | 2.32 |
| Single Female/Mother | 148 (22.3%) | 2.24 |
| Total Families | 665 (100.0%) | 2.48 |
Median Household Size in Fort Kent
The median household size in Fort Kent is 2.03 persons per household, with single female/mother households (148 | 13.6%) accounting for the largest median household size of 2.65 persons per household. non-family households (424 | 38.9%) represent the smallest median household size with 1.19 persons per household.
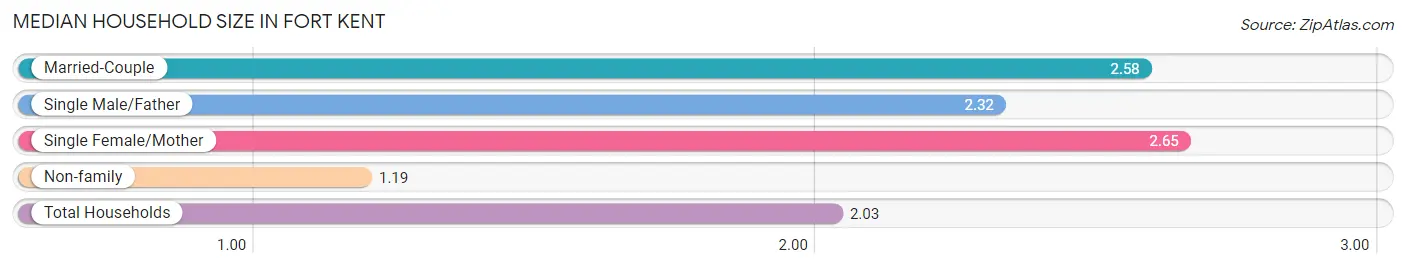
| Household Type | # Households | Household Size |
| Married-Couple | 433 (39.8%) | 2.58 |
| Single Male/Father | 84 (7.7%) | 2.32 |
| Single Female/Mother | 148 (13.6%) | 2.65 |
| Non-family | 424 (38.9%) | 1.19 |
| Total Households | 1,089 (100.0%) | 2.03 |
Household Size by Marriage Status in Fort Kent
Out of a total of 1,089 households in Fort Kent, 665 (61.1%) are family households, while 424 (38.9%) are nonfamily households. The most numerous type of family households are 2-person households, comprising 426, and the most common type of nonfamily households are 1-person households, comprising 383.
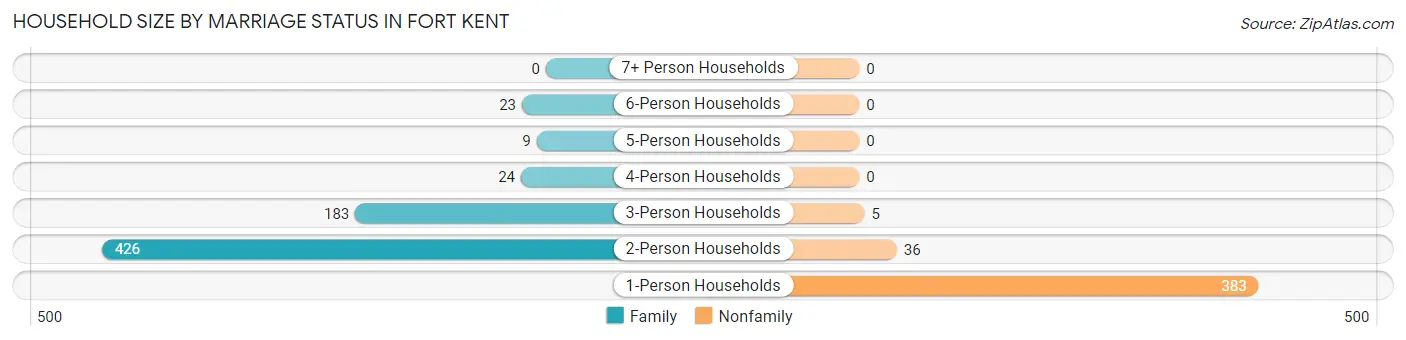
| Household Size | Family Households | Nonfamily Households |
| 1-Person Households | - | 383 (35.2%) |
| 2-Person Households | 426 (39.1%) | 36 (3.3%) |
| 3-Person Households | 183 (16.8%) | 5 (0.5%) |
| 4-Person Households | 24 (2.2%) | 0 (0.0%) |
| 5-Person Households | 9 (0.8%) | 0 (0.0%) |
| 6-Person Households | 23 (2.1%) | 0 (0.0%) |
| 7+ Person Households | 0 (0.0%) | 0 (0.0%) |
| Total | 665 (61.1%) | 424 (38.9%) |
Female Fertility in Fort Kent
Fertility by Age in Fort Kent
Average fertility rate in Fort Kent is 70.0 births per 1,000 women. Women in the age bracket of 20 to 34 years have the highest fertility rate with 215.0 births per 1,000 women. Women in the age bracket of 20 to 34 years acount for 100.0% of all women with births.
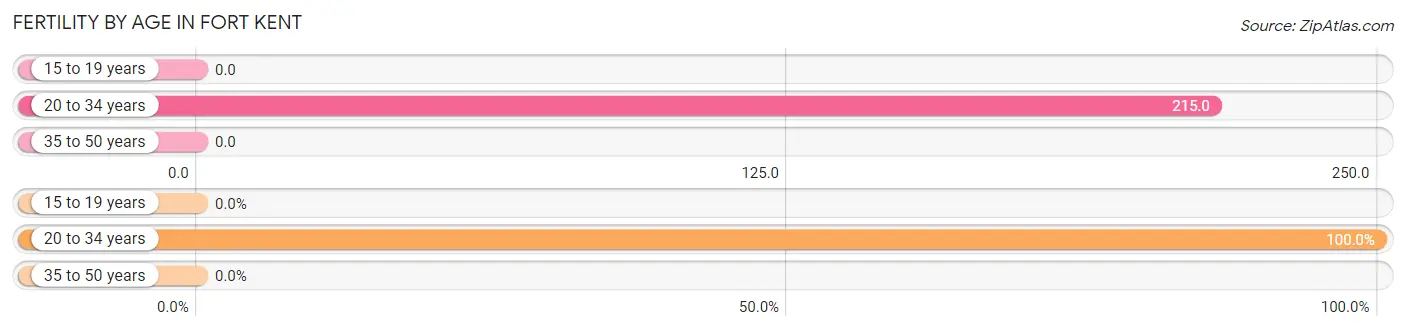
| Age Bracket | Women with Births | Births / 1,000 Women |
| 15 to 19 years | 0 (0.0%) | 0.0 |
| 20 to 34 years | 35 (100.0%) | 215.0 |
| 35 to 50 years | 0 (0.0%) | 0.0 |
| Total | 35 (100.0%) | 70.0 |
Fertility by Age by Marriage Status in Fort Kent
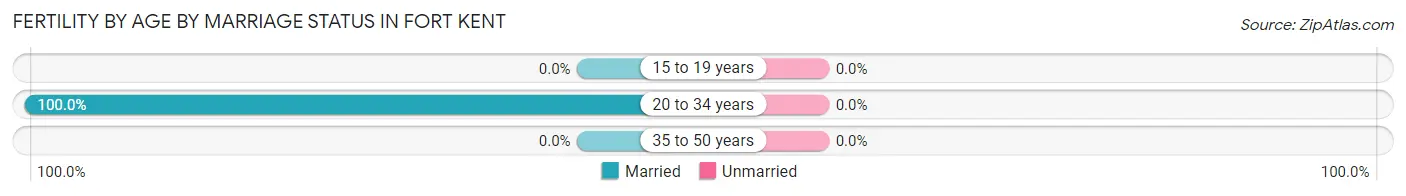
| Age Bracket | Married | Unmarried |
| 15 to 19 years | 0 (0.0%) | 0 (0.0%) |
| 20 to 34 years | 35 (100.0%) | 0 (0.0%) |
| 35 to 50 years | 0 (0.0%) | 0 (0.0%) |
| Total | 35 (100.0%) | 0 (0.0%) |
Fertility by Education in Fort Kent
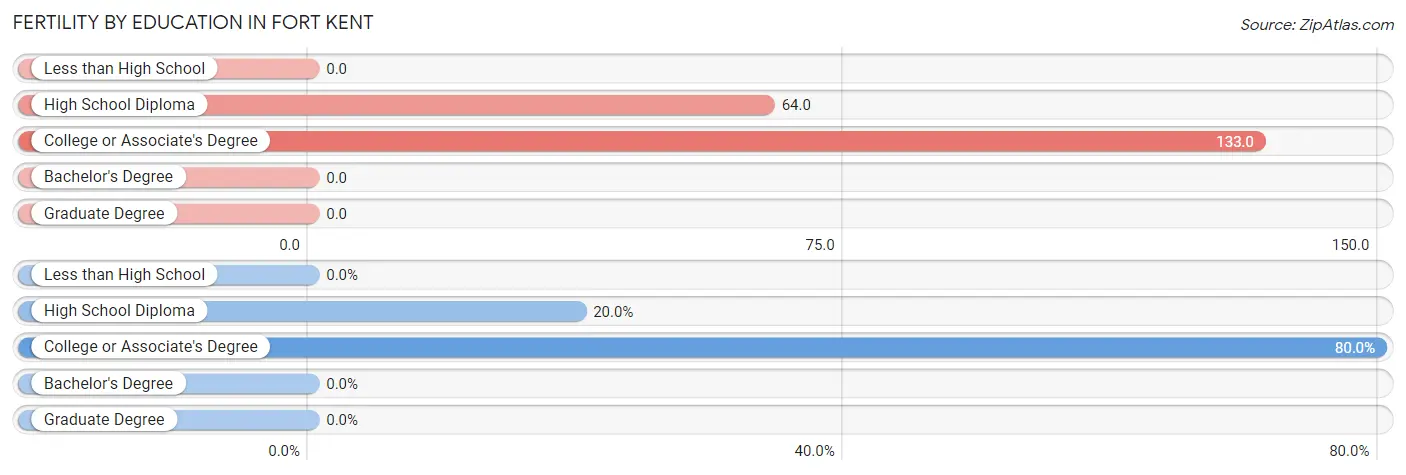
| Educational Attainment | Women with Births | Births / 1,000 Women |
| Less than High School | 0 (0.0%) | 0.0 |
| High School Diploma | 7 (20.0%) | 64.0 |
| College or Associate's Degree | 28 (80.0%) | 133.0 |
| Bachelor's Degree | 0 (0.0%) | 0.0 |
| Graduate Degree | 0 (0.0%) | 0.0 |
| Total | 35 (100.0%) | 70.0 |
Fertility by Education by Marriage Status in Fort Kent
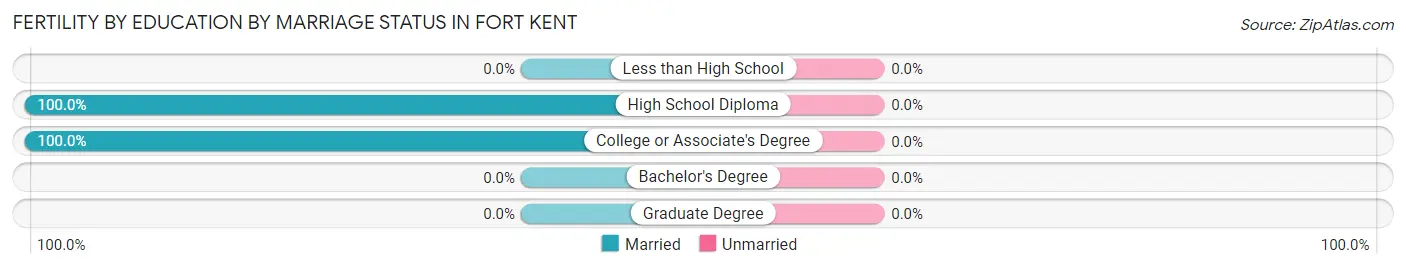
| Educational Attainment | Married | Unmarried |
| Less than High School | 0 (0.0%) | 0 (0.0%) |
| High School Diploma | 7 (100.0%) | 0 (0.0%) |
| College or Associate's Degree | 28 (100.0%) | 0 (0.0%) |
| Bachelor's Degree | 0 (0.0%) | 0 (0.0%) |
| Graduate Degree | 0 (0.0%) | 0 (0.0%) |
| Total | 35 (100.0%) | 0 (0.0%) |
Employment Characteristics in Fort Kent
Employment by Class of Employer in Fort Kent
Among the 1,079 employed individuals in Fort Kent, private company employees (602 | 55.8%), not-for-profit organizations (240 | 22.2%), and local government employees (96 | 8.9%) make up the most common classes of employment.
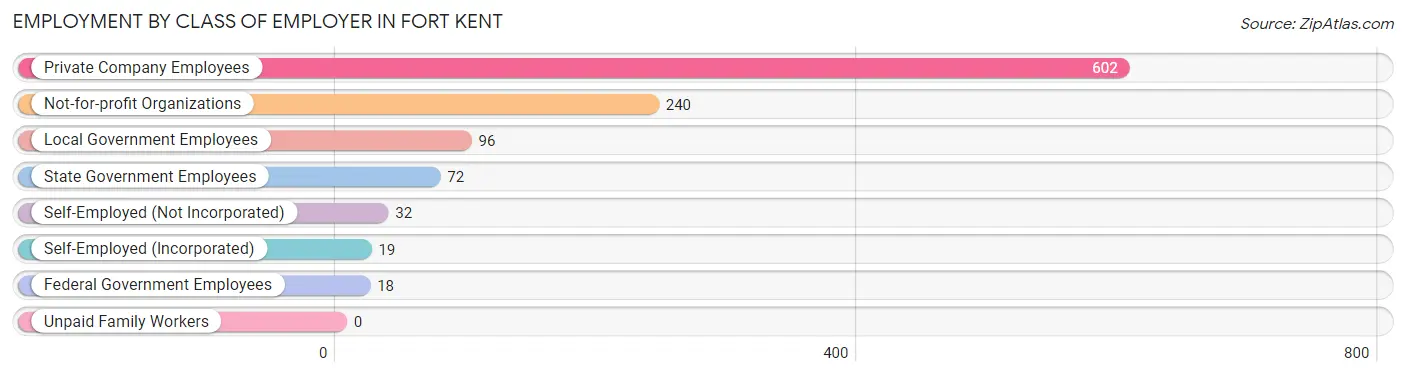
| Employer Class | # Employees | % Employees |
| Private Company Employees | 602 | 55.8% |
| Self-Employed (Incorporated) | 19 | 1.8% |
| Self-Employed (Not Incorporated) | 32 | 3.0% |
| Not-for-profit Organizations | 240 | 22.2% |
| Local Government Employees | 96 | 8.9% |
| State Government Employees | 72 | 6.7% |
| Federal Government Employees | 18 | 1.7% |
| Unpaid Family Workers | 0 | 0.0% |
| Total | 1,079 | 100.0% |
Employment Status by Age in Fort Kent
According to the labor force statistics for Fort Kent, out of the total population over 16 years of age (2,137), 51.9% or 1,109 individuals are in the labor force, with 2.8% or 31 of them unemployed. The age group with the highest labor force participation rate is 35 to 44 years, with 97.8% or 262 individuals in the labor force. Within the labor force, the 16 to 19 years age range has the highest percentage of unemployed individuals, with 21.2% or 14 of them being unemployed.
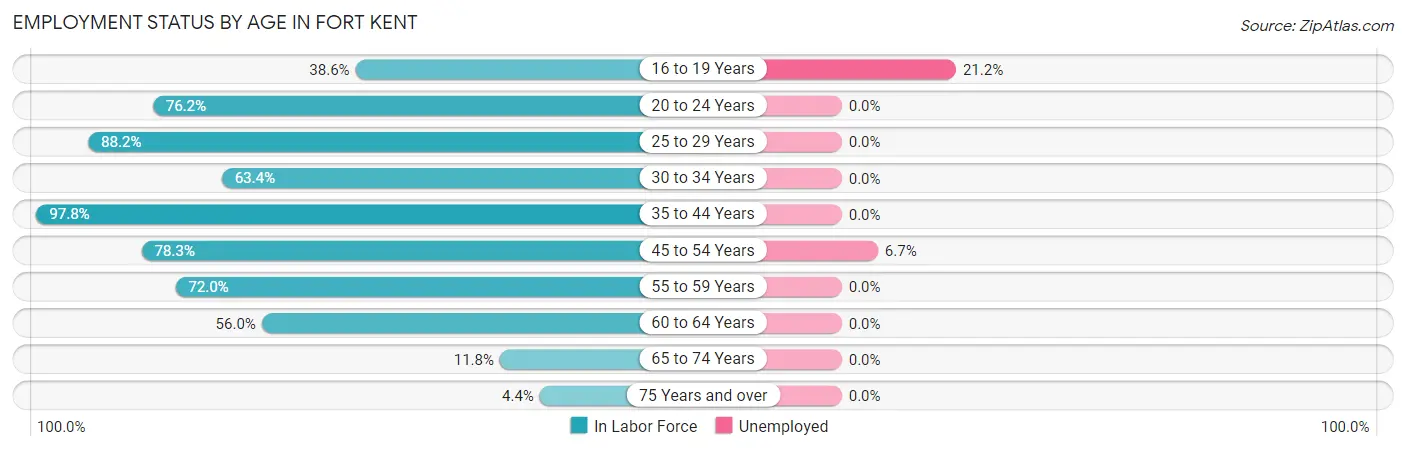
| Age Bracket | In Labor Force | Unemployed |
| 16 to 19 Years | 66 (38.6%) | 14 (21.2%) |
| 20 to 24 Years | 115 (76.2%) | 0 (0.0%) |
| 25 to 29 Years | 82 (88.2%) | 0 (0.0%) |
| 30 to 34 Years | 64 (63.4%) | 0 (0.0%) |
| 35 to 44 Years | 262 (97.8%) | 0 (0.0%) |
| 45 to 54 Years | 252 (78.3%) | 17 (6.7%) |
| 55 to 59 Years | 59 (72.0%) | 0 (0.0%) |
| 60 to 64 Years | 163 (56.0%) | 0 (0.0%) |
| 65 to 74 Years | 29 (11.8%) | 0 (0.0%) |
| 75 Years and over | 18 (4.4%) | 0 (0.0%) |
| Total | 1,109 (51.9%) | 31 (2.8%) |
Employment Status by Educational Attainment in Fort Kent
According to labor force statistics for Fort Kent, 76.2% of individuals (882) out of the total population between 25 and 64 years of age (1,157) are in the labor force, with 1.9% or 17 of them being unemployed. The group with the highest labor force participation rate are those with the educational attainment of less than high school, with 100.0% or 17 individuals in the labor force. Within the labor force, individuals with bachelor's degree or higher education have the highest percentage of unemployment, with 4.2% or 17 of them being unemployed.
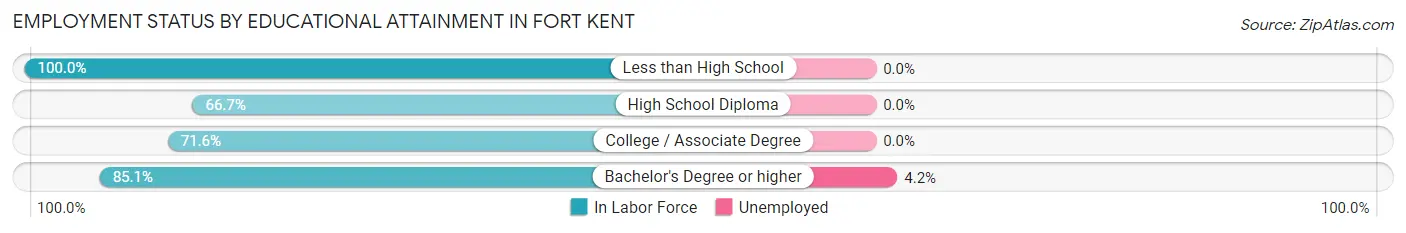
| Educational Attainment | In Labor Force | Unemployed |
| Less than High School | 17 (100.0%) | 0 (0.0%) |
| High School Diploma | 212 (66.7%) | 0 (0.0%) |
| College / Associate Degree | 247 (71.6%) | 0 (0.0%) |
| Bachelor's Degree or higher | 406 (85.1%) | 20 (4.2%) |
| Total | 882 (76.2%) | 22 (1.9%) |
Employment Occupations by Sex in Fort Kent
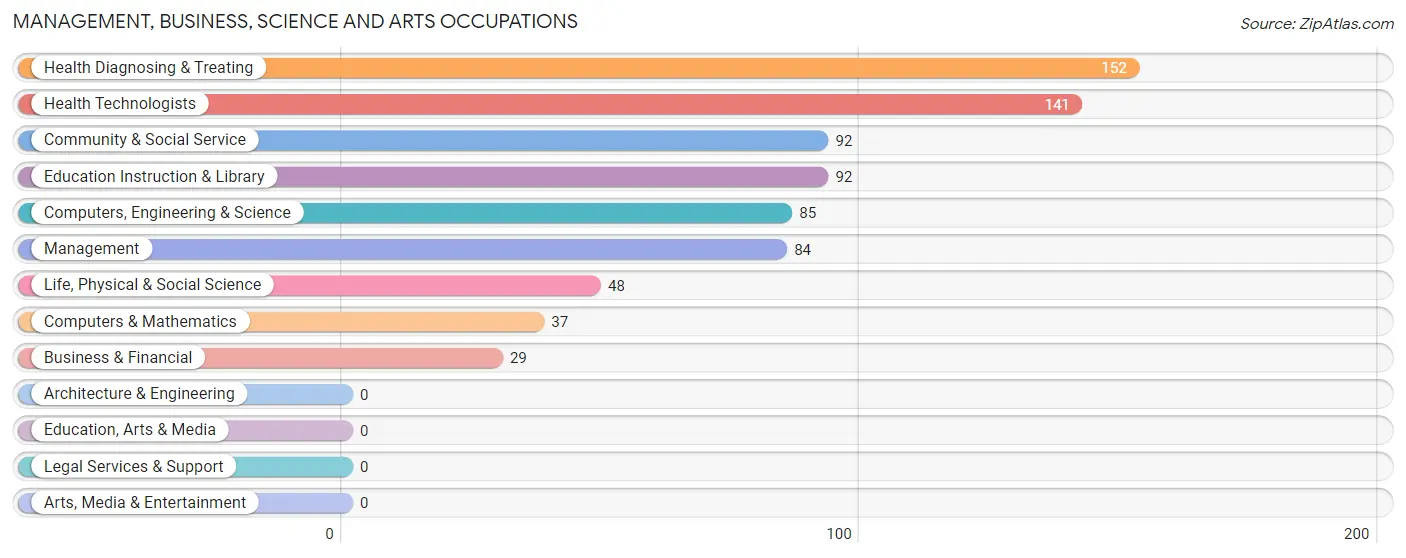
Management, Business, Science and Arts Occupations
The most common Management, Business, Science and Arts occupations in Fort Kent are Health Diagnosing & Treating (152 | 14.1%), Health Technologists (141 | 13.1%), Community & Social Service (92 | 8.5%), Education Instruction & Library (92 | 8.5%), and Computers, Engineering & Science (85 | 7.9%).
Management, Business, Science and Arts Occupations by Sex
Within the Management, Business, Science and Arts occupations in Fort Kent, the most male-oriented occupations are Computers, Engineering & Science (100.0%), Computers & Mathematics (100.0%), and Life, Physical & Social Science (100.0%), while the most female-oriented occupations are Business & Financial (100.0%), Health Diagnosing & Treating (82.9%), and Health Technologists (81.6%).
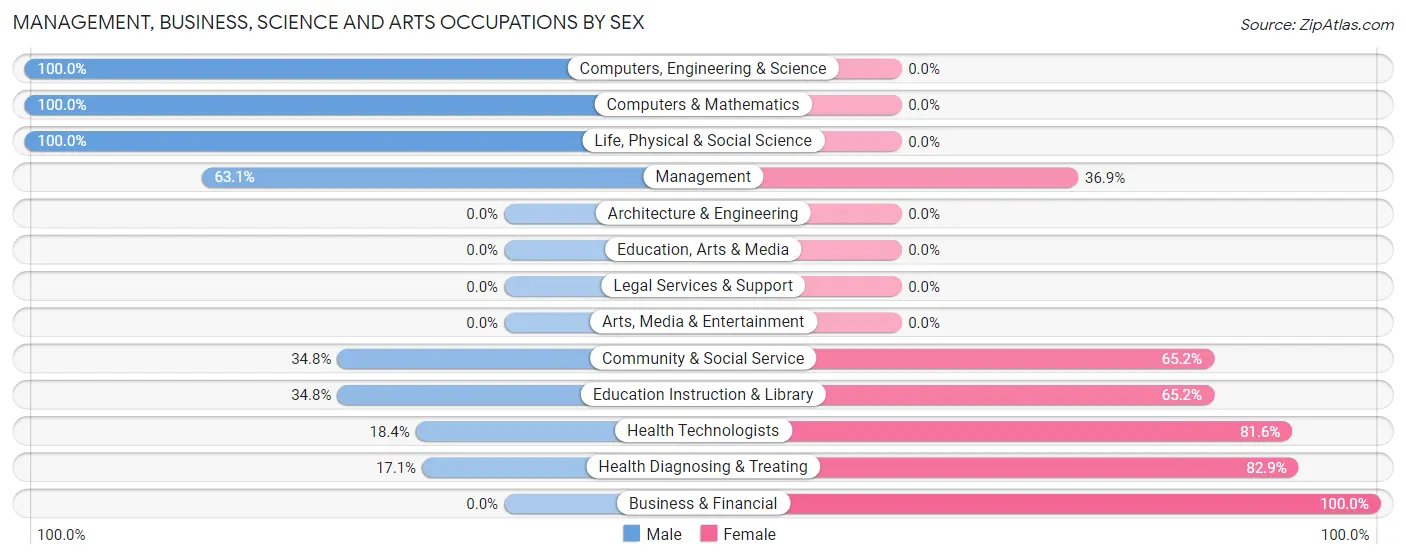
| Occupation | Male | Female |
| Management | 53 (63.1%) | 31 (36.9%) |
| Business & Financial | 0 (0.0%) | 29 (100.0%) |
| Computers, Engineering & Science | 85 (100.0%) | 0 (0.0%) |
| Computers & Mathematics | 37 (100.0%) | 0 (0.0%) |
| Architecture & Engineering | 0 (0.0%) | 0 (0.0%) |
| Life, Physical & Social Science | 48 (100.0%) | 0 (0.0%) |
| Community & Social Service | 32 (34.8%) | 60 (65.2%) |
| Education, Arts & Media | 0 (0.0%) | 0 (0.0%) |
| Legal Services & Support | 0 (0.0%) | 0 (0.0%) |
| Education Instruction & Library | 32 (34.8%) | 60 (65.2%) |
| Arts, Media & Entertainment | 0 (0.0%) | 0 (0.0%) |
| Health Diagnosing & Treating | 26 (17.1%) | 126 (82.9%) |
| Health Technologists | 26 (18.4%) | 115 (81.6%) |
| Total (Category) | 196 (44.3%) | 246 (55.7%) |
| Total (Overall) | 570 (52.8%) | 509 (47.2%) |
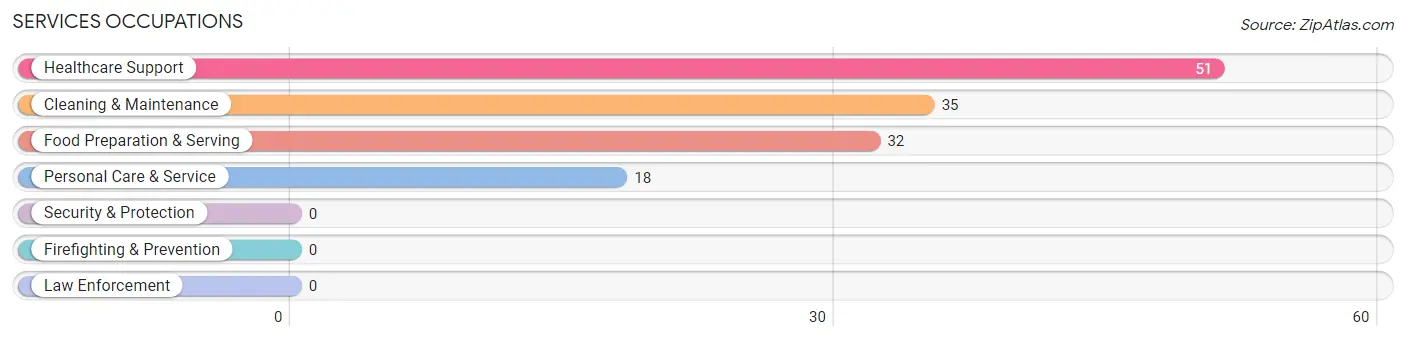
Services Occupations
The most common Services occupations in Fort Kent are Healthcare Support (51 | 4.7%), Cleaning & Maintenance (35 | 3.2%), Food Preparation & Serving (32 | 3.0%), and Personal Care & Service (18 | 1.7%).
Services Occupations by Sex
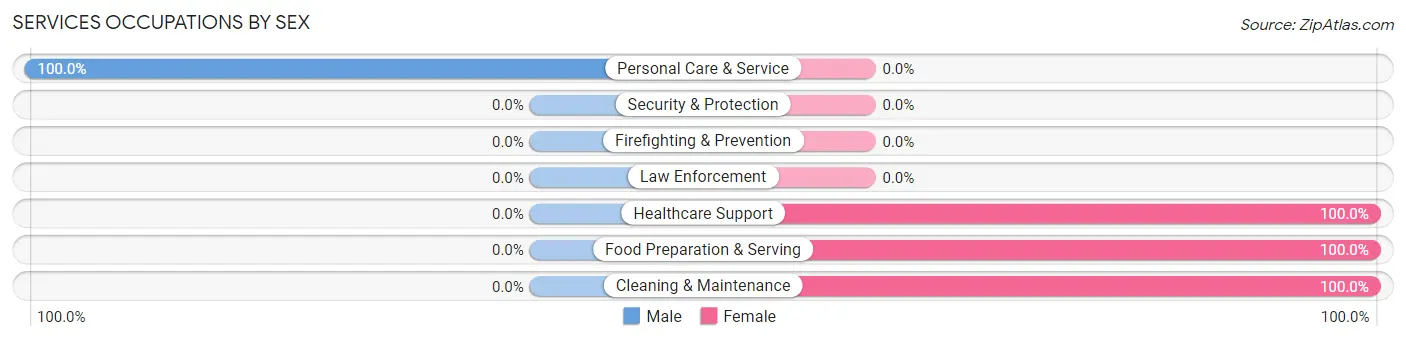
| Occupation | Male | Female |
| Healthcare Support | 0 (0.0%) | 51 (100.0%) |
| Security & Protection | 0 (0.0%) | 0 (0.0%) |
| Firefighting & Prevention | 0 (0.0%) | 0 (0.0%) |
| Law Enforcement | 0 (0.0%) | 0 (0.0%) |
| Food Preparation & Serving | 0 (0.0%) | 32 (100.0%) |
| Cleaning & Maintenance | 0 (0.0%) | 35 (100.0%) |
| Personal Care & Service | 18 (100.0%) | 0 (0.0%) |
| Total (Category) | 18 (13.2%) | 118 (86.8%) |
| Total (Overall) | 570 (52.8%) | 509 (47.2%) |
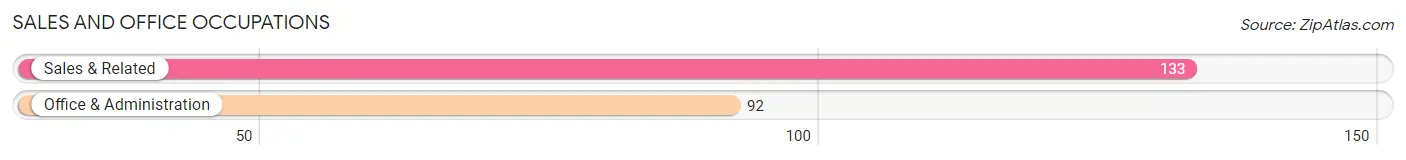
Sales and Office Occupations
The most common Sales and Office occupations in Fort Kent are Sales & Related (133 | 12.3%), and Office & Administration (92 | 8.5%).
Sales and Office Occupations by Sex
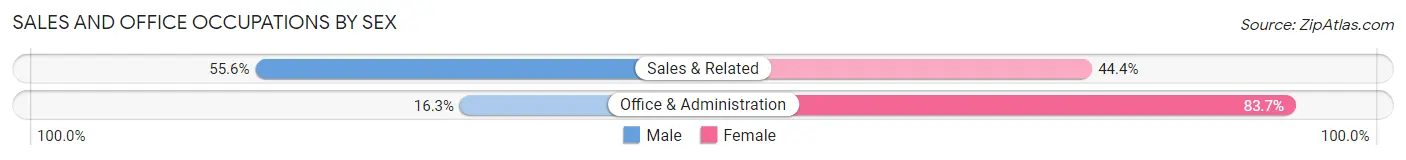
| Occupation | Male | Female |
| Sales & Related | 74 (55.6%) | 59 (44.4%) |
| Office & Administration | 15 (16.3%) | 77 (83.7%) |
| Total (Category) | 89 (39.6%) | 136 (60.4%) |
| Total (Overall) | 570 (52.8%) | 509 (47.2%) |
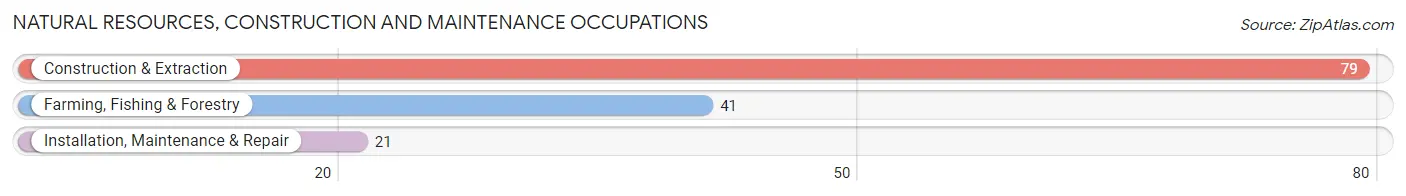
Natural Resources, Construction and Maintenance Occupations
The most common Natural Resources, Construction and Maintenance occupations in Fort Kent are Construction & Extraction (79 | 7.3%), Farming, Fishing & Forestry (41 | 3.8%), and Installation, Maintenance & Repair (21 | 1.9%).
Natural Resources, Construction and Maintenance Occupations by Sex
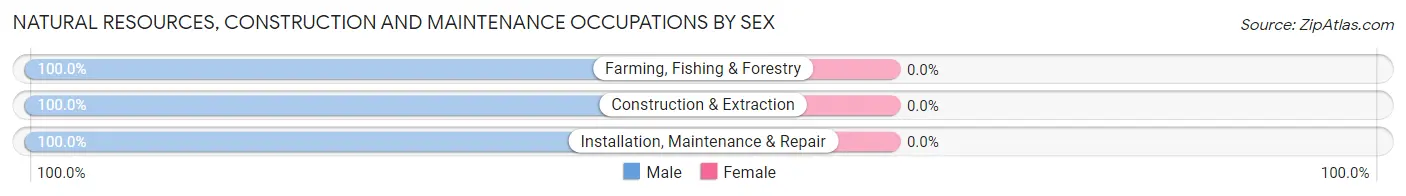
| Occupation | Male | Female |
| Farming, Fishing & Forestry | 41 (100.0%) | 0 (0.0%) |
| Construction & Extraction | 79 (100.0%) | 0 (0.0%) |
| Installation, Maintenance & Repair | 21 (100.0%) | 0 (0.0%) |
| Total (Category) | 141 (100.0%) | 0 (0.0%) |
| Total (Overall) | 570 (52.8%) | 509 (47.2%) |
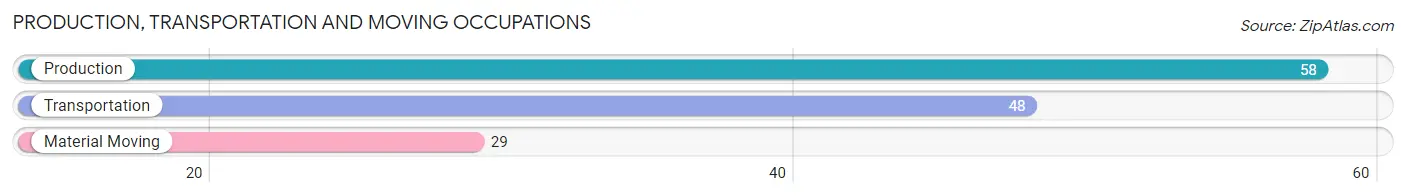
Production, Transportation and Moving Occupations
The most common Production, Transportation and Moving occupations in Fort Kent are Production (58 | 5.4%), Transportation (48 | 4.4%), and Material Moving (29 | 2.7%).
Production, Transportation and Moving Occupations by Sex
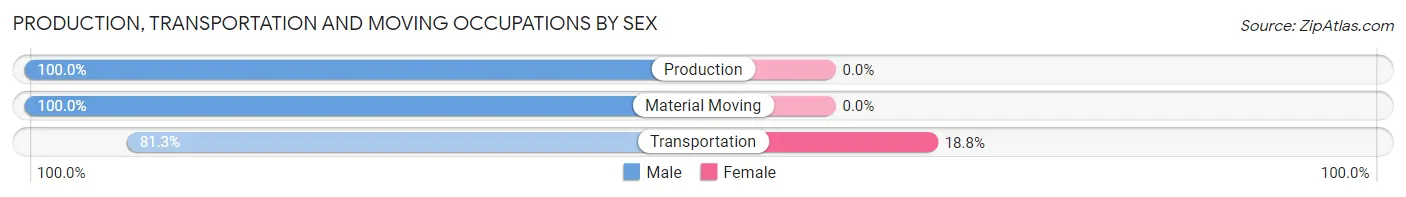
| Occupation | Male | Female |
| Production | 58 (100.0%) | 0 (0.0%) |
| Transportation | 39 (81.2%) | 9 (18.8%) |
| Material Moving | 29 (100.0%) | 0 (0.0%) |
| Total (Category) | 126 (93.3%) | 9 (6.7%) |
| Total (Overall) | 570 (52.8%) | 509 (47.2%) |
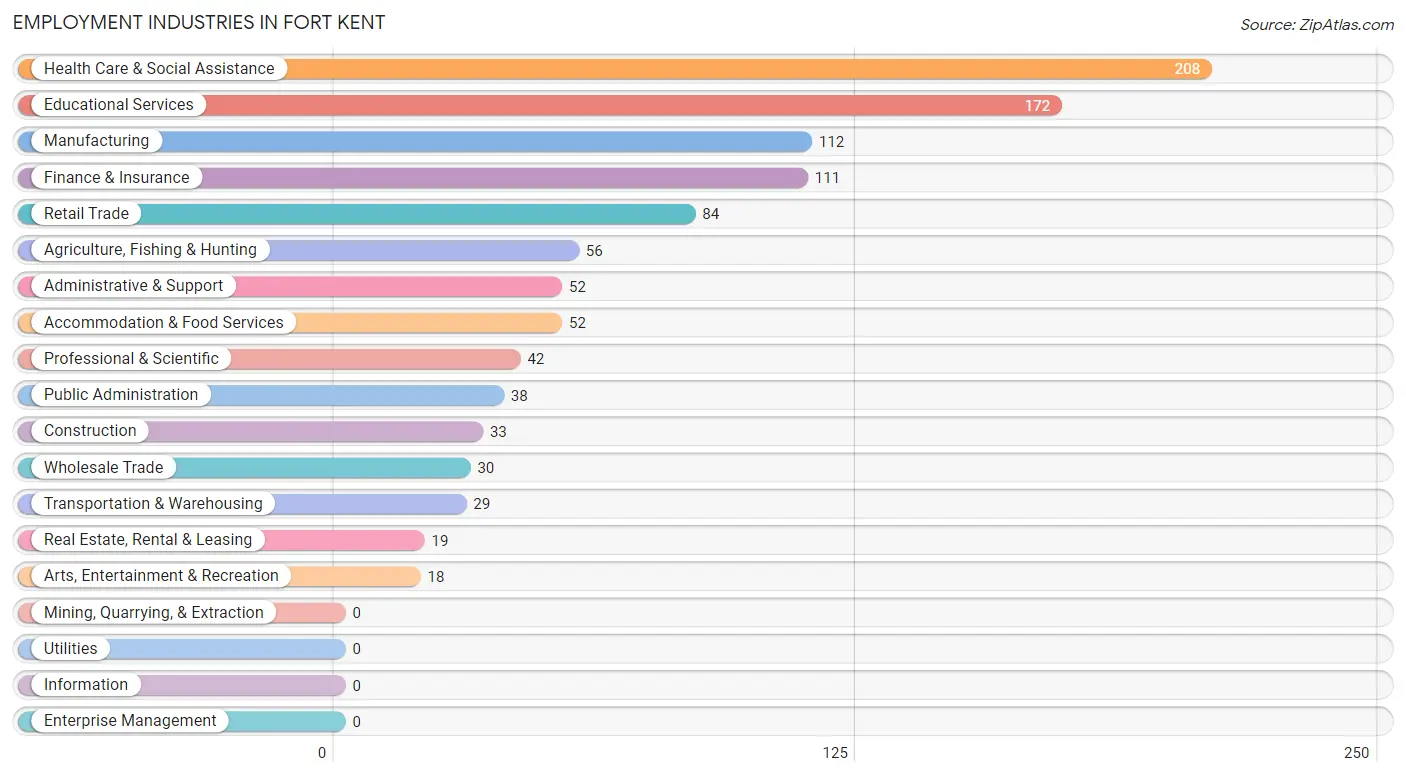
Employment Industries by Sex in Fort Kent
Employment Industries in Fort Kent
The major employment industries in Fort Kent include Health Care & Social Assistance (208 | 19.3%), Educational Services (172 | 15.9%), Manufacturing (112 | 10.4%), Finance & Insurance (111 | 10.3%), and Retail Trade (84 | 7.8%).
Employment Industries by Sex in Fort Kent
The Fort Kent industries that see more men than women are Agriculture, Fishing & Hunting (100.0%), Construction (100.0%), and Manufacturing (100.0%), whereas the industries that tend to have a higher number of women are Accommodation & Food Services (100.0%), Health Care & Social Assistance (80.3%), and Administrative & Support (71.2%).
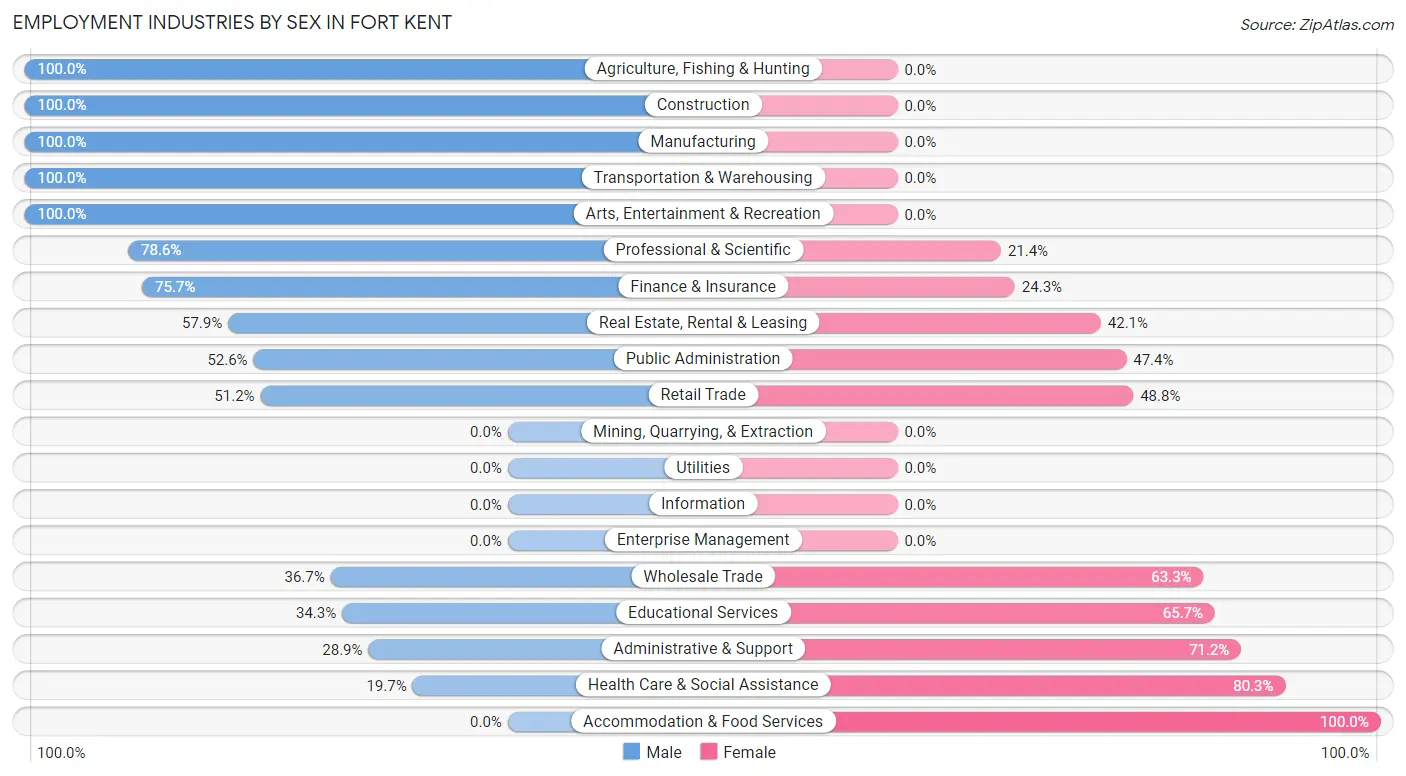
| Industry | Male | Female |
| Agriculture, Fishing & Hunting | 56 (100.0%) | 0 (0.0%) |
| Mining, Quarrying, & Extraction | 0 (0.0%) | 0 (0.0%) |
| Construction | 33 (100.0%) | 0 (0.0%) |
| Manufacturing | 112 (100.0%) | 0 (0.0%) |
| Wholesale Trade | 11 (36.7%) | 19 (63.3%) |
| Retail Trade | 43 (51.2%) | 41 (48.8%) |
| Transportation & Warehousing | 29 (100.0%) | 0 (0.0%) |
| Utilities | 0 (0.0%) | 0 (0.0%) |
| Information | 0 (0.0%) | 0 (0.0%) |
| Finance & Insurance | 84 (75.7%) | 27 (24.3%) |
| Real Estate, Rental & Leasing | 11 (57.9%) | 8 (42.1%) |
| Professional & Scientific | 33 (78.6%) | 9 (21.4%) |
| Enterprise Management | 0 (0.0%) | 0 (0.0%) |
| Administrative & Support | 15 (28.8%) | 37 (71.2%) |
| Educational Services | 59 (34.3%) | 113 (65.7%) |
| Health Care & Social Assistance | 41 (19.7%) | 167 (80.3%) |
| Arts, Entertainment & Recreation | 18 (100.0%) | 0 (0.0%) |
| Accommodation & Food Services | 0 (0.0%) | 52 (100.0%) |
| Public Administration | 20 (52.6%) | 18 (47.4%) |
| Total | 570 (52.8%) | 509 (47.2%) |
Education in Fort Kent
School Enrollment in Fort Kent
The most common levels of schooling among the 606 students in Fort Kent are college / undergraduate (222 | 36.6%), middle school (202 | 33.3%), and elementary school (55 | 9.1%).
| School Level | # Students | % Students |
| Nursery / Preschool | 13 | 2.1% |
| Kindergarten | 21 | 3.5% |
| Elementary School | 55 | 9.1% |
| Middle School | 202 | 33.3% |
| High School | 54 | 8.9% |
| College / Undergraduate | 222 | 36.6% |
| Graduate / Professional | 39 | 6.4% |
| Total | 606 | 100.0% |
School Enrollment by Age by Funding Source in Fort Kent
Out of a total of 606 students who are enrolled in schools in Fort Kent, 115 (19.0%) attend a private institution, while the remaining 491 (81.0%) are enrolled in public schools. The age group of 18 to 19 year olds has the highest likelihood of being enrolled in private schools, with 53 (52.5% in the age bracket) enrolled. Conversely, the age group of 3 to 4 year olds has the lowest likelihood of being enrolled in a private school, with 13 (100.0% in the age bracket) attending a public institution.
| Age Bracket | Public School | Private School |
| 3 to 4 Year Olds | 13 (100.0%) | 0 (0.0%) |
| 5 to 9 Year Old | 76 (100.0%) | 0 (0.0%) |
| 10 to 14 Year Olds | 224 (100.0%) | 0 (0.0%) |
| 15 to 17 Year Olds | 45 (81.8%) | 10 (18.2%) |
| 18 to 19 Year Olds | 48 (47.5%) | 53 (52.5%) |
| 20 to 24 Year Olds | 24 (53.3%) | 21 (46.7%) |
| 25 to 34 Year Olds | 37 (67.3%) | 18 (32.7%) |
| 35 Years and over | 24 (64.9%) | 13 (35.1%) |
| Total | 491 (81.0%) | 115 (19.0%) |
Educational Attainment by Field of Study in Fort Kent
Science & technology (228 | 34.2%), business (130 | 19.5%), bio, nature & agricultural (68 | 10.2%), education (63 | 9.5%), and social sciences (39 | 5.9%) are the most common fields of study among 667 individuals in Fort Kent who have obtained a bachelor's degree or higher.
| Field of Study | # Graduates | % Graduates |
| Computers & Mathematics | 0 | 0.0% |
| Bio, Nature & Agricultural | 68 | 10.2% |
| Physical & Health Sciences | 14 | 2.1% |
| Psychology | 17 | 2.5% |
| Social Sciences | 39 | 5.9% |
| Engineering | 0 | 0.0% |
| Multidisciplinary Studies | 29 | 4.3% |
| Science & Technology | 228 | 34.2% |
| Business | 130 | 19.5% |
| Education | 63 | 9.5% |
| Literature & Languages | 0 | 0.0% |
| Liberal Arts & History | 24 | 3.6% |
| Visual & Performing Arts | 37 | 5.6% |
| Communications | 0 | 0.0% |
| Arts & Humanities | 18 | 2.7% |
| Total | 667 | 100.0% |
Transportation & Commute in Fort Kent
Vehicle Availability by Sex in Fort Kent
The most prevalent vehicle ownership categories in Fort Kent are males with 2 vehicles (297, accounting for 52.1%) and females with 2 vehicles (259, making up 64.1%).
| Vehicles Available | Male | Female |
| No Vehicle | 16 (2.8%) | 0 (0.0%) |
| 1 Vehicle | 126 (22.1%) | 128 (27.7%) |
| 2 Vehicles | 297 (52.1%) | 259 (55.9%) |
| 3 Vehicles | 115 (20.2%) | 60 (13.0%) |
| 4 Vehicles | 16 (2.8%) | 16 (3.5%) |
| 5 or more Vehicles | 0 (0.0%) | 0 (0.0%) |
| Total | 570 (100.0%) | 463 (100.0%) |
Commute Time in Fort Kent
The most frequently occuring commute durations in Fort Kent are 5 to 9 minutes (390 commuters, 38.4%), less than 5 minutes (191 commuters, 18.8%), and 60 to 89 minutes (121 commuters, 11.9%).
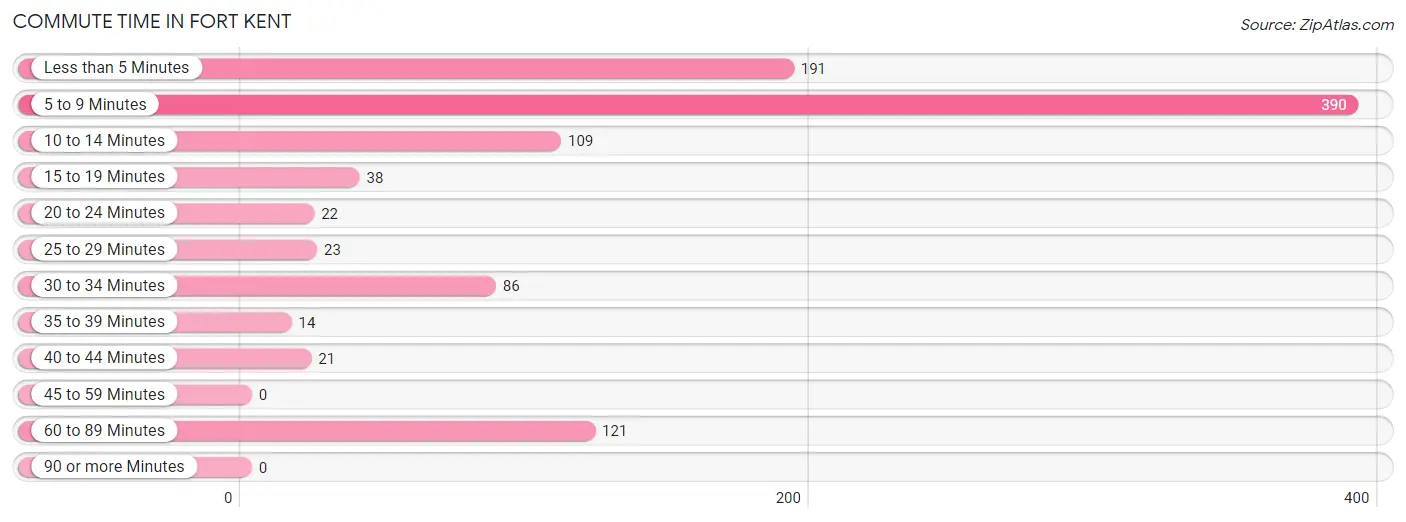
| Commute Time | # Commuters | % Commuters |
| Less than 5 Minutes | 191 | 18.8% |
| 5 to 9 Minutes | 390 | 38.4% |
| 10 to 14 Minutes | 109 | 10.7% |
| 15 to 19 Minutes | 38 | 3.7% |
| 20 to 24 Minutes | 22 | 2.2% |
| 25 to 29 Minutes | 23 | 2.3% |
| 30 to 34 Minutes | 86 | 8.5% |
| 35 to 39 Minutes | 14 | 1.4% |
| 40 to 44 Minutes | 21 | 2.1% |
| 45 to 59 Minutes | 0 | 0.0% |
| 60 to 89 Minutes | 121 | 11.9% |
| 90 or more Minutes | 0 | 0.0% |
Commute Time by Sex in Fort Kent
The most common commute times in Fort Kent are 5 to 9 minutes (161 commuters, 29.0%) for males and 5 to 9 minutes (229 commuters, 49.9%) for females.
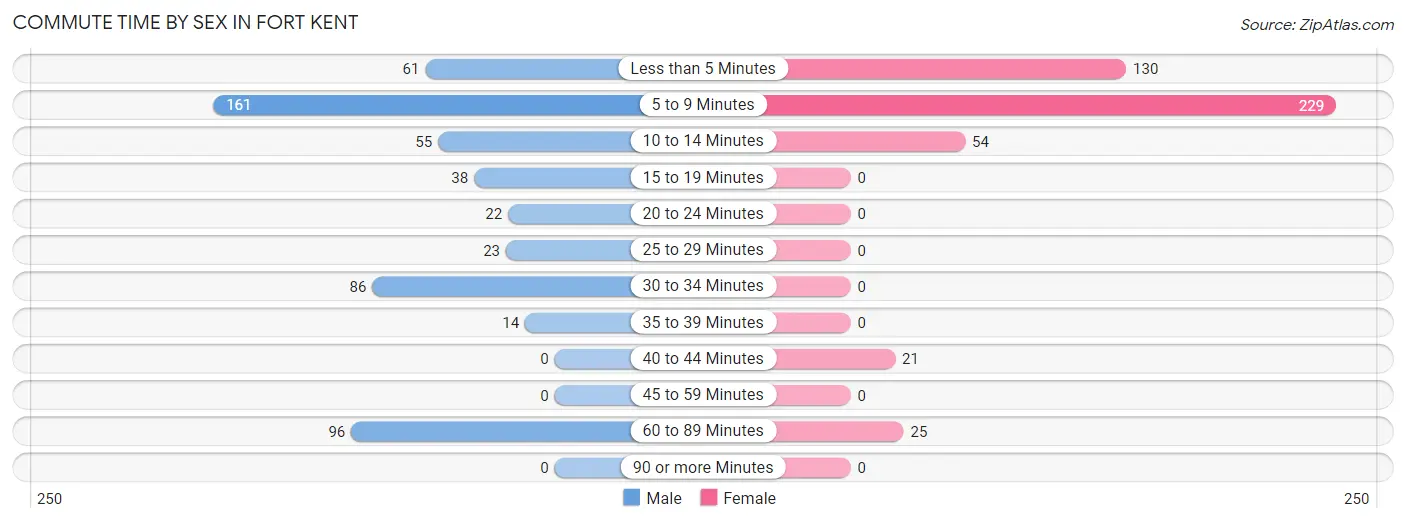
| Commute Time | Male | Female |
| Less than 5 Minutes | 61 (11.0%) | 130 (28.3%) |
| 5 to 9 Minutes | 161 (29.0%) | 229 (49.9%) |
| 10 to 14 Minutes | 55 (9.9%) | 54 (11.8%) |
| 15 to 19 Minutes | 38 (6.8%) | 0 (0.0%) |
| 20 to 24 Minutes | 22 (4.0%) | 0 (0.0%) |
| 25 to 29 Minutes | 23 (4.1%) | 0 (0.0%) |
| 30 to 34 Minutes | 86 (15.5%) | 0 (0.0%) |
| 35 to 39 Minutes | 14 (2.5%) | 0 (0.0%) |
| 40 to 44 Minutes | 0 (0.0%) | 21 (4.6%) |
| 45 to 59 Minutes | 0 (0.0%) | 0 (0.0%) |
| 60 to 89 Minutes | 96 (17.3%) | 25 (5.4%) |
| 90 or more Minutes | 0 (0.0%) | 0 (0.0%) |
Time of Departure to Work by Sex in Fort Kent
The most frequent times of departure to work in Fort Kent are 12:00 AM to 4:59 AM (122, 21.9%) for males and 6:00 AM to 6:29 AM (103, 22.4%) for females.
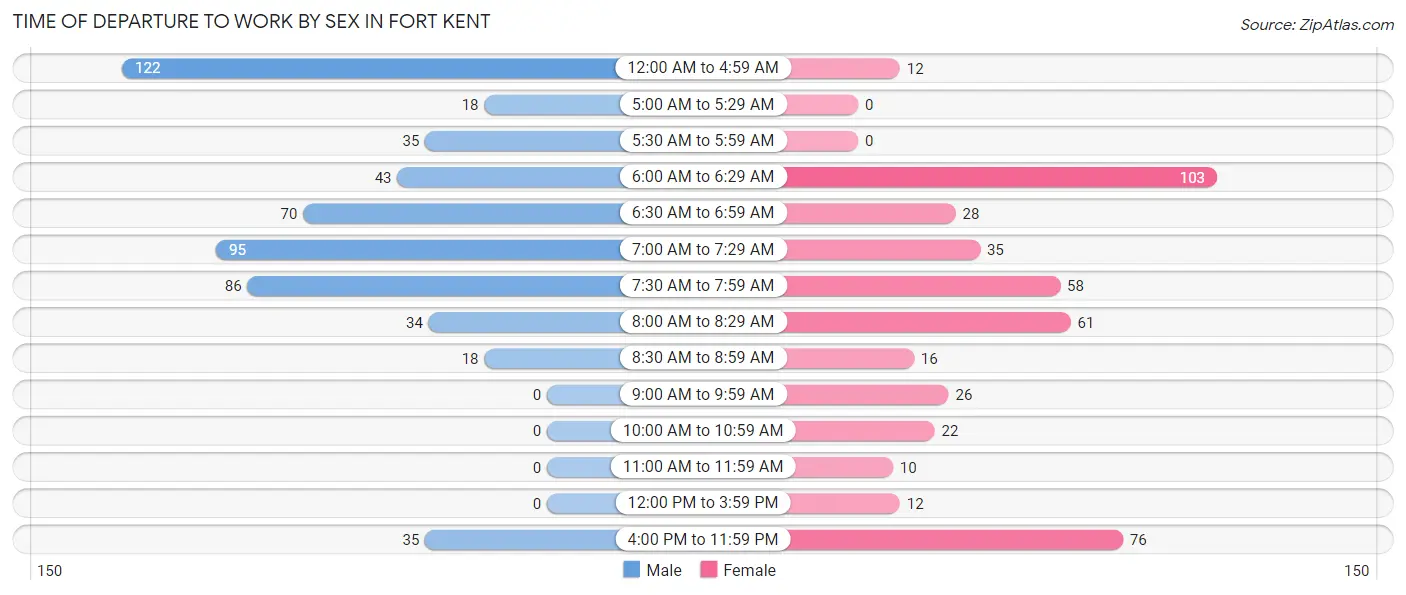
| Time of Departure | Male | Female |
| 12:00 AM to 4:59 AM | 122 (21.9%) | 12 (2.6%) |
| 5:00 AM to 5:29 AM | 18 (3.2%) | 0 (0.0%) |
| 5:30 AM to 5:59 AM | 35 (6.3%) | 0 (0.0%) |
| 6:00 AM to 6:29 AM | 43 (7.7%) | 103 (22.4%) |
| 6:30 AM to 6:59 AM | 70 (12.6%) | 28 (6.1%) |
| 7:00 AM to 7:29 AM | 95 (17.1%) | 35 (7.6%) |
| 7:30 AM to 7:59 AM | 86 (15.5%) | 58 (12.6%) |
| 8:00 AM to 8:29 AM | 34 (6.1%) | 61 (13.3%) |
| 8:30 AM to 8:59 AM | 18 (3.2%) | 16 (3.5%) |
| 9:00 AM to 9:59 AM | 0 (0.0%) | 26 (5.7%) |
| 10:00 AM to 10:59 AM | 0 (0.0%) | 22 (4.8%) |
| 11:00 AM to 11:59 AM | 0 (0.0%) | 10 (2.2%) |
| 12:00 PM to 3:59 PM | 0 (0.0%) | 12 (2.6%) |
| 4:00 PM to 11:59 PM | 35 (6.3%) | 76 (16.6%) |
| Total | 556 (100.0%) | 459 (100.0%) |
Housing Occupancy in Fort Kent
Occupancy by Ownership in Fort Kent
Of the total 1,089 dwellings in Fort Kent, owner-occupied units account for 666 (61.2%), while renter-occupied units make up 423 (38.8%).
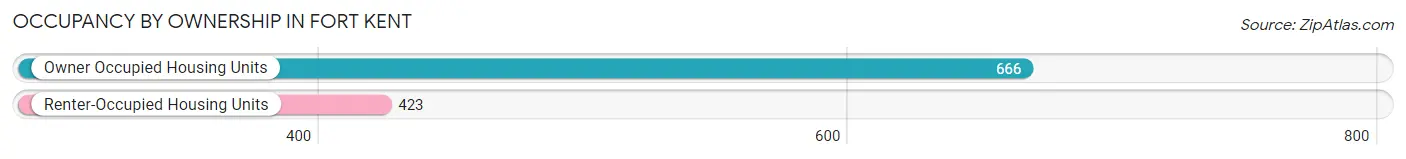
| Occupancy | # Housing Units | % Housing Units |
| Owner Occupied Housing Units | 666 | 61.2% |
| Renter-Occupied Housing Units | 423 | 38.8% |
| Total Occupied Housing Units | 1,089 | 100.0% |
Occupancy by Household Size in Fort Kent
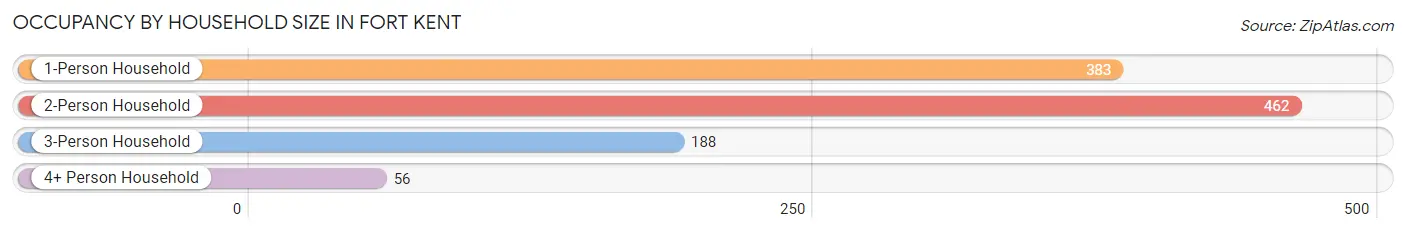
| Household Size | # Housing Units | % Housing Units |
| 1-Person Household | 383 | 35.2% |
| 2-Person Household | 462 | 42.4% |
| 3-Person Household | 188 | 17.3% |
| 4+ Person Household | 56 | 5.1% |
| Total Housing Units | 1,089 | 100.0% |
Occupancy by Ownership by Household Size in Fort Kent
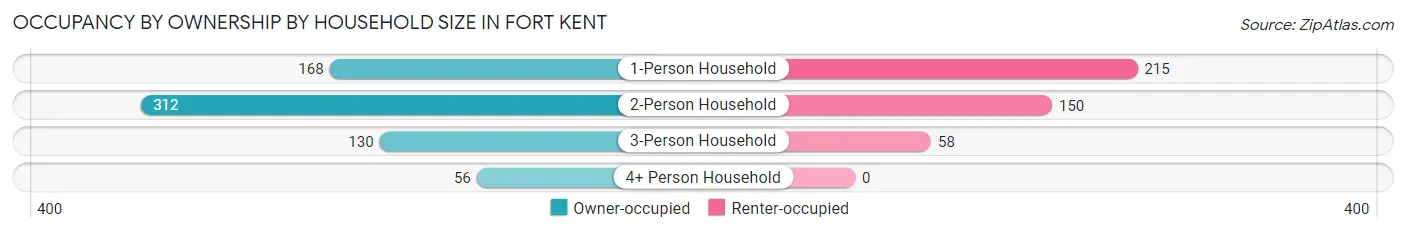
| Household Size | Owner-occupied | Renter-occupied |
| 1-Person Household | 168 (43.9%) | 215 (56.1%) |
| 2-Person Household | 312 (67.5%) | 150 (32.5%) |
| 3-Person Household | 130 (69.2%) | 58 (30.8%) |
| 4+ Person Household | 56 (100.0%) | 0 (0.0%) |
| Total Housing Units | 666 (61.2%) | 423 (38.8%) |
Occupancy by Educational Attainment in Fort Kent
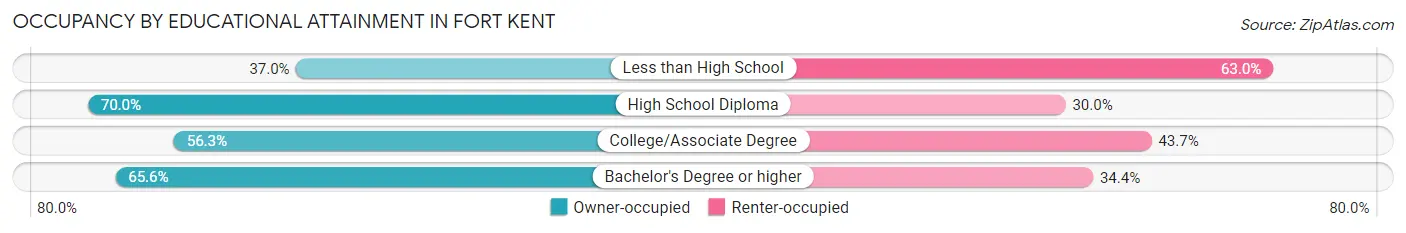
| Household Size | Owner-occupied | Renter-occupied |
| Less than High School | 40 (37.0%) | 68 (63.0%) |
| High School Diploma | 212 (70.0%) | 91 (30.0%) |
| College/Associate Degree | 187 (56.3%) | 145 (43.7%) |
| Bachelor's Degree or higher | 227 (65.6%) | 119 (34.4%) |
Occupancy by Age of Householder in Fort Kent
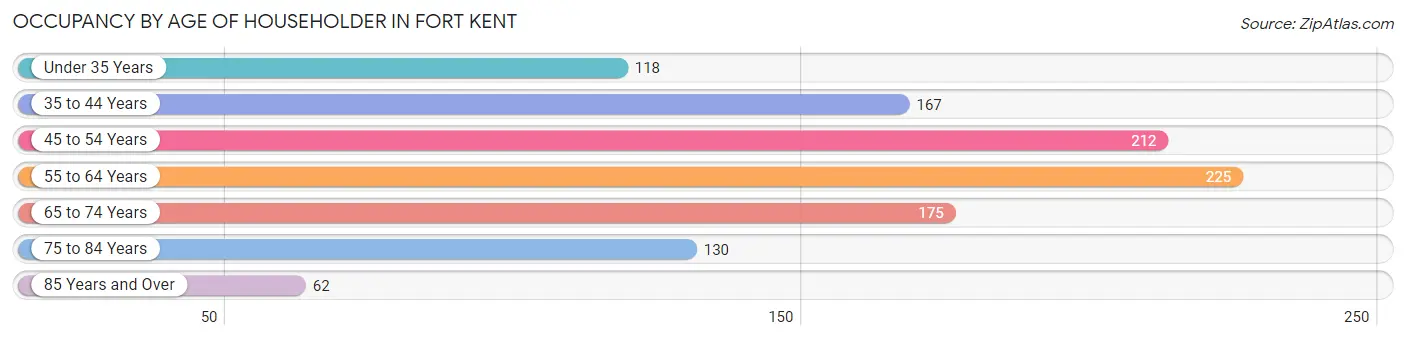
| Age Bracket | # Households | % Households |
| Under 35 Years | 118 | 10.8% |
| 35 to 44 Years | 167 | 15.3% |
| 45 to 54 Years | 212 | 19.5% |
| 55 to 64 Years | 225 | 20.7% |
| 65 to 74 Years | 175 | 16.1% |
| 75 to 84 Years | 130 | 11.9% |
| 85 Years and Over | 62 | 5.7% |
| Total | 1,089 | 100.0% |
Housing Finances in Fort Kent
Median Income by Occupancy in Fort Kent
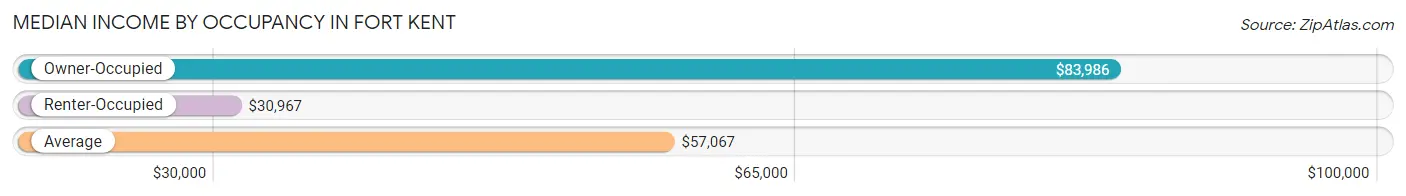
| Occupancy Type | # Households | Median Income |
| Owner-Occupied | 666 (61.2%) | $83,986 |
| Renter-Occupied | 423 (38.8%) | $30,967 |
| Average | 1,089 (100.0%) | $57,067 |
Occupancy by Householder Income Bracket in Fort Kent
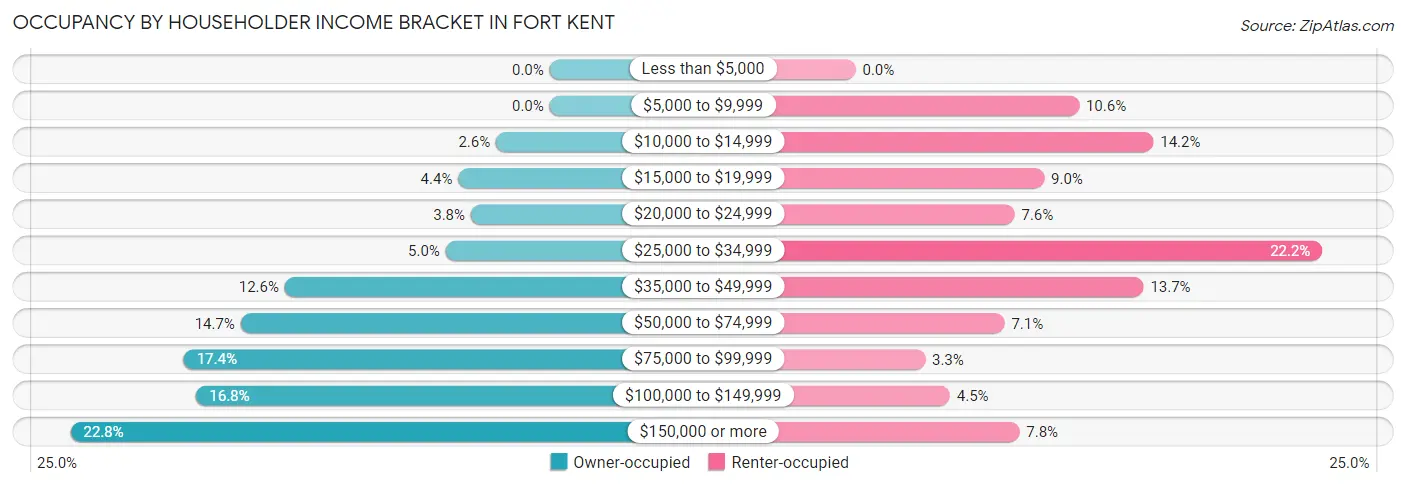
| Income Bracket | Owner-occupied | Renter-occupied |
| Less than $5,000 | 0 (0.0%) | 0 (0.0%) |
| $5,000 to $9,999 | 0 (0.0%) | 45 (10.6%) |
| $10,000 to $14,999 | 17 (2.5%) | 60 (14.2%) |
| $15,000 to $19,999 | 29 (4.3%) | 38 (9.0%) |
| $20,000 to $24,999 | 25 (3.7%) | 32 (7.6%) |
| $25,000 to $34,999 | 33 (5.0%) | 94 (22.2%) |
| $35,000 to $49,999 | 84 (12.6%) | 58 (13.7%) |
| $50,000 to $74,999 | 98 (14.7%) | 30 (7.1%) |
| $75,000 to $99,999 | 116 (17.4%) | 14 (3.3%) |
| $100,000 to $149,999 | 112 (16.8%) | 19 (4.5%) |
| $150,000 or more | 152 (22.8%) | 33 (7.8%) |
| Total | 666 (100.0%) | 423 (100.0%) |
Monthly Housing Cost Tiers in Fort Kent
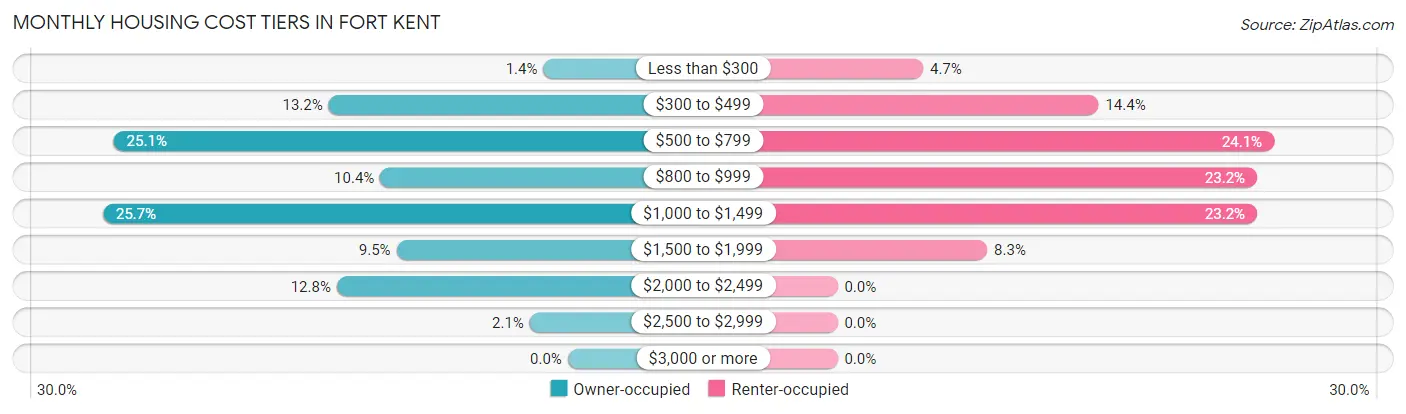
| Monthly Cost | Owner-occupied | Renter-occupied |
| Less than $300 | 9 (1.3%) | 20 (4.7%) |
| $300 to $499 | 88 (13.2%) | 61 (14.4%) |
| $500 to $799 | 167 (25.1%) | 102 (24.1%) |
| $800 to $999 | 69 (10.4%) | 98 (23.2%) |
| $1,000 to $1,499 | 171 (25.7%) | 98 (23.2%) |
| $1,500 to $1,999 | 63 (9.5%) | 35 (8.3%) |
| $2,000 to $2,499 | 85 (12.8%) | 0 (0.0%) |
| $2,500 to $2,999 | 14 (2.1%) | 0 (0.0%) |
| $3,000 or more | 0 (0.0%) | 0 (0.0%) |
| Total | 666 (100.0%) | 423 (100.0%) |
Physical Housing Characteristics in Fort Kent
Housing Structures in Fort Kent
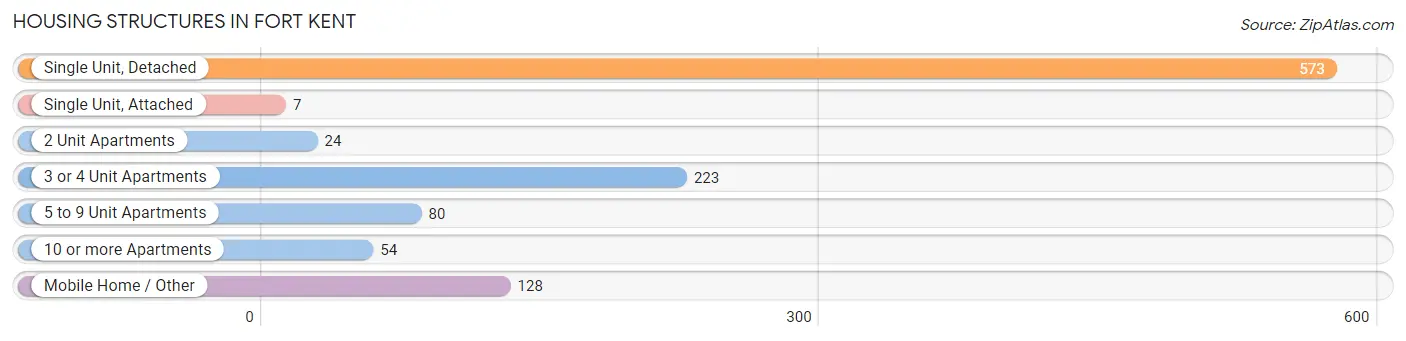
| Structure Type | # Housing Units | % Housing Units |
| Single Unit, Detached | 573 | 52.6% |
| Single Unit, Attached | 7 | 0.6% |
| 2 Unit Apartments | 24 | 2.2% |
| 3 or 4 Unit Apartments | 223 | 20.5% |
| 5 to 9 Unit Apartments | 80 | 7.3% |
| 10 or more Apartments | 54 | 5.0% |
| Mobile Home / Other | 128 | 11.7% |
| Total | 1,089 | 100.0% |
Housing Structures by Occupancy in Fort Kent
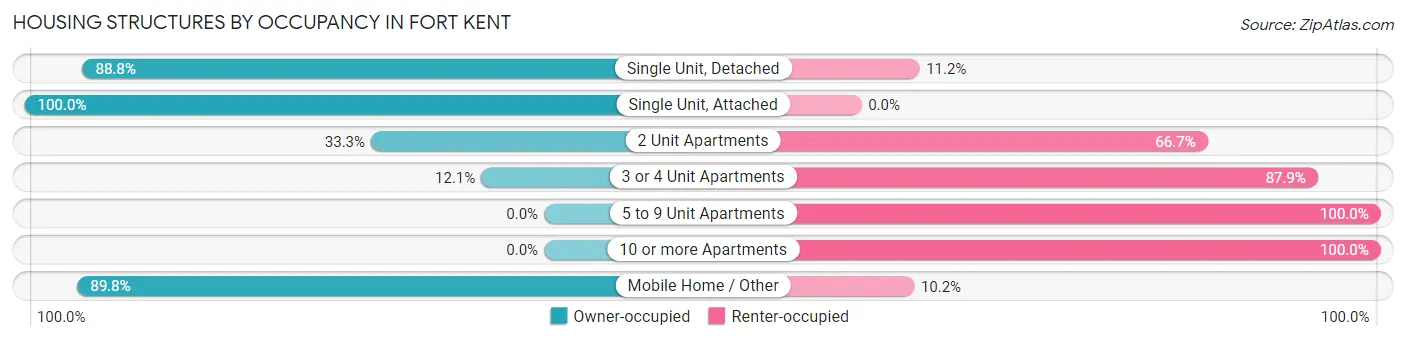
| Structure Type | Owner-occupied | Renter-occupied |
| Single Unit, Detached | 509 (88.8%) | 64 (11.2%) |
| Single Unit, Attached | 7 (100.0%) | 0 (0.0%) |
| 2 Unit Apartments | 8 (33.3%) | 16 (66.7%) |
| 3 or 4 Unit Apartments | 27 (12.1%) | 196 (87.9%) |
| 5 to 9 Unit Apartments | 0 (0.0%) | 80 (100.0%) |
| 10 or more Apartments | 0 (0.0%) | 54 (100.0%) |
| Mobile Home / Other | 115 (89.8%) | 13 (10.2%) |
| Total | 666 (61.2%) | 423 (38.8%) |
Housing Structures by Number of Rooms in Fort Kent
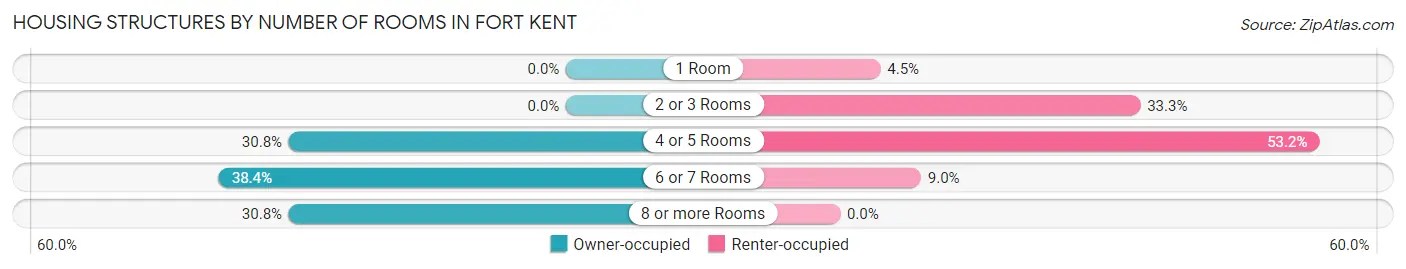
| Number of Rooms | Owner-occupied | Renter-occupied |
| 1 Room | 0 (0.0%) | 19 (4.5%) |
| 2 or 3 Rooms | 0 (0.0%) | 141 (33.3%) |
| 4 or 5 Rooms | 205 (30.8%) | 225 (53.2%) |
| 6 or 7 Rooms | 256 (38.4%) | 38 (9.0%) |
| 8 or more Rooms | 205 (30.8%) | 0 (0.0%) |
| Total | 666 (100.0%) | 423 (100.0%) |
Housing Structure by Heating Type in Fort Kent
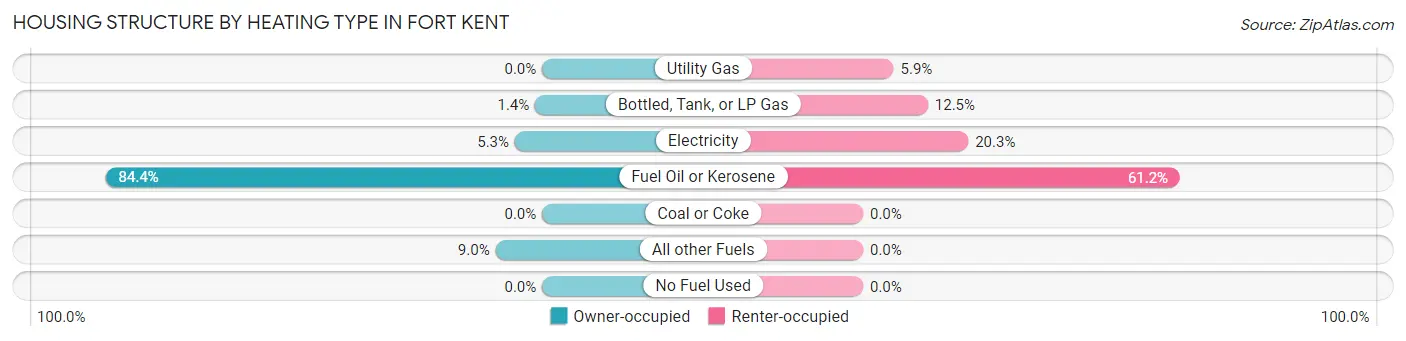
| Heating Type | Owner-occupied | Renter-occupied |
| Utility Gas | 0 (0.0%) | 25 (5.9%) |
| Bottled, Tank, or LP Gas | 9 (1.3%) | 53 (12.5%) |
| Electricity | 35 (5.3%) | 86 (20.3%) |
| Fuel Oil or Kerosene | 562 (84.4%) | 259 (61.2%) |
| Coal or Coke | 0 (0.0%) | 0 (0.0%) |
| All other Fuels | 60 (9.0%) | 0 (0.0%) |
| No Fuel Used | 0 (0.0%) | 0 (0.0%) |
| Total | 666 (100.0%) | 423 (100.0%) |
Household Vehicle Usage in Fort Kent
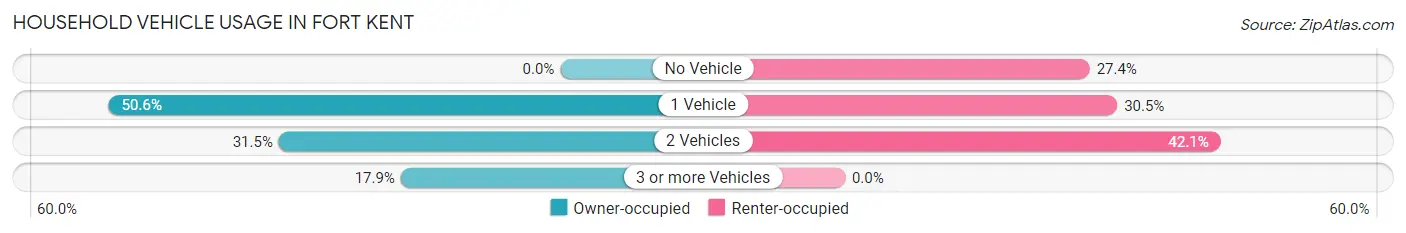
| Vehicles per Household | Owner-occupied | Renter-occupied |
| No Vehicle | 0 (0.0%) | 116 (27.4%) |
| 1 Vehicle | 337 (50.6%) | 129 (30.5%) |
| 2 Vehicles | 210 (31.5%) | 178 (42.1%) |
| 3 or more Vehicles | 119 (17.9%) | 0 (0.0%) |
| Total | 666 (100.0%) | 423 (100.0%) |
Real Estate & Mortgages in Fort Kent
Real Estate and Mortgage Overview in Fort Kent
| Characteristic | Without Mortgage | With Mortgage |
| Housing Units | 223 | 443 |
| Median Property Value | $90,600 | $136,300 |
| Median Household Income | $71,528 | $82 |
| Monthly Housing Costs | $547 | $0 |
| Real Estate Taxes | $1,506 | $0 |
Property Value by Mortgage Status in Fort Kent
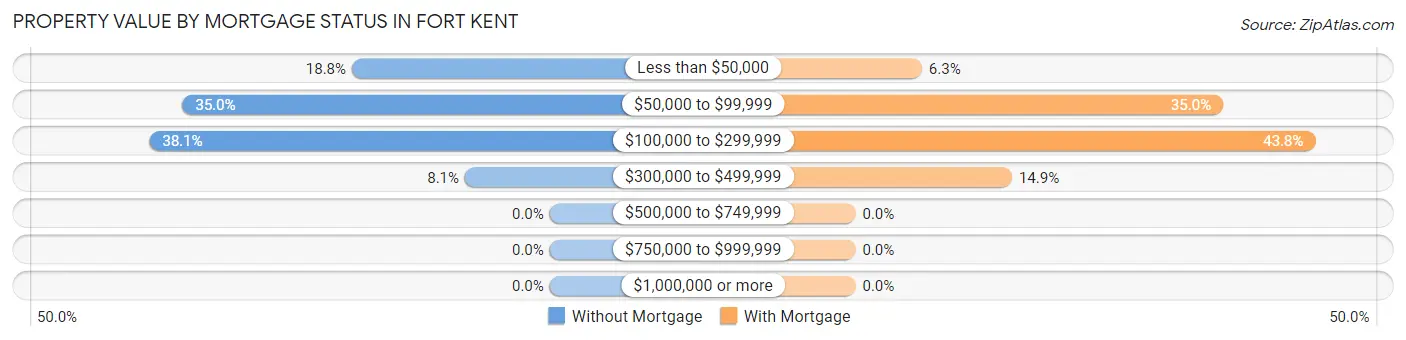
| Property Value | Without Mortgage | With Mortgage |
| Less than $50,000 | 42 (18.8%) | 28 (6.3%) |
| $50,000 to $99,999 | 78 (35.0%) | 155 (35.0%) |
| $100,000 to $299,999 | 85 (38.1%) | 194 (43.8%) |
| $300,000 to $499,999 | 18 (8.1%) | 66 (14.9%) |
| $500,000 to $749,999 | 0 (0.0%) | 0 (0.0%) |
| $750,000 to $999,999 | 0 (0.0%) | 0 (0.0%) |
| $1,000,000 or more | 0 (0.0%) | 0 (0.0%) |
| Total | 223 (100.0%) | 443 (100.0%) |
Household Income by Mortgage Status in Fort Kent
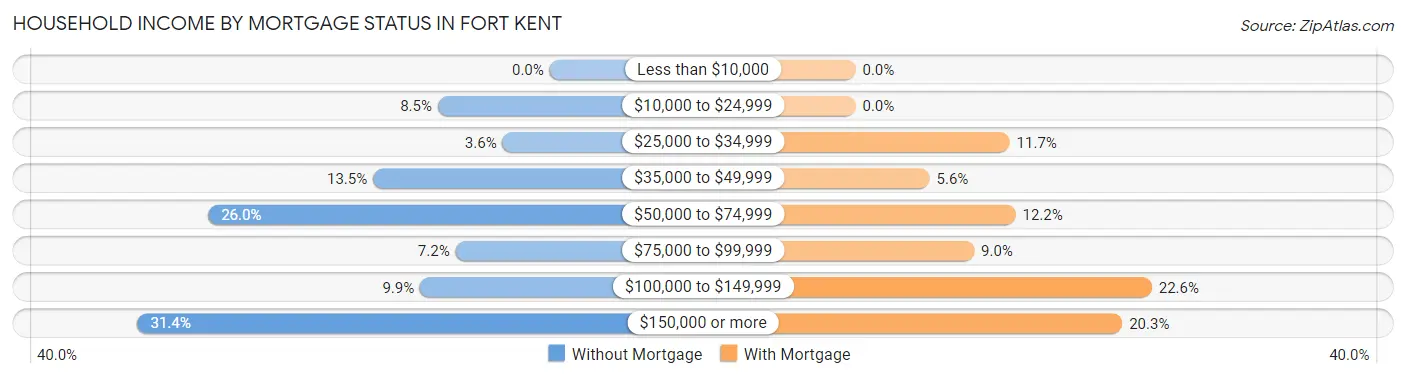
| Household Income | Without Mortgage | With Mortgage |
| Less than $10,000 | 0 (0.0%) | 0 (0.0%) |
| $10,000 to $24,999 | 19 (8.5%) | 0 (0.0%) |
| $25,000 to $34,999 | 8 (3.6%) | 52 (11.7%) |
| $35,000 to $49,999 | 30 (13.5%) | 25 (5.6%) |
| $50,000 to $74,999 | 58 (26.0%) | 54 (12.2%) |
| $75,000 to $99,999 | 16 (7.2%) | 40 (9.0%) |
| $100,000 to $149,999 | 22 (9.9%) | 100 (22.6%) |
| $150,000 or more | 70 (31.4%) | 90 (20.3%) |
| Total | 223 (100.0%) | 443 (100.0%) |
Property Value to Household Income Ratio in Fort Kent
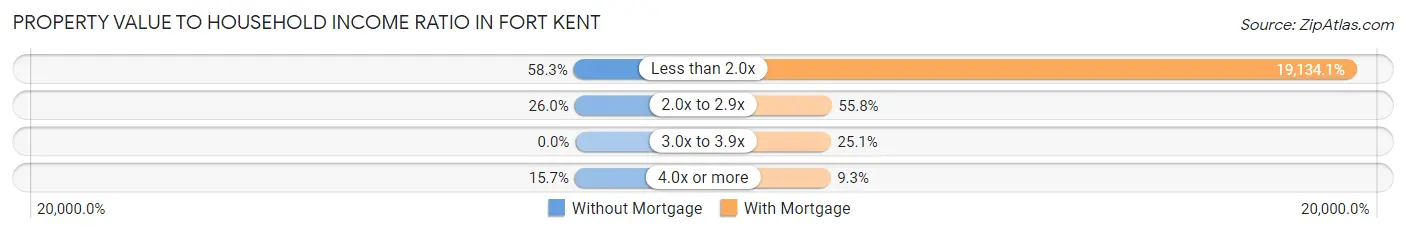
| Value-to-Income Ratio | Without Mortgage | With Mortgage |
| Less than 2.0x | 130 (58.3%) | 84,764 (19,134.1%) |
| 2.0x to 2.9x | 58 (26.0%) | 247 (55.8%) |
| 3.0x to 3.9x | 0 (0.0%) | 111 (25.1%) |
| 4.0x or more | 35 (15.7%) | 41 (9.3%) |
| Total | 223 (100.0%) | 443 (100.0%) |
Real Estate Taxes by Mortgage Status in Fort Kent
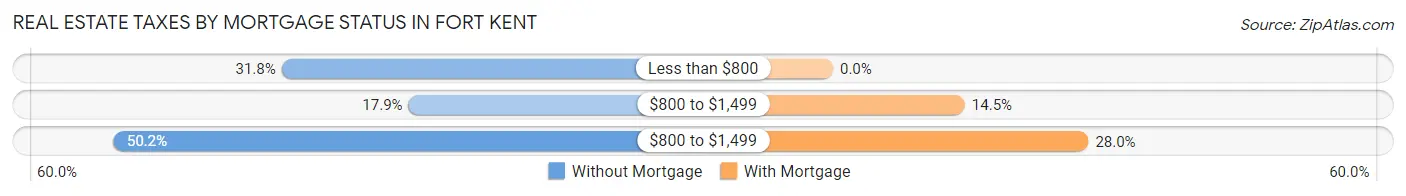
| Property Taxes | Without Mortgage | With Mortgage |
| Less than $800 | 71 (31.8%) | 0 (0.0%) |
| $800 to $1,499 | 40 (17.9%) | 64 (14.4%) |
| $800 to $1,499 | 112 (50.2%) | 124 (28.0%) |
| Total | 223 (100.0%) | 443 (100.0%) |
Health & Disability in Fort Kent
Health Insurance Coverage by Age in Fort Kent
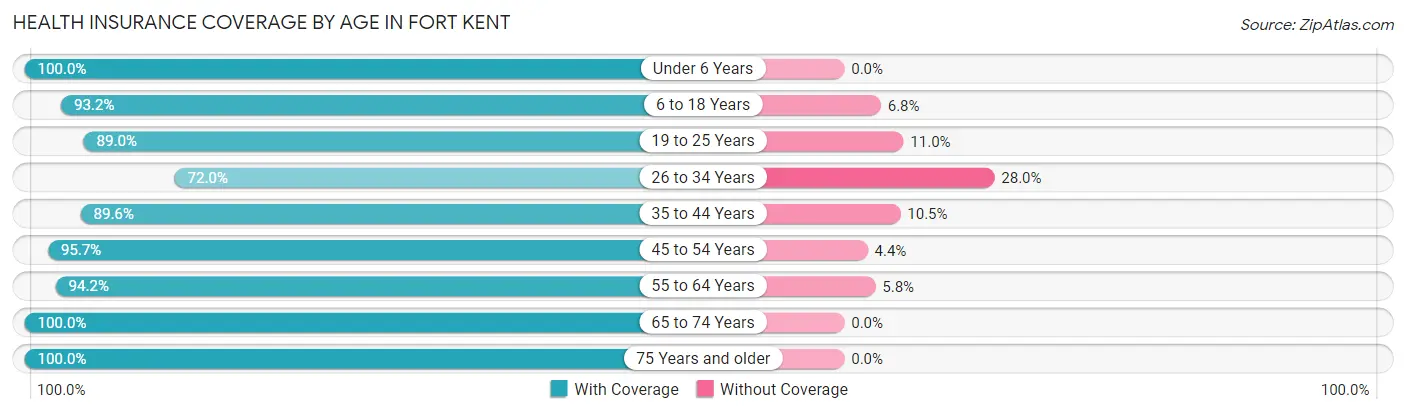
| Age Bracket | With Coverage | Without Coverage |
| Under 6 Years | 99 (100.0%) | 0 (0.0%) |
| 6 to 18 Years | 356 (93.2%) | 26 (6.8%) |
| 19 to 25 Years | 218 (89.0%) | 27 (11.0%) |
| 26 to 34 Years | 121 (72.0%) | 47 (28.0%) |
| 35 to 44 Years | 240 (89.5%) | 28 (10.4%) |
| 45 to 54 Years | 308 (95.7%) | 14 (4.3%) |
| 55 to 64 Years | 342 (94.2%) | 21 (5.8%) |
| 65 to 74 Years | 246 (100.0%) | 0 (0.0%) |
| 75 Years and older | 291 (100.0%) | 0 (0.0%) |
| Total | 2,221 (93.2%) | 163 (6.8%) |
Health Insurance Coverage by Citizenship Status in Fort Kent
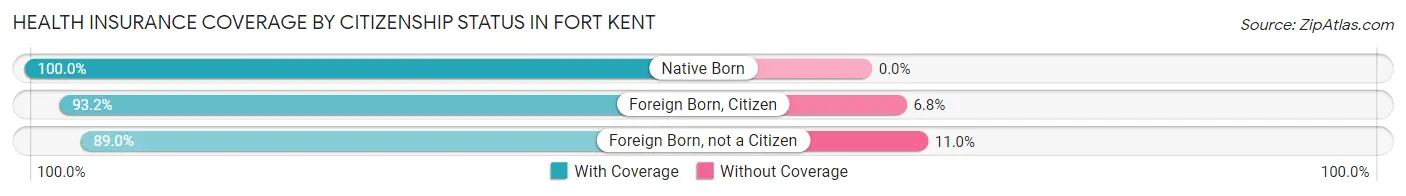
| Citizenship Status | With Coverage | Without Coverage |
| Native Born | 99 (100.0%) | 0 (0.0%) |
| Foreign Born, Citizen | 356 (93.2%) | 26 (6.8%) |
| Foreign Born, not a Citizen | 218 (89.0%) | 27 (11.0%) |
Health Insurance Coverage by Household Income in Fort Kent
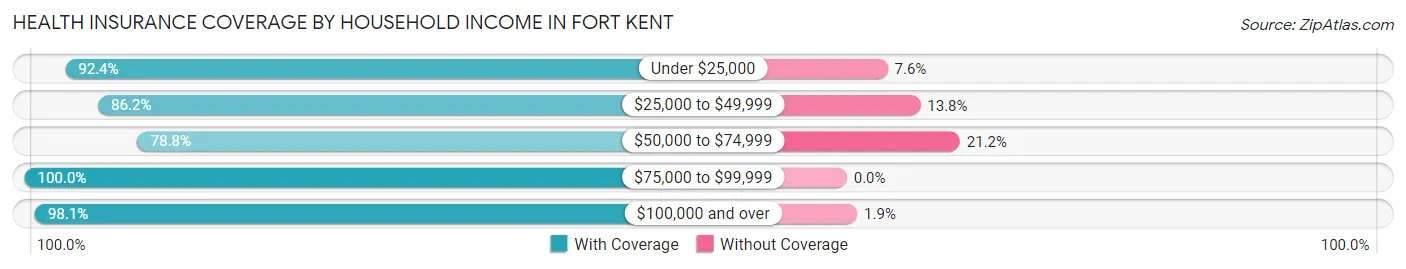
| Household Income | With Coverage | Without Coverage |
| Under $25,000 | 266 (92.4%) | 22 (7.6%) |
| $25,000 to $49,999 | 438 (86.2%) | 70 (13.8%) |
| $50,000 to $74,999 | 201 (78.8%) | 54 (21.2%) |
| $75,000 to $99,999 | 281 (100.0%) | 0 (0.0%) |
| $100,000 and over | 860 (98.1%) | 17 (1.9%) |
Public vs Private Health Insurance Coverage by Age in Fort Kent
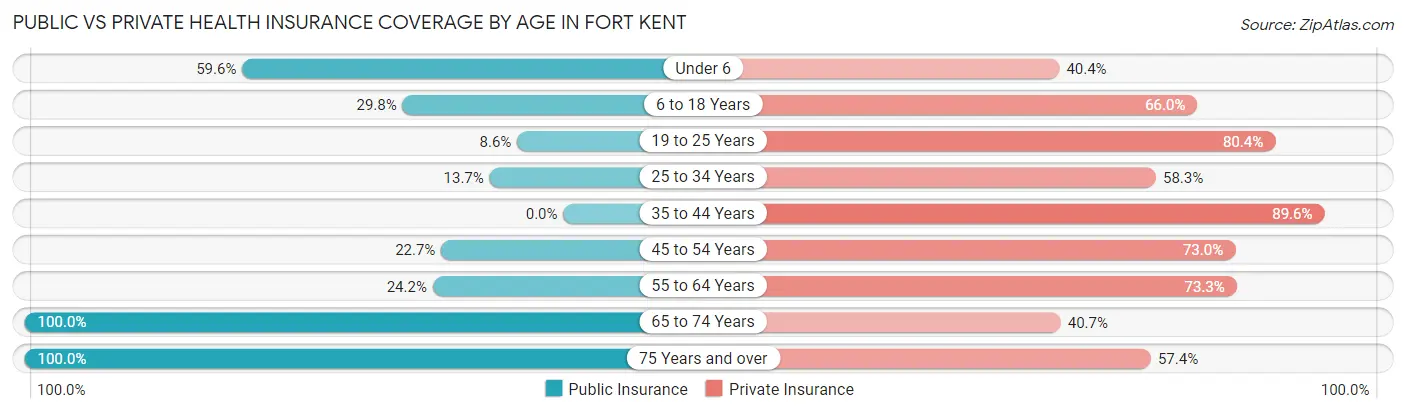
| Age Bracket | Public Insurance | Private Insurance |
| Under 6 | 59 (59.6%) | 40 (40.4%) |
| 6 to 18 Years | 114 (29.8%) | 252 (66.0%) |
| 19 to 25 Years | 21 (8.6%) | 197 (80.4%) |
| 25 to 34 Years | 23 (13.7%) | 98 (58.3%) |
| 35 to 44 Years | 0 (0.0%) | 240 (89.5%) |
| 45 to 54 Years | 73 (22.7%) | 235 (73.0%) |
| 55 to 64 Years | 88 (24.2%) | 266 (73.3%) |
| 65 to 74 Years | 246 (100.0%) | 100 (40.6%) |
| 75 Years and over | 291 (100.0%) | 167 (57.4%) |
| Total | 915 (38.4%) | 1,595 (66.9%) |
Disability Status by Sex by Age in Fort Kent
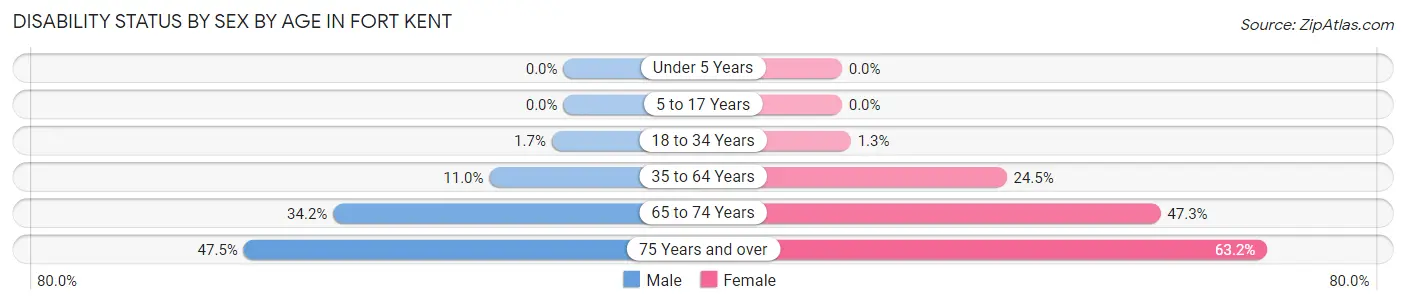
| Age Bracket | Male | Female |
| Under 5 Years | 0 (0.0%) | 0 (0.0%) |
| 5 to 17 Years | 0 (0.0%) | 0 (0.0%) |
| 18 to 34 Years | 4 (1.7%) | 3 (1.3%) |
| 35 to 64 Years | 49 (11.0%) | 124 (24.5%) |
| 65 to 74 Years | 27 (34.2%) | 79 (47.3%) |
| 75 Years and over | 75 (47.5%) | 84 (63.2%) |
Disability Class by Sex by Age in Fort Kent
Disability Class: Hearing Difficulty
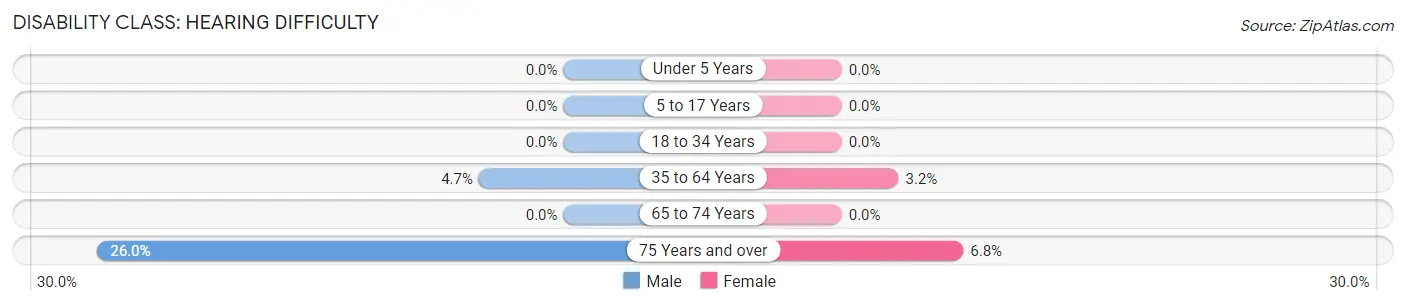
| Age Bracket | Male | Female |
| Under 5 Years | 0 (0.0%) | 0 (0.0%) |
| 5 to 17 Years | 0 (0.0%) | 0 (0.0%) |
| 18 to 34 Years | 0 (0.0%) | 0 (0.0%) |
| 35 to 64 Years | 21 (4.7%) | 16 (3.2%) |
| 65 to 74 Years | 0 (0.0%) | 0 (0.0%) |
| 75 Years and over | 41 (26.0%) | 9 (6.8%) |
Disability Class: Vision Difficulty
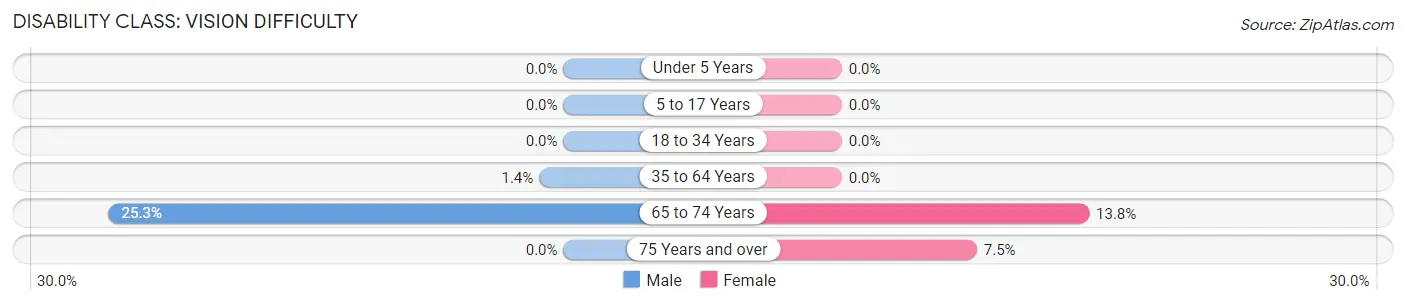
| Age Bracket | Male | Female |
| Under 5 Years | 0 (0.0%) | 0 (0.0%) |
| 5 to 17 Years | 0 (0.0%) | 0 (0.0%) |
| 18 to 34 Years | 0 (0.0%) | 0 (0.0%) |
| 35 to 64 Years | 6 (1.3%) | 0 (0.0%) |
| 65 to 74 Years | 20 (25.3%) | 23 (13.8%) |
| 75 Years and over | 0 (0.0%) | 10 (7.5%) |
Disability Class: Cognitive Difficulty
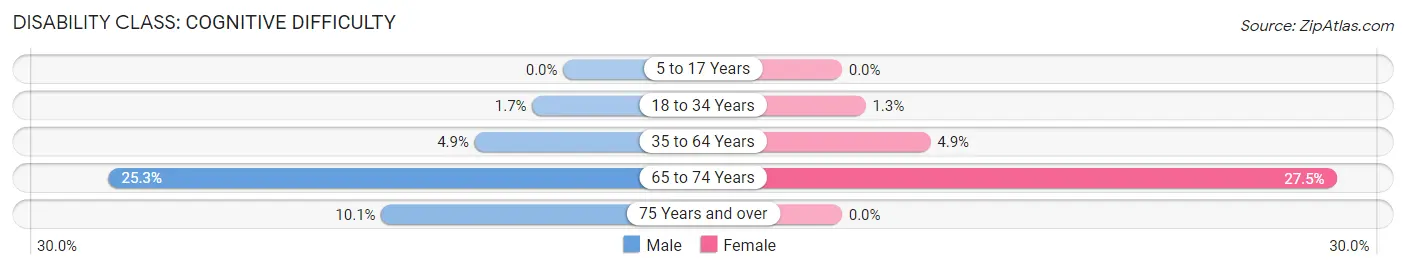
| Age Bracket | Male | Female |
| 5 to 17 Years | 0 (0.0%) | 0 (0.0%) |
| 18 to 34 Years | 4 (1.7%) | 3 (1.3%) |
| 35 to 64 Years | 22 (4.9%) | 25 (4.9%) |
| 65 to 74 Years | 20 (25.3%) | 46 (27.5%) |
| 75 Years and over | 16 (10.1%) | 0 (0.0%) |
Disability Class: Ambulatory Difficulty
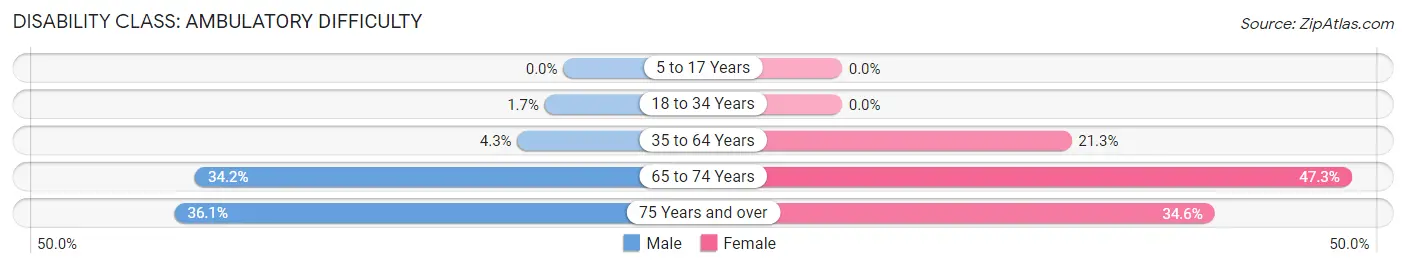
| Age Bracket | Male | Female |
| 5 to 17 Years | 0 (0.0%) | 0 (0.0%) |
| 18 to 34 Years | 4 (1.7%) | 0 (0.0%) |
| 35 to 64 Years | 19 (4.3%) | 108 (21.3%) |
| 65 to 74 Years | 27 (34.2%) | 79 (47.3%) |
| 75 Years and over | 57 (36.1%) | 46 (34.6%) |
Disability Class: Self-Care Difficulty
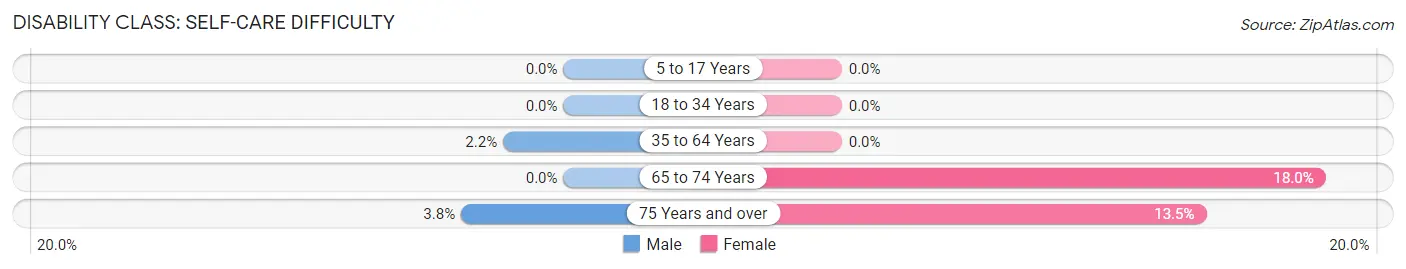
| Age Bracket | Male | Female |
| 5 to 17 Years | 0 (0.0%) | 0 (0.0%) |
| 18 to 34 Years | 0 (0.0%) | 0 (0.0%) |
| 35 to 64 Years | 10 (2.2%) | 0 (0.0%) |
| 65 to 74 Years | 0 (0.0%) | 30 (18.0%) |
| 75 Years and over | 6 (3.8%) | 18 (13.5%) |
Technology Access in Fort Kent
Computing Device Access in Fort Kent
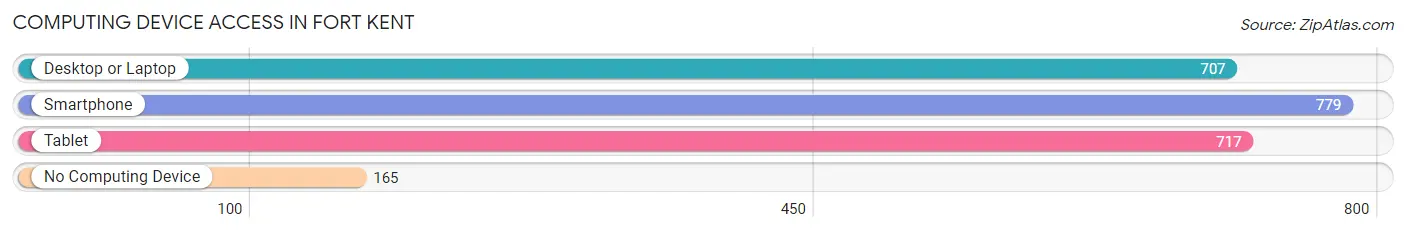
| Device Type | # Households | % Households |
| Desktop or Laptop | 707 | 64.9% |
| Smartphone | 779 | 71.5% |
| Tablet | 717 | 65.8% |
| No Computing Device | 165 | 15.1% |
| Total | 1,089 | 100.0% |
Internet Access in Fort Kent
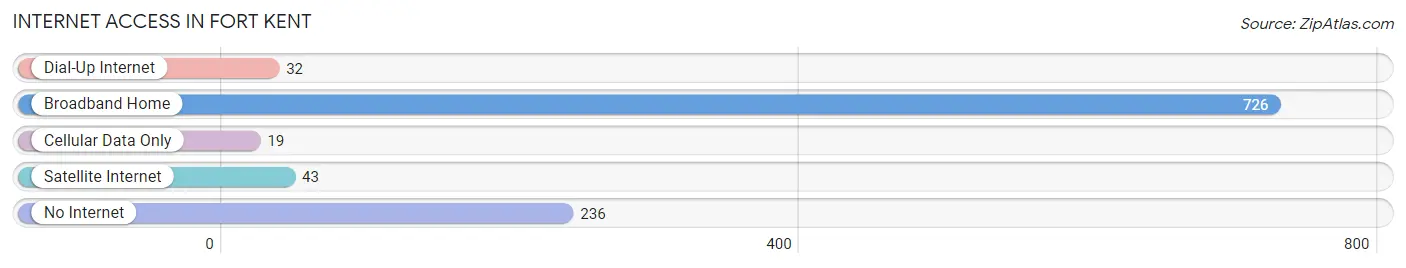
| Internet Type | # Households | % Households |
| Dial-Up Internet | 32 | 2.9% |
| Broadband Home | 726 | 66.7% |
| Cellular Data Only | 19 | 1.7% |
| Satellite Internet | 43 | 4.0% |
| No Internet | 236 | 21.7% |
| Total | 1,089 | 100.0% |
Fort Kent Summary
Fort Kent is a town located in Aroostook County, Maine, United States. It is the northernmost town in the state and is situated on the Canada–US border. The population was 4,097 at the 2010 census.
History
The area that is now Fort Kent was first settled in 1829 by a group of French-Canadian immigrants. The town was originally known as Tote Road, named after the road that ran through the area. In 1839, the town was renamed Fort Kent after the fort that had been built there in 1839. The fort was built to protect the area from British forces during the Aroostook War.
The town was incorporated in 1859 and has since grown to become the largest town in Aroostook County. The town is home to the University of Maine at Fort Kent, which was founded in 1878.
Geography
Fort Kent is located at the northernmost point of Maine, at the confluence of the Fish and St. John rivers. The town is bordered by Canada to the north and the St. John River to the east. The town is located in the St. John Valley, which is a major agricultural region.
The town has a total area of 28.2 square miles, of which 27.9 square miles is land and 0.3 square miles is water.
Economy
The economy of Fort Kent is largely based on agriculture and tourism. The town is home to several large farms, including the St. John Valley Potato Growers, which is the largest potato farm in the state. The town is also home to several small businesses, including restaurants, retail stores, and lodging.
The town is also home to the University of Maine at Fort Kent, which is a major employer in the area. The university provides jobs for faculty, staff, and students.
Demographics
As of the 2010 census, there were 4,097 people, 1,717 households, and 1,093 families residing in the town. The population density was 146.3 people per square mile. There were 1,919 housing units at an average density of 68.7 per square mile.
The racial makeup of the town was 95.2% White, 0.7% African American, 0.7% Native American, 0.7% Asian, 0.1% Pacific Islander, 0.7% from other races, and 1.9% from two or more races. Hispanic or Latino of any race were 1.7% of the population.
There were 1,717 households, out of which 28.2% had children under the age of 18 living with them, 48.2% were married couples living together, 10.7% had a female householder with no husband present, and 36.2% were non-families. 30.2% of all households were made up of individuals, and 13.2% had someone living alone who was 65 years of age or older. The average household size was 2.35 and the average family size was 2.90.
In the town, the population was spread out, with 22.7% under the age of 18, 11.2% from 18 to 24, 25.2% from 25 to 44, 24.2% from 45 to 64, and 16.7% who were 65 years of age or older. The median age was 38 years. For every 100 females, there were 92.2 males. For every 100 females age 18 and over, there were 89.2 males.
The median income for a household in the town was $30,938, and the median income for a family was $37,917. Males had a median income of $30,000 versus $20,938 for females. The per capita income for the town was $16,845. About 11.2% of families and 14.7% of the population were below the poverty line, including 19.2% of those under age 18 and 11.2% of those age 65 or over.
Common Questions
What is Per Capita Income in Fort Kent?
Per Capita income in Fort Kent is $48,524.
What is the Median Family Income in Fort Kent?
Median Family Income in Fort Kent is $72,232.
What is the Median Household income in Fort Kent?
Median Household Income in Fort Kent is $57,067.
What is Income or Wage Gap in Fort Kent?
Income or Wage Gap in Fort Kent is 47.5%.
Women in Fort Kent earn 52.5 cents for every dollar earned by a man.
What is Inequality or Gini Index in Fort Kent?
Inequality or Gini Index in Fort Kent is 0.58.
What is the Total Population of Fort Kent?
Total Population of Fort Kent is 2,515.
What is the Total Male Population of Fort Kent?
Total Male Population of Fort Kent is 1,053.
What is the Total Female Population of Fort Kent?
Total Female Population of Fort Kent is 1,462.
What is the Ratio of Males per 100 Females in Fort Kent?
There are 72.02 Males per 100 Females in Fort Kent.
What is the Ratio of Females per 100 Males in Fort Kent?
There are 138.84 Females per 100 Males in Fort Kent.
What is the Median Population Age in Fort Kent?
Median Population Age in Fort Kent is 48.4 Years.
What is the Average Family Size in Fort Kent
Average Family Size in Fort Kent is 2.5 People.
What is the Average Household Size in Fort Kent
Average Household Size in Fort Kent is 2.0 People.
How Large is the Labor Force in Fort Kent?
There are 1,109 People in the Labor Forcein in Fort Kent.
What is the Percentage of People in the Labor Force in Fort Kent?
51.9% of People are in the Labor Force in Fort Kent.
What is the Unemployment Rate in Fort Kent?
Unemployment Rate in Fort Kent is 2.8%.