Winterport, ME Map & Demographics
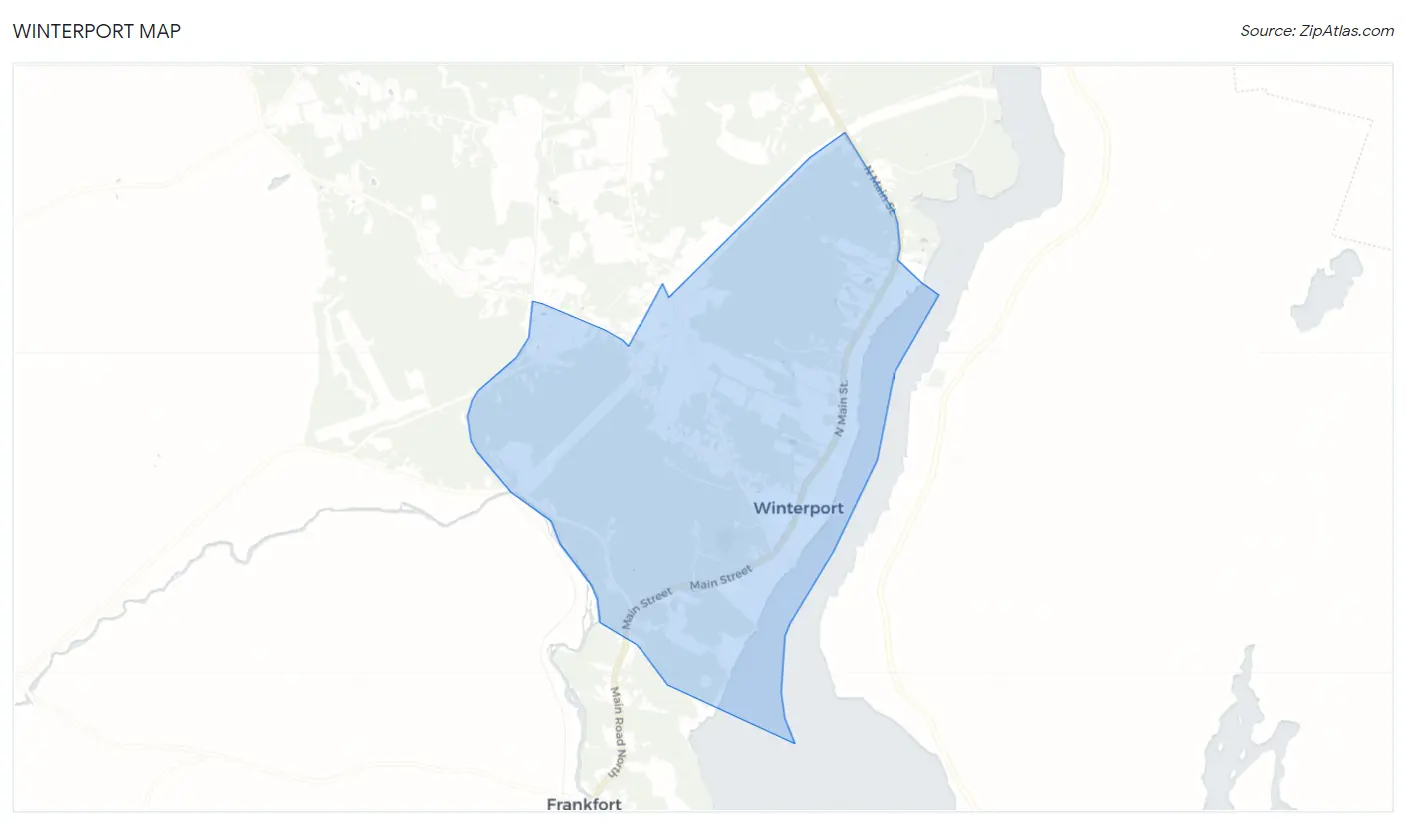
Winterport Map
Winterport Overview
$32,540
PER CAPITA INCOME
$124,450
AVG FAMILY INCOME
$44,205
AVG HOUSEHOLD INCOME
13.4%
WAGE / INCOME GAP [ % ]
86.6¢/ $1
WAGE / INCOME GAP [ $ ]
0.44
INEQUALITY / GINI INDEX
1,100
TOTAL POPULATION
542
MALE POPULATION
558
FEMALE POPULATION
97.13
MALES / 100 FEMALES
102.95
FEMALES / 100 MALES
48.1
MEDIAN AGE
3.1
AVG FAMILY SIZE
2.1
AVG HOUSEHOLD SIZE
500
LABOR FORCE [ PEOPLE ]
54.9%
PERCENT IN LABOR FORCE
Winterport Zip Codes
Winterport Area Codes
Income in Winterport
Income Overview in Winterport
Per Capita Income in Winterport is $32,540, while median incomes of families and households are $124,450 and $44,205 respectively.
| Characteristic | Number | Measure |
| Per Capita Income | 1,100 | $32,540 |
| Median Family Income | 271 | $124,450 |
| Mean Family Income | 271 | $109,402 |
| Median Household Income | 507 | $44,205 |
| Mean Household Income | 507 | $70,390 |
| Income Deficit | 271 | $0 |
| Wage / Income Gap (%) | 1,100 | 13.36% |
| Wage / Income Gap ($) | 1,100 | 86.64¢ per $1 |
| Gini / Inequality Index | 1,100 | 0.44 |
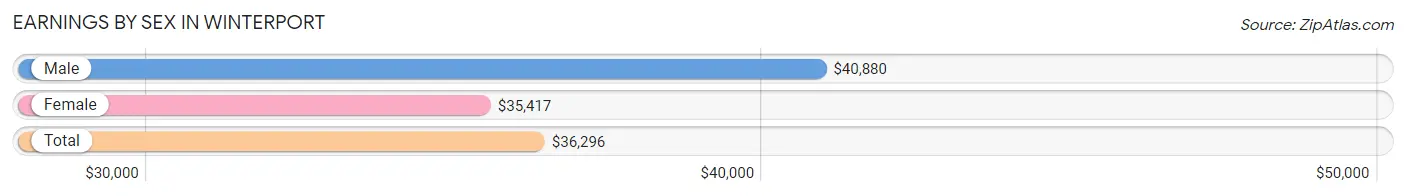
Earnings by Sex in Winterport
Average Earnings in Winterport are $36,296, $40,880 for men and $35,417 for women, a difference of 13.4%.
| Sex | Number | Average Earnings |
| Male | 241 (41.0%) | $40,880 |
| Female | 347 (59.0%) | $35,417 |
| Total | 588 (100.0%) | $36,296 |
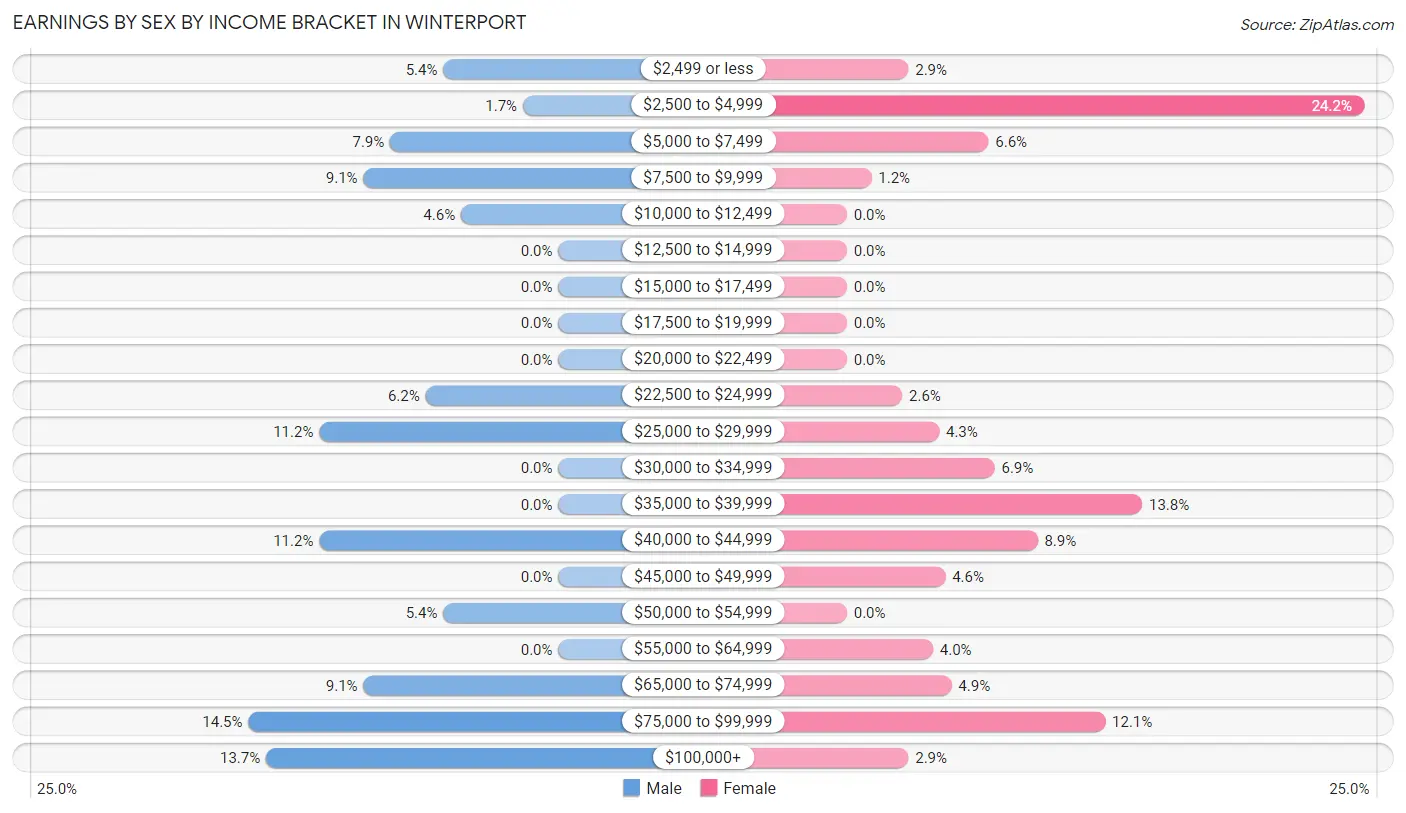
Earnings by Sex by Income Bracket in Winterport
The most common earnings brackets in Winterport are $75,000 to $99,999 for men (35 | 14.5%) and $2,500 to $4,999 for women (84 | 24.2%).
| Income | Male | Female |
| $2,499 or less | 13 (5.4%) | 10 (2.9%) |
| $2,500 to $4,999 | 4 (1.7%) | 84 (24.2%) |
| $5,000 to $7,499 | 19 (7.9%) | 23 (6.6%) |
| $7,500 to $9,999 | 22 (9.1%) | 4 (1.1%) |
| $10,000 to $12,499 | 11 (4.6%) | 0 (0.0%) |
| $12,500 to $14,999 | 0 (0.0%) | 0 (0.0%) |
| $15,000 to $17,499 | 0 (0.0%) | 0 (0.0%) |
| $17,500 to $19,999 | 0 (0.0%) | 0 (0.0%) |
| $20,000 to $22,499 | 0 (0.0%) | 0 (0.0%) |
| $22,500 to $24,999 | 15 (6.2%) | 9 (2.6%) |
| $25,000 to $29,999 | 27 (11.2%) | 15 (4.3%) |
| $30,000 to $34,999 | 0 (0.0%) | 24 (6.9%) |
| $35,000 to $39,999 | 0 (0.0%) | 48 (13.8%) |
| $40,000 to $44,999 | 27 (11.2%) | 31 (8.9%) |
| $45,000 to $49,999 | 0 (0.0%) | 16 (4.6%) |
| $50,000 to $54,999 | 13 (5.4%) | 0 (0.0%) |
| $55,000 to $64,999 | 0 (0.0%) | 14 (4.0%) |
| $65,000 to $74,999 | 22 (9.1%) | 17 (4.9%) |
| $75,000 to $99,999 | 35 (14.5%) | 42 (12.1%) |
| $100,000+ | 33 (13.7%) | 10 (2.9%) |
| Total | 241 (100.0%) | 347 (100.0%) |
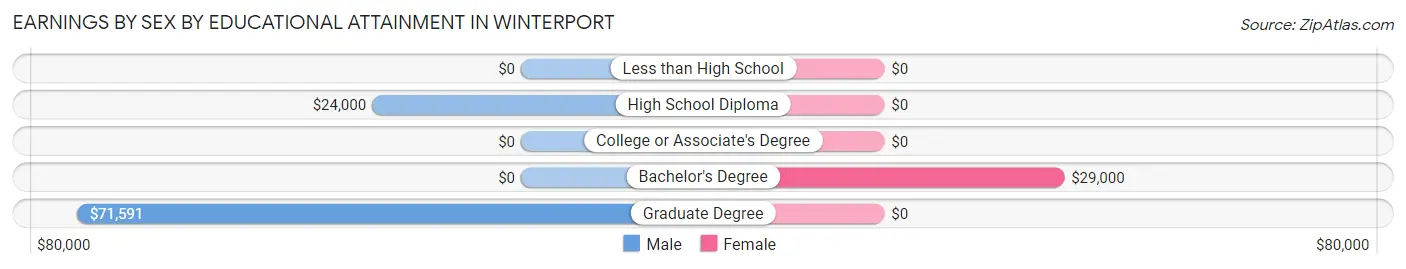
Earnings by Sex by Educational Attainment in Winterport
Average earnings in Winterport are $41,759 for men and $34,821 for women, a difference of 16.6%. Men with an educational attainment of graduate degree enjoy the highest average annual earnings of $71,591, while those with high school diploma education earn the least with $24,000. Women with an educational attainment of bachelor's degree earn the most with the average annual earnings of $29,000, while those with bachelor's degree education have the smallest earnings of $29,000.
| Educational Attainment | Male Income | Female Income |
| Less than High School | - | - |
| High School Diploma | $24,000 | $0 |
| College or Associate's Degree | - | - |
| Bachelor's Degree | - | - |
| Graduate Degree | $71,591 | $0 |
| Total | $41,759 | $34,821 |
Family Income in Winterport
Family Income Brackets in Winterport
According to the Winterport family income data, there are 79 families falling into the $150,000 to $199,999 income range, which is the most common income bracket and makes up 29.1% of all families.
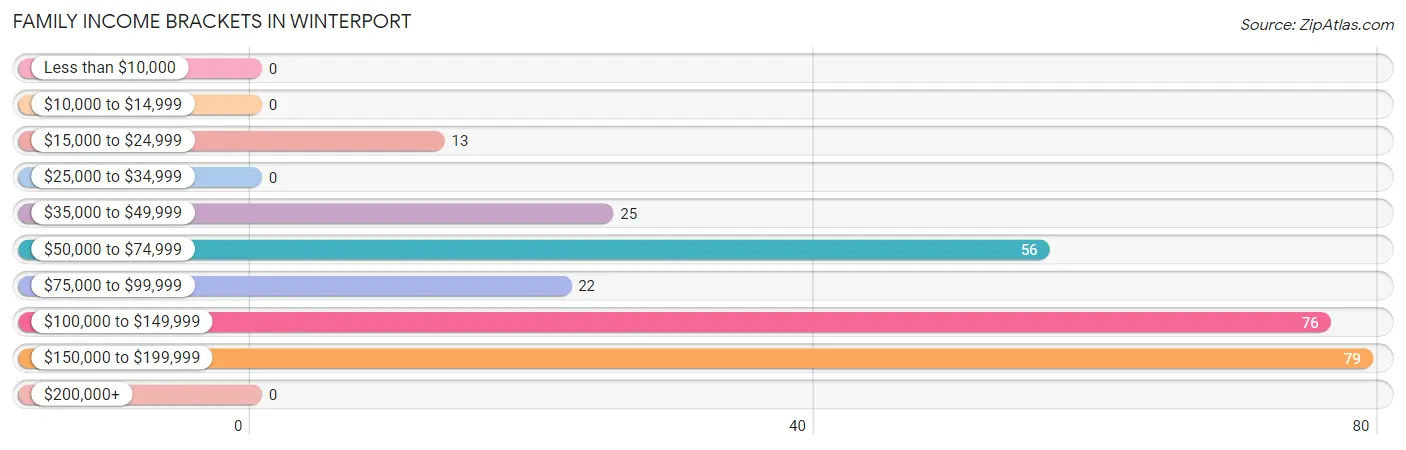
| Income Bracket | # Families | % Families |
| Less than $10,000 | 0 | 0.0% |
| $10,000 to $14,999 | 0 | 0.0% |
| $15,000 to $24,999 | 13 | 4.8% |
| $25,000 to $34,999 | 0 | 0.0% |
| $35,000 to $49,999 | 25 | 9.2% |
| $50,000 to $74,999 | 56 | 20.7% |
| $75,000 to $99,999 | 22 | 8.1% |
| $100,000 to $149,999 | 76 | 28.0% |
| $150,000 to $199,999 | 79 | 29.2% |
| $200,000+ | 0 | 0.0% |
Family Income by Famaliy Size in Winterport
4-person families (59 | 21.8%) account for the highest median family income in Winterport with $150,568 per family, while 3-person families (61 | 22.5%) have the highest median income of $49,196 per family member.
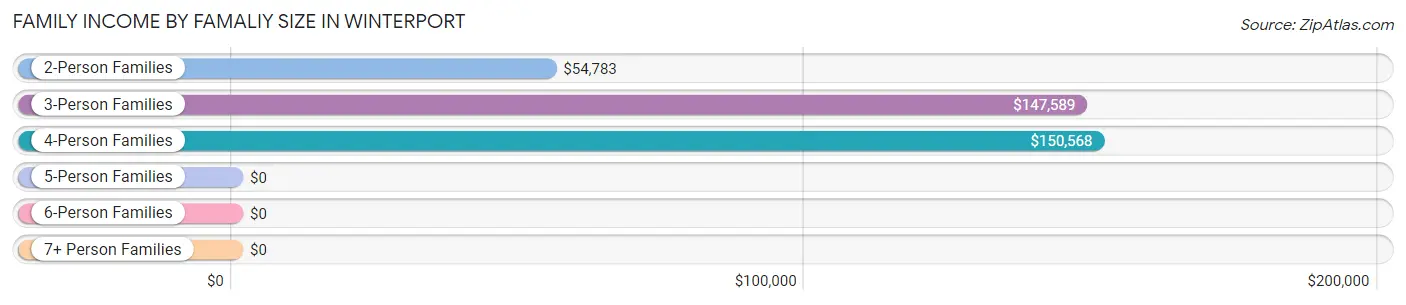
| Income Bracket | # Families | Median Income |
| 2-Person Families | 118 (43.5%) | $54,783 |
| 3-Person Families | 61 (22.5%) | $147,589 |
| 4-Person Families | 59 (21.8%) | $150,568 |
| 5-Person Families | 33 (12.2%) | $0 |
| 6-Person Families | 0 (0.0%) | $0 |
| 7+ Person Families | 0 (0.0%) | $0 |
| Total | 271 (100.0%) | $124,450 |
Family Income by Number of Earners in Winterport
The median family income in Winterport is $124,450, with families comprising 3+ earners (69) having the highest median family income of $155,724, while families with no earners (38) have the lowest median family income of $36,154, accounting for 25.5% and 14.0% of families, respectively.
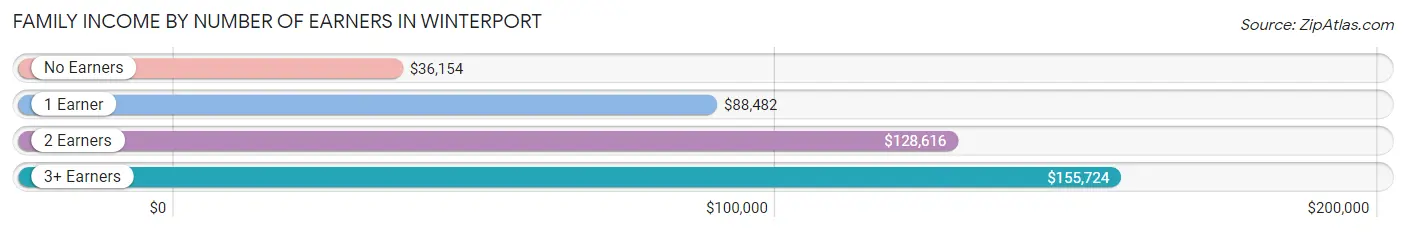
| Number of Earners | # Families | Median Income |
| No Earners | 38 (14.0%) | $36,154 |
| 1 Earner | 93 (34.3%) | $88,482 |
| 2 Earners | 71 (26.2%) | $128,616 |
| 3+ Earners | 69 (25.5%) | $155,724 |
| Total | 271 (100.0%) | $124,450 |
Household Income in Winterport
Household Income Brackets in Winterport
With 85 households falling in the category, the $10,000 to $14,999 income range is the most frequent in Winterport, accounting for 16.8% of all households.
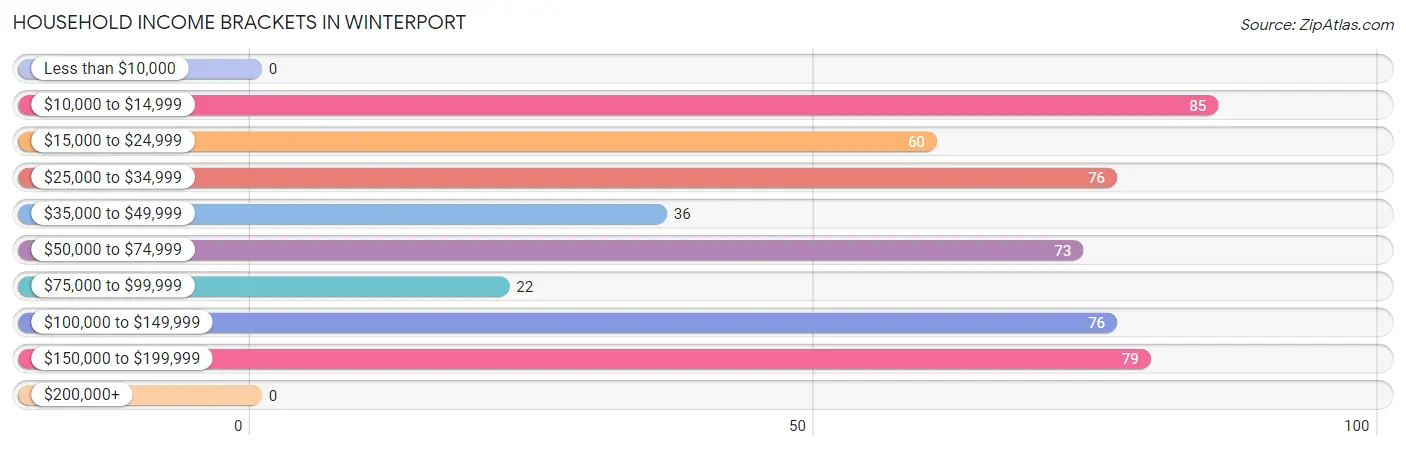
| Income Bracket | # Households | % Households |
| Less than $10,000 | 0 | 0.0% |
| $10,000 to $14,999 | 85 | 16.8% |
| $15,000 to $24,999 | 60 | 11.8% |
| $25,000 to $34,999 | 76 | 15.0% |
| $35,000 to $49,999 | 36 | 7.1% |
| $50,000 to $74,999 | 73 | 14.4% |
| $75,000 to $99,999 | 22 | 4.3% |
| $100,000 to $149,999 | 76 | 15.0% |
| $150,000 to $199,999 | 79 | 15.6% |
| $200,000+ | 0 | 0.0% |
Household Income by Householder Age in Winterport
The median household income in Winterport is $44,205, with the highest median household income of $87,188 found in the 25 to 44 years age bracket for the primary householder. A total of 68 households (13.4%) fall into this category.
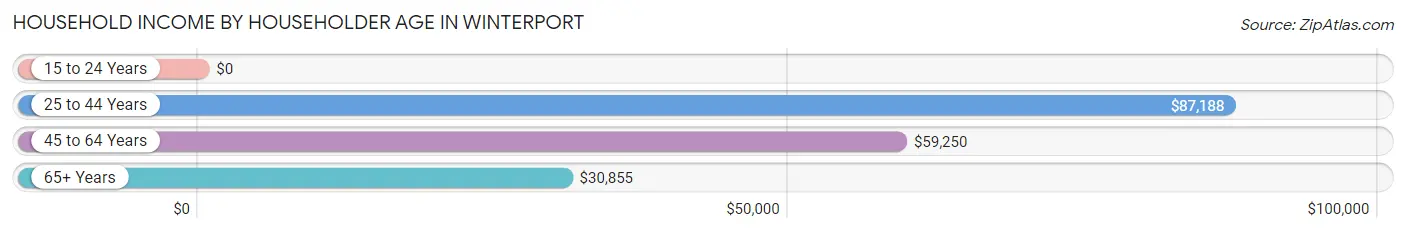
| Income Bracket | # Households | Median Income |
| 15 to 24 Years | 0 (0.0%) | $0 |
| 25 to 44 Years | 68 (13.4%) | $87,188 |
| 45 to 64 Years | 265 (52.3%) | $59,250 |
| 65+ Years | 174 (34.3%) | $30,855 |
| Total | 507 (100.0%) | $44,205 |
Poverty in Winterport
Income Below Poverty by Sex and Age in Winterport
With 11.6% poverty level for males and 12.7% for females among the residents of Winterport, 55 to 64 year old males and 45 to 54 year old females are the most vulnerable to poverty, with 39 males (36.8%) and 45 females (42.1%) in their respective age groups living below the poverty level.
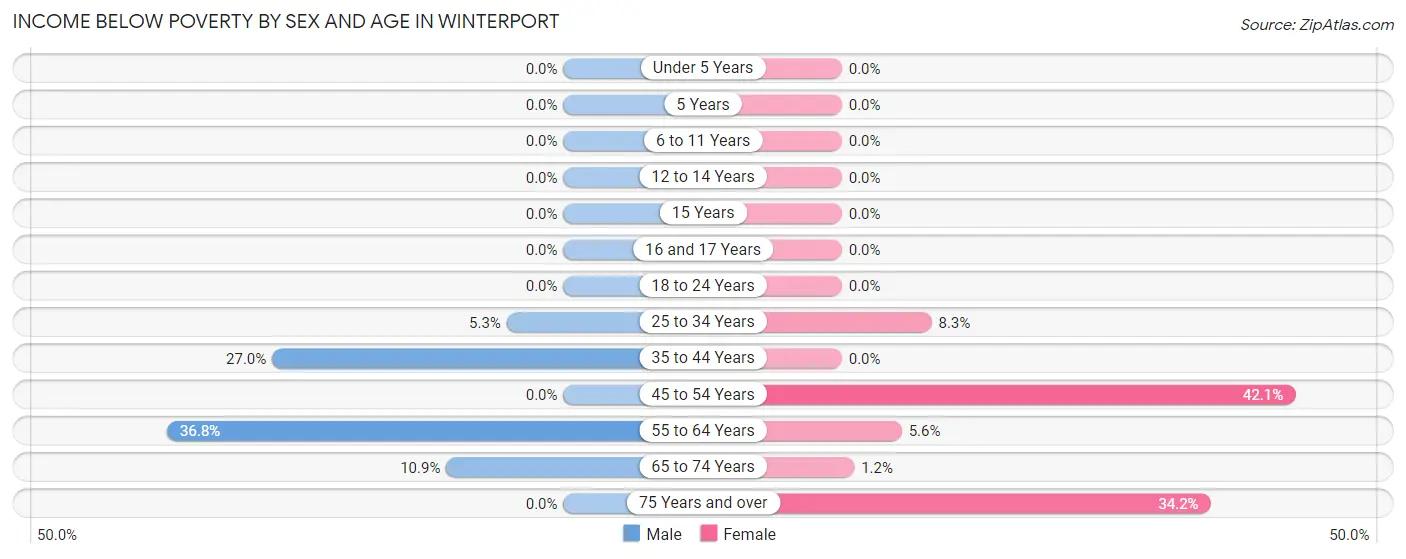
| Age Bracket | Male | Female |
| Under 5 Years | 0 (0.0%) | 0 (0.0%) |
| 5 Years | 0 (0.0%) | 0 (0.0%) |
| 6 to 11 Years | 0 (0.0%) | 0 (0.0%) |
| 12 to 14 Years | 0 (0.0%) | 0 (0.0%) |
| 15 Years | 0 (0.0%) | 0 (0.0%) |
| 16 and 17 Years | 0 (0.0%) | 0 (0.0%) |
| 18 to 24 Years | 0 (0.0%) | 0 (0.0%) |
| 25 to 34 Years | 4 (5.3%) | 4 (8.3%) |
| 35 to 44 Years | 10 (27.0%) | 0 (0.0%) |
| 45 to 54 Years | 0 (0.0%) | 45 (42.1%) |
| 55 to 64 Years | 39 (36.8%) | 8 (5.6%) |
| 65 to 74 Years | 10 (10.9%) | 1 (1.1%) |
| 75 Years and over | 0 (0.0%) | 13 (34.2%) |
| Total | 63 (11.6%) | 71 (12.7%) |
Income Above Poverty by Sex and Age in Winterport
According to the poverty statistics in Winterport, males aged under 5 years and females aged under 5 years are the age groups that are most secure financially, with 100.0% of males and 100.0% of females in these age groups living above the poverty line.
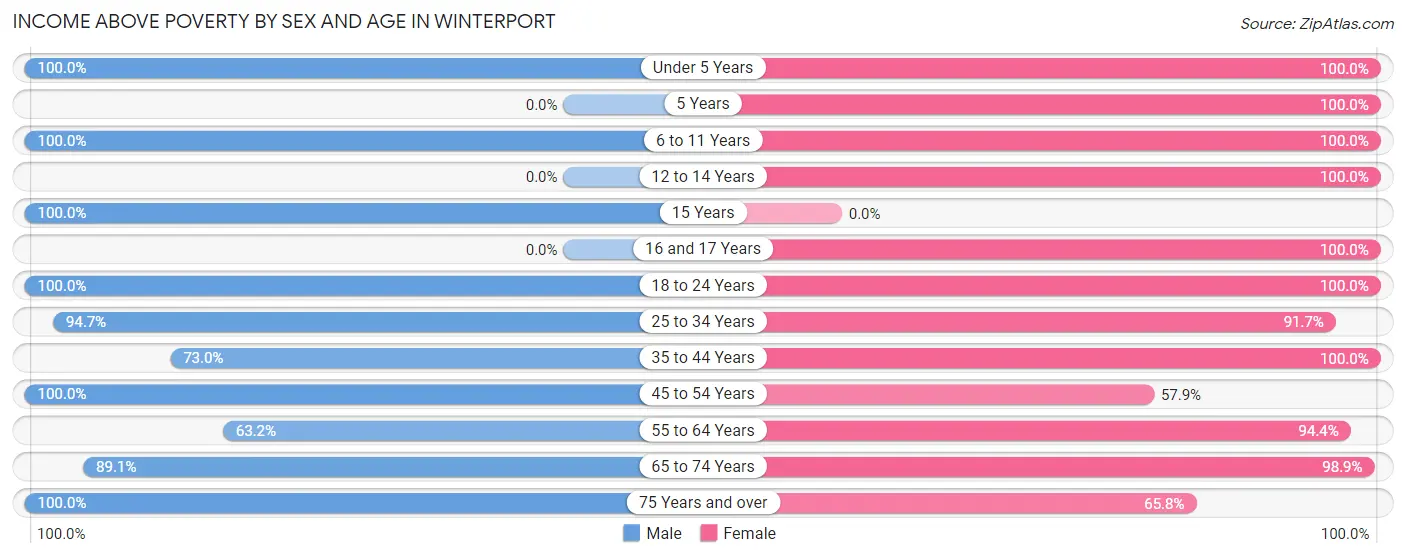
| Age Bracket | Male | Female |
| Under 5 Years | 67 (100.0%) | 8 (100.0%) |
| 5 Years | 0 (0.0%) | 9 (100.0%) |
| 6 to 11 Years | 12 (100.0%) | 9 (100.0%) |
| 12 to 14 Years | 0 (0.0%) | 40 (100.0%) |
| 15 Years | 45 (100.0%) | 0 (0.0%) |
| 16 and 17 Years | 0 (0.0%) | 10 (100.0%) |
| 18 to 24 Years | 19 (100.0%) | 21 (100.0%) |
| 25 to 34 Years | 72 (94.7%) | 44 (91.7%) |
| 35 to 44 Years | 27 (73.0%) | 37 (100.0%) |
| 45 to 54 Years | 62 (100.0%) | 62 (57.9%) |
| 55 to 64 Years | 67 (63.2%) | 136 (94.4%) |
| 65 to 74 Years | 82 (89.1%) | 86 (98.9%) |
| 75 Years and over | 26 (100.0%) | 25 (65.8%) |
| Total | 479 (88.4%) | 487 (87.3%) |
Income Below Poverty Among Married-Couple Families in Winterport
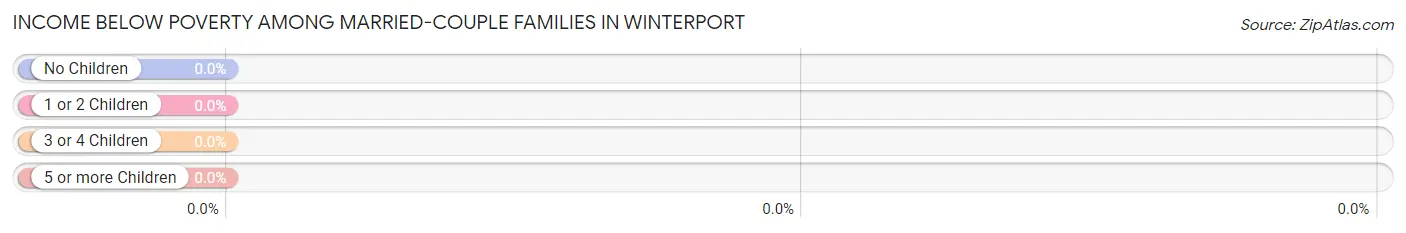
| Children | Above Poverty | Below Poverty |
| No Children | 115 (100.0%) | 0 (0.0%) |
| 1 or 2 Children | 124 (100.0%) | 0 (0.0%) |
| 3 or 4 Children | 0 (0.0%) | 0 (0.0%) |
| 5 or more Children | 0 (0.0%) | 0 (0.0%) |
| Total | 239 (100.0%) | 0 (0.0%) |
Income Below Poverty Among Single-Parent Households in Winterport
| Children | Single Father | Single Mother |
| No Children | 0 (0.0%) | 0 (0.0%) |
| 1 or 2 Children | 0 (0.0%) | 0 (0.0%) |
| 3 or 4 Children | 0 (0.0%) | 0 (0.0%) |
| 5 or more Children | 0 (0.0%) | 0 (0.0%) |
| Total | 0 (0.0%) | 0 (0.0%) |
Income Below Poverty Among Married-Couple vs Single-Parent Households in Winterport
| Children | Married-Couple Families | Single-Parent Households |
| No Children | 0 (0.0%) | 0 (0.0%) |
| 1 or 2 Children | 0 (0.0%) | 0 (0.0%) |
| 3 or 4 Children | 0 (0.0%) | 0 (0.0%) |
| 5 or more Children | 0 (0.0%) | 0 (0.0%) |
| Total | 0 (0.0%) | 0 (0.0%) |
Race in Winterport
The most populous races in Winterport are White / Caucasian (1,058 | 96.2%), Two or more Races (25 | 2.3%), and Black / African American (15 | 1.4%).
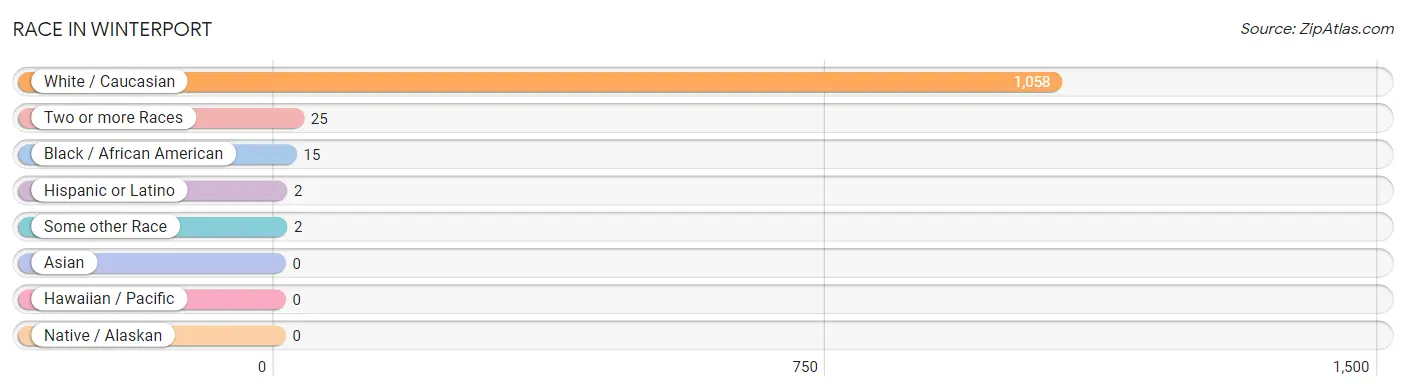
| Race | # Population | % Population |
| Asian | 0 | 0.0% |
| Black / African American | 15 | 1.4% |
| Hawaiian / Pacific | 0 | 0.0% |
| Hispanic or Latino | 2 | 0.2% |
| Native / Alaskan | 0 | 0.0% |
| White / Caucasian | 1,058 | 96.2% |
| Two or more Races | 25 | 2.3% |
| Some other Race | 2 | 0.2% |
| Total | 1,100 | 100.0% |
Ancestry in Winterport
The most populous ancestries reported in Winterport are English (327 | 29.7%), Irish (269 | 24.4%), German (222 | 20.2%), American (131 | 11.9%), and Scottish (57 | 5.2%), together accounting for 91.4% of all Winterport residents.
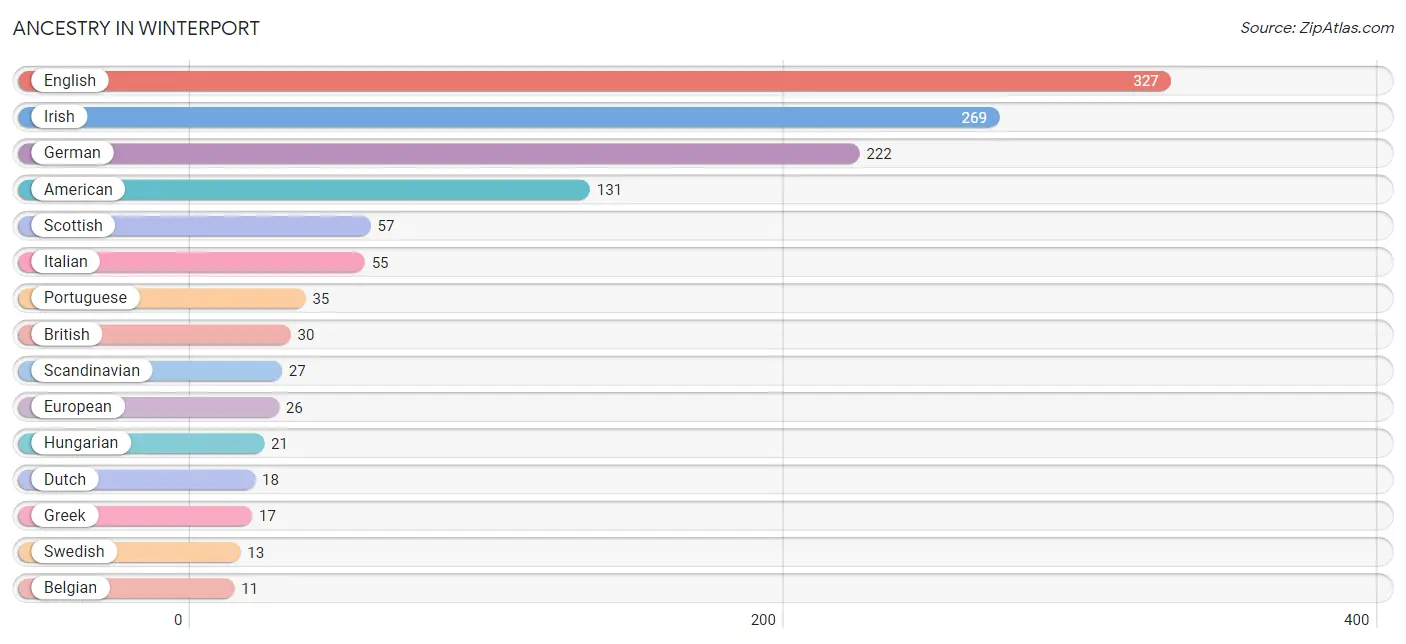
| Ancestry | # Population | % Population |
| American | 131 | 11.9% |
| Belgian | 11 | 1.0% |
| British | 30 | 2.7% |
| Dutch | 18 | 1.6% |
| English | 327 | 29.7% |
| European | 26 | 2.4% |
| French | 4 | 0.4% |
| French Canadian | 10 | 0.9% |
| German | 222 | 20.2% |
| Greek | 17 | 1.5% |
| Hungarian | 21 | 1.9% |
| Irish | 269 | 24.4% |
| Italian | 55 | 5.0% |
| Polish | 4 | 0.4% |
| Portuguese | 35 | 3.2% |
| Puerto Rican | 2 | 0.2% |
| Romanian | 11 | 1.0% |
| Russian | 4 | 0.4% |
| Scandinavian | 27 | 2.5% |
| Scottish | 57 | 5.2% |
| Swedish | 13 | 1.2% | View All 21 Rows |
Immigrants in Winterport

| Immigration Origin | # Population | % Population | View All 0 Rows |
Sex and Age in Winterport
Sex and Age in Winterport
The most populous age groups in Winterport are 60 to 64 Years (70 | 12.9%) for men and 45 to 49 Years (89 | 16.0%) for women.
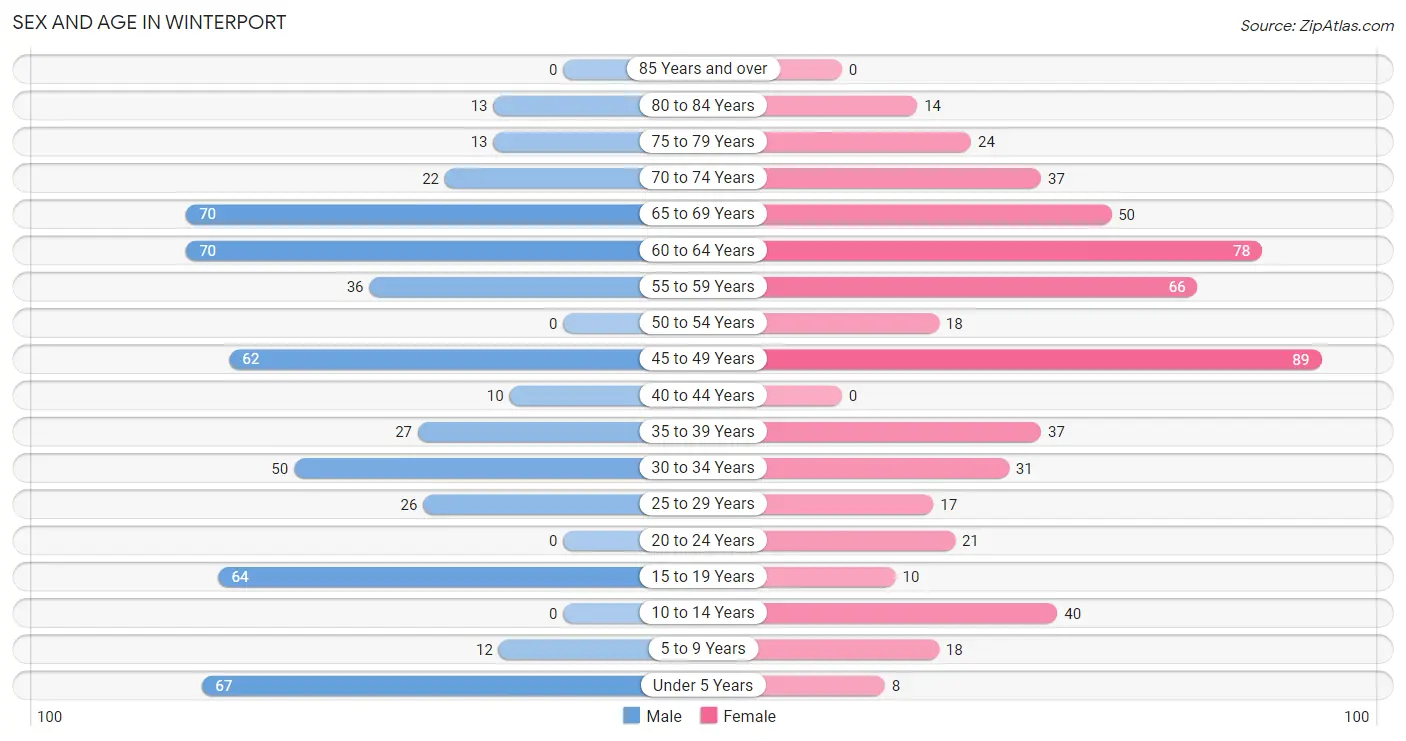
| Age Bracket | Male | Female |
| Under 5 Years | 67 (12.4%) | 8 (1.4%) |
| 5 to 9 Years | 12 (2.2%) | 18 (3.2%) |
| 10 to 14 Years | 0 (0.0%) | 40 (7.2%) |
| 15 to 19 Years | 64 (11.8%) | 10 (1.8%) |
| 20 to 24 Years | 0 (0.0%) | 21 (3.8%) |
| 25 to 29 Years | 26 (4.8%) | 17 (3.0%) |
| 30 to 34 Years | 50 (9.2%) | 31 (5.6%) |
| 35 to 39 Years | 27 (5.0%) | 37 (6.6%) |
| 40 to 44 Years | 10 (1.8%) | 0 (0.0%) |
| 45 to 49 Years | 62 (11.4%) | 89 (16.0%) |
| 50 to 54 Years | 0 (0.0%) | 18 (3.2%) |
| 55 to 59 Years | 36 (6.6%) | 66 (11.8%) |
| 60 to 64 Years | 70 (12.9%) | 78 (14.0%) |
| 65 to 69 Years | 70 (12.9%) | 50 (9.0%) |
| 70 to 74 Years | 22 (4.1%) | 37 (6.6%) |
| 75 to 79 Years | 13 (2.4%) | 24 (4.3%) |
| 80 to 84 Years | 13 (2.4%) | 14 (2.5%) |
| 85 Years and over | 0 (0.0%) | 0 (0.0%) |
| Total | 542 (100.0%) | 558 (100.0%) |
Families and Households in Winterport
Median Family Size in Winterport
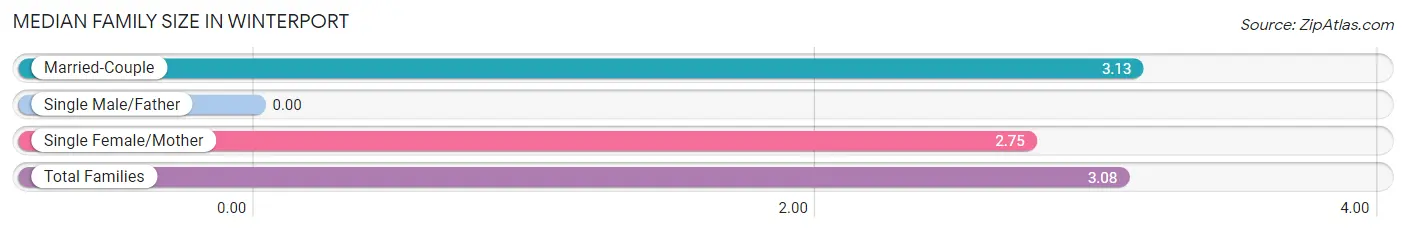
| Family Type | # Families | Family Size |
| Married-Couple | 239 (88.2%) | 3.13 |
| Single Male/Father | 0 (0.0%) | - |
| Single Female/Mother | 32 (11.8%) | 2.75 |
| Total Families | 271 (100.0%) | 3.08 |
Median Household Size in Winterport
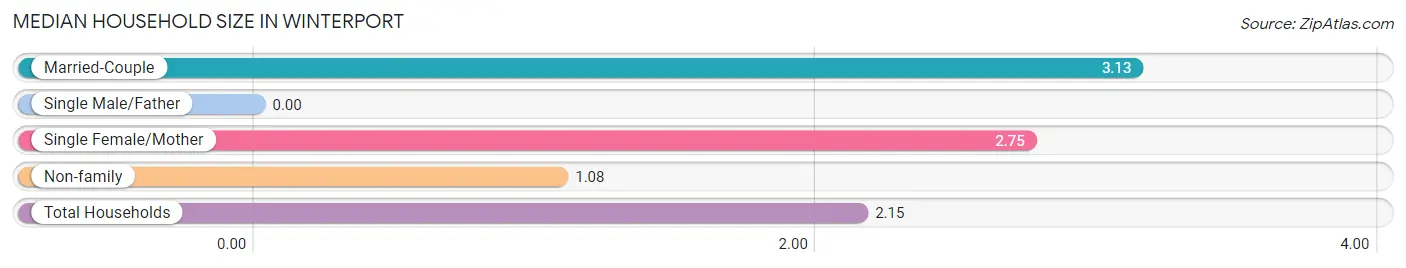
| Household Type | # Households | Household Size |
| Married-Couple | 239 (47.1%) | 3.13 |
| Single Male/Father | 0 (0.0%) | - |
| Single Female/Mother | 32 (6.3%) | 2.75 |
| Non-family | 236 (46.6%) | 1.08 |
| Total Households | 507 (100.0%) | 2.15 |
Household Size by Marriage Status in Winterport
Out of a total of 507 households in Winterport, 271 (53.4%) are family households, while 236 (46.6%) are nonfamily households. The most numerous type of family households are 2-person households, comprising 118, and the most common type of nonfamily households are 1-person households, comprising 204.
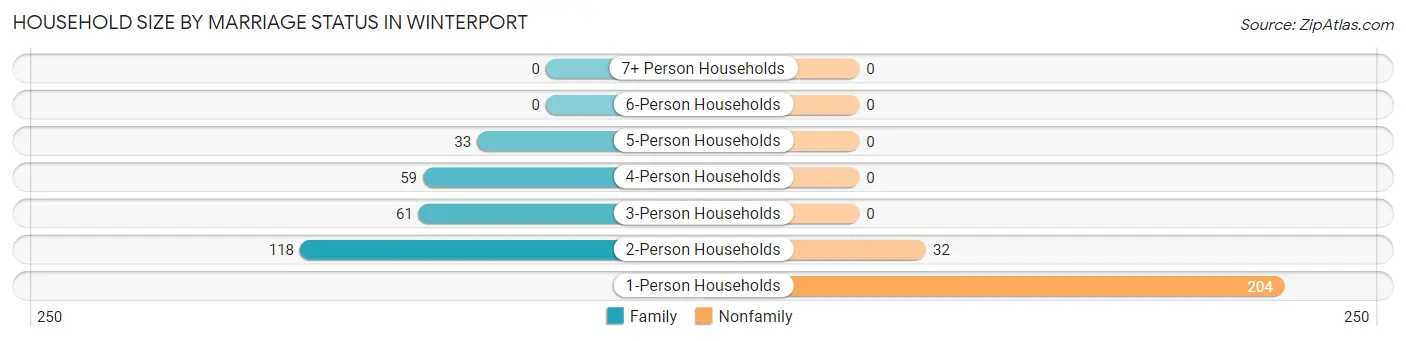
| Household Size | Family Households | Nonfamily Households |
| 1-Person Households | - | 204 (40.2%) |
| 2-Person Households | 118 (23.3%) | 32 (6.3%) |
| 3-Person Households | 61 (12.0%) | 0 (0.0%) |
| 4-Person Households | 59 (11.6%) | 0 (0.0%) |
| 5-Person Households | 33 (6.5%) | 0 (0.0%) |
| 6-Person Households | 0 (0.0%) | 0 (0.0%) |
| 7+ Person Households | 0 (0.0%) | 0 (0.0%) |
| Total | 271 (53.4%) | 236 (46.6%) |
Female Fertility in Winterport
Fertility by Age in Winterport
Average fertility rate in Winterport is 78.0 births per 1,000 women. Women in the age bracket of 20 to 34 years have the highest fertility rate with 130.0 births per 1,000 women. Women in the age bracket of 20 to 34 years acount for 56.2% of all women with births.
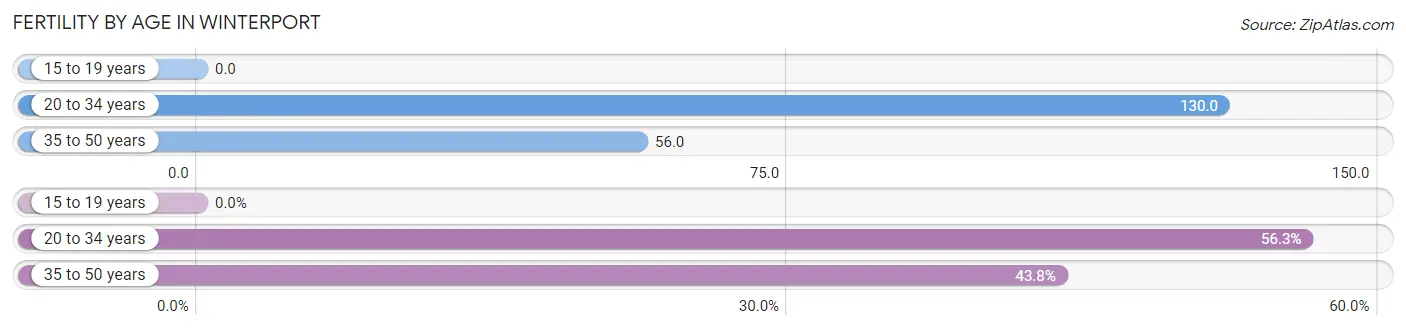
| Age Bracket | Women with Births | Births / 1,000 Women |
| 15 to 19 years | 0 (0.0%) | 0.0 |
| 20 to 34 years | 9 (56.2%) | 130.0 |
| 35 to 50 years | 7 (43.8%) | 56.0 |
| Total | 16 (100.0%) | 78.0 |
Fertility by Age by Marriage Status in Winterport
56.2% of women with births (16) in Winterport are married. The highest percentage of unmarried women with births falls into 35 to 50 years age bracket with 100.0% of them unmarried at the time of birth, while the lowest percentage of unmarried women with births belong to 20 to 34 years age bracket with 0.0% of them unmarried.
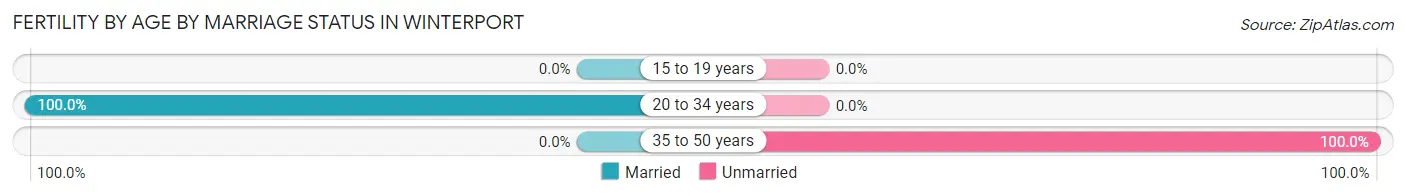
| Age Bracket | Married | Unmarried |
| 15 to 19 years | 0 (0.0%) | 0 (0.0%) |
| 20 to 34 years | 9 (100.0%) | 0 (0.0%) |
| 35 to 50 years | 0 (0.0%) | 7 (100.0%) |
| Total | 9 (56.2%) | 7 (43.8%) |
Fertility by Education in Winterport
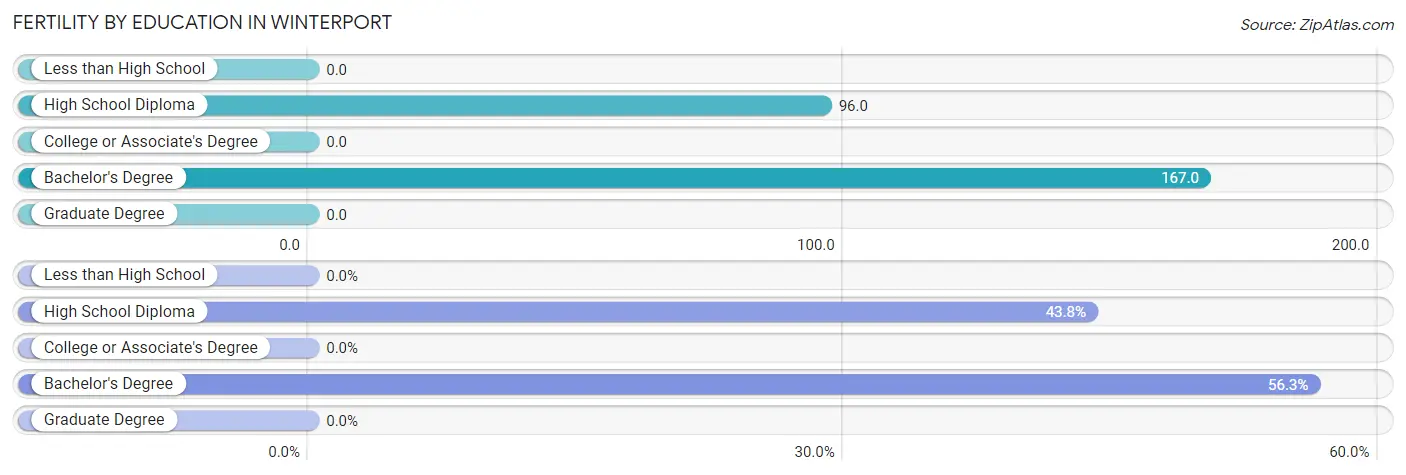
| Educational Attainment | Women with Births | Births / 1,000 Women |
| Less than High School | 0 (0.0%) | 0.0 |
| High School Diploma | 7 (43.8%) | 96.0 |
| College or Associate's Degree | 0 (0.0%) | 0.0 |
| Bachelor's Degree | 9 (56.2%) | 167.0 |
| Graduate Degree | 0 (0.0%) | 0.0 |
| Total | 16 (100.0%) | 78.0 |
Fertility by Education by Marriage Status in Winterport
43.8% of women with births in Winterport are unmarried. Women with the educational attainment of bachelor's degree are most likely to be married with 100.0% of them married at childbirth, while women with the educational attainment of high school diploma are least likely to be married with 100.0% of them unmarried at childbirth.
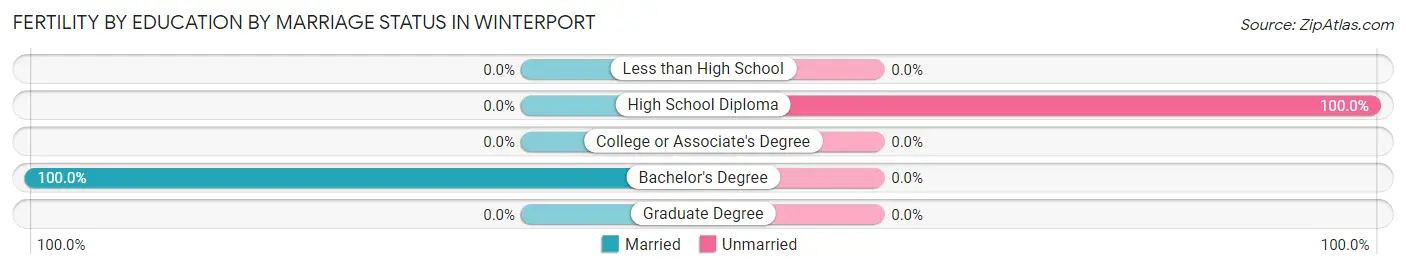
| Educational Attainment | Married | Unmarried |
| Less than High School | 0 (0.0%) | 0 (0.0%) |
| High School Diploma | 0 (0.0%) | 7 (100.0%) |
| College or Associate's Degree | 0 (0.0%) | 0 (0.0%) |
| Bachelor's Degree | 9 (100.0%) | 0 (0.0%) |
| Graduate Degree | 0 (0.0%) | 0 (0.0%) |
| Total | 9 (56.2%) | 7 (43.8%) |
Employment Characteristics in Winterport
Employment by Class of Employer in Winterport
Among the 466 employed individuals in Winterport, private company employees (249 | 53.4%), not-for-profit organizations (131 | 28.1%), and local government employees (52 | 11.2%) make up the most common classes of employment.
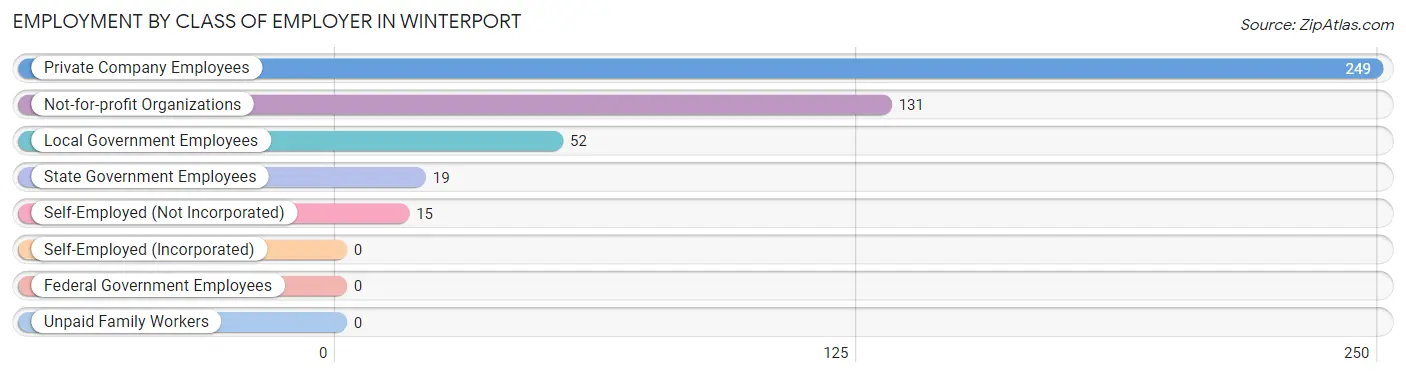
| Employer Class | # Employees | % Employees |
| Private Company Employees | 249 | 53.4% |
| Self-Employed (Incorporated) | 0 | 0.0% |
| Self-Employed (Not Incorporated) | 15 | 3.2% |
| Not-for-profit Organizations | 131 | 28.1% |
| Local Government Employees | 52 | 11.2% |
| State Government Employees | 19 | 4.1% |
| Federal Government Employees | 0 | 0.0% |
| Unpaid Family Workers | 0 | 0.0% |
| Total | 466 | 100.0% |
Employment Status by Age in Winterport
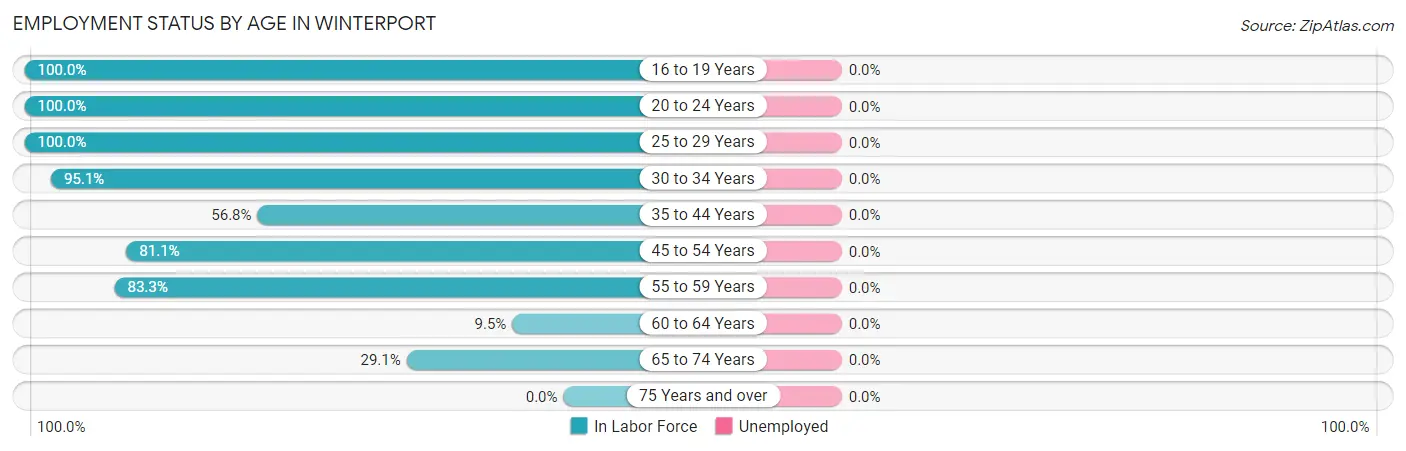
| Age Bracket | In Labor Force | Unemployed |
| 16 to 19 Years | 29 (100.0%) | 0 (0.0%) |
| 20 to 24 Years | 21 (100.0%) | 0 (0.0%) |
| 25 to 29 Years | 43 (100.0%) | 0 (0.0%) |
| 30 to 34 Years | 77 (95.1%) | 0 (0.0%) |
| 35 to 44 Years | 42 (56.8%) | 0 (0.0%) |
| 45 to 54 Years | 137 (81.1%) | 0 (0.0%) |
| 55 to 59 Years | 85 (83.3%) | 0 (0.0%) |
| 60 to 64 Years | 14 (9.5%) | 0 (0.0%) |
| 65 to 74 Years | 52 (29.1%) | 0 (0.0%) |
| 75 Years and over | 0 (0.0%) | 0 (0.0%) |
| Total | 500 (54.9%) | 0 (0.0%) |
Employment Status by Educational Attainment in Winterport
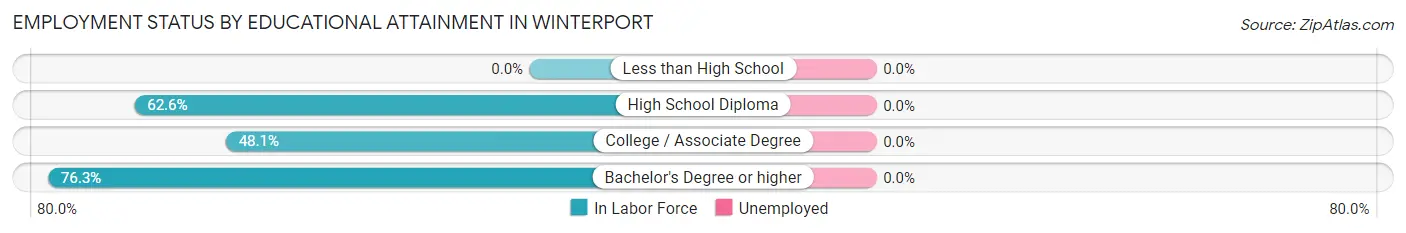
| Educational Attainment | In Labor Force | Unemployed |
| Less than High School | 0 (0.0%) | 0 (0.0%) |
| High School Diploma | 159 (62.6%) | 0 (0.0%) |
| College / Associate Degree | 65 (48.1%) | 0 (0.0%) |
| Bachelor's Degree or higher | 174 (76.3%) | 0 (0.0%) |
| Total | 398 (64.5%) | 0 (0.0%) |
Employment Occupations by Sex in Winterport
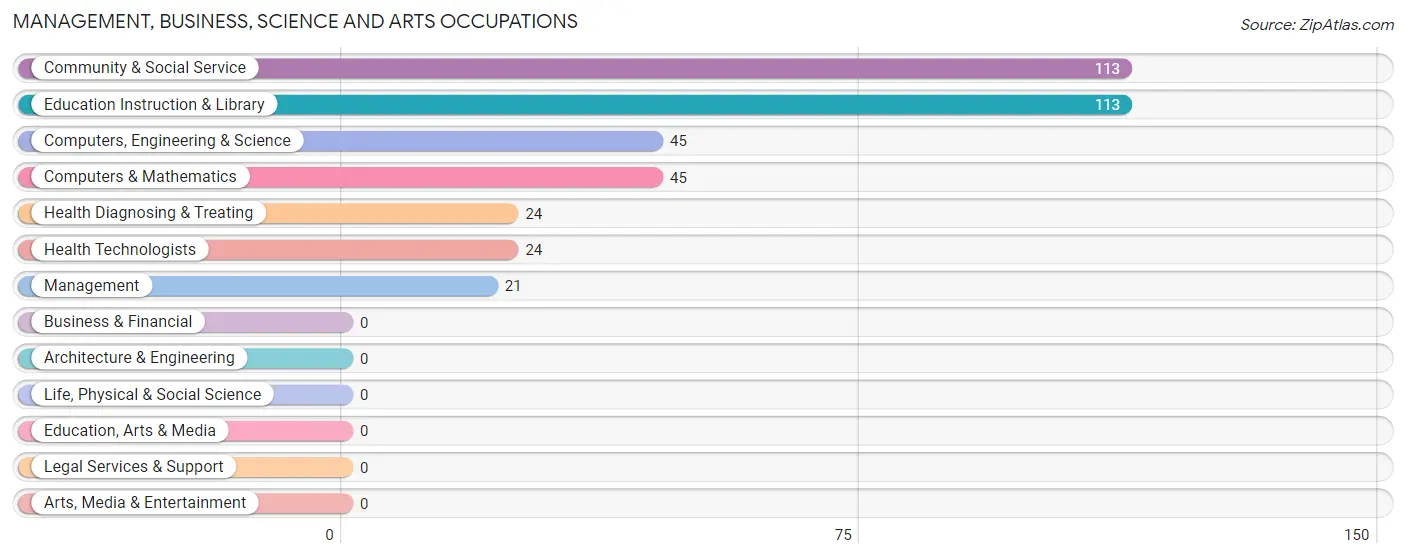
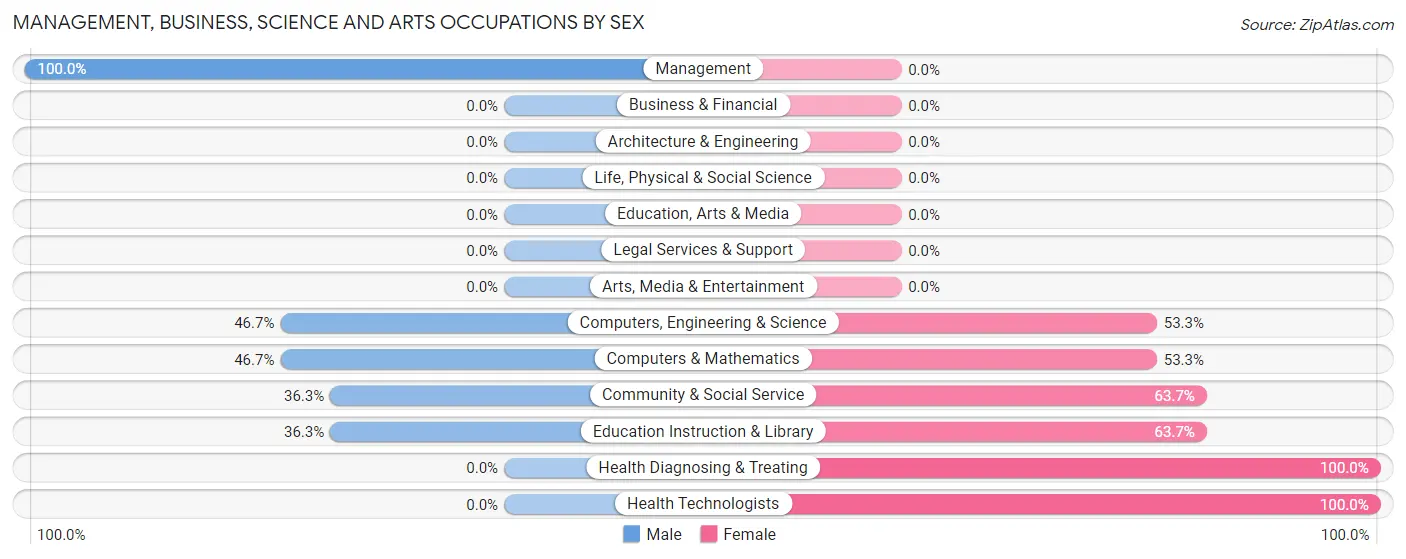
Management, Business, Science and Arts Occupations
The most common Management, Business, Science and Arts occupations in Winterport are Community & Social Service (113 | 22.6%), Education Instruction & Library (113 | 22.6%), Computers, Engineering & Science (45 | 9.0%), Computers & Mathematics (45 | 9.0%), and Health Diagnosing & Treating (24 | 4.8%).
Management, Business, Science and Arts Occupations by Sex
Within the Management, Business, Science and Arts occupations in Winterport, the most male-oriented occupations are Management (100.0%), Computers, Engineering & Science (46.7%), and Computers & Mathematics (46.7%), while the most female-oriented occupations are Health Diagnosing & Treating (100.0%), Health Technologists (100.0%), and Community & Social Service (63.7%).
| Occupation | Male | Female |
| Management | 21 (100.0%) | 0 (0.0%) |
| Business & Financial | 0 (0.0%) | 0 (0.0%) |
| Computers, Engineering & Science | 21 (46.7%) | 24 (53.3%) |
| Computers & Mathematics | 21 (46.7%) | 24 (53.3%) |
| Architecture & Engineering | 0 (0.0%) | 0 (0.0%) |
| Life, Physical & Social Science | 0 (0.0%) | 0 (0.0%) |
| Community & Social Service | 41 (36.3%) | 72 (63.7%) |
| Education, Arts & Media | 0 (0.0%) | 0 (0.0%) |
| Legal Services & Support | 0 (0.0%) | 0 (0.0%) |
| Education Instruction & Library | 41 (36.3%) | 72 (63.7%) |
| Arts, Media & Entertainment | 0 (0.0%) | 0 (0.0%) |
| Health Diagnosing & Treating | 0 (0.0%) | 24 (100.0%) |
| Health Technologists | 0 (0.0%) | 24 (100.0%) |
| Total (Category) | 83 (40.9%) | 120 (59.1%) |
| Total (Overall) | 214 (42.8%) | 286 (57.2%) |
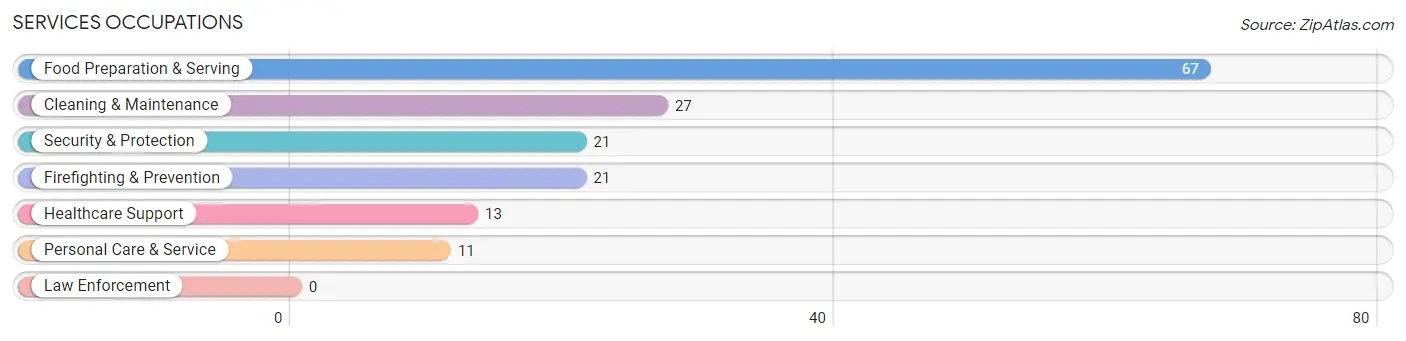
Services Occupations
The most common Services occupations in Winterport are Food Preparation & Serving (67 | 13.4%), Cleaning & Maintenance (27 | 5.4%), Security & Protection (21 | 4.2%), Firefighting & Prevention (21 | 4.2%), and Healthcare Support (13 | 2.6%).
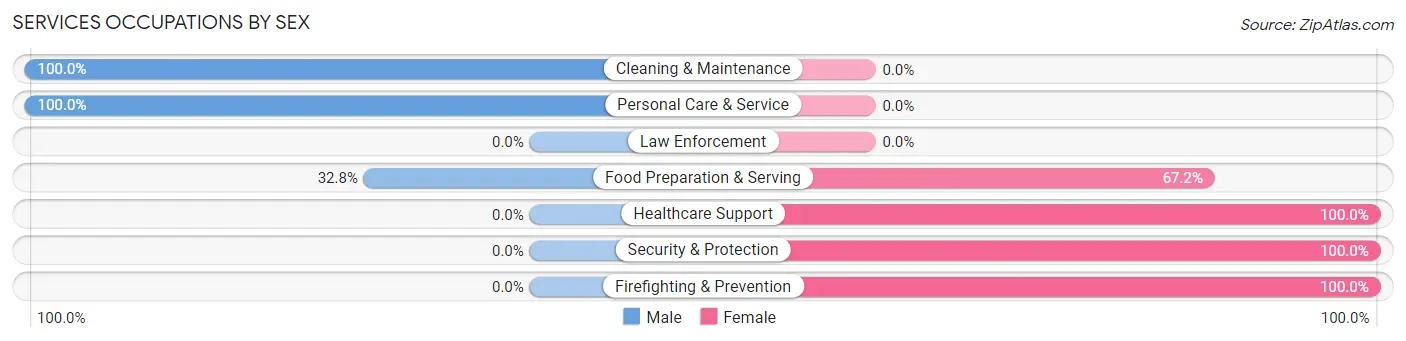
Services Occupations by Sex
Within the Services occupations in Winterport, the most male-oriented occupations are Cleaning & Maintenance (100.0%), Personal Care & Service (100.0%), and Food Preparation & Serving (32.8%), while the most female-oriented occupations are Healthcare Support (100.0%), Security & Protection (100.0%), and Firefighting & Prevention (100.0%).
| Occupation | Male | Female |
| Healthcare Support | 0 (0.0%) | 13 (100.0%) |
| Security & Protection | 0 (0.0%) | 21 (100.0%) |
| Firefighting & Prevention | 0 (0.0%) | 21 (100.0%) |
| Law Enforcement | 0 (0.0%) | 0 (0.0%) |
| Food Preparation & Serving | 22 (32.8%) | 45 (67.2%) |
| Cleaning & Maintenance | 27 (100.0%) | 0 (0.0%) |
| Personal Care & Service | 11 (100.0%) | 0 (0.0%) |
| Total (Category) | 60 (43.2%) | 79 (56.8%) |
| Total (Overall) | 214 (42.8%) | 286 (57.2%) |
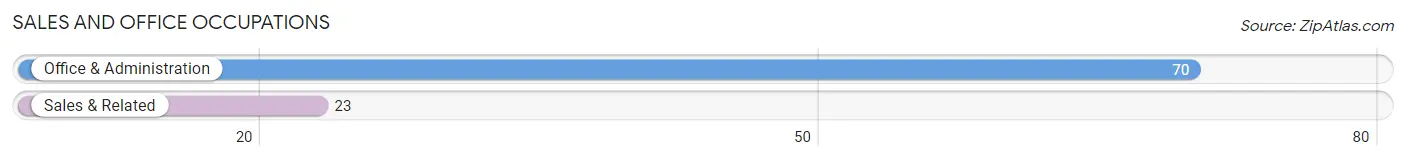
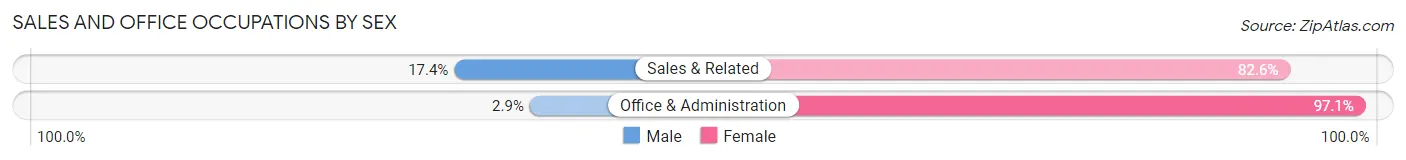
Sales and Office Occupations
The most common Sales and Office occupations in Winterport are Office & Administration (70 | 14.0%), and Sales & Related (23 | 4.6%).
Sales and Office Occupations by Sex
| Occupation | Male | Female |
| Sales & Related | 4 (17.4%) | 19 (82.6%) |
| Office & Administration | 2 (2.9%) | 68 (97.1%) |
| Total (Category) | 6 (6.5%) | 87 (93.5%) |
| Total (Overall) | 214 (42.8%) | 286 (57.2%) |
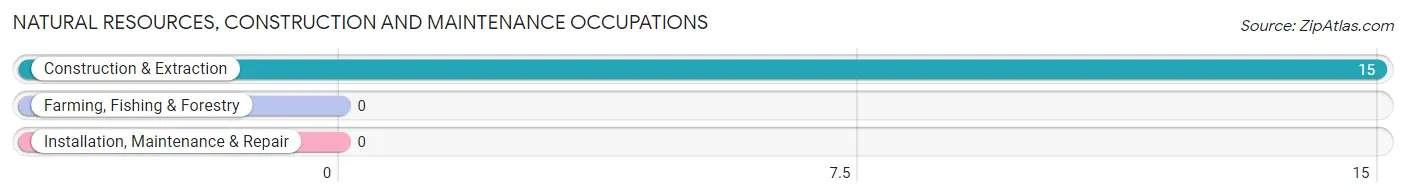
Natural Resources, Construction and Maintenance Occupations
The most common Natural Resources, Construction and Maintenance occupations in Winterport are , and Construction & Extraction (15 | 3.0%).
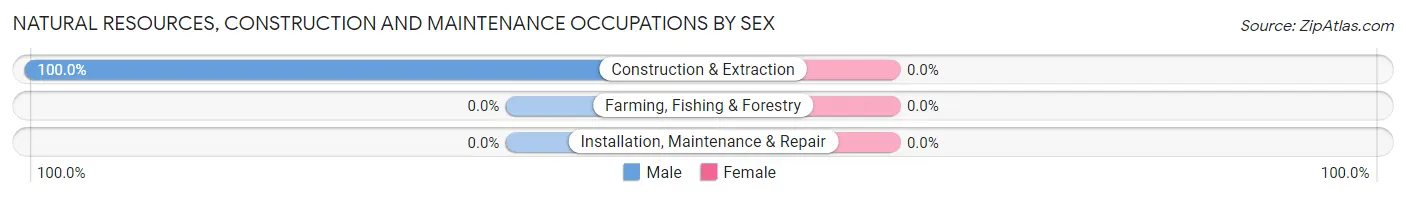
Natural Resources, Construction and Maintenance Occupations by Sex
| Occupation | Male | Female |
| Farming, Fishing & Forestry | 0 (0.0%) | 0 (0.0%) |
| Construction & Extraction | 15 (100.0%) | 0 (0.0%) |
| Installation, Maintenance & Repair | 0 (0.0%) | 0 (0.0%) |
| Total (Category) | 15 (100.0%) | 0 (0.0%) |
| Total (Overall) | 214 (42.8%) | 286 (57.2%) |
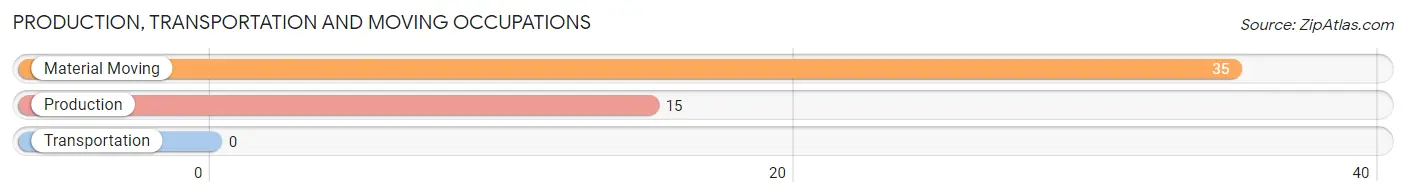
Production, Transportation and Moving Occupations
The most common Production, Transportation and Moving occupations in Winterport are Material Moving (35 | 7.0%), and Production (15 | 3.0%).
Production, Transportation and Moving Occupations by Sex
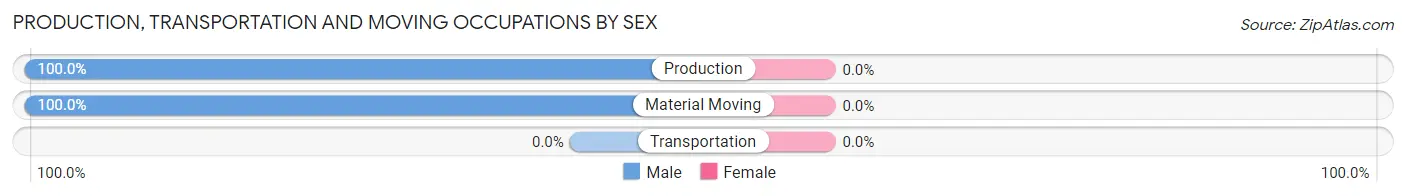
| Occupation | Male | Female |
| Production | 15 (100.0%) | 0 (0.0%) |
| Transportation | 0 (0.0%) | 0 (0.0%) |
| Material Moving | 35 (100.0%) | 0 (0.0%) |
| Total (Category) | 50 (100.0%) | 0 (0.0%) |
| Total (Overall) | 214 (42.8%) | 286 (57.2%) |
Employment Industries by Sex in Winterport
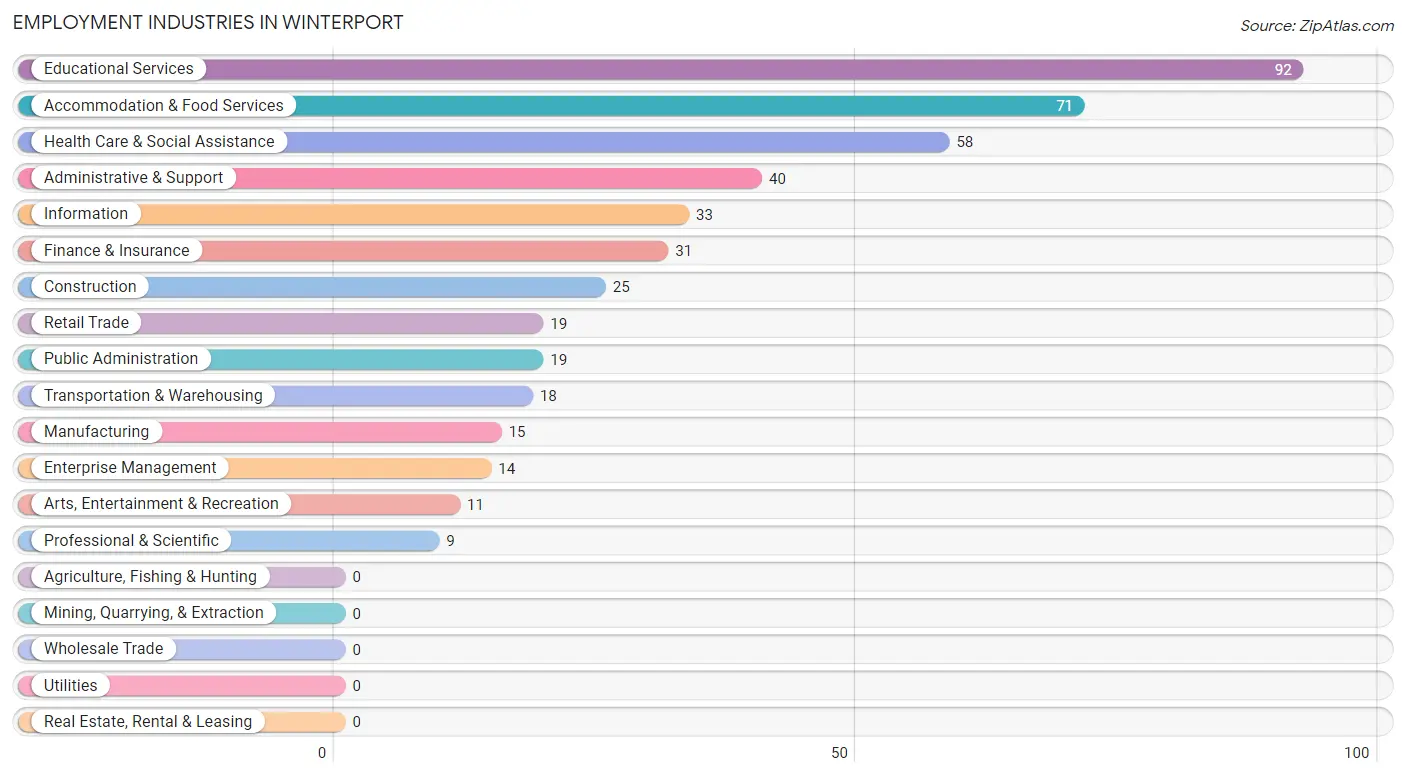
Employment Industries in Winterport
The major employment industries in Winterport include Educational Services (92 | 18.4%), Accommodation & Food Services (71 | 14.2%), Health Care & Social Assistance (58 | 11.6%), Administrative & Support (40 | 8.0%), and Information (33 | 6.6%).
Employment Industries by Sex in Winterport
The Winterport industries that see more men than women are Manufacturing (100.0%), Transportation & Warehousing (100.0%), and Professional & Scientific (100.0%), whereas the industries that tend to have a higher number of women are Retail Trade (100.0%), Enterprise Management (100.0%), and Public Administration (100.0%).
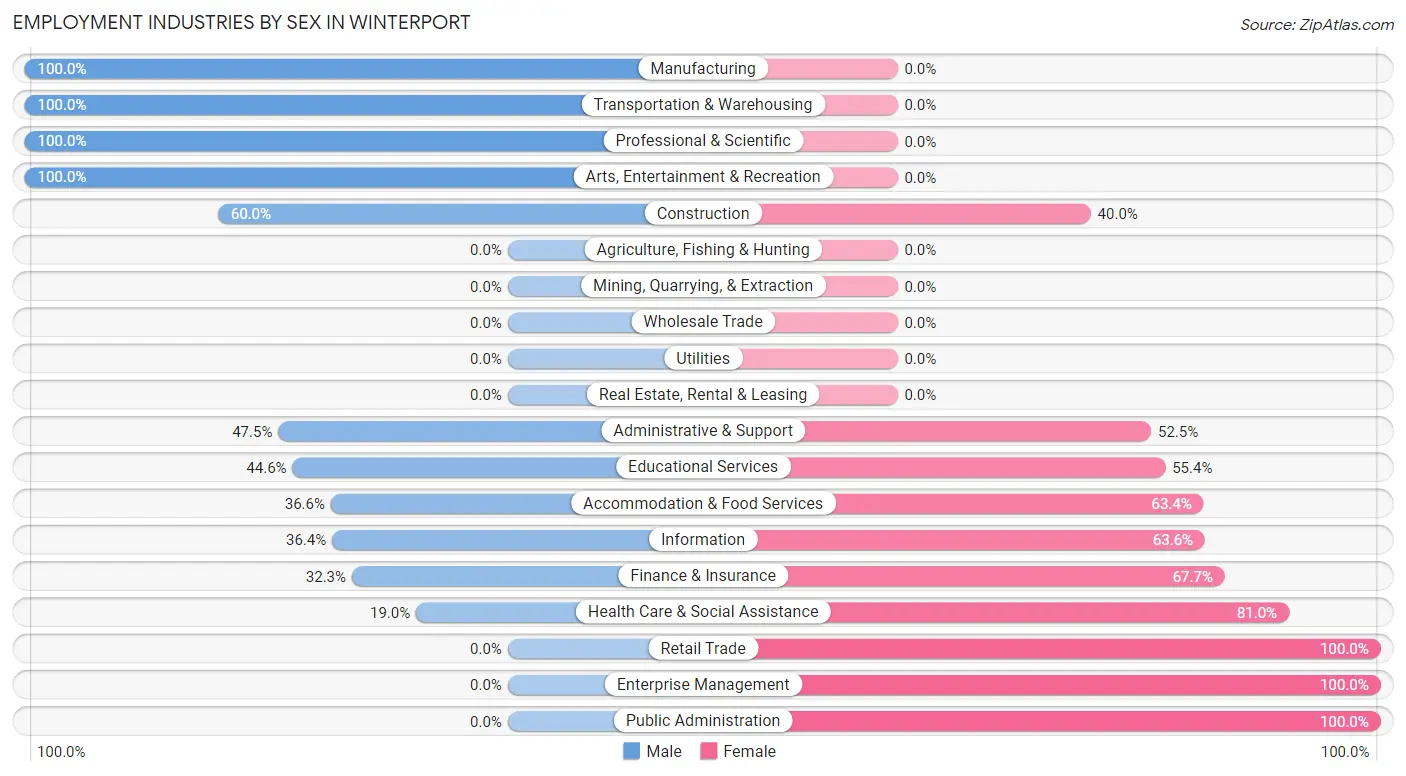
| Industry | Male | Female |
| Agriculture, Fishing & Hunting | 0 (0.0%) | 0 (0.0%) |
| Mining, Quarrying, & Extraction | 0 (0.0%) | 0 (0.0%) |
| Construction | 15 (60.0%) | 10 (40.0%) |
| Manufacturing | 15 (100.0%) | 0 (0.0%) |
| Wholesale Trade | 0 (0.0%) | 0 (0.0%) |
| Retail Trade | 0 (0.0%) | 19 (100.0%) |
| Transportation & Warehousing | 18 (100.0%) | 0 (0.0%) |
| Utilities | 0 (0.0%) | 0 (0.0%) |
| Information | 12 (36.4%) | 21 (63.6%) |
| Finance & Insurance | 10 (32.3%) | 21 (67.7%) |
| Real Estate, Rental & Leasing | 0 (0.0%) | 0 (0.0%) |
| Professional & Scientific | 9 (100.0%) | 0 (0.0%) |
| Enterprise Management | 0 (0.0%) | 14 (100.0%) |
| Administrative & Support | 19 (47.5%) | 21 (52.5%) |
| Educational Services | 41 (44.6%) | 51 (55.4%) |
| Health Care & Social Assistance | 11 (19.0%) | 47 (81.0%) |
| Arts, Entertainment & Recreation | 11 (100.0%) | 0 (0.0%) |
| Accommodation & Food Services | 26 (36.6%) | 45 (63.4%) |
| Public Administration | 0 (0.0%) | 19 (100.0%) |
| Total | 214 (42.8%) | 286 (57.2%) |
Education in Winterport
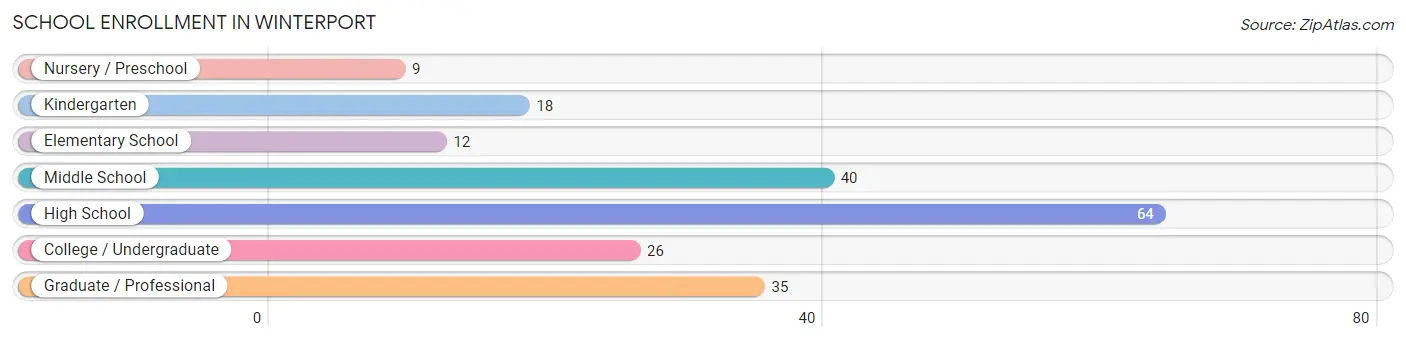
School Enrollment in Winterport
The most common levels of schooling among the 204 students in Winterport are high school (64 | 31.4%), middle school (40 | 19.6%), and graduate / professional (35 | 17.2%).
| School Level | # Students | % Students |
| Nursery / Preschool | 9 | 4.4% |
| Kindergarten | 18 | 8.8% |
| Elementary School | 12 | 5.9% |
| Middle School | 40 | 19.6% |
| High School | 64 | 31.4% |
| College / Undergraduate | 26 | 12.8% |
| Graduate / Professional | 35 | 17.2% |
| Total | 204 | 100.0% |
School Enrollment by Age by Funding Source in Winterport
Out of a total of 204 students who are enrolled in schools in Winterport, 81 (39.7%) attend a private institution, while the remaining 123 (60.3%) are enrolled in public schools. The age group of 35 years and over has the highest likelihood of being enrolled in private schools, with 51 (100.0% in the age bracket) enrolled. Conversely, the age group of 3 to 4 year olds has the lowest likelihood of being enrolled in a private school, with 9 (100.0% in the age bracket) attending a public institution.
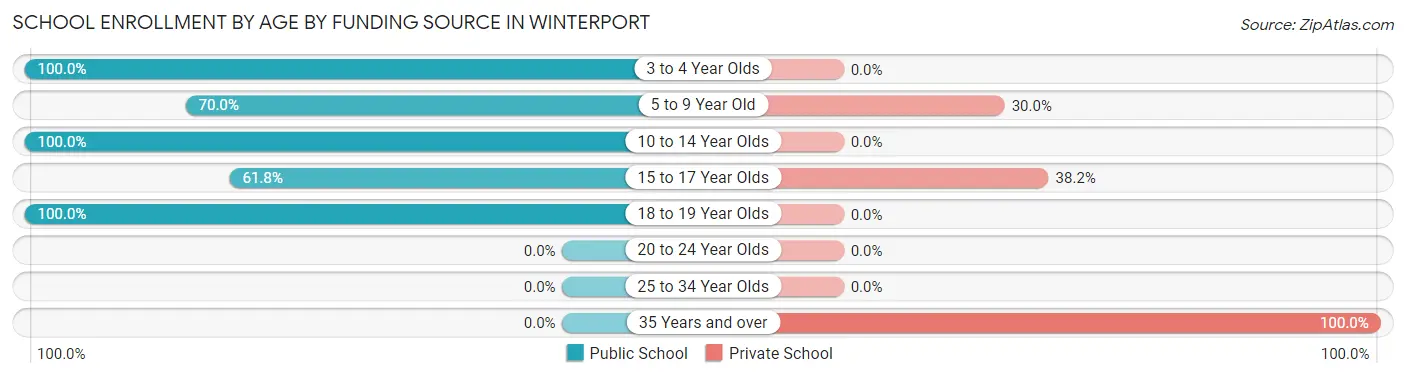
| Age Bracket | Public School | Private School |
| 3 to 4 Year Olds | 9 (100.0%) | 0 (0.0%) |
| 5 to 9 Year Old | 21 (70.0%) | 9 (30.0%) |
| 10 to 14 Year Olds | 40 (100.0%) | 0 (0.0%) |
| 15 to 17 Year Olds | 34 (61.8%) | 21 (38.2%) |
| 18 to 19 Year Olds | 19 (100.0%) | 0 (0.0%) |
| 20 to 24 Year Olds | 0 (0.0%) | 0 (0.0%) |
| 25 to 34 Year Olds | 0 (0.0%) | 0 (0.0%) |
| 35 Years and over | 0 (0.0%) | 51 (100.0%) |
| Total | 123 (60.3%) | 81 (39.7%) |
Educational Attainment by Field of Study in Winterport
Education (63 | 19.9%), science & technology (57 | 18.0%), visual & performing arts (51 | 16.1%), literature & languages (40 | 12.7%), and business (37 | 11.7%) are the most common fields of study among 316 individuals in Winterport who have obtained a bachelor's degree or higher.
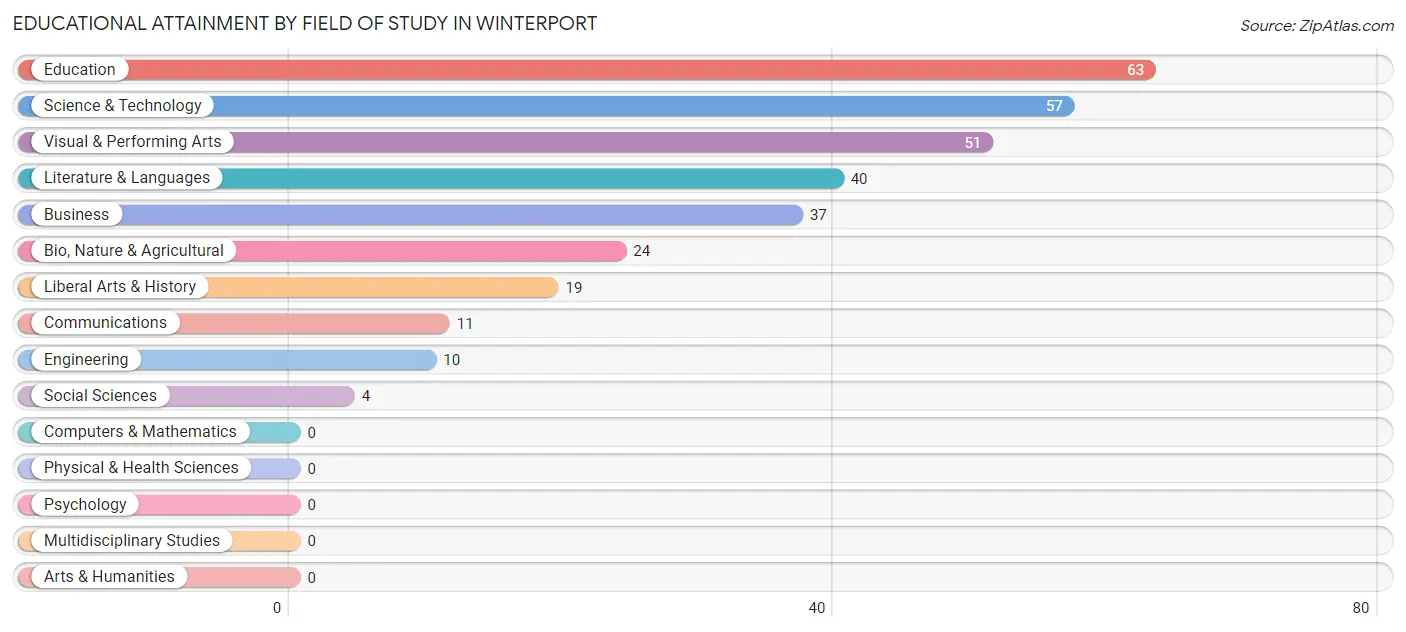
| Field of Study | # Graduates | % Graduates |
| Computers & Mathematics | 0 | 0.0% |
| Bio, Nature & Agricultural | 24 | 7.6% |
| Physical & Health Sciences | 0 | 0.0% |
| Psychology | 0 | 0.0% |
| Social Sciences | 4 | 1.3% |
| Engineering | 10 | 3.2% |
| Multidisciplinary Studies | 0 | 0.0% |
| Science & Technology | 57 | 18.0% |
| Business | 37 | 11.7% |
| Education | 63 | 19.9% |
| Literature & Languages | 40 | 12.7% |
| Liberal Arts & History | 19 | 6.0% |
| Visual & Performing Arts | 51 | 16.1% |
| Communications | 11 | 3.5% |
| Arts & Humanities | 0 | 0.0% |
| Total | 316 | 100.0% |
Transportation & Commute in Winterport
Vehicle Availability by Sex in Winterport
The most prevalent vehicle ownership categories in Winterport are males with 4 vehicles (58, accounting for 27.9%) and females with 4 vehicles (10, making up 23.0%).
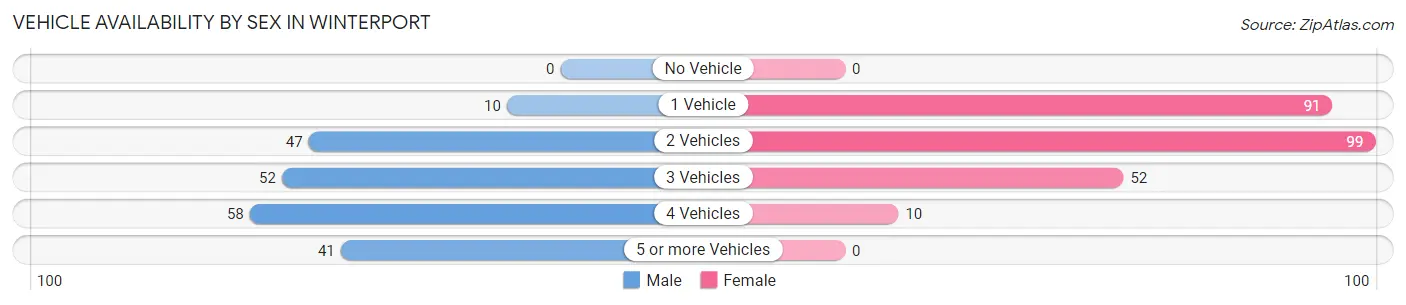
| Vehicles Available | Male | Female |
| No Vehicle | 0 (0.0%) | 0 (0.0%) |
| 1 Vehicle | 10 (4.8%) | 91 (36.1%) |
| 2 Vehicles | 47 (22.6%) | 99 (39.3%) |
| 3 Vehicles | 52 (25.0%) | 52 (20.6%) |
| 4 Vehicles | 58 (27.9%) | 10 (4.0%) |
| 5 or more Vehicles | 41 (19.7%) | 0 (0.0%) |
| Total | 208 (100.0%) | 252 (100.0%) |
Commute Time in Winterport
The most frequently occuring commute durations in Winterport are 30 to 34 minutes (121 commuters, 26.5%), 10 to 14 minutes (92 commuters, 20.2%), and 20 to 24 minutes (75 commuters, 16.5%).
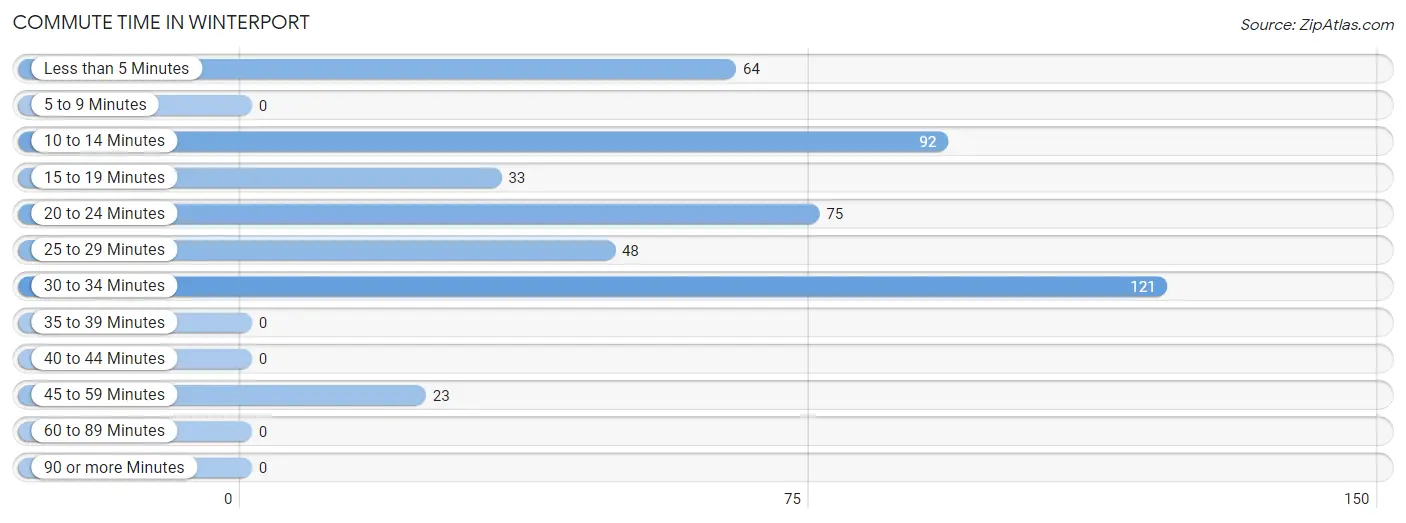
| Commute Time | # Commuters | % Commuters |
| Less than 5 Minutes | 64 | 14.0% |
| 5 to 9 Minutes | 0 | 0.0% |
| 10 to 14 Minutes | 92 | 20.2% |
| 15 to 19 Minutes | 33 | 7.2% |
| 20 to 24 Minutes | 75 | 16.5% |
| 25 to 29 Minutes | 48 | 10.5% |
| 30 to 34 Minutes | 121 | 26.5% |
| 35 to 39 Minutes | 0 | 0.0% |
| 40 to 44 Minutes | 0 | 0.0% |
| 45 to 59 Minutes | 23 | 5.0% |
| 60 to 89 Minutes | 0 | 0.0% |
| 90 or more Minutes | 0 | 0.0% |
Commute Time by Sex in Winterport
The most common commute times in Winterport are 30 to 34 minutes (60 commuters, 28.0%) for males and 10 to 14 minutes (75 commuters, 31.0%) for females.
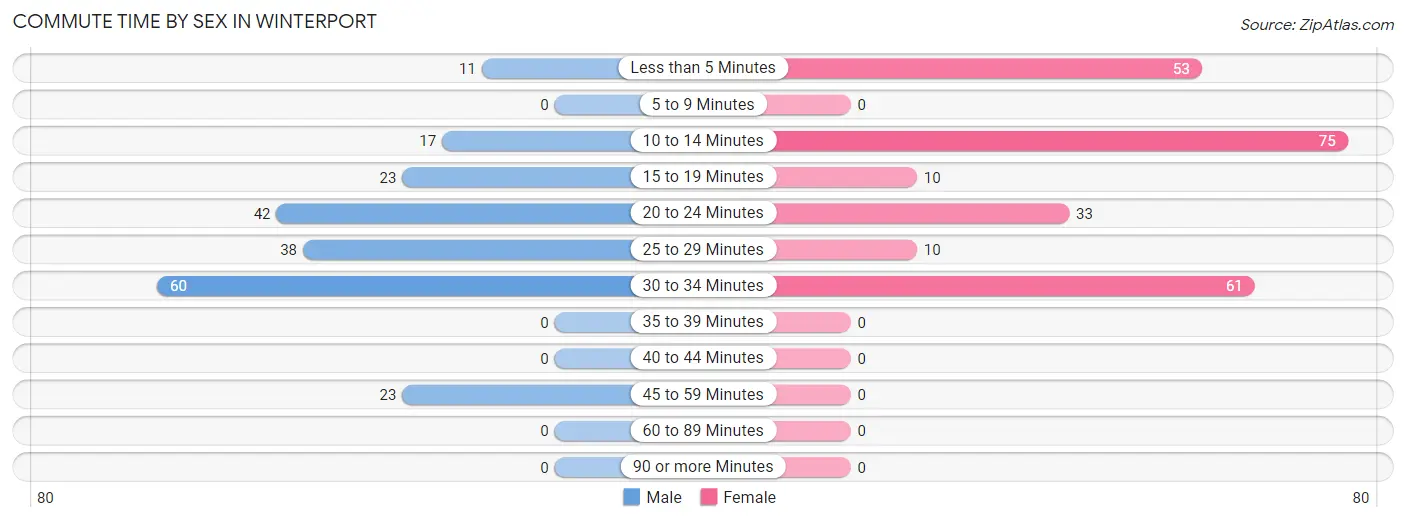
| Commute Time | Male | Female |
| Less than 5 Minutes | 11 (5.1%) | 53 (21.9%) |
| 5 to 9 Minutes | 0 (0.0%) | 0 (0.0%) |
| 10 to 14 Minutes | 17 (7.9%) | 75 (31.0%) |
| 15 to 19 Minutes | 23 (10.7%) | 10 (4.1%) |
| 20 to 24 Minutes | 42 (19.6%) | 33 (13.6%) |
| 25 to 29 Minutes | 38 (17.8%) | 10 (4.1%) |
| 30 to 34 Minutes | 60 (28.0%) | 61 (25.2%) |
| 35 to 39 Minutes | 0 (0.0%) | 0 (0.0%) |
| 40 to 44 Minutes | 0 (0.0%) | 0 (0.0%) |
| 45 to 59 Minutes | 23 (10.7%) | 0 (0.0%) |
| 60 to 89 Minutes | 0 (0.0%) | 0 (0.0%) |
| 90 or more Minutes | 0 (0.0%) | 0 (0.0%) |
Time of Departure to Work by Sex in Winterport
The most frequent times of departure to work in Winterport are 6:00 AM to 6:29 AM (61, 28.5%) for males and 12:00 PM to 3:59 PM (55, 22.7%) for females.
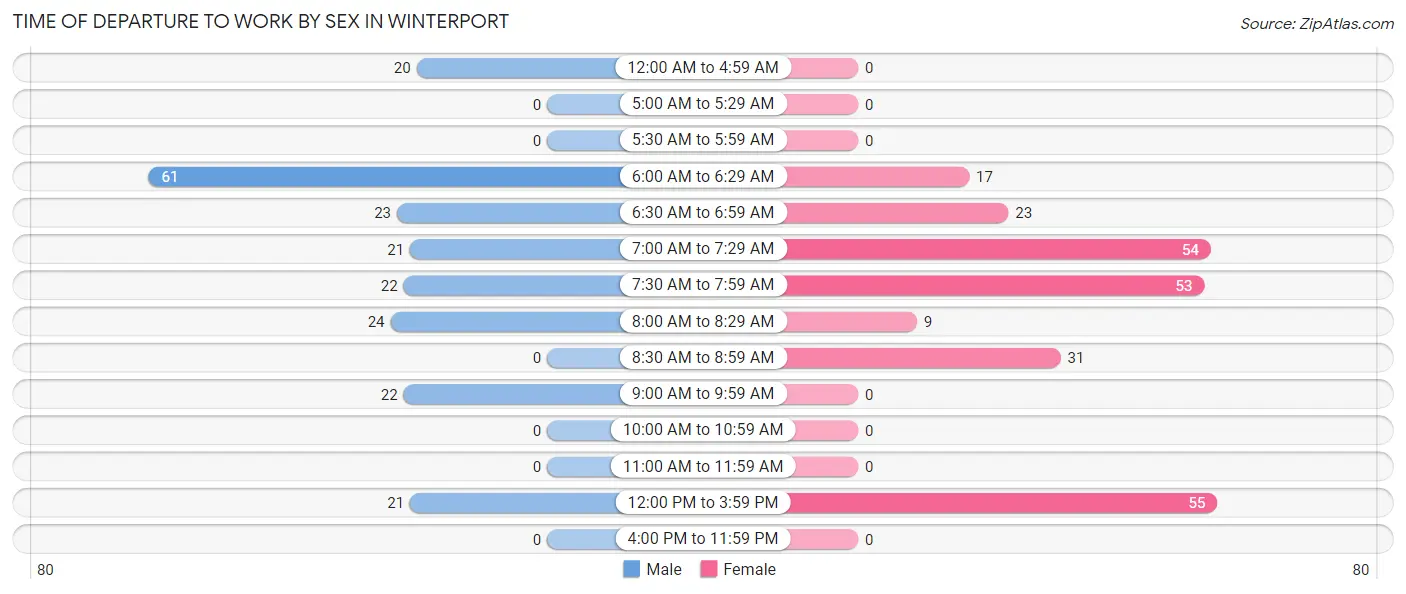
| Time of Departure | Male | Female |
| 12:00 AM to 4:59 AM | 20 (9.3%) | 0 (0.0%) |
| 5:00 AM to 5:29 AM | 0 (0.0%) | 0 (0.0%) |
| 5:30 AM to 5:59 AM | 0 (0.0%) | 0 (0.0%) |
| 6:00 AM to 6:29 AM | 61 (28.5%) | 17 (7.0%) |
| 6:30 AM to 6:59 AM | 23 (10.7%) | 23 (9.5%) |
| 7:00 AM to 7:29 AM | 21 (9.8%) | 54 (22.3%) |
| 7:30 AM to 7:59 AM | 22 (10.3%) | 53 (21.9%) |
| 8:00 AM to 8:29 AM | 24 (11.2%) | 9 (3.7%) |
| 8:30 AM to 8:59 AM | 0 (0.0%) | 31 (12.8%) |
| 9:00 AM to 9:59 AM | 22 (10.3%) | 0 (0.0%) |
| 10:00 AM to 10:59 AM | 0 (0.0%) | 0 (0.0%) |
| 11:00 AM to 11:59 AM | 0 (0.0%) | 0 (0.0%) |
| 12:00 PM to 3:59 PM | 21 (9.8%) | 55 (22.7%) |
| 4:00 PM to 11:59 PM | 0 (0.0%) | 0 (0.0%) |
| Total | 214 (100.0%) | 242 (100.0%) |
Housing Occupancy in Winterport
Occupancy by Ownership in Winterport
Of the total 507 dwellings in Winterport, owner-occupied units account for 362 (71.4%), while renter-occupied units make up 145 (28.6%).
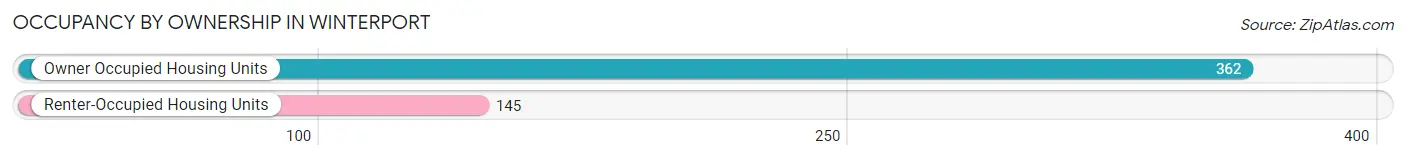
| Occupancy | # Housing Units | % Housing Units |
| Owner Occupied Housing Units | 362 | 71.4% |
| Renter-Occupied Housing Units | 145 | 28.6% |
| Total Occupied Housing Units | 507 | 100.0% |
Occupancy by Household Size in Winterport
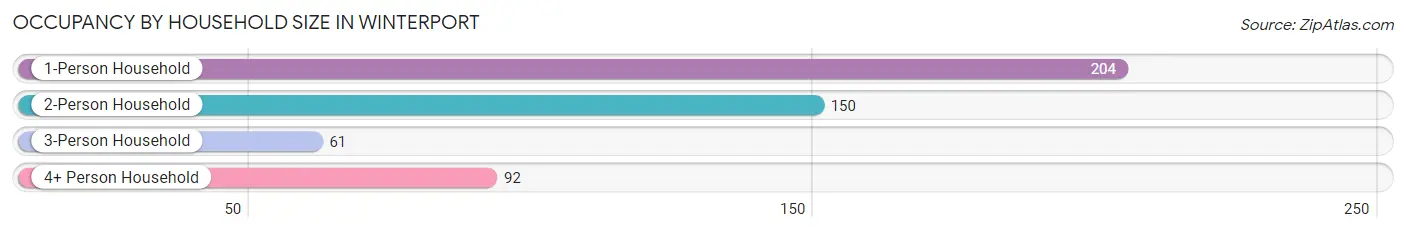
| Household Size | # Housing Units | % Housing Units |
| 1-Person Household | 204 | 40.2% |
| 2-Person Household | 150 | 29.6% |
| 3-Person Household | 61 | 12.0% |
| 4+ Person Household | 92 | 18.1% |
| Total Housing Units | 507 | 100.0% |
Occupancy by Ownership by Household Size in Winterport
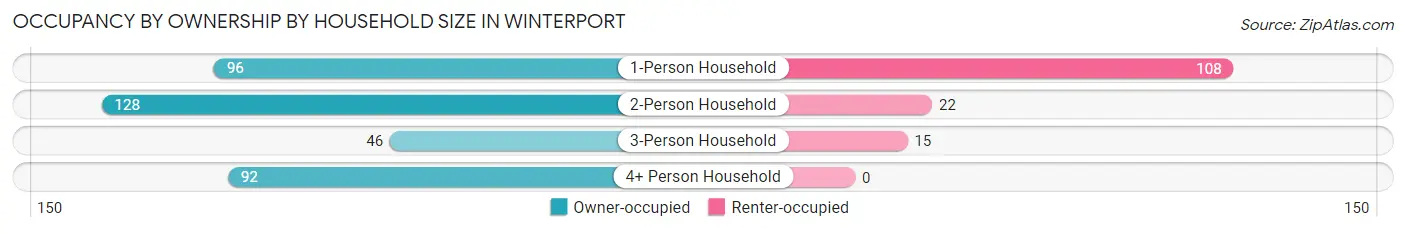
| Household Size | Owner-occupied | Renter-occupied |
| 1-Person Household | 96 (47.1%) | 108 (52.9%) |
| 2-Person Household | 128 (85.3%) | 22 (14.7%) |
| 3-Person Household | 46 (75.4%) | 15 (24.6%) |
| 4+ Person Household | 92 (100.0%) | 0 (0.0%) |
| Total Housing Units | 362 (71.4%) | 145 (28.6%) |
Occupancy by Educational Attainment in Winterport
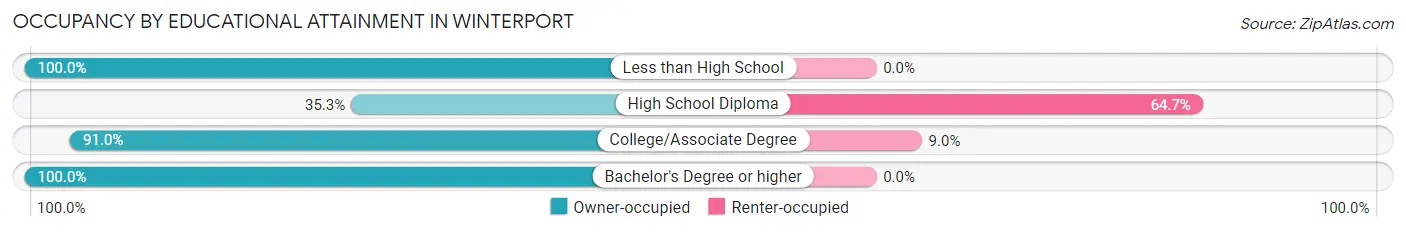
| Household Size | Owner-occupied | Renter-occupied |
| Less than High School | 15 (100.0%) | 0 (0.0%) |
| High School Diploma | 73 (35.3%) | 134 (64.7%) |
| College/Associate Degree | 111 (91.0%) | 11 (9.0%) |
| Bachelor's Degree or higher | 163 (100.0%) | 0 (0.0%) |
Occupancy by Age of Householder in Winterport
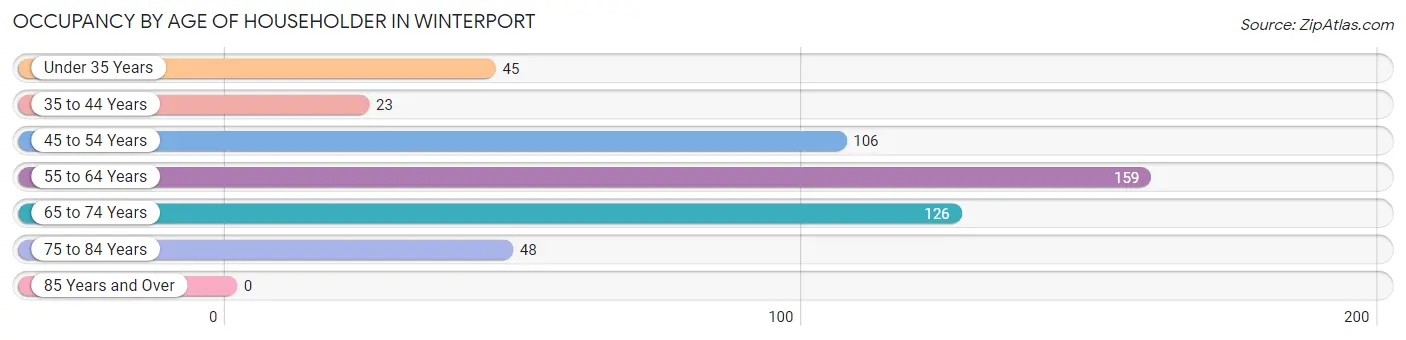
| Age Bracket | # Households | % Households |
| Under 35 Years | 45 | 8.9% |
| 35 to 44 Years | 23 | 4.5% |
| 45 to 54 Years | 106 | 20.9% |
| 55 to 64 Years | 159 | 31.4% |
| 65 to 74 Years | 126 | 24.8% |
| 75 to 84 Years | 48 | 9.5% |
| 85 Years and Over | 0 | 0.0% |
| Total | 507 | 100.0% |
Housing Finances in Winterport
Median Income by Occupancy in Winterport
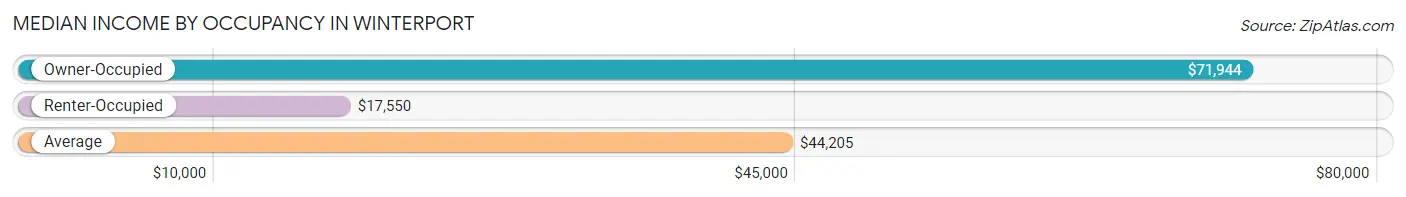
| Occupancy Type | # Households | Median Income |
| Owner-Occupied | 362 (71.4%) | $71,944 |
| Renter-Occupied | 145 (28.6%) | $17,550 |
| Average | 507 (100.0%) | $44,205 |
Occupancy by Householder Income Bracket in Winterport
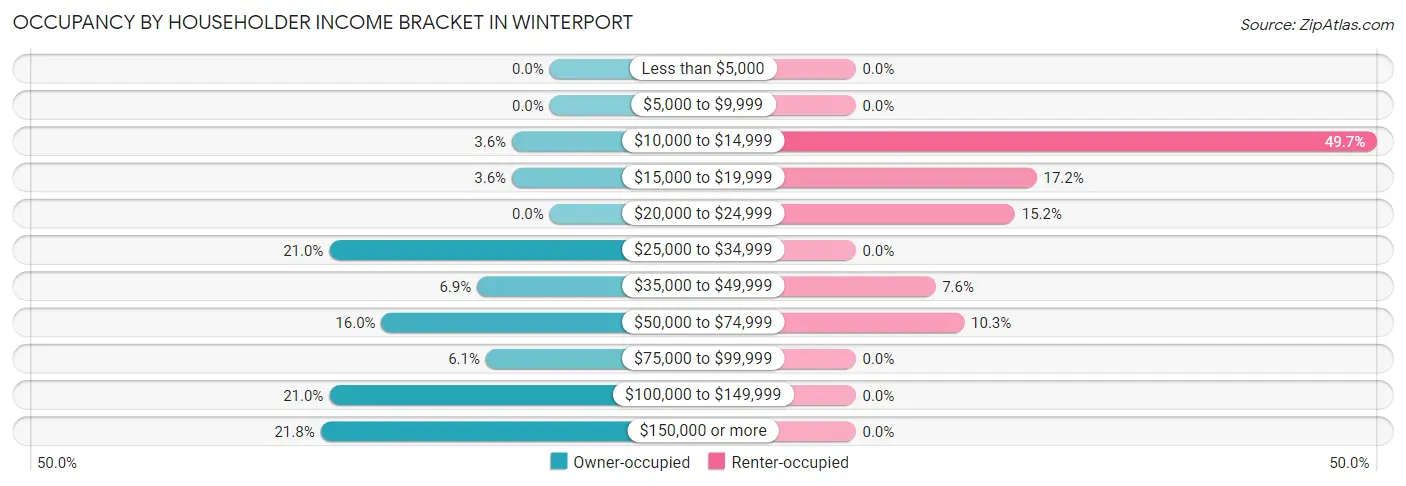
| Income Bracket | Owner-occupied | Renter-occupied |
| Less than $5,000 | 0 (0.0%) | 0 (0.0%) |
| $5,000 to $9,999 | 0 (0.0%) | 0 (0.0%) |
| $10,000 to $14,999 | 13 (3.6%) | 72 (49.7%) |
| $15,000 to $19,999 | 13 (3.6%) | 25 (17.2%) |
| $20,000 to $24,999 | 0 (0.0%) | 22 (15.2%) |
| $25,000 to $34,999 | 76 (21.0%) | 0 (0.0%) |
| $35,000 to $49,999 | 25 (6.9%) | 11 (7.6%) |
| $50,000 to $74,999 | 58 (16.0%) | 15 (10.3%) |
| $75,000 to $99,999 | 22 (6.1%) | 0 (0.0%) |
| $100,000 to $149,999 | 76 (21.0%) | 0 (0.0%) |
| $150,000 or more | 79 (21.8%) | 0 (0.0%) |
| Total | 362 (100.0%) | 145 (100.0%) |
Monthly Housing Cost Tiers in Winterport
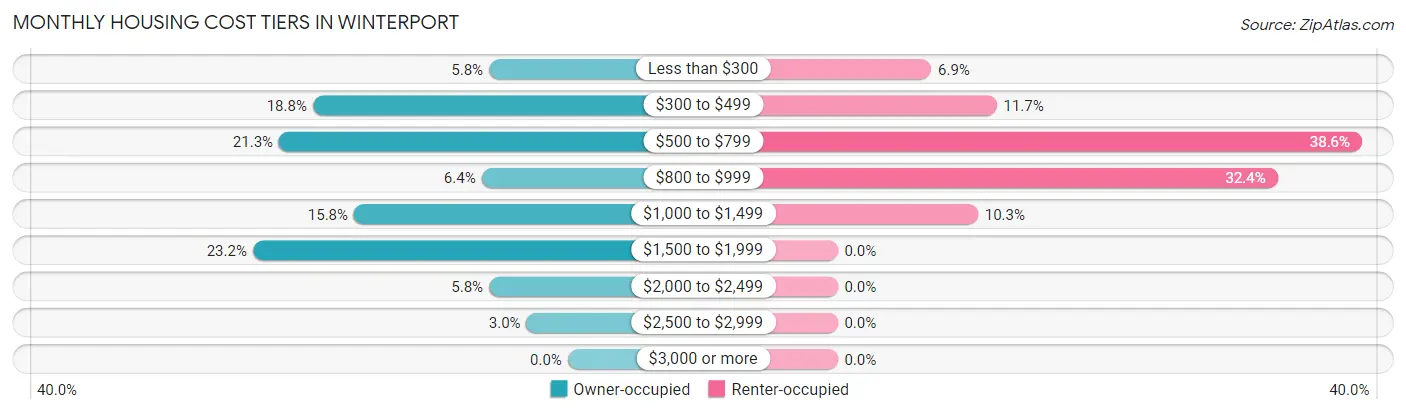
| Monthly Cost | Owner-occupied | Renter-occupied |
| Less than $300 | 21 (5.8%) | 10 (6.9%) |
| $300 to $499 | 68 (18.8%) | 17 (11.7%) |
| $500 to $799 | 77 (21.3%) | 56 (38.6%) |
| $800 to $999 | 23 (6.4%) | 47 (32.4%) |
| $1,000 to $1,499 | 57 (15.8%) | 15 (10.3%) |
| $1,500 to $1,999 | 84 (23.2%) | 0 (0.0%) |
| $2,000 to $2,499 | 21 (5.8%) | 0 (0.0%) |
| $2,500 to $2,999 | 11 (3.0%) | 0 (0.0%) |
| $3,000 or more | 0 (0.0%) | 0 (0.0%) |
| Total | 362 (100.0%) | 145 (100.0%) |
Physical Housing Characteristics in Winterport
Housing Structures in Winterport
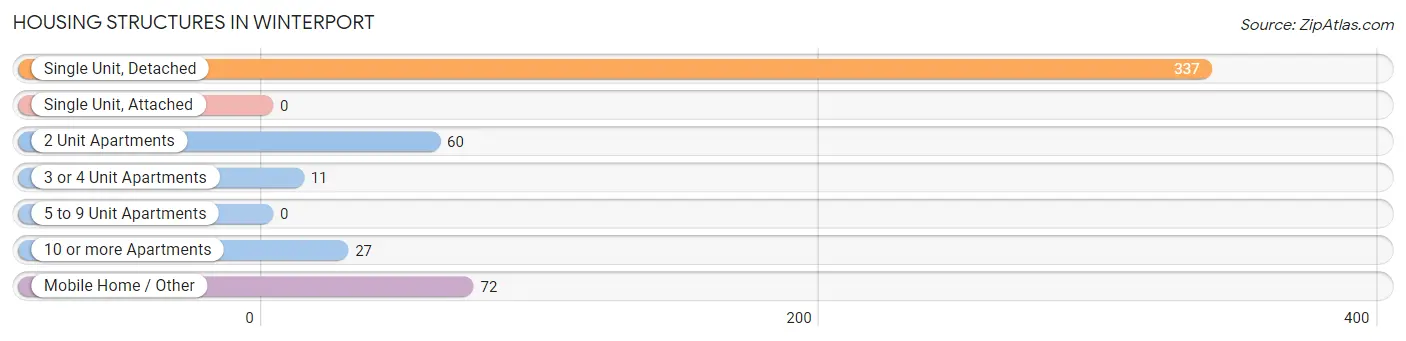
| Structure Type | # Housing Units | % Housing Units |
| Single Unit, Detached | 337 | 66.5% |
| Single Unit, Attached | 0 | 0.0% |
| 2 Unit Apartments | 60 | 11.8% |
| 3 or 4 Unit Apartments | 11 | 2.2% |
| 5 to 9 Unit Apartments | 0 | 0.0% |
| 10 or more Apartments | 27 | 5.3% |
| Mobile Home / Other | 72 | 14.2% |
| Total | 507 | 100.0% |
Housing Structures by Occupancy in Winterport
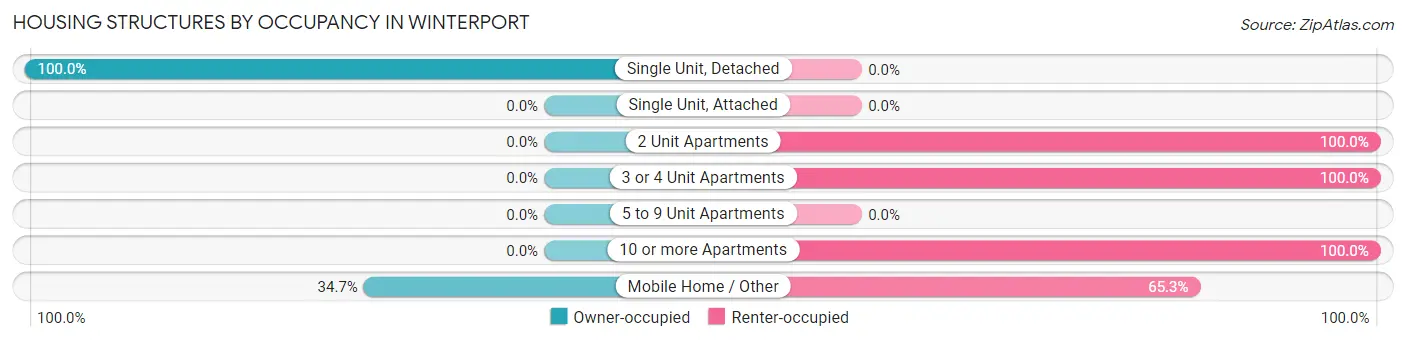
| Structure Type | Owner-occupied | Renter-occupied |
| Single Unit, Detached | 337 (100.0%) | 0 (0.0%) |
| Single Unit, Attached | 0 (0.0%) | 0 (0.0%) |
| 2 Unit Apartments | 0 (0.0%) | 60 (100.0%) |
| 3 or 4 Unit Apartments | 0 (0.0%) | 11 (100.0%) |
| 5 to 9 Unit Apartments | 0 (0.0%) | 0 (0.0%) |
| 10 or more Apartments | 0 (0.0%) | 27 (100.0%) |
| Mobile Home / Other | 25 (34.7%) | 47 (65.3%) |
| Total | 362 (71.4%) | 145 (28.6%) |
Housing Structures by Number of Rooms in Winterport
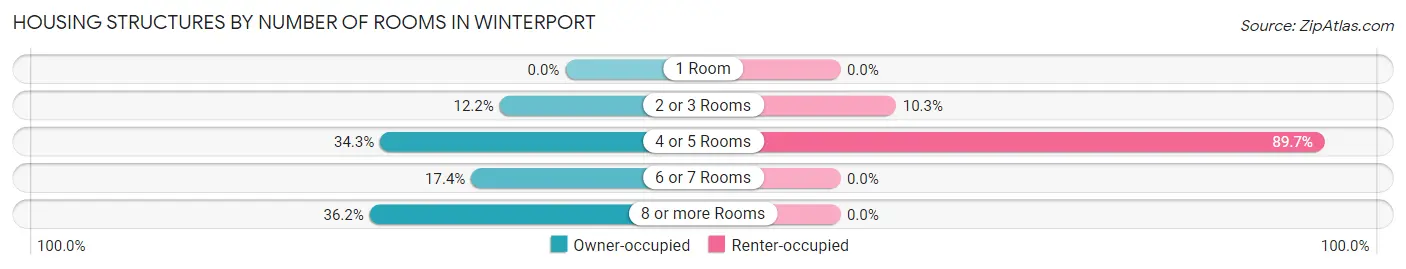
| Number of Rooms | Owner-occupied | Renter-occupied |
| 1 Room | 0 (0.0%) | 0 (0.0%) |
| 2 or 3 Rooms | 44 (12.1%) | 15 (10.3%) |
| 4 or 5 Rooms | 124 (34.3%) | 130 (89.7%) |
| 6 or 7 Rooms | 63 (17.4%) | 0 (0.0%) |
| 8 or more Rooms | 131 (36.2%) | 0 (0.0%) |
| Total | 362 (100.0%) | 145 (100.0%) |
Housing Structure by Heating Type in Winterport
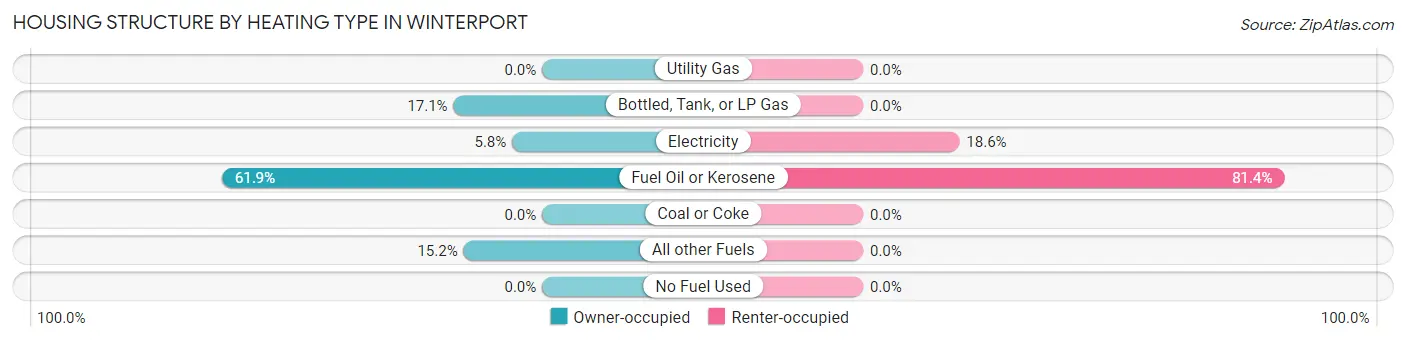
| Heating Type | Owner-occupied | Renter-occupied |
| Utility Gas | 0 (0.0%) | 0 (0.0%) |
| Bottled, Tank, or LP Gas | 62 (17.1%) | 0 (0.0%) |
| Electricity | 21 (5.8%) | 27 (18.6%) |
| Fuel Oil or Kerosene | 224 (61.9%) | 118 (81.4%) |
| Coal or Coke | 0 (0.0%) | 0 (0.0%) |
| All other Fuels | 55 (15.2%) | 0 (0.0%) |
| No Fuel Used | 0 (0.0%) | 0 (0.0%) |
| Total | 362 (100.0%) | 145 (100.0%) |
Household Vehicle Usage in Winterport
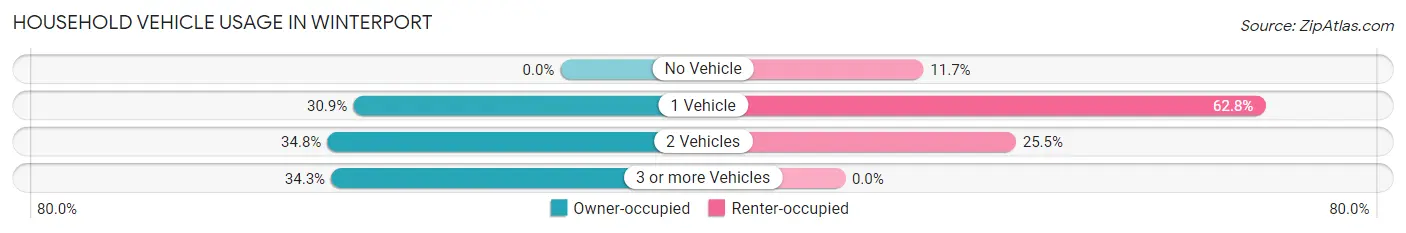
| Vehicles per Household | Owner-occupied | Renter-occupied |
| No Vehicle | 0 (0.0%) | 17 (11.7%) |
| 1 Vehicle | 112 (30.9%) | 91 (62.8%) |
| 2 Vehicles | 126 (34.8%) | 37 (25.5%) |
| 3 or more Vehicles | 124 (34.3%) | 0 (0.0%) |
| Total | 362 (100.0%) | 145 (100.0%) |
Real Estate & Mortgages in Winterport
Real Estate and Mortgage Overview in Winterport
| Characteristic | Without Mortgage | With Mortgage |
| Housing Units | 166 | 196 |
| Median Property Value | $159,000 | $210,700 |
| Median Household Income | $35,769 | $68 |
| Monthly Housing Costs | $488 | $0 |
| Real Estate Taxes | $1,342 | $0 |
Property Value by Mortgage Status in Winterport
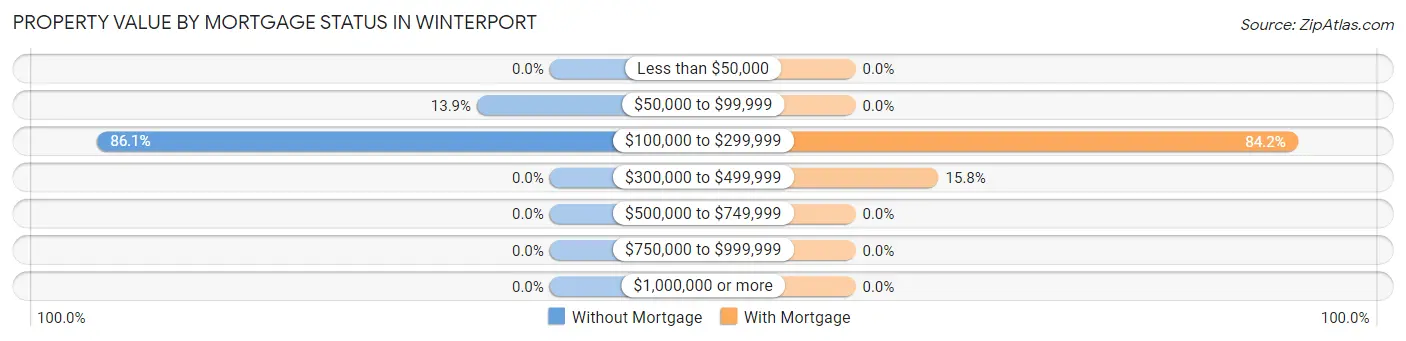
| Property Value | Without Mortgage | With Mortgage |
| Less than $50,000 | 0 (0.0%) | 0 (0.0%) |
| $50,000 to $99,999 | 23 (13.9%) | 0 (0.0%) |
| $100,000 to $299,999 | 143 (86.1%) | 165 (84.2%) |
| $300,000 to $499,999 | 0 (0.0%) | 31 (15.8%) |
| $500,000 to $749,999 | 0 (0.0%) | 0 (0.0%) |
| $750,000 to $999,999 | 0 (0.0%) | 0 (0.0%) |
| $1,000,000 or more | 0 (0.0%) | 0 (0.0%) |
| Total | 166 (100.0%) | 196 (100.0%) |
Household Income by Mortgage Status in Winterport
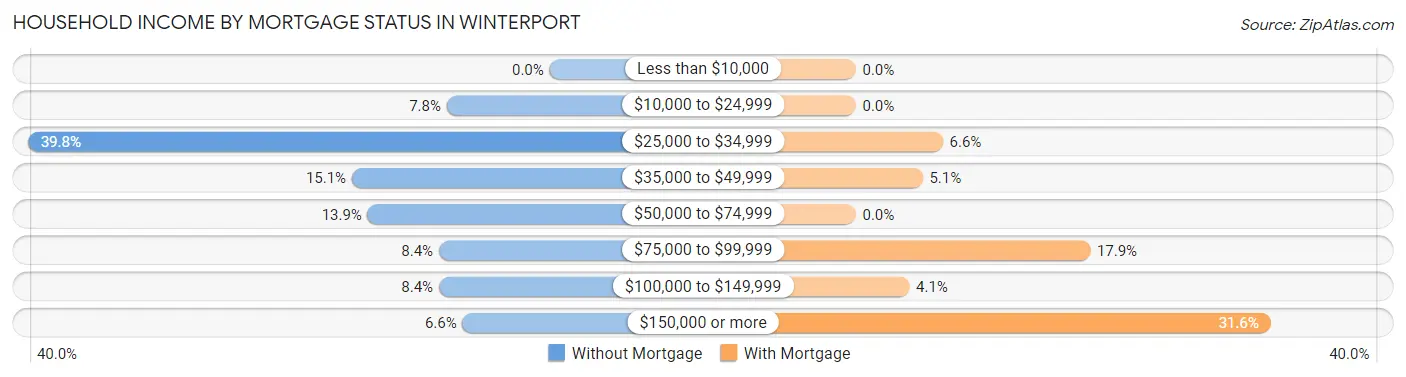
| Household Income | Without Mortgage | With Mortgage |
| Less than $10,000 | 0 (0.0%) | 0 (0.0%) |
| $10,000 to $24,999 | 13 (7.8%) | 0 (0.0%) |
| $25,000 to $34,999 | 66 (39.8%) | 13 (6.6%) |
| $35,000 to $49,999 | 25 (15.1%) | 10 (5.1%) |
| $50,000 to $74,999 | 23 (13.9%) | 0 (0.0%) |
| $75,000 to $99,999 | 14 (8.4%) | 35 (17.9%) |
| $100,000 to $149,999 | 14 (8.4%) | 8 (4.1%) |
| $150,000 or more | 11 (6.6%) | 62 (31.6%) |
| Total | 166 (100.0%) | 196 (100.0%) |
Property Value to Household Income Ratio in Winterport

| Value-to-Income Ratio | Without Mortgage | With Mortgage |
| Less than 2.0x | 48 (28.9%) | 128,125 (65,369.9%) |
| 2.0x to 2.9x | 14 (8.4%) | 109 (55.6%) |
| 3.0x to 3.9x | 51 (30.7%) | 33 (16.8%) |
| 4.0x or more | 53 (31.9%) | 24 (12.2%) |
| Total | 166 (100.0%) | 196 (100.0%) |
Real Estate Taxes by Mortgage Status in Winterport
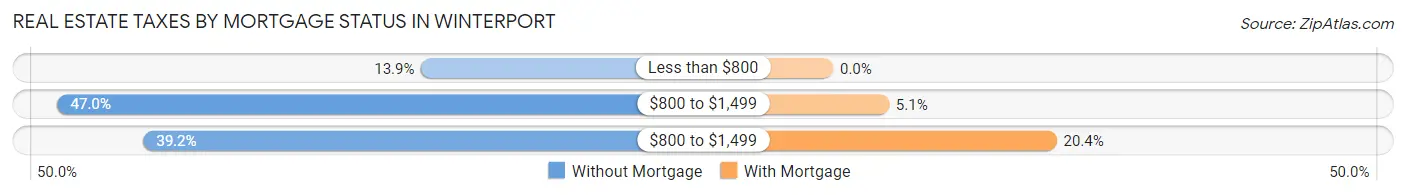
| Property Taxes | Without Mortgage | With Mortgage |
| Less than $800 | 23 (13.9%) | 0 (0.0%) |
| $800 to $1,499 | 78 (47.0%) | 10 (5.1%) |
| $800 to $1,499 | 65 (39.2%) | 40 (20.4%) |
| Total | 166 (100.0%) | 196 (100.0%) |
Health & Disability in Winterport
Health Insurance Coverage by Age in Winterport
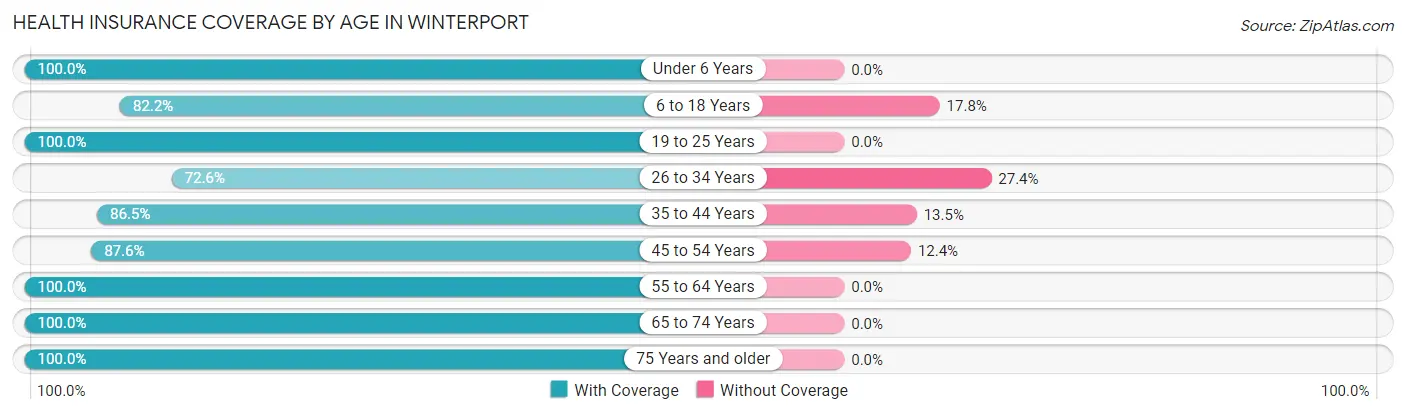
| Age Bracket | With Coverage | Without Coverage |
| Under 6 Years | 84 (100.0%) | 0 (0.0%) |
| 6 to 18 Years | 111 (82.2%) | 24 (17.8%) |
| 19 to 25 Years | 21 (100.0%) | 0 (0.0%) |
| 26 to 34 Years | 90 (72.6%) | 34 (27.4%) |
| 35 to 44 Years | 64 (86.5%) | 10 (13.5%) |
| 45 to 54 Years | 148 (87.6%) | 21 (12.4%) |
| 55 to 64 Years | 250 (100.0%) | 0 (0.0%) |
| 65 to 74 Years | 179 (100.0%) | 0 (0.0%) |
| 75 Years and older | 64 (100.0%) | 0 (0.0%) |
| Total | 1,011 (91.9%) | 89 (8.1%) |
Health Insurance Coverage by Citizenship Status in Winterport
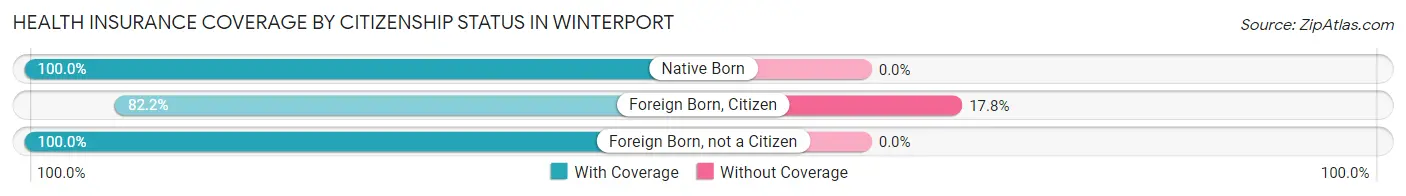
| Citizenship Status | With Coverage | Without Coverage |
| Native Born | 84 (100.0%) | 0 (0.0%) |
| Foreign Born, Citizen | 111 (82.2%) | 24 (17.8%) |
| Foreign Born, not a Citizen | 21 (100.0%) | 0 (0.0%) |
Health Insurance Coverage by Household Income in Winterport
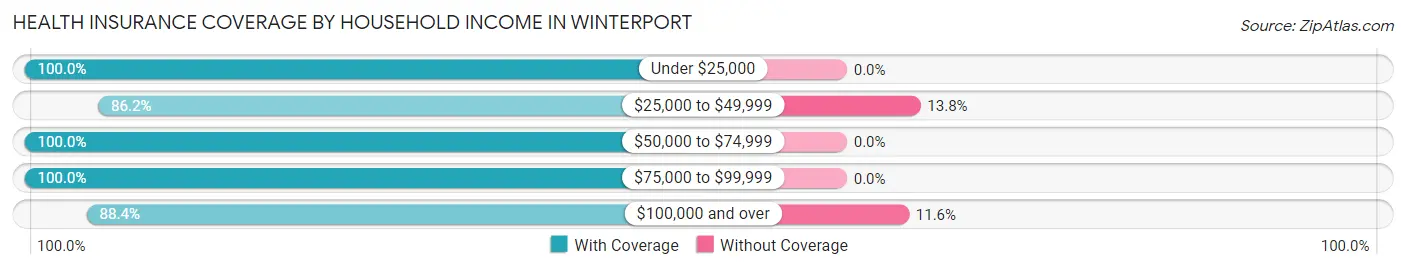
| Household Income | With Coverage | Without Coverage |
| Under $25,000 | 168 (100.0%) | 0 (0.0%) |
| $25,000 to $49,999 | 125 (86.2%) | 20 (13.8%) |
| $50,000 to $74,999 | 136 (100.0%) | 0 (0.0%) |
| $75,000 to $99,999 | 64 (100.0%) | 0 (0.0%) |
| $100,000 and over | 509 (88.4%) | 67 (11.6%) |
Public vs Private Health Insurance Coverage by Age in Winterport
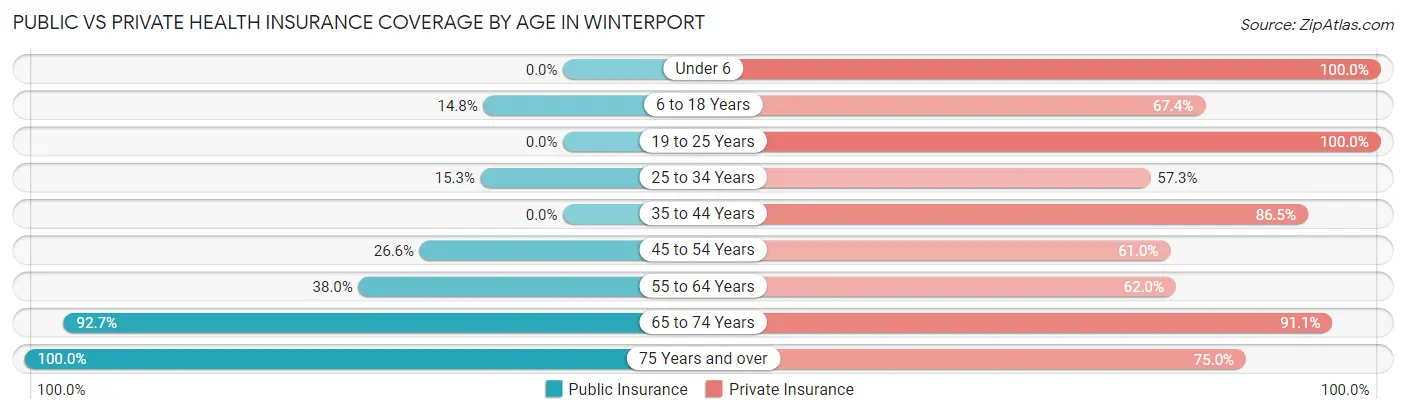
| Age Bracket | Public Insurance | Private Insurance |
| Under 6 | 0 (0.0%) | 84 (100.0%) |
| 6 to 18 Years | 20 (14.8%) | 91 (67.4%) |
| 19 to 25 Years | 0 (0.0%) | 21 (100.0%) |
| 25 to 34 Years | 19 (15.3%) | 71 (57.3%) |
| 35 to 44 Years | 0 (0.0%) | 64 (86.5%) |
| 45 to 54 Years | 45 (26.6%) | 103 (61.0%) |
| 55 to 64 Years | 95 (38.0%) | 155 (62.0%) |
| 65 to 74 Years | 166 (92.7%) | 163 (91.1%) |
| 75 Years and over | 64 (100.0%) | 48 (75.0%) |
| Total | 409 (37.2%) | 800 (72.7%) |
Disability Status by Sex by Age in Winterport
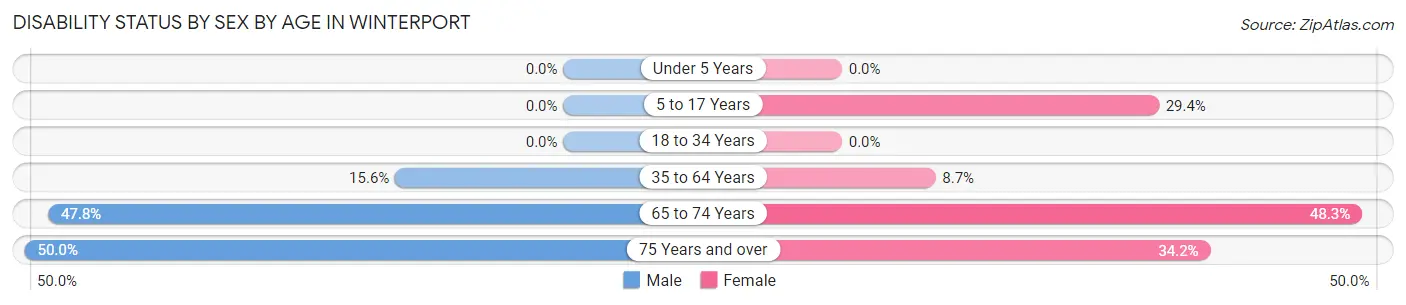
| Age Bracket | Male | Female |
| Under 5 Years | 0 (0.0%) | 0 (0.0%) |
| 5 to 17 Years | 0 (0.0%) | 20 (29.4%) |
| 18 to 34 Years | 0 (0.0%) | 0 (0.0%) |
| 35 to 64 Years | 32 (15.6%) | 25 (8.7%) |
| 65 to 74 Years | 44 (47.8%) | 42 (48.3%) |
| 75 Years and over | 13 (50.0%) | 13 (34.2%) |
Disability Class by Sex by Age in Winterport
Disability Class: Hearing Difficulty
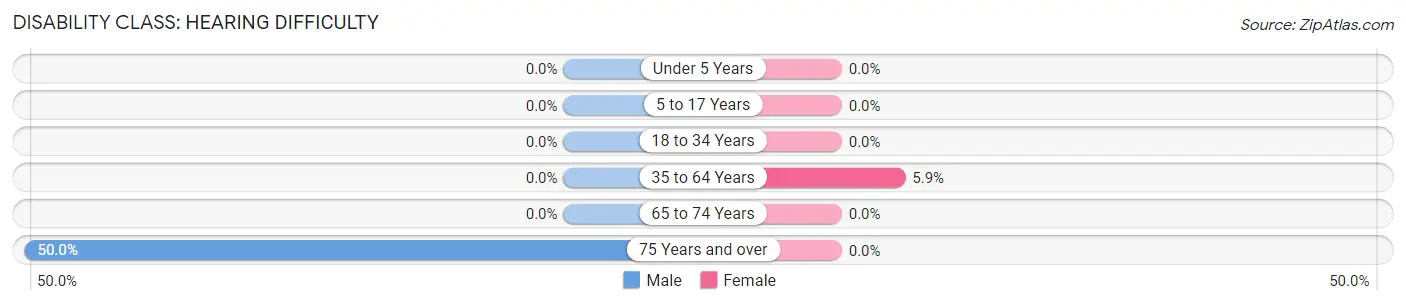
| Age Bracket | Male | Female |
| Under 5 Years | 0 (0.0%) | 0 (0.0%) |
| 5 to 17 Years | 0 (0.0%) | 0 (0.0%) |
| 18 to 34 Years | 0 (0.0%) | 0 (0.0%) |
| 35 to 64 Years | 0 (0.0%) | 17 (5.9%) |
| 65 to 74 Years | 0 (0.0%) | 0 (0.0%) |
| 75 Years and over | 13 (50.0%) | 0 (0.0%) |
Disability Class: Vision Difficulty
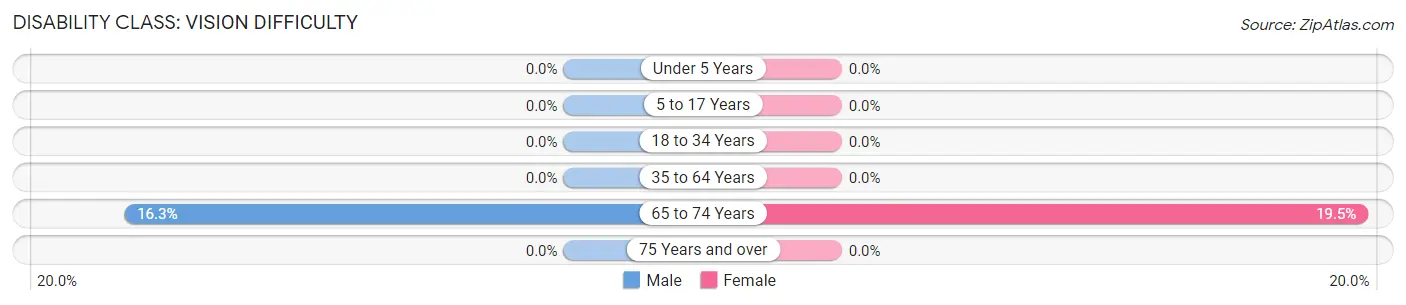
| Age Bracket | Male | Female |
| Under 5 Years | 0 (0.0%) | 0 (0.0%) |
| 5 to 17 Years | 0 (0.0%) | 0 (0.0%) |
| 18 to 34 Years | 0 (0.0%) | 0 (0.0%) |
| 35 to 64 Years | 0 (0.0%) | 0 (0.0%) |
| 65 to 74 Years | 15 (16.3%) | 17 (19.5%) |
| 75 Years and over | 0 (0.0%) | 0 (0.0%) |
Disability Class: Cognitive Difficulty
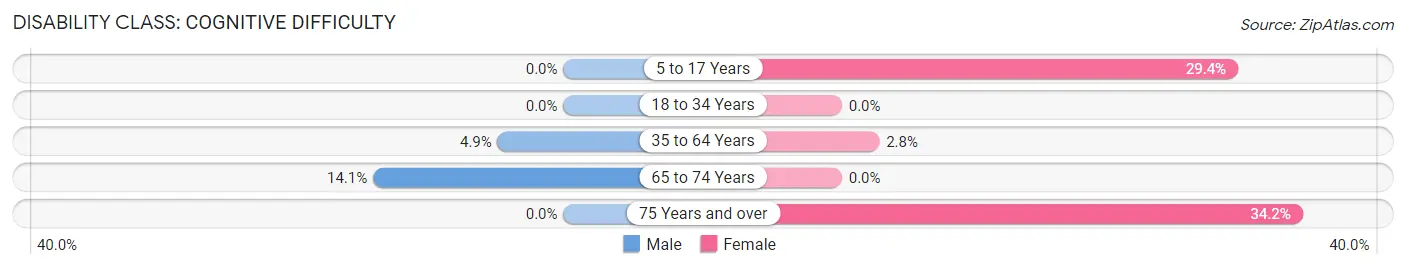
| Age Bracket | Male | Female |
| 5 to 17 Years | 0 (0.0%) | 20 (29.4%) |
| 18 to 34 Years | 0 (0.0%) | 0 (0.0%) |
| 35 to 64 Years | 10 (4.9%) | 8 (2.8%) |
| 65 to 74 Years | 13 (14.1%) | 0 (0.0%) |
| 75 Years and over | 0 (0.0%) | 13 (34.2%) |
Disability Class: Ambulatory Difficulty
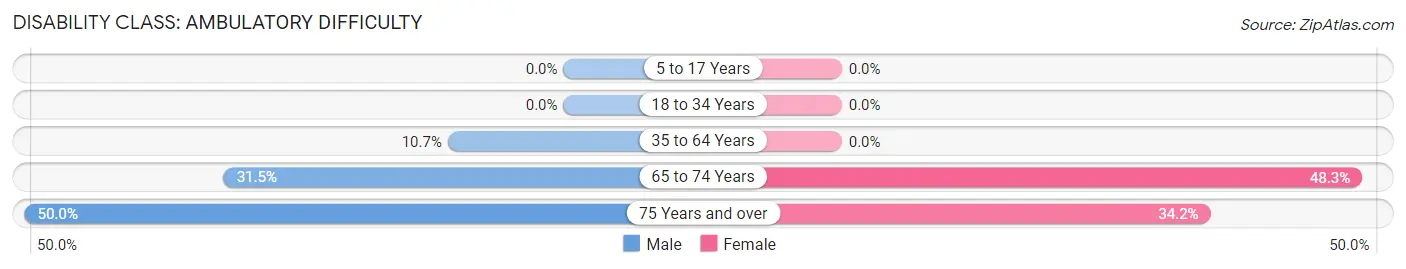
| Age Bracket | Male | Female |
| 5 to 17 Years | 0 (0.0%) | 0 (0.0%) |
| 18 to 34 Years | 0 (0.0%) | 0 (0.0%) |
| 35 to 64 Years | 22 (10.7%) | 0 (0.0%) |
| 65 to 74 Years | 29 (31.5%) | 42 (48.3%) |
| 75 Years and over | 13 (50.0%) | 13 (34.2%) |
Disability Class: Self-Care Difficulty
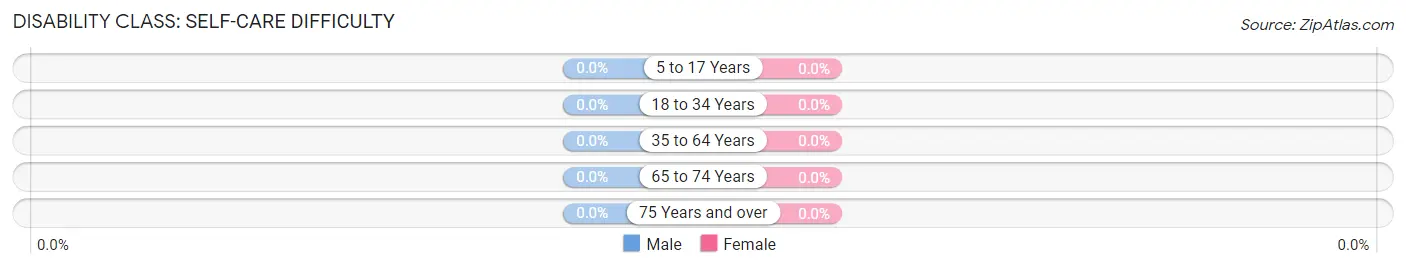
| Age Bracket | Male | Female |
| 5 to 17 Years | 0 (0.0%) | 0 (0.0%) |
| 18 to 34 Years | 0 (0.0%) | 0 (0.0%) |
| 35 to 64 Years | 0 (0.0%) | 0 (0.0%) |
| 65 to 74 Years | 0 (0.0%) | 0 (0.0%) |
| 75 Years and over | 0 (0.0%) | 0 (0.0%) |
Technology Access in Winterport
Computing Device Access in Winterport
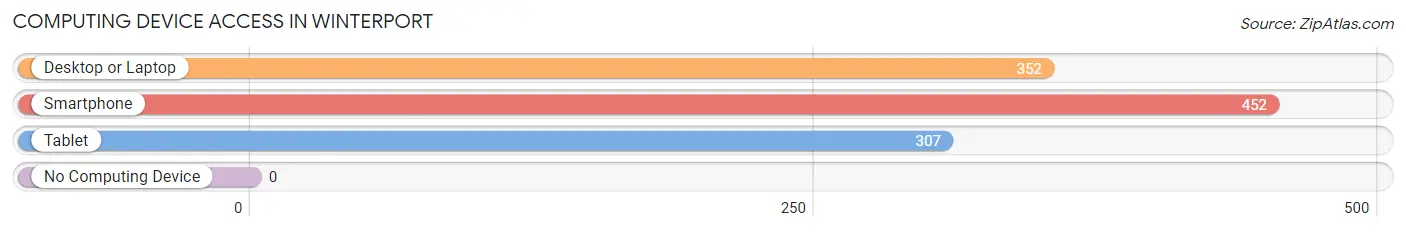
| Device Type | # Households | % Households |
| Desktop or Laptop | 352 | 69.4% |
| Smartphone | 452 | 89.1% |
| Tablet | 307 | 60.6% |
| No Computing Device | 0 | 0.0% |
| Total | 507 | 100.0% |
Internet Access in Winterport
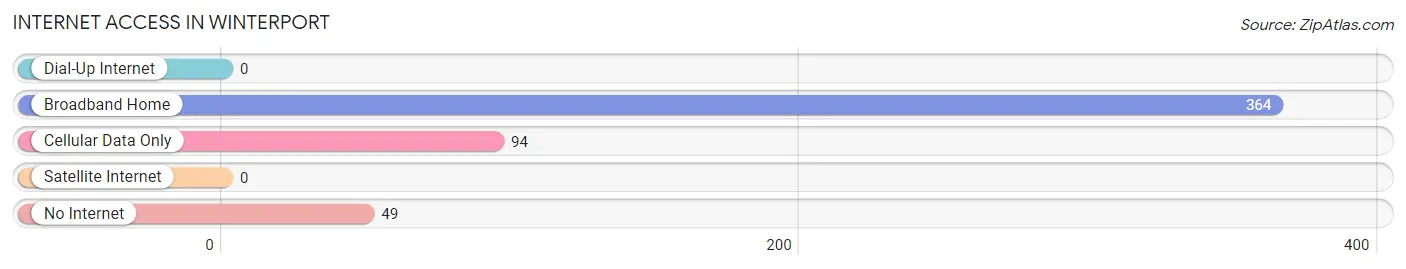
| Internet Type | # Households | % Households |
| Dial-Up Internet | 0 | 0.0% |
| Broadband Home | 364 | 71.8% |
| Cellular Data Only | 94 | 18.5% |
| Satellite Internet | 0 | 0.0% |
| No Internet | 49 | 9.7% |
| Total | 507 | 100.0% |
Winterport Summary
Winterport, Maine is a small town located in Waldo County, in the Midcoast region of the state. It is situated on the Penobscot River, about 15 miles north of Bangor. The town has a population of about 2,000 people, and is known for its rural charm and small-town atmosphere.
History
The area that is now Winterport was first settled in 1762 by a group of settlers from Massachusetts. The town was originally known as "Winter Harbour," and was incorporated in 1794. The town was named after the harbor, which was said to be frozen over during the winter months.
In the early 19th century, Winterport was a thriving port town, with a large shipbuilding industry. The town was also home to several sawmills, gristmills, and other industries. The town was also a popular destination for tourists, who came to enjoy the scenic views of the Penobscot River.
In the late 19th century, the shipbuilding industry declined, and the town's economy shifted to agriculture and lumber. The town also became a popular summer destination for tourists, who came to enjoy the area's natural beauty.
Geography
Winterport is located in the Midcoast region of Maine, about 15 miles north of Bangor. The town is situated on the Penobscot River, and is bordered by the towns of Frankfort, Prospect, and Stockton Springs. The town is located in a rural area, and is surrounded by forests and rolling hills.
The town has a total area of 11.2 square miles, of which 10.9 square miles is land and 0.3 square miles is water. The town is located at an elevation of about 100 feet above sea level.
Economy
The economy of Winterport is largely based on agriculture and tourism. The town is home to several farms, which produce a variety of crops, including potatoes, corn, and hay. The town is also home to several small businesses, including restaurants, shops, and lodging.
Tourism is an important part of the town's economy. The town is home to several attractions, including the Winterport Historical Society Museum, the Winterport Town Hall, and the Winterport Town Park. The town is also home to several festivals and events, including the Winterport Lobster Festival and the Winterport Farmers' Market.
Demographics
As of the 2010 census, there were 2,039 people, 845 households, and 545 families residing in the town. The population density was 186.3 people per square mile. The racial makeup of the town was 97.2% White, 0.4% African American, 0.4% Native American, 0.4% Asian, 0.2% from other races, and 1.4% from two or more races. Hispanic or Latino of any race were 0.7% of the population.
The median income for a household in the town was $41,250, and the median income for a family was $50,000. The per capita income for the town was $20,945. About 11.2% of families and 14.2% of the population were below the poverty line, including 18.2% of those under age 18 and 8.2% of those age 65 or over.
Common Questions
What is Per Capita Income in Winterport?
Per Capita income in Winterport is $32,540.
What is the Median Family Income in Winterport?
Median Family Income in Winterport is $124,450.
What is the Median Household income in Winterport?
Median Household Income in Winterport is $44,205.
What is Income or Wage Gap in Winterport?
Income or Wage Gap in Winterport is 13.4%.
Women in Winterport earn 86.6 cents for every dollar earned by a man.
What is Inequality or Gini Index in Winterport?
Inequality or Gini Index in Winterport is 0.44.
What is the Total Population of Winterport?
Total Population of Winterport is 1,100.
What is the Total Male Population of Winterport?
Total Male Population of Winterport is 542.
What is the Total Female Population of Winterport?
Total Female Population of Winterport is 558.
What is the Ratio of Males per 100 Females in Winterport?
There are 97.13 Males per 100 Females in Winterport.
What is the Ratio of Females per 100 Males in Winterport?
There are 102.95 Females per 100 Males in Winterport.
What is the Median Population Age in Winterport?
Median Population Age in Winterport is 48.1 Years.
What is the Average Family Size in Winterport
Average Family Size in Winterport is 3.1 People.
What is the Average Household Size in Winterport
Average Household Size in Winterport is 2.1 People.
How Large is the Labor Force in Winterport?
There are 500 People in the Labor Forcein in Winterport.
What is the Percentage of People in the Labor Force in Winterport?
54.9% of People are in the Labor Force in Winterport.